afri a’s · • increase climate smart projects from 80% to 100% • strengthening health care...
TRANSCRIPT

STRATEGIC DIRECTIONS AND PRIORITIES FOR AFRICA’S TRANSFORMATION
Strategy and Operational Policies Department (SNPS)African Development Bank

Strong Economic Growth
0
1
2
3
4
5
6
7
2010 2011 2012 2013 2014 2015 2016 (e) 2017 (p) 2018 (p)
Perc
ent
World Africa
World vs. Africa Average Annual GDP growth
Source: AfDB Statistics Department and WBG
Africa’s Development: Opportunities & Challenges
10 of 25 fastest growing economies in the world between 2004 and 2014
10 of top 20 countries with the highest growth in industrial output between 2006 and 2014
8 of top 20 countries with the highest services growth between 2006 and 2014
Source: Mo Ibrahim Foundation, Africa at a Tipping Point 2017

External Financial Flows to Africa, average 2004-08, 2009-16
638 428
210
Total annual investment needs
Current annualinvestment
Total investment gap
Estimated Investment Gap in Africa in Key SDG sectors, 2015-2030
Billions of USD, annual average
Africa’s Development: Opportunities & Challenges

Strategic Framework
6
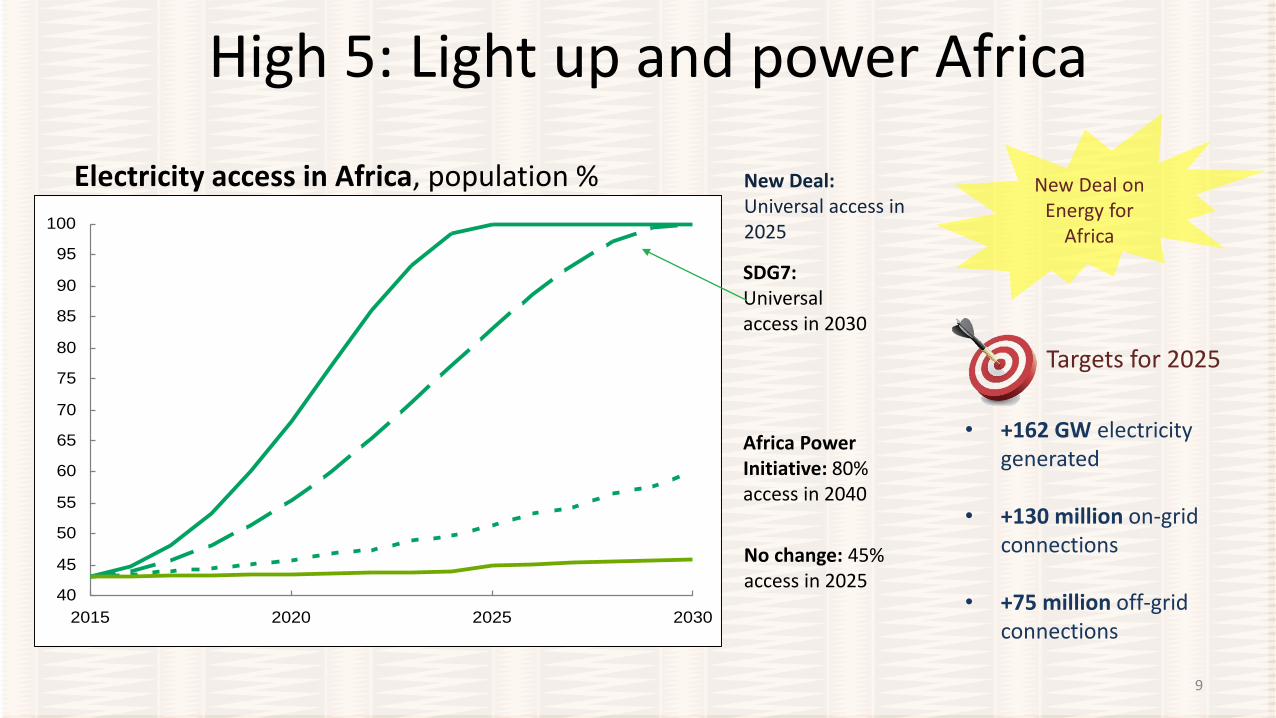
High 5: Light up and power Africa
9
Electricity access in Africa, population %
40
45
50
55
60
65
70
75
80
85
90
95
100
2015 2020 2025 2030
New Deal: Universal access in 2025
SDG7: Universal access in 2030
Africa Power Initiative: 80% access in 2040
No change: 45% access in 2025
New Deal on Energy for
Africa
Targets for 2025
• +162 GW electricity generated
• +130 million on-grid connections
• +75 million off-grid connections

High 5: Feed Africa
10
Low Productivity – Average Yields in Africa vs. Best Practices (Tons/Hectare or Animals, 2013)
9.4
2.0
2.5
1.2
0.5
0.2
0.5
25
.4
19
.2
8.6
3.6
1.3
0.4
10
.0
CASSAVA CORN RICE SOY COCOA BEEF MILK
36% of African
children are stuntedStaggering food net
food import bill of USD 35.4 billion per annum
Low value addition to agricultural commodities and primary production
Action Plan for African
Agriculture Transformation
Targets for 2025
• Zero hunger and malnutrition
• Africa´s net trade balance –$0 billion
• Africa share of market value for processed commodities increased by 40%

High 5: Industrialize Africa
11
Targets for 2025
Share of the global manufactured added value
<1.5%
Share of processed products in exports
<30%
• Industrial contribution to GDP increased by 130%
• 35 special economic zones supported
• 30 PPPs developed & strengthened
Industrialization Strategy For Africa 2016-
2025

High 5: Integrate Africa
12
Annual cost for the economy (%GDP)
1% to 1.5%
Transportation cost
70% > than in Asia; 50% > than in Latin
America
Targets for 2025
• Intra-African trade representing 52% of total trade
• US $172 billion saved in transportation cost
• No visa requirements for Africans travelling across Africa
15%
70%
51%54%
19%
Limited intra-African trade Regional Integration Policy
and Strategy
2014–2023

High 5: Improve the quality of life for the people of Africa
13
• 25 million jobs created
• US $30 billion in income gains for the African economy
• Improving access to water & sanitation
• Strengthening health care & educational systems
Jobs for Youth in Africa Initiative
Targets for 2025

Cross Cutting Area: Climate Change
Targets for 2020
• AfDB wll almost triple its annual climate financing to reach USD 5 billion a year by 2020
• 40% of project approvals
• Increase Climate Smart Projects from 80% to 100%
• Strengthening health care & educational systems
The cost of climate change for the continent is estimated to reach USD 45-50 billion per
year by 2040 and up to 7% of Africa’s annual GDP by 2100
Sustainable Energy Fund
for Africa
Inclusive Green Growth
Partnership Developing
Climate Change
Action Plan 2 (2016-2020)

Cross Cutting Area: GenderAfrica: Gender Equality Index
Affirmative Finance Action
For Women In Africa
Knowledge Management &
Capacity Building
Economic Empowerment
Legal and Property Rights
Pillars
Gender Responsive
Work Environment
Institutional Framework for
GE
Monitoring & Evaluation
System
Organizational Requirements
Training
Human & Financial
Resources
Further the Bank’s own
Transformation to make it more
Gender-Responsive
Strengthen Gender
Mainstreaming in the High 5s
Strategy
Gender Champions

Cross Cutting Area: Fragility
13
Monitoring Fragility
Step 1: Assess fragility at
country and regional level
Step 2: Apply a fragility-lens to the design of strategies
and operations
Step 3: Implement
operations and adapt
engagement
Source: Fund for Peace, 2015
Category 1High risk in countries and regions
Category 2Medium risk throughregional spill-overs or national deterioration
Category 3Low risk with stable outlook

Cross Cutting Area: Governance
African Resource Mobilization
Total illicit flows out of Africa = US$50 billion every year, equal to 5.7% of Africa’s GDP
Tax revenues account for less than 20% of GDP in sub-Saharan Africa, compared to over 33% in OECD countries
Only 8 African countries rank in the top 100 of the Doing Business 2016 Rankings
Percentage of GDP that regions are losing in Illicit Financial Flows
0
100000
200000
300000
400000
500000
600000
700000
2000 2002 2004 2006 2008 2010 2012 2014
FDI ODA Remittances Total Revenue

USD billions
Lending Trajectory Above Sustainable Lending Limits
5.60
4.86 4.86
3.784.30
5.99
8.03
8.78 8.78 8.78
-1.00
1.00
3.00
5.00
7.00
9.00
2010 2011 2012 2013 2014 2015 2016 2017 2018 2019
Actual Financing Target SLL
SLL = USD 4.9 to 5.1 billion / year

AfDB Financing Options
Conserve Capital
Increase Co-financing
Syndication
Risk Sharing
Optimize the Balance Sheet
Portfolio Guarantees
Asset Turn-Over
Loan Portfolio Exposure Exchange
Risk Appetite
Adjust Lending Mix
Increase Trade Finance
Credit Enhancement
Facility
Innovations in Public and
Private Sector Operations
Reduce Equity Investments
Recapitalize the Bank
New GCI
ADF-ADB merger
ADF borrowing on the market
Increase profits to generate
more reserves

Thank you