africa energy corp near-term high-impact creating value ... · wood mackenzie top-20 prospects in...
TRANSCRIPT
Creating Value Through Oil Exploration in Africa
AFRICA ENERGY
Near-Term High-ImpactOil ExplorationNovember 2018
AFRICA ENERGY CORP
Deepsea Stavanger to drill the Brulpadda Prospect on Block 11B/12B in South Africa.

Corporate Profile
Africa Energy | November 2018Slide 2
Board,
Management
& Employees
8%
Lundin Family
12%
Retail &
Institutional
45%
Share Ownership
• Independent oil exploration company
• Listed on TSX Venture and Nasdaq First North Stockholm
• Focused on under-explored regions in Africa
• Backed by Lundin Group
• Proven technical team from Energy Africa / Tullow Oil
• Near-term high-impact exploration assets (1)
• Reviewing additional acquisition opportunities
Africa Oil Corp.
35%
Asset Footprint
(1) Block 11B/12B transaction subject to closing.
Corporate Snapshot
AFE/AEC TSX-V/First North Ticker
C$0.175Share Price at November 2, 2018
SEK 1.16
683.4 Common Shares (million)
31.9 Stock Options (million)
$91.2 Market Cap (US$ million)
$0 Debt (US$)
$44.10 Cash at June 30, 2018 (US$ million)
13 Number of Employees
Equity Research
Pareto Securities London Shahin Amini
Numis Securities London Thomas Martin
SpareBank 1 Markets Oslo Teodor Sveen-Nilsen
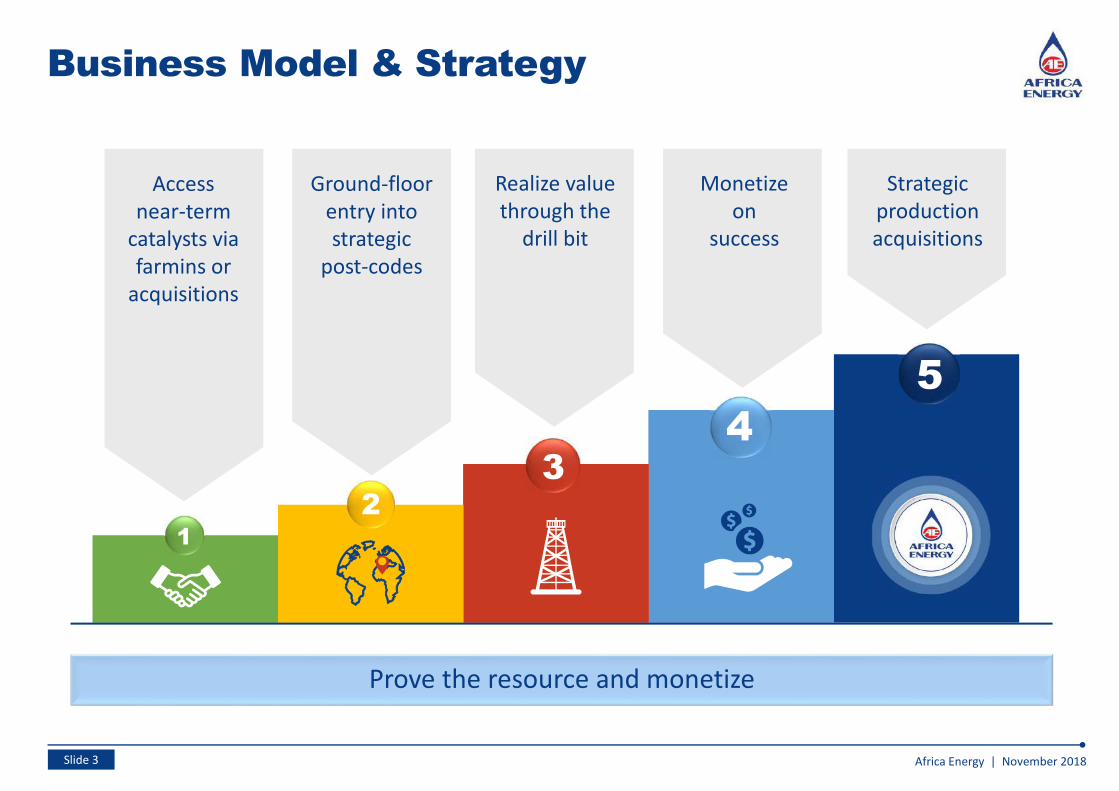
Business Model & Strategy
Slide 3 Africa Energy | November 2018
1
2
34
5
Ground-floor
entry into
strategic
post-codes
Access
near-term
catalysts via
farmins or
acquisitions
Monetize
on
success
Strategic
production
acquisitions
Realize value
through the
drill bit
Prove the resource and monetize
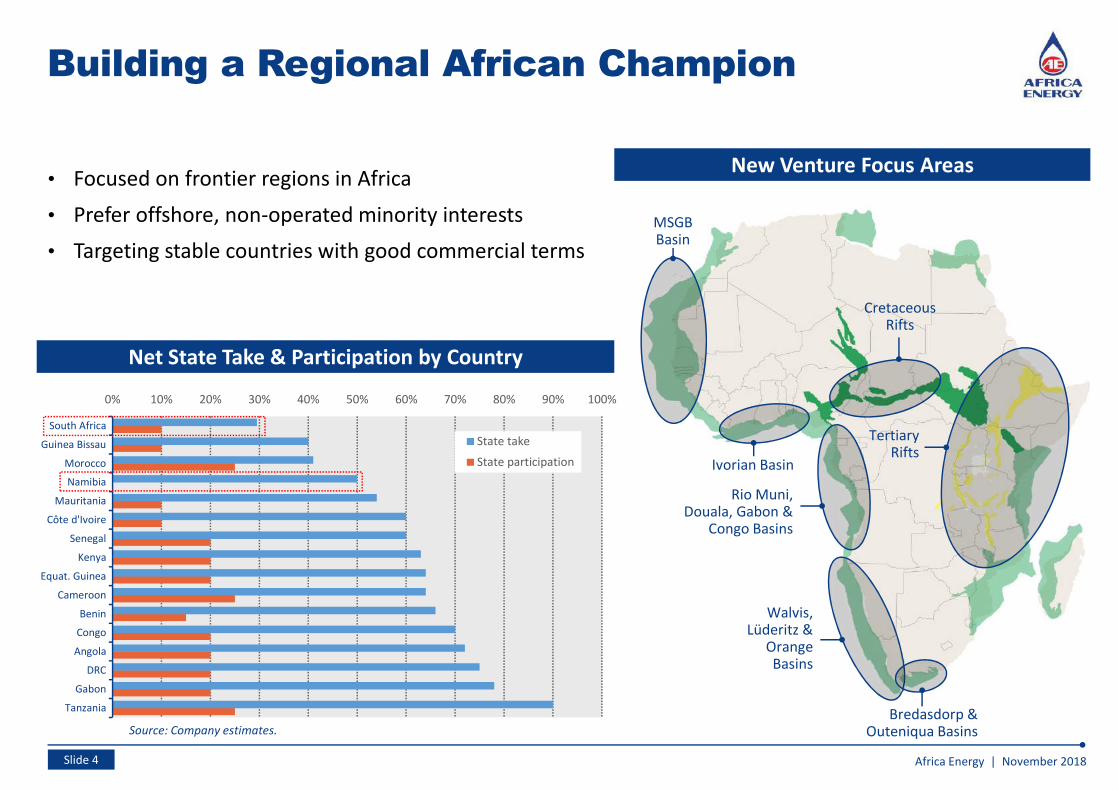
Rio Muni, Douala, Gabon &
Congo Basins
Tertiary Rifts
Walvis, Lüderitz &
Orange Basins
CretaceousRifts
MSGB Basin
Ivorian Basin
Building a Regional African Champion
Africa Energy | November 2018Slide 4
0% 10% 20% 30% 40% 50% 60% 70% 80% 90% 100%
Tanzania
Gabon
DRC
Angola
Congo
Benin
Cameroon
Equat. Guinea
Kenya
Senegal
Côte d'Ivoire
Mauritania
Namibia
Morocco
Guinea Bissau
South Africa
State take
State participation
Net State Take & Participation by Country
• Focused on frontier regions in Africa
• Prefer offshore, non-operated minority interests
• Targeting stable countries with good commercial terms
Source: Company estimates.
Bredasdorp & Outeniqua Basins
New Venture Focus Areas
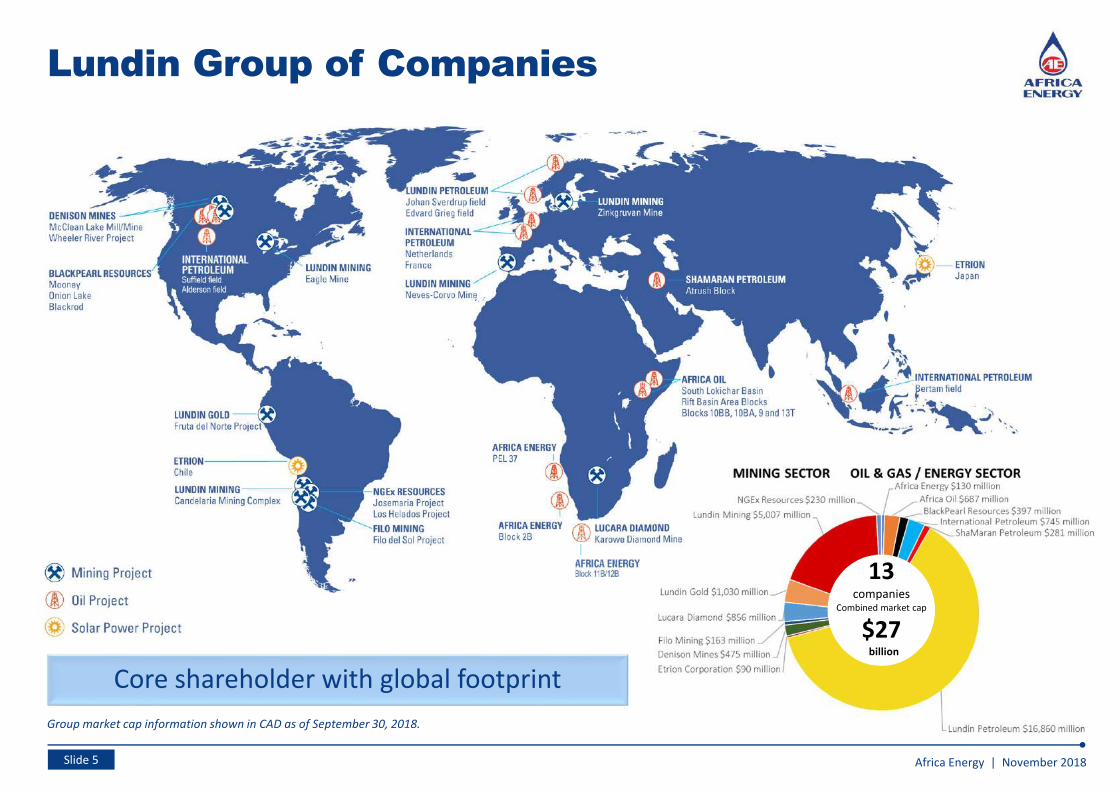
Lundin Group of Companies
Africa Energy | November 2018Slide 5
Group market cap information shown in CAD as of September 30, 2018.
Core shareholder with global footprint
13companies
Combined market cap
$27billion
Africa Energy | November 2018
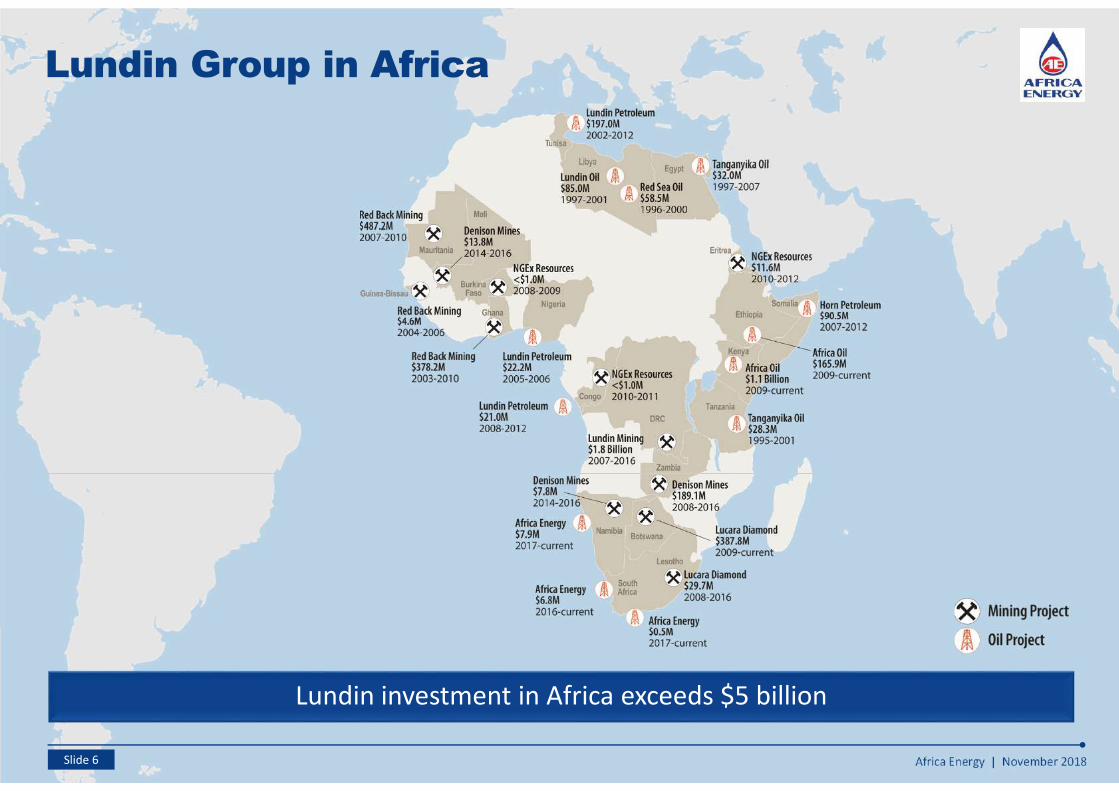
Lundin Group in Africa
Lundin investment in Africa exceeds $5 billion
Slide 6
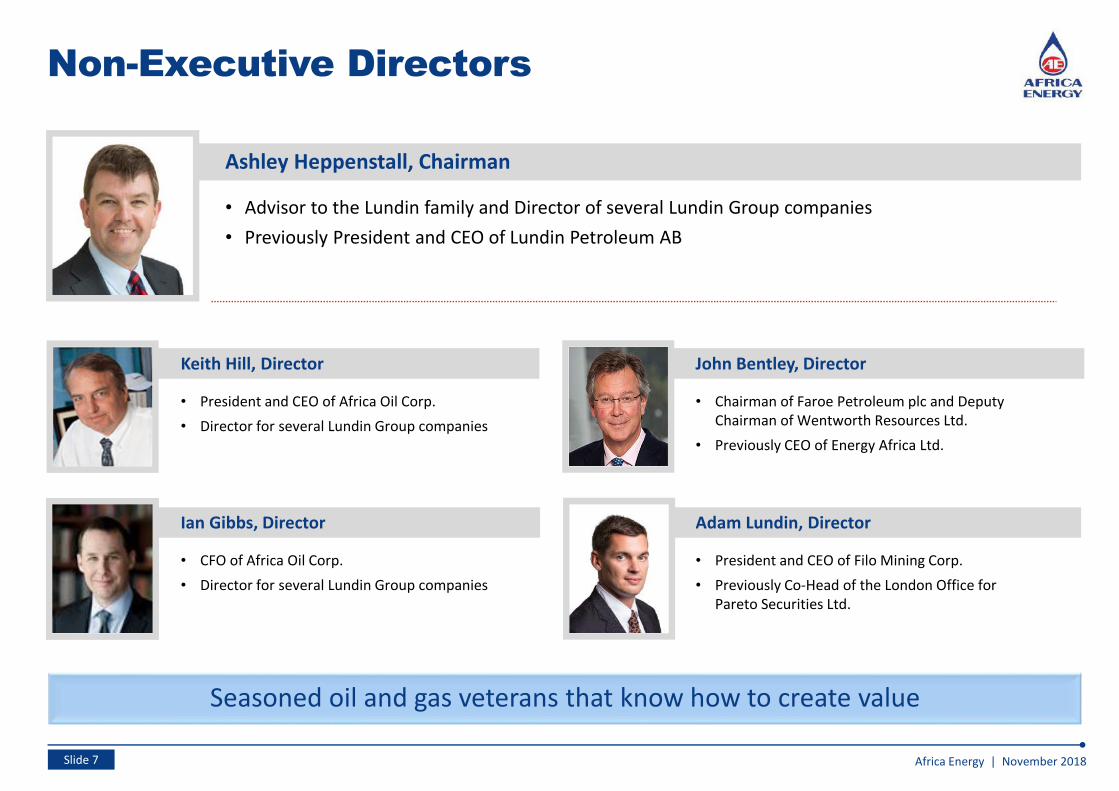
Non-Executive Directors
Africa Energy | November 2018Slide 7
Seasoned oil and gas veterans that know how to create value
Ashley Heppenstall, Chairman
• Advisor to the Lundin family and Director of several Lundin Group companies
• Previously President and CEO of Lundin Petroleum AB
Keith Hill, Director
• President and CEO of Africa Oil Corp.
• Director for several Lundin Group companies
Ian Gibbs, Director
• CFO of Africa Oil Corp.
• Director for several Lundin Group companies
John Bentley, Director
• Chairman of Faroe Petroleum plc and Deputy
Chairman of Wentworth Resources Ltd.
• Previously CEO of Energy Africa Ltd.
Adam Lundin, Director
• President and CEO of Filo Mining Corp.
• Previously Co-Head of the London Office for
Pareto Securities Ltd.
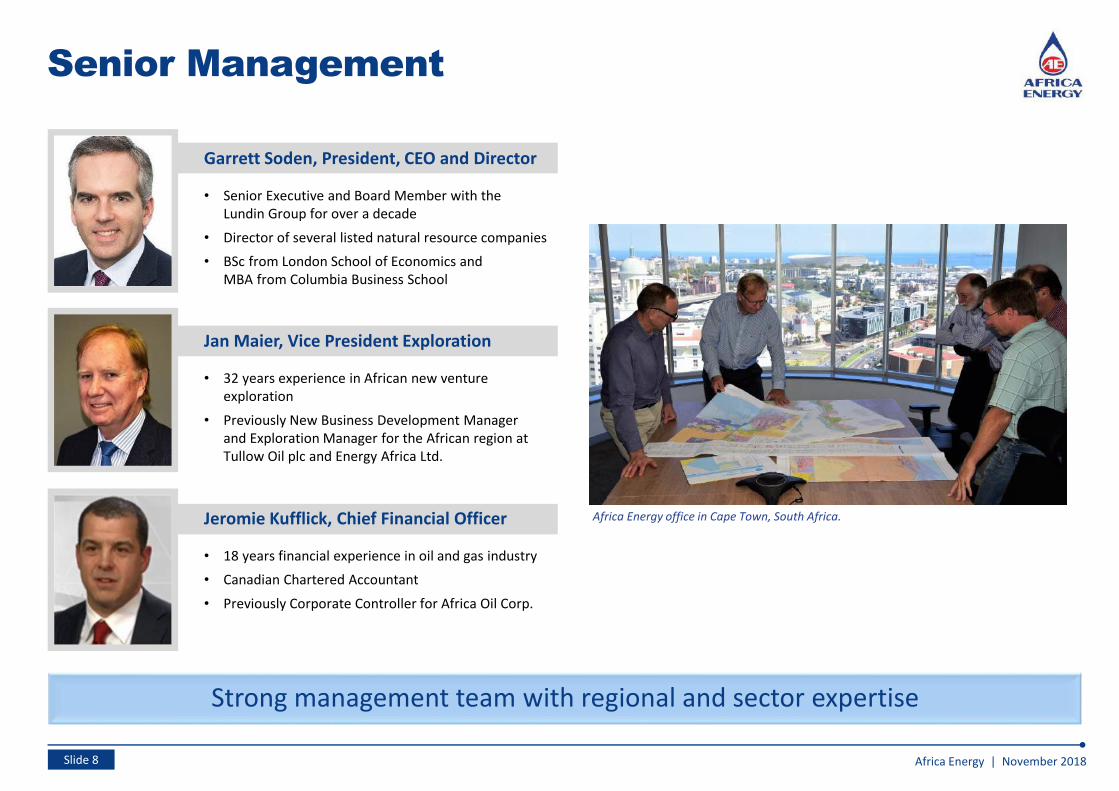
Senior Management
Africa Energy | November 2018Slide 8
Garrett Soden, President, CEO and Director
• Senior Executive and Board Member with the
Lundin Group for over a decade
• Director of several listed natural resource companies
• BSc from London School of Economics and
MBA from Columbia Business School
Jan Maier, Vice President Exploration
• 32 years experience in African new venture
exploration
• Previously New Business Development Manager
and Exploration Manager for the African region at
Tullow Oil plc and Energy Africa Ltd.
Jeromie Kufflick, Chief Financial Officer
• 18 years financial experience in oil and gas industry
• Canadian Chartered Accountant
• Previously Corporate Controller for Africa Oil Corp.
Africa Energy office in Cape Town, South Africa
Strong management team with regional and sector expertise
Africa Energy office in Cape Town, South Africa.
Africa Energy | November 2018Slide 9
Ghana
Resource numbers obtained from third party public disclosure and have not been subject to independent audit by the Company.
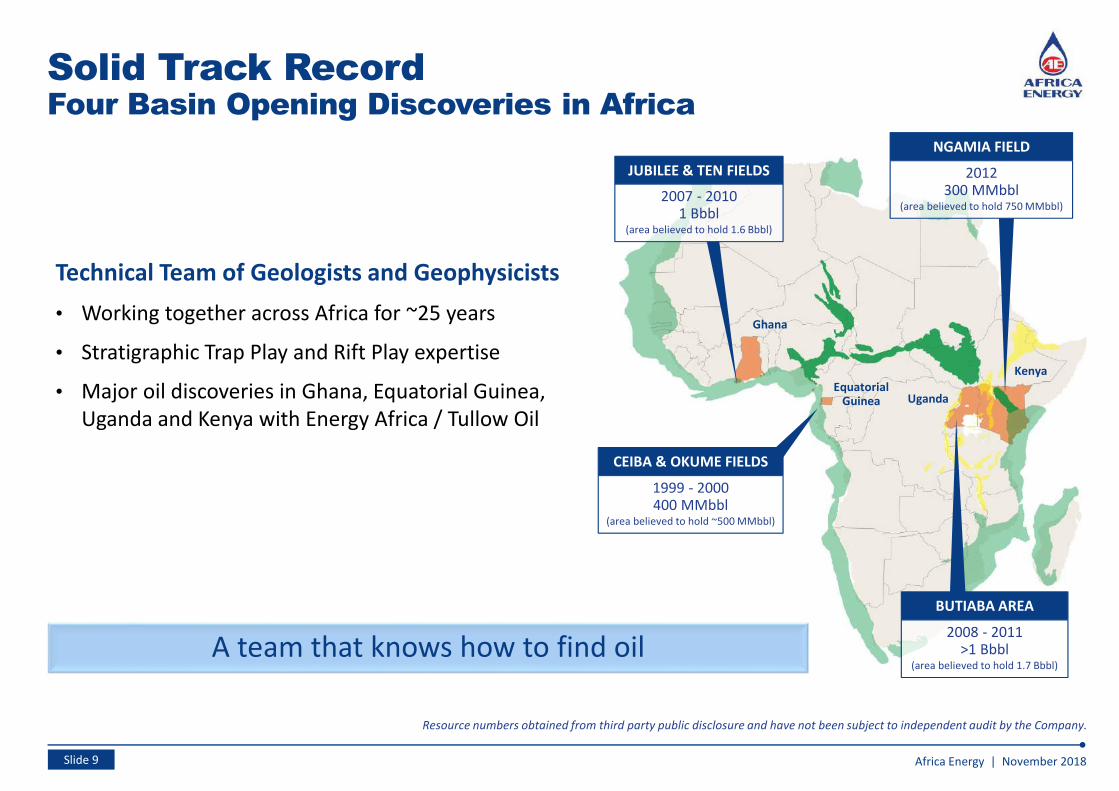
2007 - 20101 Bbbl
(area believed to hold 1.6 Bbbl)
JUBILEE & TEN FIELDS
Uganda
Kenya
Equatorial Guinea
1999 - 2000400 MMbbl
(area believed to hold ~500 MMbbl)
CEIBA & OKUME FIELDS
2008 - 2011>1 Bbbl
(area believed to hold 1.7 Bbbl)
BUTIABA AREA
2012300 MMbbl
(area believed to hold 750 MMbbl)
NGAMIA FIELD
A team that knows how to find oil
Solid Track RecordFour Basin Opening Discoveries in Africa
Technical Team of Geologists and Geophysicists
• Working together across Africa for ~25 years
• Stratigraphic Trap Play and Rift Play expertise
• Major oil discoveries in Ghana, Equatorial Guinea,
Uganda and Kenya with Energy Africa / Tullow Oil
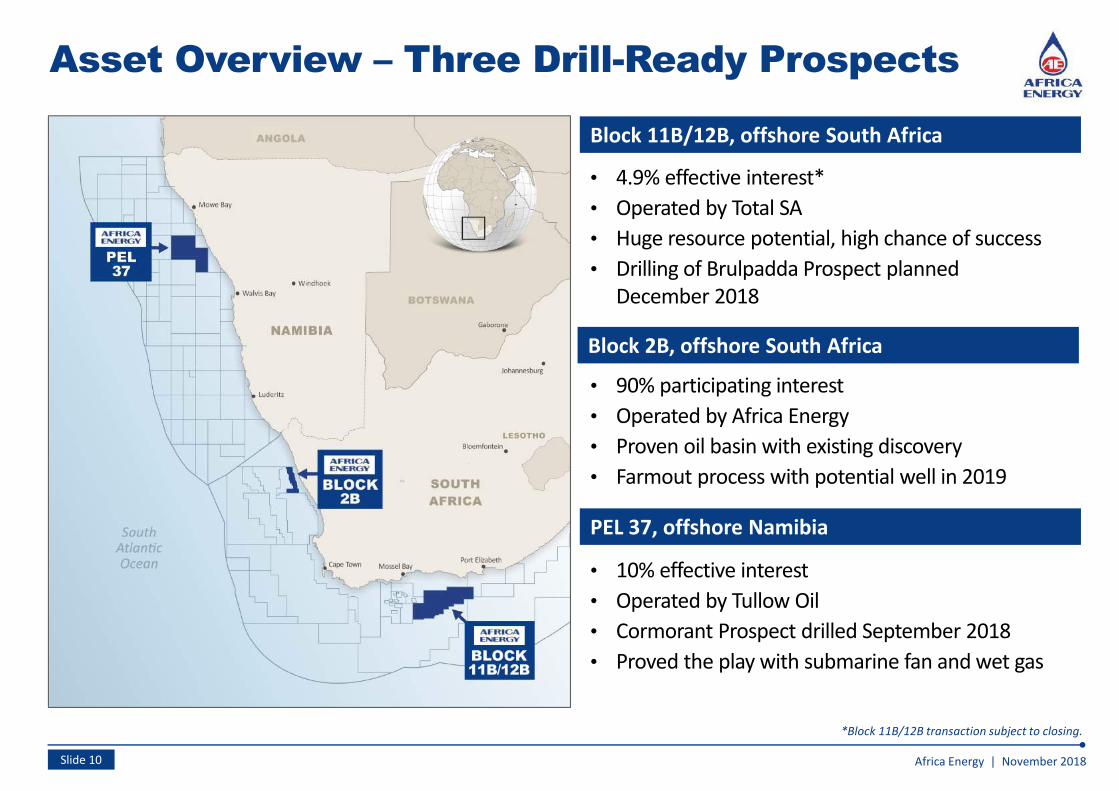
PEL 37, offshore Namibia
• 10% effective interest
• Operated by Tullow Oil
• Cormorant Prospect drilled September 2018
• Proved the play with submarine fan and wet gas
Asset Overview – Three Drill-Ready Prospects
Slide 10 Africa Energy | November 2018
Block 2B, offshore South Africa
Block 11B/12B, offshore South Africa
• 4.9% effective interest*
• Operated by Total SA
• Huge resource potential, high chance of success
• Drilling of Brulpadda Prospect planned
December 2018
• 90% participating interest
• Operated by Africa Energy
• Proven oil basin with existing discovery
• Farmout process with potential well in 2019
*Block 11B/12B transaction subject to closing.
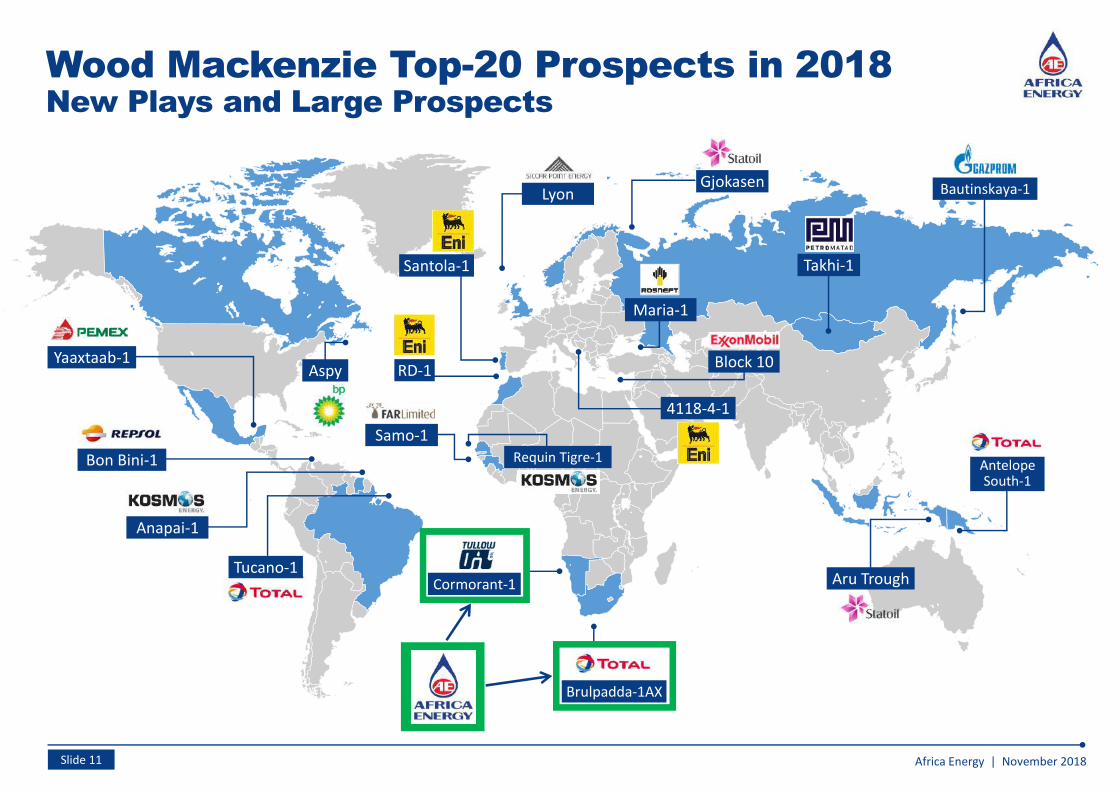
Wood Mackenzie Top-20 Prospects in 2018New Plays and Large Prospects
Africa Energy | November 2018Slide 11
Yaaxtaab-1
Bon Bini-1
Gjokasen
Aspy
Santola-1
Lyon
RD-1
Samo-1
Anapai-1
Tucano-1Cormorant-1
Brulpadda-1AX
Aru Trough
AntelopeSouth-1
Bautinskaya-1
Takhi-1
Requin Tigre-1
4118-4-1
Block 10
Maria-1
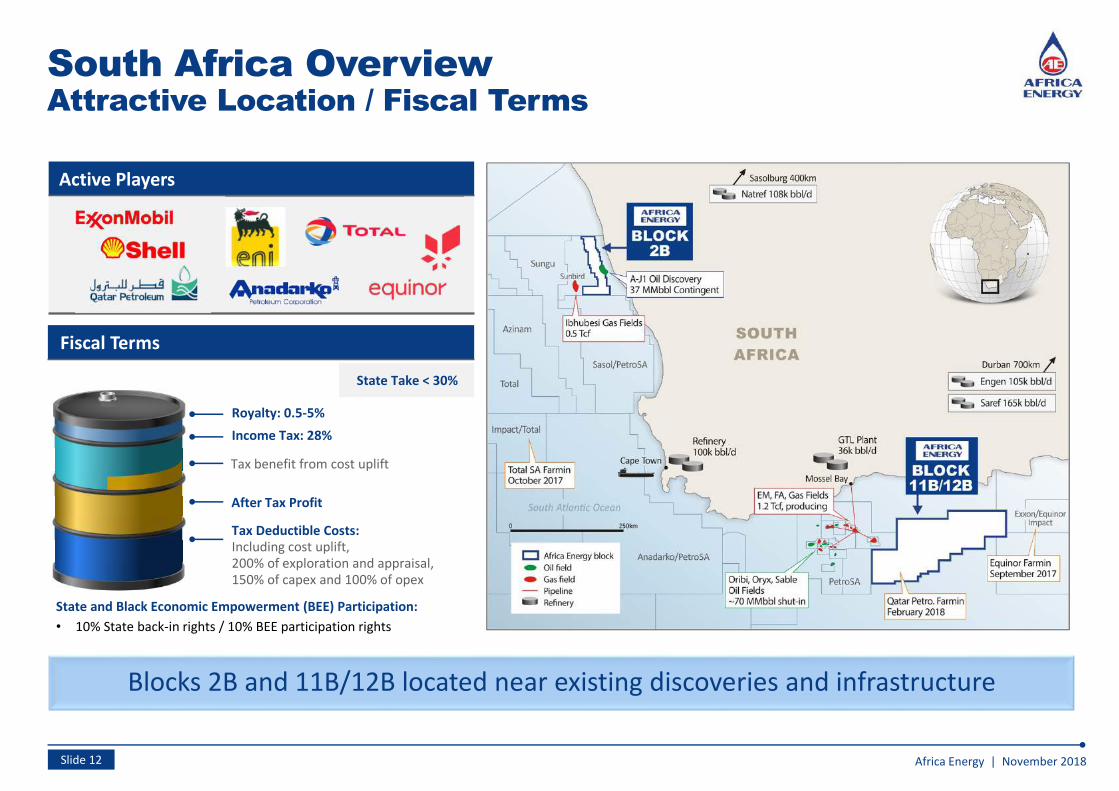
South Africa OverviewAttractive Location / Fiscal Terms
Africa Energy | November 2018Slide 12
Blocks 2B and 11B/12B located near existing discoveries and infrastructure
Fiscal Terms
State and Black Economic Empowerment (BEE) Participation:
• 10% State back-in rights / 10% BEE participation rights
State Take < 30%
Royalty: 0.5-5%
Income Tax: 28%
Tax benefit from cost uplift
After Tax Profit
Tax Deductible Costs: Including cost uplift, 200% of exploration and appraisal, 150% of capex and 100% of opex
Active Players
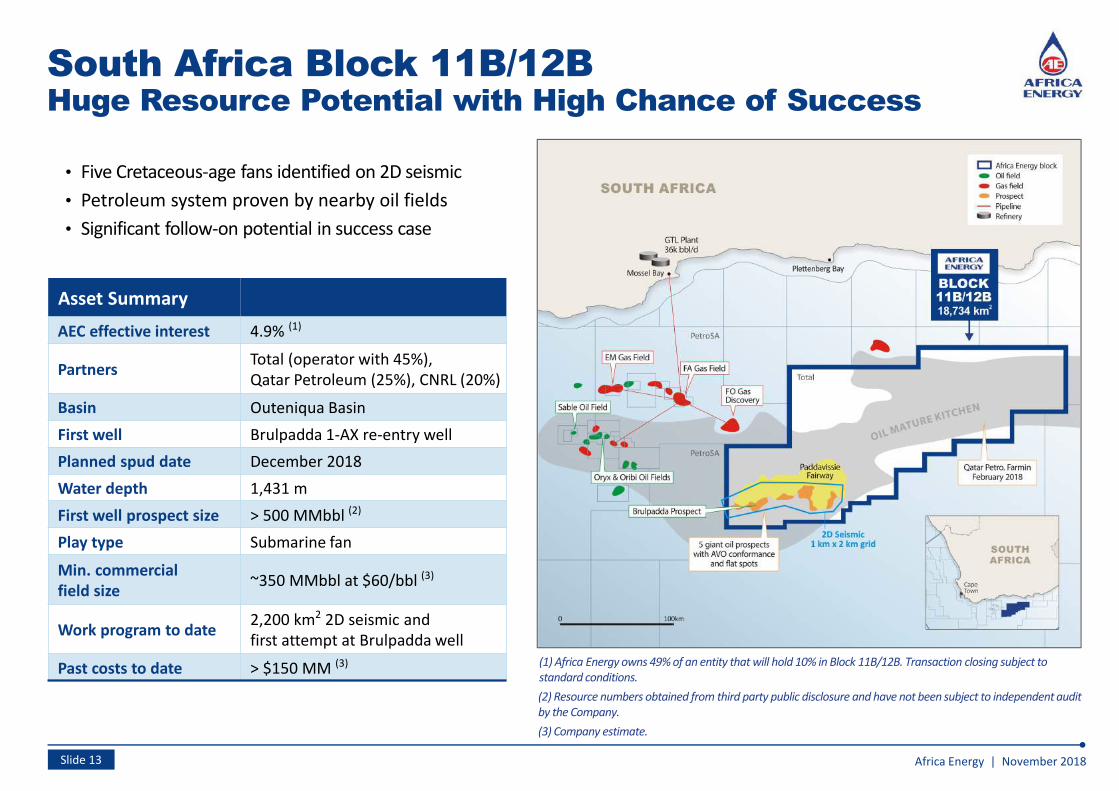
South Africa Block 11B/12BHuge Resource Potential with High Chance of Success
• Five Cretaceous-age fans identified on 2D seismic
• Petroleum system proven by nearby oil fields
• Significant follow-on potential in success case
Africa Energy | November 2018Slide 13
(1) Africa Energy owns 49% of an entity that will hold 10% in Block 11B/12B. Transaction closing subject to
standard conditions.
(2) Resource numbers obtained from third party public disclosure and have not been subject to independent audit
by the Company.
Asset Summary
AEC effective interest 4.9% (1)
PartnersTotal (operator with 45%),
Qatar Petroleum (25%), CNRL (20%)
Basin Outeniqua Basin
First well Brulpadda 1-AX re-entry well
Planned spud date December 2018
Water depth 1,431 m
First well prospect size > 500 MMbbl (2)
Play type Submarine fan
Min. commercial
field size ~350 MMbbl at $60/bbl (3)
Work program to date 2,200 km2 2D seismic and
first attempt at Brulpadda well
Past costs to date > $150 MM (3)
(3) Company estimate.
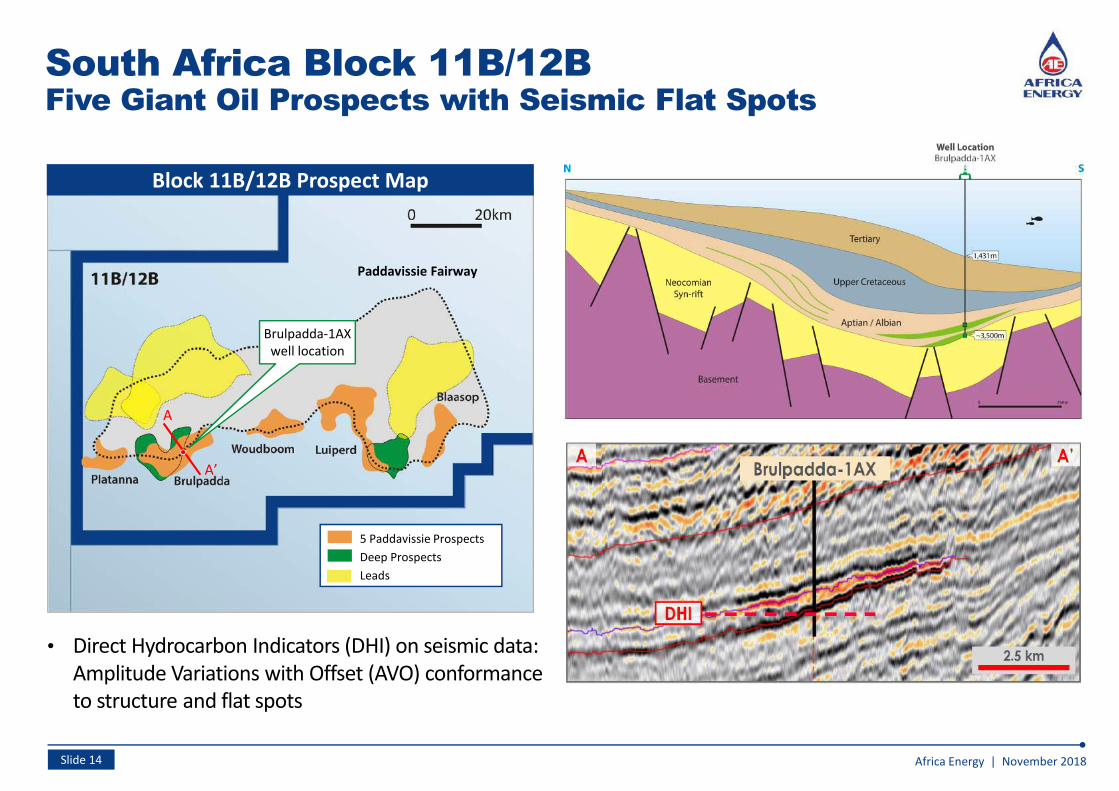
South Africa Block 11B/12BFive Giant Oil Prospects with Seismic Flat Spots
Africa Energy | November 2018Slide 14
• Direct Hydrocarbon Indicators (DHI) on seismic data:
Amplitude Variations with Offset (AVO) conformance
to structure and flat spots
A’
A
Paddavissie Fairway
5 Paddavissie Prospects
Deep Prospects
Leads
Block 11B/12B Prospect Map
Brulpadda-1AX
well location
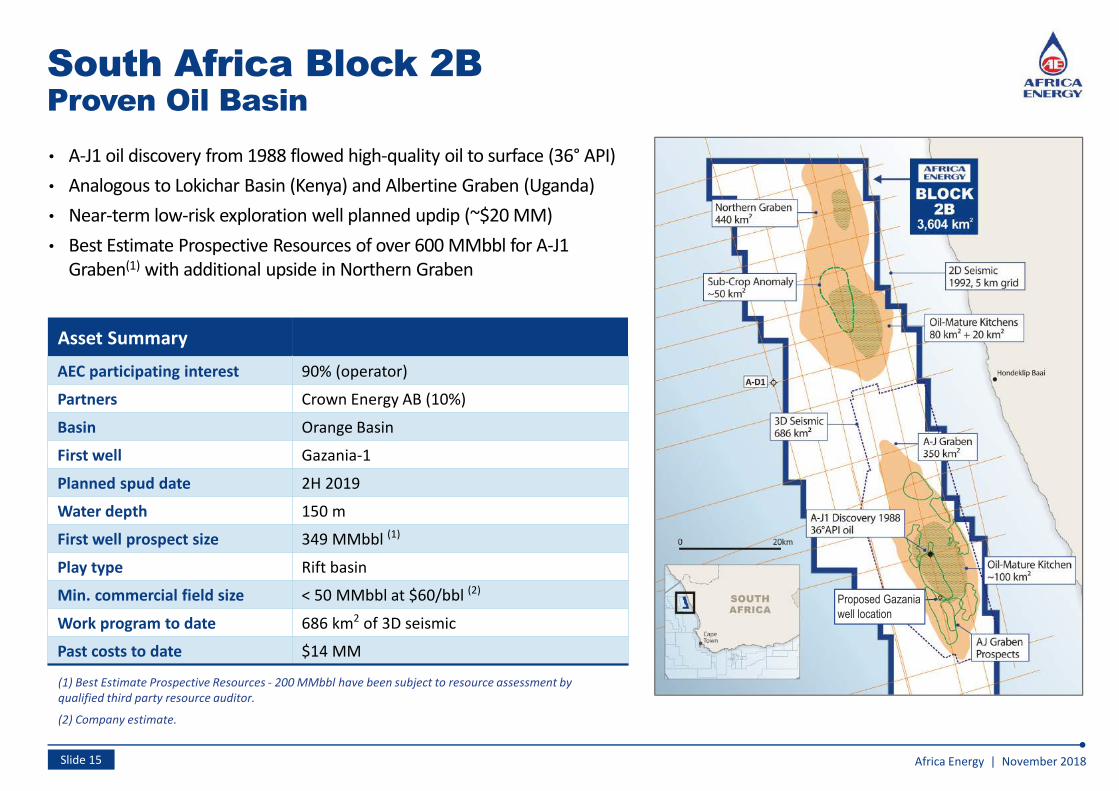
South Africa Block 2BProven Oil Basin
• A-J1 oil discovery from 1988 flowed high-quality oil to surface (36° API)
• Analogous to Lokichar Basin (Kenya) and Albertine Graben (Uganda)
• Near-term low-risk exploration well planned updip (~$20 MM)
• Best Estimate Prospective Resources of over 600 MMbbl for A-J1
Graben(1) with additional upside in Northern Graben
Africa Energy | November 2018Slide 15
(1) Best Estimate Prospective Resources - 200 MMbbl have been subject to resource assessment by
qualified third party resource auditor.
Asset Summary
AEC participating interest 90% (operator)
Partners Crown Energy AB (10%)
Basin Orange Basin
First well Gazania-1
Planned spud date 2H 2019
Water depth 150 m
First well prospect size 349 MMbbl (1)
Play type Rift basin
Min. commercial field size < 50 MMbbl at $60/bbl (2)
Work program to date 686 km2 of 3D seismic
Past costs to date $14 MM
(2) Company estimate.
Proposed Gazania
well location
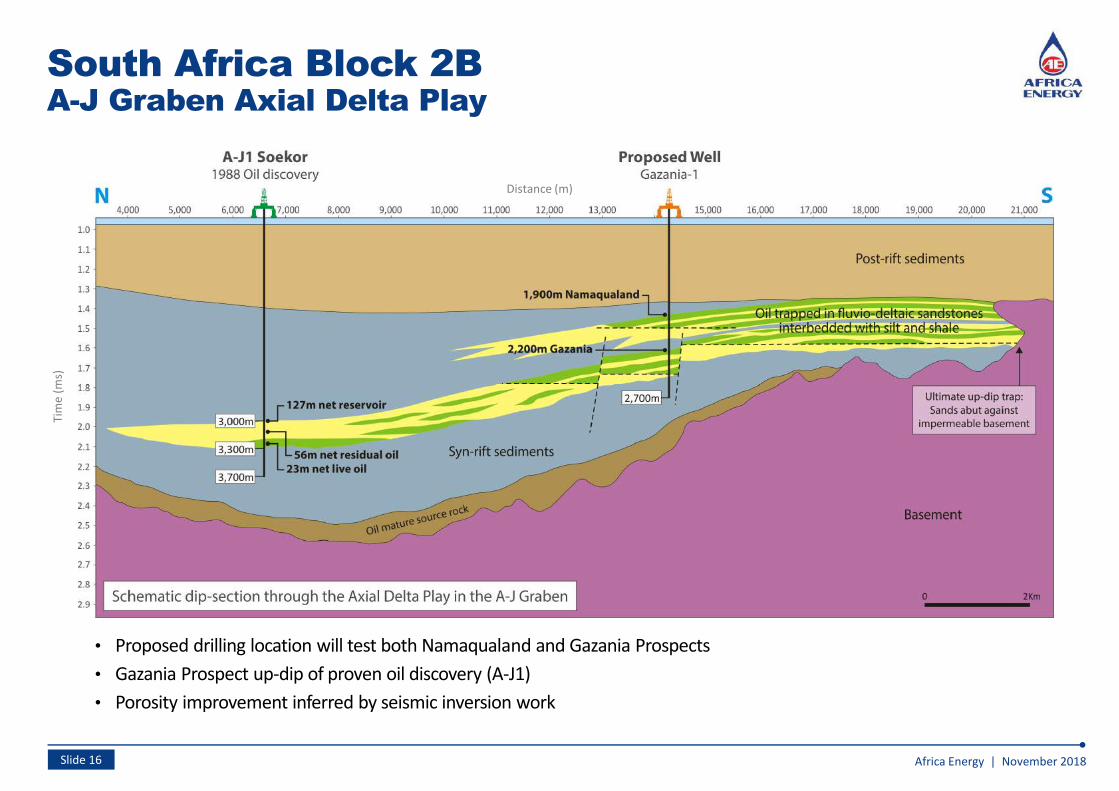
South Africa Block 2BA-J Graben Axial Delta Play
Africa Energy | November 2018Slide 16
• Proposed drilling location will test both Namaqualand and Gazania Prospects
• Gazania Prospect up-dip of proven oil discovery (A-J1)
• Porosity improvement inferred by seismic inversion work
Tim
e (
ms)
Distance (m)
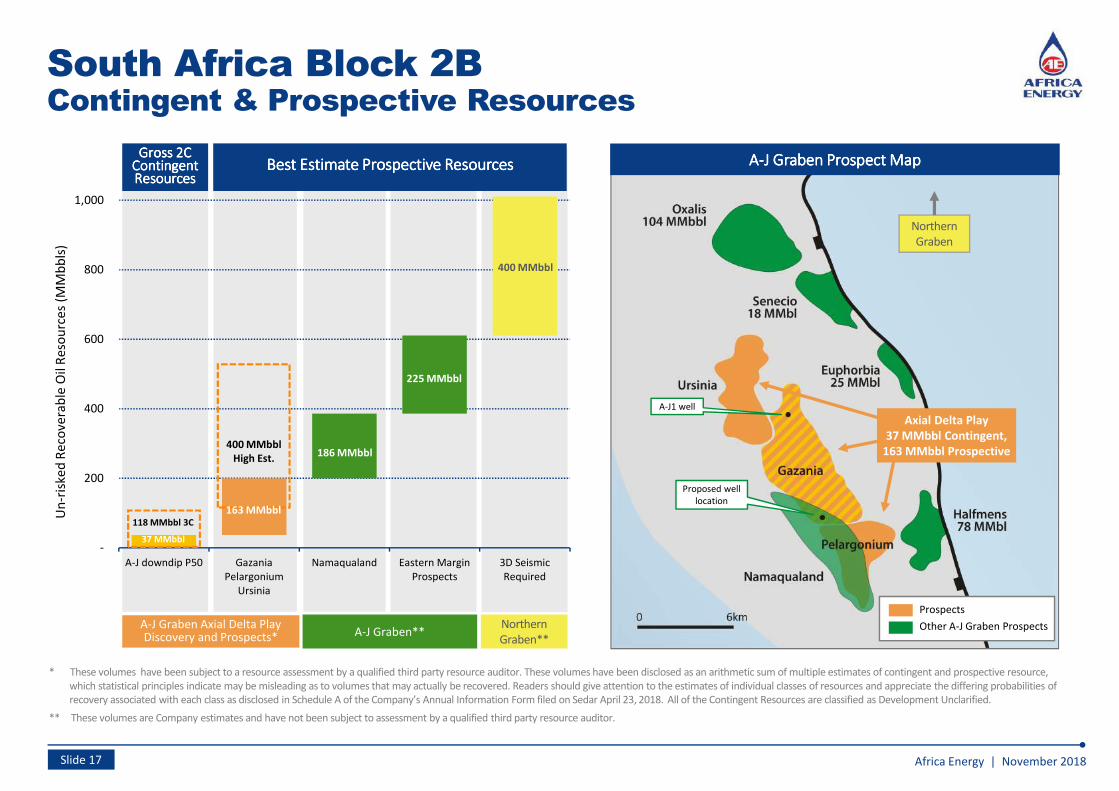
South Africa Block 2BContingent & Prospective Resources
Africa Energy | November 2018Slide 17
* These volumes have been subject to a resource assessment by a qualified third party resource auditor. These volumes have been disclosed as an arithmetic sum of multiple estimates of contingent and prospective resource,
which statistical principles indicate may be misleading as to volumes that may actually be recovered. Readers should give attention to the estimates of individual classes of resources and appreciate the differing probabilities of
recovery associated with each class as disclosed in Schedule A of the Company’s Annual Information Form filed on Sedar April 23, 2018. All of the Contingent Resources are classified as Development Unclarified.
** These volumes are Company estimates and have not been subject to assessment by a qualified third party resource auditor.
Un
-ris
ked
Re
cove
rab
le O
il R
eso
urc
es
(MM
bb
ls)
A-J Graben Axial Delta PlayDiscovery and Prospects* A-J Graben**
Northern
Graben**
Gross 2CGross 2CGross 2CGross 2CContingentContingentContingentContingentResourcesResourcesResourcesResources
-
200
400
600
800
1,000
A-J downdip P50 Gazania
Pelargonium
Ursinia
Namaqualand Eastern Margin
Prospects
3D Seismic
Required
37 MMbbl
163 MMbbl
186 MMbbl
225 MMbbl
400 MMbbl
Best Estimate Prospective ResourcesBest Estimate Prospective ResourcesBest Estimate Prospective ResourcesBest Estimate Prospective Resources
118 MMbbl 3C
400 MMbbl
High Est.
AAAA----J Graben Prospect MapJ Graben Prospect MapJ Graben Prospect MapJ Graben Prospect Map
Northern
Graben
Axial Delta Play
37 MMbbl Contingent,
163 MMbbl Prospective
Prospects
Other A-J Graben Prospects
Proposed well
location
A-J1 well
Fiscal Terms
Tax Deductible Costs: E&P expenses deductible when incurred, development costs depreciated over time
Income Tax: 35%
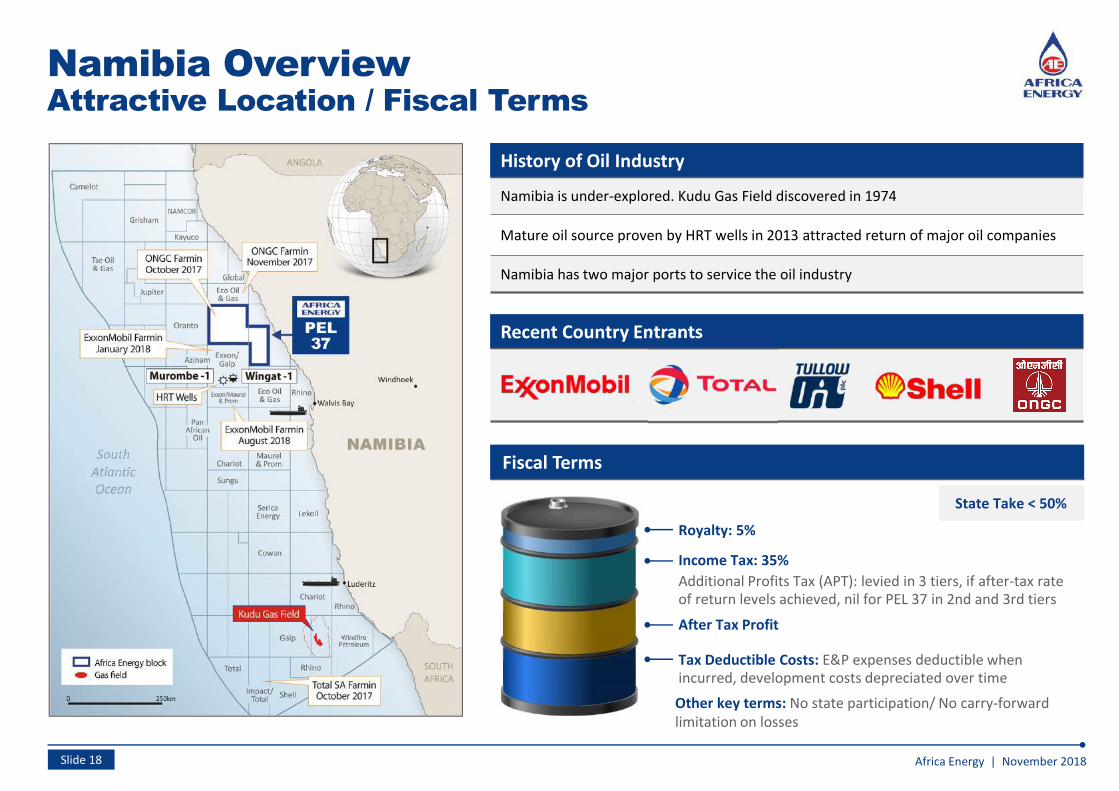
Namibia Overview Attractive Location / Fiscal Terms
Africa Energy | November 2018Slide 18
History of Oil Industry
Namibia is under-explored. Kudu Gas Field discovered in 1974
Mature oil source proven by HRT wells in 2013 attracted return of major oil companies
Namibia has two major ports to service the oil industry
State Take < 50%
Royalty: 5%
Additional Profits Tax (APT): levied in 3 tiers, if after-tax rate of return levels achieved, nil for PEL 37 in 2nd and 3rd tiers
After Tax Profit
Other key terms: No state participation/ No carry-forward
limitation on losses
Recent Country Entrants
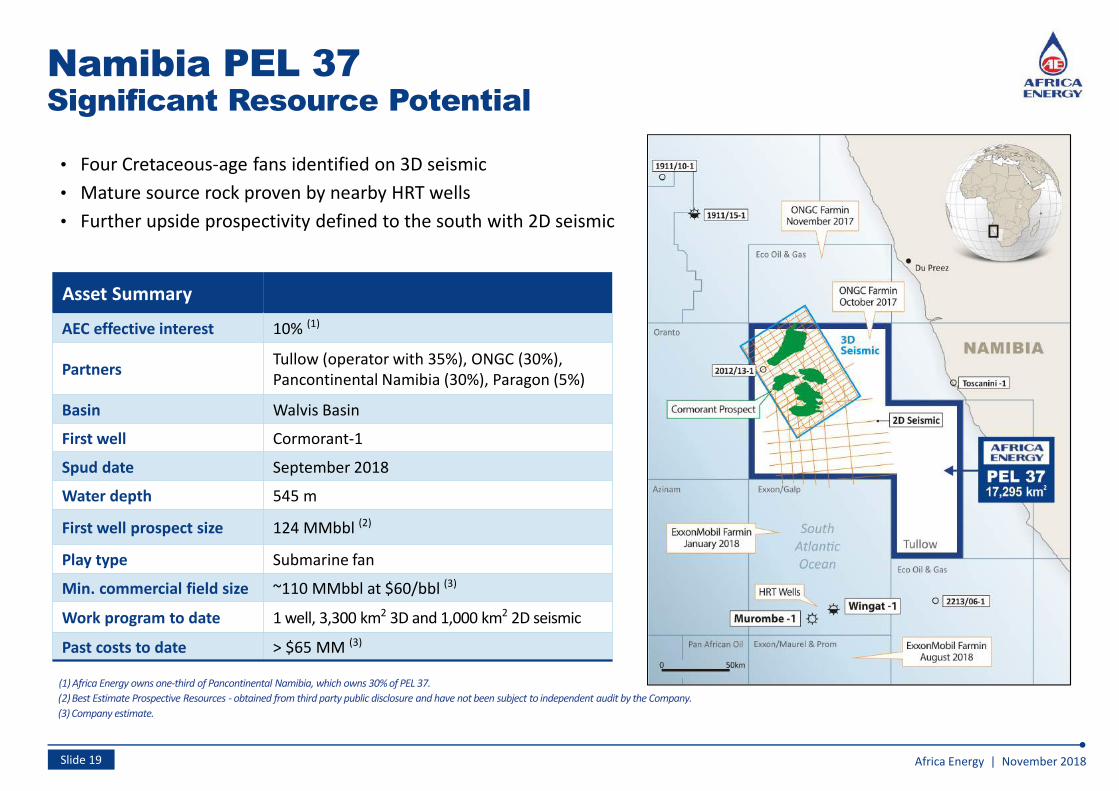
Namibia PEL 37 Significant Resource Potential
Africa Energy | November 2018Slide 19
• Four Cretaceous-age fans identified on 3D seismic
• Mature source rock proven by nearby HRT wells
• Further upside prospectivity defined to the south with 2D seismic
(1) Africa Energy owns one-third of Pancontinental Namibia, which owns 30% of PEL 37.
(2) Best Estimate Prospective Resources - obtained from third party public disclosure and have not been subject to independent audit by the Company.
Asset Summary
AEC effective interest 10% (1)
PartnersTullow (operator with 35%), ONGC (30%),
Pancontinental Namibia (30%), Paragon (5%)
Basin Walvis Basin
First well Cormorant-1
Spud date September 2018
Water depth 545 m
First well prospect size 124 MMbbl (2)
Play type Submarine fan
Min. commercial field size ~110 MMbbl at $60/bbl (3)
Work program to date 1 well, 3,300 km2 3D and 1,000 km2 2D seismic
Past costs to date > $65 MM (3)
(3) Company estimate.
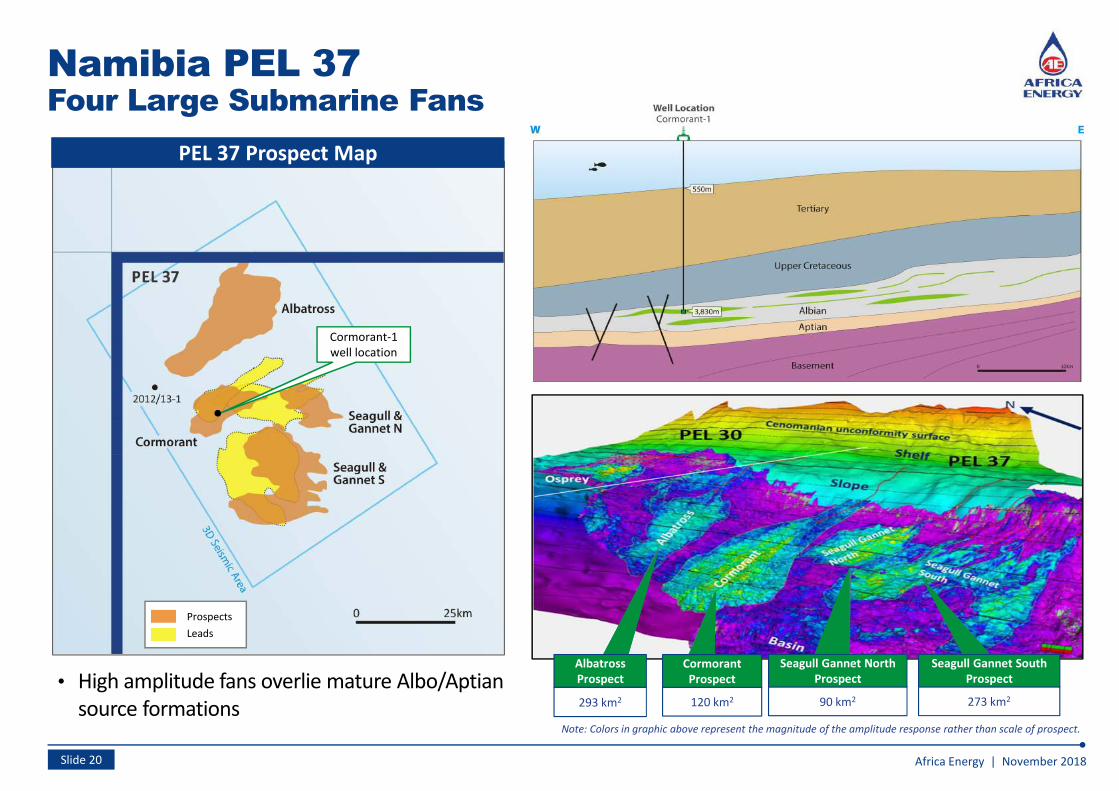
Namibia PEL 37Four Large Submarine Fans
Africa Energy | November 2018Slide 20
• High amplitude fans overlie mature Albo/Aptian
source formations
Prospects
Leads
PEL 37 Prospect Map
293 km2
Albatross
Prospect
90 km2
Seagull Gannet North
Prospect
120 km2
Cormorant
Prospect
273 km2
Seagull Gannet South
Prospect
Note: Colors in graphic above represent the magnitude of the amplitude response rather than scale of prospect.
Cormorant-1
well location
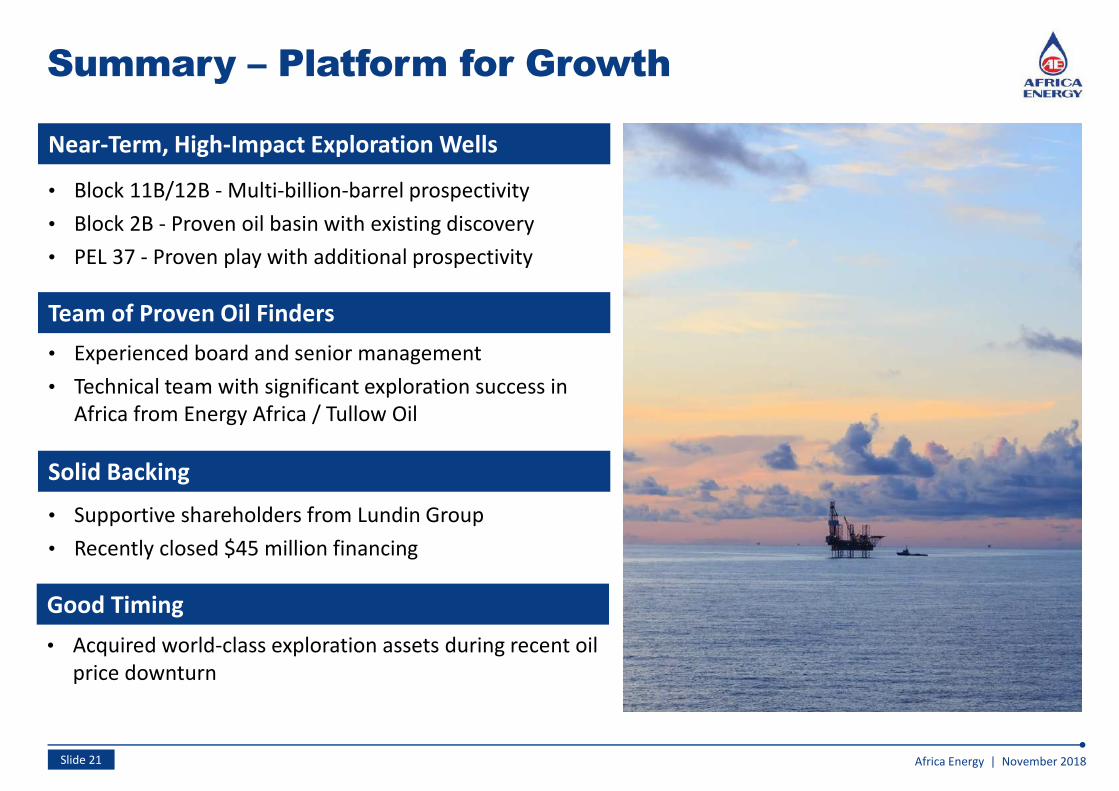
Near-Term, High-Impact Exploration Wells
Summary – Platform for Growth
• Experienced board and senior management
• Technical team with significant exploration success in
Africa from Energy Africa / Tullow Oil
Africa Energy | November 2018Slide 21
Team of Proven Oil Finders
Solid Backing
Good Timing
• Acquired world-class exploration assets during recent oil
price downturn
• Supportive shareholders from Lundin Group
• Recently closed $45 million financing
• Block 11B/12B - Multi-billion-barrel prospectivity
• Block 2B - Proven oil basin with existing discovery
• PEL 37 - Proven play with additional prospectivity
Cautionary Statements
This presentation has been prepared and issued by and is the sole responsibility of Africa Energy Corp. (the "Company") and its subsidiaries. It comprises the written materials for a presentation to investors and/or
industry professionals concerning the Company's business activities. By attending this presentation and/or accepting a copy of this document, you agree to be bound by the following conditions and will be taken to have
represented, warranted and undertaken that you have agreed to the following conditions.
The document is being supplied to you solely for your information and for use at the Company's presentation to investors and/or industry professionals concerning the Company's business activities. It is not an offer or
invitation to subscribe for or purchase any securities and nothing contained herein shall form the basis of any contract or commitment whatsoever. The information contained in this presentation may not be used for any
other purposes.
This presentation contains certain forward-looking information that reflects the current views and/or expectations of management of the Company with respect to its performance, business and future events including
statements with respect to financings and the Company's plans for growth and expansion. Such information is subject to a number of risks, uncertainties and assumptions, which may cause actual results to be materially
different from those expressed or implied including the risk that the Company is unable to obtain required financing and risks and uncertainties inherent in oil exploration and development activities. Readers are
cautioned that the assumptions used in the preparation of such information, such as market prices for oil and gas and chemical products, the Company's ability to explore, develop, produce and transport crude oil and
natural gas to markets and the results of exploration and development drilling and related activities, although considered reasonable at the time of preparation, may prove to be imprecise and, as such, undue reliance
should not be placed on forward-looking information. The Company assumes no future obligation to update this forward-looking information except as required by applicable securities laws.
Certain data in this presentation was obtained from various external data sources, and the Company has not verified such data with independent sources. Accordingly, no representation or warranty, express or implied,
is made and no reliance should be placed on the fairness, accuracy, correctness, completeness or reliability of that data, and such data involves risks and uncertainties and is subject to change based on various factors.
No reliance may be placed, for any purposes whatsoever, on the information contained in this presentation or on its completeness. The Company and its members, directors, officers and employees are under no
obligation to update or keep current information contained in this presentation, to correct any inaccuracies which may become apparent, or to publicly announce the result of any revision to the statements made herein
except where they would be required to do so under applicable law, and any opinions expressed in them are subject to change without notice, whether as a result of new information or future events. No representation
or warranty, express or implied, is given by the Company or any of its subsidiaries undertakings or affiliates or directors, officers or any other person as to the fairness, accuracy, correctness, completeness or reliability of
the information or opinions contained in this presentation, nor have they independently verified such information, and any reliance you place thereon will be at your sole risk. Without prejudice to the foregoing, no
liability whatsoever (in negligence or otherwise) for any loss howsoever arising, directly or indirectly, from any use of this presentation or its contents or otherwise arising in connection therewith is accepted by any such
person in relation to such information.
For additional details on the Company and certain risk factors, please see the Company's Annual Information Form filed on April 23, 2018 under its profile at www.sedar.com.
The resource estimates contained herein are estimates only and there is no guarantee that the estimated resources will be recovered. Volumes of resources have been presented based on a gross interest. Contingent
resources are those quantities of petroleum estimated, as of a given date, to be potentially recoverable from known accumulations using established technology or technology under development, but which are not
currently considered to be commercially recoverable due to one or more contingencies. Prospective resources are those quantities of petroleum estimated, as of a given date, to be potentially recoverable from
undiscovered accumulations by application of future development projects. There is no certainty that it will be commercially viable to produce any portion of the “Contingent Resources” referred to in this presentation.
In the case of “Prospective Resources” there is no certainty that any portion of the resources will be discovered. If discovered, there is no certainty that it will be commercially viable to produce any portion of the
resources referred to in this presentation.
Uncertainty Ranges for Resources
Estimates of resource volumes can be categorized according to the range of uncertainty associated with the estimates. Uncertainty ranges are described in the COGE Handbook as low, best and high estimates as follows:
A “low estimate” (1C) is considered to be a conservative estimate of the quantity that will actually be recovered. It is likely that the actual remaining quantities recovered will exceed the low estimate. If probabilistic
methods are used, there should be at least a 90% probability (P90) that the quantities actually recovered will equal or exceed the low estimate.
A “best estimate” (2C) is considered to be the best estimate of the quantity that will actually be recovered. It is equally likely that the actual remaining quantities recovered will be greater or less than the best estimate. If
probabilistic methods are used, there should be at least a 50% probability (P50) that the quantities actually recovered will equal or exceed the best estimate.
A “high estimate” (3C) is considered to be an optimistic estimate of the quantity that will actually be recovered. It is unlikely that the actual remaining quantities recovered will exceed the high estimate. If probabilistic
methods are used, there should be at least a 10% probability (P10) that the quantities actually recovered will equal or exceed the high estimate
Africa Energy | November 2018Slide 22
Thank You
Investor Relations - Canada
Sophia ShaneSophia ShaneSophia ShaneSophia Shane
Email: Email: Email: Email: [email protected]
Tel: Tel: Tel: Tel: +1 (604) 689-7842
Creating Value Through Oil Exploration in Africa
www.africaenergycorp.com
CONTACT DETAILS
Investor Relations - Sweden
Robert ErikssonRobert ErikssonRobert ErikssonRobert Eriksson
Email: Email: Email: Email: [email protected]
Tel: Tel: Tel: Tel: +46 701 11 26 15