africa used vehicle report
TRANSCRIPT

Africa Used Vehicle Report
Ariadne Baskin
African Clean Mobility WeekMarch 13 2018
Content
2
• Africa Used Vehicles Report
• Regulatory Environment
• Supply Chain & Scale of Used Vehicle Flows
• Way forward


? Data availability (disaggregated country used vehicle statistics)? Discrepancies in trade statistics? Variability of car ownership data in AfricaIn 2014, Sub- Saharan Africa recorded 2% of vehicle ownership per capita compared with 70% in the United States, 50% in Europe, and 6% in China (OECD/IEA, 2014).
? Fluidity of many nations borders & grey maket

“ENSURING BETTER AIR QUALITY AND REDUCED CLIMATE EMISSIONS
THROUGH CLEANER USED VEHICLES”UN Environment & UN Economic Commission
for Europe (20- 24 Feb 2017, Geneva Switzerland
Partnership for Clean Fuel and Vehicles - Used Vehicle Working Group
Global Status of Used Vehicles Report & Database
Africa Report on Used Vehicles
How can we ensure that used vehicles are the solution to clean mobility rather than exacerbating the current problem?

Global Status of Used Vehicles ReportA global report and database on what different countries and regions are doing, or not doing, to grapple with the issue of used vehicles?
• What policies are preferred? • What policies are helping leapfrog markets to cleaner and safer mobility?
Understand the global and regional supply chains, scales and quality of used vehicle flows
• What are the current trends in global and regional trade?
Understand the implications of used vehicle flows both for local pollutants, health and global emissions
There are currently no regional or global agreements that rationalize and govern the flow of used vehicles
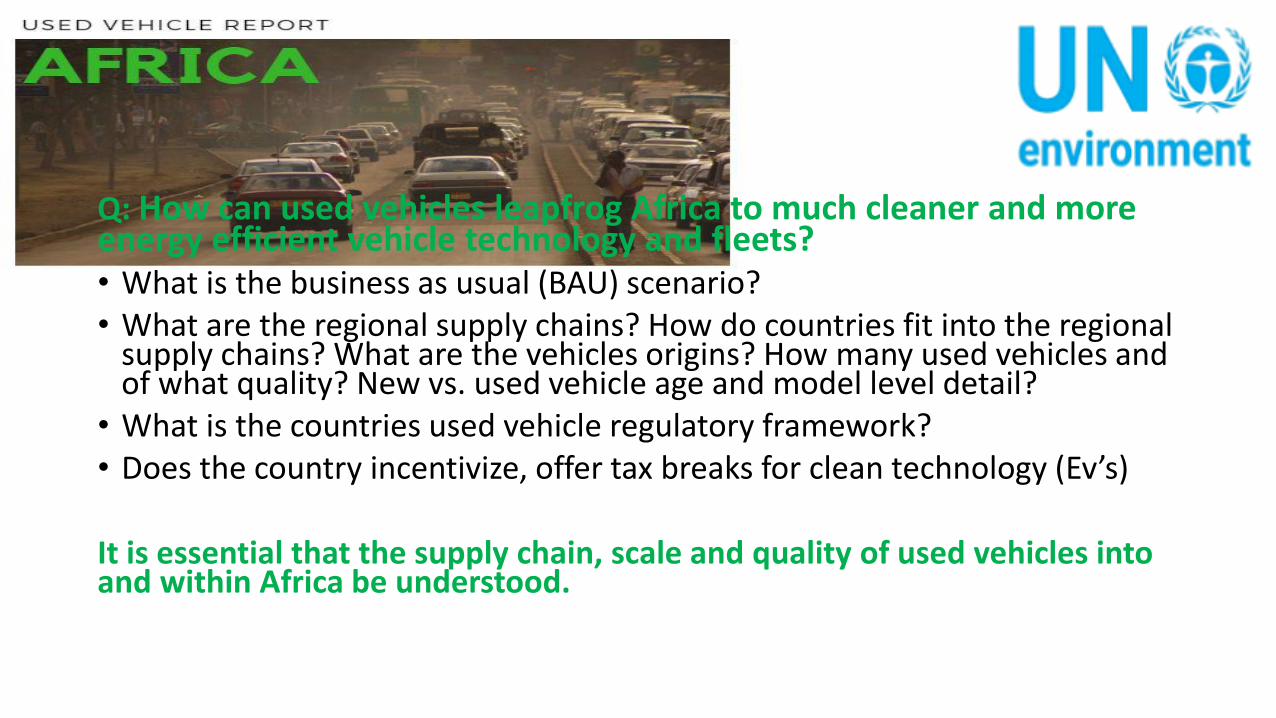
Q: How can used vehicles leapfrog Africa to much cleaner and more energy efficient vehicle technology and fleets?• What is the business as usual (BAU) scenario?• What are the regional supply chains? How do countries fit into the regional
supply chains? What are the vehicles origins? How many used vehicles and of what quality? New vs. used vehicle age and model level detail?
• What is the countries used vehicle regulatory framework? • Does the country incentivize, offer tax breaks for clean technology (Ev’s)
It is essential that the supply chain, scale and quality of used vehicles into and within Africa be understood.

Snapshot of Used Vehicles in Africa
• 42,510,000 vehicle in use in Africa ( OICA 2014)
• Used vehicle market has been estimated at about $60-70 billion in sales worldwide
• Annual vehicle fleet growth rate in Kenya and Ethiopia is 12% and 10% respectively
• In Ethiopia and Nigeria used vehicle imports account for 80% of all vehicle sales( 2016)
• More than 96% of vehicles imported into Kenya are used (2016)
• 1:131 ratio of new cars to used in Nigeria (2017)
• Africa imports 4 x more automotive products than it exports
• In 2014, automotive imports valued $48 billion and exports totaled $11 billion.
• In Nigeria internet bases car sales account for 89% of all car sales (2015)

Regulatory Environment
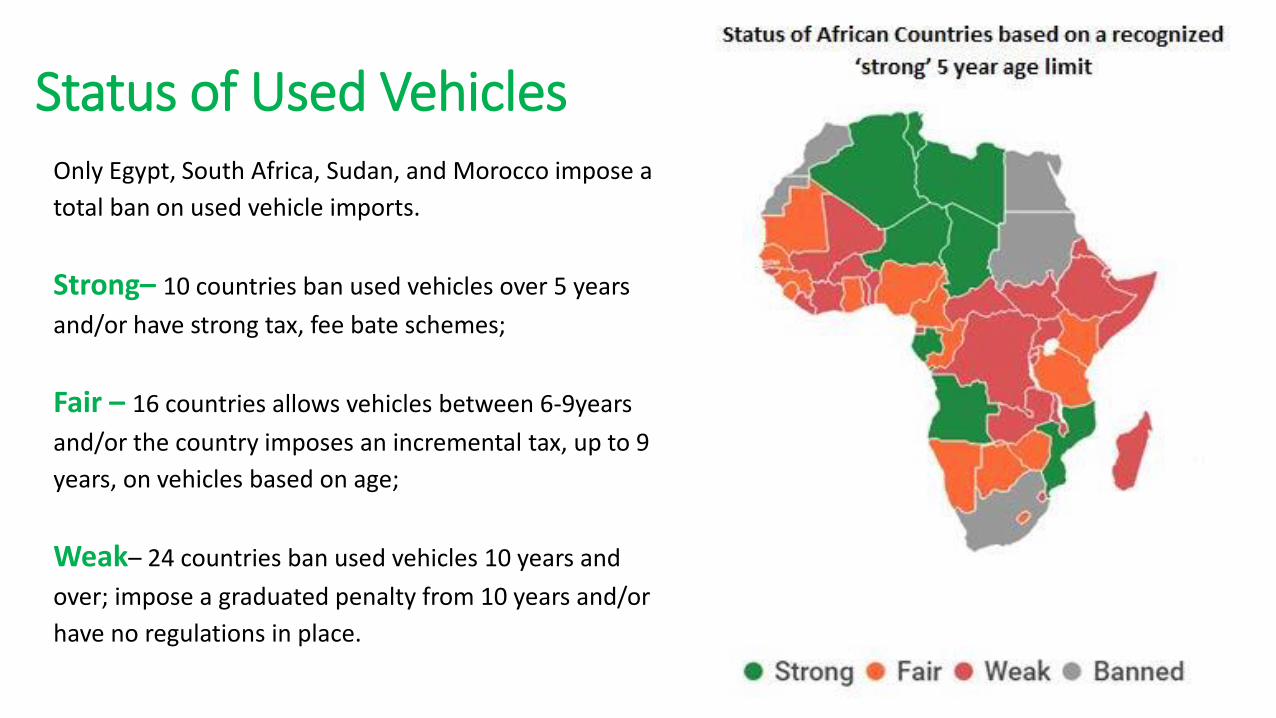
Only Egypt, South Africa, Sudan, and Morocco impose a
total ban on used vehicle imports.
Strong– 10 countries ban used vehicles over 5 years
and/or have strong tax, fee bate schemes;
Fair – 16 countries allows vehicles between 6-9years
and/or the country imposes an incremental tax, up to 9
years, on vehicles based on age;
Weak– 24 countries ban used vehicles 10 years and
over; impose a graduated penalty from 10 years and/or
have no regulations in place.
Status of Used Vehicles

25 countries place a maximum age limit on imports
4 countries completely ban imports
10 countries ban imports over 5
6 countries ban imports over 10 years old.

Age Restrictions of LDV Used Vehicle Imports, January 2018

Mauritius – Leapfrogging to Clean Technology
Adopted a carbon feebate scheme in 2011 at 158 CO2g/km
Scheme resulted to an improvement of fuel economy from
7l/100km in 2005 to 5.8l/100km in 2014
50 % excise duty waived on electric and hybrid cars and
Registration fee also reduced by 50%
From 2009 to 2014, the number of hybrid and electric cars
has increased from 43 to 1824 and from 0 to 8 respectively
2016 feebate abolished and moved to taxation system with
additional incentives to electric vehicles
The majority of used vehicles are from Japan- 49% (2016)
3 year age limit
There are plenty of opportunities to incentivise the purchase of used Ev’s and clean technology through tax breaks

Uganda- Average LDV Fuel Economy liters per 100km
2005 12.5 ~10% decrease
2014 13.7
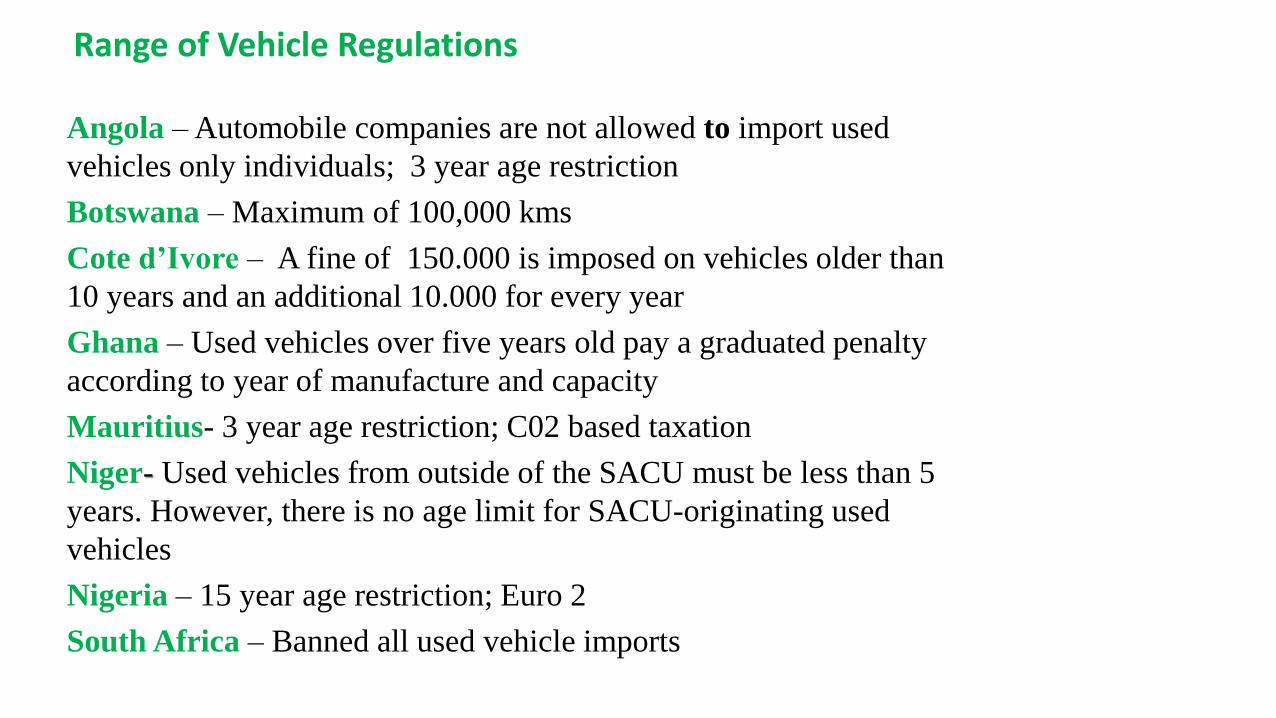
Angola – Automobile companies are not allowed to import used
vehicles only individuals; 3 year age restriction
Botswana – Maximum of 100,000 kms
Cote d’Ivore – A fine of 150.000 is imposed on vehicles older than
10 years and an additional 10.000 for every year
Ghana – Used vehicles over five years old pay a graduated penalty
according to year of manufacture and capacity
Mauritius- 3 year age restriction; C02 based taxation
Niger- Used vehicles from outside of the SACU must be less than 5
years. However, there is no age limit for SACU-originating used
vehicles
Nigeria – 15 year age restriction; Euro 2
South Africa – Banned all used vehicle imports
Range of Vehicle Regulations

Regulations on Vehicle Imports

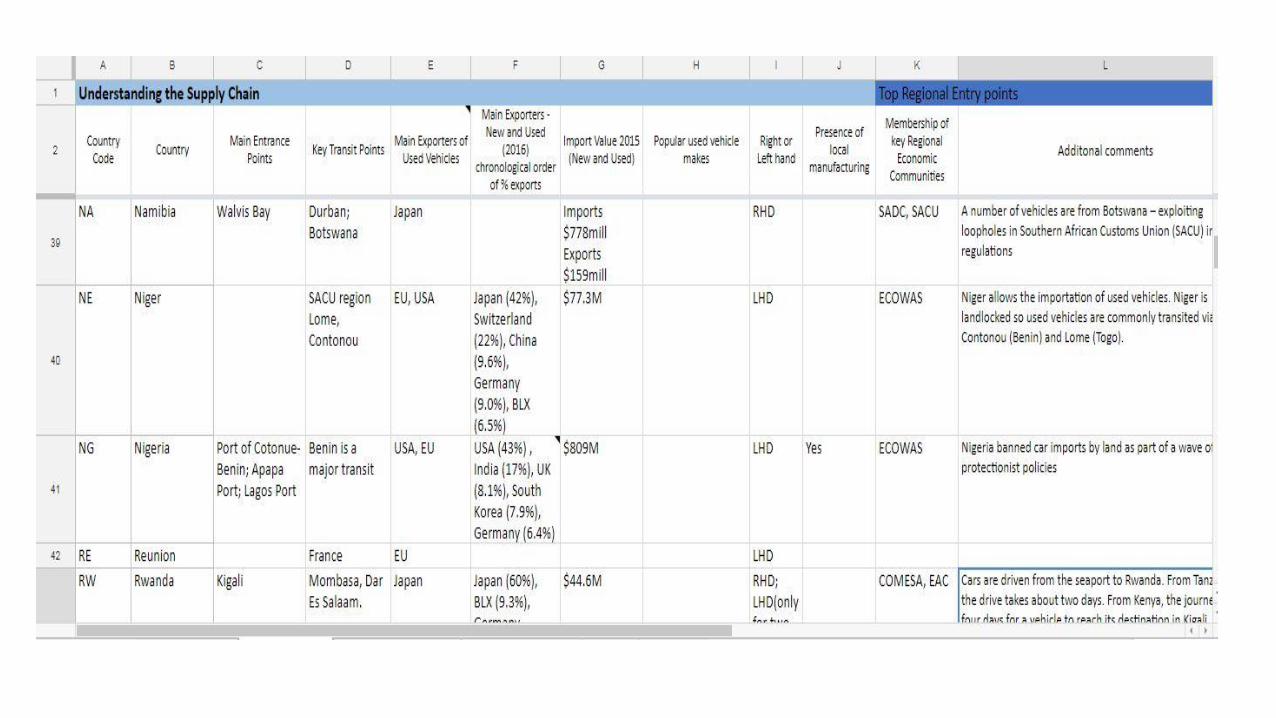
Understanding the Supply Chain & Scale of Used Vehicle Flows


Top 10 sub- Saharan African importers of used passenger vehicles from the US, Japan and EU in 2013
In 2013, around 800,000 used cars were headed to the top ten sub-Saharan African
importers from Japan, EU and US
Eurostat Comext Database, Japanese Customs and Tariff Bureau, and U.S. International Trade Commission

Regional share of total passenger vehicle imports (new and used) from the US, Japan and EU in 2013
• Each region has developed their own networks of supply and demand.
• West Africa dominates the used vehicle market, with the Nigerian market (400,124 total imports)
accounting for over double the vehicle imports to the entirety of East Africa (172,772).
• Central African imports equate roughly to Kenya’s (62, 751); with over half the imports stemming
from Cameroon (30,662).

West Africa – Regional Supply Chain

• The majority of EU and U.S used vehicle exports, over 85% and 95% respectively in 2013, were destined for West Africa.
• Germany is responsible for over half of EU export, accounting for 53% in 2016 (Eurostat, 2016).
Used passenger vehicles from the US

• Japanese used car exports dominate the South and East African Markets.
• Six nations account for 81.1% of Japanese used vehicle trade. Kenya is the major market followed by South Africa, Tanzania, Uganda, Zambia and Mozambique.
• Used vehicles imported into South Africa are for re-export, as there is a ban on used vehicles
Used Passenger vehicles from Japan

Key messages
• Not restricting but shifting to cleaner and safer used vehicle imports• Ensure used vehicles contribute to better road safety, reduced emissions, and provide cost savings;
• Direct correlation between basic import restrictions and a less outdated and more clean and technologically advanced fleet -> Mauritius vs. Uganda
• Need for data availability and collection
• Need for harmonization at regional and sub-regional level;
• Need for a systems approach;
• Need to address the illegal practices in the export of used vehicles;
• Raise awareness, show policy options and promote harmonized interventions;

WE NEED YOUR HELP!