africa’s growing debt crisis: who is the debt owed to?€¦ · africa’s growing debt crisis:...
TRANSCRIPT

1
Africa’s growing debt crisis: Who is
the debt owed to?
October 2018
Summary
• African government external debt payments have doubled in two years, from an average of
5.9% of government revenue in 2015 to 11.8% in 2017
• 20% of African government external debt is owed to China
• 17% of African government external interest payments are made to China
• In contrast, 32% of African government external debt is owed to private lenders, and 35% to
multilateral institutions such as the World Bank
• 55% of external interest payments are to private creditors
1. Africa debt payments
African government external debt payments have increased dramatically in the last few years. Between
2015 and 2017 they doubled, rising from a (mean, unweighted) average of 5.9% of government revenue
in 2015, to 11.8% of government revenue in 2017. This means African government debt payments are at
the highest level since 2001 (see graph below). Key causes of this dramatic change are increases in
lending since 2008 from multiple lenders (see Graph 5 below), followed by falls in commodity prices in
mid-2014, and rising US dollar interest rates and the value of the US dollar in recent years.
Graph 1. Mean average African government external debt payments as a percentage of revenue, from
1998 to 20171
1 Where they are available, for 2016 and 2017, the figures for government external debt payments as a proportion of revenue
come from IMF and World Bank Debt Sustainability Assessments conducted for individual countries. In total these cover 34
countries. http://www.imf.org/external/pubs/ft/dsa/lic.aspx?t=0&pg=0
For the other 15 countries, and data for all countries before 2016, figures for government external debt payments are from the
World Bank’s International Debt Statistics 2018 and figures for government revenue are calculated from the IMF’s World
Economic Outlook Database, October 2017: https://data.worldbank.org/products/ids and
0.0
2.0
4.0
6.0
8.0
10.0
12.0
14.0
16.0
18.0
19
98
19
99
20
00
20
01
20
02
20
03
20
04
20
05
20
06
20
07
20
08
20
09
20
10
20
11
20
12
20
13
20
14
20
15
20
16
20
17
Per
cen
tage
of
gove
rnm
ent
reve
nu
e

2
Recently there has been much coverage of Chinese government loans to African governments. In this
briefing, we analyse how much debt is actually owed by African governments to China.
2. Loans to African governments
The focus of this briefing is loans to governments from outside the country concerned. We do not
include domestic loans, for example from local banks to a government. This means that the figures on
Chinese loans and debt are compared solely with other external actors.
2.1 China-Africa Research Initiative on loans from China
The most comprehensive data on loans to African governments from China comes from the China-Africa
Research Initiative at John Hopkins University (CARI). CARI says there have been $143 billion of loans
from Chinese state institutions, and Chinese private banks, to African governments between 2000 and
2017. 2 Of the data CARI provides, at least 80% of these loans are from organisations owned by the
Chinese state, but up to 20% could be from private companies. These loans increased up to 2013, then
fell back, before a spike in 2016.
The Forum on China-Africa Cooperation in September 2018 announced a target of $60 billion of aid
investment and loans to Africa, the same amount as at the 2015 summit.3 Future lending is therefore
likely to continue at a similar rate as 2015-2017.
Graph 2. Loans from Chinese public and private sector to African governments, 2000 – 2017, $ billion4
[NB. 2017 might be low due to partial data. This data gap applies to both the CARI data, and the World
Bank data which follows on debt disbursements in 2017].
http://www.imf.org/external/pubs/ft/weo/2017/02/weodata/index.aspx
2 China Africa Research Initiative http://www.sais-cari.org/data-chinese-loans-and-aid-to-africa Accessed on 10 September 2018. 3 https://edition.cnn.com/2018/09/03/asia/focac-china-africa-development-intl/index.html 4 China Africa Research Initiative http://www.sais-cari.org/data-chinese-loans-and-aid-to-africa Accessed on 10 September 2018.
0
5
10
15
20
25
30
35
$ b
illio
n

3
CARI say that they only count signed loan agreements as loans, not framework agreements. However,
just because a loan agreement exists, does not mean all that loan has been disbursed that year. CARI do
claim that once a loan agreement exists, interest is payable on that loan.5
The CARI data is for 54 African countries. However, the World Bank, a key source of data on wider
creditor groupings, only has data for 48 countries.6 Therefore, our analysis in this briefing focusses on
those 48 countries covered by both CARI and the World Bank (for the full list of these countries see
Annex 2.)
The CARI data for the 48 countries is that $138 billion was lent between 2000 and 2017, $132 billion of
which was between 2006 and 2017:
Graph 3. Loans from Chinese public and private sector to 48 African governments on which the World
Bank has data, 2006 to 2017, $ billion7
2.2 Information from the World Bank on loans from governments
The World Bank does not give data on disbursements by, or debt owed, to China, but it does provide it
on those from a broader group of creditors. The World Bank reports on lending by other governments
(known as ‘bilateral’ loans), loans by multilateral institutions (and within this loans by the IMF and World
Bank) and loans by the private sector from outside the country concerned.8
For the 48 African countries on which it has data, the World Bank says $157 billion was lent by other
governments to African governments from 2006 to 2017. This is only $25 billion (19%) more than lent by
‘China’ in total. However, the Chinese figures above could be up to 20% loans from private banks, which
would be included elsewhere in the World Bank figures. And signed loans may not all be disbursed at
the time they are agreed, whereas the World Bank figure are based on actual disbursements. A final
5 https://static1.squarespace.com/static/5652847de4b033f56d2bdc29/t/58ac6353f7e0ab024bcc665c/1487692628411/guidebook+draft+v.26.pdf 6 The six countries the World Bank does not have sufficient data on are Equatorial Guinea, Libya, Namibia, Seychelles, Swaziland and South Sudan. 7 China Africa Research Initiative http://www.sais-cari.org/data-chinese-loans-and-aid-to-africa Accessed on 10 September 2018. 8 World Bank, World Development Indicators database.
0
5
10
15
20
25
30
35
2006 2007 2008 2009 2010 2011 2012 2013 2014 2015 2016 2017
$ b
illio
n

4
possibility is that not all Chinese government lending to African governments is included in the World
Bank figures, because it has not been reported to the World Bank by either borrower or lender.
At most, Chinese government lending accounts for 80% of loans to African governments from other
governments between 2006-2017 (and for 2016 reaches 97%). For the reasons stated above it is likely to
be significantly less.
Graph 4. Loans from other governments to African governments from 2006 to 2017, $ billion9
[NB. 2017 might be lower due to partial data.]
2.3 Disbursements from other lenders
In total, according to the World Bank, loans to African governments from external lenders amount to
$460 billion between 2006 and 2017.10 This would mean that if China has lent $132 billion over this
period, it would account for 29% of total lending. However, this percentage may be overstating Chinese
lending for two reasons. Firstly, the CARI data definition of loan contracts being signed may include
loans which have not been disbursed, whereas the World Bank data includes only disbursements.
Secondly, the World Bank data may not include all the Chinese loans recorded by CARI, which means
total loans from all lenders have been more than $460 billion, so the $132 billion of loans by China
according to CARI would be a lower percentage.
Below are the disbursements plotted over time, with the proviso that the figures for China are a
maximum, and either they are likely to be less, and/or, loans from governments other than China are
likely to be more.
9 World Bank, World Development Indicators database. 10 World Bank, World Development Indicators database.
0
5
10
15
20
25
30
35
2006 2007 2008 2009 2010 2011 2012 2013 2014 2015 2016 2017
$ b
illio
n
5
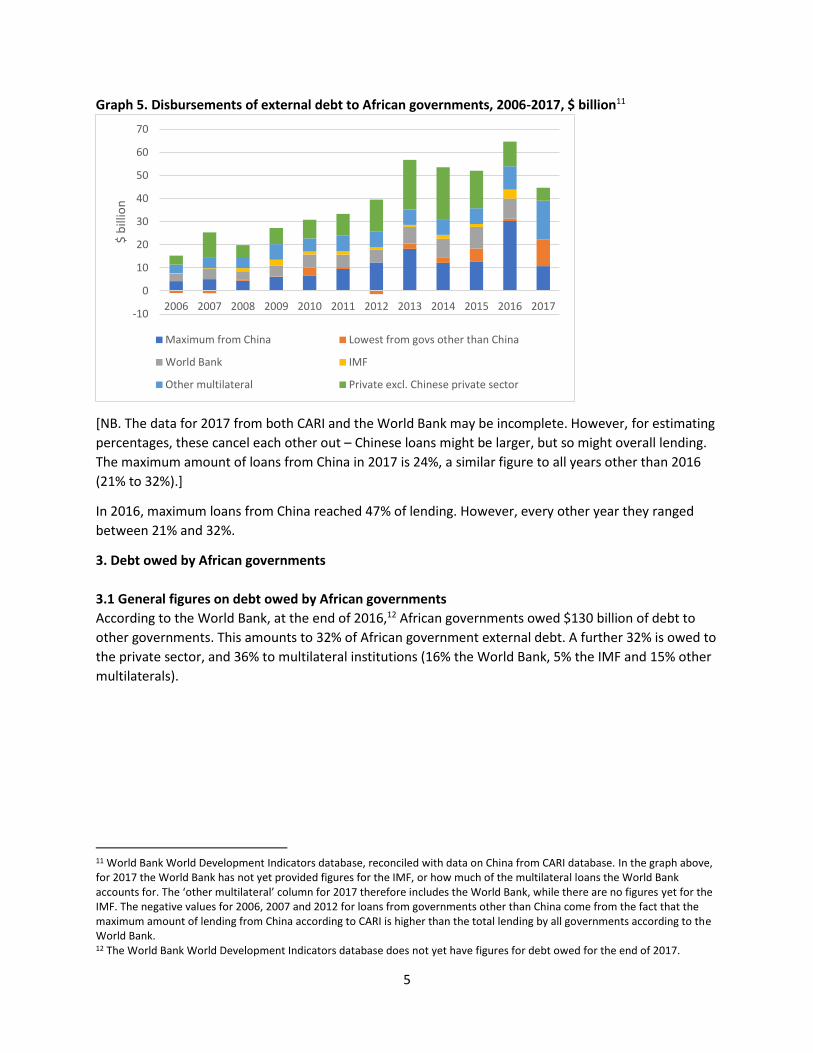
Graph 5. Disbursements of external debt to African governments, 2006-2017, $ billion11
[NB. The data for 2017 from both CARI and the World Bank may be incomplete. However, for estimating
percentages, these cancel each other out – Chinese loans might be larger, but so might overall lending.
The maximum amount of loans from China in 2017 is 24%, a similar figure to all years other than 2016
(21% to 32%).]
In 2016, maximum loans from China reached 47% of lending. However, every other year they ranged
between 21% and 32%.
3. Debt owed by African governments
3.1 General figures on debt owed by African governments
According to the World Bank, at the end of 2016,12 African governments owed $130 billion of debt to
other governments. This amounts to 32% of African government external debt. A further 32% is owed to
the private sector, and 36% to multilateral institutions (16% the World Bank, 5% the IMF and 15% other
multilaterals).
11 World Bank World Development Indicators database, reconciled with data on China from CARI database. In the graph above, for 2017 the World Bank has not yet provided figures for the IMF, or how much of the multilateral loans the World Bank accounts for. The ‘other multilateral’ column for 2017 therefore includes the World Bank, while there are no figures yet for the IMF. The negative values for 2006, 2007 and 2012 for loans from governments other than China come from the fact that the maximum amount of lending from China according to CARI is higher than the total lending by all governments according to the World Bank. 12 The World Bank World Development Indicators database does not yet have figures for debt owed for the end of 2017.
-10
0
10
20
30
40
50
60
70
2006 2007 2008 2009 2010 2011 2012 2013 2014 2015 2016 2017
$ b
illio
n
Maximum from China Lowest from govs other than China
World Bank IMF
Other multilateral Private excl. Chinese private sector

6
Graph 6. External debt owed by African governments, by creditor
Above we estimated that the maximum amount of
external debt disbursements China accounts for by
governments in the last 10 years is 80%. Of the
bilateral debt, if 80% was owed to China, then this
would mean just over 25% of total external debt
would be owed to China - $104 billion in total. This
would also mean that of the maximum of $132
billion CARI says has been lent by China to African
governments in the last ten years, just 20% has
been repaid so far.
On average, based on the World Bank database,
7.5% of bilateral debt owed is repaid every year.13
If this rate were true for China, then of the $132
billion of loans from 2006-2017, $32 billion will
have been repaid so far, and $100 billion still
owed, a similar figure to the $104 billion above.
In reality, as well as the reasons given above under the disbursements section, other reasons debt owed
by China is likely to be less than 80% of bilateral debt are that:
• Some outstanding debt will date from well before 2006, when China’s lending began to become
significant. A few countries, such as Zimbabwe, Sudan and Somalia, owe significant amounts on
historic bilateral loans from Western and Middle-Eastern governments, which have not been repaid
or cancelled.
• Some other historic debt from Western governments was not cancelled through the HIPC initiative
of the 2000s, and is only gradually being repaid, so is still outstanding
Separately, the Paris Club group of western governments report that the 48 African countries we are
looking at in this briefing collectively owe $40.1 billion to Paris Club governments.14
3.2 Calculation for maximum debt owed to the Chinese government
Here we estimate, based on the CARI data, the maximum percentage of African government external
debt which could be owed to China. To do so we make the following assumptions:
• All the loans recorded by CARI are ultimately from the state, none from the Chinese private sector
• All the loans recorded by CARI were disbursed in the year contracts were signed
• Loans to China have been repaid at the average amortization rate of bilateral debt of 7.5% a year
• There is no bilateral debt owed to any government other than China or the Paris Club governments
With these assumptions, $100 billion is owed by African governments to the Chinese government, based
on the amount and year of loans recorded by CARI, and the amortization rate of 7.5%. $40 billion is
13 Calculated by the Jubilee Debt Campaign from World Bank, World Development Indicators database, for 2006-2016. 14 Calculated by Jubilee Debt Campaign from http://www.clubdeparis.org/en/communications/page/as-of-31-december-2017-21-06-2018 The Paris Club are the group of primarily western government creditors.
32%
16%5%
15%
32%
Bilateral World Bank
IMF Other multilateral
Private

7
owed by African governments to Paris Club governments.15 Total debt owed by African governments to
other governments is $140 billion. Therefore, under this estimate China accounts for 24% of total
external debt owed by African governments, and 71% of external debt owed by African governments to
other governments.
This $140 billion is $10 billion more than the amount of bilateral debt stated by the World Bank. This
would be accounted for by the World Bank not including all debt to China in its figures. The external
debt owed by African governments to different creditor groups under these assumptions are:
Table 1. Maximum amount of African government external debt owed to China16
Creditor grouping Total debt owed Percentage of external debt owed
China $100 billion 24%
Paris Club $40 billion 10%
World Bank $66 billion 16%
IMF $18 billion 4%
Other multilateral institutions $61 billion 15%
Private sector (excl. Chinese private sector)
$132 billion 32%
Total $417 billion [Figures add up to 101% because of rounding]
This is a maximum amount of debt owed to China, but we know that it is very likely to be an
overstatement, because, even if all the loans recorded by CARI were disbursed in the year they were
given:
• There is bilateral debt owed to other non-Paris Club governments, particularly Middle-Eastern
governments, not included in Table 1 above.
• Some Chinese loans recorded by CARI are from the private sector rather than the state
3.3 Calculation for lower debt owed to the Chinese government
Here we estimate, based on the CARI data, a minimum percentage of African government external debt
which could be owed to China. To do so we make the following assumptions:
• 80% of the Chinese loans recorded by CARI are from the state, 20% from the private sector
• 90% of loans identified by CARI have been disbursed, 10% have not been
• Loans to China have been repaid at the average amortization rate of bilateral debt of 7.5% a year
• All African government debt to other governments is recorded in the World Bank’s figures
With these assumptions, of the $132 billion which is said by CARI to have been lent by China, only $120
billion (90%) has been disbursed. Of this, $95 billion (80%) is from the Chinese state, $25 billion (20%)
15 Calculated by Jubilee Debt Campaign from http://www.clubdeparis.org/en/communications/page/as-of-31-december-2017-21-06-2018 The Paris Club are the group of primarily western government creditors. 16 All figures are from the World Bank World Development Indicators database, except for the estimate for China, which is based on CARI data as explained in the text, and the Paris Club, which comes from the Paris Club as referenced above.

8
from the Chinese private sector. Of the $95 billion lent from 2006-2017, using the same amortization
rate as above, $23 billion will have been repaid so far, with $72 billion outstanding. Therefore, under
this estimate China accounts for 18% of total external debt owed by African governments, and 56% of
external debt owed by African governments to other governments.
In total there is $130 billion of African government debt owed to other governments according to the
World Bank. Under this calculation, $72 billion is owed to China, with $40 billion owed to the Paris Club.
This leaves $18 billion owed to other governments, such as in the Middle-East.
The debts owed to other creditors remain the same as in the calculation above:
Table 2. Minimum amount of African government external debt owed to China17
Creditor grouping Total debt owed Percentage of external debt owed
China $72 billion 18%
Paris Club $40 billion 10%
Other governments $18 billion 4%
World Bank $66 billion 16%
IMF $18 billion 4%
Other multilateral institutions $61 billion 15%
Private sector $132 billion 32%
Total $407 billion [Figures add up to 99% because of rounding]
3.4 Checking these figures through country cases
Another way of identifying how much African government debt is owed to China is to look bottom-up at
the individual data available by each government. The main source of information for this bottom-up
analysis (presented in full in Appendix 1) is the IMF and World Bank Debt Sustainability Analysis for that
country, but we also use data reported by governments, particularly from central banks and in bond
issuance prospectuses.
This bottom-up analysis cannot produce comprehensive figures, as for many governments there is not
have enough information on who their debt is owed to, and the amount of research time is restricted to
do this for all 48 governments. What we have been able to do is look at the information on debt owed
for those African governments in greatest debt difficulty. In particular we look at those countries ranked
by the IMF and World Bank as in debt distress, or at high risk of being so, in order to get a sense of the
contributions of lenders in situations of the most unsustainable debts. In total the IMF and World Bank
assess 16 countries in Africa as in debt distress or at high risk of debt distress.
Of these 16 countries, 15 have figures on how much debt is owed to China (for the full analysis see
Appendix 1.). Of these 15:
17 All figures are from the World Bank World Development Indicators database, except for the estimate for China, which is based on CARI data as explained in the text, and the Paris Club, which comes from the Paris Club as referenced above. The other governments amount is the remainder of the bilateral debt listed by the World Bank database, once taking away the amounts for China and the Paris Club.
9
• 12 owe less than 18% of their debt to China (Burundi, Cabo Verde, Central African Republic, Chad,
Gambia, Ghana, Mauritania, Mozambique, Sao Tome and Principe, South Sudan, Sudan and
Zimbabwe).
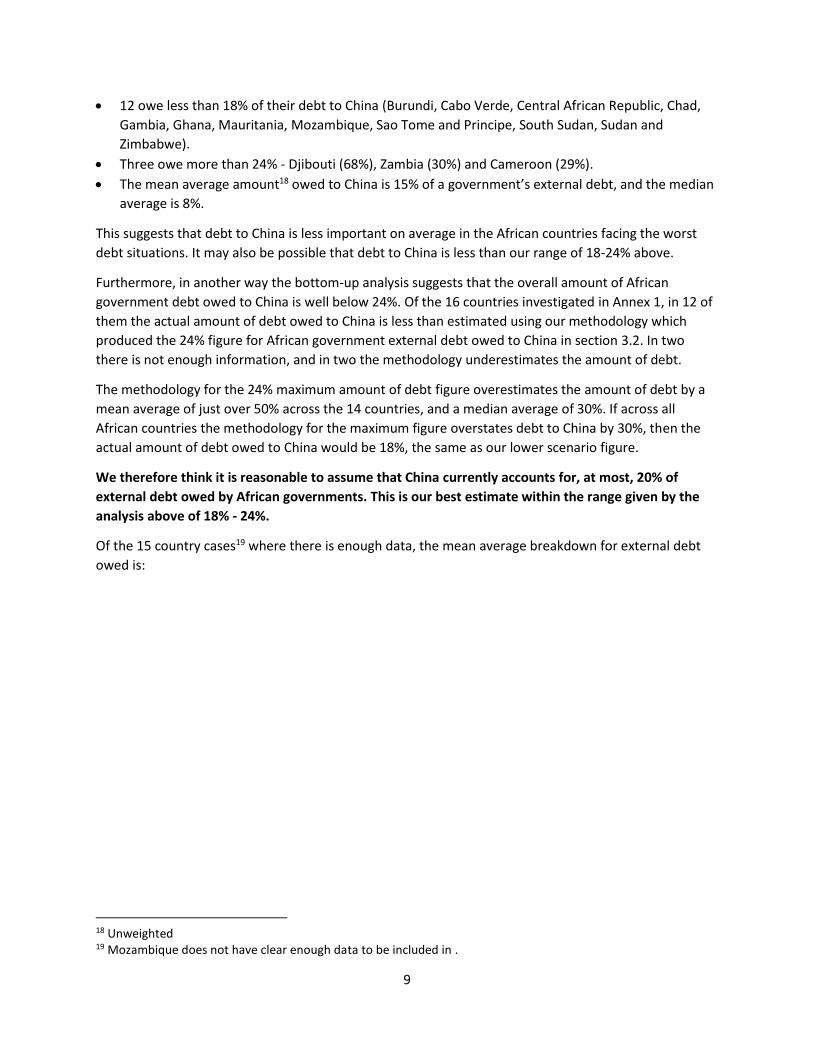
• Three owe more than 24% - Djibouti (68%), Zambia (30%) and Cameroon (29%).
• The mean average amount18 owed to China is 15% of a government’s external debt, and the median
average is 8%.
This suggests that debt to China is less important on average in the African countries facing the worst
debt situations. It may also be possible that debt to China is less than our range of 18-24% above.
Furthermore, in another way the bottom-up analysis suggests that the overall amount of African
government debt owed to China is well below 24%. Of the 16 countries investigated in Annex 1, in 12 of
them the actual amount of debt owed to China is less than estimated using our methodology which
produced the 24% figure for African government external debt owed to China in section 3.2. In two
there is not enough information, and in two the methodology underestimates the amount of debt.
The methodology for the 24% maximum amount of debt figure overestimates the amount of debt by a
mean average of just over 50% across the 14 countries, and a median average of 30%. If across all
African countries the methodology for the maximum figure overstates debt to China by 30%, then the
actual amount of debt owed to China would be 18%, the same as our lower scenario figure.
We therefore think it is reasonable to assume that China currently accounts for, at most, 20% of
external debt owed by African governments. This is our best estimate within the range given by the
analysis above of 18% - 24%.
Of the 15 country cases19 where there is enough data, the mean average breakdown for external debt
owed is:
18 Unweighted 19 Mozambique does not have clear enough data to be included in .

10
Graph 7. Who external debt is owed to for the 15 governments in debt distress or at high risk, mean,
unweighted, average
These average figures show there are
lots of creditor involved, but the
situations are very different across
countries. For example, in 7 of the
countries external debt owed to the
private sector is over 20% (ranging from
21% to 54% of external debt owed). In 7
it is less than 10%.
4.Debt payments
According to the World Bank, African
governments made $12.8 billion of debt
payments to other governments in 2016,
in principal and interest, which is 38% of
total external debt payments. $13.2
billion was paid to private creditors
(40%), and $7.3 billion to multilateral
institutions (22%), making total external
debt payments of $33.3 billion.
Multilateral payments are lower than
their relative share of the debt, because
interest payments on multilateral debt tends to be lower, and multilateral debt has longer maturities.
Bilateral loans tend to have lower interest rates than private loans. However, the fact that bilateral loan
payments are only slightly less than private suggests that bilateral loans have shorter maturities than
debt owed to private creditors.
If China accounts for 71% of bilateral loan payments (as in the maximum debt owed to China scenario),
this would mean it accounted for $9.1 billion of African government external debt payments in 2016,
amounting to 27% of total external debt payments.
If China accounts for 56% of bilateral debt (as in the minimum debt owed to China scenario), this would
mean it accounted for $7.2 billion of African government external debt payments in 2016, amounting to
21% of total external debt payments.
If China accounts for 62% of bilateral debt (the amount consistent with 20% of external debt being owed
to China), this would mean it accounted for $7.9 billion of African government external debt payments
in 2016, amounting to 24% of total external debt payments.
5. Debt interest
The higher cost of private sector loans is seen through debt interest payments. According to the World
Bank, in 2016 total external debt interest paid to other governments by African governments was $3.1
billion, compared to $6 billion to private external creditors. $1.8 billion was paid to multilateral
15%
11%
19%
13%
5%
16%
21%
China Paris Club
Other governments World Bank
IMF Other multilateral institutions
Private sector

11
institutions, so total external interest paid was $10.9 billion. This means private creditors account for
55% of external interest payments, bilateral 28% and multilateral 17%.
Again, if China accounts for a maximum of 71% of bilateral interest payments, this would be $2.2 billion
and 20% of total external interest payments.
If China accounts for a minimum of 55% of bilateral interest payments, this would be $1.7 billion and
16% of total external interest payments.
If China accounts for 62% of bilateral interest payments, an amount consistent with being owed 20% of
external debt, this would be $1.9 billion and 17% of external interest payments.

12
Appendix 1. Country cases
Burundi: High risk of debt distress
The Central Bank of Burundi says that as of end-2017, 13% of the government’s external debt is owed
bilaterally, but none of it to China (the bilateral creditors are Saudi Arabia, Kuwait and Abu Dhabi).20
However, according to the World Bank, 20% of the government’s external debt is owed to other
governments.21 This leaves 7% to be explained.
According to CARI, Burundi has been lent $99 million by China since 2008, the last loan of which was $63
million in 2014. It is possible all the Chinese debt has been paid-off and/or not disbursed. However,
under the methodology for the maximum scenario, we would expect $69 million to still be owed to
China by Burundi, if it had all been disbursed.
There is no recent Debt Sustainability Analysis (DSA) from the IMF and World Bank. The World Bank
database says that at the end of 2016 Burundi’s total external debt was $474 million. If 7% of this was
owed to China, that would be $33 million.
There is not enough information on Burundi’s debt, but our bottom-up analysis suggests Burundi’s debt
to China is a maximum of $33 million, which means the top down maximum figure of $69 million
overstates the size of the debt by 110%.
The general breakdown of Burundi’s external government debt based on the World Bank and Burundi
government figures are:
Table 3. Creditors for Burundi’s external government debt
Creditor grouping Total debt owed Percentage of external debt owed
Saudi Arabia, Kuwait and Abu Dhabi
$62 million 13%
Other governments $33 million 7%
World Bank $143 million 30%
IMF $65 million 14%
Other multilateral institutions $167 million 35%
Private sector $4 million 1%
Total $474 million
Cabo Verde: High risk of debt distress
According to the IMF and World Bank DSA,22 Cabo Verde owed China $23 million at end-2017, which is
1% of government external debt. According to CARI, Cabo Verde has been lent $149 million by China
since 2006. Under the methodology for the maximum scenario, we would expect $95 million to still be
owed to China by Cabo Verde, if it had all been disbursed. Therefore, this methodology overstates Cabo
20 https://www.brb.bi/en/content/public-finances 21 World Bank, World Development Indicators database. 22 https://www.imf.org/external/pubs/ft/dsa/pdf/2018/dsacr18104.pdf

13
Verde’s debt to China by over 300%. The most likely explanation is that a significant amount of the loans
recorded by CARI have not been disbursed.
The general breakdown of Cabo Verde’s external government debt based on the IMF and World Bank
Debt Sustainability Assessment figures, as well as information from the Paris Club, are:
Table 4. Creditors for Cabo Verde’s external government debt
Creditor grouping Total debt owed Percentage of external debt owed
China $23 million 1%
Portugal $168 million 10%
Other Paris Club $43 million 3%
Other governments $155 million 12%
World Bank $346 million 21%
IMF $0 0%
Other multilateral institutions $408 million 24%
Private sector $532 million 32%
Total $1,675 million
Cameroon: High risk of debt distress
The IMF and World Bank DSA for 2018 says that as of end-2017, bilateral debt to non-Paris Club
creditors amounted to 31% of Cameroon’s external public debt.23 The 2017 DSA says that 95% of non-
Paris Club bilateral debt is owed to China,24 so this makes China holder of 29% of Cameroon’s external
public debt. Cameroon’s total external public debt is $8.73 billion, so that makes the debt to China $2.53
billion.
CARI says that $5.6 billion has been lent by China to Cameroon between 2004 and 2017. Our
methodology for working out the maximum amount which could still be owed estimates that debt to
China should now be $4.3 billion. This therefore overestimates debt to China by 70%. One explanation
for this is given in the IMF and World Bank DSA, which says that Cameroon has almost as much
undisbursed external debt as it does debt which has been disbursed. This is loan contracts which have
been signed, but the money not lent yet. China accounts for 28% of the undisbursed debt, while
multilateral creditors account for 40%.25
The overall breakdown of Cameroon’s debt based on the IMF and World Bank DSAs, as well as
information directly from the IMF and World Bank on debt owed to them, is:
23 https://www.imf.org/external/pubs/ft/dsa/pdf/2018/dsacr18235.pdf 24 https://www.imf.org/external/pubs/ft/dsa/pdf/2017/dsacr17185.pdf 25 https://www.imf.org/external/pubs/ft/dsa/pdf/2018/dsacr18235.pdf
14
Table 5. Creditors for Cameroon’s external government debt
Creditor grouping Total debt owed Percentage of external debt owed
China $2.53 billion 29%
Paris Club governments $1.22 billion 14%
Other governments $0.17 billion 2%
World Bank $1.44 billion 16%
IMF $0.40 billion 5%
Other multilateral $0.69 billion 8%
Private sector $2.27 billion 26%
Total $8.73 billion
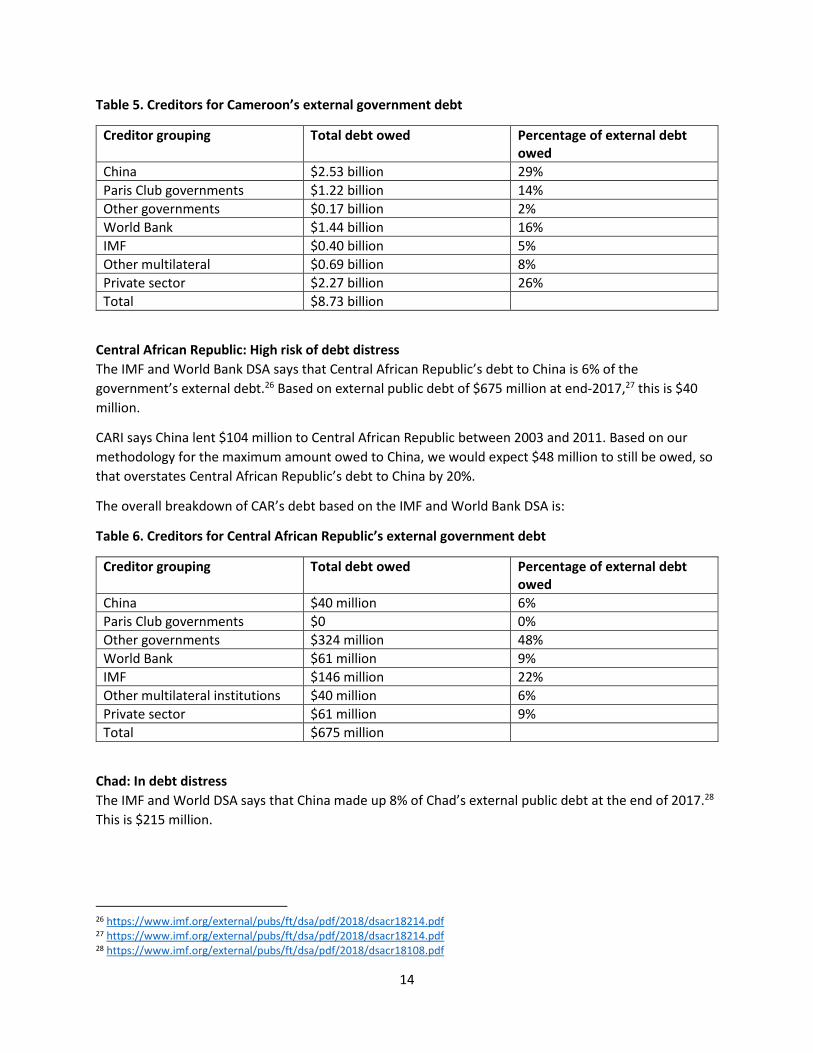
Central African Republic: High risk of debt distress
The IMF and World Bank DSA says that Central African Republic’s debt to China is 6% of the
government’s external debt.26 Based on external public debt of $675 million at end-2017,27 this is $40
million.
CARI says China lent $104 million to Central African Republic between 2003 and 2011. Based on our
methodology for the maximum amount owed to China, we would expect $48 million to still be owed, so
that overstates Central African Republic’s debt to China by 20%.
The overall breakdown of CAR’s debt based on the IMF and World Bank DSA is:
Table 6. Creditors for Central African Republic’s external government debt
Creditor grouping Total debt owed Percentage of external debt owed
China $40 million 6%
Paris Club governments $0 0%
Other governments $324 million 48%
World Bank $61 million 9%
IMF $146 million 22%
Other multilateral institutions $40 million 6%
Private sector $61 million 9%
Total $675 million
Chad: In debt distress
The IMF and World DSA says that China made up 8% of Chad’s external public debt at the end of 2017.28
This is $215 million.
26 https://www.imf.org/external/pubs/ft/dsa/pdf/2018/dsacr18214.pdf 27 https://www.imf.org/external/pubs/ft/dsa/pdf/2018/dsacr18214.pdf 28 https://www.imf.org/external/pubs/ft/dsa/pdf/2018/dsacr18108.pdf

15
CARI says China lent $641 million to Chad between 2007 and 2017. Based on our methodology for the
maximum amount owed to China, we would expect $333 million to still be owed, so that overstates
Chad’s debt to China by 55%.
The most significant debt for Chad is high interest loans owed to western oil companies. The IMF and
World Bank DSA says that debts to the private sector accounted for 49% of Chad’s external public debt
at the end of 2017.
Table 7. Creditors for Chad’s external government debt
Creditor grouping Total debt owed Percentage of external debt owed
China $215 million 8%
Paris Club governments $54 million 2%
Other governments $457 million 17%
World Bank $161 million 6%
IMF $161 million 6%
Other multilateral institutions $323 million 12%
Private sector $1,318 million 49%
Total $2.69 billion
Djibouti: High risk of debt distress
The IMF and World Bank DSA says that Djibouti has signed loan agreements worth $1.2 billion with
China, of which $1.1 billion has been disbursed. However, it does not specify how much is owed to
China. In the IMF and World Bank DSA’s breakdown of Djibouti’s debt, they just list $1.096 billion of
publicly guaranteed external debt, separately from a breakdown of debt owed to other creditors.29 If we
assume that this is all debt to China, this means 68% of Djibouti’s external debt is owed to China.
CARI says China lent $1.47 billion to Djibouti between 2001 and 2016. Based on our methodology for the
maximum amount owed to China, we would expect $1.14 billion to still be owed, so that overstates
Chad’s debt to China by 4%.
Table 8. Creditors for Djibouti’s external government debt
Creditor grouping Total debt owed Percentage of external debt owed
China $1.096 billion 68%
Paris Club governments $0.047 billion 3%
Other governments $0.139 billion 9%
World Bank $0.131 billion 8%
IMF $0.026 billion 2%
Other multilateral institutions $0.165 billion 10%
Private sector $0 0%
Total $1.604 billion
29 https://www.imf.org/external/pubs/ft/dsa/pdf/2017/dsacr1787.pdf

16
Ethiopia: High risk of debt distress
The IMF and World Bank DSA says that at end-June 2017, Ethiopia owed $8.6 billion to external bilateral
non-Paris Club creditors, 35% of total external debt.30 However, neither the IMF or Ethiopian
government say how much of this is owed to China. The Ethiopian bond prospectus in 2014 said bilateral
debt was owed to China, India and Middle-East governments, but did not specify in what proportions.31
CARI say that China has made loan commitments of $13.7 billion between 2006 and 2017. Under the
methodology for the maximum scenario, we would expect $9.7 billion to still be owed to China by
Ethiopia, if it had all been disbursed. However, the absolute maximum owed to China is $8.6 billion (and
some debts to India and Middle East countries mean it must be less than this). Therefore, the maximum
scenario methodology overstates Ethiopia’s debt to China by at least 13%.
The general breakdown of Ethiopia’s external government debt based on the IMF and World Bank
figures are:
Table 9. Creditors for Ethiopia’s external government debt
Creditor grouping Total debt owed Percentage of external debt owed
China, India and Middle East governments
$8.6 billion 35%
Paris Club governments $0.4 billion 2%
World Bank $6.6 billion 27%
IMF $0.2 billion 1%
Other multilateral institutions $1.8 billion 10%
Private sector $6.4 billion 26%
Total $24 billion [Figures add up to 101% because of rounding]
Gambia: In debt distress
CARI says that China has not made any loans to Gambia. The IMF and World Bank DSA deso not include
any debt to China in Gambia’s list of creditors, which does include Kuwait, Saudi Arabia, and India.32
The breakdown of external creditors based on the DSA is:
30 https://www.imf.org/external/pubs/ft/dsa/pdf/2018/dsacr1818.pdf 31 http://www.ise.ie/Media/News-and-Events/2014/The-Federal-Democratic-Republic-of-Ethiopia-debt-prospectus-document-for-www-ise-ie.pdf 32 http://www.imf.org/en/Publications/CR/Issues/2018/06/28/The-Gambia-Second-Review-Under-the-Staff-Monitored-Program-Press-Release-and-Staff-Report-46035

17
Table 10. Creditors for Gambia’s external government debt
Creditor grouping Total debt owed Percentage of external debt owed
China $0 0%
Kuwait, Saudi Arabia and India $101 million 15%
Paris Club $6 million 1%
Other non-Paris Club $57 million 7%
World Bank $105 million 16%
IMF $52 million 8%
Other multilateral institutions $322 million 47%
Private sector $44 million 6%
Total $686 million
Ghana: High risk of debt distress
CARI says that $3.5 billion has been lent by China to Ghana between 2000 and 2017. Our methodology
for the maximum scenario says that of this, $2.2 billion should now be owed.
The government of Ghana says, in a 2018 disclosure to financial markets,33 that Ghana owes $2.060
billion to China, the Export-Import Bank of China and the China Development Bank. This means that for
Ghana, the methodology to estimate the maximum amount of debt owed to China overstates Ghana’s
debt to China by 7%.
The government of Ghana says that at the end of 2017, Ghana’s total external debt was $17.1 billion.34
The IMF and World Bank say that at end 2017 Ghana’s total external debt was $22 billion.35 This
therefore puts Ghana’s debt to China at between 9% and 12%. One of the key reasons for this difference
is that the IMF and World Bank, rightly, class debt owed in domestic currency, but to the foreign private
sector, as external debt, unlike the government of Ghana.
The general breakdown of Ghana’s debt based on the Ghanaian government and IMF and World Bank
figures are:
33 https://www.rns-pdf.londonstockexchange.com/rns/1923O_-2018-5-15.pdf 34 https://www.rns-pdf.londonstockexchange.com/rns/1923O_-2018-5-15.pdf 35 https://www.imf.org/external/pubs/ft/dsa/pdf/2018/dsacr18113.pdf

18
Table 11. Creditors for Ghana’s external government debt
Creditor grouping Total debt owed Percentage of external debt owed
China $2.060 billion 9%
Paris Club $3.014 billion 14%
Other governments $0.681 billion 3%
World Bank $3.922 billion 18%
IMF $0.958 billion 4%
Other multilateral institutions $1.557 billion 7%
Private sector $4.968 billion 23%
Private sector debt included by IMF and World Bank
$4.8 billion 22%
Total $22 billion [Figures add up to 101% because of rounding]
Mauritania: High risk of debt distress
The IMF and World Bank DSA says that at the end of 2016, Mauritania owed China $339 million, 8% of
the government’s overall external debt of $4.408 billion.36
CARI says that China has lent $431 million between 2006 and 2017. Under the methodology for the
maximum scenario, we would expect $242 million to still be owed to China by Mauritania. Therefore,
the maximum scenario methodology understates Mauritania’s debt to China by 29%.
The general breakdown of Mauritania’s debt based on the IMF and World Bank’s detailed figures are:
Table 12. Creditors for Mauritania’s external government debt
Creditor grouping Total debt owed Percentage of external debt owed
China $0.339 billion 8%
Paris Club $0.116 billion 3%
Kuwait $1.147 billion 26%
Saudi Arabia $0.523 billion 12%
Other governments $0.170 bilion 4%
World Bank $0.365 billion 8%
IMF $0.166 billion 4%
Other multilateral institutions $1.582 billion 36%
Private sector $0 0
Total $4.408 billion [Figures add up to 101% because of rounding]
Mozambique: In debt distress
The Mozambique government does not reveal the amount of debt owed to China, either in its most
recent bond prospectus of March 2016, nor in the Bank of Mozambique’s statistics on holders of
external debt. The IMF and World Bank DSA says that external public debt owed to non-Paris Club
36 https://www.imf.org/external/pubs/ft/dsa/pdf/2017/dsacr17369.pdf

19
bilateral creditors is 25.5% of GDP, $3.24 billion.37 Of this, $94 million is arrears to other non-Paris Club
countries, which leaves $3.15 billion between China and all other non-Paris Club creditors. The IMF and
World Bank DSA says that significant amounts are owed to India as well as China.
There is therefore not enough information for a bottom-up estimate of Mozambique’s debt to China. It
is less than £3.24 billion, but we don’t know how much less. CARI says $2.3 billion has been lent by China
to Mozambique from 2001 to 2017. Our methodology predicts that the maximum amount still owed is
$1.6 billion. However, loans from London-based banks have been given in secret. It is possible that China
has done the same, which could mean there are loans not included in the CARI figures. Alternatively, the
$1.6 billion estimate could be reasonable, with another $1.6 billion owed to other non-Paris Club
creditors such as India.
Table 13. Creditors for Mozambique’s external government debt
Creditor grouping Total debt owed Percentage of external debt owed
Non-Paris Club, including India and China
$3.24 billion (estimate for China $1.6 billion)
32% (estimate for China 16%)
Paris Club $0.81 billion 8%
World Bank $2.87 billion 28%
IMF $0.20 billion 2%
Other multilateral institutions $3.76 billion 9%
Private sector $2.13 billion 21%
Total $10.15 billion
Sao Tome and Principe: In debt distress
The IMF and World Bank DSA says that, as of end-2017, China is owed $10 million by Sao Tome and
Principe, making up 5% of the government’s external debt. In contrast, Portugal is owed $60 million and
Angola $56 million.38
According to CARI China has not made any loans to Sao Tome. The debt listed by the IMF and World
Bank is private debt guaranteed by the government, so this might be why the CARI system has not
picked up on it. Therefore, the general methodology we use to estimate the maximum amount of debt
owed to China understates Sao Tome’s debt to China.
The general breakdown of Sao Tome and Principe’s debt based on the IMF and World Bank’s detailed
figures are:
37 https://www.imf.org/external/pubs/ft/dsa/pdf/2018/dsacr1865.pdf 38 https://www.imf.org/external/pubs/ft/dsa/pdf/2018/dsacr18251.pdf

20
Table 14. Creditors for Sao Tome and Principe’s external government debt
Creditor grouping Total debt owed Percentage of external debt owed
China $10 million 5%
Portugal $60 million 32%
Angola $56 million 29%
Other governments $6 million 3%
World Bank $12 million 6%
IMF $7 million 4%
Other multilateral institutions $26 million 14%
Private sector $13 million 7%
Total $190 million [Figures add up to 101% because of rounding]
South Sudan: In debt distress
In the general World Bank database there is no data for South Sudan, so it is not covered in the general
analysis above.
However, in the specific IMF and World Bank DSA, the Fund and Bank say that South Sudan owes China
$100 million, 10% of South Sudan’s government external debt.39 The largest debt by far is $610 million
owed to Qatar National Bank, with $219 million owed to international oil companies for oil advances.
Qatar National Bank is owned by both the state of Qatar and members of the public.40
CARI say that China lent South Sudan $182 million between 2013 and 2014. Applying our methodology
for estimating the maximum amount owed to China, we would estimate that $142 million of this would
still be owed. This means that methodology overestimates the amount of debt owed by South Sudan to
China by 42%.
The general breakdown of South Sudan’s debt based on the IMF and World Bank’s detailed figures are:
39 https://www.imf.org/external/pubs/ft/dsa/pdf/2017/dsacr1773.pdf 40 https://www.qnb.com/cs/Satellite/QNBQatar/en_QA/enAboutQNB

21
Table 15. Creditors for South Sudan’s external government debt
Creditor grouping Total debt owed Percentage of external debt owed
China $100 million 10%
Qatar National Bank $610 million 63% (divide this half between other governments, half private)
World Bank $34 million 4%
Private (oil companies) $219 million 23%
Total $963 million
Sudan: In debt distress
We have not been able to find direct information on Sudan’s debt to China. The IMF and World Bank
DSA says that $19.7 billion, out of a total external government debt of $50.7 billion, is owed to non-Paris
Club bilateral creditors.41 Of this, it is stated that Gulf states, including Saudi Arabia, Kuwait and Qatar
have made significant loans.
CARI says that $6.5 billion has been lent by China since 2001, with the last significant loan announced in
2014. However, there have also been various news reports since then that China has agreed to delay
repayments on its debt from Sudan. Our methodology would predict that $6.5 billion of loans would
have fallen to $3.2 billion of debt owed now (which would be 6% of Sudan public external debt).
Table 16. Creditors for Sudan’s external government debt
Creditor grouping Total debt owed Percentage of external debt owed
Non-Paris Club governments $19.7 billion (estimate $3.2 billion China)
39% (estimate 6% China)
Paris Club governments $18.4 billion 36%
World Bank $1.2 billion 2%
IMF $1.4 billion 3%
Other multilateral $3.1 billion 6%
Private $6.9 billion 14%
Total $50.7 billion
Zambia: High risk of debt distress
The IMF and World Bank DSA does not give figures for Zambia’s debt to China. The Bank of Zambia says
that $246 million is owed to the non-Paris Club in bilateral debt.42 However, it is likely that other debt to
China is including in a separate category in the Bank of Zambia’s report of ‘Export/Suppliers/Commercial
Debt’, which amounts to $6.8 billion.
41 https://www.imf.org/external/pubs/ft/dsa/pdf/2017/dsacr17364.pdf 42 http://www.boz.zm/BOZANNUALREPORT2017.pdf

22
In total the Bank of Zambia says total external government debt for end-2017 is $8.8 billion.43 The IMF
and World Bank DSA reports a similar, slightly lower, amount of $8.4 billion.44 The largest portion of
Zambia’s debt is $3 billion owed through three external bond issuances.
Zambian Information Minister Dora Siliya told the BBC World Service on 11 September 2018 that
Zambia’s debt to China is 30% of the overall debt, though did not specify if it is external or domestic. If
external, this would be $2.6 billion. This fits consistently with information on other creditors which is
available, which gives an overall breakdown of external debt at end-2017 of:
Table 17. Creditors for Zambia’s external government debt
Creditor grouping Total debt owed Percentage of external debt owed
China $2.64 billion 30%
Paris Club governments $0.13 billion 1%
World Bank $0.89 billion 10%
IMF $0.13 billion 1%
Other multilateral $0.60 billion 7%
Private: Bonds $3 billion 34%
Private: Other $1.4 billion 16%
Total $8.8 billion
CARI says that China has lent $6.4 billion to Zambia between 2002 and 2017. Our methodology for the
maximum amount of debt owed to China estimates that $4.9 billion of these loans would still be owed.
This is 86% more than the estimate above. The above is still an estimate rather than a definitive figure.
However, $4.9 billion would represent 56% of Zambia’s external debt, and 35% of Zambia’s total public
debt.
As well as being higher than stated by the Zambian government, $4.9 billion is also inconsistent with the
other external debts we know are owed by Zambia. The debts owed to the Paris Club, multilateral
institutution and private sector total at least $4.7 billion at end-2017, leaving $4.1 billion between China,
other non-Paris Club creditors, export credits and private lending other than the external bonds.
Zimbabwe: In debt distress
The IMF and World Bank DSA says that as of end-2016, Zimbabwe owes $1.142 billion in external non-
Paris Club bilateral debt, out of a total of $4.2 billion of bilateral debt and $7.3 billion of external public
debt.45 A presentation by the Reserve Bank of Zimbabwe in October 2015 says that debt to China was
$628 million, out of a total non-Paris Club bilateral debt of $646 million.46 If we assume that China
continues to account for 97% of Zimbabwe’s non-Paris Club bilateral debt, then the debt to China at
end-2016 will be $1.107 billion, 15% of external public debt.
43 http://www.boz.zm/BOZANNUALREPORT2017.pdf 44 http://www.boz.zm/BOZANNUALREPORT2017.pdf 45 https://www.imf.org/external/pubs/ft/dsa/pdf/2017/dsacr17196.pdf 46 http://www.rbz.co.zw/assets/strategies-for-clearing-external-debt-arrears-and-supportive-economic-reform-measures.pdf

23
The CARI database says China agreed loans of $2.2 billion since 2000, with the last ones in 2015. Our
methodology for the maximum amount to China would predict that $1.4 billion is still owed, so again
this is an overestimate, this time by 27%.
The general breakdown of Zimbabwe’s debt based on the IMF and World Bank’s detailed figures are:
Table 18. Creditors for Zimbabwe’s external government debt
Creditor grouping Total debt owed Percentage of external debt owed
China $1.107 billion 15%
Paris Club governments $3.041 billion 42%
Other governments $0.035 billion 1%
World Bank $1.402 billion 19%
Other multilateral $1.138 billion 16%
Unspecified RBZ debt $0.530 billion 7%
Total $7.253 billion
Appendix 2. The countries in this study
As explained in section 2, CARI has collected data on loan disbursements by China to 54 African
governments. However, the World Bank World Development Indicators database only has debt data for
48 countries. Therefore, the 48 countries we have included in this study are:
1. Algeria
2. Angola
3. Benin
4. Botswana
5. Burkina Faso
6. Burundi
7. Cabo Verde
8. Cameroon
9. Central African Republic
10. Chad
11. Comoros
12. Congo, Republic
13. Congo, Democratic Republic
14. Cote d’Ivoire
15. Djibouti
16. Egypt
17. Eritrea
18. Ethiopia
19. Gabon
20. Gambia
21. Ghana
22. Guinea
23. Guinea-Bissau

24
24. Kenya
25. Lesotho
26. Liberia
27. Madagascar
28. Mali
29. Malawi
30. Mauritius
31. Mauritania
32. Morocco
33. Mozambique
34. Niger
35. Nigeria
36. Rwanda
37. Sao Tome and Principe
38. Senegal
39. Sierra Leone
40. Somalia
41. South Africa
42. Sudan
43. Tanzania
44. Togo
45. Tunisia
46. Uganda
47. Zambia
48. Zimbabwe
South Sudan is not included in the general figures because there is no data in the World Bank database.
However, it is included in the country cases because it is rated as in debt distress by the IMF and World
Bank, and there is information in the IMF and World Bank DSA.