afrl-rh-wp-tr-2014-0132 - dticjohn z. hezel david r. mattie bioeffects division molecular bioeffects...
TRANSCRIPT
AFRL-RH-WP-TR-2014-0132
BIOMARKER DISCOVERY AFTER OCCUPATIONAL EXPOSURE TO VOLATILE ORGANIC COMPOUNDS AND AEROSOLS IN
F-15 AND C-130 FLIGHT LINE CREWS: PROINFLAMMATORY CYTOKINES IN SERUM
Jeanette Frey Henry M. Jackson Foundation for the Advancement of Military Medicine Wright-Patterson AFB OH 45433
Asao Kobayashi Yusuke Mizohata Takatomo Taki
Yasutami Otsuka Aeromedical Laboratory
Japan Air Self-Defense Force Tachikawa, Tokyo, Japan
Stephen W. Mitchell 18 MDOS/SGOL
Kadena AB, Okinawa, Japan
Scott C. Dillard 374 AMDS/SGPF
Yokota AB, Tokyo, Japan
John Z. Hezel David R. Mattie
Bioeffects Division Molecular Bioeffects Branch
August 2014
Interim Report for April 2011 to August 2014
Air Force Research Laboratory 711th Human Performance Wing Human Effectiveness Directorate Bioeffects Division Molecular Bioeffects Branch Wright-Patterson AFB OH 45433-5707
Distribution A. Approved for public release (PA); distribution unlimited. PA Case No. 88ABW-2014-6079 Date Cleared 30 December, 2014
NOTICE AND SIGNATURE PAGE Using Government drawings, specifications, or other data included in this document for any purpose other than Government procurement does not in any way obligate the U.S. Government. The fact that the Government formulated or supplied the drawings, specifications, or other data does not license the holder or any other person or corporation; or convey any rights or permission to manufacture, use, or sell any patented invention that may relate to them.
Qualified requestors may obtain copies of this report from the Defense Technical Information Center (DTIC) (http://www.dtic.mil).
(AFRL-RH- - - - ) has been reviewed and is approved for publication in accordance with assigned distribution statement.
_______________________________________
_______________________________________GARRETT D. POLHAMUS, DR-IV, DAFChief, Bioeffects DivisionHuman Effectiveness Directorate711th Human Performance Wing Air Force Research Laboratory
This report is published in the interest of scientific and technical information exchange, and its publication does not constitute the Government’s approval or disapproval of its ideas or findings.
The experiments reported were conducted according to the "Guide for the Care and Use of Laboratory Animals," Institute of Laboratory Animal Resources, National Research Council.
TRWP 01322014
POLHAMUS.GARRETT.D.1175839484
Digitally signed by POLHAMUS.GARRETT.D.1175839484 DN: c=US, o=U.S. Government, ou=DoD, ou=PKI, ou=USAF, cn=POLHAMUS.GARRETT.D.1175839484 Date: 2015.01.02 15:20:51 -06'00'
MATTIE.DAVID.R.1230101880
Digitally signed by MATTIE.DAVID.R.1230101880 DN: c=US, o=U.S. Government, ou=DoD, ou=PKI, ou=USAF, cn=MATTIE.DAVID.R.1230101880Date: 2014.12.18 15:26:58 -05'00'
DAVID R. MATTIE, Work Unit Manager Molecular Bioeffects Branch

REPORT DOCUMENTATION PAGE Form Approved
OMB No. 0704-0188 Public reporting burden for this collection of information is estimated to average 1 hour per response, including the time for reviewing instructions, searching existing data sources, gathering and maintaining the data needed, and completing and reviewing this collection of information. Send comments regarding this burden estimate or any other aspect of this collection of information, including suggestions for reducing this burden to Department of Defense, Washington Headquarters Services, Directorate for Information Operations and Reports (0704-0188), 1215 Jefferson Davis Highway, Suite 1204, Arlington, VA 22202- 4302. Respondents should be aware that notwithstanding any other provision of law, no person shall be subject to any penalty for failing to comply with a collection of information if it does not display a currently valid OMB control number. PLEASE DO NOT RETURN YOUR FORM TO THE ABOVE ADDRESS. 1. REPORT DATE (DD-MM-YYYY)
29-08-2014 2. REPORT TYPE
Interim 3. DATES COVERED (From - To)
Apr 2011-Aug 2014 4. TITLE AND SUBTITLE Biomarker Discovery After Occupational Exposure To Volatile Organic Compounds And Aerosols In F-15 and C-130 Flight Line Crews: Examination of ProInflammatory Cytokines in Serum
5a. CONTRACT NUMBER
5b. GRANT NUMBER NA 5c. PROGRAM ELEMENT NUMBER 62202F
6. AUTHOR(S) Jeanette Frey1; Asao Kobayashi2; Yusuke Mizohata2; Takatomo Taki2; Yasutami Otsuka2; Stephen W. Mitchell3; Scott C. Dillard4; John Z. Hezel*; David R. Mattie*
5d. PROJECT NUMBER 7757
5e. TASK NUMBER HD
5f. WORK UNIT NUMBER 7757HD05/H0D1
7. PERFORMING ORGANIZATION NAME(S) AND ADDRESS(ES) 1HJF, Bldg 837, 2729 R Street, Wright-Patterson AFB OH 45433 2Aeromedical Laboratory, Japan Air Self-Defense Force, Tachikawa, Tokyo, Japan 318 MDOS/SGOL, Kadena AB, Okinawa, Japan 4374 AMDS/SGPF, Yokota AB, Tokyo, Japan
8. PERFORMING ORGANIZATION REPORT NUMBER
9. SPONSORING / MONITORING AGENCY NAME(S) AND ADDRESS(ES) Air Force Materiel Command* Air Force Research Laboratory 711th Human Performance Wing Human Effectiveness Directorate Bioeffects Division Molecular Bioeffects Branch Wright-Patterson AFB OH 45433-5707
10. SPONSOR/MONITOR’S ACRONYM(S) 711th HPW/RHDJ
11. SPONSOR/MONITOR’S REPORT
AFRL-RH-WP-TR-2014-0132
12. DISTRIBUTION / AVAILABILITY STATEMENT A: Approved for public release (PA); distribution unlimited. PA Case No: 88ABW-2014-6079 Date Cleared 30 December, 2014
13. SUPPLEMENTARY NOTES 14. ABSTRACT Air and ground crews transfer significant amounts of jet fuel and, as a result of transfers, breathe its volatile emissions. Working on flight lines also exposes maintainers to jet fuel exhaust. Little is known concerning levels of exposure and corresponding response biomarkers associated with human jet fuel exposure. The objective of this study was screening blood for detectable jet fuel components and potential biomarkers. As collaborative research the Japan Air Self-Defense Force measured JP-4 or JP-8 components in blood and the U.S. Air Force analyzed for biomarkers. This report describes methods and results for examining ten proinflammatory cytokines in serum. Blood was collected from volunteers at USAF and JASDF air bases in Japan only once pre-shift, post-shift, and the following morning. Concentrations of 5 cytokines (GM-CSF, IFN- γ, IL-2, IL-1β and IL-1α) fell below assay range. No changes were observed with IL-6, IL-10, and IL-12 p70. TNF-α at Kadena AB showed a significant increase post-shift for JP-8-exposed subjects, but levels did not differ from control subjects. IL-8 levels in JP-4-exposed subjects were higher than those in Tachikawa control subjects (no active runway) at the post-shift time point. IL-8 levels in JP-8-exposed subjects were also higher than levels in control subjects (at the recovery time point). IL-8 levels in JP-4-exposed subjects were higher than levels in JP-8-exposed subjects at all three time points. Data might indicate a low level of inflammation. However, cytokines may not be sensitive markers for jet fuel exposure or exposure was too low to trigger inflammatory effects. 15. SUBJECT TERMS jet fuel, JP-4, JP-8, cytokine, GM-CSF, IFN- γ, IL-2, IL-1β, IL-1α, IL-6, IL-8, IL-10, IL-12 p70, TNF-α 16. SECURITY CLASSIFICATION OF: U
17. LIMITATION OF ABSTRACT
SAR
18. NUMBER OF PAGES
62
19a. NAME OF RESPONSIBLE PERSON D. R. Mattie
a. REPORT
U
b. ABSTRACT
U
c. THIS PAGE
U
19b. TELEPHONE NUMBER (include area code)
NA Standard Form 298 (Rev. 8-98) Prescribed by ANSI Std. 239.18
i

THIS PAGE IS LEFT INTENTIONALLY BLANK.
ii
Distribution A. Approved for public release (PA); distribution unlimited. (PA Case No: 88ABW-2014-6079 Date Cleared 30 December, 2014
TABLE OF CONTENTS
1.0 SUMMARY………………………………………………………………………..…......1 2.0 INTRODUCTION………………………………………………………………………...2 3.1 MATERIALS AND METHODS…………………………………………………………4
3.1 Subjects/Sampling ...............................................................................................................4 3.2 Human IL-1α Ultra-Sensitive Multi-Array® Assay............................................................6 3.3 Human ProInflammatory 9-Plex Ultra-Sensitive Multi-Spot® Assay ................................6 3.4 Statistical Analysis ..............................................................................................................7
4.1 RESULTS…………………………………………………………………………………7 4.1 Human IL-1α Ultra-Sensitive Multi-Array® Assay............................................................7 4.2 Human ProInflammatory 9-Plex Ultra-Sensitive Multi-Spot® Assay ................................9 4.3 Summary of ANOVA Analyses ........................................................................................45 4.4 Alternate Statistical Analyses ............................................................................................46
5.1DISCUSSION/CONCLUSIONS………………………………………………………….48 5.1 Overview ...........................................................................................................................48 5.2 Cytokines ..........................................................................................................................49
6.0 REFERENCES…………………………………………………………………………..50 7.0 LIST OF SYMBOLS, ABBREVIATIONS, AND ACRONYMS………………………52
iii
Distribution A. Approved for public release (PA); distribution unlimited. (PA Case No: 88ABW-2014-6079 Date Cleared 30 December, 2014
LIST OF FIGURES Figure 1. Distribution of IL-1α Concentrations in (A) Control Subjects and (B) Exposed
Subjects ......................................................................................................................................9 Figure 2. Distribution of GM-CSF Concentrations in (A) Control Subjects and (B) Exposed
Subjects ....................................................................................................................................12 Figure 3. Distribution of IFN-γ Concentrations in (A) Control Subjects and (B) Exposed
Subjects ....................................................................................................................................14 Figure 4. Distribution of IL-2 Concentrations in (A) Control Subjects and (B) exposed
Subjects ....................................................................................................................................16 Figure 5. Distribution of IL-1β Concentrations in (A) Control Subjects and (B) Exposed
Subjects ....................................................................................................................................18 Figure 6. Distribution of IL-8 Concentrations in (A) Control Subjects and (B) Exposed
Subjects ....................................................................................................................................19 Figure 7. IL-8 Concentrations in the Four Control Groups at the Pre-shift, Post-shift and
Recovery Time Points ..............................................................................................................21 Figure 8. IL-8 Concentrations in the Five Exposure Groups at the Pre-shift, Post-shift, and
Recovery Time Points ..............................................................................................................22 Figure 9. IL-8 Concentrations of Control Subjects versus JP-4-Exposed Subjects.......................23 Figure 10. IL-8 Concentrations of Control Subjects versus JP-8-Exposed Subjects .....................24 Figure 11. IL-8 Concentrations of JP-4-Exposed Subjects versus JP-8-Exposed Subjects ...........25 Figure 12. Distribution of IL-6 Concentrations in (A) Control Subjects and (B) Exposed Subjects
.................................................................................................................................................. 26
Figure 13. IL-6 Concentrations in (A) Control Groups and (B) Exposure Groups at the Pre- shift, Post-shift, and Recovery Time Points .............................................................................28
Figure 14. IL-6 Concentrations of Control Subjects versus (A) JP-4-Exposed Subjects and (B) JP-8-Exposed Subjects at all Three Time Points ...............................................................29
Figure 15. IL-6 Concentrations of JP-4-Exposed Subjects versus JP-8-Exposed Subjects ...........30 Figure 16. Distribution of TNF-α Concentrations in (A) Control Subjects and (B) Exposed
Subjects ....................................................................................................................................31 Figure 17. TNF-α Concentrations in (A) Control Groups and (B) Exposure Groups at the
Pre-shift, Post-shift, and Recovery Time Points ......................................................................33 Figure 18. TNF-α Concentrations of Control Subjects versus (A) JP-4-Exposed Subjects and
(B) JP-8-Exposed Subjects .......................................................................................................34 Figure 19. TNF-α Concentrations of JP-4-Exposed Subjects versus JP-8-Exposed Subjects .......35 Figure 20. Distribution of IL-10 Concentrations in (A) Control Subjects and (B) Exposed
Subjects ....................................................................................................................................36 Figure 21. IL-10 Concentrations in (A) Control Groups and (B) Exposure Groups at the Pre-
shift, Post-shift and Recovery Time Points ..............................................................................38 Figure 22. IL-10 Concentrations of Control Subjects versus (A) JP-4-Exposed Subjects and
(B) JP-8-Exposed Subjects .......................................................................................................39 Figure 23. IL-10 Concentrations of JP-4-Exposed Subjects versus JP-8-Exposed Subjects .........40 Figure 24. Distribution of IL-12 p70 Concentrations in (A) Control Subjects and (B)
Exposed Subjects .....................................................................................................................41 iv
Distribution A. Approved for public release (PA); distribution unlimited. (PA Case No: 88ABW-2014-6079 Date Cleared 30 December, 2014
Figure 25. IL-12 p70 Concentrations in (A) Control Groups and (B) Exposure Groups at the Pre-shift, Post-shift and Recovery Time Points ...................................................................... 43
Figure 26. IL-12 p70 Concentrations of Control Subjects versus (A) JP-4-Exposed Subjects and (B) JP-8-Exposed Subjects ............................................................................................... 44
Figure 27. IL-12 p70 Concentrations of JP-4-Exposed Subjects versus JP-8-Exposed Subjects ................................................................................................................................... 45
v
Distribution A. Approved for public release (PA); distribution unlimited. (PA Case No: 88ABW-2014-6079 Date Cleared 30 December, 2014
LIST OF TABLES Table 1. Summary of Final Number of Blood Samples Collected for Analysis .............................5 Table 2. Sampling Schedule ............................................................................................................5 Table 3. Lower Limit of Detection and Median Levels of Nine Cytokines Detected by the
Human ProInflammatory 9-Plex Ultra-Sensitive Multi-Spot® Assay .....................................10 Table 4. Percentage of Samples Below Detection Limits .............................................................10 Table 5. Average IL-8 Concentrations (pg/mL) ± 1 SD in Each Study Group at All Three
Time Points ..............................................................................................................................20 Table 6. Average IL-6 Concentrations (pg/mL) ± 1 SD in Each Study Group at All Three
Time Points ..............................................................................................................................27 Table 7. Average TNF-α Concentrations (pg/mL) ± 1 SD in Each Study Group at all Three
Time Points ..............................................................................................................................32 Table 8. Average IL-10 Concentrations (pg/mL) ± 1 SD in Each Study Group at All Three
Time Points ..............................................................................................................................37 Table 9. Average IL-12 p70 Concentrations (pg/mL) ± 1 SD in Each Study Group at All
Three Time Points ....................................................................................................................42 Table 10. Summary of ANOVA Analyses ....................................................................................46 Table 11. Summary of Mann-Whitney U-Tests ............................................................................47
vi
Distribution A. Approved for public release (PA); distribution unlimited. (PA Case No: 88ABW-2014-6079 Date Cleared 30 December, 2014
PREFACE This study completes phase two of a cooperative research project conducted under a Memorandum of Understanding between the Department of Defense of the United States of America and the Ministry of Defense of Japan. This international agreement, “The Human Effects of Exposure to Aviation Jet Fuels, JP-4 and JP-8, and Their Engine Exhaust,” is a scientific collaboration between the Molecular Bioeffects Branch (711 HPW/RHDJ) and Japan Air Self-Defense Force, Aeromedical Laboratory (JASDF/AML).
The program managers for the Memorandum of Understanding are Asao Kobayashi, PhD for JASDF/AML and David Mattie, PhD for 711 HPW/RHDJ. Funding for this project was equally provided by JASDF and USAF.
The study protocol, Human Operational Exposure to JP-4 and JP-8 Fuel (Exhaust), was approved as FWR20110047H by the Air Force Research Laboratory Institutional Review Board and as 22- 01-01 by the Aeromedical Laboratory Ethical Committee.
The authors would like to acknowledge the men and women of the U.S. Air Force and Japanese Air Self Defense Force who were part of this study or assisted in the collection of samples for this study especially at Detachment 3, USAFSAM and 374 AMDS/SGPB.
vii
DRAFT PENDING Distribution A. Approved for public release (PA); distribution unlimited. (PA Case No: 88ABW-2014-XXXX Date Cleared

THIS PAGE IS LEFT INTENTIONALLY BLANK.
viii
DRAFT PENDING Distribution A. Approved for public release (PA); distribution unlimited. (PA Case No: 88ABW-2014-XXXX Date Cleared

1.0 SUMMARY Air and ground crews transfer a significant amount of jet fuel, and as a result of transfers, breathe its volatile emission from residues. Working on the flight line also exposes maintainers to exhaust from the jet fuel as engines are tested or run before and after flight. Since little is known concerning levels of exposure and the corresponding response biomarkers associated with human jet fuel exposure, screening blood and urine for detectable jet fuel components and examining them for biomarkers were the objectives of this study. The project was a collaborative research effort between the U.S. Air Force (USAF) and the Japan Air Self-Defense Force (JASDF) to correlate exposure and biomarkers for JP-4 and compare them with those from JP-8. This report describes the USAF’s examination of ten proinflammatory cytokines in serum. Blood was collected from volunteers at USAF and JASDF air bases located in Japan. The USAF air bases were Yokota, a C-130 air base and Kadena, an F-15 Air base. The JASDF bases were Komaki, a C-130 air base and Naha and Komatsu, F-15 air bases. In addition subjects were recruited from Tachikawa AB because there was no active runway at this base so it served as a better control site than sampling from the individual JASDF air bases with active runways and potential exposure to all base personnel. Samples were collected for each subject once at three time points: pre-shift, post-shift, and the following morning. The Meso Scale Discovery (MSD) Human IL-1α Ultra-Sensitive Multi-Array® Assay was used to detect IL-1α in human serum samples while the Human ProInflammatory 9-Plex Ultra-Sensitive Multi-Spot® Assay, a multiplex detection method was used to determine the following nine cytokines: IL-2, IL-8, IL- 12 p70, IL-1β, GM-CSF, IFN-γ, IL-6, IL-10, and TNF-α simultaneously. Concentrations of five cytokines (GM-CSF, IFN- γ, IL-2, IL-1β and IL-1α) fell below assay range. No changes were observed with IL-6, IL-10, and IL-12 p70. TNF-α at Kadena AB showed a significant increase post-shift for JP-8-exposed subjects, but levels did not differ from control subject post-shift samples. IL-8 levels in JP-4-exposed subjects were higher than those in Tachikawa control subjects (no active runway) at the post-shift time point. IL-8 levels in JP-8-exposed subjects were also higher than levels in control subjects (at the recovery time point). IL-8 levels in JP-4- exposed subjects were higher than levels in JP-8-exposed subjects at all three time points. These data might indicate a low level of inflammation. However, in general cytokines may not be sensitive markers for jet fuel exposure or jet fuel exposures occurring at the bases were too low to trigger inflammatory effects. Additional work is required to identify key biomarkers that are predictive of exposure to specific jet fuels or combustion products.
1
2.0 INTRODUCTION Due to its widespread use, JP-8 has been recognized as the single largest source of chemical exposure for U.S. and NATO military personnel (Carlton and Smith, 2000). Inhalation and dermal contact have been shown to represent the primary routes of exposure (Chao et al., 2005). The potential for widespread occupational exposure among military and civilian personnel may result in toxicity to the immune system, nervous system and respiratory tract (National Research Council, 2003). Air and ground crews transfer a significant amount of jet fuel, and as a result of transfers, breathe its volatile emission from residues. Compounding this inhalation exposure is breathing combustion products and uncombusted fuel from exhaust emitted from a variety of jet engines. Lastly, individuals that directly transfer fuel have intermittent skin exposure to liquid state fuel that enhances their dose received during their work shift. Therefore, a tremendous need exists to identify biomarkers predictive of toxic insult due to these common exposures to volatile organic chemicals.
JP-4 and JP-8 jet fuels are designed to power aircraft turbine engines. Each jet fuel is part of a family of jet propulsion fuels made into unique chemical formulations for assuring combustion power and performance specifications. During the distillation of crude oil to make JP-4, a wide cut is taken of the distillate so as to include both the naphtha (gasoline) and kerosene fractions. JP-4 is typically composed of about 50 to 60 percent gasoline, and the remainder is kerosene. Combat experience, observed during the Vietnam War, revealed that the USAF aircraft, using highly volatile JP-4, had higher combat losses than U. S. Navy aircraft, which were using the lower volatility fuel JP-5. Also, crash data indicated that the probability of a post-crash fire is nearly 100 percent when using JP-4, much higher than with a kerosene-based fuel such as JP-5 or commercial Jet A (USAF, 1996). JP-8, which is solely a kerosene-based fuel, was developed and introduced to provide a safer jet fuel (similar to commercial Jet A-1) for the USAF and has become the operational fuel for DoD.
The two primary routes for occupational jet fuel exposure are via the skin (dermal absorption) and respiratory tract (inhalation). A number of human and animal studies have looked at these two routes. Initial studies of jet fuel toxicity noted that many observed effects are attributable to the fuel components such as benzene, toluene, xylene, and n-hexane. Studies by Struwe et al. (1983) and Knave et al. (1976 and 1978) documented the occurrence of symptoms of neurasthenia (chronic fatigue and weakness, loss of memory, and generalized aches and pains), psychasthenia (disorder characterized by phobias, obsessions, compulsions, or excessive anxiety) and polyneuropathy (disorder of the peripheral nerves) in civilian and military aircraft workers exposed to jet fuel. They also reported cases of sexual dysfunction which were possibly neurologic in origin. Government literature reviews summarizing the health effects of jet fuel exposure have been published (USAF, 1989; ATSDR, 1993), primarily focusing on JP-4. The major findings for JP-4 exposure have been skin irritation and defatting, neurotoxicity, nephrotoxicity, and renal carcinogenicity (in male rats).
Animal studies support previous findings involving human exposures showing that JP-8 can induce irritation. However, JP-8 animal irritation studies have produced mixed results and may be dependent on the source of the fuel (oil field acquired and/or refinery processes) and its
2
DRAFT PENDING Distribution A. Approved for public release (PA); distribution unlimited. (PA Case No: 88ABW-2014-XXXX Date Cleared

subcomponent chemical profile. JP-8 is formulated to performance specifications that can ultimately lead to each batch of fuel having a slightly different percentage of chemical components. Some components, as well as the chemical additives, may influence toxicity during exposure. JP-8 was found to be non-irritating in the rabbit primary eye irritation test (Smith et al., 1981; Kinkead et al., 1992a). Results in the corresponding rabbit skin irritation test ranged from non-irritating (Smith et al., 1981; Wolfe et al., 1996) to slightly irritating (Kinkead et al., 1992a), to slight to moderately irritating (Hurley et al., 2011). Differences may be dependent on the source and/or performance mixture components of the JP-8. JP-4 was considered to be non- irritating in the rabbit primary eye irritation test and slightly irritating in the rabbit skin irritation test (Kinkead et al., 1992b). The rabbit skin irritation test, which was conducted four times for JP-8 with variable results and once for JP-4, was ultimately not predictive for human exposure (Mattie and Sterner, 2011). JP-4 was not found to be irritating to workers, even though the rabbit test indicated that it was slightly irritating to rabbit skin. The two negative results for dermal irritation in rabbit studies for JP-8 gave the impression that JP-8 would be the same as JP-4, or at least less irritating to humans. In actuality, after longer operational use, JP-8 appears to cause more dermal irritation to humans than JP-4 based on anecdotal reporting received from operational and medical personnel.
Jet fuel toxicity assessments also evaluated the ability of the fuels to induce respiratory irritation. Several studies have evaluated jet fuel induced respiratory effects. Respiratory tract sensory irritation was examined for JP-4 and JP-8 in male Swiss-Webster mice. Groups of mice were exposed head-only to JP-4 at concentrations of 685, 956, 1888, or 11430 mg/m3 or JP-8 at 681, 708, 1090, 1837 or 3565 mg/m3 for 30 minutes. The calculated concentration at which the respiratory rate decreased 50 percent (RD50) was 4842 and 2876 mg/m3 for each fuel, respectively (Whitman and Hinz, 2001). The depression of mouse respiration rate shows a potential for greater irritation from inhalation of JP-8, although both fuels showed respiratory depression and irritation. The irritation potential of JP-8 is also supported by reports from military personnel working with JP-8 (Olsen et al., 1998).
A comparison of JP-4 and JP-8 composition revealed that the concentration of benzene and n- hexane in JP-8 are reduced when compared to JP-4. Despite lower percentages of benzene and n-hexane in JP-8, awareness of JP-4’s reported health effects resulted in comprehensive toxicity studies of the newer JP-8 jet fuel. This conscious effort to study the effects of JP-8 resulted in a number of toxicity reviews for JP-8 and jet fuel in general. These include military reviews (USAF, 1989; Ritchie et al., 2003; Mattie and Sterner, 2011) as well as those performed by other government agencies (National Research Council, 1996 and 2003; ATSDR, 1998). Although JP- 8 appears to be less toxic than JP-4, definitive comparative studies have not been conducted. A technical report described an investigation of flight line workers at Hill AFB as the base converted from JP-4 to JP-8. However, the total numbers of personnel, and the single observation of workers exposed to JP-4 before conversion to JP-8, were not sufficient to draw any significant conclusions (Olsen et al., 1998).
Kobayashi and Kikukawa (2000) showed combusted jet fuel having higher amounts of the irritant and suspected carcinogen, formaldehyde, in the exhaust of JP-8 powered F-4 engines. The lack of studies conclusively demonstrating the difference in risk between JP-4 and JP-8
3
DRAFT PENDING Distribution A. Approved for public release (PA); distribution unlimited. (PA Case No: 88ABW-2014-XXXX Date Cleared
combustion products is, and has remained, a concern to the Japan Air Self-Defense Force (JASDF). Preliminary results from limited sampling by JASDF has shown parts per billion (ppb) detectable levels of benzene, toluene, hexane, heptane, nonane, decane, undecane, and dodecane in the exhaust of F-15J engines using JP-4 in Japan. In the exhaust of C-130s, JASDF found ppb levels of undecane, tridecane, tetradecane, and pentadecane. All of these components of JP-4 jet fuel exhaust are of concern to JASDF Surgeon General. As a result their military has delayed the switch to JP-8.
A direct human exposure response comparison study during military operations, able to evaluate and compare JP-4 and JP-8 by both characterizing jet fuel components and their amounts in blood, urine and within flight line air environment is necessary to draw substantive conclusions regarding the higher human toxicity of either fuel. This project was a collaborative research effort between the U.S. Air Force (USAF) and the JASDF designed to investigate jet fuel exposure health effects to ground crews handling JP-4 versus ground crews handling JP-8. Since little is known concerning level of exposure and the corresponding response biomarkers associated with human jet fuel exposure, screening blood of flight line personnel for possible detectable biomarkers will be the first effort to identify changes and new biomarkers from jet fuel exposure. This report describes the USAF’s examination of ten proinflammatory cytokines in serum.
Chemical exposures can potentially lead to the generation of reactive oxygen species. Oxidative stress and inflammation have been implicated in inhalation JP-8 exposures (Espinoza et al., 2006; Hays et al., 1995). Cytokines can be induced by oxidative stress and are immunomodulatory proteins (i.e., interleukins (IL)) that normally function in cell signaling and as immunomodulating agents. Cytokines have been known to be involved in response to JP-8 induced oxidative stress in dermal and inhalation jet fuel exposure studies (Harris et al., 2007; Ramos et al., 2009). The concentration of cytokines can increase in response to trauma or infection. Cytokines appear to be successful as biomarkers when they are key drivers of acute toxicity, but biological variability, assay sensitivity and short half-life are still issues (Tarrant, 2010). Most nucleated cells, especially those near the interface with the external environment such as skin and lung, are capable of being potent cytokine producers. Samples from studies investigating dermal and inhalation jet fuel exposures revealed a common dysregulated cytokine profile. Jet fuel dermal exposure studies using rats led to induction of IL-1 alpha, TNF-α, and PGE2 to levels different than those of non-exposed controls (Fulzele et al., 2007). Inhaled jet fuel exposure using mice led to an increase in serum IL-10 and the proinflammatory agent PGE2 (Harris et al., 2007). Gene expression profiles of jet fuel exposed rat, mice and cell lines to include human dermal and alveolar cell lines have consistently discovered inflammatory pathway changes. We measured cytokine inflammation mediators IL-1 alpha, IL-1 beta, IL-2, IL-6, IL-8, IL-10, IL-12p70, TNF-α, IFN-γ, and GM-CSF.
3.1 MATERIALS AND METHODS
3.2 Subjects/Sampling
4
DRAFT PENDING Distribution A. Approved for public release (PA); distribution unlimited. (PA Case No: 88ABW-2014-XXXX Date Cleared
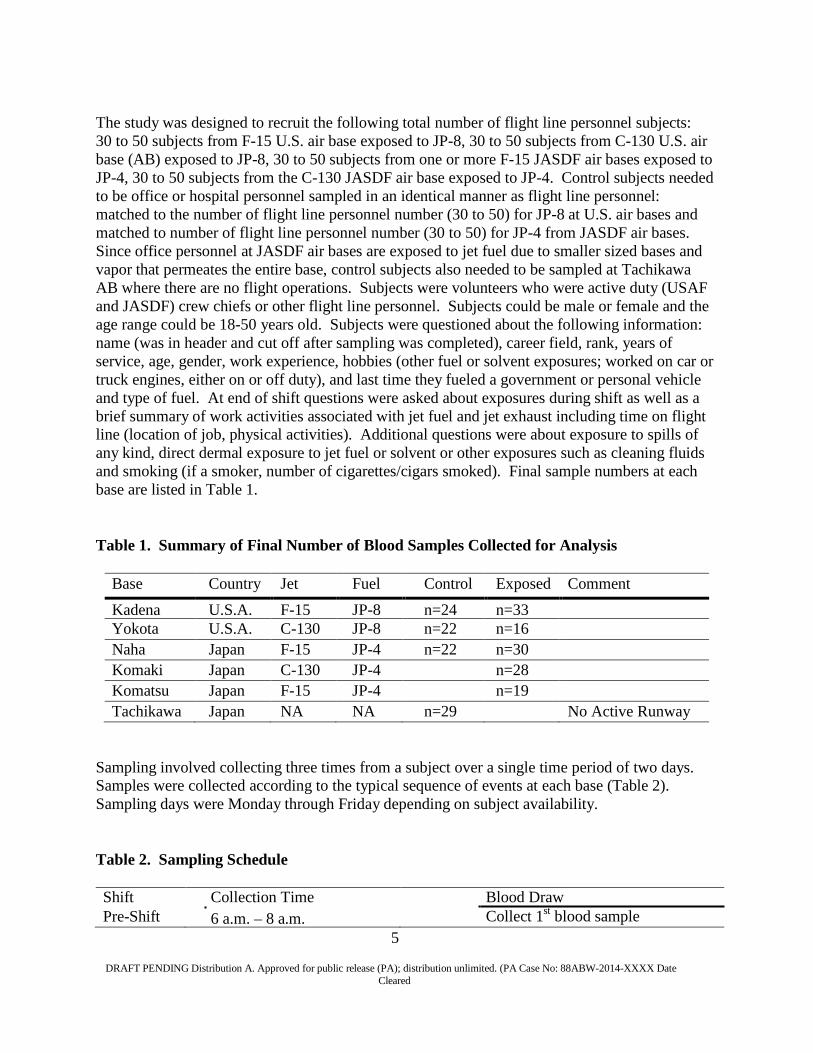
The study was designed to recruit the following total number of flight line personnel subjects: 30 to 50 subjects from F-15 U.S. air base exposed to JP-8, 30 to 50 subjects from C-130 U.S. air base (AB) exposed to JP-8, 30 to 50 subjects from one or more F-15 JASDF air bases exposed to JP-4, 30 to 50 subjects from the C-130 JASDF air base exposed to JP-4. Control subjects needed to be office or hospital personnel sampled in an identical manner as flight line personnel: matched to the number of flight line personnel number (30 to 50) for JP-8 at U.S. air bases and matched to number of flight line personnel number (30 to 50) for JP-4 from JASDF air bases. Since office personnel at JASDF air bases are exposed to jet fuel due to smaller sized bases and vapor that permeates the entire base, control subjects also needed to be sampled at Tachikawa AB where there are no flight operations. Subjects were volunteers who were active duty (USAF and JASDF) crew chiefs or other flight line personnel. Subjects could be male or female and the age range could be 18-50 years old. Subjects were questioned about the following information: name (was in header and cut off after sampling was completed), career field, rank, years of service, age, gender, work experience, hobbies (other fuel or solvent exposures; worked on car or truck engines, either on or off duty), and last time they fueled a government or personal vehicle and type of fuel. At end of shift questions were asked about exposures during shift as well as a brief summary of work activities associated with jet fuel and jet exhaust including time on flight line (location of job, physical activities). Additional questions were about exposure to spills of any kind, direct dermal exposure to jet fuel or solvent or other exposures such as cleaning fluids and smoking (if a smoker, number of cigarettes/cigars smoked). Final sample numbers at each base are listed in Table 1.
Table 1. Summary of Final Number of Blood Samples Collected for Analysis
Base Country Jet Fuel Control Exposed Comment Kadena U.S.A. F-15 JP-8 n=24 n=33 Yokota U.S.A. C-130 JP-8 n=22 n=16 Naha Japan F-15 JP-4 n=22 n=30 Komaki Japan C-130 JP-4 n=28 Komatsu Japan F-15 JP-4 n=19 Tachikawa Japan NA NA n=29 No Active Runway
Sampling involved collecting three times from a subject over a single time period of two days. Samples were collected according to the typical sequence of events at each base (Table 2). Sampling days were Monday through Friday depending on subject availability.
Table 2. Sampling Schedule
Shift Collection Time Blood Draw Pre-Shift
6 a.m. – 8 a.m. Collect 1st blood sample 5
DRAFT PENDING Distribution A. Approved for public release (PA); distribution unlimited. (PA Case No: 88ABW-2014-XXXX Date Cleared
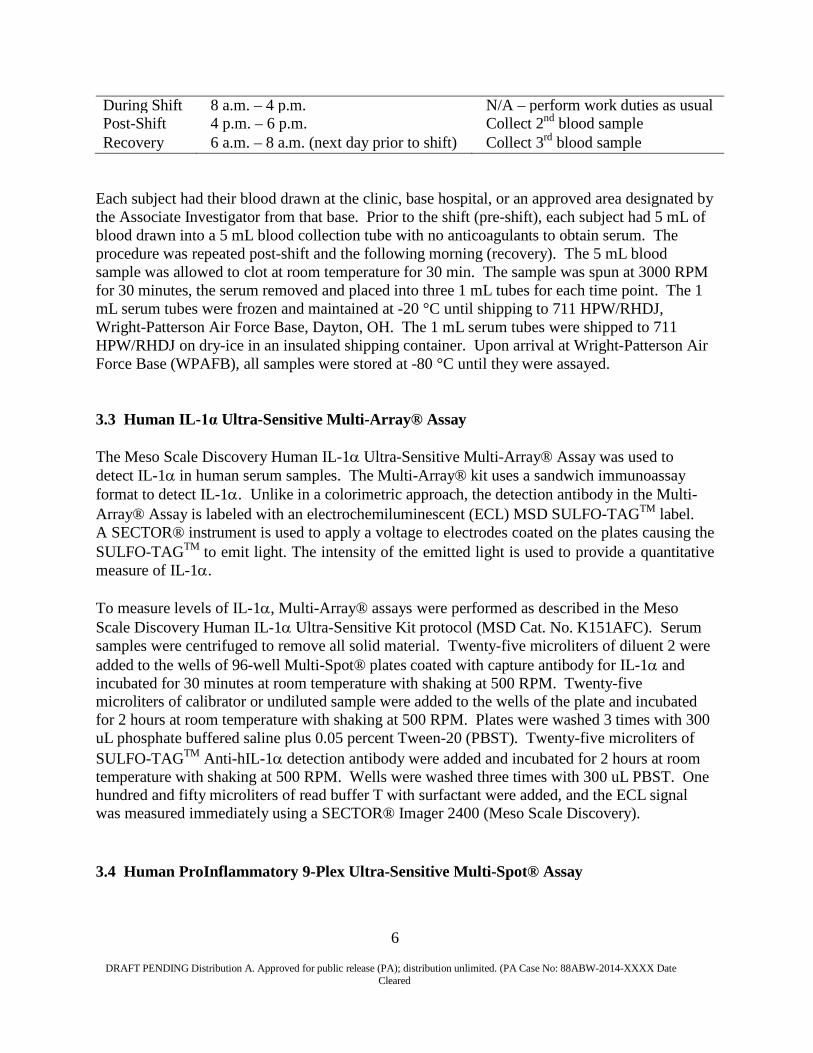
During Shift 8 a.m. – 4 p.m. N/A – perform work duties as usual Post-Shift 4 p.m. – 6 p.m. Collect 2nd blood sample Recovery 6 a.m. – 8 a.m. (next day prior to shift) Collect 3rd blood sample
Each subject had their blood drawn at the clinic, base hospital, or an approved area designated by the Associate Investigator from that base. Prior to the shift (pre-shift), each subject had 5 mL of blood drawn into a 5 mL blood collection tube with no anticoagulants to obtain serum. The procedure was repeated post-shift and the following morning (recovery). The 5 mL blood sample was allowed to clot at room temperature for 30 min. The sample was spun at 3000 RPM for 30 minutes, the serum removed and placed into three 1 mL tubes for each time point. The 1 mL serum tubes were frozen and maintained at -20 °C until shipping to 711 HPW/RHDJ, Wright-Patterson Air Force Base, Dayton, OH. The 1 mL serum tubes were shipped to 711 HPW/RHDJ on dry-ice in an insulated shipping container. Upon arrival at Wright-Patterson Air Force Base (WPAFB), all samples were stored at -80 °C until they were assayed.
3.3 Human IL-1α Ultra-Sensitive Multi-Array® Assay
The Meso Scale Discovery Human IL-1α Ultra-Sensitive Multi-Array® Assay was used to detect IL-1α in human serum samples. The Multi-Array® kit uses a sandwich immunoassay format to detect IL-1α. Unlike in a colorimetric approach, the detection antibody in the Multi- Array® Assay is labeled with an electrochemiluminescent (ECL) MSD SULFO-TAGTM label. A SECTOR® instrument is used to apply a voltage to electrodes coated on the plates causing the SULFO-TAGTM to emit light. The intensity of the emitted light is used to provide a quantitative measure of IL-1α.
To measure levels of IL-1α, Multi-Array® assays were performed as described in the Meso Scale Discovery Human IL-1α Ultra-Sensitive Kit protocol (MSD Cat. No. K151AFC). Serum samples were centrifuged to remove all solid material. Twenty-five microliters of diluent 2 were added to the wells of 96-well Multi-Spot® plates coated with capture antibody for IL-1α and incubated for 30 minutes at room temperature with shaking at 500 RPM. Twenty-five microliters of calibrator or undiluted sample were added to the wells of the plate and incubated for 2 hours at room temperature with shaking at 500 RPM. Plates were washed 3 times with 300 uL phosphate buffered saline plus 0.05 percent Tween-20 (PBST). Twenty-five microliters of SULFO-TAGTM Anti-hIL-1α detection antibody were added and incubated for 2 hours at room temperature with shaking at 500 RPM. Wells were washed three times with 300 uL PBST. One hundred and fifty microliters of read buffer T with surfactant were added, and the ECL signal was measured immediately using a SECTOR® Imager 2400 (Meso Scale Discovery).
3.4 Human ProInflammatory 9-Plex Ultra-Sensitive Multi-Spot® Assay
6
DRAFT PENDING Distribution A. Approved for public release (PA); distribution unlimited. (PA Case No: 88ABW-2014-XXXX Date Cleared
The Human ProInflammatory 9-Plex Ultra-Sensitive Multi-Spot® Assay is a multiplex assay capable of detecting multiple protein targets simultaneously. The capture antibodies for each of the targets are in the same well, but coated on distinct electrodes. The Multi-Spot® kit uses a sandwich immunoassay format in which the detection antibodies are labeled with an ECL MSD SULFO-TAGTM label. A SECTOR® instrument is used to apply a voltage to electrodes coated on the plates causing the SULFO-TAGTM to emit light. The intensity of the emitted light is used to provide a quantitative measure of each protein target.
Multi-Spot® assays were performed as described in the Meso Scale Discovery Human ProInflammatory 9-Plex Ultra-Sensitive Kit protocol (MSD Cat. No. K15007C). The following nine cytokines were measured: IL-2, IL-8, IL-12 p70, IL-1β, GM-CSF, IFN-γ, IL-6, IL-10, and TNF-α. Serum samples were centrifuged to remove all solid material. Twenty-five microliters of diluent 2 were added to the wells of 96-well Multi-Spot® plates coated with capture antibodies for IL-2, IL-8, IL-12 p70, IL-1β, GM-CSF, IFN-γ, IL-6, IL-10, and TNF-α and incubated for 30 minutes at room temperature with shaking at 500 RPM. Twenty-five microliters of calibrator or undiluted sample were added to the wells of the plate and incubated for 2 hours at room temperature with shaking at 500 RPM. Plates were washed 3 times with 300 uL PBST. Twenty-five microliters of SULFO-TAGTM 9-Plex detection antibody blend were added and incubated for 2 hours at room temperature with shaking at 500 RPM. Wells were washed three times with 300 uL PBST. One hundred and fifty microliters of read buffer T with surfactant were added, and the ECL signal was measured immediately using a SECTOR® Imager 2400 (Meso Scale Discovery).
3.5 Statistical Analysis
All data were the average of duplicate determinations. For statistical purposes, cytokine measurements that were “Below Fit Curve Range” (as determined by the standard curve for each cytokine individually) were assigned an arbitrary value of zero. Cytokine measurements that were “Below Detection Limit” (BDL) were estimated with an extrapolation from the standard curve. These samples were included in both the plots presented and the statistical analysis conducted, except in the case of IFN-γ, GM-CSF, IL-2, IL-1β, and IL-1α where a majority of the samples had a value below the lower limit of detection (LLOD). In the case of IFN-γ, GM-CSF, IL-2, IL-1β, and IL-1α, non-rigorous data analysis is presented. Two-tailed t-tests were used to make comparisons between control and exposure groups. For all other cytokines, evaluation of the association of jet fuel exposure with biomarkers of immune response was completed using one-way analysis of variance (ANOVA). When a significant difference was found at α = 0.5, Mann-Whitney U-tests were performed to identify which groups differed significantly. Analyses were conducted in Excel 2010.
4.1 RESULTS
4.2 Human IL-1α Ultra-Sensitive Multi-Array® Assay
7
DRAFT PENDING Distribution A. Approved for public release (PA); distribution unlimited. (PA Case No: 88ABW-2014-XXXX Date Cleared
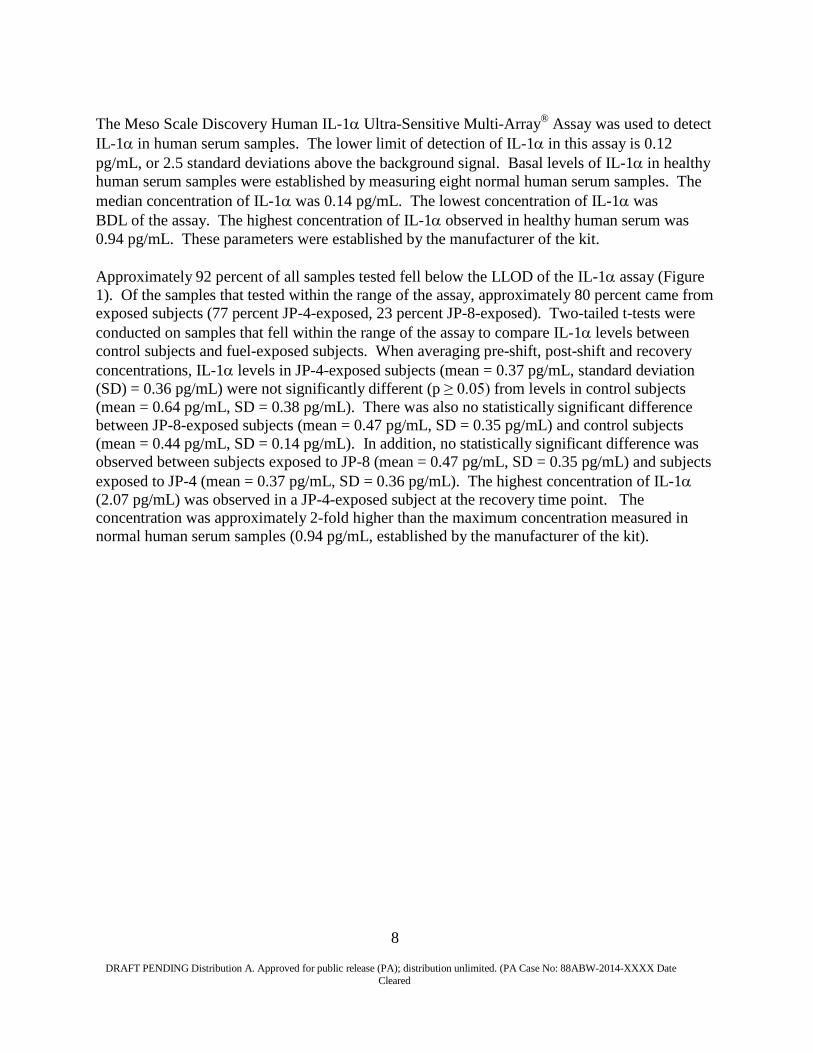
The Meso Scale Discovery Human IL-1α Ultra-Sensitive Multi-Array® Assay was used to detect IL-1α in human serum samples. The lower limit of detection of IL-1α in this assay is 0.12 pg/mL, or 2.5 standard deviations above the background signal. Basal levels of IL-1α in healthy human serum samples were established by measuring eight normal human serum samples. The median concentration of IL-1α was 0.14 pg/mL. The lowest concentration of IL-1α was BDL of the assay. The highest concentration of IL-1α observed in healthy human serum was 0.94 pg/mL. These parameters were established by the manufacturer of the kit.
Approximately 92 percent of all samples tested fell below the LLOD of the IL-1α assay (Figure 1). Of the samples that tested within the range of the assay, approximately 80 percent came from exposed subjects (77 percent JP-4-exposed, 23 percent JP-8-exposed). Two-tailed t-tests were conducted on samples that fell within the range of the assay to compare IL-1α levels between control subjects and fuel-exposed subjects. When averaging pre-shift, post-shift and recovery concentrations, IL-1α levels in JP-4-exposed subjects (mean = 0.37 pg/mL, standard deviation (SD) = 0.36 pg/mL) were not significantly different (p ≥ 0.05) from levels in control subjects (mean = 0.64 pg/mL, SD = 0.38 pg/mL). There was also no statistically significant difference between JP-8-exposed subjects (mean = 0.47 pg/mL, SD = 0.35 pg/mL) and control subjects (mean = 0.44 pg/mL, SD = 0.14 pg/mL). In addition, no statistically significant difference was observed between subjects exposed to JP-8 (mean = 0.47 pg/mL, SD = 0.35 pg/mL) and subjects exposed to JP-4 (mean = 0.37 pg/mL, SD = 0.36 pg/mL). The highest concentration of IL-1α (2.07 pg/mL) was observed in a JP-4-exposed subject at the recovery time point. The concentration was approximately 2-fold higher than the maximum concentration measured in normal human serum samples (0.94 pg/mL, established by the manufacturer of the kit).
8
DRAFT PENDING Distribution A. Approved for public release (PA); distribution unlimited. (PA Case No: 88ABW-2014-XXXX Date Cleared

Figure 1. Distribution of IL-1α Concentrations in (A) Control Subjects and (B) Exposed Subjects. Control data combine subjects from Kadena, Yokota, Naha and Tachikawa. Exposed data combine subjects from Kadena, Yokota, Naha, Komaki and Komatsu.
4.2 Human ProInflammatory 9-Plex Ultra-Sensitive Multi-Spot® Assay
Because the Human ProInflammatory 9-Plex Ultra-Sensitive Multi-Spot® Assay is a multiplex assay, by definition it is capable of detecting multiple protein targets simultaneously. The assay was used to detect the following nine cytokines: IL-2, IL-8, IL-12 p70, IL-1β, GM-CSF, IFN-γ,
B.
A.
9
DRAFT PENDING Distribution A. Approved for public release (PA); distribution unlimited. (PA Case No: 88ABW-2014-XXXX Date Cleared

IL-6, IL-10 and TNF-α. The LLOD of each cytokine and its median concentration in normal human serum samples are listed in Table 3. Table 3. Lower Limit of Detection and Median Levels of Nine Cytokines Detected by the Human ProInflammatory 9-Plex Ultra-Sensitive Multi-Spot® Assay
Cytokine LLOD (pg/mL)* Median Concentration (pg/mL) IL-8 0.090 7.4 TNF-α 0.50 4.2 IL-6 0.27 1.8 IL-10 0.21 1.0 IL-12 p70 1.4 2.2 IFN-γ 0.53 0.8 GM-CSF 0.20 <LLOD IL-2 0.35 <LLOD IL-1β 0.36 <LLOD
*LLODs were calculated based on a signal 2.5 standard deviations above the zero calibrator. Median concentrations were determined by measuring 8 normal human serum samples. Both
parameters were established by Meso Scale Discovery. In the case of GM-CSF, IFN-γ, IL-2 and IL-1β the majority of samples had concentrations below the LLOD of the assay (Table 4). Based on the LLOD and the basal concentrations of these cytokines established by MSD it is not surprising that the Human ProInflammatory 9-Plex Ultra- Sensitive Multi-Spot® Assay was not sensitive enough to quantitate GM-CSF, IFN-γ, IL-2 and IL-1β in the majority of subjects. According to the manufacturer of the kit, the lowest concentrations of these four cytokines in healthy human serum are below the LLOD of the assay. In addition, the median concentrations of GM-CSF, IL-2 and IL-1β in normal human serum are below the LLOD of the assay. The median concentration of IFN-γ is 0.8 pg/mL.
Table 4. Percentage of Samples Below Detection Limits
Cytokine Samples BDL (%*) Samples In Range (%*) IL-8 0.0 100.0 TNF-α 0.8 99.2 IL-6 14.9 85.1 IL-10 16.4 83.6 IL-12 p70 50.7 49.3 GM-CSF 78.7 21.3 IFN-γ 80.5 19.5 IL-2 90.8 9.2 IL-1β 96.2 3.8 *Percentages are based on subjects from all sample populations and data from all time points.
10
DRAFT PENDING Distribution A. Approved for public release (PA); distribution unlimited. (PA Case No: 88ABW-2014-XXXX Date Cleared

11
DRAFT PENDING Distribution A. Approved for public release (PA); distribution unlimited. (PA Case No: 88ABW-2014-XXXX Date Cleared
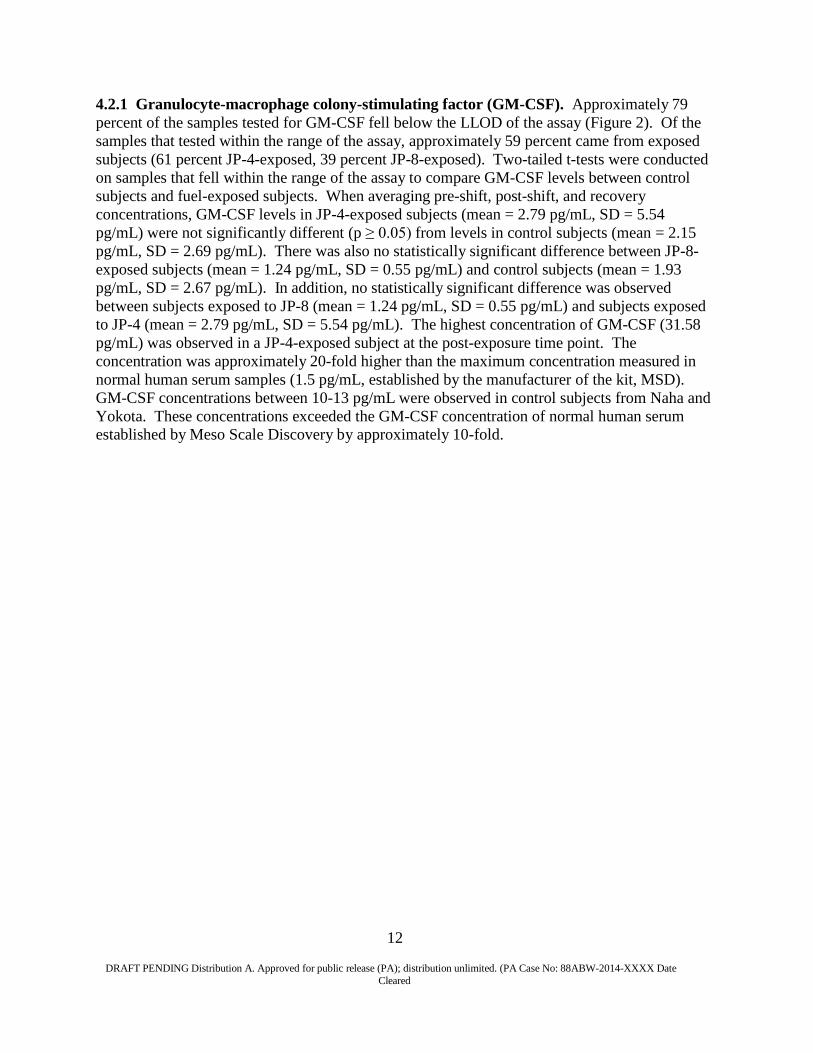
4.2.1 Granulocyte-macrophage colony-stimulating factor (GM-CSF). Approximately 79 percent of the samples tested for GM-CSF fell below the LLOD of the assay (Figure 2). Of the samples that tested within the range of the assay, approximately 59 percent came from exposed subjects (61 percent JP-4-exposed, 39 percent JP-8-exposed). Two-tailed t-tests were conducted on samples that fell within the range of the assay to compare GM-CSF levels between control subjects and fuel-exposed subjects. When averaging pre-shift, post-shift, and recovery concentrations, GM-CSF levels in JP-4-exposed subjects (mean = 2.79 pg/mL, SD = 5.54 pg/mL) were not significantly different (p ≥ 0.05) from levels in control subjects (mean = 2.15 pg/mL, SD = 2.69 pg/mL). There was also no statistically significant difference between JP-8- exposed subjects (mean = 1.24 pg/mL, SD = 0.55 pg/mL) and control subjects (mean = 1.93 pg/mL, SD = 2.67 pg/mL). In addition, no statistically significant difference was observed between subjects exposed to JP-8 (mean = 1.24 pg/mL, SD = 0.55 pg/mL) and subjects exposed to JP-4 (mean = 2.79 pg/mL, SD = 5.54 pg/mL). The highest concentration of GM-CSF (31.58 pg/mL) was observed in a JP-4-exposed subject at the post-exposure time point. The concentration was approximately 20-fold higher than the maximum concentration measured in normal human serum samples (1.5 pg/mL, established by the manufacturer of the kit, MSD). GM-CSF concentrations between 10-13 pg/mL were observed in control subjects from Naha and Yokota. These concentrations exceeded the GM-CSF concentration of normal human serum established by Meso Scale Discovery by approximately 10-fold.
12
DRAFT PENDING Distribution A. Approved for public release (PA); distribution unlimited. (PA Case No: 88ABW-2014-XXXX Date Cleared
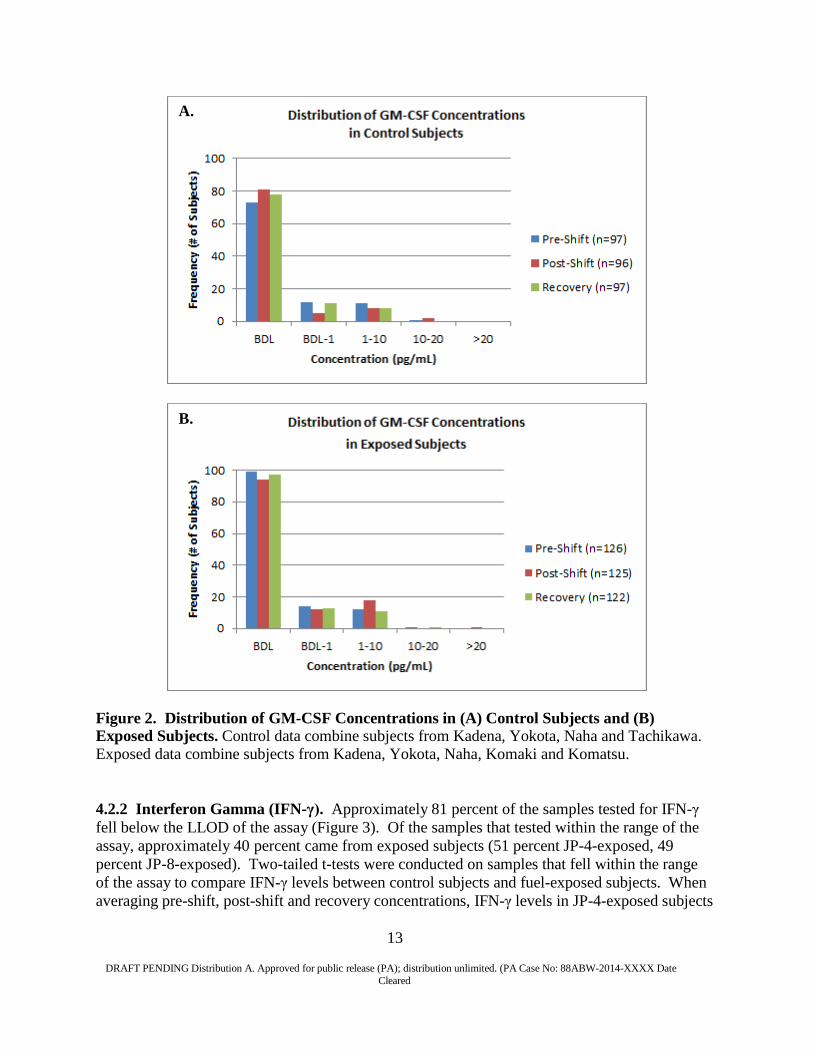
Figure 2. Distribution of GM-CSF Concentrations in (A) Control Subjects and (B) Exposed Subjects. Control data combine subjects from Kadena, Yokota, Naha and Tachikawa. Exposed data combine subjects from Kadena, Yokota, Naha, Komaki and Komatsu.
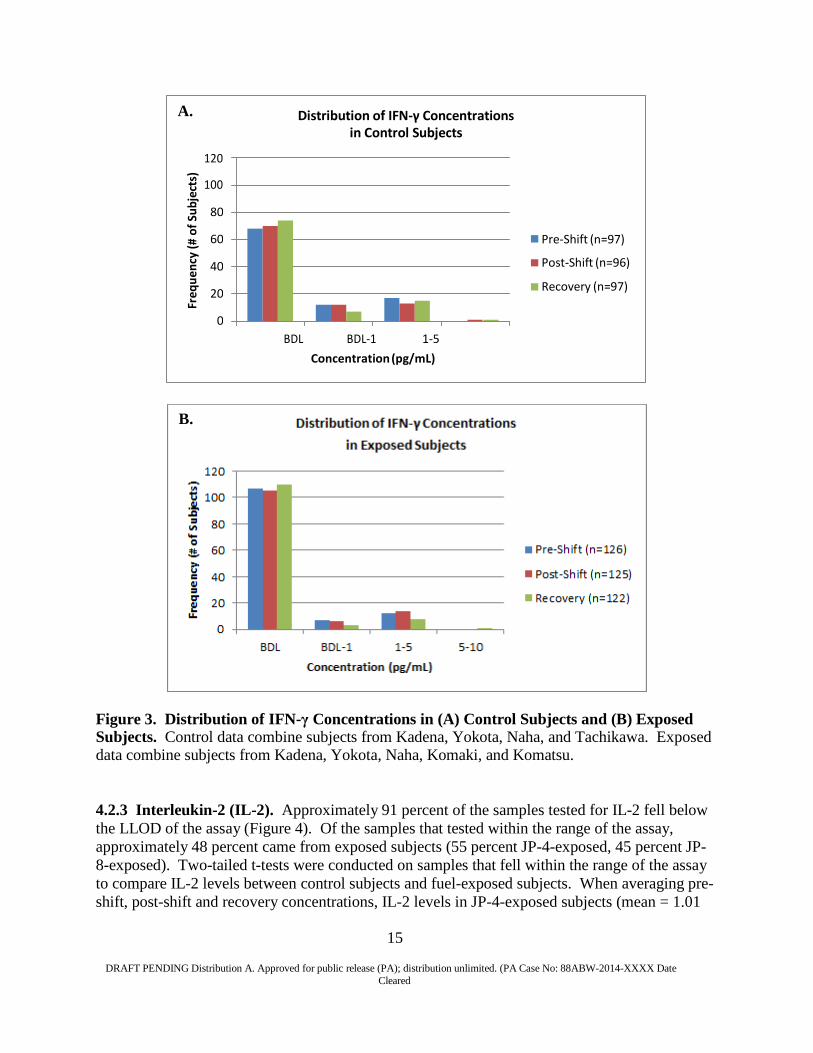
4.2.2 Interferon Gamma (IFN-γ). Approximately 81 percent of the samples tested for IFN-γ fell below the LLOD of the assay (Figure 3). Of the samples that tested within the range of the assay, approximately 40 percent came from exposed subjects (51 percent JP-4-exposed, 49 percent JP-8-exposed). Two-tailed t-tests were conducted on samples that fell within the range of the assay to compare IFN-γ levels between control subjects and fuel-exposed subjects. When averaging pre-shift, post-shift and recovery concentrations, IFN-γ levels in JP-4-exposed subjects
B.
A.
13
DRAFT PENDING Distribution A. Approved for public release (PA); distribution unlimited. (PA Case No: 88ABW-2014-XXXX Date Cleared
(mean = 1.90 pg/mL, SD = 1.99 pg/mL) were not significantly different (p ≥ 0.05) from levels in control subjects (mean = 1.28 pg/mL , SD = 0.83 pg/mL). There was also no statistically significant difference between JP-8-exposed subjects (mean = 1.43 pg/mL, SD = 0.55 pg/mL) and control subjects (mean = 1.69 pg/mL, SD = 1.35 pg/mL). In addition, no statistically significant difference was observed between subjects exposed to JP-8 (mean = 1.43 pg/mL, SD = 0.55 pg/mL) and subjects exposed to JP-4 (mean = 1.90 pg/mL, SD = 1.99 pg/mL). The highest concentration of IFN-γ (approximately 10 pg/mL) was observed in a JP-4-exposed subject at the recovery time point. IFN-γ concentrations between 5-8 pg/mL were observed in control subjects from Kadena. These concentrations were approximately 5-fold higher than the maximum concentration in normal human serum samples (1.6 pg/mL) established by Meso Scale Discovery.
14
DRAFT PENDING Distribution A. Approved for public release (PA); distribution unlimited. (PA Case No: 88ABW-2014-XXXX Date Cleared
A. Distribution of IFN-γ Concentrations in Control Subjects
120
100
80
60
40
20
0
Pre-Shift (n=97)
Post-Shift (n=96)
Recovery (n=97)
BDL BDL-1 1-5 Concentration (pg/mL)
Figure 3. Distribution of IFN-γ Concentrations in (A) Control Subjects and (B) Exposed Subjects. Control data combine subjects from Kadena, Yokota, Naha, and Tachikawa. Exposed data combine subjects from Kadena, Yokota, Naha, Komaki, and Komatsu.
4.2.3 Interleukin-2 (IL-2). Approximately 91 percent of the samples tested for IL-2 fell below the LLOD of the assay (Figure 4). Of the samples that tested within the range of the assay, approximately 48 percent came from exposed subjects (55 percent JP-4-exposed, 45 percent JP- 8-exposed). Two-tailed t-tests were conducted on samples that fell within the range of the assay to compare IL-2 levels between control subjects and fuel-exposed subjects. When averaging pre- shift, post-shift and recovery concentrations, IL-2 levels in JP-4-exposed subjects (mean = 1.01
B.
Freq
uenc
y (#
of S
ubje
cts)
15
DRAFT PENDING Distribution A. Approved for public release (PA); distribution unlimited. (PA Case No: 88ABW-2014-XXXX Date Cleared
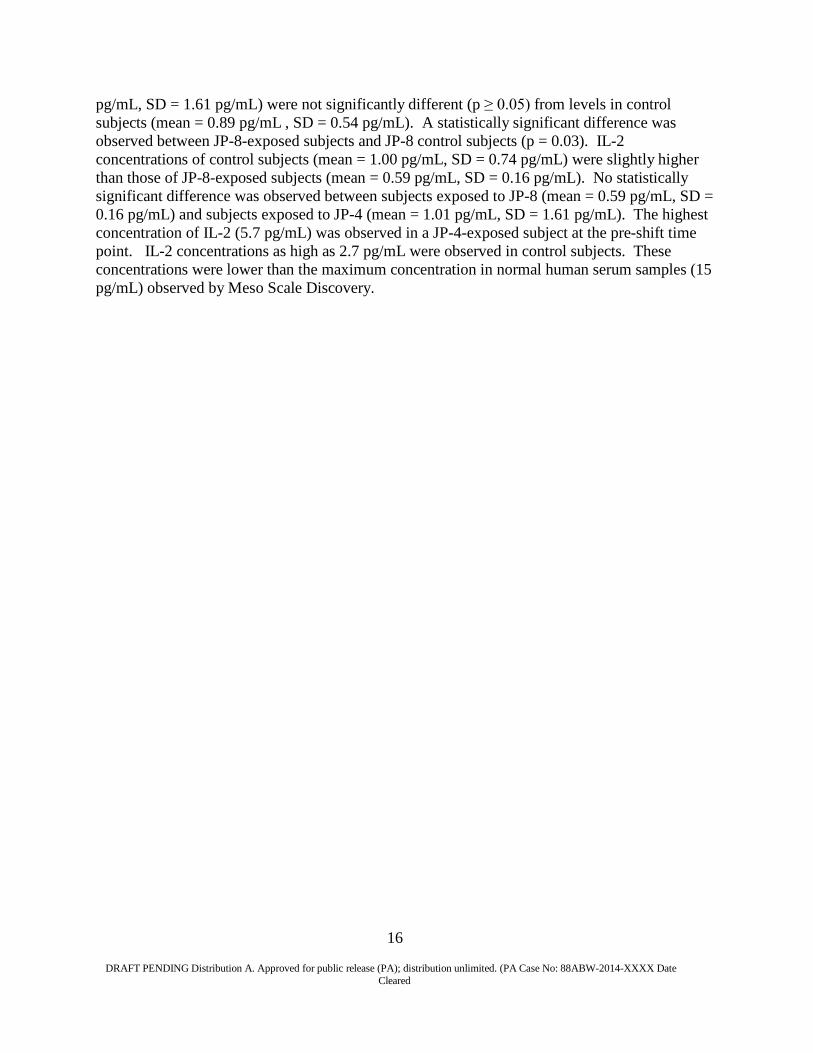
pg/mL, SD = 1.61 pg/mL) were not significantly different (p ≥ 0.05) from levels in control subjects (mean = 0.89 pg/mL , SD = 0.54 pg/mL). A statistically significant difference was observed between JP-8-exposed subjects and JP-8 control subjects (p = 0.03). IL-2 concentrations of control subjects (mean = 1.00 pg/mL, SD = 0.74 pg/mL) were slightly higher than those of JP-8-exposed subjects (mean = 0.59 pg/mL, SD = 0.16 pg/mL). No statistically significant difference was observed between subjects exposed to JP-8 (mean = 0.59 pg/mL, SD = 0.16 pg/mL) and subjects exposed to JP-4 (mean = 1.01 pg/mL, SD = 1.61 pg/mL). The highest concentration of IL-2 (5.7 pg/mL) was observed in a JP-4-exposed subject at the pre-shift time point. IL-2 concentrations as high as 2.7 pg/mL were observed in control subjects. These concentrations were lower than the maximum concentration in normal human serum samples (15 pg/mL) observed by Meso Scale Discovery.
16
DRAFT PENDING Distribution A. Approved for public release (PA); distribution unlimited. (PA Case No: 88ABW-2014-XXXX Date Cleared

Figure 4. Distribution of IL-2 Concentrations in (A) Control Subjects and (B) exposed Subjects. Control data combine subjects from Kadena, Yokota, Naha and Tachikawa. Exposed data combine subjects from Kadena, Yokota, Naha, Komaki and Komatsu.
4.2.4 Interleukin-1 Beta (IL-1β). Approximately 96 percent of the samples tested for IL-1β fell below the LLOD of the assay (Figure 5). Of the samples that tested within the range of the assay, approximately 64 percent came from exposed subjects (75 percent JP-4-exposed, 25 percent JP-8-exposed). Two-tailed t-tests were conducted on samples that fell within the range of the assay to compare IL-1β levels between control subjects and fuel-exposed subjects. IL-1β levels in JP-4-exposed subjects (mean = 1.95 pg/mL, SD = 1.74 pg/mL) were significantly
B.
A.
17
DRAFT PENDING Distribution A. Approved for public release (PA); distribution unlimited. (PA Case No: 88ABW-2014-XXXX Date Cleared
higher (p = 0.013) than levels in control subjects (mean = 0.45 pg/mL , SD = 0.08 pg/mL). A t- test was not conducted to compare IL-1β levels between JP-8-exposed subjects (mean = 2.95 pg/mL, SD = 1.18 pg/mL) and control subjects because only one control subject had IL-1β levels that fell within the range of the assay (1.24 pg/mL). No statistically significant difference was observed between subjects exposed to JP-8 (mean = 2.95 pg/mL, SD = 1.81 pg/mL) and subjects exposed to JP-4 (mean = 1.95 pg/mL, SD = 1.74 pg/mL). The highest concentration of IL-1β (6.3 pg/mL) was observed in a JP-4-exposed subject at the post-shift time point. IL-1β concentrations as high as 1.2 pg/mL were observed in control subjects. Both concentrations were higher than the maximum concentration in normal human serum samples (0.53 pg/mL) observed by Meso Scale Discovery.
18
DRAFT PENDING Distribution A. Approved for public release (PA); distribution unlimited. (PA Case No: 88ABW-2014-XXXX Date Cleared
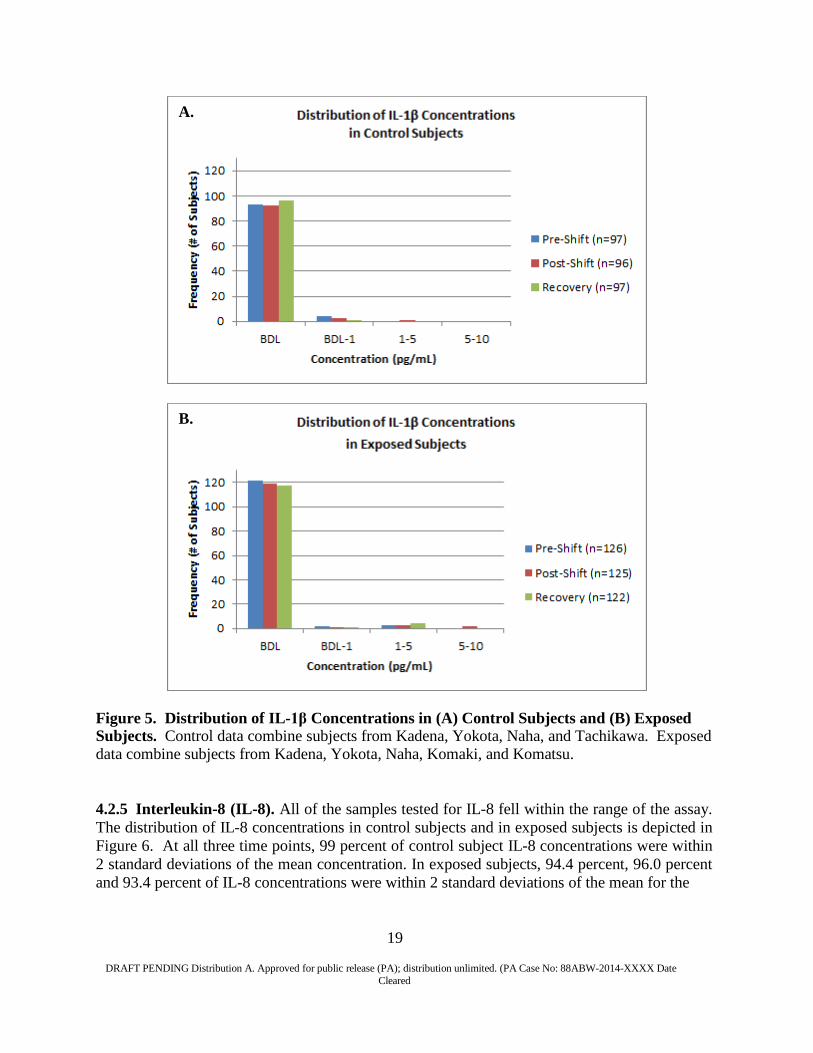
Figure 5. Distribution of IL-1β Concentrations in (A) Control Subjects and (B) Exposed Subjects. Control data combine subjects from Kadena, Yokota, Naha, and Tachikawa. Exposed data combine subjects from Kadena, Yokota, Naha, Komaki, and Komatsu.
4.2.5 Interleukin-8 (IL-8). All of the samples tested for IL-8 fell within the range of the assay. The distribution of IL-8 concentrations in control subjects and in exposed subjects is depicted in Figure 6. At all three time points, 99 percent of control subject IL-8 concentrations were within 2 standard deviations of the mean concentration. In exposed subjects, 94.4 percent, 96.0 percent and 93.4 percent of IL-8 concentrations were within 2 standard deviations of the mean for the
B.
A.
19
DRAFT PENDING Distribution A. Approved for public release (PA); distribution unlimited. (PA Case No: 88ABW-2014-XXXX Date Cleared
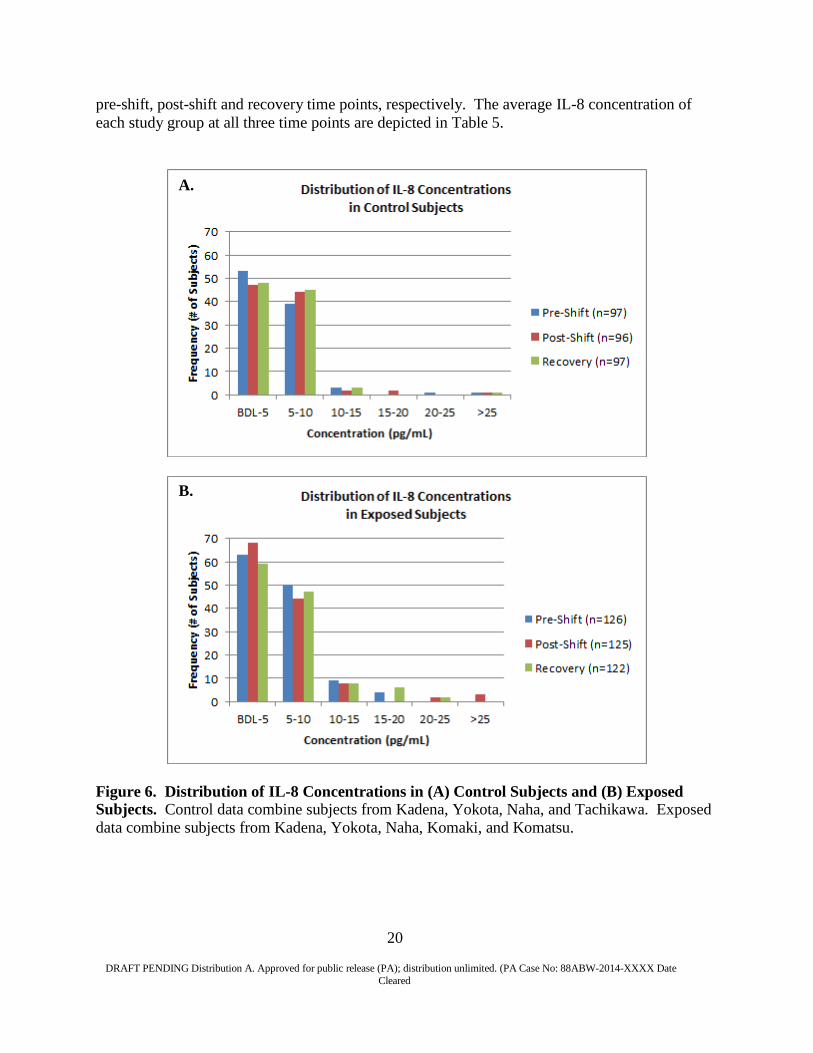
pre-shift, post-shift and recovery time points, respectively. The average IL-8 concentration of each study group at all three time points are depicted in Table 5.
Figure 6. Distribution of IL-8 Concentrations in (A) Control Subjects and (B) Exposed Subjects. Control data combine subjects from Kadena, Yokota, Naha, and Tachikawa. Exposed data combine subjects from Kadena, Yokota, Naha, Komaki, and Komatsu.
B.
A.
20
DRAFT PENDING Distribution A. Approved for public release (PA); distribution unlimited. (PA Case No: 88ABW-2014-XXXX Date Cleared
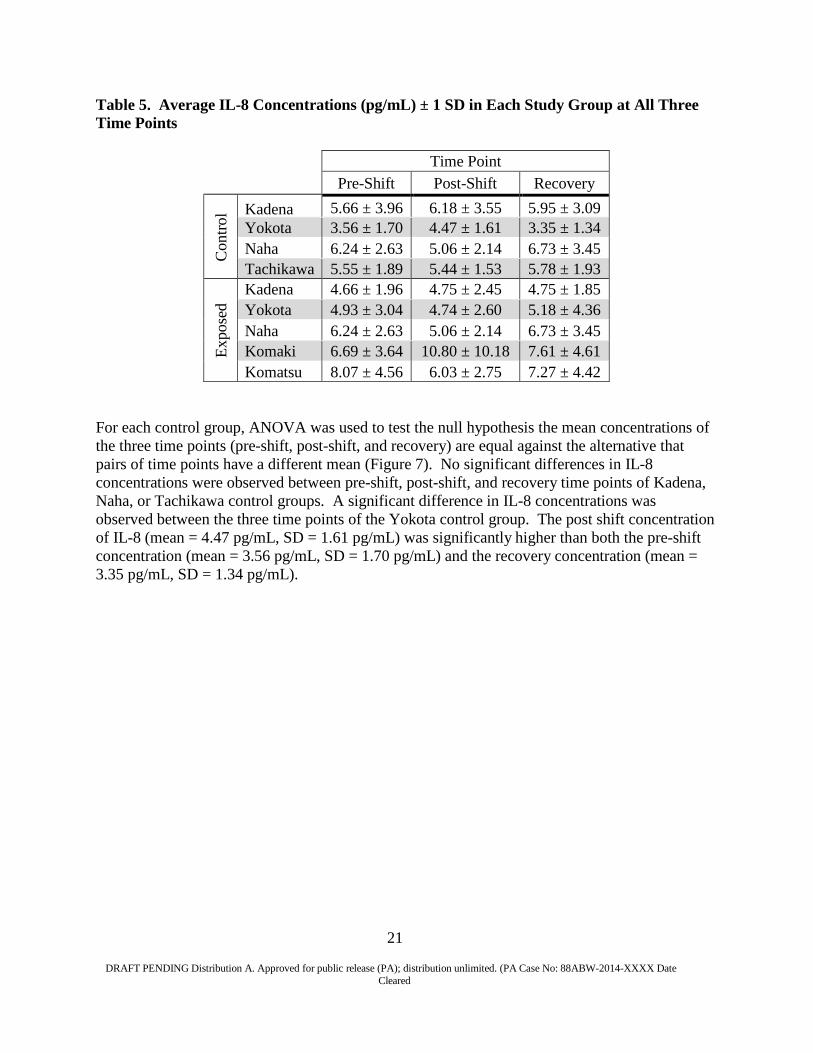
Table 5. Average IL-8 Concentrations (pg/mL) ± 1 SD in Each Study Group at All Three Time Points
Time Point
Pre-Shift Post-Shift Recovery
Con
trol Kadena 5.66 ± 3.96 6.18 ± 3.55 5.95 ± 3.09
Yokota 3.56 ± 1.70 4.47 ± 1.61 3.35 ± 1.34 Naha 6.24 ± 2.63 5.06 ± 2.14 6.73 ± 3.45 Tachikawa 5.55 ± 1.89 5.44 ± 1.53 5.78 ± 1.93
Expo
sed
Kadena 4.66 ± 1.96 4.75 ± 2.45 4.75 ± 1.85 Yokota 4.93 ± 3.04 4.74 ± 2.60 5.18 ± 4.36 Naha 6.24 ± 2.63 5.06 ± 2.14 6.73 ± 3.45 Komaki 6.69 ± 3.64 10.80 ± 10.18 7.61 ± 4.61 Komatsu 8.07 ± 4.56 6.03 ± 2.75 7.27 ± 4.42
For each control group, ANOVA was used to test the null hypothesis the mean concentrations of the three time points (pre-shift, post-shift, and recovery) are equal against the alternative that pairs of time points have a different mean (Figure 7). No significant differences in IL-8 concentrations were observed between pre-shift, post-shift, and recovery time points of Kadena, Naha, or Tachikawa control groups. A significant difference in IL-8 concentrations was observed between the three time points of the Yokota control group. The post shift concentration of IL-8 (mean = 4.47 pg/mL, SD = 1.61 pg/mL) was significantly higher than both the pre-shift concentration (mean = 3.56 pg/mL, SD = 1.70 pg/mL) and the recovery concentration (mean = 3.35 pg/mL, SD = 1.34 pg/mL).
21
DRAFT PENDING Distribution A. Approved for public release (PA); distribution unlimited. (PA Case No: 88ABW-2014-XXXX Date Cleared

Figure 7. IL-8 Concentrations in the Four Control Groups at the Pre-shift, Post-shift and Recovery Time Points. The average post-shift IL-8 concentration of the Yokota control group was higher than the pre-shift and recovery concentrations. Error bars = 1 SD.
The mean concentrations of the pre-shift, post-shift, and recovery time points were also compared for each exposure group. No significant differences were observed in IL-8 concentrations between pre-shift, post-shift and recovery time points of Kadena, Yokota, Naha, Komaki,- or Komatsu exposure groups (Figure 8).
22
DRAFT PENDING Distribution A. Approved for public release (PA); distribution unlimited. (PA Case No: 88ABW-2014-XXXX Date Cleared
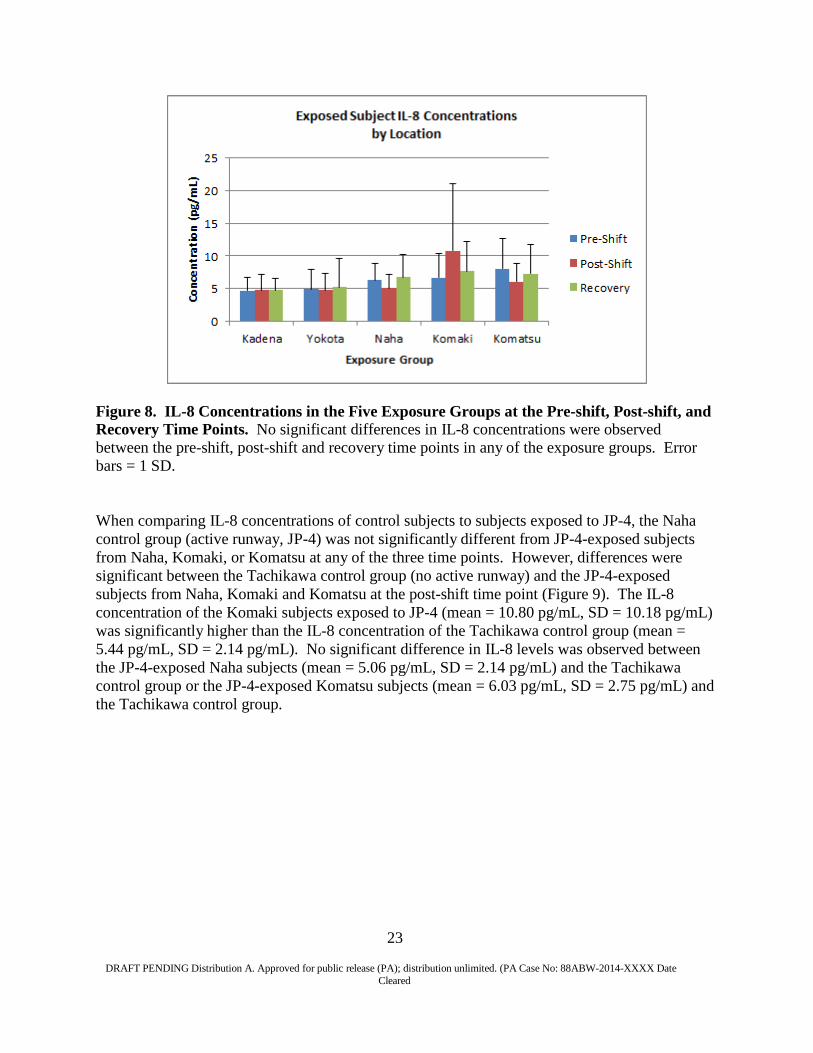
Figure 8. IL-8 Concentrations in the Five Exposure Groups at the Pre-shift, Post-shift, and Recovery Time Points. No significant differences in IL-8 concentrations were observed between the pre-shift, post-shift and recovery time points in any of the exposure groups. Error bars = 1 SD.
When comparing IL-8 concentrations of control subjects to subjects exposed to JP-4, the Naha control group (active runway, JP-4) was not significantly different from JP-4-exposed subjects from Naha, Komaki, or Komatsu at any of the three time points. However, differences were significant between the Tachikawa control group (no active runway) and the JP-4-exposed subjects from Naha, Komaki and Komatsu at the post-shift time point (Figure 9). The IL-8 concentration of the Komaki subjects exposed to JP-4 (mean = 10.80 pg/mL, SD = 10.18 pg/mL) was significantly higher than the IL-8 concentration of the Tachikawa control group (mean = 5.44 pg/mL, SD = 2.14 pg/mL). No significant difference in IL-8 levels was observed between the JP-4-exposed Naha subjects (mean = 5.06 pg/mL, SD = 2.14 pg/mL) and the Tachikawa control group or the JP-4-exposed Komatsu subjects (mean = 6.03 pg/mL, SD = 2.75 pg/mL) and the Tachikawa control group.
23
DRAFT PENDING Distribution A. Approved for public release (PA); distribution unlimited. (PA Case No: 88ABW-2014-XXXX Date Cleared
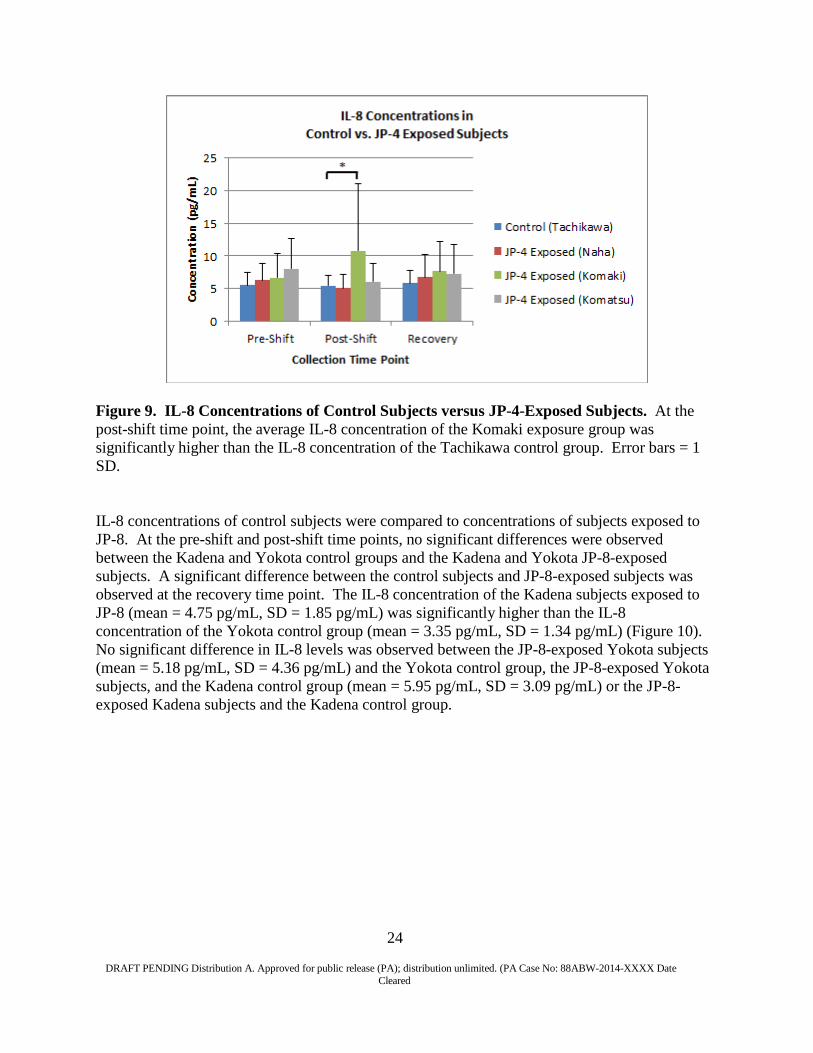
Figure 9. IL-8 Concentrations of Control Subjects versus JP-4-Exposed Subjects. At the post-shift time point, the average IL-8 concentration of the Komaki exposure group was significantly higher than the IL-8 concentration of the Tachikawa control group. Error bars = 1 SD.
IL-8 concentrations of control subjects were compared to concentrations of subjects exposed to JP-8. At the pre-shift and post-shift time points, no significant differences were observed between the Kadena and Yokota control groups and the Kadena and Yokota JP-8-exposed subjects. A significant difference between the control subjects and JP-8-exposed subjects was observed at the recovery time point. The IL-8 concentration of the Kadena subjects exposed to JP-8 (mean = 4.75 pg/mL, SD = 1.85 pg/mL) was significantly higher than the IL-8 concentration of the Yokota control group (mean = 3.35 pg/mL, SD = 1.34 pg/mL) (Figure 10). No significant difference in IL-8 levels was observed between the JP-8-exposed Yokota subjects (mean = 5.18 pg/mL, SD = 4.36 pg/mL) and the Yokota control group, the JP-8-exposed Yokota subjects, and the Kadena control group (mean = 5.95 pg/mL, SD = 3.09 pg/mL) or the JP-8- exposed Kadena subjects and the Kadena control group.
24
DRAFT PENDING Distribution A. Approved for public release (PA); distribution unlimited. (PA Case No: 88ABW-2014-XXXX Date Cleared

Figure 10. IL-8 Concentrations of Control Subjects versus JP-8-Exposed Subjects. At the recovery time point, the average IL-8 concentration of the Kadena exposure group was significantly higher than the IL-8 concentration of the Yokota control group. Error bars = 1 SD.
In order to investigate differences in IL-8 concentrations between JP-4-exposed subjects and JP- 8-exposed subjects, data from all three JP-4 exposure groups (Naha, Komatsu and Komaki) were averaged and compared to averaged data from the two JP-8 exposure groups (Kadena and Yokota). Significant differences in IL-8 concentrations were observed between JP-4-exposed subjects and JP-8-exposed subjects. At the pre-shift time point, the average IL-8 concentration of JP-4-exposed subjects from Naha, Komatsu and Komaki (mean = 6.86 pg/mL, SD = 3.58 pg/mL) was significantly higher than the average IL-8 concentration of JP-8-exposed subjects from Kadena and Yokota (mean = 4.75 pg/mL, SD = 2.34 pg/mL) (Figure 11). The same was observed at the post-shift and recovery time points. At the post-shift time point, the average IL-8 concentration of JP-4-exposed subjects (mean = 7.42 pg/mL, SD = 6.91 pg/mL) was significantly higher than the average IL-8 concentration of JP-8-exposed subjects (mean = 4.75 pg/mL, SD = 2.48 pg/mL). At the recovery time point, the average IL-8 concentration of JP-4- exposed subjects (mean = 7.19 pg/mL, SD = 4.11 pg/mL) was significantly higher than the average IL-8 concentration of JP-8-exposed subjects from (mean = 4.90 pg/mL, SD = 2.93 pg/mL).
25
DRAFT PENDING Distribution A. Approved for public release (PA); distribution unlimited. (PA Case No: 88ABW-2014-XXXX Date Cleared
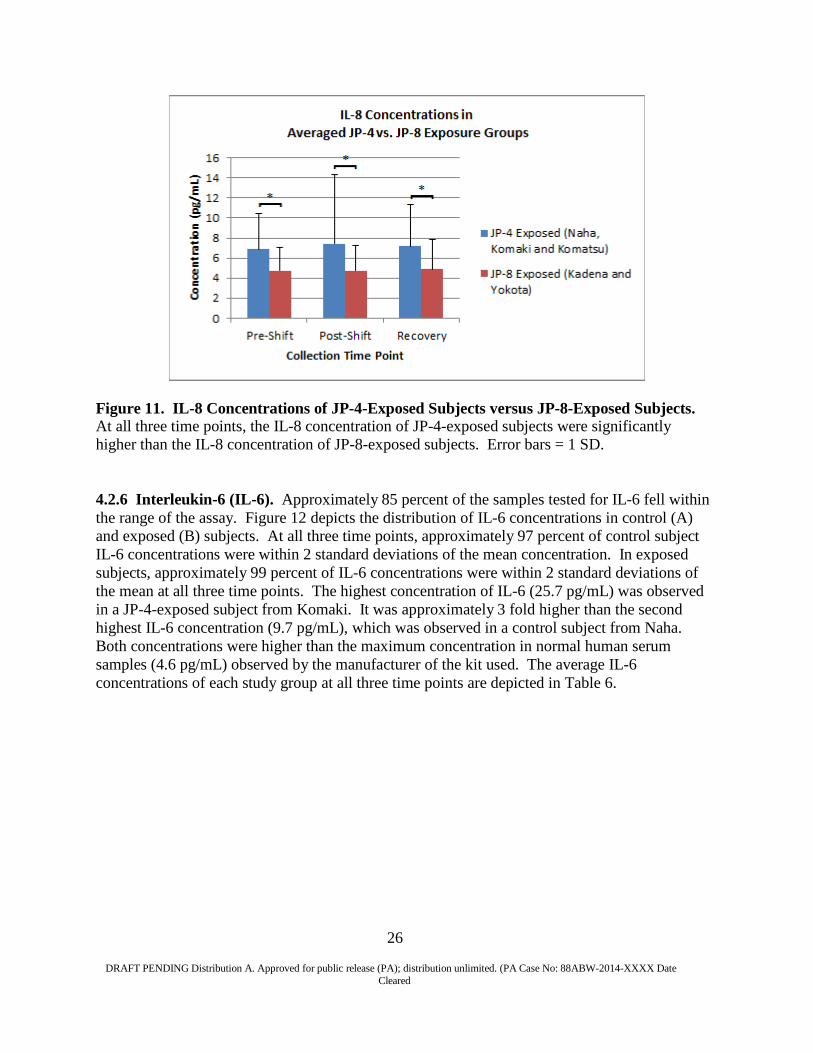
Figure 11. IL-8 Concentrations of JP-4-Exposed Subjects versus JP-8-Exposed Subjects. At all three time points, the IL-8 concentration of JP-4-exposed subjects were significantly higher than the IL-8 concentration of JP-8-exposed subjects. Error bars = 1 SD.
4.2.6 Interleukin-6 (IL-6). Approximately 85 percent of the samples tested for IL-6 fell within the range of the assay. Figure 12 depicts the distribution of IL-6 concentrations in control (A) and exposed (B) subjects. At all three time points, approximately 97 percent of control subject IL-6 concentrations were within 2 standard deviations of the mean concentration. In exposed subjects, approximately 99 percent of IL-6 concentrations were within 2 standard deviations of the mean at all three time points. The highest concentration of IL-6 (25.7 pg/mL) was observed in a JP-4-exposed subject from Komaki. It was approximately 3 fold higher than the second highest IL-6 concentration (9.7 pg/mL), which was observed in a control subject from Naha. Both concentrations were higher than the maximum concentration in normal human serum samples (4.6 pg/mL) observed by the manufacturer of the kit used. The average IL-6 concentrations of each study group at all three time points are depicted in Table 6.
26
DRAFT PENDING Distribution A. Approved for public release (PA); distribution unlimited. (PA Case No: 88ABW-2014-XXXX Date Cleared
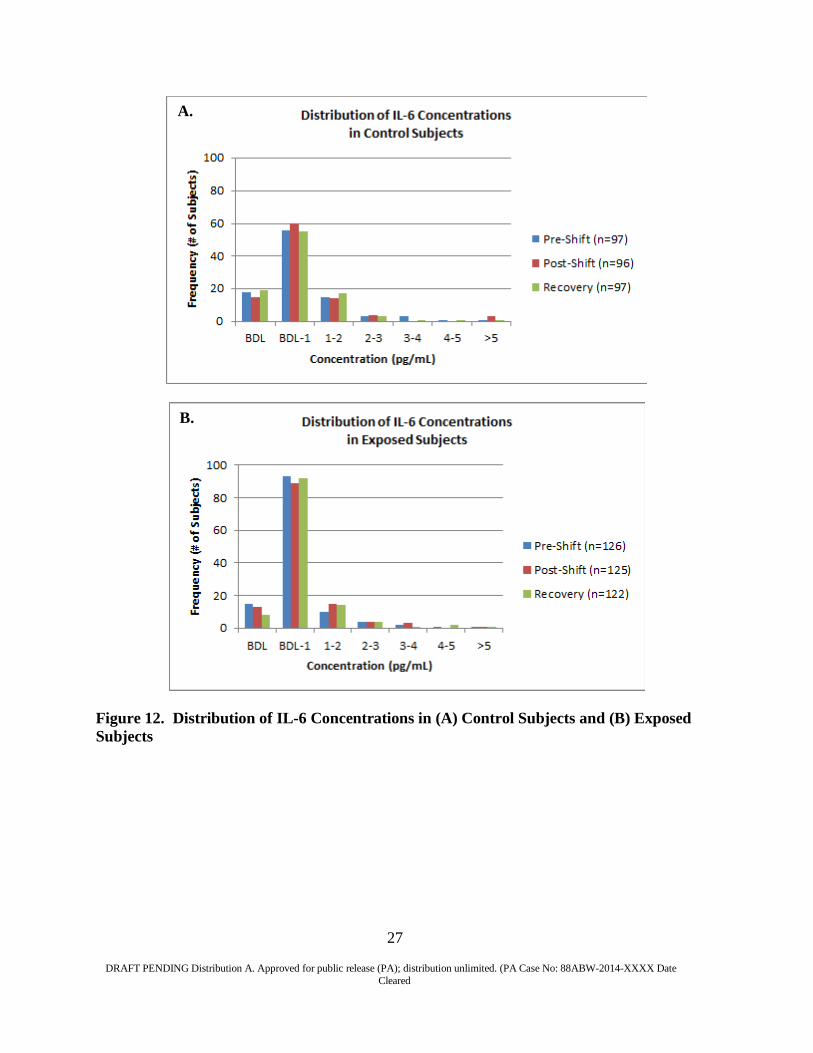
Figure 12. Distribution of IL-6 Concentrations in (A) Control Subjects and (B) Exposed Subjects
B.
A.
27
DRAFT PENDING Distribution A. Approved for public release (PA); distribution unlimited. (PA Case No: 88ABW-2014-XXXX Date Cleared
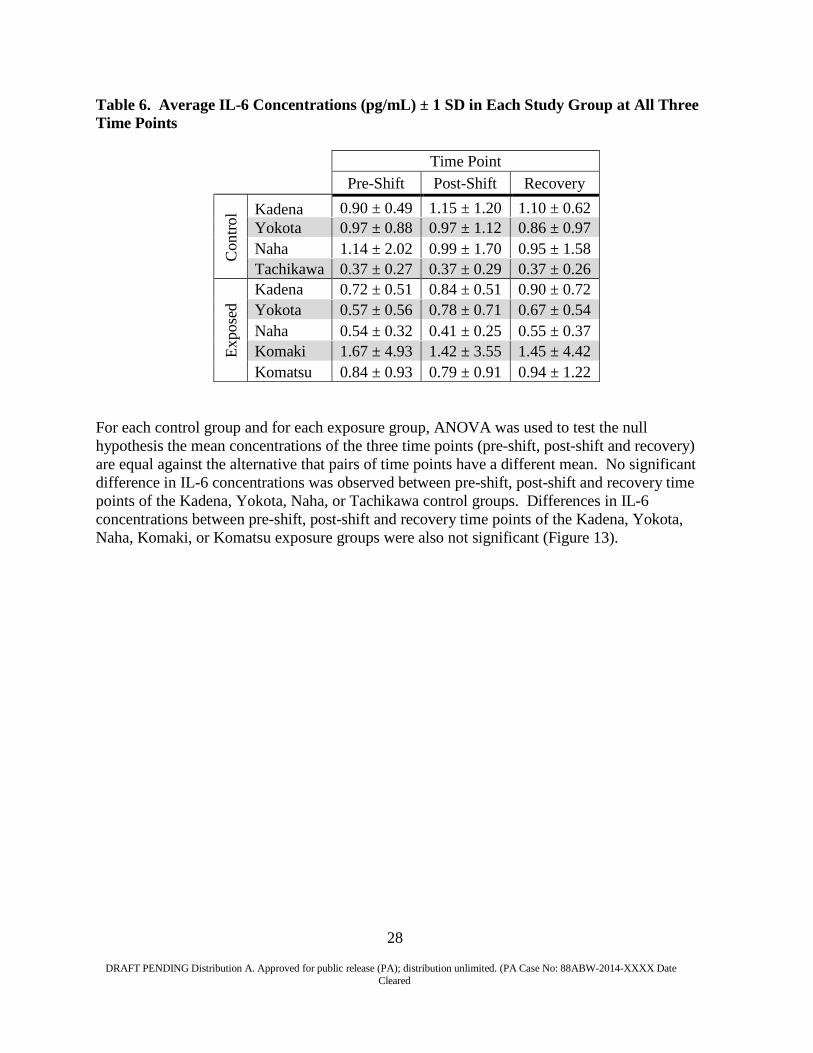
Table 6. Average IL-6 Concentrations (pg/mL) ± 1 SD in Each Study Group at All Three Time Points
Time Point
Pre-Shift Post-Shift Recovery
Con
trol Kadena 0.90 ± 0.49 1.15 ± 1.20 1.10 ± 0.62
Yokota 0.97 ± 0.88 0.97 ± 1.12 0.86 ± 0.97 Naha 1.14 ± 2.02 0.99 ± 1.70 0.95 ± 1.58 Tachikawa 0.37 ± 0.27 0.37 ± 0.29 0.37 ± 0.26
Expo
sed
Kadena 0.72 ± 0.51 0.84 ± 0.51 0.90 ± 0.72 Yokota 0.57 ± 0.56 0.78 ± 0.71 0.67 ± 0.54 Naha 0.54 ± 0.32 0.41 ± 0.25 0.55 ± 0.37 Komaki 1.67 ± 4.93 1.42 ± 3.55 1.45 ± 4.42 Komatsu 0.84 ± 0.93 0.79 ± 0.91 0.94 ± 1.22
For each control group and for each exposure group, ANOVA was used to test the null hypothesis the mean concentrations of the three time points (pre-shift, post-shift and recovery) are equal against the alternative that pairs of time points have a different mean. No significant difference in IL-6 concentrations was observed between pre-shift, post-shift and recovery time points of the Kadena, Yokota, Naha, or Tachikawa control groups. Differences in IL-6 concentrations between pre-shift, post-shift and recovery time points of the Kadena, Yokota, Naha, Komaki, or Komatsu exposure groups were also not significant (Figure 13).
28
DRAFT PENDING Distribution A. Approved for public release (PA); distribution unlimited. (PA Case No: 88ABW-2014-XXXX Date Cleared
Figure 13. IL-6 Concentrations in (A) Control Groups and (B) Exposure Groups at the Pre-shift, Post-shift, and Recovery Time Points. No significant difference in IL-6 concentrations between the three time points was observed in any of the study groups. Error bars = 1 SD.
IL-6 concentrations were compared between control subjects and subjects exposed to JP-4 or JP- 8. No significant differences were observed between the Naha control group (active runway, JP- 4) and JP-4-exposed subjects from Naha, Komaki or Komatsu at any of the three time points (Figure 14A). In addition, no significant differences were observed between the Tachikawa control group (no active runway) and the JP-4-exposed subjects from Naha, Komaki and
B.
A.
29
DRAFT PENDING Distribution A. Approved for public release (PA); distribution unlimited. (PA Case No: 88ABW-2014-XXXX Date Cleared
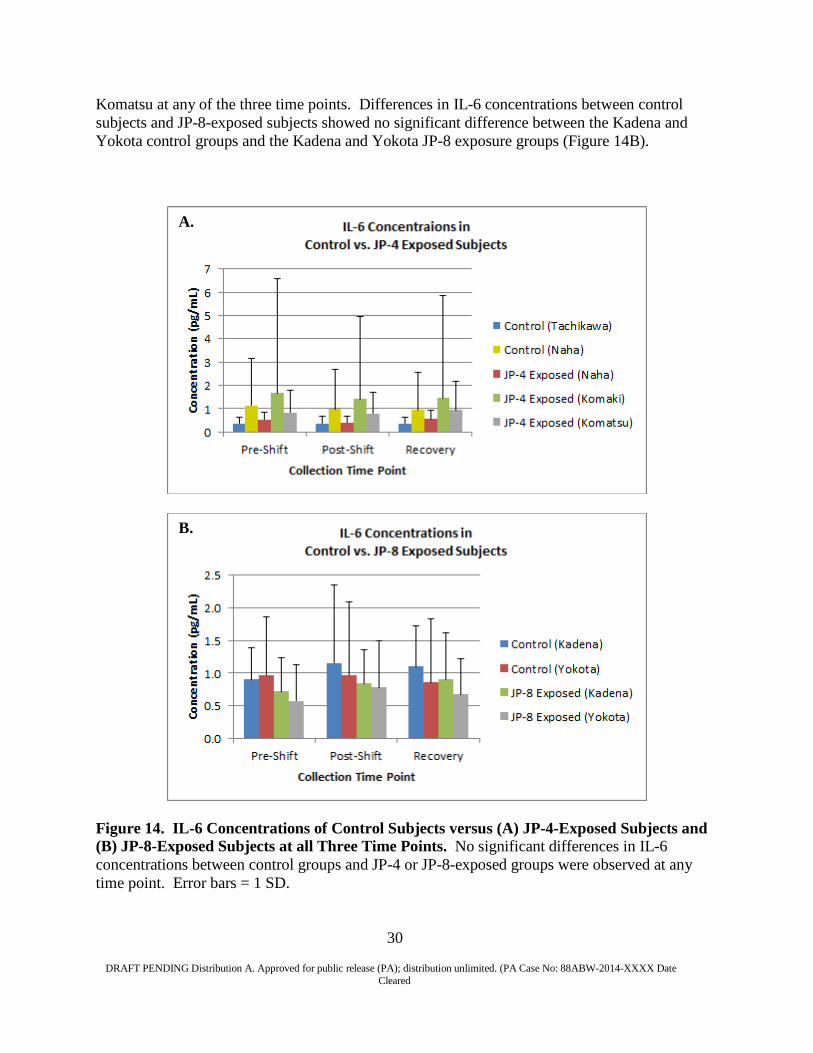
Komatsu at any of the three time points. Differences in IL-6 concentrations between control subjects and JP-8-exposed subjects showed no significant difference between the Kadena and Yokota control groups and the Kadena and Yokota JP-8 exposure groups (Figure 14B).
Figure 14. IL-6 Concentrations of Control Subjects versus (A) JP-4-Exposed Subjects and (B) JP-8-Exposed Subjects at all Three Time Points. No significant differences in IL-6 concentrations between control groups and JP-4 or JP-8-exposed groups were observed at any time point. Error bars = 1 SD.
B.
A.
30
DRAFT PENDING Distribution A. Approved for public release (PA); distribution unlimited. (PA Case No: 88ABW-2014-XXXX Date Cleared
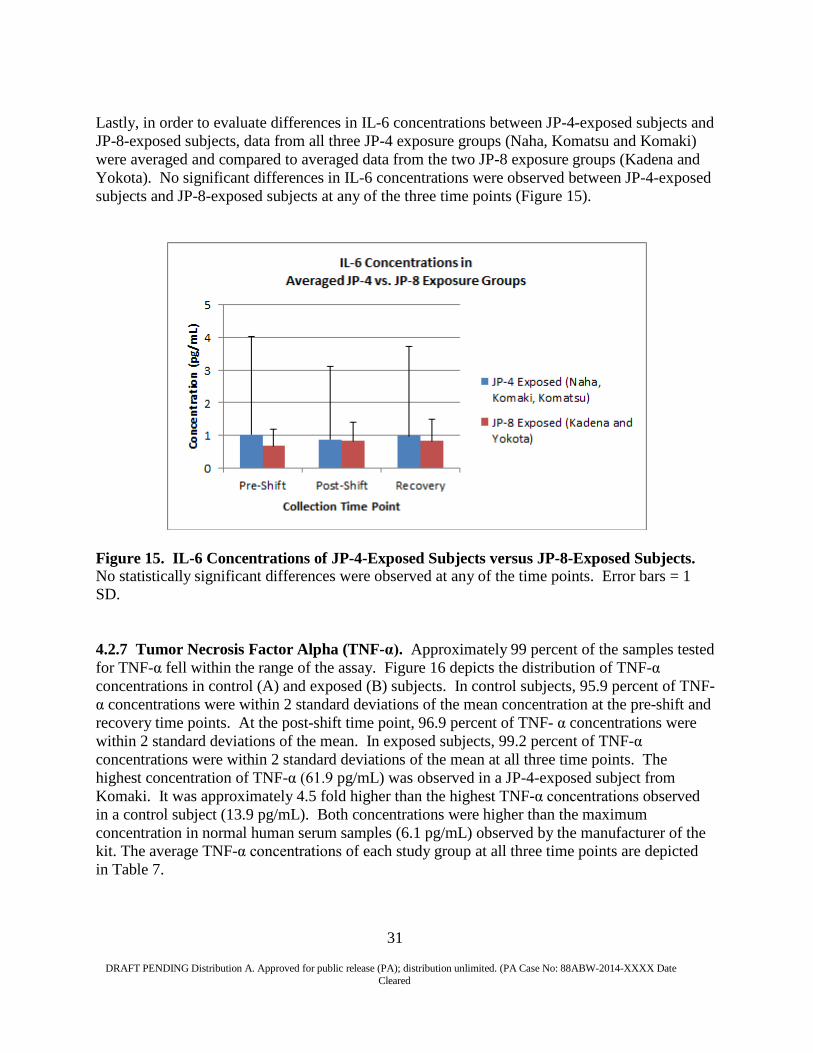
Lastly, in order to evaluate differences in IL-6 concentrations between JP-4-exposed subjects and JP-8-exposed subjects, data from all three JP-4 exposure groups (Naha, Komatsu and Komaki) were averaged and compared to averaged data from the two JP-8 exposure groups (Kadena and Yokota). No significant differences in IL-6 concentrations were observed between JP-4-exposed subjects and JP-8-exposed subjects at any of the three time points (Figure 15).
Figure 15. IL-6 Concentrations of JP-4-Exposed Subjects versus JP-8-Exposed Subjects. No statistically significant differences were observed at any of the time points. Error bars = 1 SD.
4.2.7 Tumor Necrosis Factor Alpha (TNF-α). Approximately 99 percent of the samples tested for TNF-α fell within the range of the assay. Figure 16 depicts the distribution of TNF-α concentrations in control (A) and exposed (B) subjects. In control subjects, 95.9 percent of TNF- α concentrations were within 2 standard deviations of the mean concentration at the pre-shift and recovery time points. At the post-shift time point, 96.9 percent of TNF- α concentrations were within 2 standard deviations of the mean. In exposed subjects, 99.2 percent of TNF-α concentrations were within 2 standard deviations of the mean at all three time points. The highest concentration of TNF-α (61.9 pg/mL) was observed in a JP-4-exposed subject from Komaki. It was approximately 4.5 fold higher than the highest TNF-α concentrations observed in a control subject (13.9 pg/mL). Both concentrations were higher than the maximum concentration in normal human serum samples (6.1 pg/mL) observed by the manufacturer of the kit. The average TNF-α concentrations of each study group at all three time points are depicted in Table 7.
31
DRAFT PENDING Distribution A. Approved for public release (PA); distribution unlimited. (PA Case No: 88ABW-2014-XXXX Date Cleared
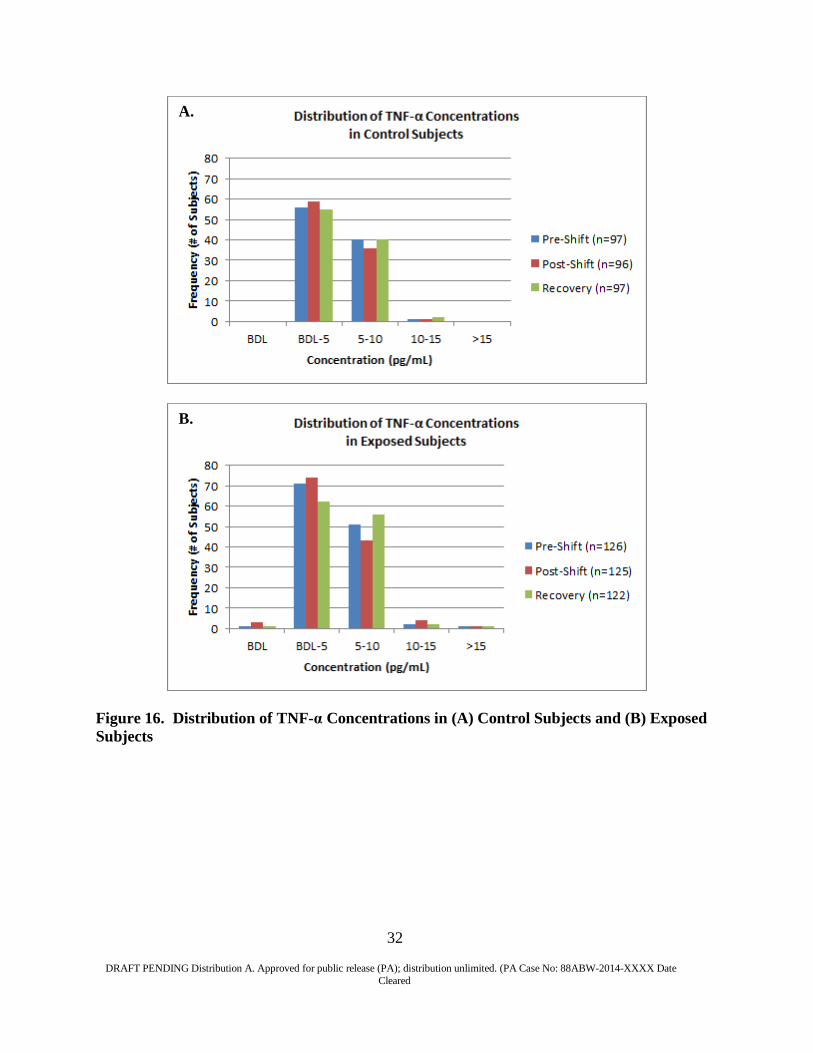
Figure 16. Distribution of TNF-α Concentrations in (A) Control Subjects and (B) Exposed Subjects
B.
A.
32
DRAFT PENDING Distribution A. Approved for public release (PA); distribution unlimited. (PA Case No: 88ABW-2014-XXXX Date Cleared
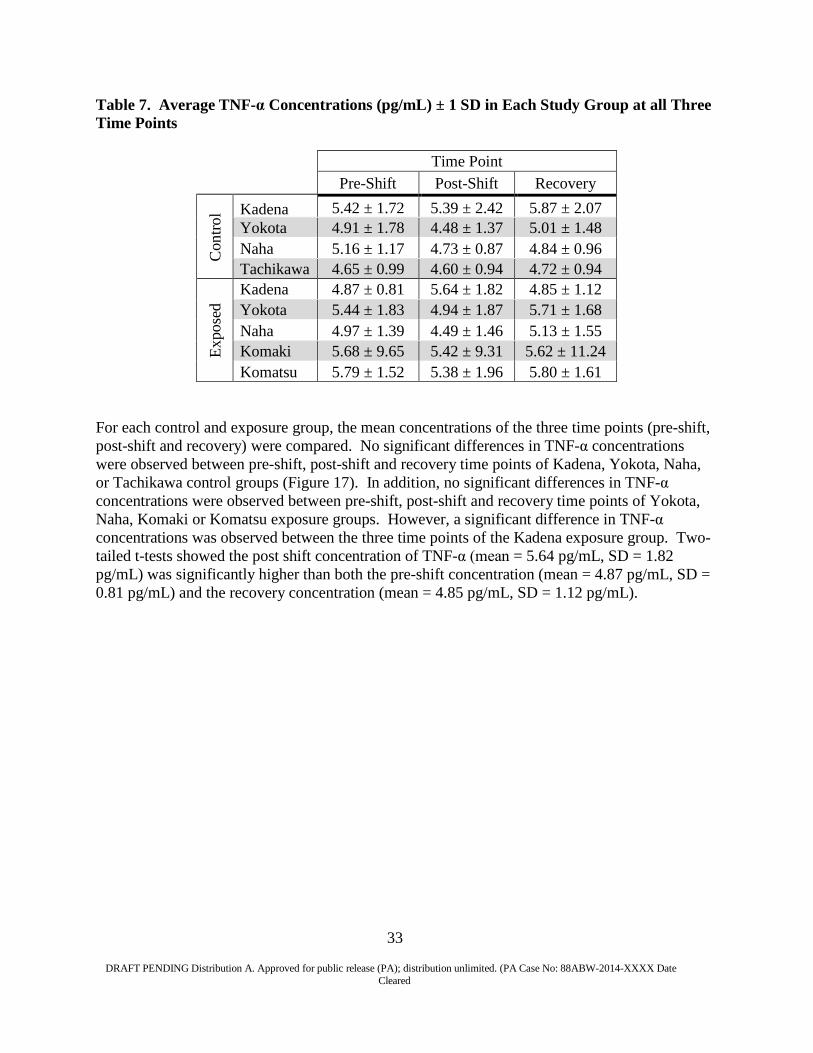
Table 7. Average TNF-α Concentrations (pg/mL) ± 1 SD in Each Study Group at all Three Time Points
Time Point
Pre-Shift Post-Shift Recovery
Con
trol Kadena 5.42 ± 1.72 5.39 ± 2.42 5.87 ± 2.07
Yokota 4.91 ± 1.78 4.48 ± 1.37 5.01 ± 1.48 Naha 5.16 ± 1.17 4.73 ± 0.87 4.84 ± 0.96 Tachikawa 4.65 ± 0.99 4.60 ± 0.94 4.72 ± 0.94
Expo
sed
Kadena 4.87 ± 0.81 5.64 ± 1.82 4.85 ± 1.12 Yokota 5.44 ± 1.83 4.94 ± 1.87 5.71 ± 1.68 Naha 4.97 ± 1.39 4.49 ± 1.46 5.13 ± 1.55 Komaki 5.68 ± 9.65 5.42 ± 9.31 5.62 ± 11.24 Komatsu 5.79 ± 1.52 5.38 ± 1.96 5.80 ± 1.61
For each control and exposure group, the mean concentrations of the three time points (pre-shift, post-shift and recovery) were compared. No significant differences in TNF-α concentrations were observed between pre-shift, post-shift and recovery time points of Kadena, Yokota, Naha, or Tachikawa control groups (Figure 17). In addition, no significant differences in TNF-α concentrations were observed between pre-shift, post-shift and recovery time points of Yokota, Naha, Komaki or Komatsu exposure groups. However, a significant difference in TNF-α concentrations was observed between the three time points of the Kadena exposure group. Two- tailed t-tests showed the post shift concentration of TNF-α (mean = 5.64 pg/mL, SD = 1.82 pg/mL) was significantly higher than both the pre-shift concentration (mean = 4.87 pg/mL, SD = 0.81 pg/mL) and the recovery concentration (mean = 4.85 pg/mL, SD = 1.12 pg/mL).
33
DRAFT PENDING Distribution A. Approved for public release (PA); distribution unlimited. (PA Case No: 88ABW-2014-XXXX Date Cleared
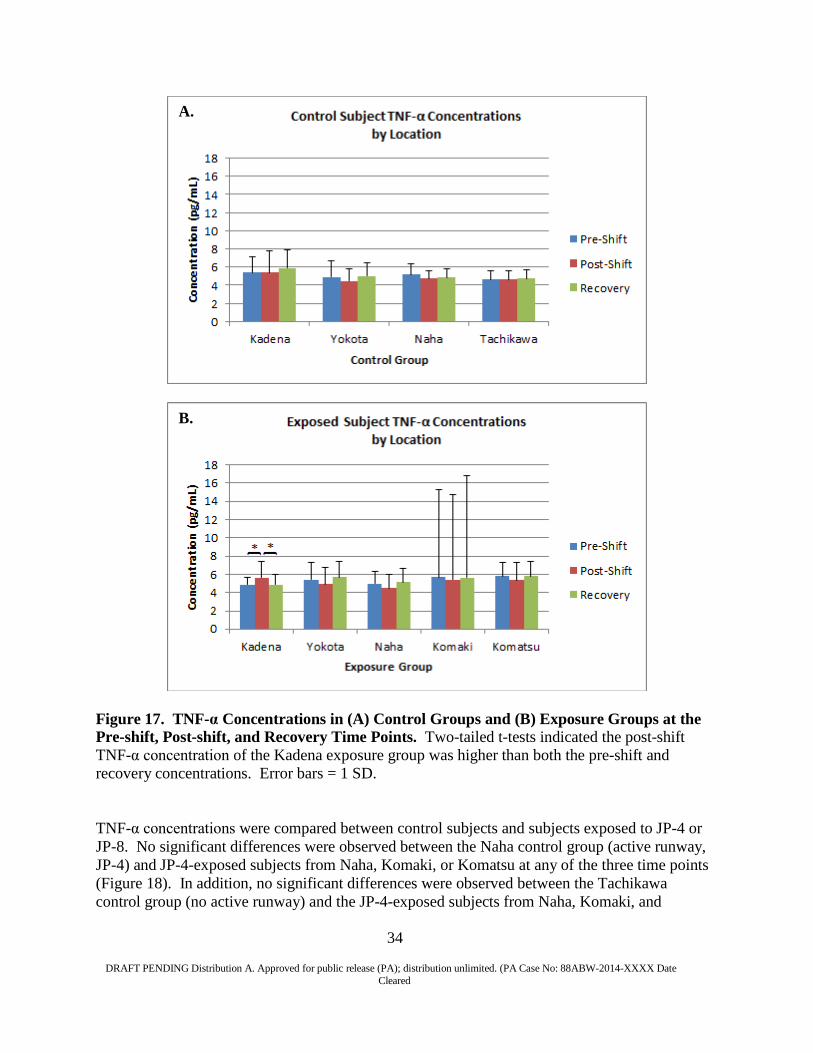
Figure 17. TNF-α Concentrations in (A) Control Groups and (B) Exposure Groups at the Pre-shift, Post-shift, and Recovery Time Points. Two-tailed t-tests indicated the post-shift TNF-α concentration of the Kadena exposure group was higher than both the pre-shift and recovery concentrations. Error bars = 1 SD.
TNF-α concentrations were compared between control subjects and subjects exposed to JP-4 or JP-8. No significant differences were observed between the Naha control group (active runway, JP-4) and JP-4-exposed subjects from Naha, Komaki, or Komatsu at any of the three time points (Figure 18). In addition, no significant differences were observed between the Tachikawa control group (no active runway) and the JP-4-exposed subjects from Naha, Komaki, and
B.
A.
34
DRAFT PENDING Distribution A. Approved for public release (PA); distribution unlimited. (PA Case No: 88ABW-2014-XXXX Date Cleared

Komatsu at any of the three time points. When comparing TNF-α concentrations in control subjects to subjects exposed to JP-8, no significant differences were observed between the Kadena control group and either JP-8 exposure group or the Yokota control group and either JP- 8 exposure group.
Figure 18. TNF-α Concentrations of Control Subjects versus (A) JP-4-Exposed Subjects and (B) JP-8-Exposed Subjects. No significant differences in TNF-α concentrations between control groups and JP-4 or JP-8-exposed groups were observed. Error bars = 1 SD.
B.
A.
35
DRAFT PENDING Distribution A. Approved for public release (PA); distribution unlimited. (PA Case No: 88ABW-2014-XXXX Date Cleared
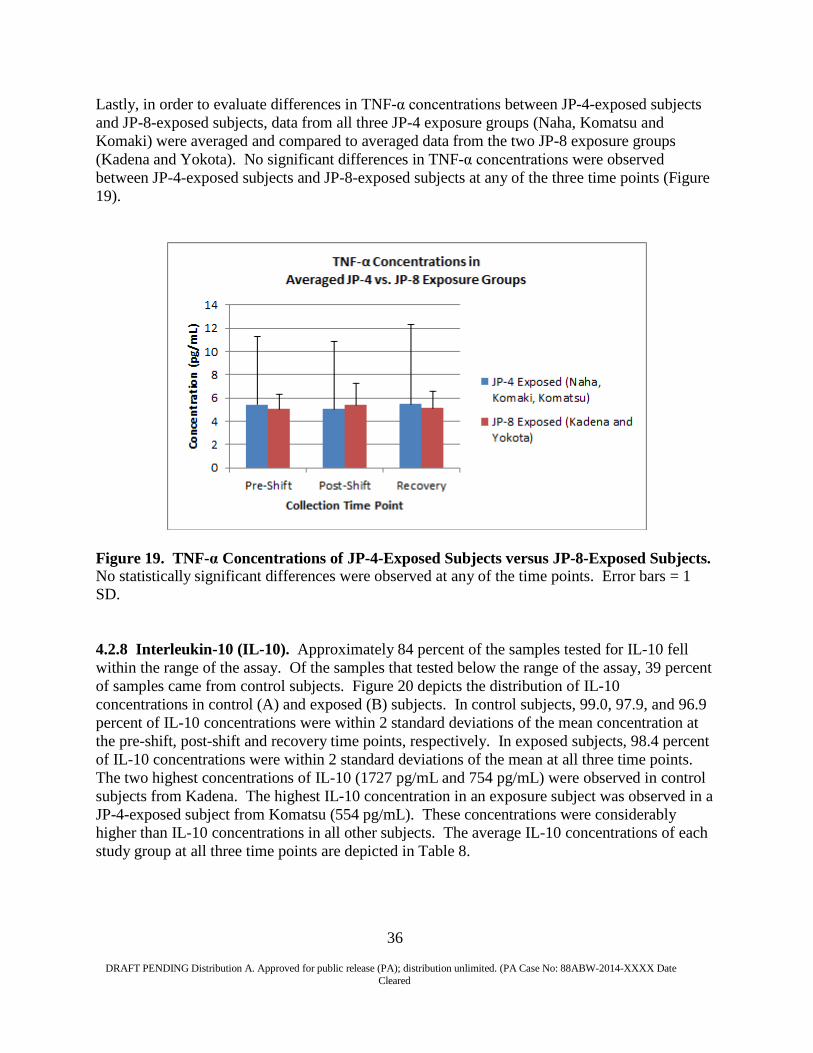
Lastly, in order to evaluate differences in TNF-α concentrations between JP-4-exposed subjects and JP-8-exposed subjects, data from all three JP-4 exposure groups (Naha, Komatsu and Komaki) were averaged and compared to averaged data from the two JP-8 exposure groups (Kadena and Yokota). No significant differences in TNF-α concentrations were observed between JP-4-exposed subjects and JP-8-exposed subjects at any of the three time points (Figure 19).
Figure 19. TNF-α Concentrations of JP-4-Exposed Subjects versus JP-8-Exposed Subjects. No statistically significant differences were observed at any of the time points. Error bars = 1 SD.
4.2.8 Interleukin-10 (IL-10). Approximately 84 percent of the samples tested for IL-10 fell within the range of the assay. Of the samples that tested below the range of the assay, 39 percent of samples came from control subjects. Figure 20 depicts the distribution of IL-10 concentrations in control (A) and exposed (B) subjects. In control subjects, 99.0, 97.9, and 96.9 percent of IL-10 concentrations were within 2 standard deviations of the mean concentration at the pre-shift, post-shift and recovery time points, respectively. In exposed subjects, 98.4 percent of IL-10 concentrations were within 2 standard deviations of the mean at all three time points. The two highest concentrations of IL-10 (1727 pg/mL and 754 pg/mL) were observed in control subjects from Kadena. The highest IL-10 concentration in an exposure subject was observed in a JP-4-exposed subject from Komatsu (554 pg/mL). These concentrations were considerably higher than IL-10 concentrations in all other subjects. The average IL-10 concentrations of each study group at all three time points are depicted in Table 8.
36
DRAFT PENDING Distribution A. Approved for public release (PA); distribution unlimited. (PA Case No: 88ABW-2014-XXXX Date Cleared

Figure 20. Distribution of IL-10 Concentrations in (A) Control Subjects and (B) Exposed Subjects
B.
A.
37
DRAFT PENDING Distribution A. Approved for public release (PA); distribution unlimited. (PA Case No: 88ABW-2014-XXXX Date Cleared

Table 8. Average IL-10 Concentrations (pg/mL) ± 1 SD in Each Study Group at All Three Time Points
Time Point
Pre-Shift Post-Shift Recovery C
ontro
l Kadena 86.95 ± 352.23 106.83 ± 327.32 64.37 ± 223.78 Yokota 14.8 ± 58.54 14.49 ± 57.30 14.48 ± 56.86 Naha 2.03 ± 3.40 1.81 ± 2.91 2.26 ± 3.48 Tachikawa 5.84 ± 10.16 5.06 ± 8.86 5.37 ± 9.06
Expo
sed
Kadena 8.67 ± 24.33 14.00 ± 48.16 7.60 ± 16.03 Yokota 1.84 ± 1.56 1.62 ± 1.40 2.05 ± 1.76 Naha 2.15 ± 4.48 2.09 ± 5.38 2.70 ± 6.78 Komaki 3.01 ± 6.74 2.62 ± 5.71 2.11 ± 3.83 Komatsu 31.57 ± 126.57 30.26 ± 121.52 24.78 ± 96.7
For each control group and each exposure group the mean concentrations of the three time points (pre-shift, post-shift and recovery) were compared. No significant differences were observed in IL-10 concentrations between pre-shift, post-shift, and recovery time points of Kadena, Yokota, Naha, or Tachikawa control groups (Figure 21). In addition, no significant differences were observed in IL-10 concentrations between pre-shift, post-shift and recovery time points of Kadena, Yokota, Naha, Komaki, or Komatsu exposure groups.
38
DRAFT PENDING Distribution A. Approved for public release (PA); distribution unlimited. (PA Case No: 88ABW-2014-XXXX Date Cleared

Figure 21. IL-10 Concentrations in (A) Control Groups and (B) Exposure Groups at the Pre-shift, Post-shift and Recovery Time Points. No significant differences in IL-10 concentrations between the three time points were observed in any of the study groups. Error bars = 1 SD.
IL-10 concentrations were compared between control subjects and subjects exposed to JP-4 or JP-8. No significant differences were observed between the Naha control group (active runway, JP-4) and JP-4-exposed subjects from Naha, Komaki, or Komatsu at any of the three time points (Figure 22). In addition, no significant differences were observed between the Tachikawa control group (no active runway) and the JP-4-exposed subjects from Naha, Komaki, and
B.
A.
39
DRAFT PENDING Distribution A. Approved for public release (PA); distribution unlimited. (PA Case No: 88ABW-2014-XXXX Date Cleared
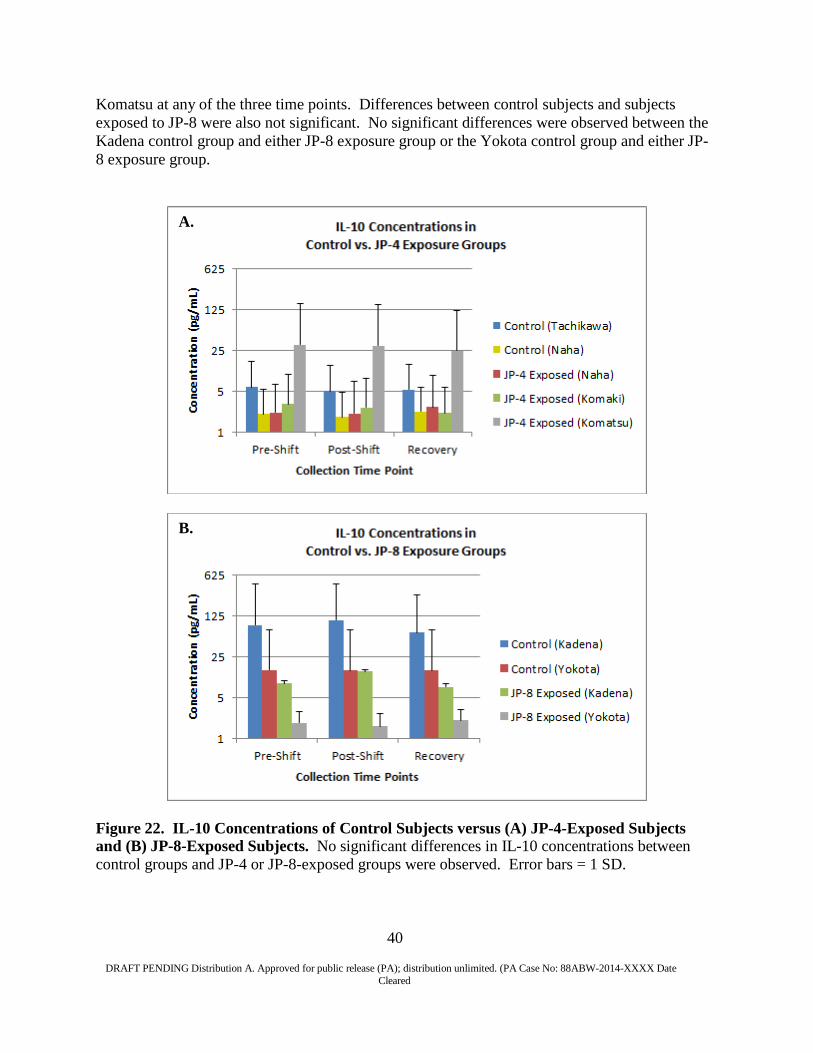
Komatsu at any of the three time points. Differences between control subjects and subjects exposed to JP-8 were also not significant. No significant differences were observed between the Kadena control group and either JP-8 exposure group or the Yokota control group and either JP- 8 exposure group.
Figure 22. IL-10 Concentrations of Control Subjects versus (A) JP-4-Exposed Subjects and (B) JP-8-Exposed Subjects. No significant differences in IL-10 concentrations between control groups and JP-4 or JP-8-exposed groups were observed. Error bars = 1 SD.
B.
A.
40
DRAFT PENDING Distribution A. Approved for public release (PA); distribution unlimited. (PA Case No: 88ABW-2014-XXXX Date Cleared
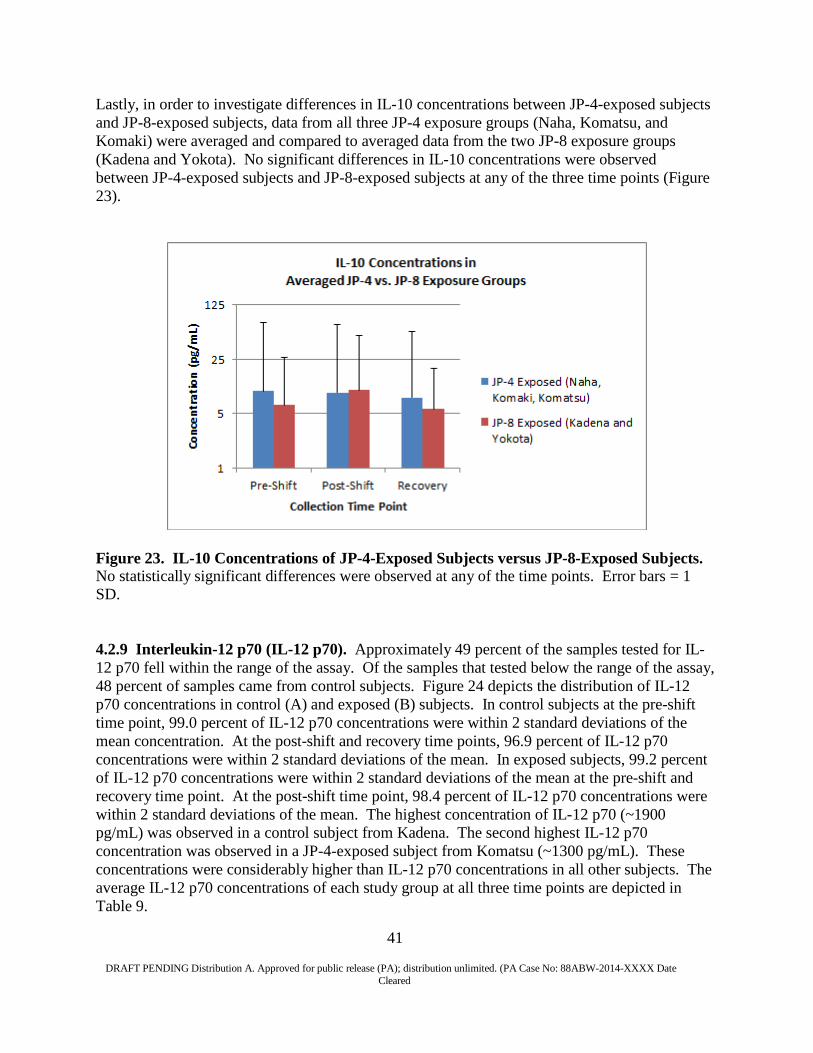
Lastly, in order to investigate differences in IL-10 concentrations between JP-4-exposed subjects and JP-8-exposed subjects, data from all three JP-4 exposure groups (Naha, Komatsu, and Komaki) were averaged and compared to averaged data from the two JP-8 exposure groups (Kadena and Yokota). No significant differences in IL-10 concentrations were observed between JP-4-exposed subjects and JP-8-exposed subjects at any of the three time points (Figure 23).
Figure 23. IL-10 Concentrations of JP-4-Exposed Subjects versus JP-8-Exposed Subjects. No statistically significant differences were observed at any of the time points. Error bars = 1 SD.
4.2.9 Interleukin-12 p70 (IL-12 p70). Approximately 49 percent of the samples tested for IL- 12 p70 fell within the range of the assay. Of the samples that tested below the range of the assay, 48 percent of samples came from control subjects. Figure 24 depicts the distribution of IL-12 p70 concentrations in control (A) and exposed (B) subjects. In control subjects at the pre-shift time point, 99.0 percent of IL-12 p70 concentrations were within 2 standard deviations of the mean concentration. At the post-shift and recovery time points, 96.9 percent of IL-12 p70 concentrations were within 2 standard deviations of the mean. In exposed subjects, 99.2 percent of IL-12 p70 concentrations were within 2 standard deviations of the mean at the pre-shift and recovery time point. At the post-shift time point, 98.4 percent of IL-12 p70 concentrations were within 2 standard deviations of the mean. The highest concentration of IL-12 p70 (~1900 pg/mL) was observed in a control subject from Kadena. The second highest IL-12 p70 concentration was observed in a JP-4-exposed subject from Komatsu (~1300 pg/mL). These concentrations were considerably higher than IL-12 p70 concentrations in all other subjects. The average IL-12 p70 concentrations of each study group at all three time points are depicted in Table 9.
41
DRAFT PENDING Distribution A. Approved for public release (PA); distribution unlimited. (PA Case No: 88ABW-2014-XXXX Date Cleared
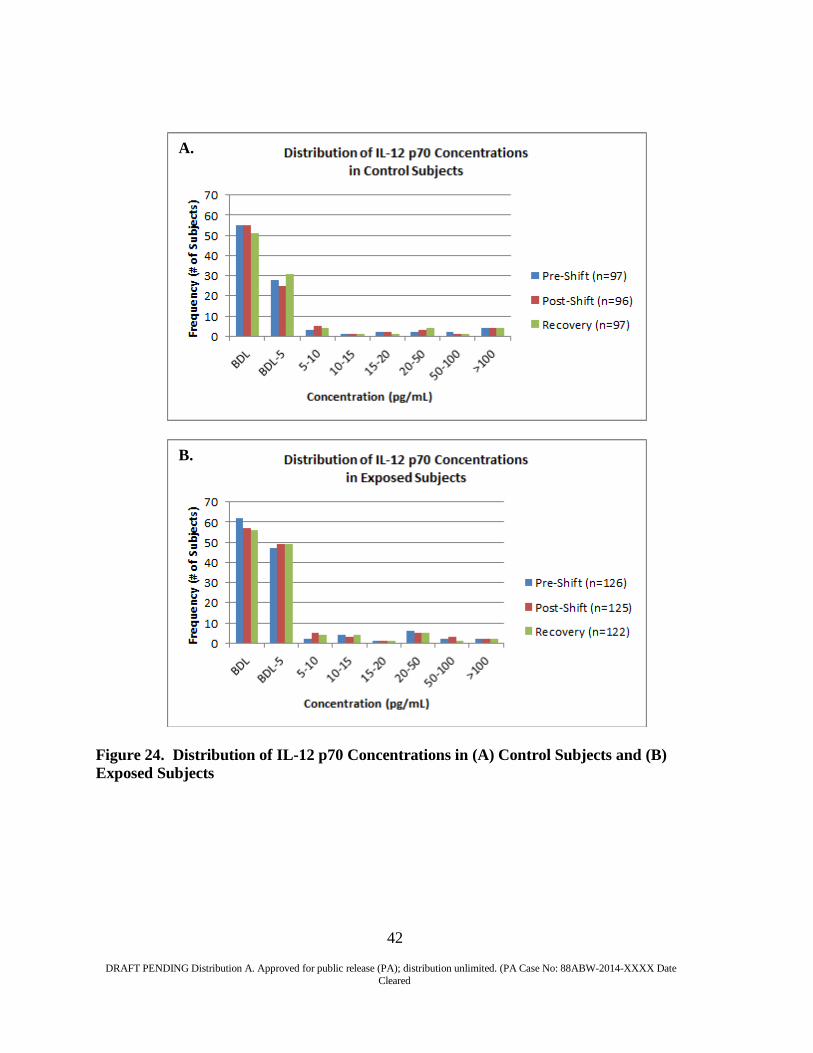
Figure 24. Distribution of IL-12 p70 Concentrations in (A) Control Subjects and (B) Exposed Subjects
B.
A.
42
DRAFT PENDING Distribution A. Approved for public release (PA); distribution unlimited. (PA Case No: 88ABW-2014-XXXX Date Cleared

Table 9. Average IL-12 p70 Concentrations (pg/mL) ± 1 SD in Each Study Group at All Three Time Points
Time Point
Pre-Shift Post-Shift Recovery C
ontro
l Kadena 145.16 ± 578.56 159.00 ± 480.63 114.45 ± 409.99 Yokota 29.91 ± 128.7 30.1 ± 127.94 26.26 ± 110.81 Naha 1.74 ± 4.26 1.61 ± 3.93 2.15 ± 4.71 Tachikawa 6.34 ± 14.1 6.6 ± 14.93 6.27 ± 13.72
Expo
sed
Kadena 13.68 ± 47.41 27.87 ± 113.09 11.69 ± 34.23 Yokota 1.05 ± 1.59 1.33 ± 2.15 1.05 ± 1.59 Naha 3.18 ± 9.64 3.10 ± 10.30 2.91 ± 9.44 Komaki 4.49 ± 12.92 3.77 ± 10.27 2.73 ± 6.67 Komatsu 86.29 ± 365.36 69.89 ± 295.09 62.07 ± 258.85
For each control and exposure group, the mean concentrations of the three time points (pre-shift, post-shift and recovery) were compared. No significant differences in IL-12 p70 concentrations were observed between pre-shift, post-shift and recovery time points of Kadena, Yokota, Naha, or Tachikawa control groups (Figure 25). In addition, no significant differences in IL-12 p70 concentrations were observed between pre-shift, post-shift and recovery time points of Kadena, Yokota, Naha, Komaki, or Komatsu exposure groups.
43
DRAFT PENDING Distribution A. Approved for public release (PA); distribution unlimited. (PA Case No: 88ABW-2014-XXXX Date Cleared
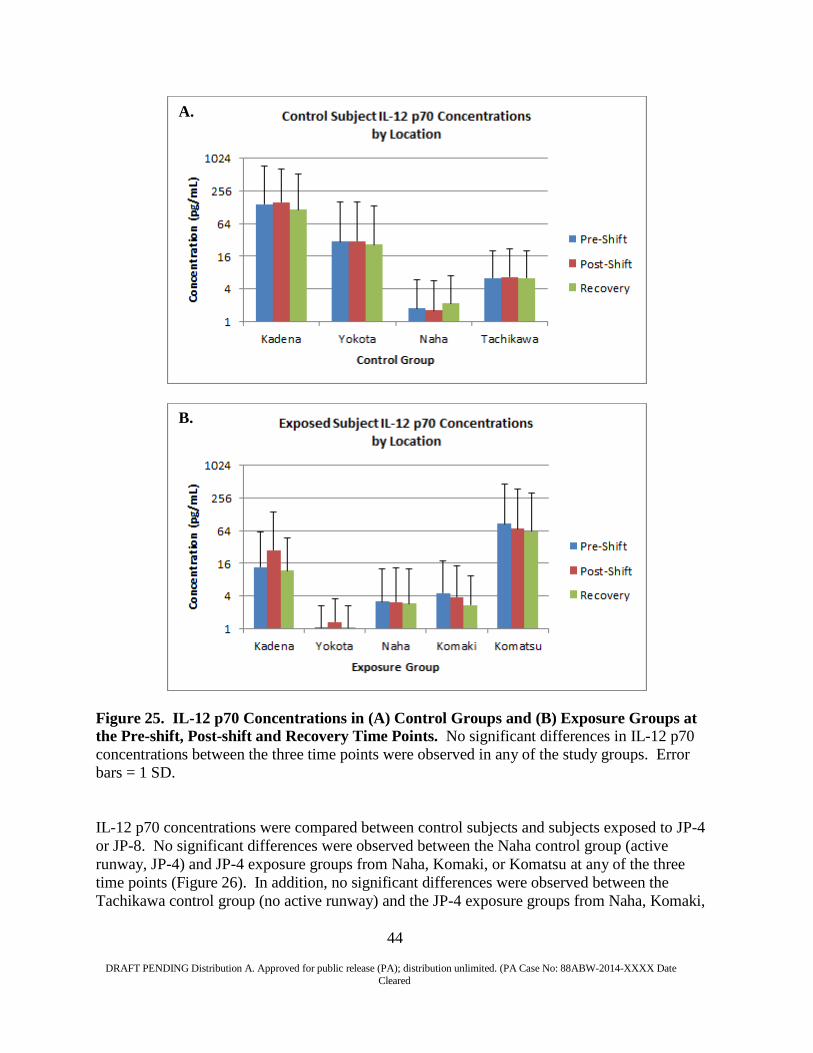
Figure 25. IL-12 p70 Concentrations in (A) Control Groups and (B) Exposure Groups at the Pre-shift, Post-shift and Recovery Time Points. No significant differences in IL-12 p70 concentrations between the three time points were observed in any of the study groups. Error bars = 1 SD.
IL-12 p70 concentrations were compared between control subjects and subjects exposed to JP-4 or JP-8. No significant differences were observed between the Naha control group (active runway, JP-4) and JP-4 exposure groups from Naha, Komaki, or Komatsu at any of the three time points (Figure 26). In addition, no significant differences were observed between the Tachikawa control group (no active runway) and the JP-4 exposure groups from Naha, Komaki,
B.
A.
44
DRAFT PENDING Distribution A. Approved for public release (PA); distribution unlimited. (PA Case No: 88ABW-2014-XXXX Date Cleared
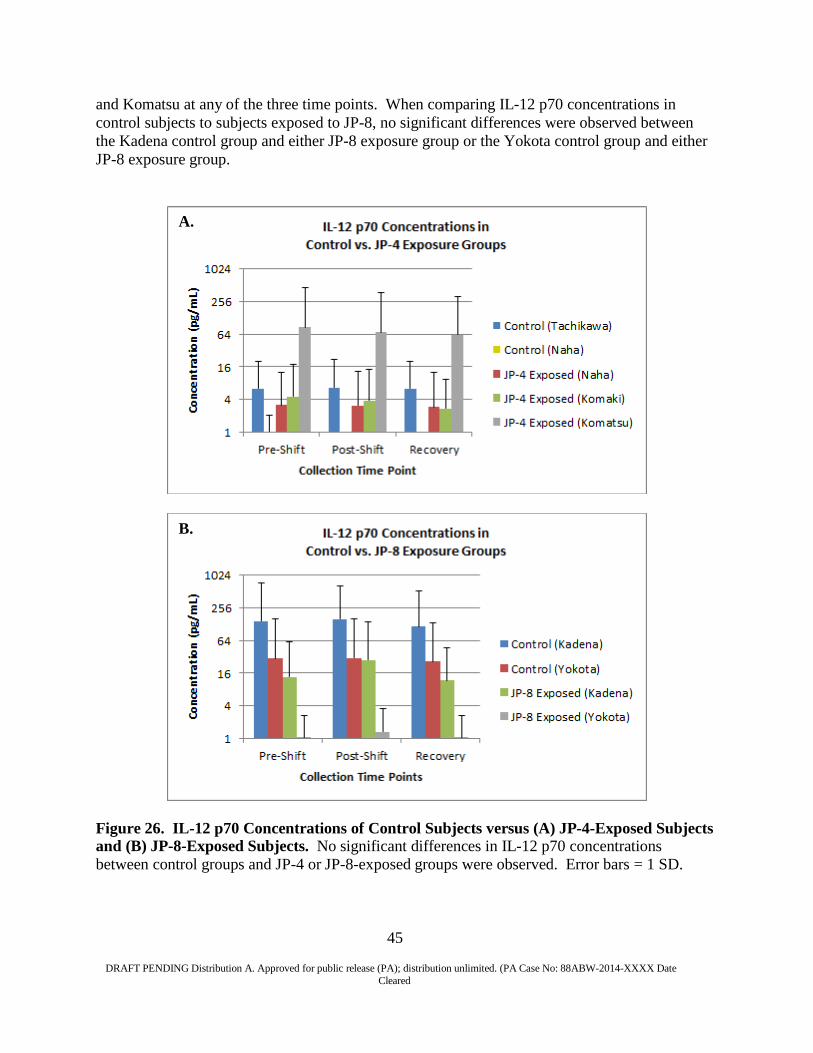
and Komatsu at any of the three time points. When comparing IL-12 p70 concentrations in control subjects to subjects exposed to JP-8, no significant differences were observed between the Kadena control group and either JP-8 exposure group or the Yokota control group and either JP-8 exposure group.
Figure 26. IL-12 p70 Concentrations of Control Subjects versus (A) JP-4-Exposed Subjects and (B) JP-8-Exposed Subjects. No significant differences in IL-12 p70 concentrations between control groups and JP-4 or JP-8-exposed groups were observed. Error bars = 1 SD.
B.
A.
45
DRAFT PENDING Distribution A. Approved for public release (PA); distribution unlimited. (PA Case No: 88ABW-2014-XXXX Date Cleared
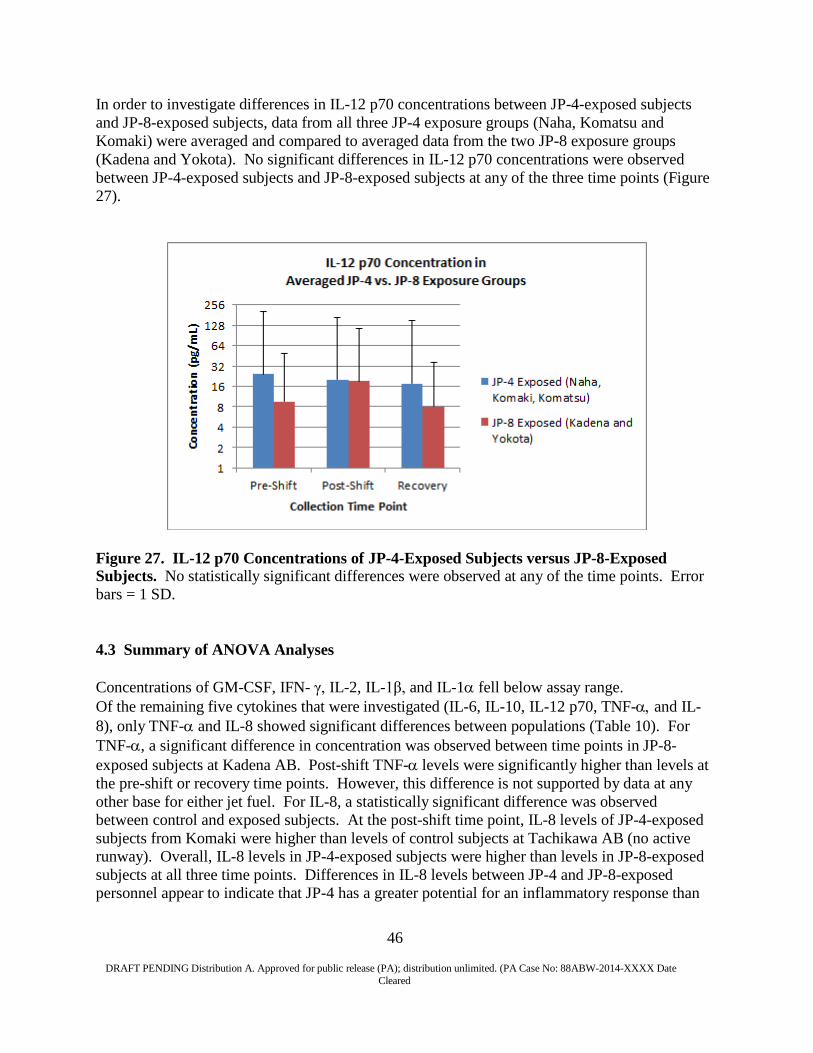
In order to investigate differences in IL-12 p70 concentrations between JP-4-exposed subjects and JP-8-exposed subjects, data from all three JP-4 exposure groups (Naha, Komatsu and Komaki) were averaged and compared to averaged data from the two JP-8 exposure groups (Kadena and Yokota). No significant differences in IL-12 p70 concentrations were observed between JP-4-exposed subjects and JP-8-exposed subjects at any of the three time points (Figure 27).
Figure 27. IL-12 p70 Concentrations of JP-4-Exposed Subjects versus JP-8-Exposed Subjects. No statistically significant differences were observed at any of the time points. Error bars = 1 SD.
4.3 Summary of ANOVA Analyses
Concentrations of GM-CSF, IFN- γ, IL-2, IL-1β, and IL-1α fell below assay range. Of the remaining five cytokines that were investigated (IL-6, IL-10, IL-12 p70, TNF-α, and IL- 8), only TNF-α and IL-8 showed significant differences between populations (Table 10). For TNF-α, a significant difference in concentration was observed between time points in JP-8- exposed subjects at Kadena AB. Post-shift TNF-α levels were significantly higher than levels at the pre-shift or recovery time points. However, this difference is not supported by data at any other base for either jet fuel. For IL-8, a statistically significant difference was observed between control and exposed subjects. At the post-shift time point, IL-8 levels of JP-4-exposed subjects from Komaki were higher than levels of control subjects at Tachikawa AB (no active runway). Overall, IL-8 levels in JP-4-exposed subjects were higher than levels in JP-8-exposed subjects at all three time points. Differences in IL-8 levels between JP-4 and JP-8-exposed personnel appear to indicate that JP-4 has a greater potential for an inflammatory response than
46
DRAFT PENDING Distribution A. Approved for public release (PA); distribution unlimited. (PA Case No: 88ABW-2014-XXXX Date Cleared
JP-8. The higher levels of IL-8 in jet fuel exposed personnel might be a marker for a low level response as a result of working on a flight line. Further study is needed to confirm this finding.
47
DRAFT PENDING Distribution A. Approved for public release (PA); distribution unlimited. (PA Case No: 88ABW-2014-XXXX Date Cleared
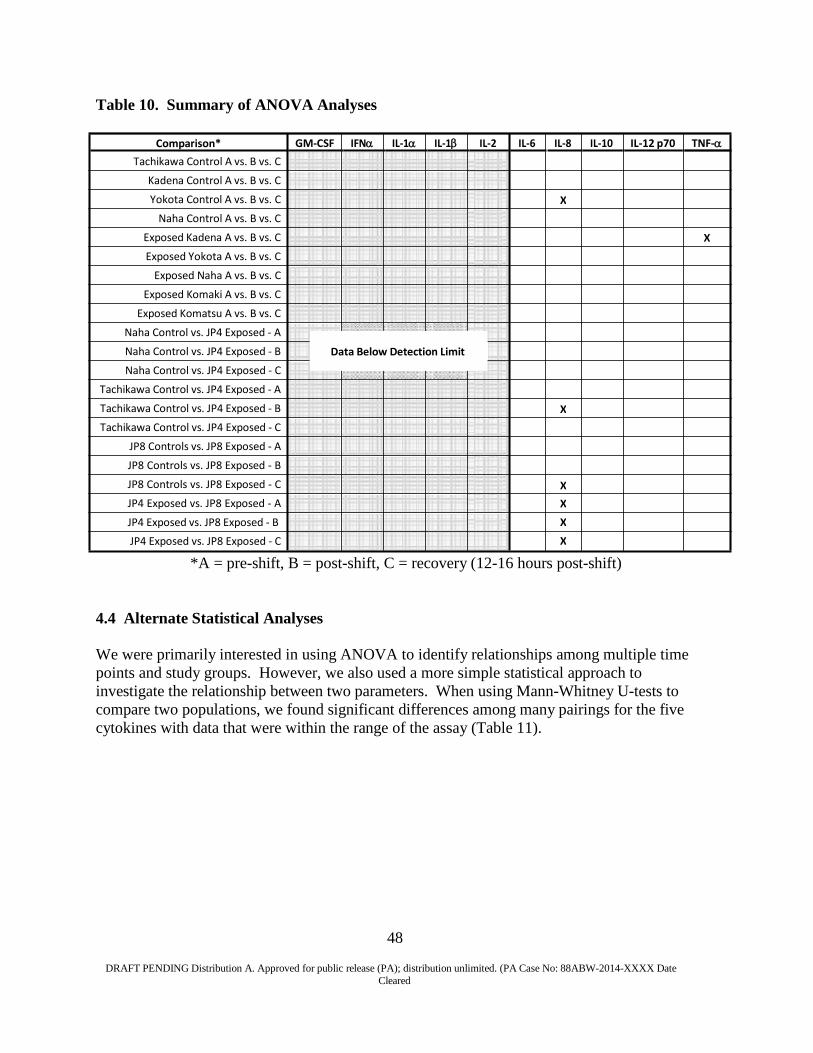
Table 10. Summary of ANOVA Analyses
*A = pre-shift, B = post-shift, C = recovery (12-16 hours post-shift)
4.4 Alternate Statistical Analyses
We were primarily interested in using ANOVA to identify relationships among multiple time points and study groups. However, we also used a more simple statistical approach to investigate the relationship between two parameters. When using Mann-Whitney U-tests to compare two populations, we found significant differences among many pairings for the five cytokines with data that were within the range of the assay (Table 11).
Comparison* Tachikawa Control A vs. B vs. C
Kadena Control A vs. B vs. C
Yokota Control A vs. B vs. C
Naha Control A vs. B vs. C
Exposed Kadena A vs. B vs. C
Exposed Yokota A vs. B vs. C
Exposed Naha A vs. B vs. C
Exposed Komaki A vs. B vs. C
Exposed Komatsu A vs. B vs. C
Naha Control vs. JP4 Exposed - A
Naha Control vs. JP4 Exposed - B
Naha Control vs. JP4 Exposed - C
Tachikawa Control vs. JP4 Exposed - A
Tachikawa Control vs. JP4 Exposed - B
Tachikawa Control vs. JP4 Exposed - C
JP8 Controls vs. JP8 Exposed - A
JP8 Controls vs. JP8 Exposed - B
JP8 Controls vs. JP8 Exposed - C
JP4 Exposed vs. JP8 Exposed - A
JP4 Exposed vs. JP8 Exposed - B JP4 Exposed vs. JP8 Exposed - C
GM-CSF IFNα IL-1α IL-1β IL-2 IL-6 IL-8 IL-10 IL-12 p70 TNF-α
X
X
Data Below Detection Limit
X
X X X X
48
DRAFT PENDING Distribution A. Approved for public release (PA); distribution unlimited. (PA Case No: 88ABW-2014-XXXX Date Cleared
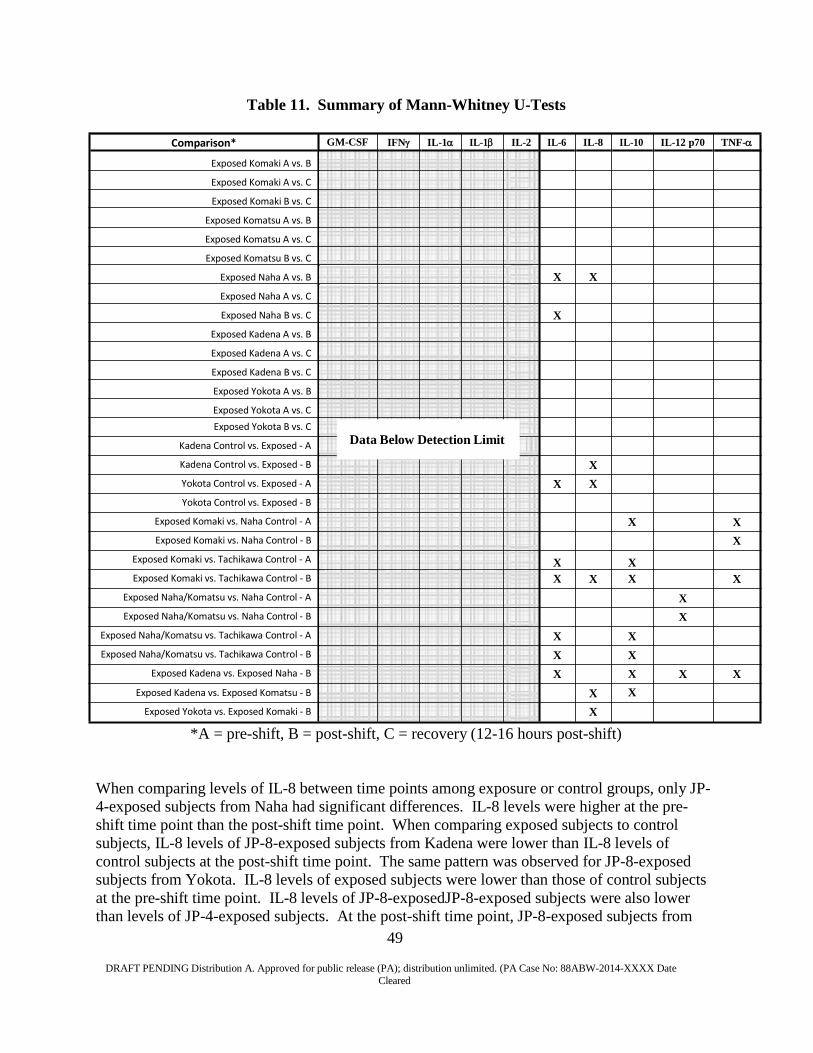
Table 11. Summary of Mann-Whitney U-Tests
*A = pre-shift, B = post-shift, C = recovery (12-16 hours post-shift)
When comparing levels of IL-8 between time points among exposure or control groups, only JP- 4-exposed subjects from Naha had significant differences. IL-8 levels were higher at the pre- shift time point than the post-shift time point. When comparing exposed subjects to control subjects, IL-8 levels of JP-8-exposed subjects from Kadena were lower than IL-8 levels of control subjects at the post-shift time point. The same pattern was observed for JP-8-exposed subjects from Yokota. IL-8 levels of exposed subjects were lower than those of control subjects at the pre-shift time point. IL-8 levels of JP-8-exposedJP-8-exposed subjects were also lower than levels of JP-4-exposed subjects. At the post-shift time point, JP-8-exposed subjects from
Comparison*
Exposed Komaki A vs. B
Exposed Komaki A vs. C
Exposed Komaki B vs. C
Exposed Komatsu A vs. B
Exposed Komatsu A vs. C
Exposed Komatsu B vs. C
Exposed Naha A vs. B
Exposed Naha A vs. C
Exposed Naha B vs. C
Exposed Kadena A vs. B
Exposed Kadena A vs. C
Exposed Kadena B vs. C
Exposed Yokota A vs. B
Exposed Yokota A vs. C Exposed Yokota B vs. C
Kadena Control vs. Exposed - A
Kadena Control vs. Exposed - B
Yokota Control vs. Exposed - A
Yokota Control vs. Exposed - B
Exposed Komaki vs. Naha Control - A
Exposed Komaki vs. Naha Control - B
Exposed Komaki vs. Tachikawa Control - A
Exposed Komaki vs. Tachikawa Control - B
Exposed Naha/Komatsu vs. Naha Control - A
Exposed Naha/Komatsu vs. Naha Control - B
Exposed Naha/Komatsu vs. Tachikawa Control - A
Exposed Naha/Komatsu vs. Tachikawa Control - B
Exposed Kadena vs. Exposed Naha - B
Exposed Kadena vs. Exposed Komatsu - B
Exposed Yokota vs. Exposed Komaki - B
GM-CSF IFNγ IL-1α IL-1β IL-2 IL-6 IL-8 IL-10 IL-12 p70 TNF-α
X X
X
Data Below Detection Limit
X X X
X X X
X X X
X X X
X X
X X X
X X X X
X X X X
49
DRAFT PENDING Distribution A. Approved for public release (PA); distribution unlimited. (PA Case No: 88ABW-2014-XXXX Date Cleared

Kadena had lower IL-8 levels than JP-4-exposed subjects from Komatsu and JP-8-exposed subjects from Yokota had lower IL-8 levels of JP-4-exposed subjects from Komaki. IL-8 levels of JP-4-exposed subjects, however, were higher than control levels. At the post-shift time point, exposed subjects from Komaki had higher levels of IL-8 than Tachikawa control subjects (no active runway).
When comparing exposed subjects to control subjects, IL-6 levels of JP-4-exposed subjects, were higher than those of control subjects. This supports a potential for low level inflammation in JP- 4 flight line workers. When comparing IL-6 levels of JP-8-exposed subjects to JP-4-exposed subjects, JP-8-exposed subjects from Kadena were higher than IL-6 levels of JP-4-exposed subjects from Naha. This does not support the IL-8 data showing a potential greater inflammatory effect caused by JP-4. However, the ANOVA analysis did not show the same statistical differences in IL-6 concentration. Unlike the results of the Mann-Whitney U-test, ANOVA showed no significant differences in IL-6 concentration between JP-4-exposed subjects and JP-8-exposed subjects.
No differences were observed in IL-10 levels between time points among exposure or control groups. The differences seen when comparing exposed subjects to control subjects or JP-4- exposed subjects to JP-8-exposed subjects are hard to explain due to the variability in IL-10 levels between bases for both the control and exposed subjects (see Table 8).
Significant differences were observed when comparing TNF-α levels between exposed and control subjects. TNF-α levels of JP-4-exposed subjects from Komaki were higher than levels of Naha control subjects at pre-shift time point and the post-shift time point. At the post-shift time point, TNF-α levels of JP-4-exposed subjects from Komaki were also higher than levels of Tachikawa control subjects. Significant differences were also observed between JP-8 and JP-4 exposure groups. TNF-α levels of JP-8-exposed subjects from Kadena were higher than TNF-α levels of JP-4-exposed subjects from Naha at the post-shift time point. This was not expected for JP-8.
Significant differences were observed when comparing IL-12 p70 levels between exposed and control subjects. When combining data of JP-4-exposed subjects from Naha and Komatsu, IL-12 p70 levels of the JP-4-exposed subjects were higher than levels of Naha control subjects at the pre-shift and post-shift time point. Significant differences were also observed between JP-8 and JP-4 exposure groups. IL-12 p70 levels of JP-8-exposed subjects from Kadena were higher than IL-12 p70 levels of JP-4-exposed subjects from Naha at the post-shift time point. This was also not expected for JP-8.
5.1 DISCUSSION/CONCLUSIONS
5.2 Overview
50
DRAFT PENDING Distribution A. Approved for public release (PA); distribution unlimited. (PA Case No: 88ABW-2014-XXXX Date Cleared
In this report we describe a collaborative research effort between the U.S. Air Force and the Japan Air Self-Defense Force to investigate jet fuel exposure health effects to ground crews handling JP-4 versus ground crews handling JP-8. Blood was collected from volunteers at USAF and JASDF air bases located in Japan. The USAF air bases were Yokota and Kadena, air bases using JP-8. The JASDF bases were Komaki, Naha, and Komatsu, air bases using JP-4. In addition, subjects were recruited from Tachikawa AB, an airbase with no active runway that served as a control site. Samples were collected for each subject at three time points: pre-shift, post-shift and the following morning (recovery). Serum of each subject at all three time points was tested for ten pro-inflammatory cytokines (IL-1α, IL-2, IL-8, IL-12 p70, IL-1β, GM-CSF, IFN-γ, IL-6, IL-10 and TNF-α) using Meso Scale Discovery’s Multi-Array® technology. If inflammatory changes are occurring as a result of jet fuel exposure, we expect changes in levels of cytokines that modulate inflammatory response.
5.3 Cytokines
Concentrations of 5 cytokines (GM-CSF, IFN- γ, IL-2, IL-1β and IL-1α) fell below assay range. Using ANOVA we showed concentrations of IL-6, IL-10 and IL-12 p70 did not vary between pre-exposure, post-exposure and recovery time points for control groups or exposed subjects. In addition, no statistically significant changes were observed between control and exposed subjects or between JP-4 and JP-8-exposed subjects.
Using ANOVA we observed a significant difference in TNF-α concentration between time points in JP-8-exposed subjects at Kadena AB. Post-shift TNF-α levels were significantly higher than levels at the pre-shift or recovery time points. TNF-α was the only cytokine that showed this response. However, the levels of TNF-α were not significantly different from control subjects making it difficult to determine if there is truly an effect by JP-8. Mann- Whitney U-test did not support the ANOVA results of no significant difference between control and exposure groups. Significant differences were observed at the post-shift time point between JP-4-exposed subjects from Komaki (mean = 9.31 pg/mL, SD = 5.41 pg/mL) and Naha control subjects (mean = 4.73 pg/mL, SD = 0.87 pg/mL) as well as Tachikawa control subjects (mean = 4.60 pg/mL, SD = 0.94 pg/mL). However, differences can be explained by the fact that the Mann-Whitney U-test assumes an equal distribution of data, and the Komaki exposure group included one individual whose TNF-α levels were much higher (50.7 pg/mL) than those of all other subjects.
A statistically significant difference was observed when comparing IL-8 levels between control and exposed subjects using ANOVA. At the post-shift time point, IL-8 levels of JP-4-exposed subjects from Komaki were higher than levels of control subjects at Tachikawa AB (no active runway). In addition, at the recovery time point, IL-8 concentrations of JP-8-exposed subjects from Kadena were higher than those of control subjects from Yokota. These data might indicate a low level of inflammation. However, no significant differences were observed between pre- shift and post-shift concentrations. Changes appeared to be constant for either controls or exposed subjects. Overall, when using ANOVA, IL-8 levels in JP-4-exposed subjects were
51
DRAFT PENDING Distribution A. Approved for public release (PA); distribution unlimited. (PA Case No: 88ABW-2014-XXXX Date Cleared
higher than levels in JP-8-exposed subjects at all three time points. Mann-Whitney U-test supported these findings. While these differences between fuels may indicate a slightly higher toxic effect due to JP-4 than JP-8, variations could also be related to a myriad of other factors such as race, age or health of the subjects.
The Mann-Whitney U-test is a more simple statistical approach that was used to investigate the relationship between cytokine levels at the various air bases. A number of significant differences were also found among pairings for IL-6, IL-10 and IL-12 p70. However, the results from these analyses were inconclusive or did not support the results of the ANOVA analyses.
Cytokines may not be sensitive markers for jet fuel exposure or jet fuel exposure was too low to trigger inflammatory effects. Additional work is required to identify key cytokine biomarkers that are predictive of exposure to JP-4 and JP-8 and to draw substantive conclusions regarding the higher human toxicity of either fuel.
6.0 REFERENCES
ATSDR. Draft Toxicological Profile for Jet Fuels JP-4 and JP-7. Agency for Toxic Substances
and Disease Registry, Atlanta, GA. 1993. ATSDR. Toxicological Profile for JP-5 and JP-8. Agency for Toxic Substances and Disease
Registry, Atlanta, GA. 1998. Carlton GN and Smith LB. “Exposures to jet fuel and benzene during aircraft fuel tank repair in
the U.S. Air Force.” Appl Occup Environ Hyg (2000) 15(6):485–491. Chao YC, Gibson RL, and Nylander-French LA. “Dermal exposure to jet fuel (JP-8) in U.S. Air
Force personnel.” Ann Occup Hyg (2005) 49(7):639–645. Espinoza LA, Tenzin F, Cecchi AO, Chen Z, Witten ML, and Smulson ME. “Expression of JP-
8-induced inflammatory genes in AEII cells is mediated by NF-kappaB and PARP-1.” Am. J. Respir. Cell Mol Biol (2006) 35:479–487.
Fulzele SV, Babu RJ, Ahaghotu E, and Singh M. “Estimation of proinflammatory biomarkers of skin irritation by dermal microdialysis following exposure with irritant chemicals.” Toxicology (2007) 237:77-88.
Harris DT, Sakiestewa D, Titone D, and Witten M. “JP-8 jet fuel exposure rapidly induces high levels of IL-10 and PGE2 secretion and is correlated with loss of immune function.” Toxicol Ind Health (2007) 23:223–230.
Hays AM, Parliman G, Pfaff JK, Lantz RC, Tinajero J, Tollinger B, Hall JN, and Witten ML. “Changes in Lung Permeability Correlate with Lung Histology in a Chronic Exposure Model.” Tox Indus Health (1995) 11(3):325-336.
Hurley JM, Wagner D, Sterner TR, and Mattie DR. Acute Dermal Irritation Study of JP-8 and S- 8 in New Zealand White Rabbits. AFRL-RH-WP-TR-2011-0054, ADA546698. Air Force Research Laboratory, Applied Biotechnology Branch, Wright-Patterson AFB, OH. 2011.
Kinkead ER, Salins SA, and Wolfe RE. “Acute irritation and sensitization potential of JP-8 jet fuel.” Acute Toxicity Data (1992a) 11:700.
Kinkead ER, Salins SA, and Wolfe RE. “Acute irritation and sensitization potential of petroleum-derived JP-4 jet fuel.” Acute Toxicity Data (1992b) 11:699.
52
DRAFT PENDING Distribution A. Approved for public release (PA); distribution unlimited. (PA Case No: 88ABW-2014-XXXX Date Cleared

Knave B, Olson BA, Elofsson S, Gamberale F, Isaksson A, Mindus P, Persson HE, Struwe G, Wennberg A, and Westerholm P. “Long-term exposure to jet fuel. II. A cross-sectional epidemiologic investigation on occupationally exposed industrial workers with special reference to the nervous system.” Scand J Work Environ Health (1978) 4:19-45.
Knave B, Persson HE, Goldberg JM, and Westerholm P. “Long-term exposure to jet fuel: an investigation on occupationally exposed workers with special reference to the nervous system.” Scand J Work Environ Health (1976) 2:152-164.
Kobayashi A and Kikukawa A. “Increased formaldehyde in jet engine exhaust with changes to JP-8, lower temperature, and lower humidity irritates eyes and respiratory tract.” Aviation, Space, and Environmental Medicine (2000) 71(4):396-399.
Mattie DR and Sterner TR. “Past, Present and Emerging Toxicity Issues for Jet Fuel.” Toxicology and Applied Pharmacology (2011) 254:127–132.
National Research Council. Permissible Exposure Levels for Selected Military Fuel Vapors. The National Academies Press, Washington, DC. 1996.
National Research Council. Toxicologic Assessment of Jet-Propulsion Fuel 8. The National Academies Press, Washington, DC. 2003.
Olsen DM, Mattie DR, Gould WD, Witzmann F, Ledbetter M, Lemasters GK, and Yin JH. A Pilot Study of Occupational Assessment of Air Force Personnel Exposure to Jet Fuel Before and After Conversion to JP-8. AFRL-HE-WP-1998-0107. Air Force Research Laboratory, Wright-Patterson AFB, OH. 1998.
Ramos G, Limon-Flores AY, and Ullrich SE. “JP-8 Induces Immune Suppression via a Reactive Oxygen Species NF-KB–Dependent Mechanism.” Tox Sci (2009) 108(1): 100-109.
Ritchie GD, Still KR, Rossi J, Bekkedal MYV, Bobb AJ, and Arfsten DP. “Biological and health effects of exposure to kerosene-based jet fuels and performance additives.” J Toxicol Environ Health B (2003) 6:357-451.
Smith LH, Haschek WM, Witschi H. “Acute toxicity of selected crude and refined shale oil- and petroleum-derived substances.” In: Health effects investigation of oil shale development. Griest WH, Guerin MR, Coffin DL Eds. Ann Arbor Science Publishers Inc, Ann Arbor, MI. (1981) 141-160.
Struwe G, Knave B, and Mindus P. “Neuropsychiatric symptoms in workers occupationally exposed to jet fuel - A combined epidemiological and casuistic study.” Acta Psychiat Scand Suppl (1983) 303:55-67.
Tarrant JM. “Blood Cytokines as Biomarkers of In Vivo Toxicity in Preclinical Safety Assessment: Considerations for Their Use.” Tox Sci (2010) 117(1):4-16.
USAF. The Installation Restoration Program Toxicology Guide, Vol. 4. DOE interagency agreement no. 1891-A076-A1. AAMRL, Aerospace Medical Division, Air Force Systems Command, Wright-Patterson Air Force Base, OH. 1989.
USAF. History of Aviation Fuel Development in the United States – AFRL/RPSF. Regulatory and Scientific Affairs Committee, Jet Fuel and Alternative Fuels Meeting, Dayton, OH. 1996.
Whitman FT and Hinz JP. Sensory irritation study in mice: JP-4, JP-8, JP-8+100. IERA-RS- BR-SR-2001-0005. AF Institute for Environment, Safety and Occupational Health Risk Analysis, Brooks AFB, TX. 2001.
53
DRAFT PENDING Distribution A. Approved for public release (PA); distribution unlimited. (PA Case No: 88ABW-2014-XXXX Date Cleared
Wolfe RE, Kinkead ER, Feldmann ML, Leahy HF, Jederberg WW, Mattie DR, and Still KR. Acute toxicity evaluation of JP-8 jet fuel and JP-8 jet fuel containing additives. AL/OE-TR- 1996-0136. Armstrong Laboratory, Wright-Patterson AFB, OH. 1996.
54
DRAFT PENDING Distribution A. Approved for public release (PA); distribution unlimited. (PA Case No: 88ABW-2014-XXXX Date Cleared
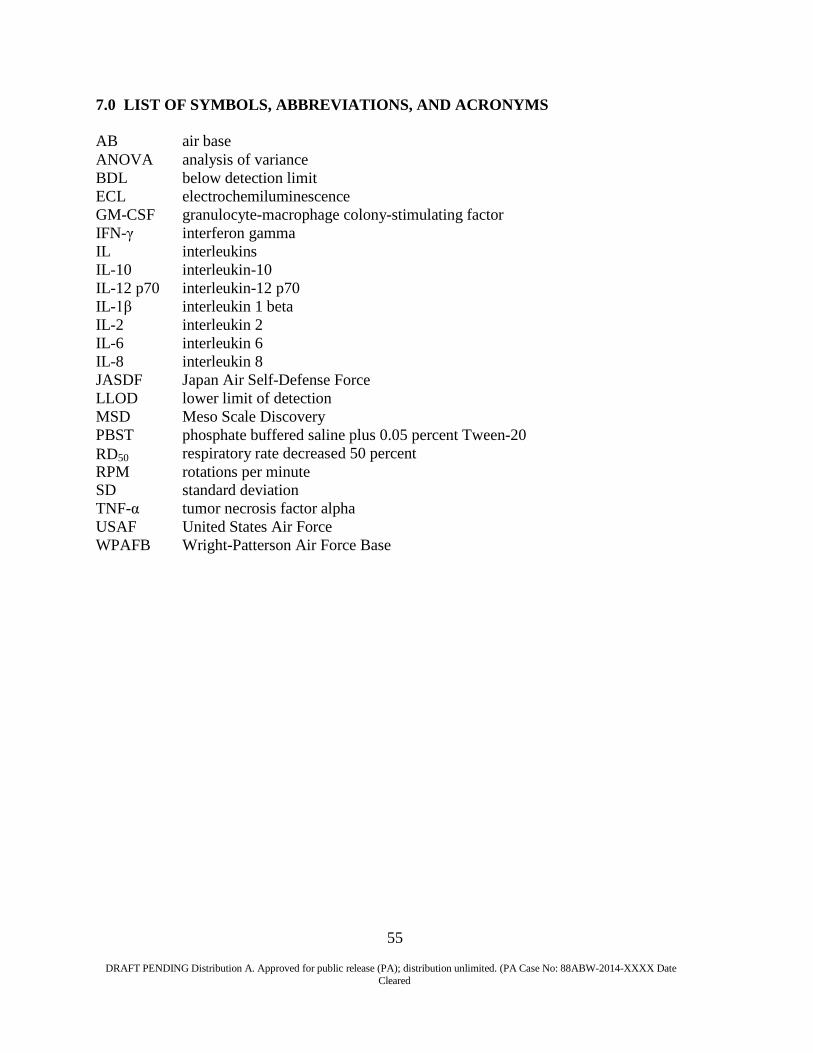
7.0 LIST OF SYMBOLS, ABBREVIATIONS, AND ACRONYMS
AB air base ANOVA analysis of variance BDL below detection limit ECL electrochemiluminescence GM-CSF granulocyte-macrophage colony-stimulating factor IFN-γ interferon gamma IL interleukins IL-10 interleukin-10 IL-12 p70 interleukin-12 p70 IL-1β interleukin 1 beta IL-2 interleukin 2 IL-6 interleukin 6 IL-8 interleukin 8 JASDF Japan Air Self-Defense Force LLOD lower limit of detection MSD Meso Scale Discovery PBST phosphate buffered saline plus 0.05 percent Tween-20 RD50 respiratory rate decreased 50 percent RPM rotations per minute SD standard deviation TNF-α tumor necrosis factor alpha USAF United States Air Force WPAFB Wright-Patterson Air Force Base
55
DRAFT PENDING Distribution A. Approved for public release (PA); distribution unlimited. (PA Case No: 88ABW-2014-XXXX Date Cleared