afs best practices leadership council webinar series ... · 2019/04/25 · commercial lending...
TRANSCRIPT

April 25, 2019
Winners and LosersCommercial Lending Dynamics
Green Lending
AFS Best Practices Leadership Council Webinar Series Presents:
Special Feature:
©2019 Automated Financial Systems, Inc. All Rights Reserved. AFS and all AFS product trademarks Are registered trademarks of Automated Financial Systems, Inc. The content of this document represents confidential and proprietary information of AFS. This information may not be disclosed to any third party, other than the direct addressee and its employees, agents, and representatives. The infringement of this prohibition may violate AFS proprietary and trade secret rights with resulting irreparable damage to AFS. Your cooperation is requested and appreciated. Thank you for your help in this matter. AFS 123 Summit Drive, Exton, Pennsylvania 19341. Telephone (610) 524‐9300 Fax (610) 524‐7977
©2019 Automated Financial Systems, Inc. All Rights Reserved. Confidential & Proprietary.2April 25, 2019
Achieving Success through Execution
Ask Questions
We want to hear from you. Please use the chat area to ask questions. We will answer your questions at the conclusion of the prepared remarks.
Please use this area to ask your questions.

©2019 Automated Financial Systems, Inc. All Rights Reserved. Confidential & Proprietary.3April 25, 2019
Achieving Success through Execution
AFS Pricing Dashboard by the Numbers
$1.2 TrillionThe Pricing Dashboard database already totals over $1.2 trillion in committed exposure, with broad coverage and depth across C&I and Commercial Real Estate product categories.
80,000 20+The database is seeded with over 80,000 new or renewed loans per quarter, creating a robust set of historical performance metrics to model and analyze.
The Pricing Dashboard contains a robust offering of measures and dimensions, allowing banks to tailor the analysis to their unique specifications and create balanced scorecards of growth, pricing, and credit risk performance.
Do you want to know… How your portfolio compares to peers? What geographies have tailwinds for loan growth? What sectors have the most pricing volatility? What are spread and fee levels for comparable credit?
The Pricing Dashboard gives you the tools and information you need to stay ahead of the curve.

©2019 Automated Financial Systems, Inc. All Rights Reserved. Confidential & Proprietary.4April 25, 2019
Achieving Success through Execution
Agenda
Balance Growth
Total commercial loan balances increased +1.6% in 1Q19, well above the pace reported in the same quarter a year earlierFor bilateral loans, balance growth trends continued to diverge between the large and small deals
New/Renewed Vol.
Spread Pricing
Fee Pricing
Special Topic
New bilateral volume continued to trend upwards in MarchTexas surpassed California as the largest state for new/renewed participation volume
Spread pricing was flat year over year for new loansThe average spread for renewals was up in March from a year ago
Total annualized fee performance in March was up slightly from a year ago
This month we examine the loan growth, spread pricing, and credit risk characteristics of “Green” industry segments

©2019 Automated Financial Systems, Inc. All Rights Reserved. Confidential & Proprietary.5April 25, 2019
Achieving Success through Execution
Markets Are Giving Mixed Signals
‐3.0‐2.0‐1.00.01.02.03.04.05.0
Chan
ge in Rea
l GDP
%
Real GDP Growth accelerated in 2018...
0.0
1.0
2.0
3.0
4.0
5.0
%
Fed Funds Interest Rate$1‐5M Fixed Loans
LIBOR‐Equ. Spread$1‐5M Fixed Loans
...and spreads remain stagnant despite rising interest rates
0.0
2.0
4.0
6.0
8.0
10.0
12.0
U.S. Nat'l Un
employmen
t %
... and unemployment remains at historic lows.
‐2.0‐1.00.01.02.03.04.05.0
10‐Yr M
inus 3‐M
th Treasury
The yield curve inverted in March...
Real GDP Source: Bureau of Economic Analysis (BEA)U.S. Unemployment Rate Source: Bureau of Labor Statistics (BLS)Yield Curve Source: Federal Reserve Bank of St. LouisInterest rate and LIBOR‐Equivalent Spread Source: AFS Pricing Dashboard

©2019 Automated Financial Systems, Inc. All Rights Reserved. Confidential & Proprietary.6April 25, 2019
Achieving Success through Execution
Commercial Lending in the News
“U.S. banks have delivered a mixed bag of first‐quarter financial results so far — but that’s probably the sector’s best this year, especially if the Federal Reserve does not increase interest rates at all.
With the Fed already signaling that it did not expect to hike interest rates this year, the banking industry’s ability to generate higher profits in the coming months may be limited.”
—CNBC, April 16, 2019
“Small‐business owners are turning to online lenders for financing much more frequently than they did even two years ago, the Federal Reserve Banks found in a new survey.
The findings suggest that more traditional lenders risk being left behind if they do not match the faster processes that many online lenders offer.
‘We’re seeing essentially low‐credit‐risk firms going to very conventional channels, and lower‐risk channels, ones that might have a longer wait time, but do offer better [lower] rates.’”
—American Banker, April 16, 2019

©2019 Automated Financial Systems, Inc. All Rights Reserved. Confidential & Proprietary.7April 25, 2019
Achieving Success through Execution
100
150
200
250
300
350New Renewed 10‐Year Treasuries
LIBOR‐Equivalent Spread (in BPS) TrendAll Loan Types
$0$5
$10$15$20$25$30$35$40
New Renewed
New and Renewed Loans Trend ($ Billions)All Loan Types
Commercial Loan Market Overview: March 2019
Source: AFS Pricing Dashboard – March 2019
Mar 20130.09%
Mar 20141.98%
Mar 20151.38%
Mar 20162.01%
Mar 2017‐0.02%
Mar 20180.33%
Mar 20191.58%
‐1.0%
0.0%
1.0%
2.0%
3.0%
4.0%
5.0%
6.0%
7.0%
Percen
t Growth
Growth in Outstandings ‐ Quarterly Trend(Quarter‐over‐Quarter Growth Rates)
0
5
10
15
20
25
30
35
2018* 2019*
Total Fees Upfront Fees
Total Fees Paid (in BPS) ‐ Bilateral LoansYear‐over‐Year Comparison
* Based on Comparative Jan‐Mar Periods

©2019 Automated Financial Systems, Inc. All Rights Reserved. Confidential & Proprietary.8April 25, 2019
Achieving Success through Execution
Bilateral Loan Growth Concentrated in the Larger DealsParticipations Up Broadly Across the Size Spectrum
Source: AFS Pricing Dashboard – March 2019
‐2.0%‐1.0%0.0%1.0%2.0%3.0%4.0%5.0%6.0%7.0%
Percen
t Growth
Bilateral Loans Participations
Growth in Outstandings ‐ Quarterly Trend(Quarter‐over‐Quarter Growth Rates)
‐1.45% ‐0.87%
0.86%1.96% 1.72%
‐2.0%
0.0%
2.0%
4.0%
6.0%
8.0%
10.0%
< $1M $1M to< $5M
$5M to< $25M
>= $25M CRE
Percen
t Growth
Growth in Outstandings ‐ Dec 2018 vs. Mar 2019Bilateral Loans
C&I Bilateral Loans
0.86%
8.52%
2.72%1.40%
3.18%
‐2.0%
0.0%
2.0%
4.0%
6.0%
8.0%
10.0%
< $1M $1M to< $5M
$5M to< $25M
>= $25M CRE
Percen
t Growth
Growth in Outstandings ‐ Dec 2018 vs. Mar 2019Participations
C&I Participations

©2019 Automated Financial Systems, Inc. All Rights Reserved. Confidential & Proprietary.9April 25, 2019
Achieving Success through Execution
CRE Balance Growth Accelerated in 1Q19
Source: AFS Pricing Dashboard – March 2019
‐5.0%
0.0%
5.0%
10.0%
15.0%
Percen
t Growth
Bilateral Loans Participations
Growth in Outstandings ‐ Quarterly Trend ‐ CRE(Quarter‐over‐Quarter Growth Rates)
‐0.38% ‐0.45%
1.52%
4.57%
‐10.0%
‐5.0%
0.0%
5.0%
10.0%
15.0%
< $1M $1M to< $5M
$5M to< $25M
>= $25M
Percen
t Growth
Growth in Outstandings ‐ Dec 2018 vs. Mar 2019Bilateral Loans ‐ CRE
‐5.17%
11.45%
1.96%4.21%
‐10.0%
‐5.0%
0.0%
5.0%
10.0%
15.0%
< $1M $1M to< $5M
$5M to< $25M
>= $25M
Percen
t Growth
Growth in Outstandings ‐ Dec 2018 vs. Mar 2019Participations ‐ CRE

©2019 Automated Financial Systems, Inc. All Rights Reserved. Confidential & Proprietary.10April 25, 2019
Achieving Success through Execution
Year‐Over‐Year Loan Growth Continues to Trend Upwards
Source: AFS Pricing Dashboard – March 2019
The charts below plot year‐over‐year loan growth rates for each month, allowing us to better account for seasonal effects on the loan growth trend. Year‐over‐year commercial loan balance growth in March 2019 was 5.6%, the highest growth rate seen since 2016.
‐5%
0%
5%
10%
15%
20%
25%
30%
% Growth Ye
ar‐ove
r‐Year
Growth in Outstandings Trend by Month(Year‐over‐Year Growth Rates)
All Loan Types (Bilateral Loans & Participations)
‐5%
0%
5%
10%
15%
20%
25%
30%
% Growth Ye
ar‐ove
r‐Year
Growth in Outstandings Trend by Month(Year‐over‐Year Growth Rates)
Bilateral Loans Participations

©2019 Automated Financial Systems, Inc. All Rights Reserved. Confidential & Proprietary.11April 25, 2019
Achieving Success through Execution
Texas is a High‐Growth Region for Both Bilateral Loans and Participations
Note: Geographic data refers to the location of the borrower, not necessarily the bank booking the loan. Outstandings of at least $3 billion in the base period is required. Source: AFS Pricing Dashboard – March 2019
6.5%
5.9%
2.6%
1.7%
1.5%
1.4%
‐0.3%
‐1.4%
‐2.8%
‐3.8%
‐4.6%
South Carolina
Texas
North Carolina
GeorgiaNew York
New Jersey
ColoradoWisconsin
NevadaKentucky
Growth in Outstandings ‐ Dec 2018 vs. Mar 2019All Loan Types
Nat'l Avg
3.4%
3.4%
1.9%
0.8%
0.7%
1.0%
‐1.0%
‐1.3%
‐1.4%
‐1.5%
‐4.9%
Texas
MassachusettsFlorida
New York
California
Tennessee
Oregon
OhioPennsylvania
Wisconsin
Growth in Outstandings ‐ Dec 2018 vs. Mar 2019Bilateral Loans
Nat'l Avg
8.0%
5.2%
3.9%
3.6%
3.1%
2.5%
‐1.9%
‐1.9%
‐2.1%
‐2.3%
‐5.2%
Texas
PennsylvaniaIllinoisGeorgia
New York
New JerseyColoradoCalifornia
Massachusetts
Florida
Growth in Outstandings ‐ Dec 2018 vs. Mar 2019Participations
Nat'l Avg

©2019 Automated Financial Systems, Inc. All Rights Reserved. Confidential & Proprietary.12April 25, 2019
Achieving Success through Execution
* Core Based Statistical Areas (CBSAs)Note: Geographic data refers to the location of the borrower, not necessarily the bank booking the loan.Source: AFS Pricing Dashboard – March 2019
Drilling Down to the CBSA* Level
1.94%
4.13%
1.39%
2.75%
‐0.83% ‐1.05%‐2.0%
‐1.0%
0.0%
1.0%
2.0%
3.0%
4.0%
5.0%
6.0%Pe
rcen
t Growth
Growth in Outstandings ‐ BilateralFlorida
Dec 2018 to Mar 2019

©2019 Automated Financial Systems, Inc. All Rights Reserved. Confidential & Proprietary.13April 25, 2019
Achieving Success through Execution
Note: Geographic data refers to the location of the borrower, not necessarily the bank booking the loan. Source: AFS Pricing Dashboard – March 2019
Bilateral Loans Up in 1Q19 Across Most States
Top 5 States1. Florida2. Texas3. California4. Massachusetts5. New York
Bottom 5 States1. Pennsylvania2. Ohio3. Wisconsin4. Nevada5. Iowa
ALARAZ
CA CO
CT
DCDE
FL
GA
IA
ID
IL INKS KY
LA
MA
MD
ME
MI
MN
MO
MS
MT
NC
ND
NE
NH
NJ
NM
NV
NY
OH
OK
OR
PARI
SC
SD
TN
TX
UTVA
VTWA
WI
WV
WY
Growth in OutstandingsDec 2018 vs. Mar 2019
Bilateral Loans
Negative Growth$0 to $100M$100M to $250M $250M to $500M Greater‐than $500MInsufficient Data

©2019 Automated Financial Systems, Inc. All Rights Reserved. Confidential & Proprietary.14April 25, 2019
Achieving Success through Execution
Note: Geographic data refers to the location of the borrower, not necessarily the bank booking the loan. Source: AFS Pricing Dashboard – March 2019
Participation Balances Up in 1Q19 Across the Majority of States
Top 5 States1. Texas2. New York3. Pennsylvania4. Maine5. Illinois
Bottom 5 States1. California2. Florida3. Arkansas4. Kentucky5. Massachusetts
ALARAZ
CA CO
CT
DCDE
FL
GA
IA
ID
IL INKS KY
LA
MA
MD
ME
MI
MN
MO
MS
MT
NC
ND
NE
NH
NJ
NM
NV
NY
OH
OK
OR
PARI
SC
SD
TN
TX
UTVA
VTWA
WI
WV
WY
Growth in OutstandingsDec 2018 vs. Mar 2019
Participations
Negative Growth$0 to $100M$100M to $250M $250M to $500M Greater‐than $500MInsufficient Data

©2019 Automated Financial Systems, Inc. All Rights Reserved. Confidential & Proprietary.15April 25, 2019
Achieving Success through Execution
GDP and Loan Growth: Is There a Correlation?
Total commercial loan growth for the Top 10 CBSAs* in terms of GDP remains well ahead of the rest of the country.
* Top 10 Core Based Statistical Areas (CBSAs) based on contribution to total U.S. Real GDP. Geographic data refers to the location of the borrower, not necessarily the bank booking the loan. Source: AFS Pricing Dashboard – March 2019Real GDP data sourced from the Bureau of Economic Analysis (BEA)
2.9%4.6% 5.2% 5.2% 5.6% 6.4% 7.1%
8.3% 8.9%10.9%
12.4%
15.2%
17.4%
1.3%2.5% 2.2% 2.5% 2.1% 1.9%
1.5% 1.5% 1.7% 2.3% 2.5%
4.5%5.6%
0.0%2.0%4.0%6.0%8.0%
10.0%12.0%14.0%16.0%18.0%20.0%
% Growth
Growth in Outstandings ‐ December 2015 BaselineTop 10 CBSAs vs. All Other Regions
Top 10 CBSAs
All Other Regions

©2019 Automated Financial Systems, Inc. All Rights Reserved. Confidential & Proprietary.16April 25, 2019
Achieving Success through Execution
Manufacturing Sectors Fuel Balance Growth for Both Bilateral Loans and Participations
Note: Industry categories based on North American Industry Classification System (NAICS). Outstandings of at least $3 billion in the base period is required.Source: AFS Pricing Dashboard – March 2019
8.1%
6.0%
3.6%
1.6%
1.5%
1.4%
‐0.6%
‐0.7%
‐1.8%
‐2.6%
‐7.7%
Manufacturing (Wood, Chem)
Manufacturing (Machinery, Elec)
Professional, Scientific, & Tech Retail Trade (Motor, Elec, Bldg)
Finance & Insurance
Arts, Entertainment, & Recreation
Admin, Support, Waste Mgmt Transportation (Air, Water, Truck)
Public Administration
Agriculture
Growth in Outstandings ‐ Dec 2018 vs. Mar 2019All Loan Types
All Industries Avg
10.9%
9.0%
5.8%
4.6%
1.3%
1.0%
‐1.9%
‐2.8%
‐3.1%
‐4.8%
‐9.3%
Utilities
Manufacturing (Wood, Chem)
Manufacturing (Machinery, Elec)
Professional, Scientific, & Tech
Finance & Insurance
Arts, Entertainment, & Recreation
Public Administration Admin, Support, Waste Mgmt
Manufacturing (Food, Bev, Apparel) Agriculture
Growth in Outstandings ‐ Dec 2018 vs. Mar 2019Bilateral Loans
All Industries Avg
7.4%
7.4%
7.1%
6.1%
1.8%
2.5%
1.6%
1.5%
1.5%
‐4.4%
‐6.4%
Manufacturing (Food, Bev, Apparel) Manufacturing (Wood, Chem)
Retail Trade (Motor, Elec, Bldg)
Manufacturing (Machinery, Elec) Health Care & Social Assistance
Finance & Insurance Arts, Entertainment, & Recreation
Admin, Support, Waste Mgmt
Transportation (Air, Water, Truck) Utilities
Growth in Outstandings ‐ Dec 2018 vs. Mar 2019Participations
All Industries Avg

©2019 Automated Financial Systems, Inc. All Rights Reserved. Confidential & Proprietary.17April 25, 2019
Achieving Success through Execution
Note: Industry categories based on North American Industry Classification System (NAICS).Source: AFS Pricing Dashboard – March 2019
Drilling Down to the 6‐Digit NAICS Level
5.81%
10.48%
3.72%
16.87%
‐1.85%‐5.0%
0.0%
5.0%
10.0%
15.0%
20.0%
33Manufacturing
(Machinery, Elec)
331Primary MetalManufacturing
331210Iron & Steel Pipe
& TubeManufacturingfrom Purchased
Steel
331318Other AluminumRolling, Drawing,
& Extruding
331222Steel WireDrawing
Percen
t Growth
Growth in Outstandings ‐ BilateralManufacturing (Machinery, Elec)
Dec 2018 to Mar 2019

©2019 Automated Financial Systems, Inc. All Rights Reserved. Confidential & Proprietary.18April 25, 2019
Achieving Success through Execution
100
150
200
250
300
350
400New Renewed 10‐Year Treasuries
LIBOR‐Equivalent Spreads (in BPS) TrendBilateral Loans
$0
$5
$10
$15
$20
$25New Renewed
New and Renewed Loan Volume ($ Billions)Bilateral Loans
New Bilateral Volume Decreased from a Year Ago…While Spreads Narrowed Over the Same Period
Source: AFS Pricing Dashboard – March 2019

©2019 Automated Financial Systems, Inc. All Rights Reserved. Confidential & Proprietary.19April 25, 2019
Achieving Success through Execution
Volume vs. Spread Pricing: New/Renewed Bilateral LoansState and Industry Detail for the Most Recent 6‐Month Period
Note: Geographic data refers to the location of the borrower, not necessarily the bank booking the loan. Industry categories based on North American Industry Classification System (NAICS).Source: AFS Pricing Dashboard – March 2019
$27.3
$16.5
$7.6
$6.4
$6.4
$5.6
$5.6
$4.7
$4.1
$3.9
California
New York
Florida
Ohio
Texas
Pennsylvania
Minnesota
Maryland
New Jersey
North Carolina
Top 10 States New/Renewed Volume Oct 2018 to Mar 2019 Bilateral Loans
$29.6
$13.5
$9.4
$6.4
$5.8
$4.6
$3.9
$3.3
$2.9
$2.7
Finance & Insurance
Wholesale Trade
Manufacturing (Machinery, Elec)
Health Care & Social Assistance
Retail Trade (Motor, Elec, Bldg)
Accommodation & Food Services
Professional, Scientific, & Tech
Manufacturing (Wood, Chem)
Information Manufacturing (Food, Bev, Apparel)
Top 10 C&I Industries New/Renewed Volume Oct 2018 to Mar 2019 Bilateral Loans
201
161
170
193
207
202
242
235
185
200
159
Finance & Insurance
Wholesale Trade Manufacturing (Machinery, Elec)
Health Care & Social Assistance Retail Trade (Motor, Elec, Bldg)
Accommodation & Food Services Professional, Scientific, & Tech Manufacturing (Wood, Chem)
Information Manufacturing (Food, Bev, Apparel)
Top 10 C&I Industries New/Renewed Volume ‐ LIBOR‐Equ. Spread Bilateral Loans
All Industries Avg
210
218
214
223
220
202
218
167
184
218
226
CaliforniaNew York
Florida
OhioTexas
PennsylvaniaMinnesotaMaryland
New Jersey
North Carolina
Top 10 States New/Renewed Volume ‐ LIBOR‐Equ. Spread Bilateral Loans
Nat'l Avg

©2019 Automated Financial Systems, Inc. All Rights Reserved. Confidential & Proprietary.20April 25, 2019
Achieving Success through Execution
100
150
200
250
300
350
400New Renewed 10‐Year Treasuries
LIBOR‐Equivalent Spreads (in BPS) TrendParticipations
$0
$5
$10
$15
$20
$25New Renewed
New and Renewed Loan Volume ($ Billions)Participations
New Participation Volume Continued to Fall in 1Q19…While Spreads Increased M/M and Y/Y
Source: AFS Pricing Dashboard – March 2019

©2019 Automated Financial Systems, Inc. All Rights Reserved. Confidential & Proprietary.21April 25, 2019
Achieving Success through Execution
Volume vs. Spread Pricing: New/Renewed ParticipationsState and Industry Detail for the Most Recent 6‐Month Period
Note: Geographic data refers to the location of the borrower, not necessarily the bank booking the loan. Industry categories based on North American Industry Classification System (NAICS).Source: AFS Pricing Dashboard – March 2019
$11.1
$10.8
$8.7
$5.8
$5.3
$4.6
$4.4
$4.2
$3.2
$2.7
Texas
California
New York
Pennsylvania
Illinois
Florida
Georgia
Ohio
Massachusetts
Maryland
Top 10 States New/Renewed Volume Oct 2018 to Mar 2019 Participations
$12.2
$10.3
$6.8
$6.7
$5.4
$5.1
$5.0
$4.3
$3.4
$3.3
Finance & Insurance
Manufacturing (Machinery, Elec)
Mining, Oil & Gas
Wholesale Trade
Utilities
Information
Manufacturing (Wood, Chem)
Retail Trade (Motor, Elec, Bldg)
Transportation (Air, Water, Truck)
Professional, Scientific, & Tech
Top 10 C&I Industries New/Renewed Volume Oct 2018 to Mar 2019 Participations
230
170
184
148
148184
191
152
162
197
188
Texas
California
New YorkPennsylvania
Illinois
Florida
GeorgiaOhio
Massachusetts
Maryland
Top 10 States New/Renewed Volume ‐ LIBOR‐Equ. Spread Participations
Nat'l Avg
174140
253
174
153
184152
177
168
202
182
Finance & Insurance
Manufacturing (Machinery, Elec) Mining, Oil & Gas
Wholesale Trade
Utilities
Information Manufacturing (Wood, Chem)
Retail Trade (Motor, Elec, Bldg)
Transportation (Air, Water, Truck) Professional, Scientific, & Tech
Top 10 C&I Industries New/Renewed Volume ‐ LIBOR‐Equ. Spread Participations
All Industries Avg

©2019 Automated Financial Systems, Inc. All Rights Reserved. Confidential & Proprietary.22April 25, 2019
Achieving Success through Execution
Total Annualized Fee Performance in March Up Slightly from the Same Period a Year Ago
Note: Geographic data refers to the location of the borrower, not necessarily the bank booking the loan. Industry categories based on North American Industry Classification System (NAICS).Source: AFS Pricing Dashboard – March 2019
0
5
10
15
20
25
30
35
2018* 2019*
Total Fees Upfront Fees
Total Fees Paid (in BPS) ‐ Bilateral LoansYear‐over‐Year Comparison
* Based on Comparative Jan‐Mar Periods
05
101520253035
Eastern
Midwest
Middle
Atlantic
Northea
st
South
Southw
est
West
Western
Midwest
2018* 2019*
Total Upfront Fees Paid (in BPS) Year‐over‐Year Comparison ‐ By Geographic Region
* Based on Comparative Jan‐Mar Periods
05
101520253035
Inform
ation
Utilities
Fina
nce &
Insuranc
e
Admin, S
uppo
rt,
Waste M
gmt,
& Rem
ediatio
nMan
ufacturing
(Woo
d, Pap
er,
Plastic
)
Man
agem
ent
of Com
panies
Educationa
lSe
rvices
Agric
ulture,
Forestry, Fishing
& Hun
ting
Retail Trad
e(M
otor, E
lec,
Bldg
)
Public
Administration
2018* 2019*
Total Upfront Fees Paid (in BPS) Year‐over‐Year Comparison ‐ By Industry
* Based on Comparative Jan‐Mar Periods

Special TopicGreen Lending
©2019 Automated Financial Systems, Inc. All Rights Reserved. Confidential & Proprietary.

©2019 Automated Financial Systems, Inc. All Rights Reserved. Confidential & Proprietary.24April 25, 2019
Achieving Success through Execution
Green Lending: Overview
Most of the major banks and many regional players have established green lending and sustainability initiatives
According to the LSTA, 2018 was a record year for green and sustainability linked loans in the syndicated loan market1
Bloomberg reported that over $12 trillion in investment is needed to support the climate goals of the Paris Agreement2
The Bureau of Labor Statistics provides criteria for identifying green industry segments3
1. LSTA Week in Review, February 1, 2019.2. Bloomberg New Energy Finance, New Energy Outlook, 2017.3. Bureau of Labor Statistics (BLS), https://www.bls.gov/green/industry_by_naics.pdf.

©2019 Automated Financial Systems, Inc. All Rights Reserved. Confidential & Proprietary.25April 25, 2019
Achieving Success through Execution
Categories of Green Lending
Agricultural and Natural Resources
Conservation0.9%
Education, Compliance,
Public Awareness, and Training
21.7%
Energy Efficiency29.5%Greenhouse
Gas Reduction0.9%
Pollution Reduction and Cleanup
6.3%
Recycling and Waste Reduction26.0%
Renewable Energy14.9%
Green and Sustainable Lending
Distribution of Outstandings by SubsectorMar 2019
See the Appendix for the NAICS mappings of the Green industries.Source: AFS Pricing Dashboard – March 2019

©2019 Automated Financial Systems, Inc. All Rights Reserved. Confidential & Proprietary.26April 25, 2019
Achieving Success through Execution
Green Lending is Already a Significant Exposure for Many Banks
Subset of participating banks in the AFS Pricing Dashboard. See the Appendix for the NAICS mappings of the Green industries.Source: AFS Pricing Dashboard – March 2019
For the Market as a whole, the Green industries represent 2.6% of total C&I and CRE exposure, although this ratio varies significantly across the participating banks.
0.0%
1.0%
2.0%
3.0%
4.0%
5.0%
6.0%
Percen
t of O
utstan
ding
s
Green and Sustainable LendingPercent of Total Commercial Portfolio
Bilateral Loans Participations

©2019 Automated Financial Systems, Inc. All Rights Reserved. Confidential & Proprietary.27April 25, 2019
Achieving Success through Execution
Loan Growth for Green Industries Trails Market Averages
See the Appendix for the NAICS mappings of the Green industries.Source: AFS Pricing Dashboard – March 2019
Total outstandings for Green industries were down year over year in March. However, quarter over quarter, the Green sector experienced a healthy rebound in bilateral loan growth.
0.4%
‐0.9%
1.7%
‐2.2% ‐2.5%
2.1%1.4%
5.7%
0.9%
4.7%
2.6%
8.1%
‐4.0%
‐2.0%
0.0%
2.0%
4.0%
6.0%
8.0%
10.0%
Qtr/Qtr Yr/Yr Qtr/Qtr Yr/Yr Qtr/Qtr Yr/Yr
All Loan Types Bilateral Loans Participations
Percen
t Growth
Growth in Outstandings ‐Mar 2019
Green and Sustainable Lending All Other Sectors

©2019 Automated Financial Systems, Inc. All Rights Reserved. Confidential & Proprietary.28April 25, 2019
Achieving Success through Execution
Recycling and Waste Reduction Leads Loan Growth at the Subsector Level
See the Appendix for the NAICS mappings of the Green industries.Source: AFS Pricing Dashboard – March 2019
1.4%
0.4%
0.8%
‐0.5%‐0.7%
1.2%
‐0.8%
‐1.0%
‐0.5%
0.0%
0.5%
1.0%
1.5%
2.0%
All O
ther Sectors
Green an
d Su
staina
ble
Lend
ing
Education, Com
pliance,
Public Awaren
ess,
and Training
Energy Efficien
cy
Pollu
tion Re
duction
and Cleanu
p
Recycling
and
Waste Red
uctio
n
Rene
wab
le Ene
rgy
Percen
t Growth
Growth in OutstandingsMar 2019 Qtr/Qtr
5.7%
‐0.9%
‐8.8%‐7.2%
15.7%
11.0%
‐0.3%
‐10.0%
‐5.0%
0.0%
5.0%
10.0%
15.0%
20.0%
All O
ther Sectors
Green an
d Su
staina
ble
Lend
ing
Education, Com
pliance,
Public Awaren
ess,
and Training
Energy Efficien
cy
Pollu
tion Re
duction
and Cleanu
p
Recycling
and
Waste Red
uctio
n
Rene
wab
le Ene
rgy
Percen
t Growth
Growth in OutstandingsMar 2019 Yr/Yr

©2019 Automated Financial Systems, Inc. All Rights Reserved. Confidential & Proprietary.29April 25, 2019
Achieving Success through Execution
The Return Relative to Risk is Better than Average for the Green Industries
Yellow bubbles represent 2‐digit NAICS industry segments.Risk ratings based on the RMA 10‐point obligor risk rating scale.See the Appendix for the NAICS mappings of the Green industries.Source: AFS Pricing Dashboard – March 2019

©2019 Automated Financial Systems, Inc. All Rights Reserved. Confidential & Proprietary.30April 25, 2019
Achieving Success through Execution
Spreads Widen Year Over Year for Green Industries
100
125
150
175
200
225
250
1Q18 2Q18 3Q18 4Q18 1Q19
Wtd Avg LIBOR‐Equivalent Spread (in BPS)New and Renewed Loans
Green and Sustainable Lending All Other Sectors
3.00
3.50
4.00
4.50
5.00
5.50
1Q18 2Q18 3Q18 4Q18 1Q19
Wtd Avg Risk Rating (10‐Pt. Scale)New and Renewed Loans
Green and Sustainable Lending All Other Sectors
Risk ratings based on the RMA 10‐point obligor risk rating scale.See the Appendix for the NAICS mappings of the Green industries.Source: AFS Pricing Dashboard – March 2019
On a year‐over‐year basis, spread pricing for the Green industries increased 44 bps, as contrasted with a decline of 9 bps for All Other Sectors. The weighted average risk rating for the Green industries trended upwards over the last year, although credit quality for this segment is comparable to that seen for All Other Sectors.
©2019 Automated Financial Systems, Inc. All Rights Reserved. Confidential & Proprietary.31April 25, 2019
Achieving Success through Execution
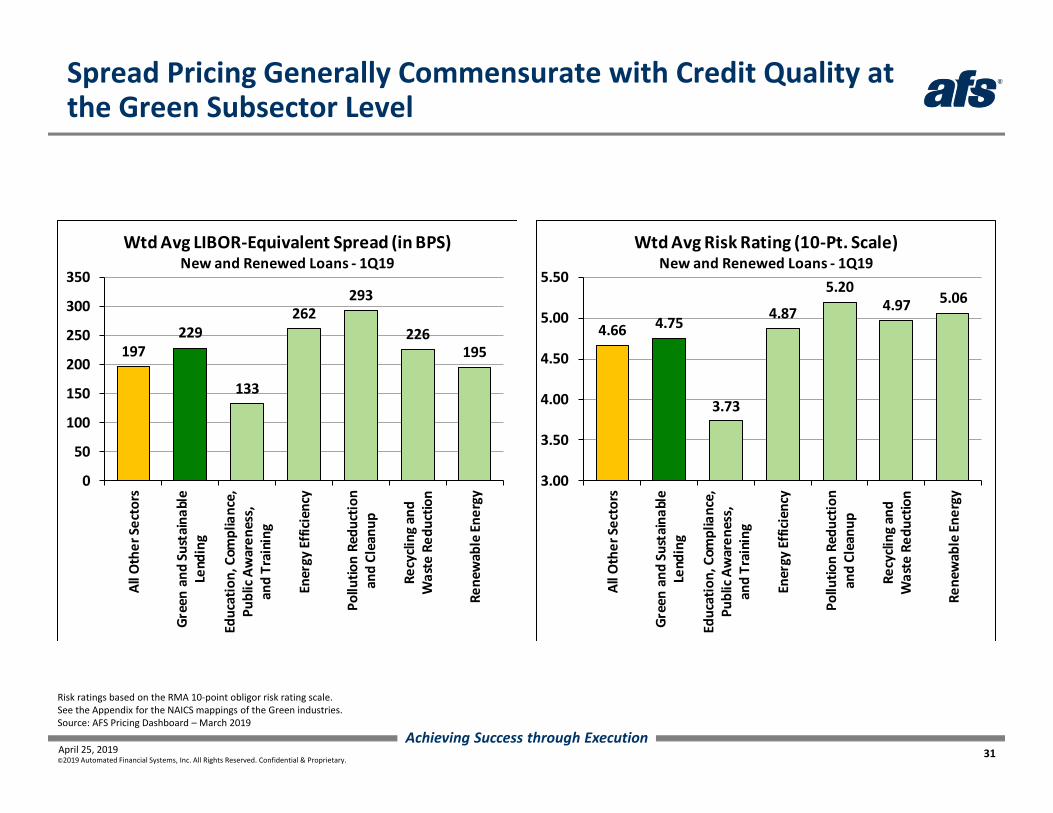
Spread Pricing Generally Commensurate with Credit Quality at the Green Subsector Level
197229
133
262293
226195
0
50
100
150
200
250
300
350
All O
ther Sectors
Green an
d Su
staina
ble
Lend
ing
Education, Com
pliance,
Public Awaren
ess,
and Training
Energy Efficien
cy
Pollu
tion Re
duction
and Cleanu
p
Recycling
and
Waste Red
uctio
n
Rene
wab
le Ene
rgy
Wtd Avg LIBOR‐Equivalent Spread (in BPS)New and Renewed Loans ‐ 1Q19
4.66 4.75
3.73
4.87
5.204.97 5.06
3.00
3.50
4.00
4.50
5.00
5.50
All O
ther Sectors
Green an
d Su
staina
ble
Lend
ing
Education, Com
pliance,
Public Awaren
ess,
and Training
Energy Efficien
cy
Pollu
tion Re
duction
and Cleanu
p
Recycling
and
Waste Red
uctio
n
Rene
wab
le Ene
rgy
Wtd Avg Risk Rating (10‐Pt. Scale)New and Renewed Loans ‐ 1Q19
Risk ratings based on the RMA 10‐point obligor risk rating scale.See the Appendix for the NAICS mappings of the Green industries.Source: AFS Pricing Dashboard – March 2019

©2019 Automated Financial Systems, Inc. All Rights Reserved. Confidential & Proprietary.32April 25, 2019
Achieving Success through Execution
Summary of Findings & Observations
Green industries are material in size in terms of current loans outstanding, although recent loan growth has been sluggish
In 1Q19, the Recycling & Waste Reduction subsector led growth in Green loans
Spread pricing increased year over year for the Green industries, correlating with an increase in credit risk over the same period for this segment
The return relative to risk is better than average for the Green industries
Demand for Green/sustainability linked loans is likely to increase in the coming years

©2019 Automated Financial Systems, Inc. All Rights Reserved. Confidential & Proprietary.33April 25, 2019
Achieving Success through Execution
Thank You for Joining Us Today
A recording and a copy of this presentation will be made available by the end of this week.
Questions?
Doug Skinner+1 484‐875‐1562
Don Dougherty+1 484‐875‐1334
Jeremy Chalson+1 484‐875‐1546

©2019 Automated Financial Systems, Inc. All Rights Reserved. Confidential & Proprietary.34April 25, 2019
Achieving Success through Execution
AFS Best Practices Leadership Council Programming
Upcoming AFS in the Industry Events
Topic Date
Fiserv Forum, Las Vegas May 6–9, 2019
LIBOR Webinar May 8, 2019
©2019 Automated Financial Systems, Inc. All Rights Reserved. Confidential & Proprietary.35April 25, 2019
Achieving Success through Execution
Stay Connected with AFS
Stay on top of all the latest news and happenings with AFS. Follow us and stay connected.
Automated Financial Systems, Inc.
@afs_vision
AFS@AFSVision

Appendix
©2019 Automated Financial Systems, Inc. All Rights Reserved. Confidential & Proprietary.

©2019 Automated Financial Systems, Inc. All Rights Reserved. Confidential & Proprietary.37April 25, 2019
Achieving Success through Execution
How Do We Define “Best”?
Balance Growth Percent change in outstandings. Is there positive
growth momentum in the industry or region? Are banks getting their fair share of wallet?
The three criteria listed below are used to evaluate industry and regional performance in the database. Segments in the top quartile for all three categories represent sustainable growth opportunities for banks.
Spread and Fee Pricing Is spread and fee pricing above average for the
industry or region, or rather is the segment showing signs of pricing compression?
Credit Risk Are risk levels and default projections trending
downward for the segment?
$

©2019 Automated Financial Systems, Inc. All Rights Reserved. Confidential & Proprietary.38April 25, 2019
Achieving Success through Execution
NAICS Mapping of Green IndustriesAgricultural and Natural Resources Conservation
Green Subsector NAICS NAICS Description
Agricultural and natural resources conservation 113210 Forest nursery and gathering forest products
Agricultural and natural resources conservation 115310 Support activities for forestry
Agricultural and natural resources conservation 712130 Zoos and botanical gardens
Agricultural and natural resources conservation 712190 Nature parks and other similar institutions
Source: Bureau of Labor Statistics (BLS), https://www.bls.gov/green/industry_by_naics.pdf.

©2019 Automated Financial Systems, Inc. All Rights Reserved. Confidential & Proprietary.39April 25, 2019
Achieving Success through Execution
NAICS Mapping of Green IndustriesEducation, Compliance, Public Awareness, and Training
Green Subsector NAICS NAICS Description
Education, compliance, public awareness, and training 813211 Grantmaking foundations
Education, compliance, public awareness, and training 813219 Other grantmaking and giving services
Education, compliance, public awareness, and training 813312 Environment and conservation orgs
Education, compliance, public awareness, and training 813910 Business associations
Education, compliance, public awareness, and training 813920 Professional organizations
Education, compliance, public awareness, and training 813940 Political organizations
Education, compliance, public awareness, and training 924110 Air, water, and waste program administration
Education, compliance, public awareness, and training 924120 Administration of conservation programs
Education, compliance, public awareness, and training 926110 Administration of general economic programs
Education, compliance, public awareness, and training 926120 Transportation program administration
Education, compliance, public awareness, and training 926130 Utility regulation and administration
Education, compliance, public awareness, and training 926140 Agricultural market and commodity regulation
Education, compliance, public awareness, and training 926150 Licensing and regulating commercial sectors
Source: Bureau of Labor Statistics (BLS), https://www.bls.gov/green/industry_by_naics.pdf.

©2019 Automated Financial Systems, Inc. All Rights Reserved. Confidential & Proprietary.40April 25, 2019
Achieving Success through Execution
NAICS Mapping of Green IndustriesEnergy Efficiency
Green Subsector NAICS NAICS Description
Energy efficiency 236118 Residential remodelers
Energy efficiency 237210 Land subdivision
Energy efficiency 333312 Commercial laundry and drycleaning machinery
Energy efficiency 334513 Industrial process variable instruments
Energy efficiency 334514 Totalizing fluid meters and counting devices
Energy efficiency 334515 Electricity and signal testing instruments
Energy efficiency 483114 Coastal and Great Lakes passenger transport.
Energy efficiency 483212 Inland water passenger transportation
Energy efficiency 485111 Mixed mode transit systems
Energy efficiency 485112 Commuter rail systems
Energy efficiency 485113 Bus and other motor vehicle transit systems
Energy efficiency 485119 Other urban transit systems
Energy efficiency 485210 Interurban and rural bus transportation
Energy efficiency 485410 School and employee bus transportation
Energy efficiency 485991 Special needs transportation
Energy efficiency 485999 All other ground passenger transportation
Energy efficiency 511210 Software publishersSource: Bureau of Labor Statistics (BLS), https://www.bls.gov/green/industry_by_naics.pdf.
©2019 Automated Financial Systems, Inc. All Rights Reserved. Confidential & Proprietary.41April 25, 2019
Achieving Success through Execution
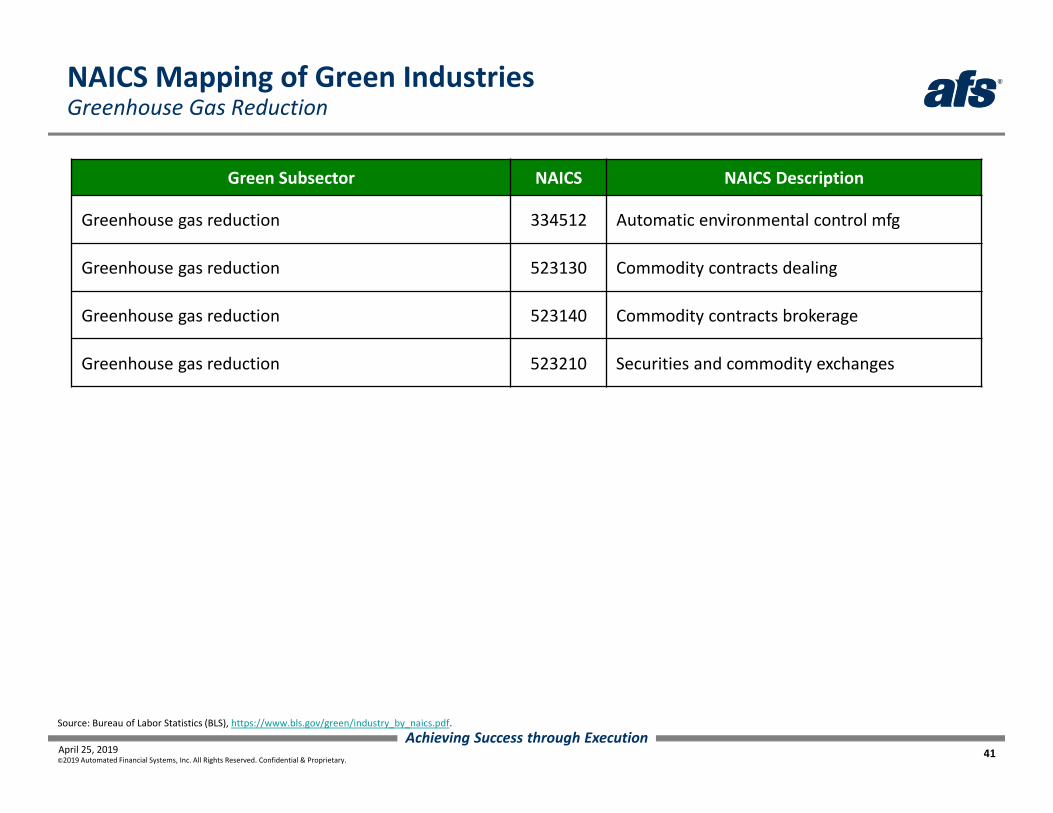
NAICS Mapping of Green IndustriesGreenhouse Gas Reduction
Green Subsector NAICS NAICS Description
Greenhouse gas reduction 334512 Automatic environmental control mfg
Greenhouse gas reduction 523130 Commodity contracts dealing
Greenhouse gas reduction 523140 Commodity contracts brokerage
Greenhouse gas reduction 523210 Securities and commodity exchanges
Source: Bureau of Labor Statistics (BLS), https://www.bls.gov/green/industry_by_naics.pdf.

©2019 Automated Financial Systems, Inc. All Rights Reserved. Confidential & Proprietary.42April 25, 2019
Achieving Success through Execution
NAICS Mapping of Green IndustriesPollution Reduction and Cleanup
Green Subsector NAICS NAICS Description
Pollution reduction and cleanup 333411 Air purification equipment mfg
Pollution reduction and cleanup 334516 Analytical laboratory instrument mfg.
Pollution reduction and cleanup 562112 Hazardous waste collection
Pollution reduction and cleanup 562211 Hazardous waste treatment and disposal
Pollution reduction and cleanup 562910 Remediation services
Pollution reduction and cleanup 562920 Materials recovery facilities
Pollution reduction and cleanup 562991 Septic tank and related services
Pollution reduction and cleanup 812320 Drycleaning and laundry services
Source: Bureau of Labor Statistics (BLS), https://www.bls.gov/green/industry_by_naics.pdf.

©2019 Automated Financial Systems, Inc. All Rights Reserved. Confidential & Proprietary.43April 25, 2019
Achieving Success through Execution
NAICS Mapping of Green IndustriesRecycling and Waste Reduction
Green Subsector NAICS NAICS Description
Recycling and waste reduction 221310 Water supply and irrigation systems
Recycling and waste reduction 221320 Sewage treatment facilities
Recycling and waste reduction 237110 Water and sewer system construction
Recycling and waste reduction 333319 Other commercial & service machinery mfg
Recycling and waste reduction 423930 Recyclable material merchant wholesalers
Recycling and waste reduction 562111 Solid waste collection
Recycling and waste reduction 562119 Other waste collection
Recycling and waste reduction 562212 Solid waste landfill
Recycling and waste reduction 562213 Solid waste combustors and incinerators
Recycling and waste reduction 562219 Other nonhazardous waste disposal
Recycling and waste reduction 562998 Miscellaneous waste management services
Source: Bureau of Labor Statistics (BLS), https://www.bls.gov/green/industry_by_naics.pdf.
©2019 Automated Financial Systems, Inc. All Rights Reserved. Confidential & Proprietary.44April 25, 2019
Achieving Success through Execution
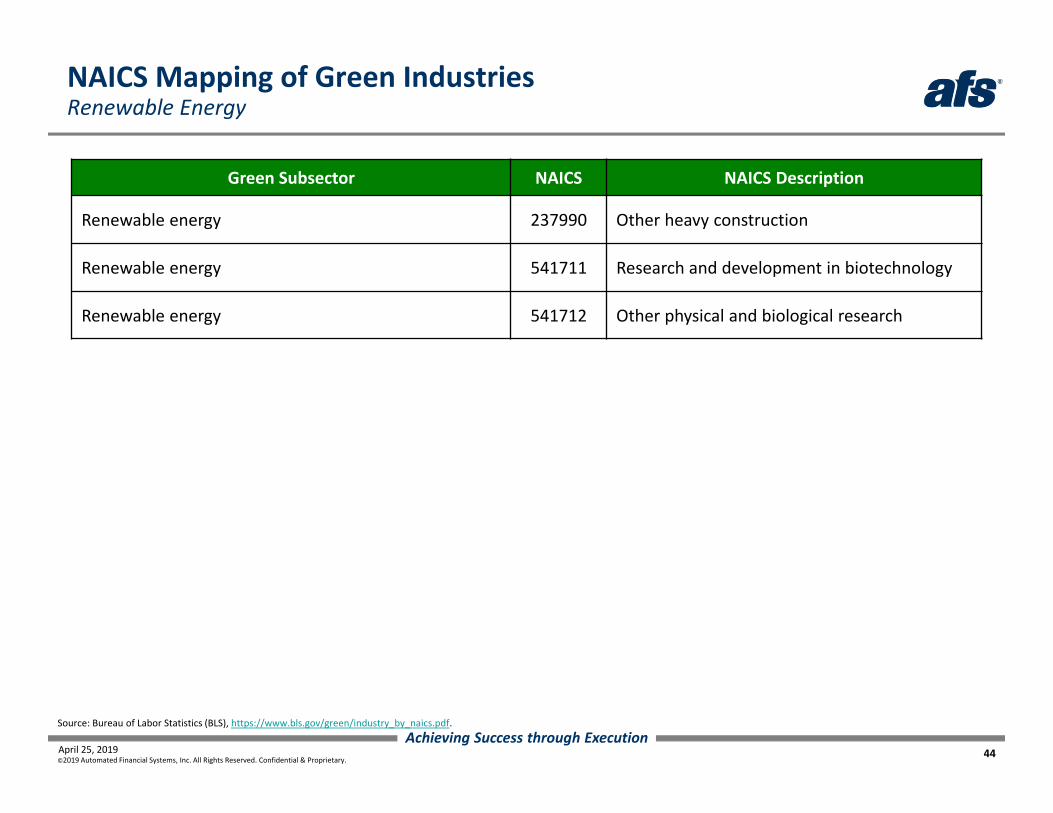
NAICS Mapping of Green IndustriesRenewable Energy
Green Subsector NAICS NAICS Description
Renewable energy 237990 Other heavy construction
Renewable energy 541711 Research and development in biotechnology
Renewable energy 541712 Other physical and biological research
Source: Bureau of Labor Statistics (BLS), https://www.bls.gov/green/industry_by_naics.pdf.
©2019 Automated Financial Systems, Inc. All Rights Reserved. Confidential & Proprietary.45April 25, 2019
Achieving Success through Execution
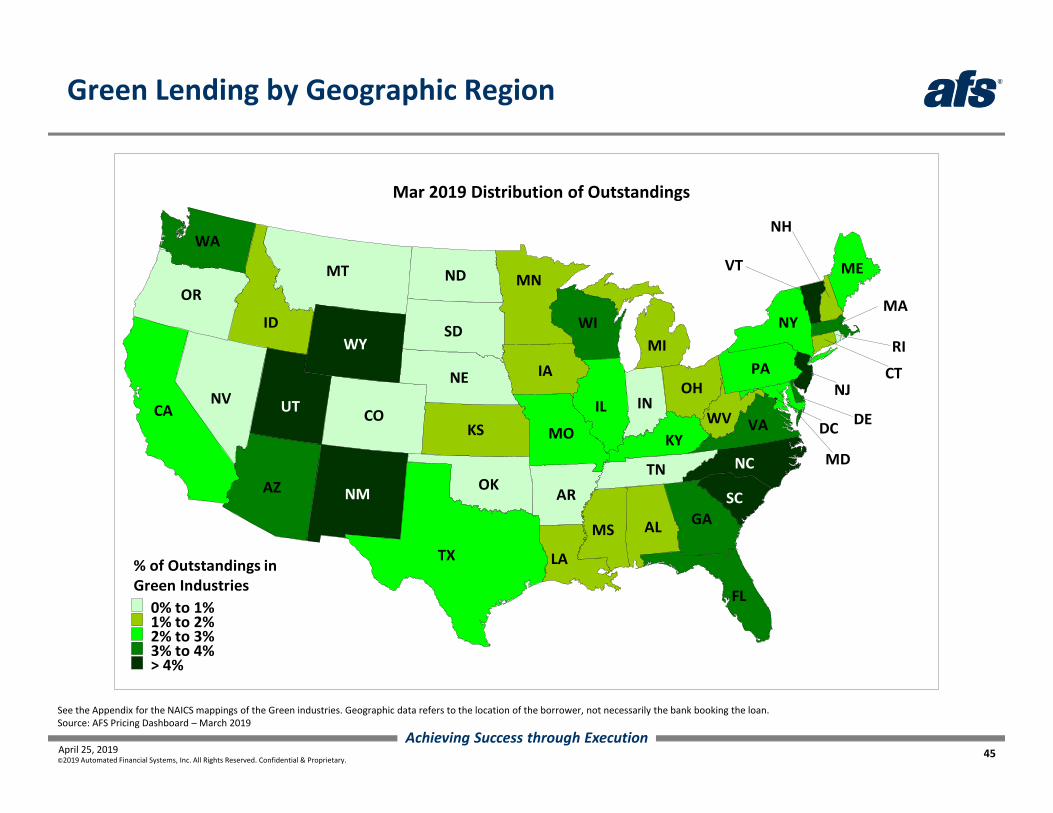
Green Lending by Geographic Region
See the Appendix for the NAICS mappings of the Green industries. Geographic data refers to the location of the borrower, not necessarily the bank booking the loan.Source: AFS Pricing Dashboard – March 2019
SD
ND
NENV
MT
TNOK
OR
IN
RI
AR
CO
MI
NH
OH
ID
MS
CT
LA
KS
AL
IA
MN
WVCA
ME
MO
NY
IL
MDKY
TX
PA
FL
AZ
WA
WI
GA
VA DE
MA
UT
NC
NJ
SCNM
DC
VT
WY
0% to 1%1% to 2%2% to 3%3% to 4%> 4%
% of Outstandings in Green Industries
Mar 2019 Distribution of Outstandings
©2019 Automated Financial Systems, Inc. All Rights Reserved. Confidential & Proprietary.46April 25, 2019
Achieving Success through Execution
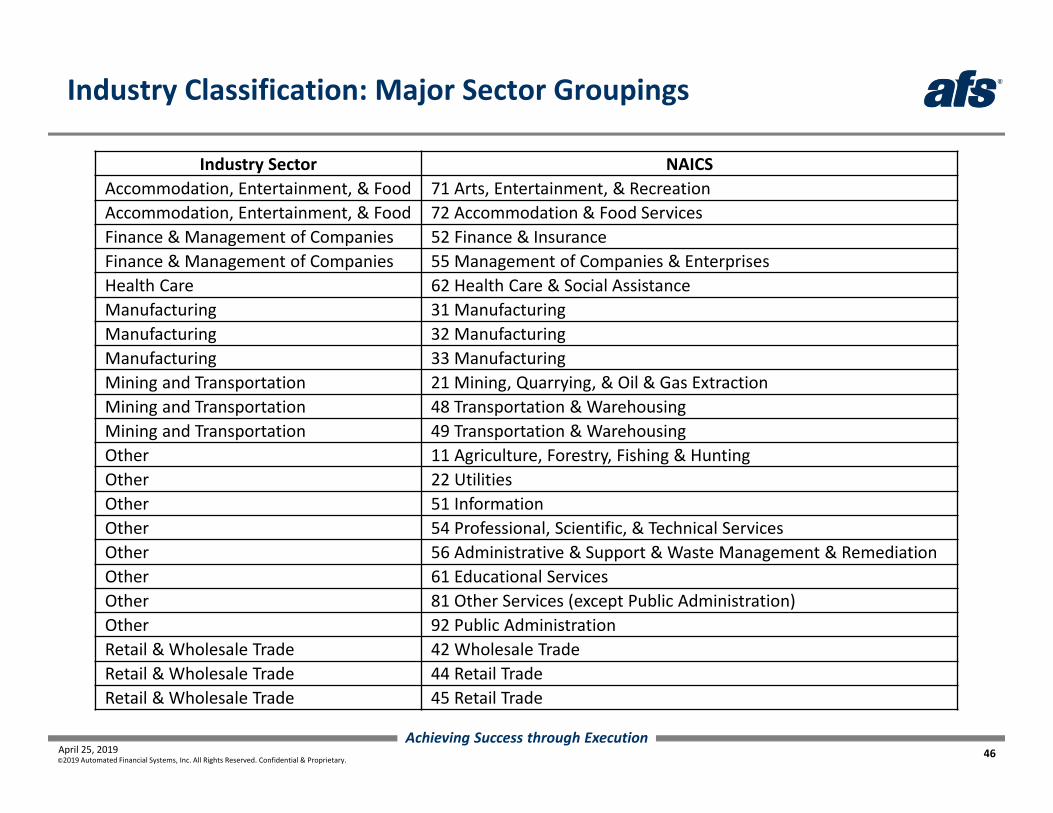
Industry Classification: Major Sector Groupings
Industry Sector NAICSAccommodation, Entertainment, & Food 71 Arts, Entertainment, & RecreationAccommodation, Entertainment, & Food 72 Accommodation & Food ServicesFinance & Management of Companies 52 Finance & InsuranceFinance & Management of Companies 55 Management of Companies & EnterprisesHealth Care 62 Health Care & Social AssistanceManufacturing 31 ManufacturingManufacturing 32 ManufacturingManufacturing 33 ManufacturingMining and Transportation 21 Mining, Quarrying, & Oil & Gas ExtractionMining and Transportation 48 Transportation & WarehousingMining and Transportation 49 Transportation & WarehousingOther 11 Agriculture, Forestry, Fishing & HuntingOther 22 UtilitiesOther 51 InformationOther 54 Professional, Scientific, & Technical ServicesOther 56 Administrative & Support & Waste Management & RemediationOther 61 Educational ServicesOther 81 Other Services (except Public Administration)Other 92 Public AdministrationRetail & Wholesale Trade 42 Wholesale TradeRetail & Wholesale Trade 44 Retail TradeRetail & Wholesale Trade 45 Retail Trade

©2019 Automated Financial Systems, Inc. All Rights Reserved. Confidential & Proprietary.47April 25, 2019
Achieving Success through Execution
Balance Growth by State and Industry: Bilateral Loans
Note: Geographic data refers to the location of the borrower, not necessarily the bank booking the loan. Industry categories based on North American Industry Classification System (NAICS).Source: AFS Pricing Dashboard – March 2019
ALARAZ
CA CO
CT
DCDE
FL
GA
IA
ID
IL INKS KY
LA
MA
MD
ME
MI
MN
MO
MS
MT
NC
ND
NE
NH
NJ
NM
NV
NY
OH
OK
OR
PARI
SC
SD
TN
TX
UTVA
VTWA
WI
WV
WY
Growth in Outstandings ‐ Predominant C&I Industries*Dec 2018 vs. Mar 2019
Bilateral Loans
Retail & Wholesale TradeHealth CareFinance & Management of CompaniesManufacturingMining and TransportationAccommodation, Entertainment, & FoodOther

©2019 Automated Financial Systems, Inc. All Rights Reserved. Confidential & Proprietary.48April 25, 2019
Achieving Success through Execution
Balance Growth by State and Industry: Participations
Note: Geographic data refers to the location of the borrower, not necessarily the bank booking the loan. Industry categories based on North American Industry Classification System (NAICS).Source: AFS Pricing Dashboard – March 2019
ALARAZ
CA CO
CT
DCDE
FL
GA
IA
ID
IL INKS KY
LA
MA
MD
ME
MI
MN
MO
MS
MT
NC
ND
NE
NH
NJ
NM
NV
NY
OH
OK
OR
PARI
SC
SD
TN
TX
UTVA
VTWA
WI
WV
WY
Growth in Outstandings ‐ Predominant C&I Industries*Dec 2018 vs. Mar 2019
Participations
Retail & Wholesale TradeHealth CareFinance & Management of CompaniesManufacturingMining and TransportationAccommodation, Entertainment, & FoodOther

©2019 Automated Financial Systems, Inc. All Rights Reserved. Confidential & Proprietary.49April 25, 2019
Achieving Success through Execution
Balance Growth: Industry Drivers by Geographic Region
The AFS Pricing Dashboard enables users to pinpoint industry loan growth drivers across their unique geographic footprints.
Note: Geographic data refers to the location of the borrower, not necessarily the bank booking the loan. Industry categories based on North American Industry Classification System (NAICS).Source: AFS Pricing Dashboard – March 2019
12.2%
‐0.2%
12.1%
6.6%
15.3%
7.3%
Manufacturing(Machinery,
Elec)
WholesaleTrade
Professional,Scientific,& Tech
Bilateral Participations
1.9% 3.7%
7.9%
2.2%
23.4%
6.6%
Real Estate Manufacturing(Machinery,
Elec)
Finance& Insurance
Bilateral Participations
0.5%2.3% 2.1%
9.5%
‐1.1%
16.1%
Finance& Insurance
Real Estate Retail Trade(Motor, Elec,
Bldg)
Bilateral Participations

©2019 Automated Financial Systems, Inc. All Rights Reserved. Confidential & Proprietary.50April 25, 2019
Achieving Success through Execution
Balance Growth: Industry Drivers by Geographic Region
Note: Geographic data refers to the location of the borrower, not necessarily the bank booking the loan. Industry categories based on North American Industry Classification System (NAICS).Source: AFS Pricing Dashboard – March 2019
2.3% 2.0%5.9%
11.0%
17.4%
‐2.2%Health Care& Social
Assistance
Accomm‐odation &
Food Services
Finance& Insurance
Bilateral Participations
16.0%
2.1%5.8%
42.6%
13.0%6.3%
Information Real Estate Finance& Insurance
Bilateral Participations
1.0%
‐1.3%
2.1%
‐2.5%
6.1%
0.0%
Real Estate Accomm‐odation &
Food Services
Manufacturing(Machinery,
Elec)
Bilateral Participations
20.0%
6.7%11.1%9.2%
29.7%
18.9%
WholesaleTrade
Finance& Insurance
Manufacturing(Machinery,
Elec)
Bilateral Participations
©2019 Automated Financial Systems, Inc. All Rights Reserved. Confidential & Proprietary.51April 25, 2019
Achieving Success through Execution
0.000.501.001.502.002.503.003.504.004.505.00
10‐Year Treasuries Fixed‐Rate Loans >10 Years(AFS Pricing Dashboard)
One‐Month LIBOR
LIBOR‐Rate Loans(AFS Pricing Dashboard)
5‐Year Treasuries
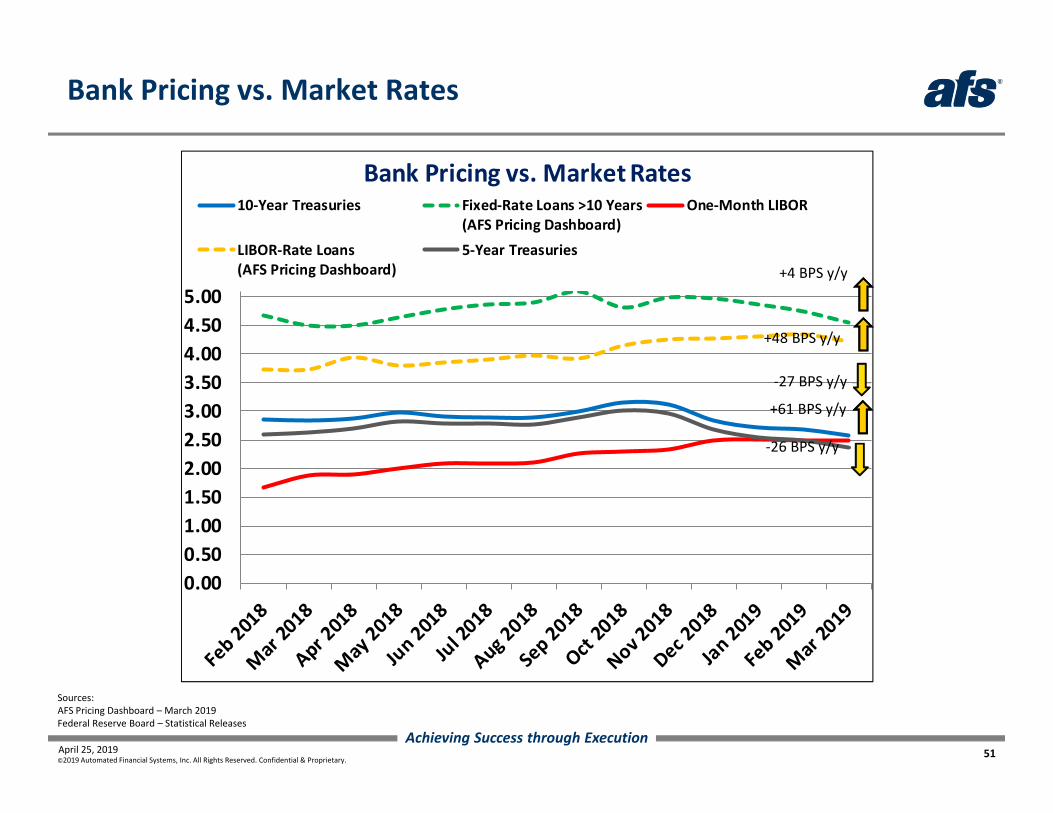
Bank Pricing vs. Market Rates
Bank Pricing vs. Market Rates
Sources: AFS Pricing Dashboard – March 2019Federal Reserve Board – Statistical Releases
+48 BPS y/y
‐26 BPS y/y
+4 BPS y/y
‐27 BPS y/y
+61 BPS y/y

©2019 Automated Financial Systems, Inc. All Rights Reserved. Confidential & Proprietary.52April 25, 2019
Achieving Success through Execution
Overall Line of Credit Utilization Remains Flat
Note: Geographic data refers to the location of the borrower, not necessarily the bank booking the loan. Industry categories based on North American Industry Classification System (NAICS).Source: AFS Pricing Dashboard – March 2019
20%
30%
40%
50%
60%Overall Line Usage < $1M $1M to < $5M
$5M to < $25M >= $25M Participations
Line of Credit Utilization Rate ‐ By Deal SizeRevolving Lines of Credit Only
51.1%
47.9%
47.0%
46.8%
45.4%
39.1%
33.8%
32.8%
31.4%
30.8%
30.1%
New HampshireUtah
Maryland
Oregon
ArkansasIndiana
WisconsinMissouri
Washington
Top 5 / Bottom 5 States ‐ Line Utilization Mar 2019 All Loan Types
Kansas
Nat'l Avg
50.8%
49.2%
45.4%
44.2%
42.0%
39.1%
34.5%
32.1%
31.5%
24.5%
20.9%
Agriculture
Retail Trade (Motor, Elec, Bldg)
Wholesale Trade Mining, Oil & Gas
Management
Public Administration
Professional, Scientific, & Tech
Retail Trade (Hobby, General)
Utilities Educational Services
Top 5 / Bottom 5 C&I Industries ‐ Line Utilization Mar 2019 All Loan Types
All Industries Avg

©2019 Automated Financial Systems, Inc. All Rights Reserved. Confidential & Proprietary.53April 25, 2019
Achieving Success through Execution
RMA 10‐Point Obligor Risk Rating Scale
Risk Key
Risk Rating
Risk Rating Category Definition and Criteria
1 Substantially Risk‐Free
High Pass Borrowers of unquestioned credit standing at the pinnacle of credit quality. Basically, governments and central banks of major industrialized countries, a few major world‐class banks, and a few multinational corporations.
2 Minimal Risk
High Pass Borrowers of the highest quality, presently and prospectively. Virtually no risk in lending to this class. Cash flows over at least five years demonstrate exceptionally large and/or stable margins of protection. Balance sheets are very conservative and strong with liquid assets. Projected cash flows, including anticipated credit extensions, exhibit strong trends in margins of protection, liquidity, and debt service coverage. Excellent asset quality and management. Access to world capital Markets under any conditions. Typically, large national companies with a significant share of a major, stable industry.
3 Modest Risk
High Pass Borrowers in the lower end of the high‐quality range but with excellent prospects. Very good asset quality and liquidity; consistently strong debt capacity and coverage; very good management. The credit extension is considered definitely sound; however, elements may be present that suggest the borrower may not be free from temporary impairments some‐time in the future. May have limited access to national capital Markets. Typically major regional companies in relatively stable industries.
4 Better than Average Risk
Moderate Pass
Borrowers in the high end of the medium range between borrowers who are definitely sound and those with minor risk characteristics. The margin of protection is good. Elements of strength are present in such areas as liquidity, stability of margins and cash flows, diversity of assets, and lack of dependence on one type of business. Reasonable access to capital Markets or bank financing is present; can always borrow at favorable rates and terms. Well‐established regional and excellent local companies operating in a reasonably stable industry that may be moderately affected by the business cycle and moderately open to changes. Management and owners have unquestioned character, as demonstrated by repeated performance.
5 Average Risk
Moderate Pass
Borrowers with smaller margins of debt service coverage and with some elements of reduced strength. Satisfactory asset quality and liquidity; good debt capacity and coverage; and good management in critical positions. These companies have good margins of protection and will definitely qualify as attractive borrowers. These borrowers will be able to obtain similar financing from other financial institutions and can generally borrow at attractive rates and terms. A loss year or a somewhat declining earnings trend may occur, but borrowers have sufficient strength and financial flexibility to offset these issues. These are typically solid companies often operating in cyclical industries that are somewhat vulnerable to change. Management and owners have unquestioned character. Depth of management may become an issue in a growing firm.

©2019 Automated Financial Systems, Inc. All Rights Reserved. Confidential & Proprietary.54April 25, 2019
Achieving Success through Execution
RMA 10‐Point Obligor Risk Rating Scale
Risk Key
Risk Rating
Risk Rating Category Definition and Criteria
6 Acceptable Risk
Low Pass Borrowers with declining earnings, strained cash flow, increasing leverage and/or weakening Market fundamentals that indicate above‐average risk. These borrowers generally have limited additional debt capacity and modest coverage and average or below average asset quality, margins, and Market share. Some management weakness exists. These borrowers should be able to obtain similar financing with comparable terms or somewhat worse, from other banks, but that ability may diminish in difficult economic times. Also, borrowers who are currently performing as agreed but could be adversely affected by such developing factors as deteriorating industry conditions, operating problems, pending litigation of a significant nature, or declining collateral quality/adequacy, and so forth. Companies with average or smaller Market shares operating in a cyclical or declining industry. Management and owners have good character, with no basis for questions.
7 Special Mention (Potential Weakness)
Criticized –Classified
Borrowers who exhibit potential credit weaknesses or downward trends deserving bank management’s close attention. If not checked or corrected, these trends will weaken the bank’s asset and position. While potentially weak, these borrowers are currently marginally acceptable; no loss of principal or interest is envisioned. As a result, special mention assets do not expose an institution to sufficient risk to warrant adverse classification. Included in special mention assets could be turnaround situations, as well as those borrowers previously rated 4–6 who have shown deterioration, for whatever reason, indicating a downgrading from the better categories. Typically companies in start‐up or deteriorating industries or with a poor and declining Market share in an average industry. An element of asset quality, financial flexibility, or management is below average. Management and owners may have limited depth and backup. Borrowers who have been or would normally be categorized special mention by regulatory authorities.
8 Substandard (Definite Weakness – Loss Unlikely)
Criticized –Classified
Borrowers with well‐defined weaknesses that jeopardize the orderly liquidation of debt. A substandard loan is inadequately protected by the current sound worth and paying capacity of the obligor or by the collateral pledged, if any. Normal repayment from the borrower is in jeopardy, although no loss of principal is envisioned. There is a distinct possibility that a partial loss of interest and/or principal will occur if the deficiencies are not corrected. Loss potential, while existing in the aggregate amount of substandard assets, does not have to exist in individual assets classified substandard. Management skills are questionable with readily identifiable voids. Borrowers that have been or would normally be classified substandard by regulatory authorities.

©2019 Automated Financial Systems, Inc. All Rights Reserved. Confidential & Proprietary.55April 25, 2019
Achieving Success through Execution
RMA 10‐Point Obligor Risk Rating Scale
Risk Key
Risk Rating
Risk Rating Category Definition and Criteria
9 Doubtful (Partial Loss Probable)
Criticized –Classified
Borrowers classified doubtful have the weaknesses found in substandard borrowers with the added provision that the weaknesses make collection of debt in full, on the basis of currently existing facts, conditions, and values, highly questionable and improbable. Serious problems exist to the point where partial loss of principal is likely. The possibility of loss is extremely high, but because of certain important, reasonably specific pending factors that may work to strengthen the assets, the loans’ classification as estimated losses are deferred until a more exact status may be determined. Pending factors include proposed merger, acquisition, or liquidation procedures; capital injection; perfecting liens on additional collateral; and refinancing plans. Reserves are generally established to provide for these uncertainties. Management has a demonstrated history of failing to live up to agreements, unethical or dishonest business practices, bankruptcy, and/or conviction on criminal charges.
10 Loss (Definite Loss)
Criticized –Classified
Borrowers deemed incapable of repayment of unsecured debt. Loans to such borrowers are considered uncollectible and of such little value that continuance as active assets of the bank is not warranted. This classification does not mean that the loans have absolutely no recovery or salvage value but, rather, it is not practical or desirable to defer writing off these basically worthless assets even though partial recovery may be effected in the future.

Additional FeaturesDelivering Market Data
©2019 Automated Financial Systems, Inc. All Rights Reserved. Confidential & Proprietary.

©2019 Automated Financial Systems, Inc. All Rights Reserved. Confidential & Proprietary.57April 25, 2019
Achieving Success through Execution
Delivering Market Data: Simple Pricing Grid
AFS will work with the bank to define the appropriate segmentation criteria and level of granularity. This can be used for integration into other systems at the bank.
Min/Median/Max/Avg of Banks in Market
Segmentation Criteria
Sample data for illustration purposes only.
Region Collateral Pricing Index Product
New & Renewed
FlagTerm Deal Size EL Number of
Observations
Bank Minimum LIBOR
Equivalent Spread
Bank Median LIBOR
Equivalent Spread
Bank Maximum LIBOR
Equivalent Spread
Market AverageLIBOR
Equivalent Spread
South Secured Re Prime Line of Credit New <= 1 Year $100,000‐$249,999 4.0% < 8.0% 42 3.58 3.70 4.01 3.70
Eastern Midwest Secured No Fixed Line of Credit New 2‐5 Years $5,000,000‐$24,999,999 4.0% < 8.0% 20 2.03 2.03 2.03 2.03
South Secured No Prime Line of Credit New 5‐10 Years <$100,000 4.0% < 8.0% 18 5.64 5.64 5.64 5.64
Eastern Midwest Secured No Fixed Line of Credit New 1‐2 Years $5,000,000‐$24,999,999 4.0% < 8.0% 16 2.16 2.16 2.16 2.16
Eastern Midwest Secured No Fixed Line of Credit New 2‐5 Years <$100,000 4.0% < 8.0% 15 2.09 2.09 2.09 2.09
Eastern Midwest Unsecured LIBOR Line of Credit New <= 1 Year $50,000,000+ 4.0% < 8.0% 14 2.50 2.50 2.50 2.50
South Secured No Fixed Term/Time Loan New 5‐10 Years <$100,000 4.0% < 8.0% 14 4.25 5.90 7.55 4.30
Middle Atlantic Secured Re Prime Line of Credit New <= 1 Year $100,000‐$249,999 4.0% < 8.0% 9 3.77 3.77 3.77 3.77
Eastern Midwest Secured No Fixed Line of Credit New <= 1 Year $5,000,000‐$24,999,999 4.0% < 8.0% 7 2.00 2.00 2.00 2.00
South Secured No Fixed Term/Time Loan New 2‐5 Years <$100,000 4.0% < 8.0% 7 4.03 4.03 4.03 4.03
South Secured No Prime Line of Credit New Unknown/ <$100,000 4.0% < 8.0% 7 5.85 5.85 5.85 5.85
Middle Atlantic Secured Re LIBOR Term/Time Loan New <= 1 Year $1,000,000‐$4,999,999 4.0% < 8.0% 6 4.00 4.00 4.00 4.00
South Secured Re LIBOR Term/Time Loan New 1‐2 Years $5,000,000‐$24,999,999 4.0% < 8.0% 6 3.50 3.50 3.50 3.50
Middle Atlantic Secured No Prime Line of Credit New 5‐10 Years <$100,000 4.0% < 8.0% 5 5.13 5.13 5.13 5.13
Western Midwest Secured Re Prime Line of Credit New <= 1 Year $250,000‐$499,999 4.0% < 8.0% 5 2.93 2.93 2.93 2.93

©2019 Automated Financial Systems, Inc. All Rights Reserved. Confidential & Proprietary.58April 25, 2019
Achieving Success through Execution
Upcoming Renewals Report
PDB View – Includes the Upcoming Renewals Report. Business Purpose – Provides actionable data to support pricing decisions on loans coming
up for renewal. Key Insights – Provides a total market equivalent price for each obligation based on
shared loan characteristics. Allows the Bank to maximize the revenue on each deal while still maintaining its competitive advantage. From an accountability perspective, shows how the pricing of each individual obligation compares to external standards.
For the borrower circled below, the Bank can reprice at more advantageous terms while still undercutting its competitors.
Sample data for illustration purposes only.

©2019 Automated Financial Systems, Inc. All Rights Reserved. Confidential & Proprietary.59April 25, 2019
Achieving Success through Execution
Pricing Performance: Recent New and Renewed Deals
For enforcement of policy, reporting on all New and recently Renewed deals provides an audit of pricing exceptions.
Sample data for illustration purposes only.