after the crisis: the economics of the p-c insurance ...-400-200 0 200 400 600 8 8 8 8 8 8 8 8 8 8 8...
TRANSCRIPT

After the Crisis:
the Economics of the P-C
Insurance Industry Energy Market
Trends and Challenges
Robert P. Hartwig, Ph.D., CPCU
President and Economist
Insurance Information Institute

Presentation Outline
• The Economic Storm: Reasons for Optimism, Causes for Concern
• Demand Drivers for Energy and Energy Insurance
• Looking Beyond the Crisis: Energy and Insurance Markets
• Energy Consumption, Capacity and Carbon Emissions
– Long-Term Investment in Energy Sector and Insurance Implications
• Insurance Industry Financial Overview and Outlook
– Profitability
– Financial Strength
– Premium Growth/Soft Market
Presentation Outline
• Insurance Industry Financial Overview and Outlook
– Underwriting Performance
– Capital/Capacity
– Financial Market Impacts
• Tort System Review: Overview and Causes for Concern
• Catastrophe Loss Overview
• Deepwater Horizon: Implications for Energy and Insurance Markets

The Economic Storm
The US Economic Recovery Will Remain Weak Impacting Insurance and Energy Markets Alike
Reasons for Optimism, Causes for Concern
in the P/C Insurance Industry
• Economic recovery in US is self-sustaining: no double dip recession
• European debt crisis will pass; concerns are overblown
– Volatility will remain a reality, however
• No secondary spike in unemployment or swoon in payrolls
– But job and wage growth will remain sluggish
• Global P/C (re)insurance has recaptured 100% of capital/capacity eroded away during the financial crisis
– Critical given ongoing volatility and threat of severe hurricane season in the US and high catastrophe losses on a global basis
Source: Insurance Information Institute.

Reasons for Optimism, Causes for Concern
in the P/C Insurance Industry
• Investment environment is/remains much more favorable
– Volatility, however, will persist and yields remain low
– Both are critical issues in pricing long-tailed commercial lines like WC, D&O
• Financial strength and ratings of global (re)insurance industries remained strong throughout the financial crisis in sharp contrast with banks
• Insurers avoided draconian outcomes in financial services reform
• Tort environment in US is beginning to deteriorate; no tort reform in US
• Major transformation of US economy underway with major opportunities for insurers through 2020 in health, tech, natural resources and energy
Source: Insurance Information Institute.
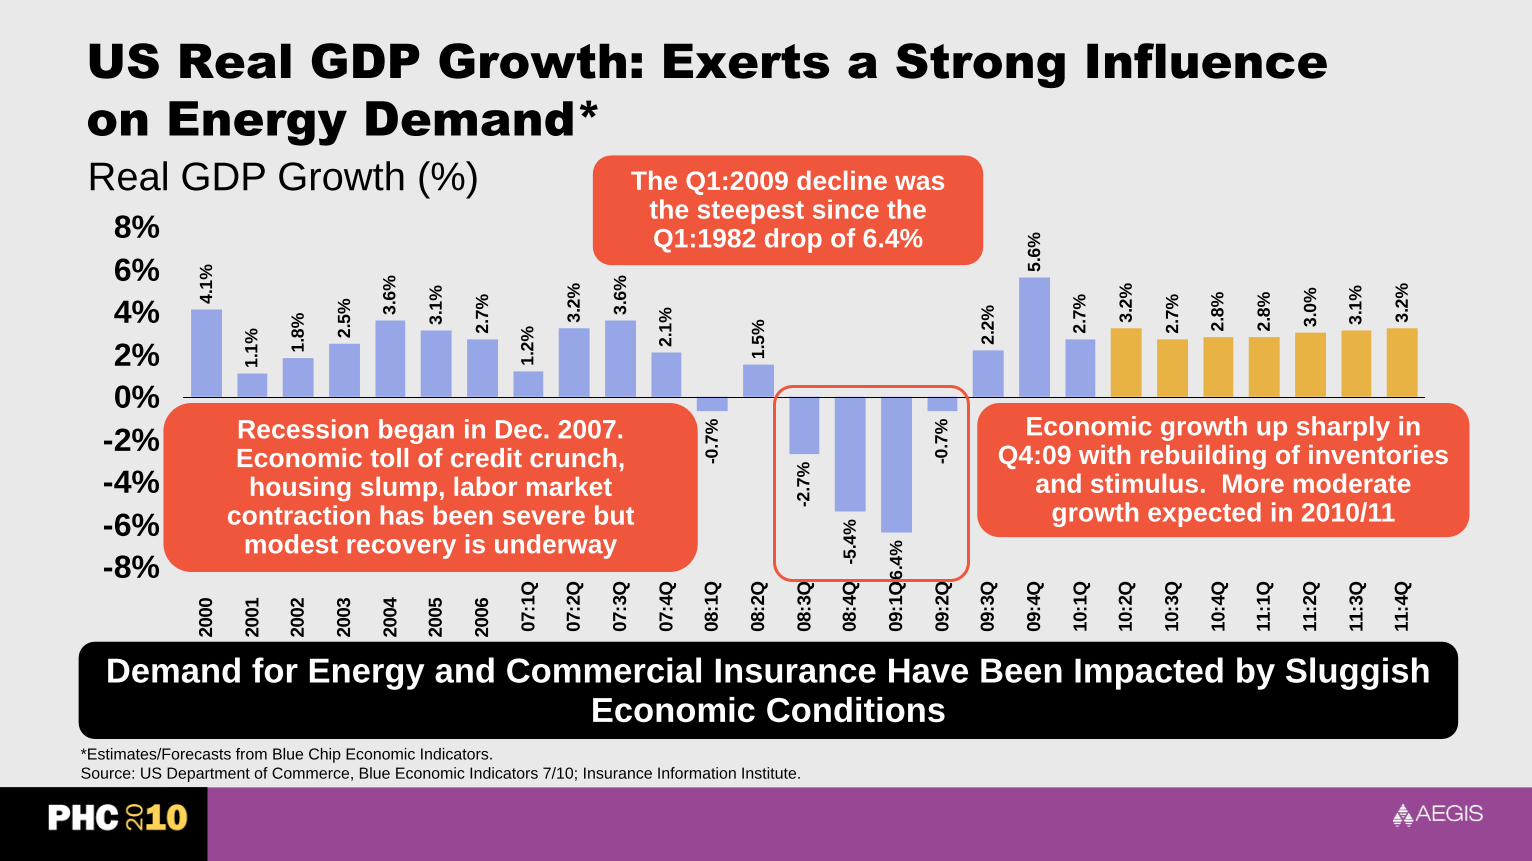
US Real GDP Growth: Exerts a Strong Influence
on Energy Demand*
4.1
%
1.1
%
1.8
%
2.5
% 3.6
%
3.1
%
2.7
%
1.2
%
3.2
%
3.6
%
2.1
%
-0.7
%
1.5
%
-2.7
%
-5.4
%
-6.4
%
-0.7
%
2.2
%
5.6
%
2.7
%
3.2
%
2.7
%
2.8
%
2.8
%
3.0
%
3.1
%
3.2
%
-8%
-6%
-4%
-2%
0%
2%
4%
6%
8%
2000
2
001
2
002
2
003
2
004
2
005
2
006
07:1
Q
07:2
Q
07:3
Q
07:4
Q
08:1
Q
08:2
Q
08:3
Q
08:4
Q
09:1
Q
09:2
Q
09:3
Q
09:4
Q
10:1
Q
10:2
Q
10:3
Q
10:4
Q
11:1
Q
11:2
Q
11:3
Q
11:4
Q
Real GDP Growth (%)
*Estimates/Forecasts from Blue Chip Economic Indicators.
Source: US Department of Commerce, Blue Economic Indicators 7/10; Insurance Information Institute.
Demand for Energy and Commercial Insurance Have Been Impacted by Sluggish Economic Conditions
Recession began in Dec. 2007. Economic toll of credit crunch, housing slump, labor market
contraction has been severe but modest recovery is underway
The Q1:2009 decline was the steepest since the Q1:1982 drop of 6.4%
Economic growth up sharply in Q4:09 with rebuilding of inventories
and stimulus. More moderate growth expected in 2010/11

Factors Influencing Demand
for Energy and Insurance
Commercial and ConsumerDemand Drivers Remain Tepid

Total Industrial Production
1.5%3.2% 3.6%
0.3% 0.2%
-4.6%
-9.0%
-13.0%
-17.6%
-10.3%
8.3%7.0% 6.9% 6.3%
4.9% 4.6% 4.4% 4.3% 4.2% 4.2%
-20%
-15%
-10%
-5%
0%
5%
10%07:Q
1
07:Q
2
07:Q
3
07:Q
4
08:Q
1
08:Q
2
08:Q
3
08:Q
4
09:Q
1
09:Q
2
09:Q
3
09:Q
4
10:Q
1
10:Q
2
10:Q
3
10:Q
4
11:Q
1
11:Q
2
11:Q
3
11:Q
4
Industrial production is aided by a rebuild of inventories, gradual economic recovery and Stimulus
Program (Q2:09 through 2010)
Industrial production began to contract sharply in late
2008 and plunged in 2009:Q1
2007:Q1 to 2011:Q4F (%)
End of Recession in mid-2009, Stimulus Program Benefited Industrial Production and Insurance Exposure Both Directly and Indirectly, Albeit it Very Modestly; Stimulus Effect is Waning in 2010 and Will Be Gone in 2011.
Sources: US Bureau of Labor Statistics; Blue Chip Economic Indicators (7/10); Insurance Information Institute
66%
68%
70%
72%
74%
76%
78%
80%
82%M
ar
01
Ju
n 0
1
Sep
01
Dec 0
1
Mar
02
Ju
n 0
2
Sep
02
Dec 0
2
Mar
03
Ju
n 0
3
Sep
03
Dec 0
3
Mar
04
Ju
n 0
4
Sep
04
Dec 0
4
Mar
05
Ju
n 0
5
Sep
05
Dec 0
5
Mar
06
Ju
n 0
6
Sep
06
Dec 0
6
Mar
07
Ju
n 0
7
Sep
07
Dec 0
7
Mar
08
Ju
n 0
8
Sep
08
Dec 0
8
Mar
09
Ju
n 0
9
Sep
09
Dec 0
9
Mar
10
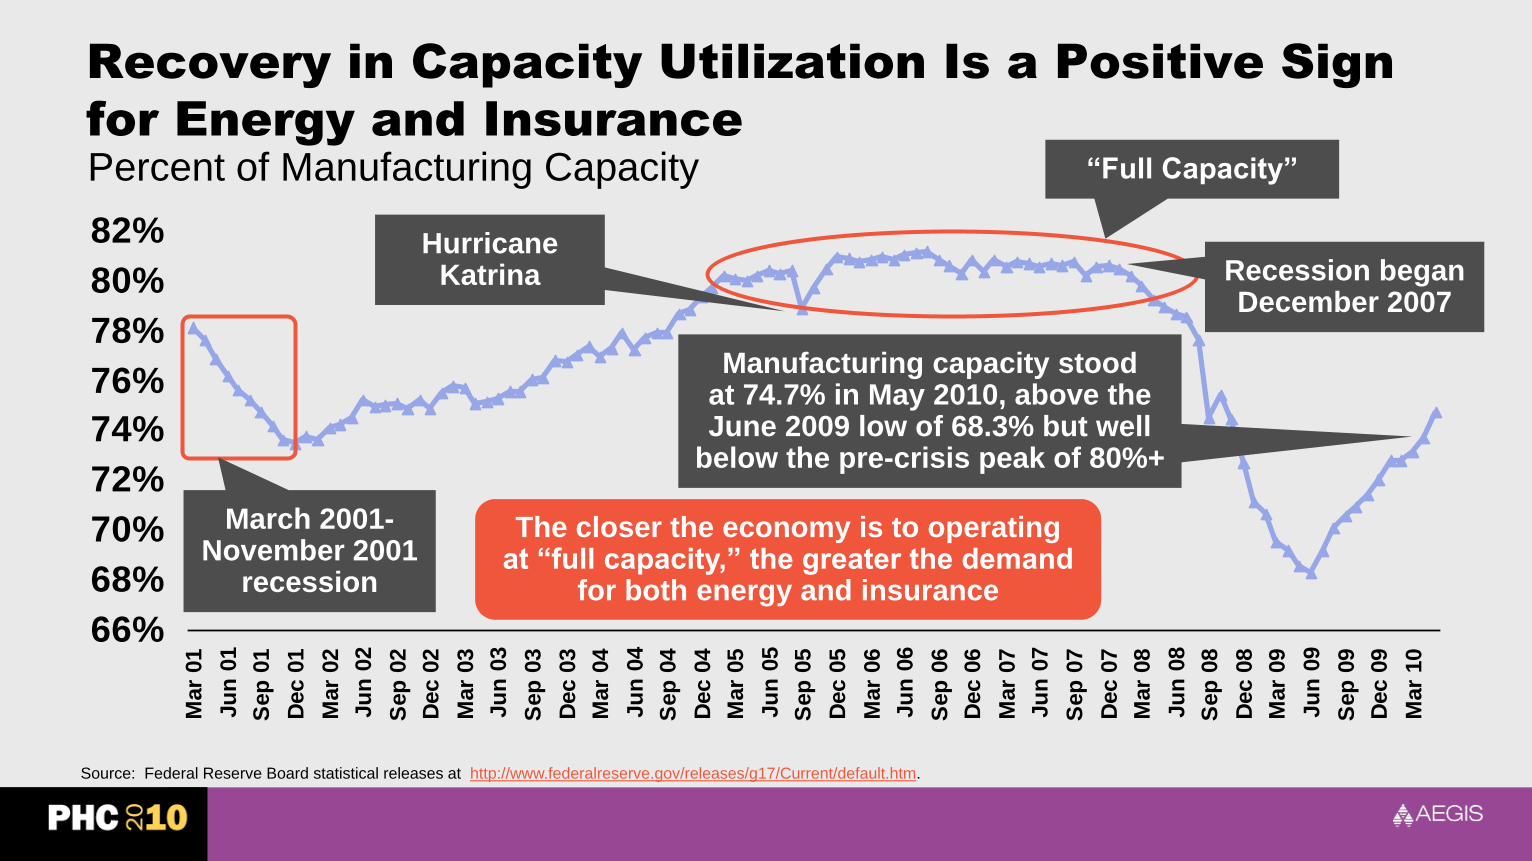
Recovery in Capacity Utilization Is a Positive Sign
for Energy and Insurance
Source: Federal Reserve Board statistical releases at http://www.federalreserve.gov/releases/g17/Current/default.htm.
Hurricane Katrina
“Full Capacity”
The closer the economy is to operating at “full capacity,” the greater the demand
for both energy and insurance
Manufacturing capacity stood at 74.7% in May 2010, above the June 2009 low of 68.3% but well
below the pre-crisis peak of 80%+
Recession began December 2007
Percent of Manufacturing Capacity
March 2001-November 2001
recession

16
.9
16
.5
16
.1
13
.1
10
.3 11
.7 13
.1
16
.9
16
.6
17
.1
17
.5
17
.8
17
.4
9
11
13
15
17
19
99 00 01 02 03 04 05 06 07 08 09 10F 11F
Auto/Light Truck Sales, 1999-2011F
Source: U.S. Department of Commerce; Blue Chip Economic Indicators (7/10); Insurance Information Institute.
New auto/light truck sales fell to the lowest level since the
late 1960s. Forecast for 2010-11 is still far below 1999-2007
average of 17 million units
Sharply lower auto sales will have a smaller effect on auto insurance
exposure level than problems in the housing market will on home insurers
“Cash for Clunkers” generated about $300M in net new personal auto premiums
(Millions of Units)
Car/Light Truck Sales Will Recover from the 2009 Low Point, but High Unemployment, Tight Credit Are Still Restraining Sales; Gas Prices Could Once Again Become a Factor, Too
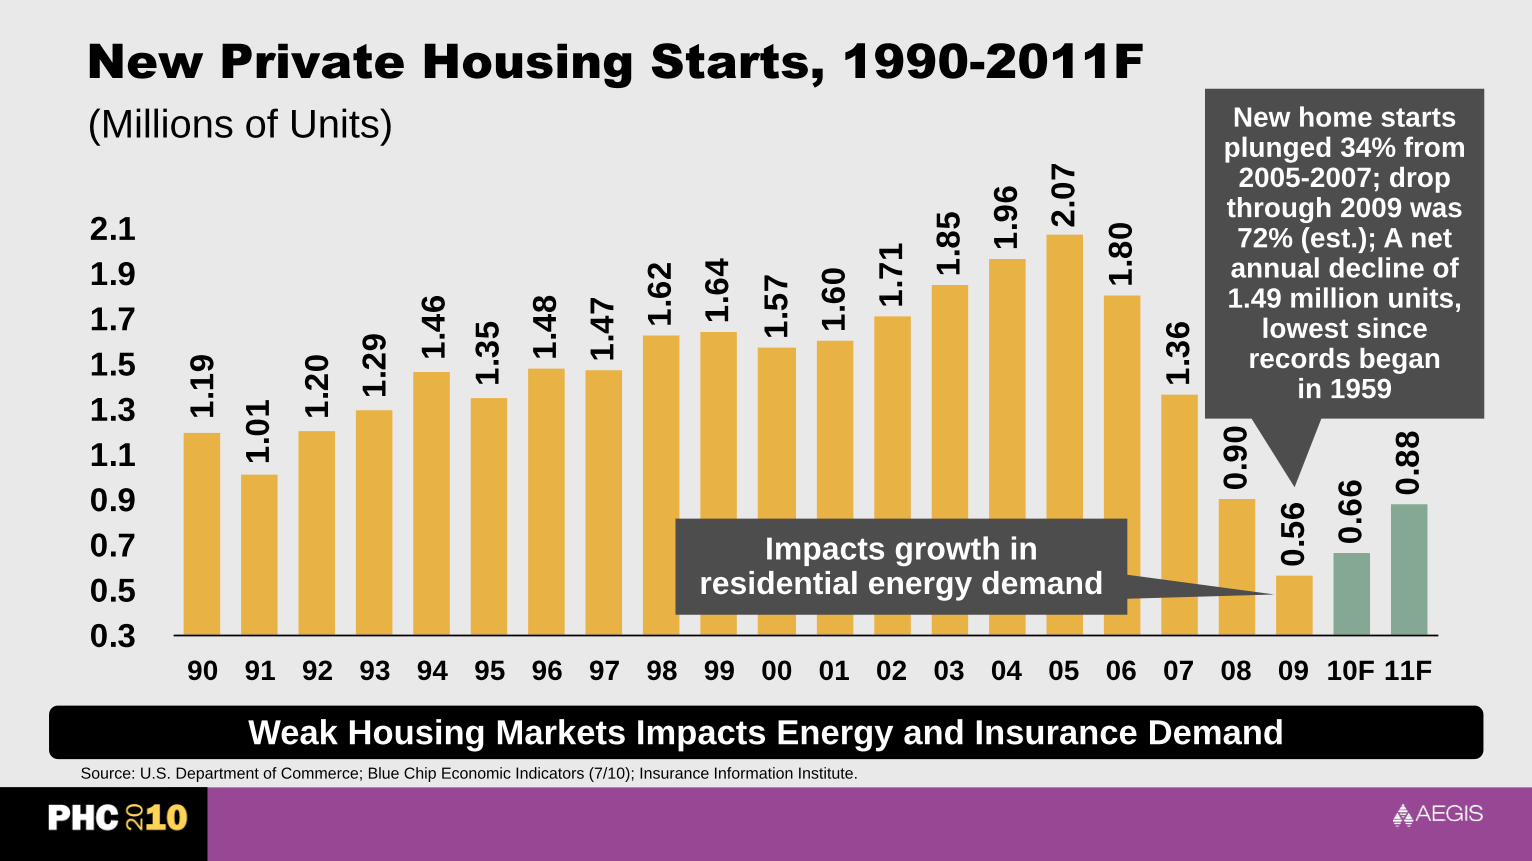
New Private Housing Starts, 1990-2011F
1.4
8
1.4
7 1.6
2
1.6
4
1.5
7
1.6
0
1.7
1 1.8
5
1.9
6
2.0
7
1.8
0
1.3
6
0.9
0
0.5
6
0.6
6 0.8
8
1.3
5
1.4
6
1.2
9
1.2
0
1.0
11.1
9
0.3
0.5
0.7
0.9
1.1
1.3
1.5
1.7
1.9
2.1
90 91 92 93 94 95 96 97 98 99 00 01 02 03 04 05 06 07 08 09 10F 11F
Source: U.S. Department of Commerce; Blue Chip Economic Indicators (7/10); Insurance Information Institute.
New home starts plunged 34% from 2005-2007; drop
through 2009 was 72% (est.); A net annual decline of 1.49 million units,
lowest since records began
in 1959
Impacts growth in residential energy demand
Weak Housing Markets Impacts Energy and Insurance Demand
(Millions of Units)
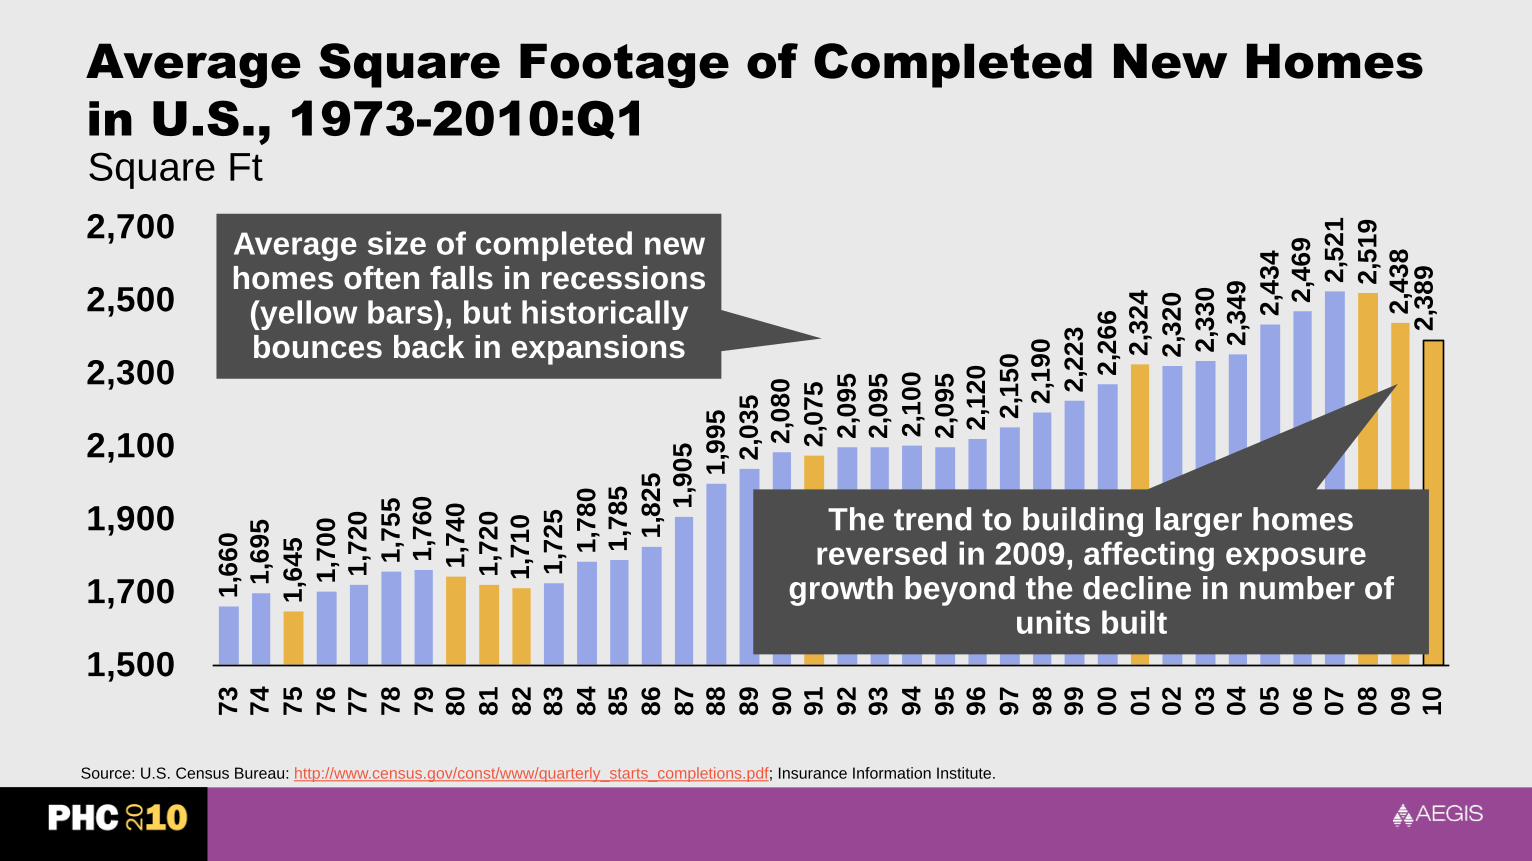
Average Square Footage of Completed New Homes
in U.S., 1973-2010:Q1
1,6
60
1,6
95
1,6
45
1,7
00
1,7
20
1,7
55
1,7
60
1,7
40
1,7
20
1,7
10
1,7
25
1,7
80
1,7
85
1,8
25
1,9
05
1,9
95
2,0
35
2,0
80
2,0
75
2,0
95
2,0
95
2,1
00
2,0
95
2,1
20
2,1
50
2,1
90
2,2
23
2,2
66
2,3
24
2,3
20
2,3
30
2,3
49
2,4
34
2,4
69
2,5
21
2,5
19
2,4
38
2,3
89
1,500
1,700
1,900
2,100
2,300
2,500
2,7007
3
74
75
76
77
78
79
80
81
82
83
84
85
86
87
88
89
90
91
92
93
94
95
96
97
98
99
00
01
02
03
04
05
06
07
08
09
10
Source: U.S. Census Bureau: http://www.census.gov/const/www/quarterly_starts_completions.pdf; Insurance Information Institute.
The trend to building larger homes reversed in 2009, affecting exposure
growth beyond the decline in number of units built
Average size of completed new homes often falls in recessions (yellow bars), but historically bounces back in expansions
Square Ft

43
,69
4
48
,12
5
69
,30
0
62
,43
6
64
,00
4
71
,27
7
81
,23
5
82
,44
6
63
,85
3
63
,23
5
64
,85
3
71
,54
9
70
,64
3
62
,30
4
52
,37
4
51
,95
9
53
,54
9
54
,02
7
44
,36
7
37
,88
4
35
,47
2
40
,09
9
38
,54
0
35
,03
7
34
,31
7
39
,20
1
19
,69
5
28
,32
2 43
,54
6 60
,83
7
14
,60
7
0
10,000
20,000
30,000
40,000
50,000
60,000
70,000
80,000
90,0008
0
81
82
83
84
85
86
87
88
89
90
91
92
93
94
95
96
97
98
99
00
01
02
03
04
05
06
07
08
09
10
:Q1
Business Bankruptcy Filings,
1980-2010:Q1
Source: American Bankruptcy Institute; Insurance Information Institute
There were 60,837 business bankruptcies in 2009, up 40% from 2008 and the most since 1993.
2010:Q1 bankruptcies totaled 14,607, up 18% from Q1:2009
% Change Surrounding Recessions
1980-82 58.6%
1980-87 88.7%
1990-91 10.3%
2000-01 13.0%
2006-09 208.9%*
Significant Exposure Implications for All Commercial Lines

Private Sector Business Starts,
1993:Q2 – 2009:Q3*
175
186
174 1
80 1
86 1
92
188
187
189
186 190 194
191
199 2
04
202
195
196
196
206
206
201
192 1
98
206
206
203
211
205
212
200 2
05
204
204
197 2
03 2
09
201
192
192
193
201 204
202
210
212
209
216 220 223
220
220
210
221
212
204
218
209
207
199
191
193
171 1
77
169
203
150
160
170
180
190
200
210
220
230
93 94 95 96 97 98 99 00 01 02 03 04 05 06 07 08 09
*Latest available as of June 7, 2010, seasonally adjusted
Source: Bureau of Labor Statistics, http://www.bls.gov/news.release/cewbd.t07.htm.
Business Starts Are Down Nearly 20% in the Current Downturn, Holding Back Most Types of Commercial Insurance Exposure
(Thousands)
169,000 businesses started in 2009:Q3, actually declining during form the prior quarter.
The figure is the lowest level since 1993.

US Unemployment Rate
4.5
%
4.5
%
4.6
%
4.8
%
4.9
%
5.4
% 6.1
% 6.9
%
8.1
%
9.3
%
9.6
%
10
.0%
9.7
%
9.7
%
9.6
%
9.4
%
9.2
%
9.0
%
8.8
%9.5
%
4.0%
5.0%
6.0%
7.0%
8.0%
9.0%
10.0%
11.0%0
7:Q
1
07
:Q2
07
:Q3
07
:Q4
08
:Q1
08
:Q2
08
:Q3
08
:Q4
09
:Q1
09
:Q2
09
:Q3
09
:Q4
10
:Q1
10
:Q2
10
:Q3
10
:Q4
11
:Q1
11
:Q2
11
:Q3
11
:Q4
Rising unemployment eroded payrolls and workers comp’s
exposure base.
Unemployment likely peaked at 10% in late 2009.
* = actual; = forecasts
Sources: US Bureau of Labor Statistics; Blue Chip Economic Indicators (7/10); Insurance Information Institute
Unemployment forecasts are being revised downward
for the first time in years
2007:Q1 to 2011:Q4F*

-128
-175
-321
-380
-597
-681
-779
-726
-753
-528 -3
87
-515 -3
46 -2
12
-225
-224
64
-109
14 39
208 313 4
33
-125
-161
-137
-160
-122
-144-7
2
-1,000
-800
-600
-400
-200
0
200
400
600J
an
08
Fe
b 0
8
Ma
r 0
8
Ap
r 0
8
Ma
y 0
8
Ju
n 0
8
Ju
l 0
8
Au
g 0
8
Se
p 0
8
Oc
t 0
8
No
v 0
8
De
c 0
8
Ja
n 0
9
Fe
b 0
9
Ma
r 0
9
Ap
r 0
9
Ma
y 0
9
Ju
n 0
9
Ju
l 0
9
Au
g 0
9
Se
p 0
9
Oc
t 0
9
No
v 0
9
De
c 0
9
Ja
n 1
0
Fe
b 1
0
Ma
r 1
0
Ap
r 1
0
Ma
y 1
0
Ju
n 1
0
Monthly Change Employment*
Job Losses Since the Recession Began in Dec. 2007 Peaked at 8.4 Mill in Dec. 09; Stands at 7.4 Million Through June 2010; 14.6 Million People are Now Defined as Unemployed
January 2008 through June 2010* (Thousands)
*Estimate based on Reuters poll of economists.
Source: US Bureau of Labor Statistics: http://www.bls.gov/ces/home.htm; Insurance Information Institute
Monthly losses in Dec. 08–Mar. 09 were the largest in the Post-WW II Period
May’s gain of 433,000 jobs was distorted by the hiring of 411,000 temporary Census workers. June’s loss of 125,000 jobs was distorted by the end of 225,000 Census jobs. Private sector
employment was up 41,000 in May and 83,000 in June.
4.3
%
18.6
%
20.3
%
5.8
%
0.3
%
-1.6
%
-1.0
%
-1.8
%
-1.0
%
3.1
%
1.1
%
0.8
%
0.4
%
0.6
%
-0.4
%
-0.3
%
1.6
% 5.6
%
13.7
%
7.7
%
1.2
%
-2.9
%
-0.5
%
-3.8
%
-4.4
%
-3.3
%
-3.0
%
1.8
%
-1.5
%
-6.5
%
-7.4
%
-0.9
%
5.2
%
-10%
-5%
0%
5%
10%
15%
20%
25%7
87
98
08
18
28
38
48
58
68
78
88
99
09
19
29
3
94
95
96
97
98
99
00
01
02
03
04
05
06
07
08
09
10
E
-4%
-2%
0%
2%
4%
6%
8%
Real NWP Growth Real GDP
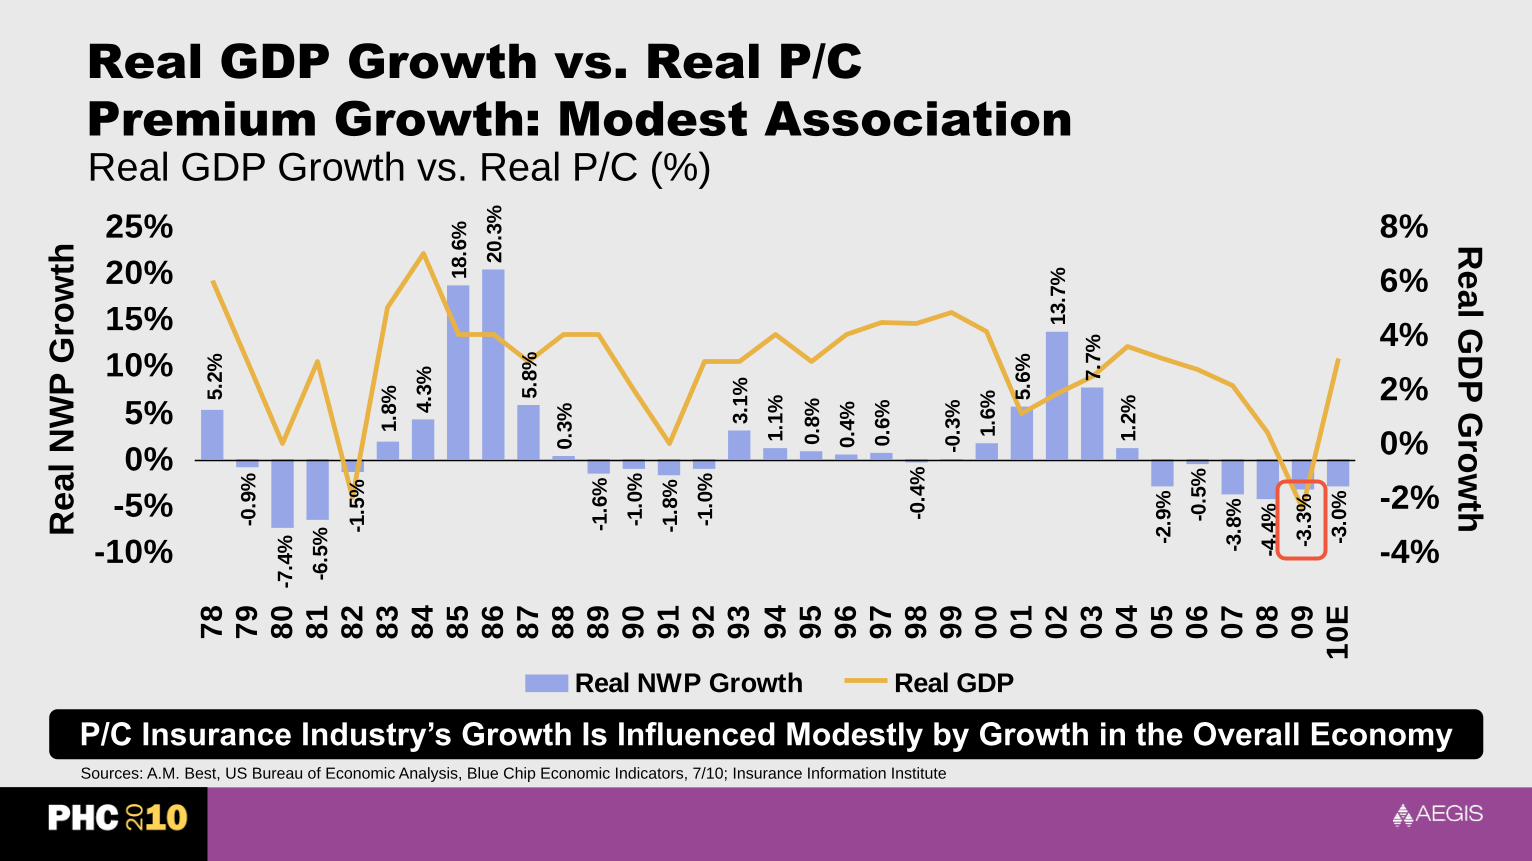
Real GDP Growth vs. Real P/C
Premium Growth: Modest Association
Real GDP Growth vs. Real P/C (%)
Sources: A.M. Best, US Bureau of Economic Analysis, Blue Chip Economic Indicators, 7/10; Insurance Information Institute
P/C Insurance Industry’s Growth Is Influenced Modestly by Growth in the Overall Economy
Real G
DP
Gro
wth
Real
NW
P G
row
th

Inflation Trends: Concerns over
Stimulus Spending and Monetary
Policy Have Not Yet Materialized
Rising Inflation Would Pressure Claim Costs Severities via Higher Materials, Labor, Medical and Tort Costs

Annual Inflation Rates
(CPI-U, %), 1990–2011F
2.8 2.6
1.51.9
3.3 3.4
1.3
2.5 2.33.0
3.8
2.8
3.8
-0.4
1.7 1.5
2.92.4
3.23.0
5.14.9
-1.0
0.0
1.0
2.0
3.0
4.0
5.0
6.0
90 91 92 93 94 95 96 97 98 99 00 01 02 03 04 05 06 07 08 09 10F 11F
Sources: US Bureau of Labor Statistics; Blue Chip Economic Indicators, July 10, 2010 (forecasts).
Inflation peaked at 5.6% in August 2008 on high energy and commodity crisis. The
recession and the collapse of the commodity bubble have reduced inflationary pressures
Annual Inflation Rates (%)
There is So Much Slack in the US Economy Inflation Should Not Be a Concern Through 2010/11, but Deficits and Monetary Policy Remain Longer Run Concerns

P/C Insurers Experience Inflation More Intensely
than 2009 CPI Suggests
*Measured Dec. 2009 vs. Dec. 2008.
Source: Bureau of Labor Statistics. Tort cost is 2009 Towers-Perrin estimate. WC figure is I.I.I. estimate based on historical NCCI data.
-0.4%
2.7% 3.0% 3.1% 3.4% 3.8%
5.5%
6.9%
-2%
0%
2%
4%
6%
8%
Overall CPI Legal
Services
US Tort
Costs
Medical
Care
Prescription
Drugs*
Motor
Vehicle
Body Work
WC Med
Severity
Hospital
Services*
(Percent)
Healthcare and Legal/Tort Costs Are a Major P/C Insurance Cost Driver. These Are Expected to Increase Above the Overall Inflation Rate (CPI) Indefinitely

4.5%
3.5%2.8%
3.2% 3.5%4.1%
4.6% 4.7%4.0%
4.4% 4.2% 4.0%4.4%
3.7%3.4%
5.1%
7.4%
10.1%
8.3%
10.6%
7.3%
13.5%
8.8%
7.3%
5.6%
7.4%
5.4% 5.4%
6.7%
5.0%
0%
2%
4%
6%
8%
10%
12%
14%
16%
1995 1996 1997 1998 1999 2000 2001 2002 2003 2004 2005 2006 2007 2008 2009
Change in Medical CPI
Change Med Cost per Lost Time Claim
WC Medical Severity Rising
at Twice the Medical CPI Rate
Sources: Med CPI from US Bureau of Labor Statistics, WC med severity from NCCI based on NCCI states.
Average annual increase in WC medical severity form 1995 through 2009 was nearly twice the medical CPI (7.6% vs. 3.9%). New healthcare reform legislation is unlikely to
have any impact on the gap.

Recent Appreciation of the Dollar Reduces
Inflationary Pressure, Especially for Energy Inputs
*As of June 2010.
Source: Source: US Federal Reserve, Board of Governors; Insurance Information Institute.
$1.065
$0.923$0.895
$0.945
$1.256
$1.371
$1.473
$1.394
$1.223$1.245$1.244
$1.132
$0.8
$0.9
$1.0
$1.1
$1.2
$1.3
$1.4
$1.5
$1.6
99 00 01 02 03 04 05 06 07 08 09 10*
US Dollar vs. Euro, 1999 through June 2010

World Crude Oil Prices: 1997- July 2010
*All countries spot market price weighted by estimated export volume.
Source: Energy Information Administration; http://tonto.eia.doe.gov/dnav/pet/hist/wtotworldw.htm
$0
$20
$40
$60
$80
$100
$120
$140
$160
Jan-97 Jan-98 Jan-99 Jan-00 Jan-01 Jan-02 Jan-03 Jan-04 Jan-05 Jan-06 Jan-07 Jan-08 Jan-09 Jan 10
Crude oil prices peaked at $145.29in July 2008, fell 75% to $34.57 in Jan. 2009, but rose again to over
$82/bbl in March 2010 before settling back to $75/bbl in early July
Jan. 1998 $15.21
PEAKJul. 2008 $145.29
TROUGHJan. 2009
$34.57
RECENT2 July 2010
$73.31
Dollars per Barrel*

Beyond the Crisis
Impacts on Energy Demand, Supply and Insurance Exposure

Severe Recession Depressed US Energy Demand:
Change 2009 vs. 2008
-2.2%
-1.3%-1.7% -1.7%
-6.4%-7%
-6%
-5%
-4%
-3%
-2%
-1%
0%
Oil Natural Gas Electricty
(Industrial)
Electricty (All) Coal for
Electricity
Sources: Energy Information Administration based on Short-Term Energy Outlook, March 2009 and March 2010.
Industrial consumption of electricity has experienced the most severe declines
Percentage Change in Consumption, 2009 vs. 2008

US Energy Expenditures as a % of GDP Have Been
Hurt by Recession
0%
2%
4%
6%
8%
10%
12%
14%8
3
84
85
86
87
88
89
90
91
92
93
94
95
96
97
98
99
00
01
02
03
04
05
06
07
08
09
10
F
11
F
Source: Energy Information Administration, Short-Term Energy Outlook, March 2010; Ins. Info. Inst.
The energy price bubble pushed energy expenditures to 9.9% of GDP
in 2008. The bursting of the bubble and recession pushed expenditures
down to 7.0% of GDP in 2009, rising to about 8% in 2010 and 2011.
Energy Demand is recovering from the global recession and 2008 energy price spike, but remains below pre-crisis levels
Percentage of GDP
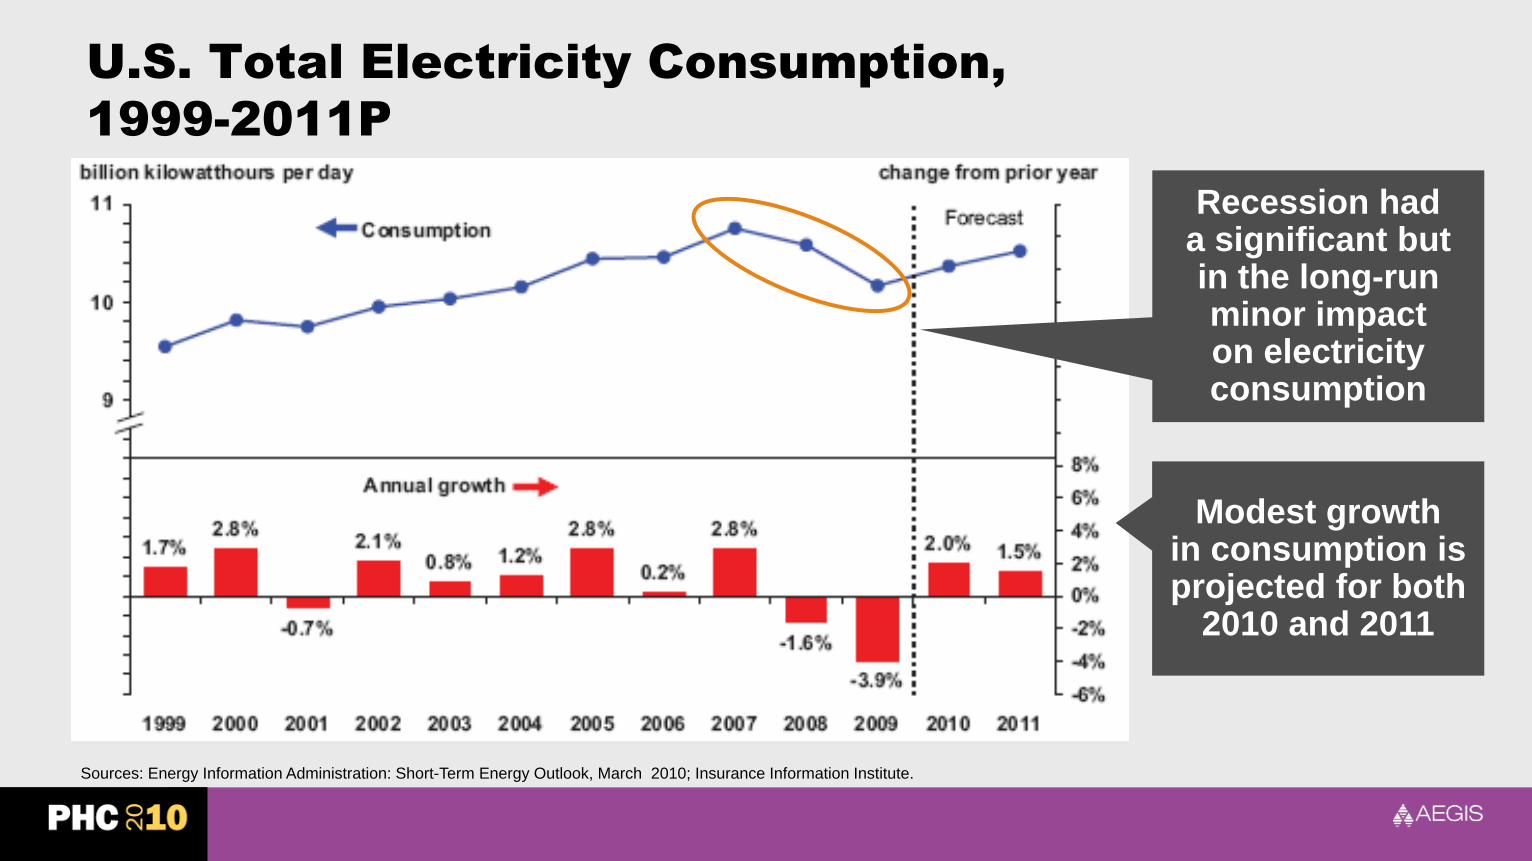
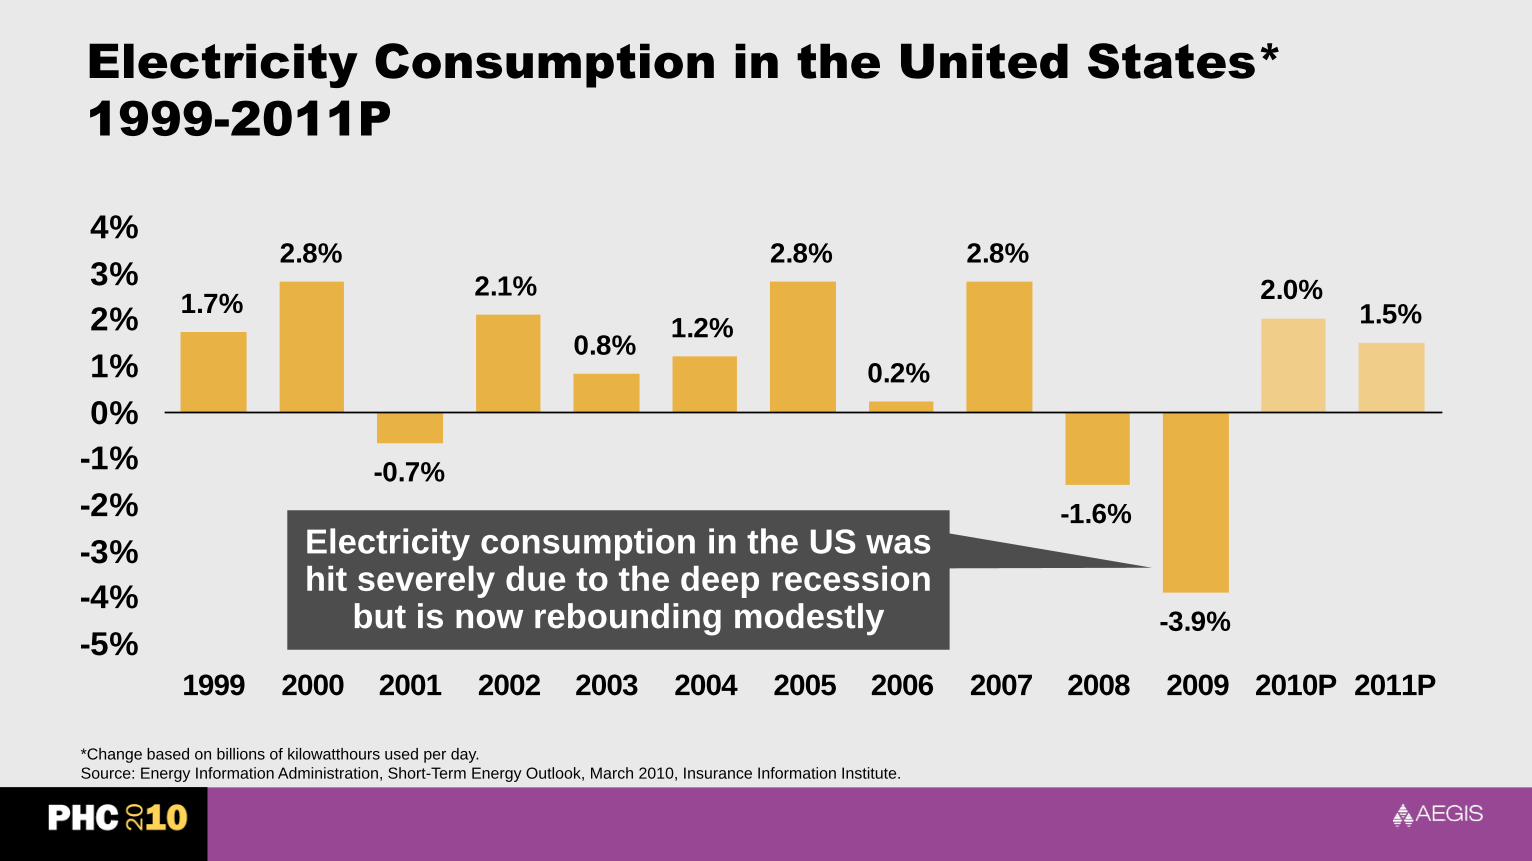
U.S. Total Electricity Consumption,
1999-2011P
Sources: Energy Information Administration: Short-Term Energy Outlook, March 2010; Insurance Information Institute.
Recession hada significant but in the long-run minor impact on electricity consumption
Modest growth in consumption is projected for both
2010 and 2011
1.7%
-0.7%
2.1%
0.8%1.2%
2.8%
0.2%
2.8%
-1.6%
-3.9%
2.0%1.5%
2.8%
-5%
-4%
-3%
-2%
-1%
0%
1%
2%
3%
4%
1999 2000 2001 2002 2003 2004 2005 2006 2007 2008 2009 2010P 2011P
Electricity Consumption in the United States*
1999-2011P
*Change based on billions of kilowatthours used per day.
Source: Energy Information Administration, Short-Term Energy Outlook, March 2010, Insurance Information Institute.
Electricity consumption in the US was hit severely due to the deep recession
but is now rebounding modestly

347.7
472.4508.3
551.5595.7
637.3678.3
462.1
0
100
200
300
400
500
600
700
800
1990 2005 2006 2010P 2015P 2020P 2025P 2030P
World Primary Energy Consumption, 1990-2030P
Source: Energy Information Administration, 2009 International Energy Outlook, Insurance Information Institute.
Between 2006 and 2030, energy consumption in projected to increase annually by 1.5%
worldwide but only 0.5% in the US
Global energy consumption
is expected to increase by
33.4% between 2010 and 2030
but by only 12% in the US
Quadrillion BTUs

Avg. Annual Change in Total Energy Consumption
by Country/Region:2006-2030P
3.2%
2.6% 2.5%
1.5%
0.9%
0.5% 0.5%
1.1%1.2%1.4%
0.0%
0.5%
1.0%
1.5%
2.0%
2.5%
3.0%
3.5%C
hin
a
Bra
zil
Ind
ia
Ca
na
da
S.
Ko
rea
Me
xic
o
Au
st/
NZ
Ru
ss
ia
US
Eu
rop
e
(OE
CD
)
Source: Energy Information Administration, 2009 International Energy Outlook, Insurance Information Institute
US/Europe have the slowest growth
rates for energy consumption through
2030, growing at less than 1/6 the rate
in China and 1/5 that of India
Average Annual Change in Consumption (Quadrillion BTUs)

Global Net Electricity Generation Is Growing Faster
than Consumption
Sources: Energy Information Administration: International Energy Outlook 2009; Insurance Information Institute.
• Electricity generation is growing faster than total energy consumption
• This suggests that there is a net substitution away from other energy sources to electricity
• Implies a bright future for utilities
• Requires significant insurance capacity

US Primary Energy Consumption by Source
and Sector, 2008 (Quadrillion BTUs)
Sources: Energy Information Administration: Annual Energy Review 2008 accessed at: http://www.eia.doe.gov/aer/pdf/pecss_diagram.pdf ; Insurance Information Institute.
Electricity accounts for 40% of US energy demand. More than
half (51%) of that demand is met
via coal.

US Electricity Demand Growth:
1950-2035P (Billions Kilowatt Hours)
Sources: Energy Information Administration: Annual Energy Outlook 2010; Insurance Information Institute.
Electricity demand continues to grow but
at a slower rate in response to slowing
population growth and efficiency enhancements.
Demand for insurance should be similar but
could vary depending on liability environment .
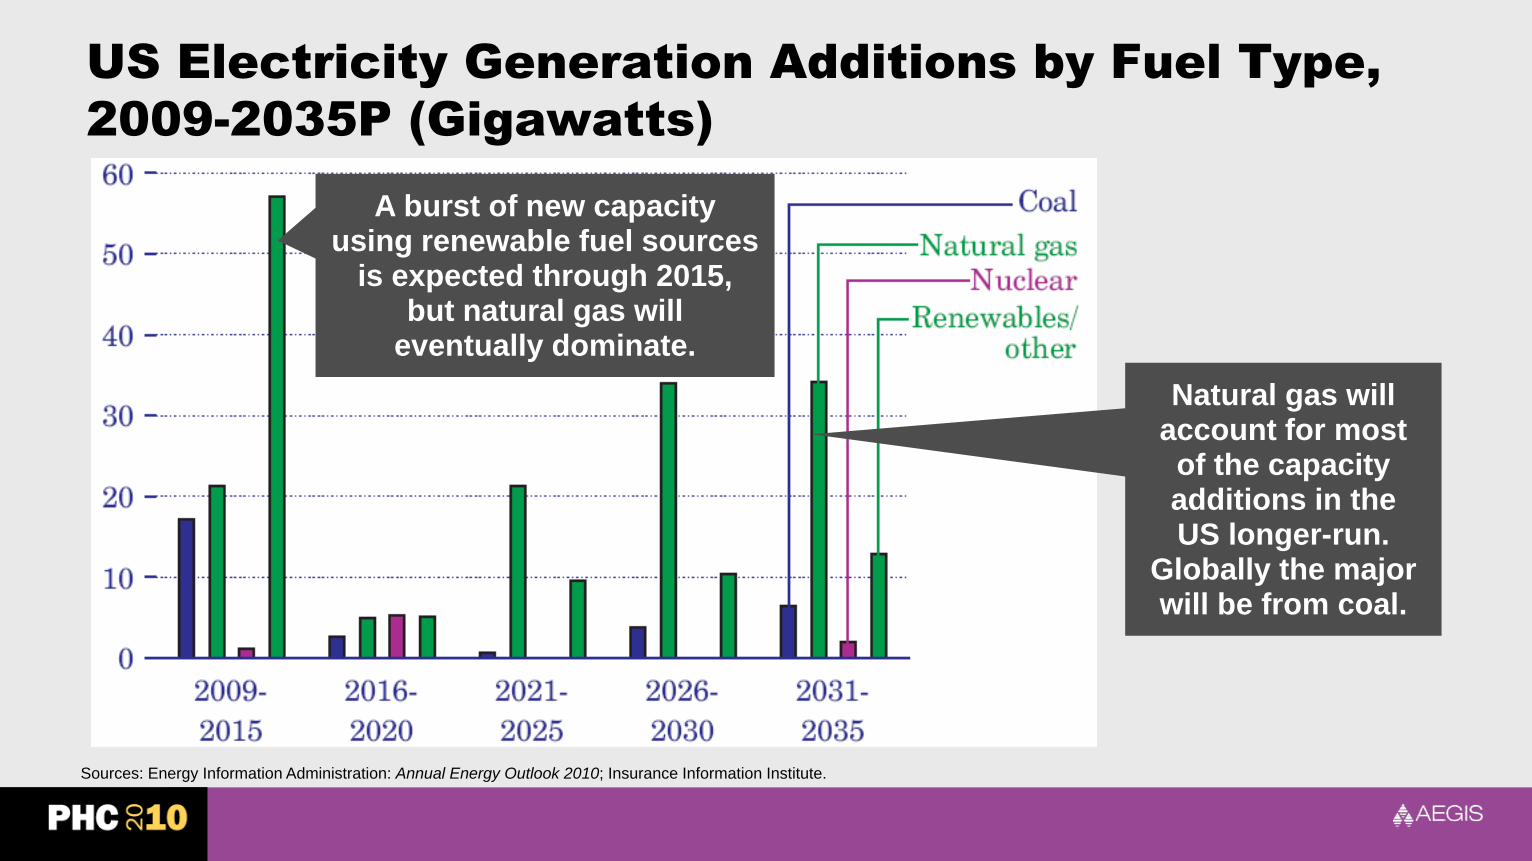
US Electricity Generation Additions by Fuel Type,
2009-2035P (Gigawatts)
Natural gas will account for most
of the capacity additions in the US longer-run.
Globally the major will be from coal.
Sources: Energy Information Administration: Annual Energy Outlook 2010; Insurance Information Institute.
A burst of new capacity using renewable fuel sources
is expected through 2015, but natural gas will
eventually dominate.
Energy Consumption,
Capacity and Carbon
Long-Run Projections for the US Energy Sector Relative to the Global Energy Market and Insurance Implications

US Primary Energy Consumption As a Share
of Global Consumption, 1990-2030P
102.9109.1
84.7
99.9100.0100.5 105.4
113.6
21.8% 21.6% 21.8% 20.7% 19.8% 19.1%
24.4%
28.8%
50
60
70
80
90
100
110
120
1990 2005 2006 2010P 2015P 2020P 2025P 2030P
0%
5%
10%
15%
20%
25%
30%
35%
US Primary Energy Consumption US Share of Global Primary Energy Consumption
The US share of global energy consumption is projected to fall from 24.4% in 1990 to
21.6% in 2010 and 19.1% in 2030P
Source: Energy Information Administration, 2009 International Energy Outlook, Insurance Information Institute calculations.
Impact of recession;
Faster growth in
emerging markets
US
Pri
mary
En
erg
y
Co
nsu
mp
tio
n, Q
uad
. B
tu)
US
Sh
are
of G
lob
al P
rimary
En
erg
y C
on
su
mp
tion
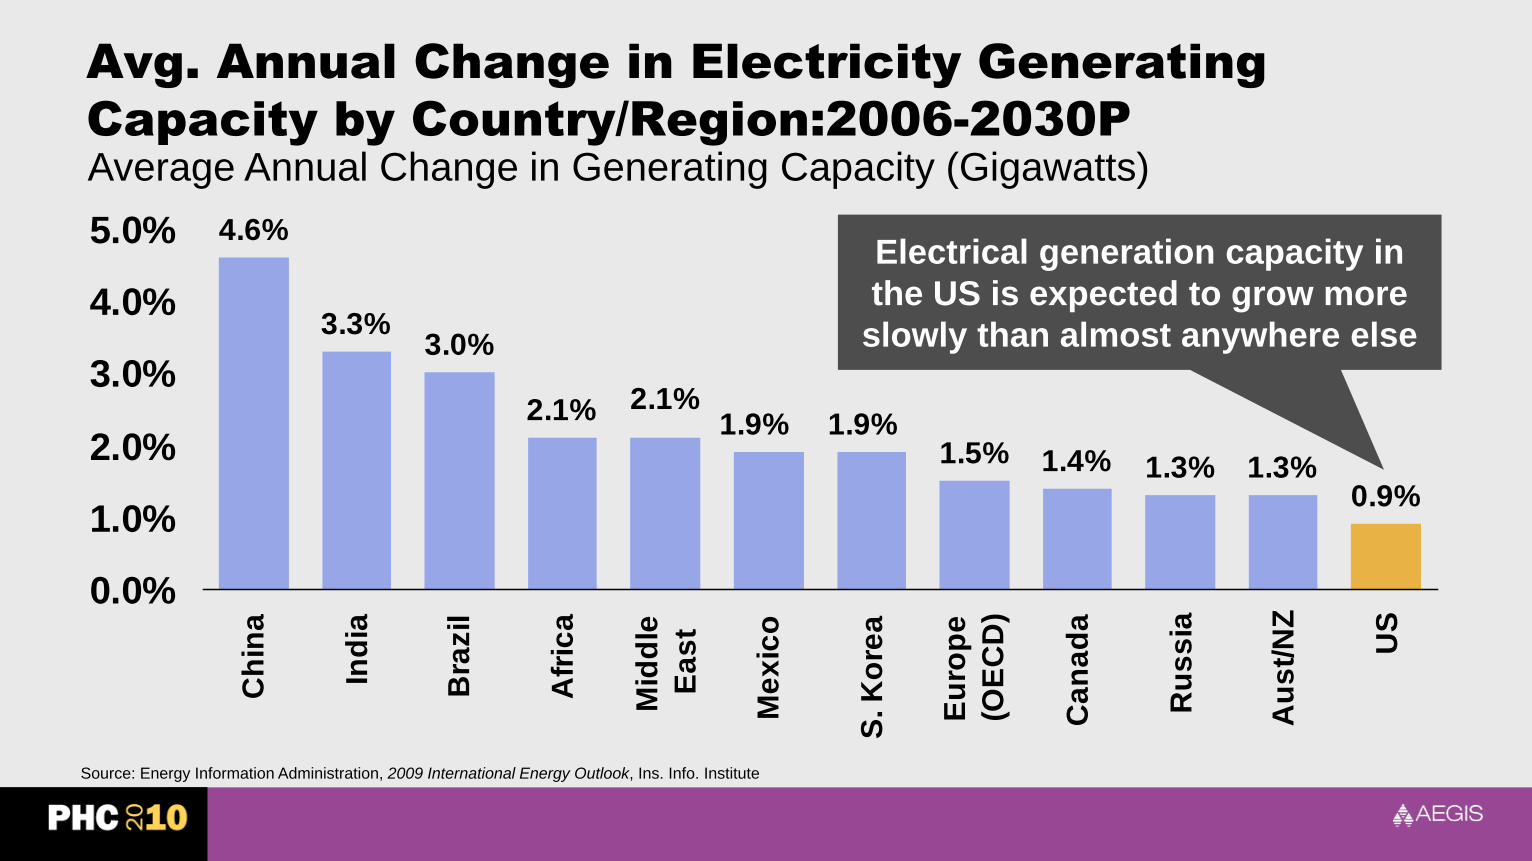
Avg. Annual Change in Electricity Generating
Capacity by Country/Region:2006-2030P
4.6%
3.3%3.0%
2.1%
1.5% 1.4% 1.3% 1.3%0.9%
2.1%1.9% 1.9%
0.0%
1.0%
2.0%
3.0%
4.0%
5.0%C
hin
a
Ind
ia
Bra
zil
Afr
ica
Mid
dle
Ea
st
Me
xic
o
S. K
ore
a
Eu
rop
e
(OE
CD
)
Ca
na
da
Ru
ss
ia
Au
st/
NZ
US
Source: Energy Information Administration, 2009 International Energy Outlook, Ins. Info. Institute
Electrical generation capacity in
the US is expected to grow more
slowly than almost anywhere else
Average Annual Change in Generating Capacity (Gigawatts)

US Share of Global Electricity Generation Capacity
as a Share of Global Capacity, 1990-2030P
1,130
9591,0611,0241,021
1,201
18.6%18.9%19.3%
22.2%
23.9%
20.4%
50
250
450
650
850
1,050
1,250
1,450
2006 2010P 2015P 2020P 2025P 2030P
0%
5%
10%
15%
20%
25%
30%
US Generating Capacity US Share of Installed Generating Capacity
The US share of global energy generation capacity is projected to fall from 22.2% in
2010 and 18.6% in 2030
Source: Energy Information Administration, 2009 International Energy Outlook, Insurance Information Institute calculations.
US
Ele
ctr
ical G
en
era
tio
n
Cap
acit
y (
Gig
aw
att
s)
US
Sh
are
of G
lob
al E
lectric
ity
Gen
era
tion
Cap
acity
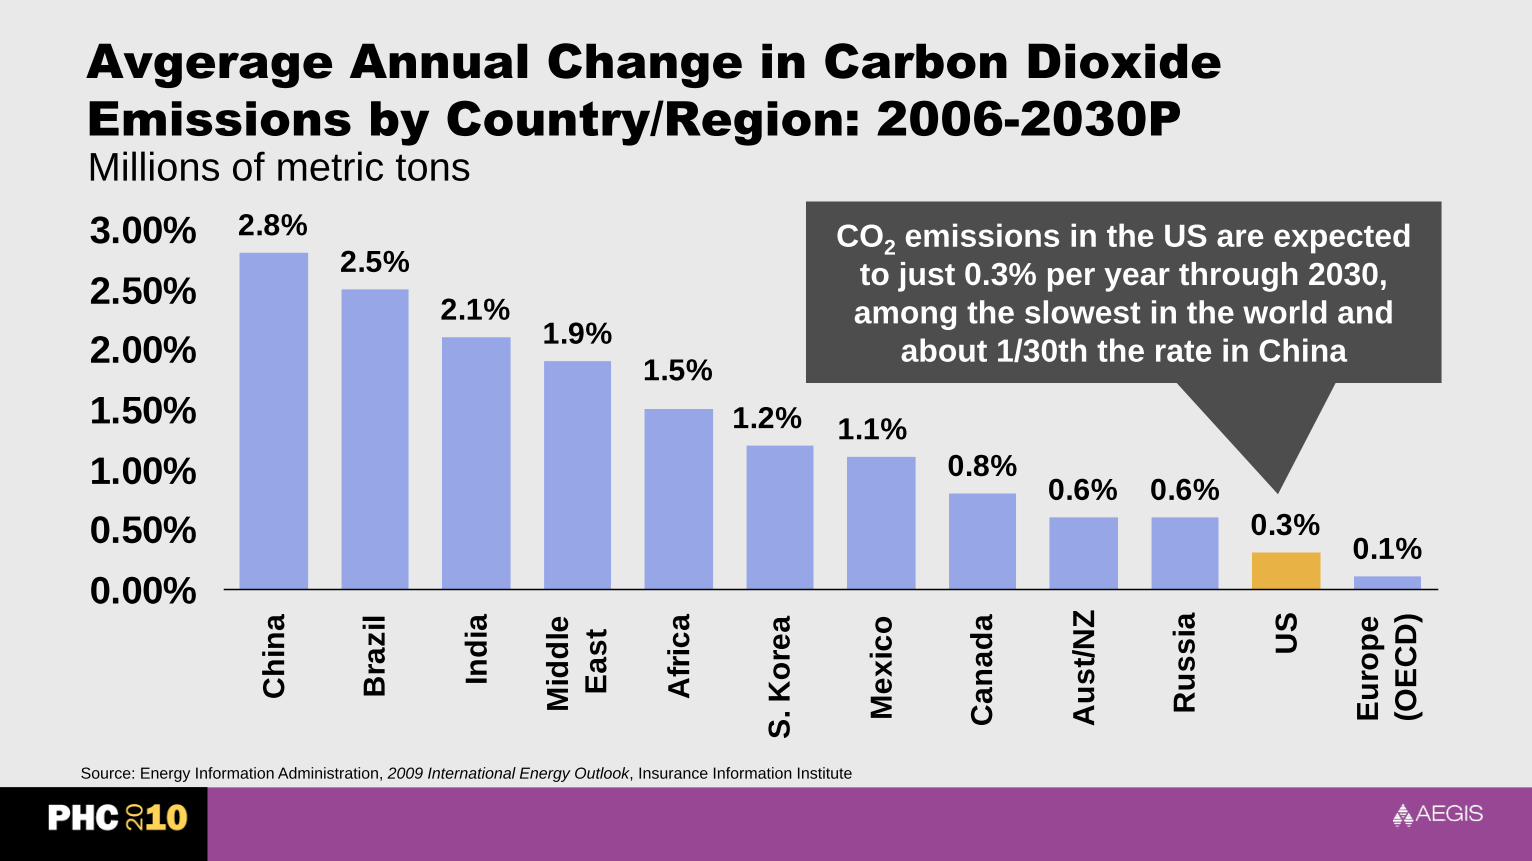
Avgerage Annual Change in Carbon Dioxide
Emissions by Country/Region: 2006-2030P
2.8%
2.5%
2.1%1.9%
0.8%0.6% 0.6%
0.3%0.1%
1.5%
1.2% 1.1%
0.00%
0.50%
1.00%
1.50%
2.00%
2.50%
3.00%C
hin
a
Bra
zil
Ind
ia
Mid
dle
Ea
st
Afr
ica
S. K
ore
a
Me
xic
o
Ca
na
da
Au
st/
NZ
Ru
ss
ia
US
Eu
rop
e
(OE
CD
)
Source: Energy Information Administration, 2009 International Energy Outlook, Insurance Information Institute
CO2 emissions in the US are expected
to just 0.3% per year through 2030,
among the slowest in the world and
about 1/30th the rate in China
Millions of metric tons
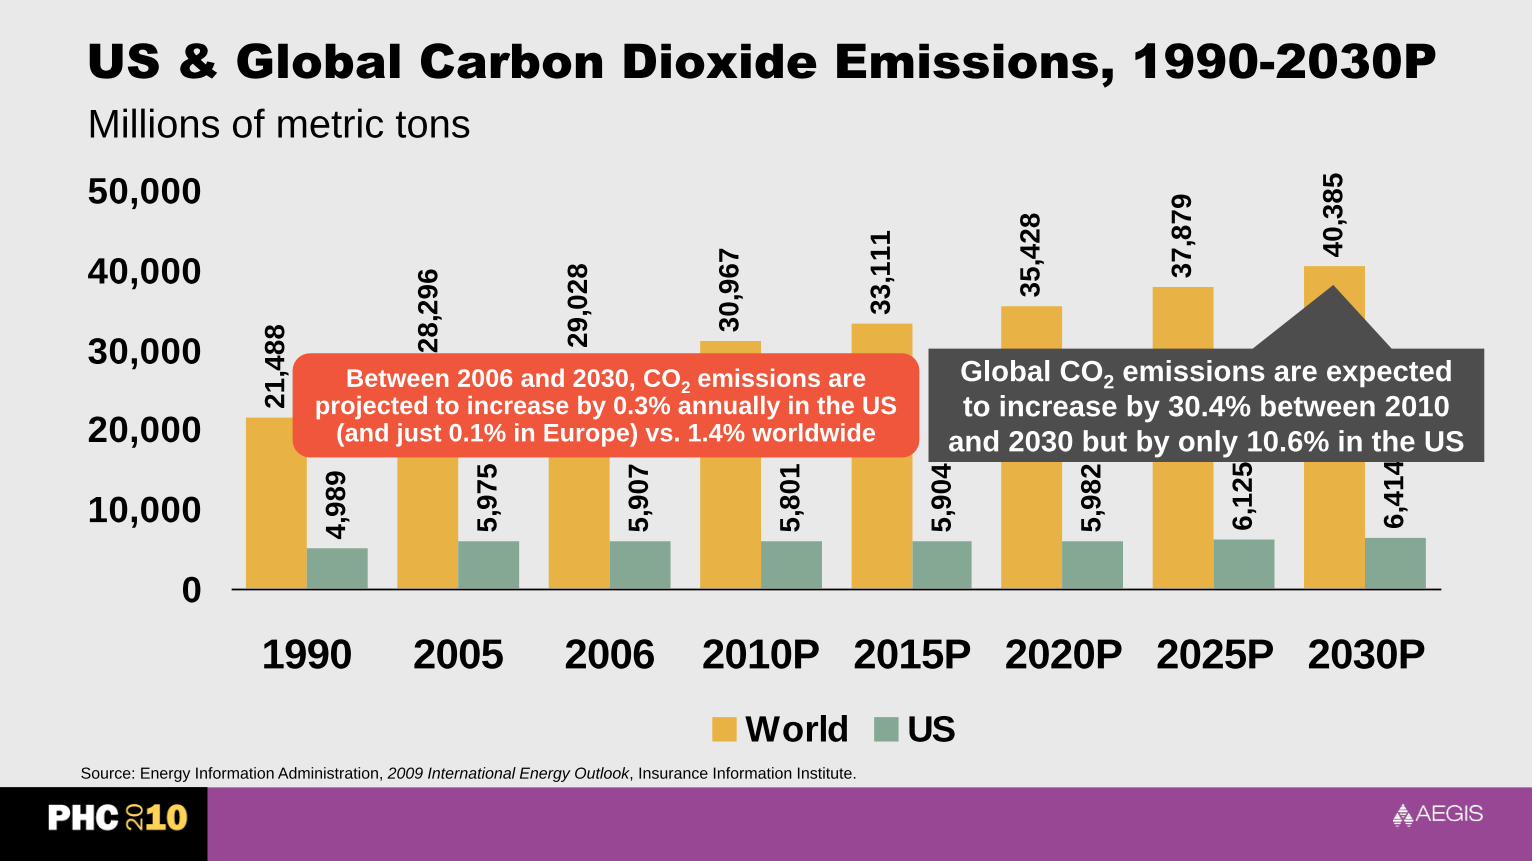
21
,48
8 29
,02
8
30
,96
7
33
,11
1
35
,42
8
37
,87
9
40
,38
5
4,9
89
5,9
75
5,9
07
5,8
01
5,9
04
5,9
82
6,1
25
6,4
14
28
,29
6
0
10,000
20,000
30,000
40,000
50,000
1990 2005 2006 2010P 2015P 2020P 2025P 2030P
World US
US & Global Carbon Dioxide Emissions, 1990-2030P
Source: Energy Information Administration, 2009 International Energy Outlook, Insurance Information Institute.
Between 2006 and 2030, CO2 emissions are projected to increase by 0.3% annually in the US
(and just 0.1% in Europe) vs. 1.4% worldwide
Global CO2 emissions are expected
to increase by 30.4% between 2010
and 2030 but by only 10.6% in the US
Millions of metric tons
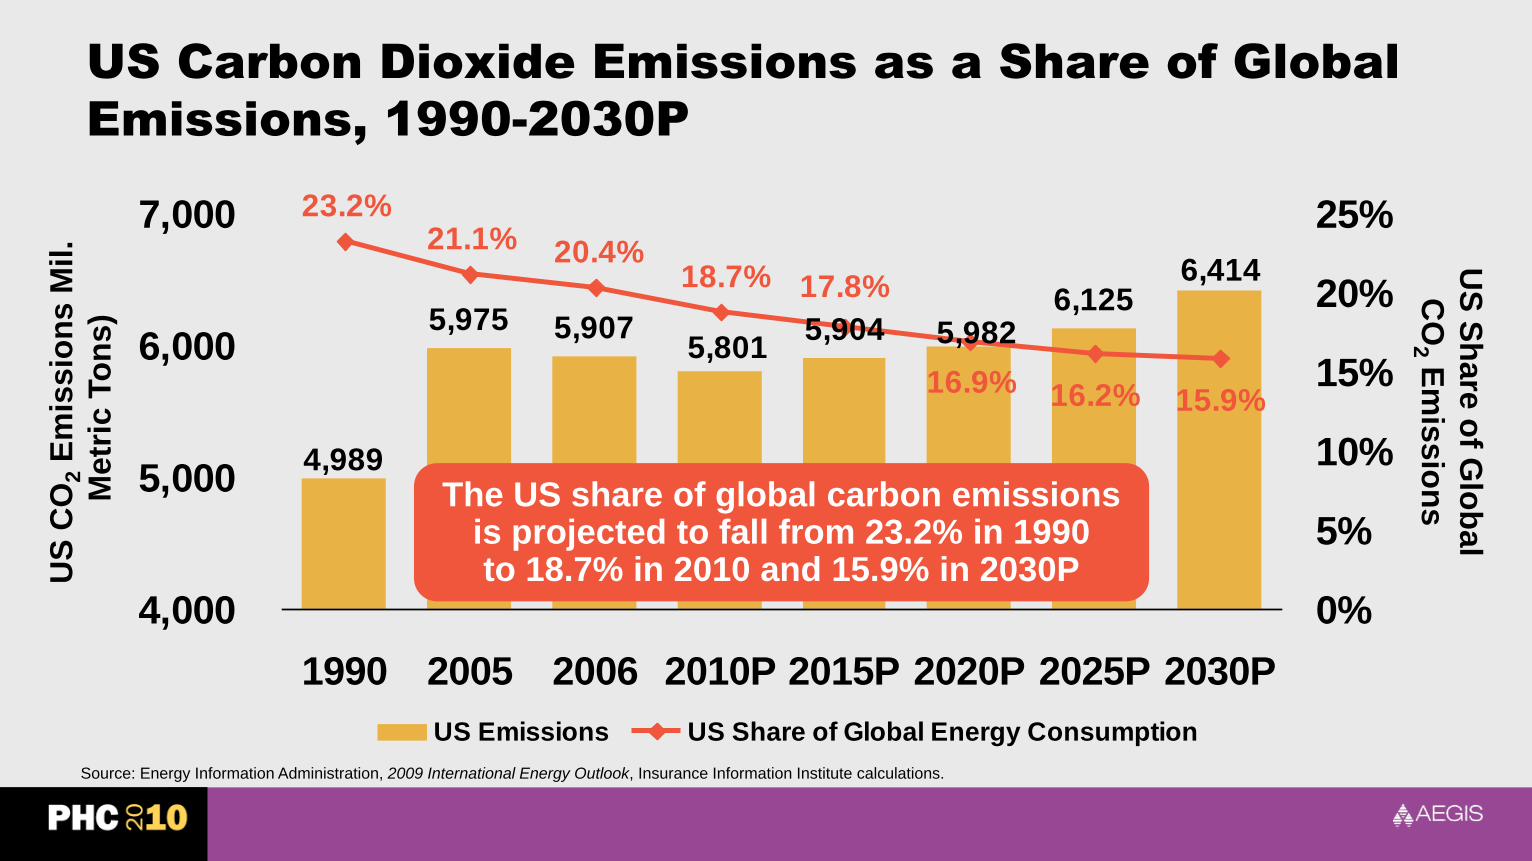
US Carbon Dioxide Emissions as a Share of Global
Emissions, 1990-2030P
5,9046,125
4,989
5,8015,9075,975 5,982
6,414
16.2% 15.9%16.9%
17.8%18.7%
21.1%23.2%
20.4%
4,000
5,000
6,000
7,000
1990 2005 2006 2010P 2015P 2020P 2025P 2030P
0%
5%
10%
15%
20%
25%
US Emissions US Share of Global Energy Consumption
The US share of global carbon emissions is projected to fall from 23.2% in 1990 to 18.7% in 2010 and 15.9% in 2030P
Source: Energy Information Administration, 2009 International Energy Outlook, Insurance Information Institute calculations.
US
CO
2E
mis
sio
ns M
il.
Metr
ic T
on
s)
US
Sh
are
of G
lob
al
CO
2E
mis
sio
ns
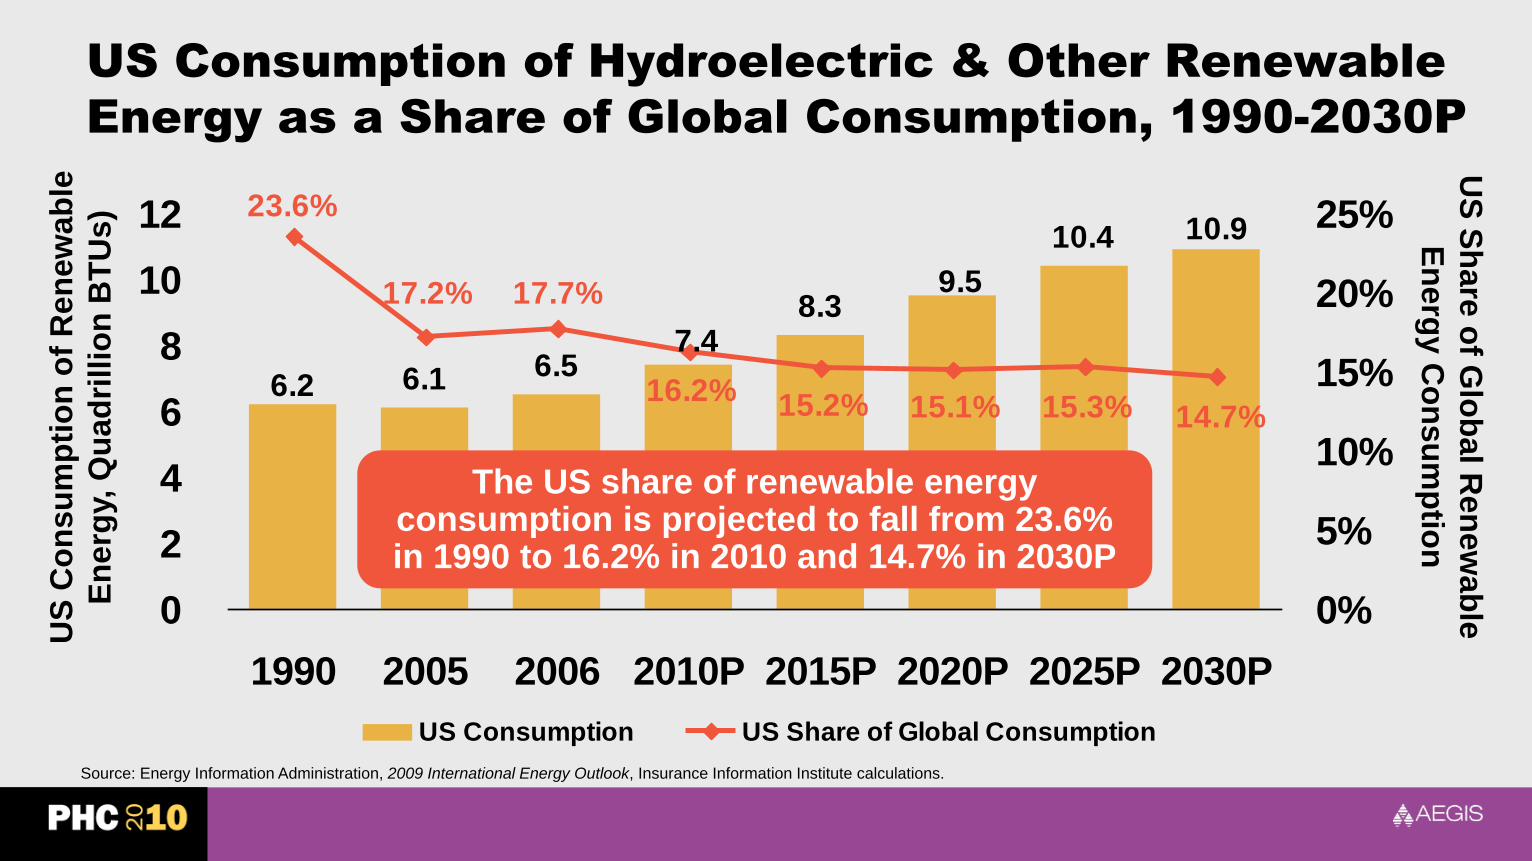
US Consumption of Hydroelectric & Other Renewable
Energy as a Share of Global Consumption, 1990-2030P
8.3
10.4
6.2
7.46.56.1
9.5
10.9
14.7%15.3%15.1%15.2%16.2%
17.2%
23.6%
17.7%
0
2
4
6
8
10
12
1990 2005 2006 2010P 2015P 2020P 2025P 2030P
0%
5%
10%
15%
20%
25%
US Consumption US Share of Global Consumption
The US share of renewable energy consumption is projected to fall from 23.6% in 1990 to 16.2% in 2010 and 14.7% in 2030P
Source: Energy Information Administration, 2009 International Energy Outlook, Insurance Information Institute calculations.
US
Co
ns
um
pti
on
of
Ren
ew
ab
le
En
erg
y, Q
uad
rillio
n B
TU
s)
US
Sh
are
of G
lob
al R
en
ew
ab
le
En
erg
y C
on
su
mp
tion
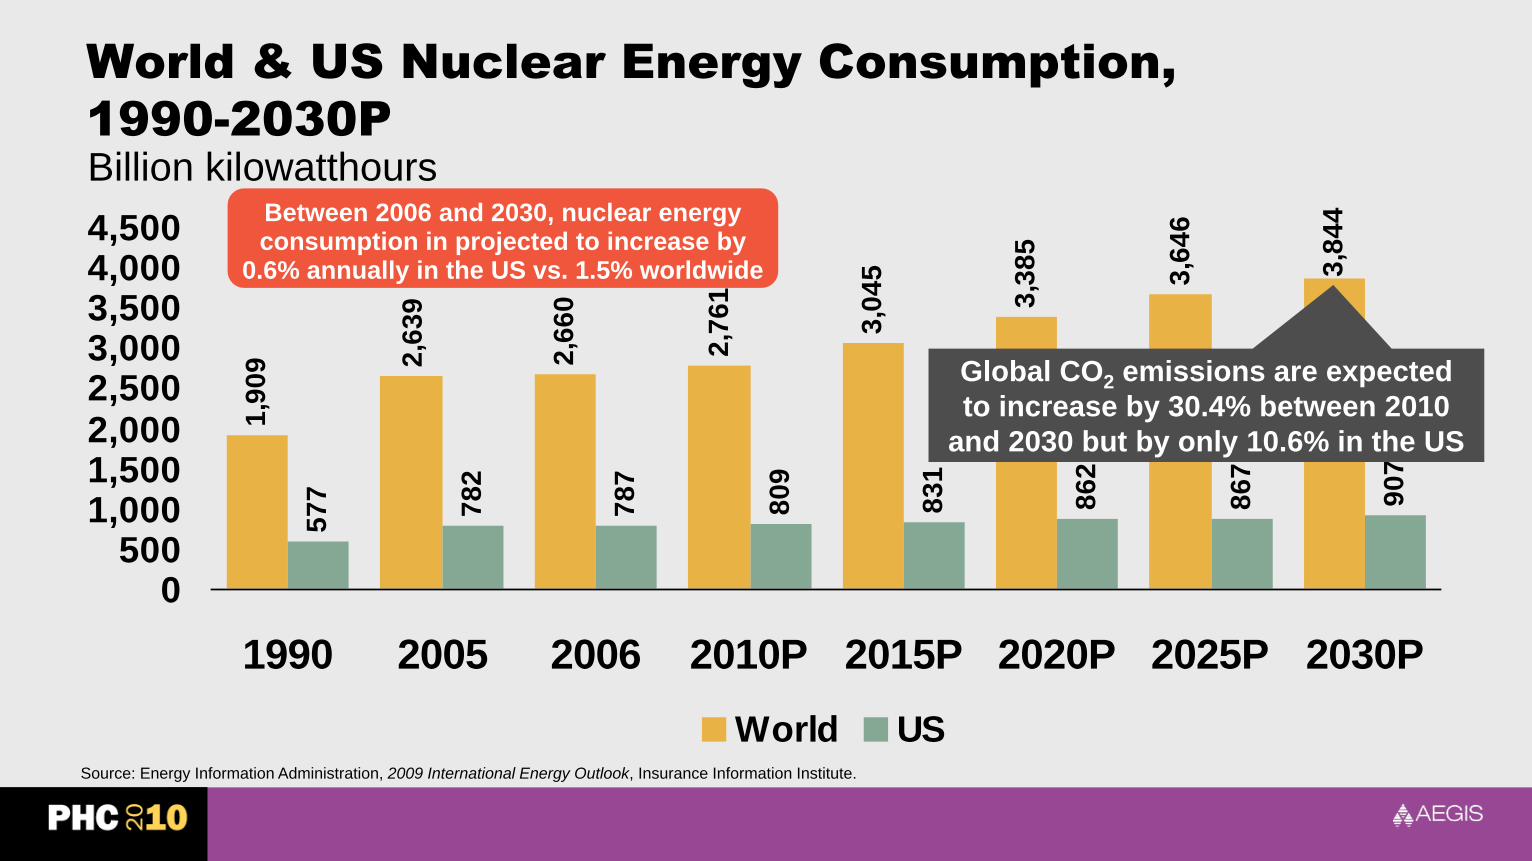
1,9
09 2
,66
0
2,7
61
3,0
45
3,3
85
3,6
46
3,8
44
57
7
78
2
78
7
80
9
83
1
86
2
86
7
90
7
2,6
39
0500
1,0001,5002,0002,5003,0003,5004,0004,500
1990 2005 2006 2010P 2015P 2020P 2025P 2030P
World US
World & US Nuclear Energy Consumption,
1990-2030P
Source: Energy Information Administration, 2009 International Energy Outlook, Insurance Information Institute.
Between 2006 and 2030, nuclear energy consumption in projected to increase by
0.6% annually in the US vs. 1.5% worldwide
Global CO2 emissions are expected
to increase by 30.4% between 2010
and 2030 but by only 10.6% in the US
Billion kilowatthours
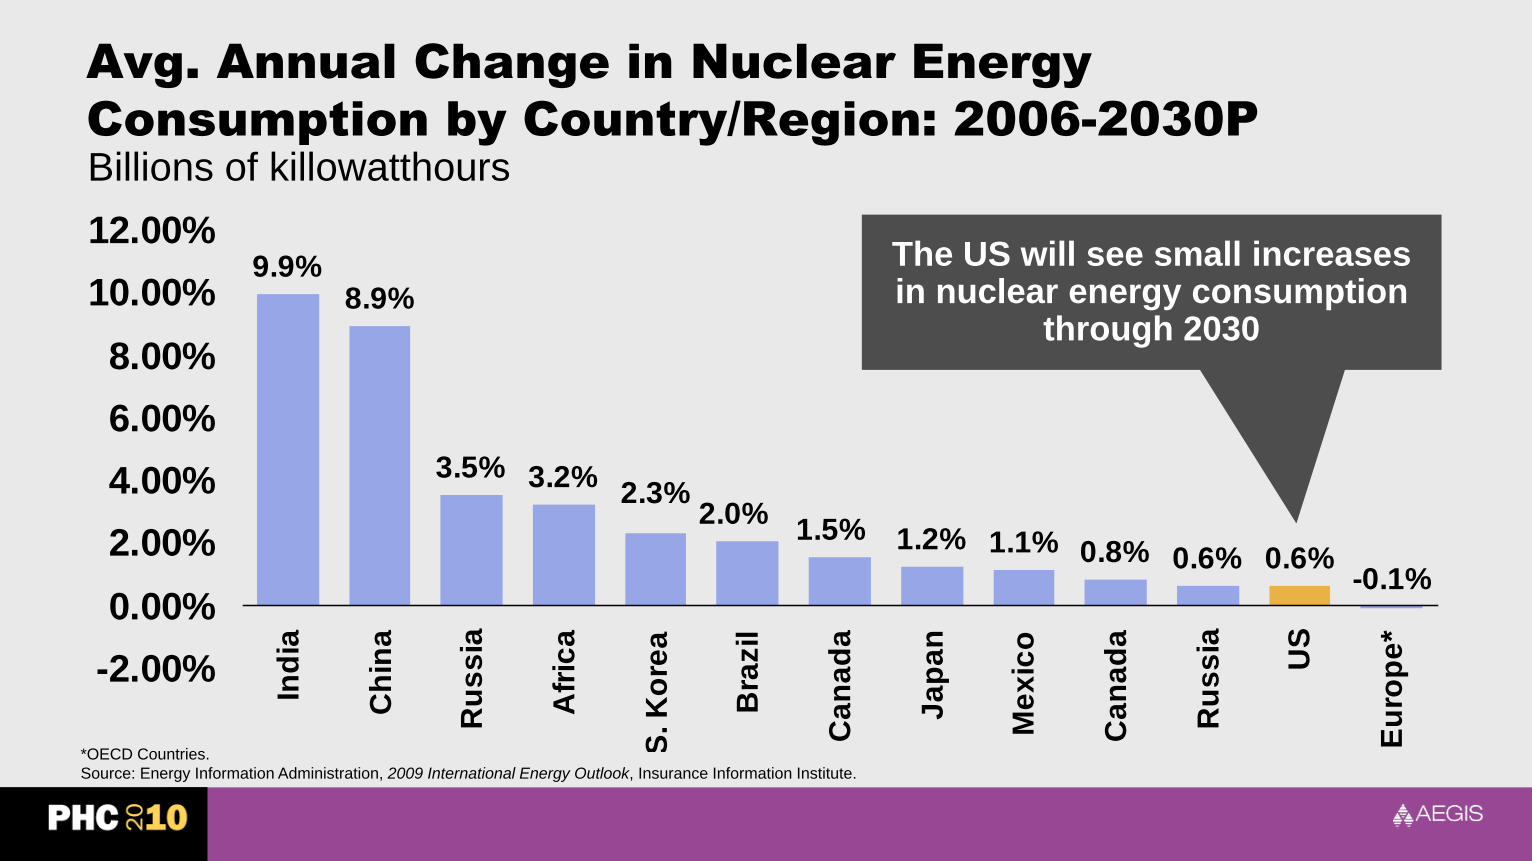
Avg. Annual Change in Nuclear Energy
Consumption by Country/Region: 2006-2030P
9.9%8.9%
3.5% 3.2%
1.2% 1.1% 0.8% 0.6% 0.6%-0.1%
2.3%2.0%
1.5%
-2.00%
0.00%
2.00%
4.00%
6.00%
8.00%
10.00%
12.00%
Ind
ia
Ch
ina
Ru
ss
ia
Afr
ica
S. K
ore
a
Bra
zil
Ca
na
da
Ja
pa
n
Me
xic
o
Ca
na
da
Ru
ss
ia
US
Eu
rop
e*
*OECD Countries.
Source: Energy Information Administration, 2009 International Energy Outlook, Insurance Information Institute.
The US will see small increases in nuclear energy consumption
through 2030
Billions of killowatthours
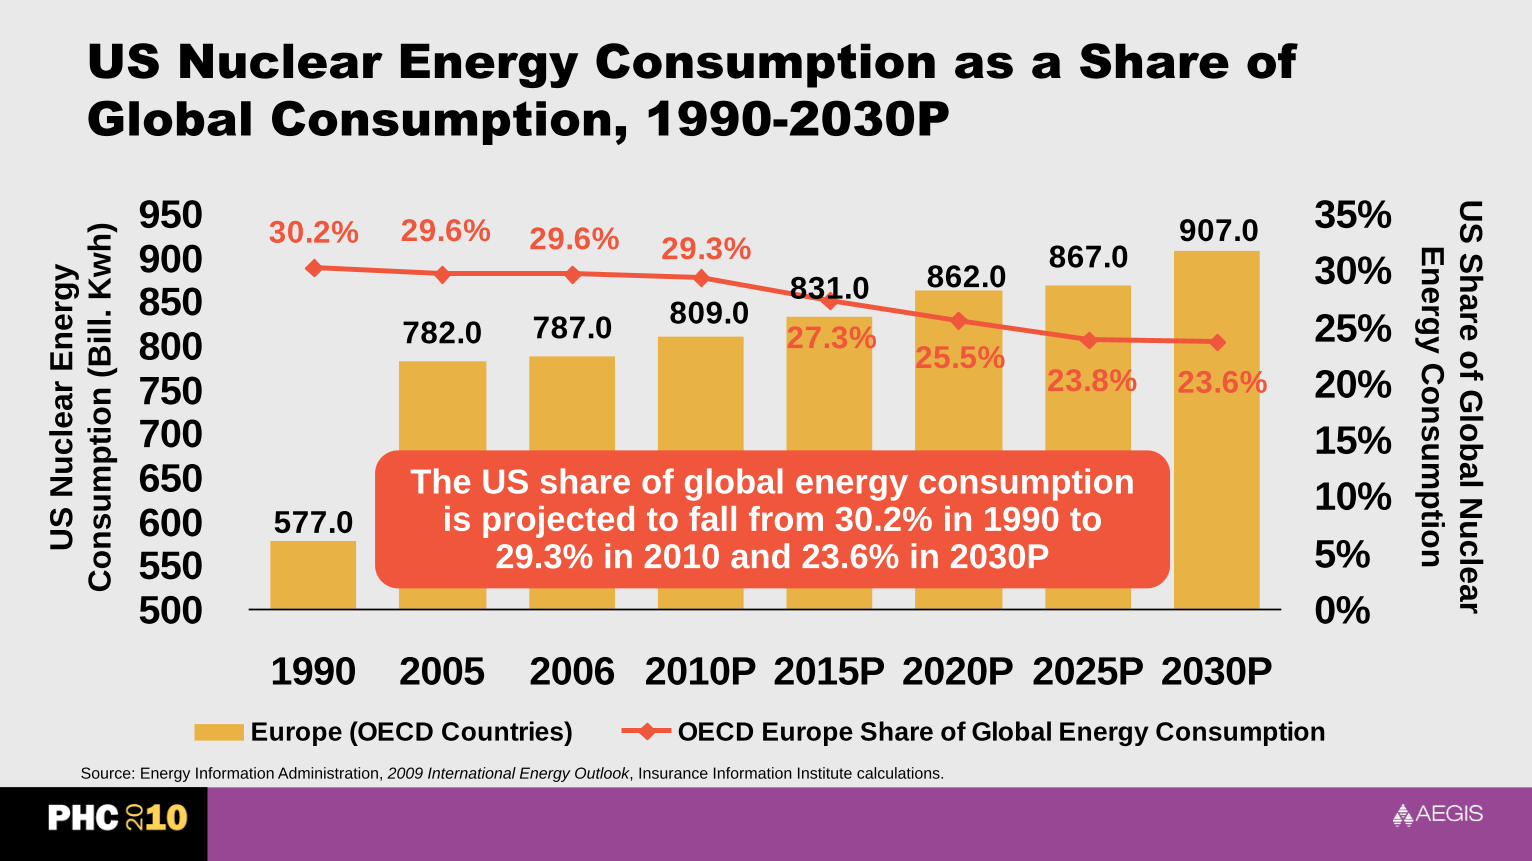
US Nuclear Energy Consumption as a Share of
Global Consumption, 1990-2030P
831.0867.0
577.0
809.0787.0782.0
862.0
907.0
23.6%23.8%25.5%
27.3%
29.3%29.6%30.2% 29.6%
500550600650700750800850900950
1990 2005 2006 2010P 2015P 2020P 2025P 2030P
0%
5%
10%
15%
20%
25%
30%
35%
Europe (OECD Countries) OECD Europe Share of Global Energy Consumption
The US share of global energy consumption is projected to fall from 30.2% in 1990 to
29.3% in 2010 and 23.6% in 2030P
Source: Energy Information Administration, 2009 International Energy Outlook, Insurance Information Institute calculations.
US
Nu
cle
ar
En
erg
y
Co
ns
um
pti
on
(B
ill. K
wh
)
US
Sh
are
of G
lob
al N
ucle
ar
En
erg
y C
on
su
mp
tion
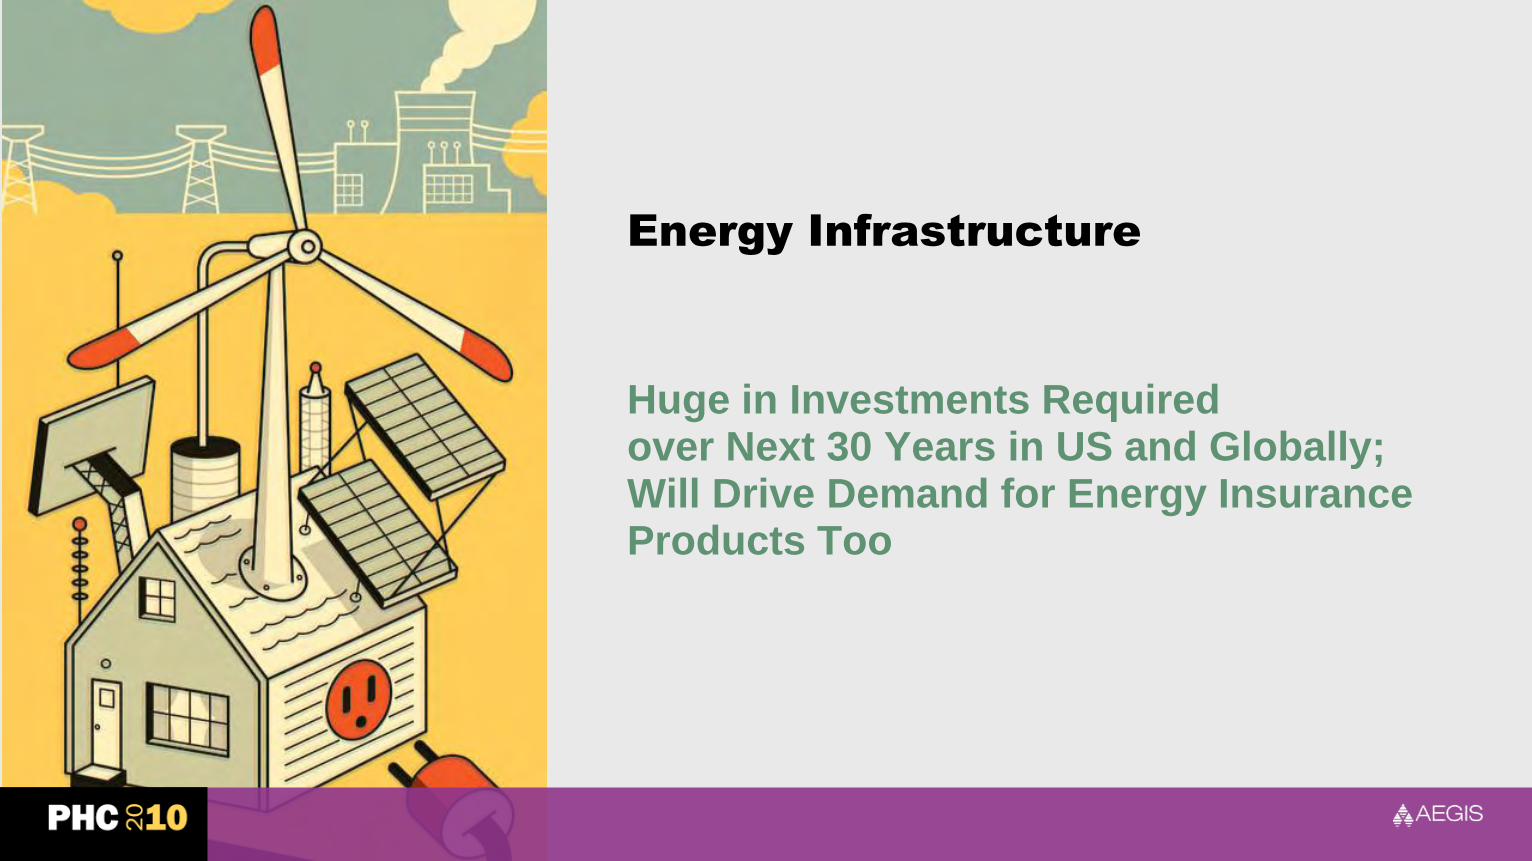
Energy Infrastructure
Huge in Investments Required over Next 30 Years in US and Globally; Will Drive Demand for Energy Insurance Products Too

11.3
14.6
1820.6
23.2
26
28.9
31.8
12.6
0
5
10
15
20
25
30
35
1990 1995 2000 2006 2010 2015 2020 2025 2030
World Net Effective Electric Power
Generation, 1990-2030P
Source: Energy Information Administration, 2009 International Energy Outlook, Insurance Information Institute.
Global electric power generation was dampened about 3% by the global financial
crisis, but will still grow at 2.9% per year through 2030 compared to 1.9% for total
energy consumption
Trillions of kilowatt hoursc

World Energy Supply Infrastructure Investment by
Category: 2001-2030P
Transmission, $1,568
16%
Distribution $3,755
38%
Generation-New, $4,080
42%
Generation-Refurbished, $439
4%
Source: International Atomic Energy Agency, World Outlook for Electricity Investment.
$ BillionsGeneration will
account for 46% or $4.5 trillion of all
investment through 2030 to meet rising demand. Financial
crisis had no significant impact on
long-term global energy demand and the need to develop
supply infrastructure

Electricity Supply Infrastructure: Despite Crisis, Huge
Investments Needed Along With Insurance: 2001-2030 (Est.)
$1,351
$1,876
$809
$377
$744
$258
$609
$1,913
$799 $783
$0
$500
$1,000
$1,500
$2,000
$2,500
Eu
rop
e
No
rth
Am
eri
ca
Pa
cif
ic
Ru
ss
ia
Ch
ina
E. A
sia
S. A
sia
La
tin
Am
eri
ca
Mid
dle
Ea
st
Afr
ica
Source: International Atomic Energy Agency, World Outlook for Electricity Investment.
North American investment could total $1.876 trillion
$ Billions
Investments in electricity supply infrastructure globally are expected to total $9.841
trillion between 2001 and 2030

Proposed New Investments in US Energy
Infrastructure Over Next 30 Years
Sources: National Geographic, June 2010; Insurance Information Institute.
Huge investments will be needed in the US to meet the energy demands of the future. Insurance products will help
make this possible.

Insurance Industry
Financial Performance
Impacted by Soft Market, Volatile Investment Environment

P/C Net Income After Taxes
1991–2010:Q1
$3
6,8
19
$3
0,7
73
$2
1,8
65
$2
0,5
59
$3
,04
6
$3
0,0
29
$3
8,5
01
$4
4,1
55
$6
5,7
77
$6
2,4
96
$3
,04
3
$2
8,3
11
$8
,85
6
$2
4,4
04
$2
0,5
98
$1
0,8
70
$1
9,3
16
$5
,84
0
$1
4,1
78
-$6,970-$10,000
$0
$10,000
$20,000
$30,000$40,000
$50,000
$60,000
$70,000
$80,000
91 92 93 94 95 96 97 98 99 0 1 2 3 4 5 6 7 8 9 10:Q1
* ROE figures are GAAP; 1Return on avg. surplus. Excluding Mortgage & Financial Guaranty insurers yields an 8.3% ROAS for 2010:Q1, 7.3% for 2009 and 4.4% for 2008.
2009 net income was $34.5 billion and $20.8 billion in 2008 excluding M&FG.
Sources: A.M. Best, ISO, Insurance Information Institute
P-C Industry 2010:Q1 profits rose vs. -$1.3B in 2009:Q1, due mainly to $1B in realized capital
gains vs. -$8B in previous realized capital losses
$ Millions 2005 ROE*= 9.6%
2006 ROE = 12.7%
2007 ROE = 10.9%
2008 ROE = 0.3%
2009 ROAS1 = 5.8%
2010:Q1 ROAS = 6.7%
P/C Premium Growth
Primarily Driven by the
Industry’s Underwriting
Cycle, Not the Economy
-5%
0%
5%
10%
15%
20%
25%
71 72 73 74 75 76 77 78 79 80 81 82 83 84 85 86 87 88 89 90 91 92 93 94 95 96 97 98 99 00 01 02 03 04 05 06 07 08 0910F
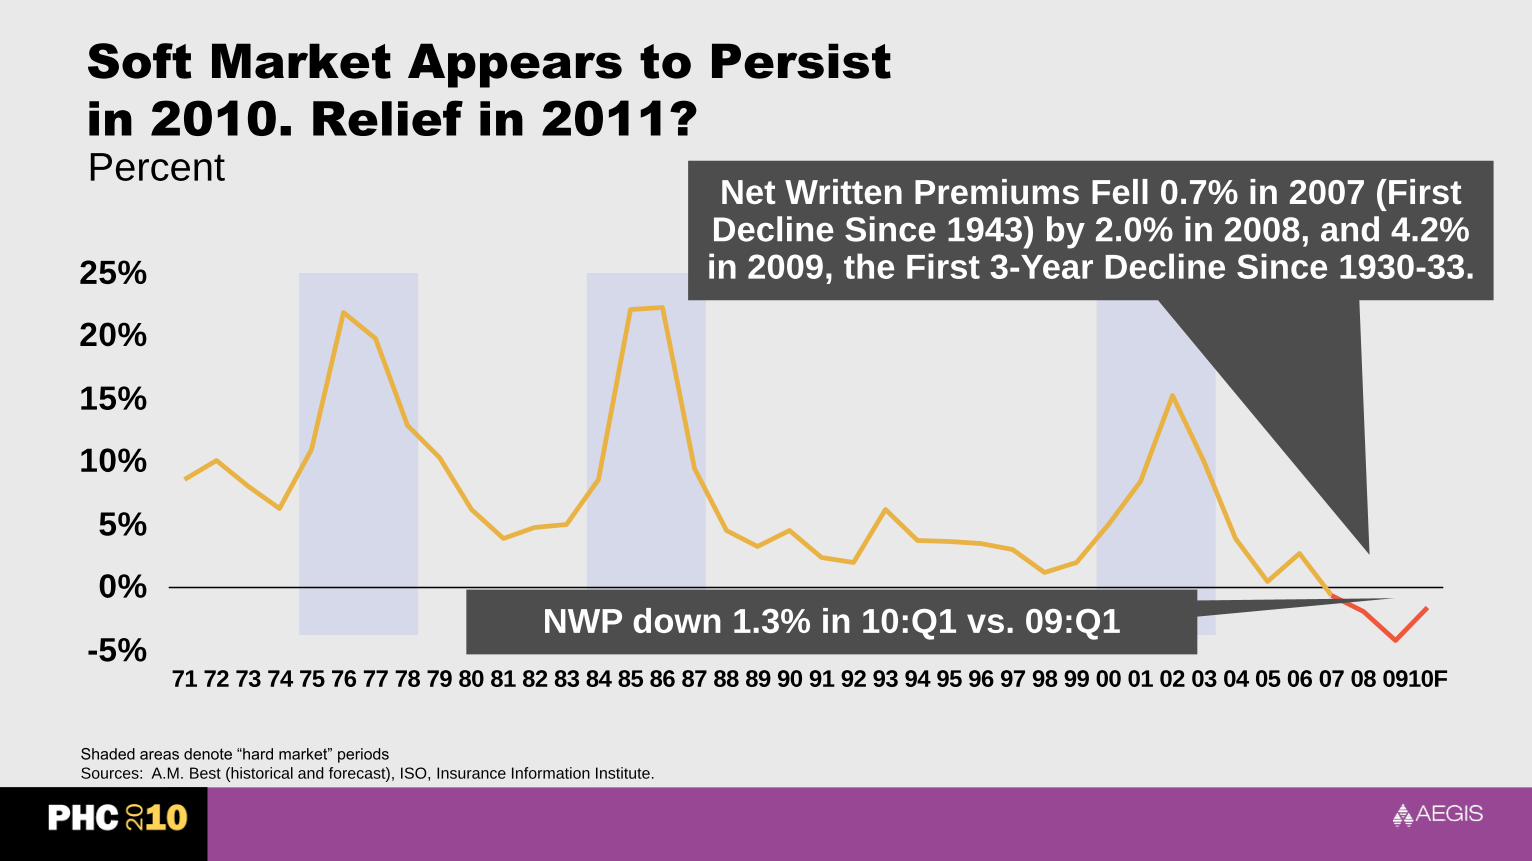
Soft Market Appears to Persist
in 2010. Relief in 2011?
Shaded areas denote “hard market” periods
Sources: A.M. Best (historical and forecast), ISO, Insurance Information Institute.
Net Written Premiums Fell 0.7% in 2007 (First Decline Since 1943) by 2.0% in 2008, and 4.2% in 2009, the First 3-Year Decline Since 1930-33.
Percent
NWP down 1.3% in 10:Q1 vs. 09:Q1

-0.1
%
-3.2
%
-5.9
%
-7.0
%
-9.4
%
-9.7
%
-8.2
%
-4.6
% -2.7
%
-3.0
%
-5.3
%
-9.6
%
-11
.3%
-11
.8%
-12
.0%
-13
.5%
-12
.9%
-11
.0%
-6.4
%
-5.1
%
-4.9
%
-5.8
%
-5.6
%
-5.3
%
-13
.3%
-16%
-14%
-12%
-10%
-8%
-6%
-4%
-2%
0%
1Q
04
2Q
04
3Q
04
4Q
04
1Q
05
2Q
05
3Q
05
4Q
05
1Q
06
2Q
06
3Q
06
4Q
06
1Q
07
2Q
07
3Q
07
4Q
07
1Q
08
2Q
08
3Q
08
4Q
08
1Q
09
2Q
09
3Q
09
4Q
09
1Q
10
Average Commercial Rate Change,
All Lines, (1Q:2004–1Q:2010)
Source: Council of Insurance Agents & Brokers; Insurance Information Institute
Percent
KRW Effect
Magnitude of Price Declines Shrank During
Crisis, Reflecting Shrinking Capital,
Reduced Investment Gains, Deteriorating
Underwriting Performance, Higher Cat Losses and Costlier Reinsurance
Market Remains Soft as Capital Restored and Underwriting Losses Fall

-5.3% -5.4%-5.0%
-4.6% -4.4%-3.9% -3.9%
-2.9%-2.5%
-2.1%
0.4%
-6.0%-5.0%-4.0%-3.0%-2.0%-1.0%0.0%1.0%
All
Co
mm
erc
ial
Co
mm
l P
rop
GL
Um
bre
lla
Co
mm
l A
uto
Co
nstr
ucti
on
WC
Bu
s.
Inte
rru
pti
on
EP
L
D&
O
Su
rety
Change in Commercial Rate Renewals, by Line:
2010:Q1
Source: Council of Insurance Agents & Brokers; Insurance Information Institute
Percentage Change (%)
Most Major Commercial Lines Renewed Down in Q1:2010 by Roughly the Same Margin as a Year Earlier
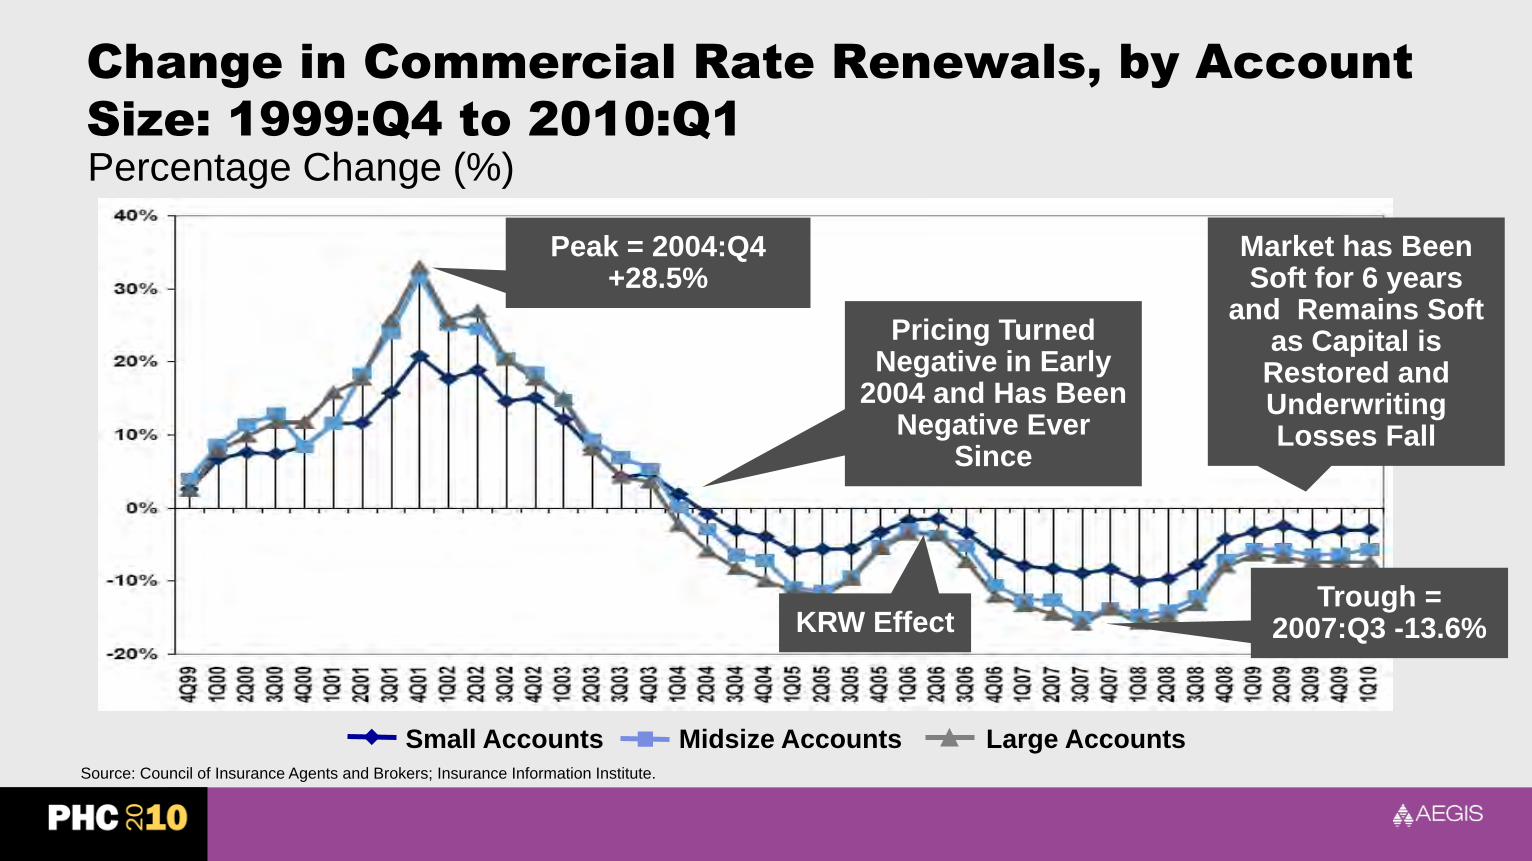
Change in Commercial Rate Renewals, by Account
Size: 1999:Q4 to 2010:Q1
Source: Council of Insurance Agents and Brokers; Insurance Information Institute.
Market has Been Soft for 6 years
and Remains Soft as Capital is Restored and Underwriting Losses Fall
Peak = 2004:Q4 +28.5%
KRW EffectTrough =
2007:Q3 -13.6%
Pricing Turned Negative in Early
2004 and Has Been Negative Ever
Since
Percentage Change (%)
Small Accounts Midsize Accounts Large Accounts
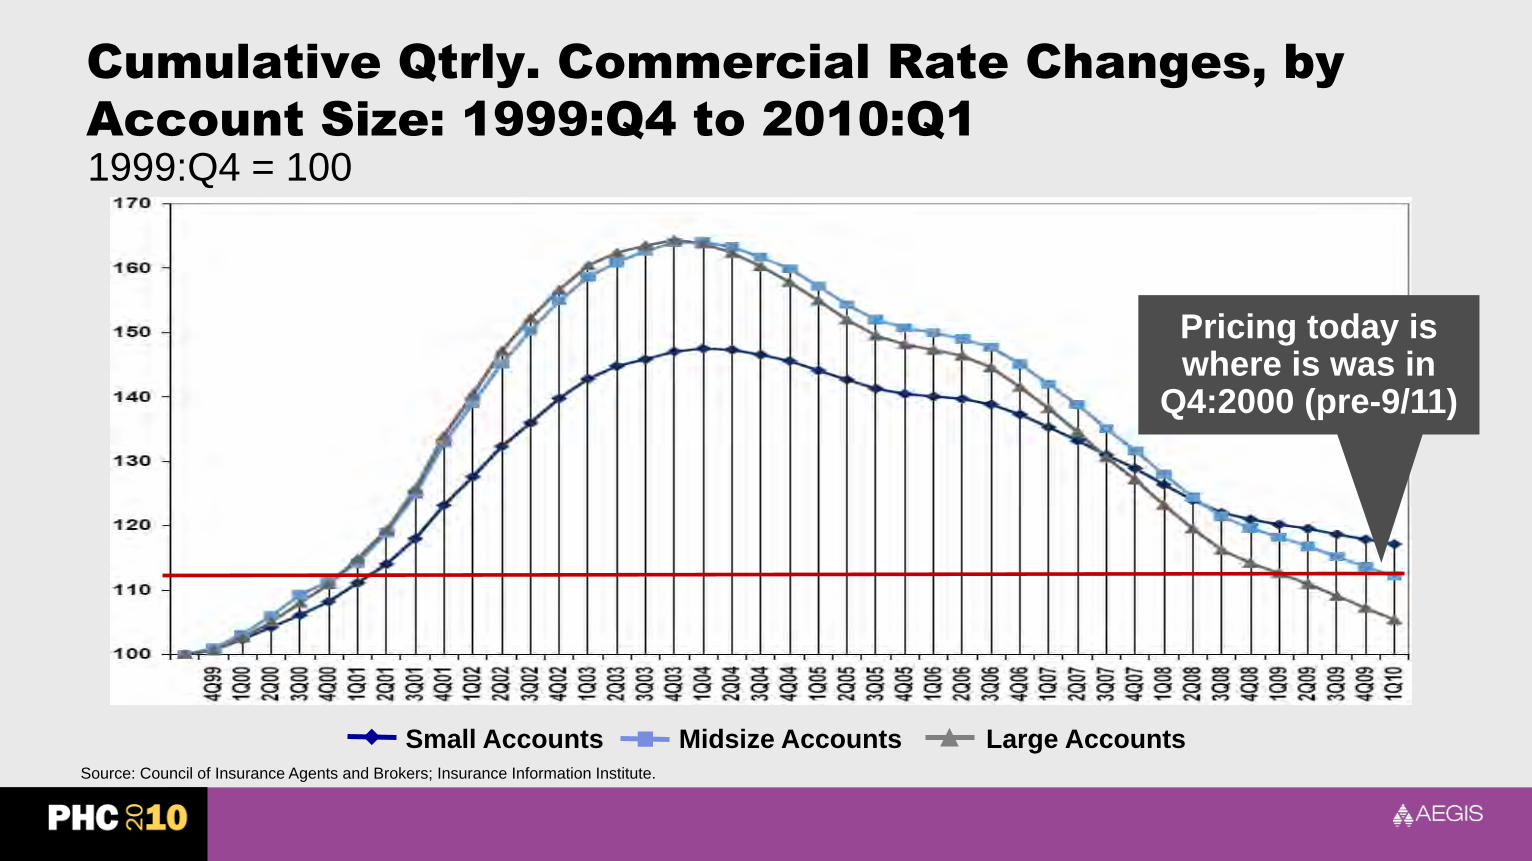
Cumulative Qtrly. Commercial Rate Changes, by
Account Size: 1999:Q4 to 2010:Q1
Pricing today is where is was in
Q4:2000 (pre-9/11)
1999:Q4 = 100
Source: Council of Insurance Agents and Brokers; Insurance Information Institute.
Small Accounts Midsize Accounts Large Accounts
Capital/Policyholder
Surplus (US)
Shrinkage, but Not Enoughto Trigger Hard Market

Policyholder Surplus,
2006:Q4–2010:Q1E
$487.1$496.6
$512.8$521.8
$478.5
$455.6
$437.1
$463.0
$490.8
$540.7
$511.5$517.9 $515.6$505.0
$420$440
$460$480
$500$520
$540$560
06:Q4 07:Q1 07:Q2 07:Q3 07:Q4 08:Q1 08:Q2 08:Q3 08:Q4 09:Q1 09:Q2 09:Q3 09:Q4 10:Q1E
Sources: ISO, A.M .Best.
$ Billions2007:Q3
Previous Surplus PeakSurplus set a new
record in 2010: Q1*
*Includes $22.5B of paid-in capital
from a holding company parent for
one insurer’s investment in a non-
insurance business
Quarterly Surplus Changes Since 2007:Q3 Peak
08:Q2: -$16.6B (-3.2%)
08:Q3: -$43.3B (-8.3%)
08:Q4: -$66.2B (-12.9%)
09:Q1: -$84.7B (-16.2%)
09:Q2: -$58.8B (-11.2%)
09:Q3: -$31.8B (-5.9%)
09:Q4: -$10.3B (-2.0%)
10:Q1: +$18.9B (+3.6%)

3.3%
6.9%
10.9%
6.2%
13.8%
16.2%
9.6%
0%
3%
6%
9%
12%
15%
18%
6/30/1989
Hurricane
Hugo
6/30/1992
Hurricane
Andrew
12/31/93
Northridge
Earthquake
6/30/01 Sept.
11 Attacks
6/30/04
Florida
Hurricanes
6/30/05
Hurricane
Katrina
Financial
Crisis as of
3/31/09**
Ratio of Insured Loss to Surplus for Largest
Capital Events Since 1989*
* Ratio is for end-of-quarter surplus immediately prior to event. Date shown is end of quarter prior to event
** Date of maximum capital erosion; As of 9/30/09 (latest available) ratio = 5.9%
Source: PCS; Insurance Information Institute
PercentThe Financial Crisis at its Peak Ranks
as the Largest “Capital Event” Over
the Past 20+ Years
Investment Performance
Investments Are a PrincipleSource of Declining Profitability
$35.4
$47.2$52.3
$58.0$51.9
$56.9
$44.4
$36.0
$45.3$48.9
$59.4$55.7
$64.0
$31.7
$39.0
$12.6
$42.8
$0
$10
$20
$30
$40
$50
$60
$70
94 95 96 97 98 99 00 01 02 03 04 05* 06 07 08 09 10:Q1
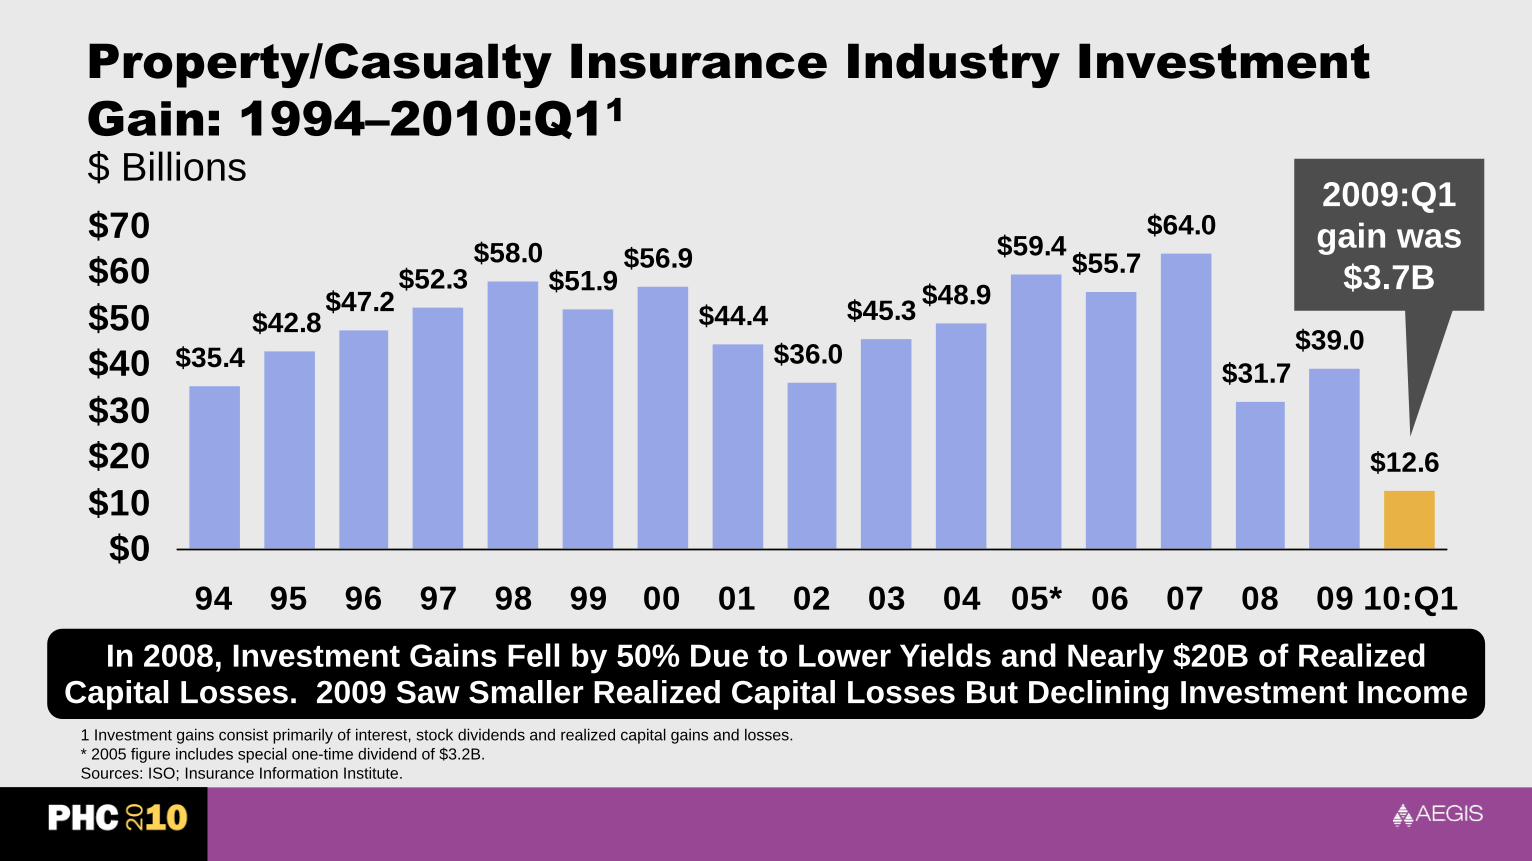
Property/Casualty Insurance Industry Investment
Gain: 1994–2010:Q11
1 Investment gains consist primarily of interest, stock dividends and realized capital gains and losses.
* 2005 figure includes special one-time dividend of $3.2B.
Sources: ISO; Insurance Information Institute.
$ Billions2009:Q1
gain was
$3.7B
In 2008, Investment Gains Fell by 50% Due to Lower Yields and Nearly $20B of Realized Capital Losses. 2009 Saw Smaller Realized Capital Losses But Declining Investment Income

0.08% 0.19% 0.32%0.72%
1.17%
2.00%2.66%
3.20%3.95% 4.13%
0.12%
5.19%5.00%4.93%5.00%4.88%4.82%4.82%4.96%
5.04%4.96%4.82%
0%
1%
2%
3%
4%
5%
6%
1M 3M 6M 1Y 2Y 3Y 5Y 7Y 10Y 20Y 30Y
June 2010 Yield Curve* Pre-Crisis (July 2007)
Treasury Yield Curves:
Pre-Crisis (July 2007) vs. June 2010
Sources: Board of Governors of the United States Federal Reserve Bank; Insurance Information Institute.
Stock Dividend Cuts Have Further Pressured Investment Income
Treasury yield curve is near its most
depressed level in at least 45 years.
Investment income is falling as a result

-1.8% -1.8% -2.0%
-3.6%
-1.9% -2.1%
-3.1% -3.3% -3.3%-3.7%
-5.2%-5.7%
-7.3%
-4.3%
-8%-7%-6%-5%-4%-3%-2%-1%0%
Pers
on
al
Lin
es
Pvt
Pass A
uto
Pers
Pro
p
Co
mm
erc
ial
Co
mm
l A
uto
Cre
dit
Co
mm
Pro
p
Co
mm
Cas
Fid
elity
/Su
rety
Warr
an
ty
Su
rplu
s L
ines
Med
Mal
WC
Rein
su
ran
ce**
Reduction in Combined Ratio Necessary to Offset 1% Decline
in Investment Yield to Maintain Constant ROE, by Line*
*Based on 2008 Invested Assets and Earned Premiums
**US domestic reinsurance only
Source: A.M. Best; Insurance Information Institute.
Lower Investment Earnings Place a Greater Burden on Underwriting and Pricing Discipline

Financial Strength and Ratings
Industry Has Weathered the Storms Well
812
711 9
34
91312
19
9
161413
36
49
3134
5048
556058
41
29
1612
31
1819
495047
35
181415
5 7 6
15
0
10
20
30
40
50
60
70
69 70 71 72 73 74 75 76 77 78 79 80 81 82 83 84 85 86 87 88 89 90 91 92 93 94 95 96 97 98 99 00 01 02 03 04 05 06 07 08 09
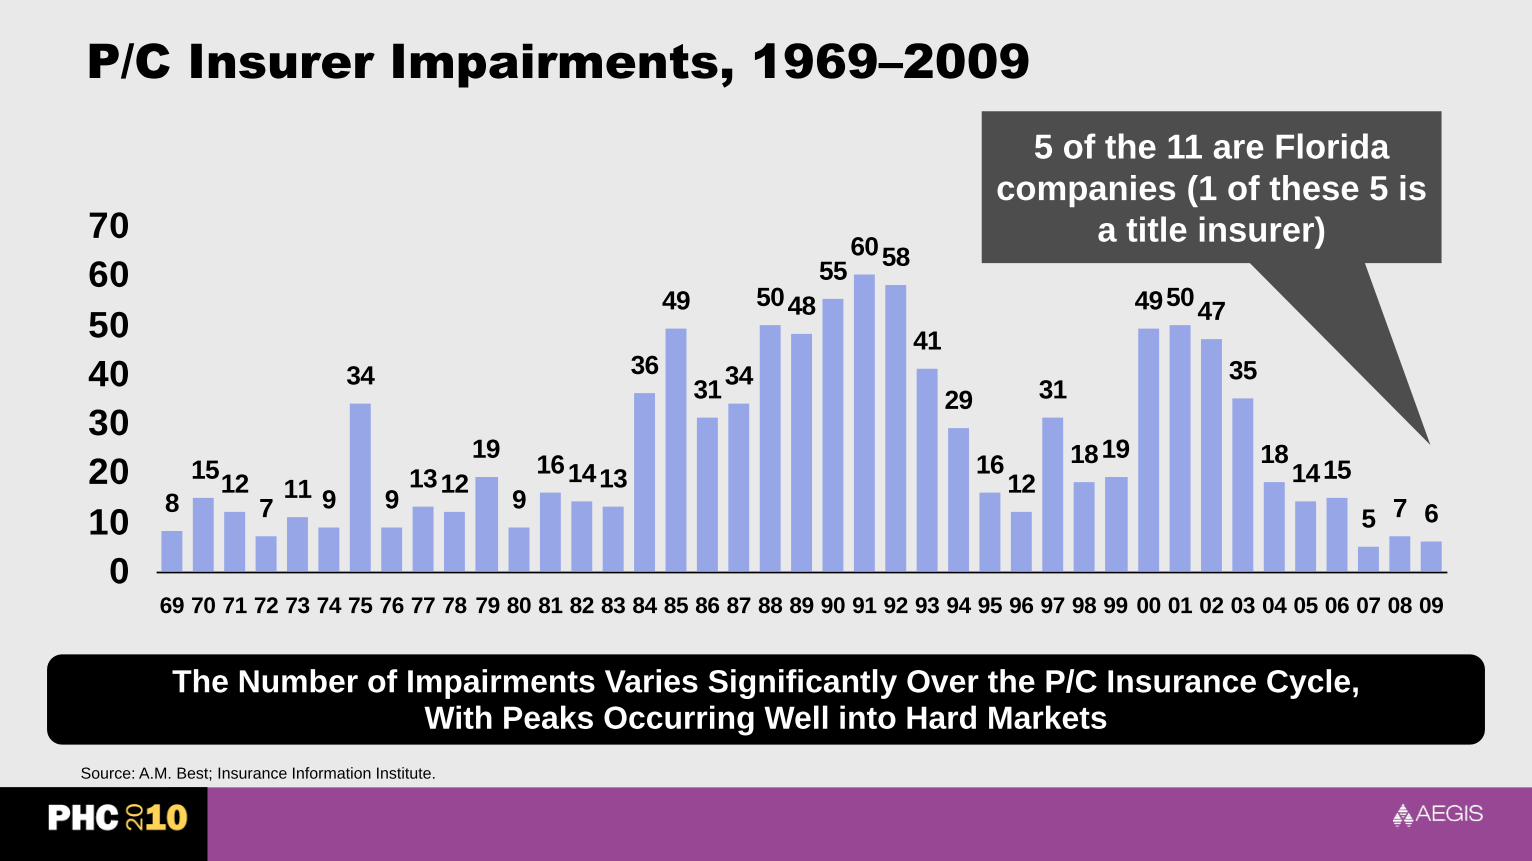
P/C Insurer Impairments, 1969–2009
Source: A.M. Best; Insurance Information Institute.
The Number of Impairments Varies Significantly Over the P/C Insurance Cycle, With Peaks Occurring Well into Hard Markets
5 of the 11 are Florida
companies (1 of these 5 is
a title insurer)

Reasons for US P/C Insurer
Impairments, 1969–2008
Rapid Growth, 14.3%
Misc, 9.1%
Deficient Loss Reserves/
In-adequate Pricing
38.1%
Alleged Fraud, 8.1%
Source: A.M. Best: 1969-2008 Impairment Review, Special Report, Apr. 6, 2009
Deficient Loss Reserves and Inadequate Pricing Are the Leading Cause of Insurer Impairments,
Underscoring the Importance of Discipline. Investment Catastrophe
Losses Play a Much Smaller Role
Catastrophy Losses, 7.6%
Affiliate Impairment, 7.9%
Investment Problems, 7.0%
Sig. Change in Business, 4.2%
Reinsurance Failure, 3.7%
Underwriting Trends –
Financial Crisis Does Not
Directly Impact Underwriting
Performance: Cycle,
Catastrophes Were 2008’s Drivers

112.1 113.0115.9
118.1115.7 116.2
102.7
95.292.9 92.1 92.4
94.296.8 97.0 98.5
112.0
80
85
90
95
100
105
110
115
120
125
95 96 97 98 99 00 01 02 03 04 05 06 07 08 09 10P
Commercial Auto Combined Ratio: 1993–2010P
Sources: A.M. Best; Insurance Information Institute.
Commercial Auto is Expected to Remain Reasonably Profitable in 2010
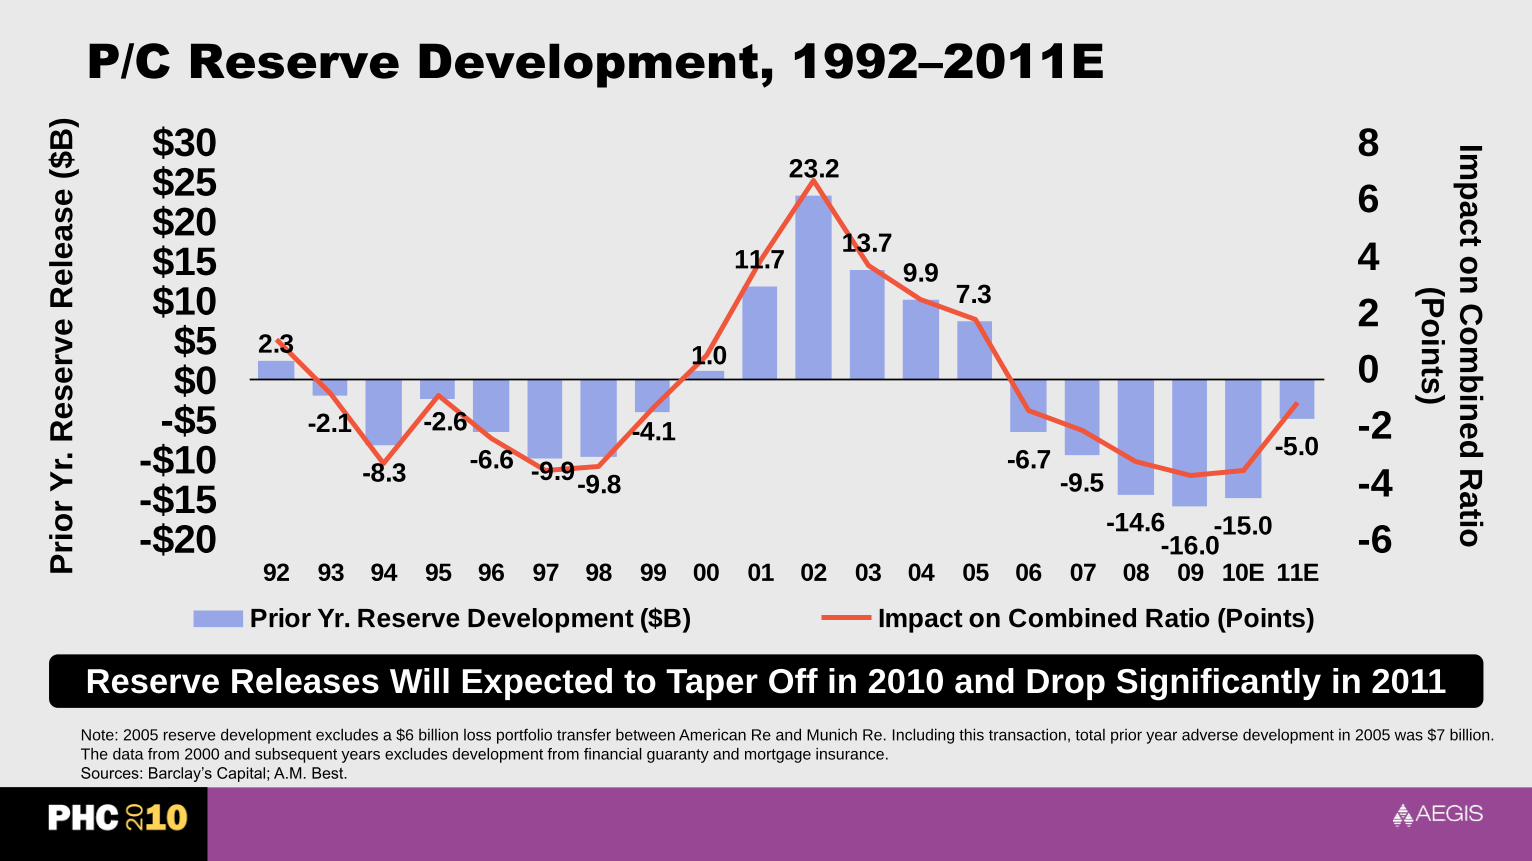
P/C Reserve Development, 1992–2011E
-6.6-9.8
13.79.9
7.3
-6.7-9.5
-14.6 -15.0
-5.0
-16.0
23.2
11.7
1.0
-4.1
-9.9
-2.1
-8.3
-2.6
2.3
-$20-$15-$10-$5$0$5
$10$15$20$25$30
92 93 94 95 96 97 98 99 00 01 02 03 04 05 06 07 08 09 10E 11E-6
-4
-2
0
2
4
6
8
Prior Yr. Reserve Development ($B) Impact on Combined Ratio (Points)
Note: 2005 reserve development excludes a $6 billion loss portfolio transfer between American Re and Munich Re. Including this transaction, total prior year adverse development in 2005 was $7 billion.
The data from 2000 and subsequent years excludes development from financial guaranty and mortgage insurance.
Sources: Barclay’s Capital; A.M. Best.
Pri
or
Yr.
Reserv
e R
ele
ase (
$B
)Im
pact o
n C
om
bin
ed
Ratio
(Po
ints
)
Reserve Releases Will Expected to Taper Off in 2010 and Drop Significantly in 2011

96.8
101.1
104.2
103.6
99.4
96.4
101.4
102.8
103.9
112.5
121.9
118.8
121.1
117.6
118.4
118.2
117.4
122.6
121.5
109.1
102.0
97.0
100.0
101.0
107.0
115.3
118.2
121.7
110.9
110.0
107.0
102.7
98.4
103.5
104.3
109.0
112.0
99.9
0
20
40
60
80
100
120
140
73 77 81 85 89 93 97 01 05 09E
Workers Compensation Combined Ratio: 1973–2010P
Source: A.M. Best; Insurance Information Institute.
Workers Comp Underwriting Results Are Deteriorating Markedly
Shifting Legal Liability
and Tort Environment
Is the Tort PendulumSwinging Against Insurers?

Important Issues & Threats
Facing Insurers: 2010–2015
• No tort reform (or protection of recent reforms) is forthcoming from the current Congress or Administration
• Erosion of recent reforms is a certainty (already happening)
• Innumerable legislative initiatives will create opportunities to undermine existing reforms and develop new theories and channels of liability
• Torts twice the overall rate of inflation
• Influence personal and commercial lines, esp. auto liability
• Historically extremely costly to p/c insurance industry
• Leads to reserve deficiency, rate pressure
Source: Insurance Information Institute
Bottom Line: Tort “crisis” is on the horizon and will be recognized as such by 2012–2014
Emerging Tort Threat
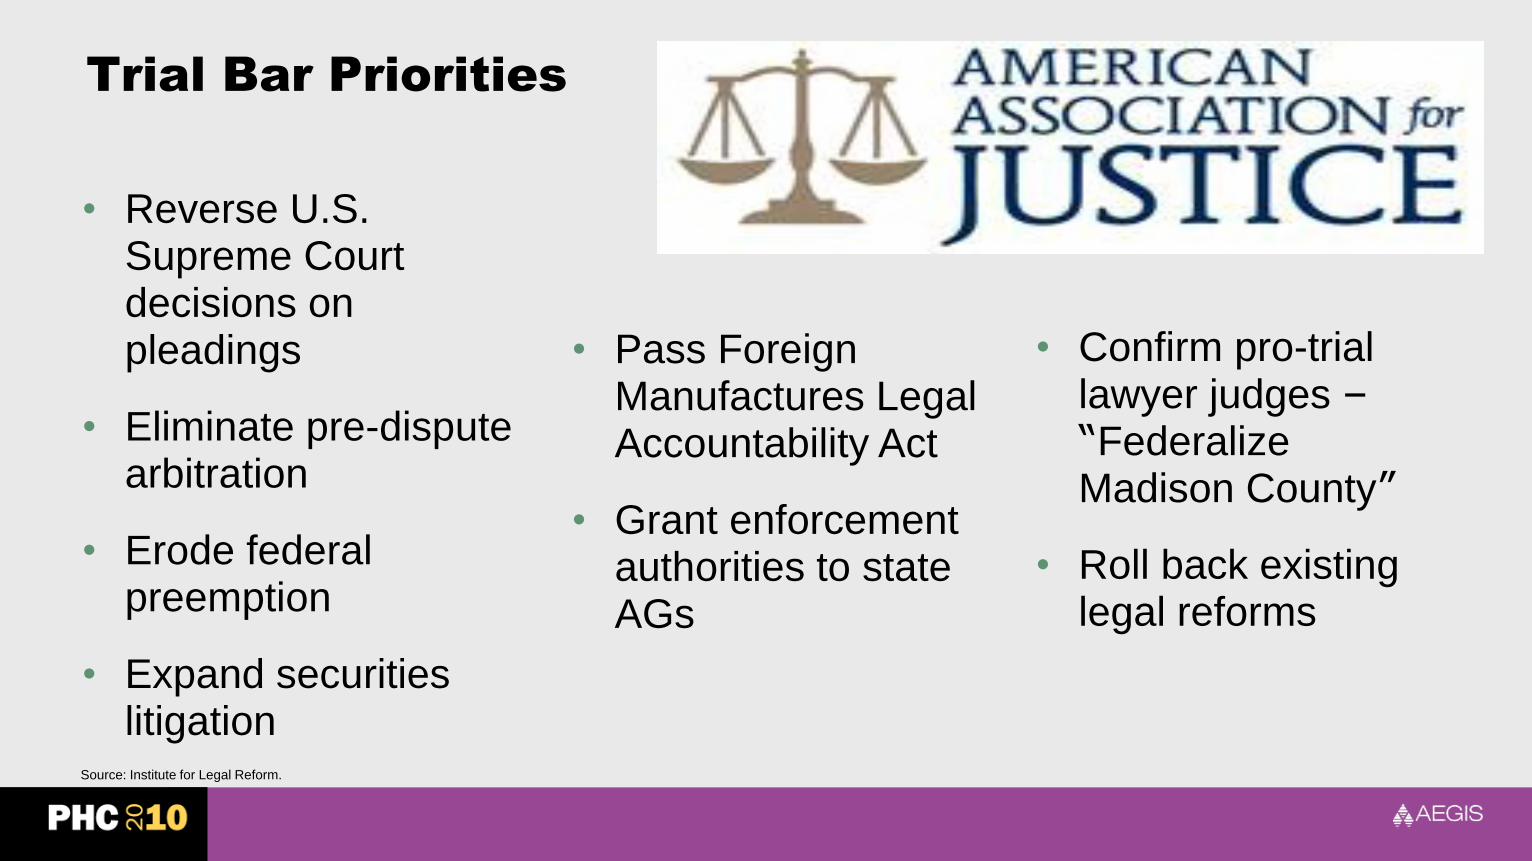
• Reverse U.S. Supreme Court decisions on pleadings
• Eliminate pre-dispute arbitration
• Erode federal preemption
• Expand securities litigation
• Pass Foreign Manufactures Legal Accountability Act
• Grant enforcement authorities to state AGs
• Confirm pro-trial lawyer judges –“Federalize Madison County”
• Roll back existing legal reforms
Trial Bar Priorities
Source: Institute for Legal Reform.
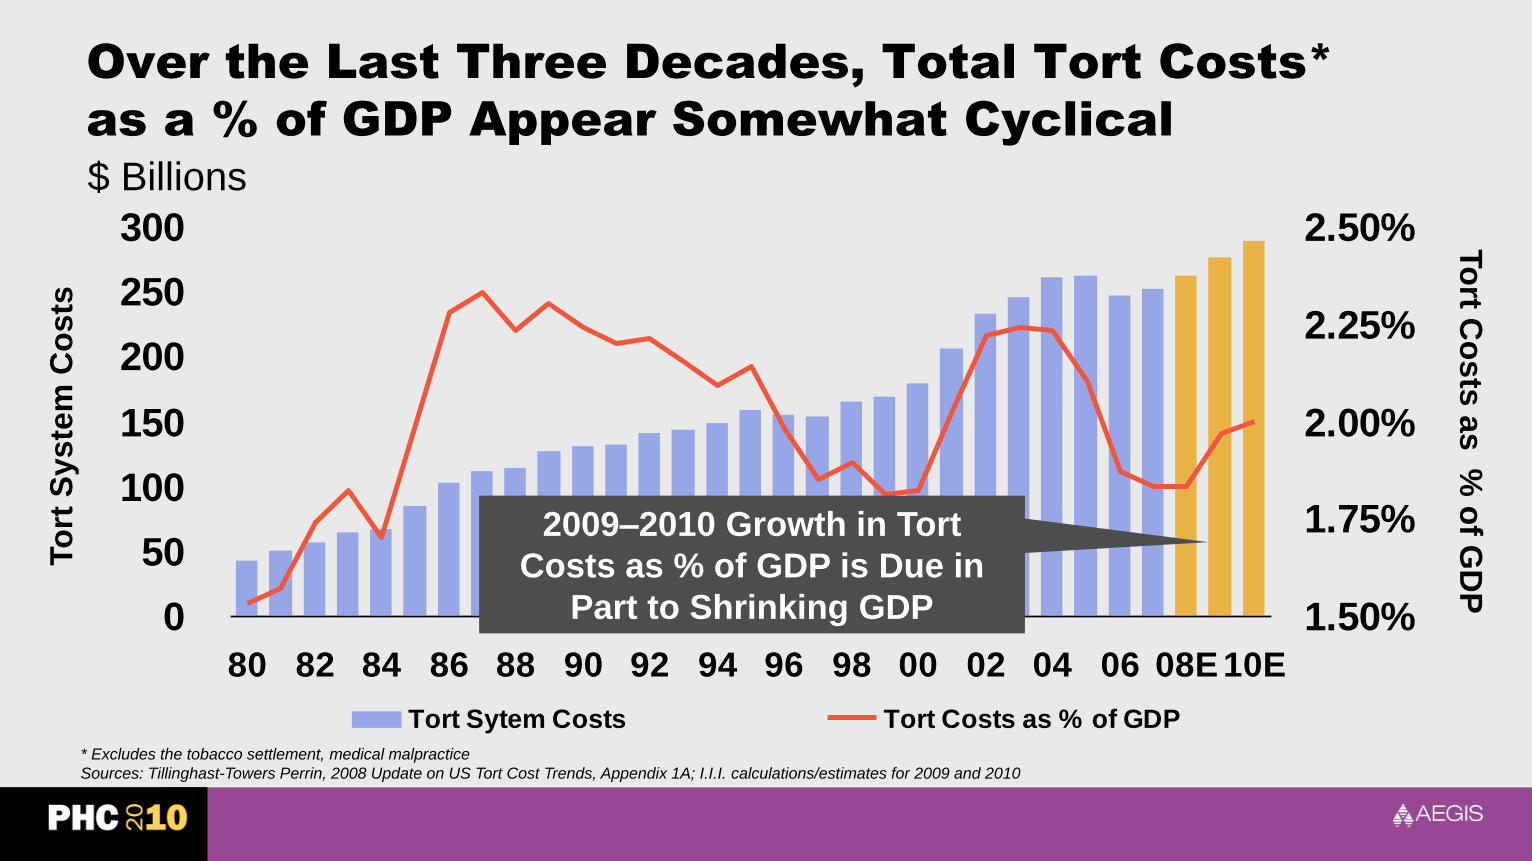
Over the Last Three Decades, Total Tort Costs*
as a % of GDP Appear Somewhat Cyclical
0
50
100
150
200
250
300
80 82 84 86 88 90 92 94 96 98 00 02 04 06 08E 10E
1.50%
1.75%
2.00%
2.25%
2.50%
Tort Sytem Costs Tort Costs as % of GDP
* Excludes the tobacco settlement, medical malpractice
Sources: Tillinghast-Towers Perrin, 2008 Update on US Tort Cost Trends, Appendix 1A; I.I.I. calculations/estimates for 2009 and 2010
To
rt S
yste
m C
osts
To
rt Co
sts
as %
of G
DP
$ Billions
2009–2010 Growth in Tort
Costs as % of GDP is Due in
Part to Shrinking GDP

Business Leaders Ranking of Liability Systems
Best States
1. Delaware
2. North Dakota
3. Nebraska
4. Indiana
5. Iowa
6. Virginia
7. Utah
8. Colorado
9. Massachusetts
10. South Dakota
Worst States
41. New Mexico
42. Florida
43. Montana
44. Arkansas
45. Illinois
46. California
47. Alabama
48. Mississippi
49. Louisiana
50. West Virginia
New in 2009
North Dakota
Massachusetts
South Dakota
Drop-offs
Maine
Vermont
Kansas
Newly Notorious
New Mexico
Montana
Arkansas
Rising Above
Texas
South Carolina
Hawaii
Source: US Chamber of Commerce 2009 State Liability Systems Ranking Study; Insurance Info. Institute.
Midwest/West has mix of good and bad states.

The Nation’s Judicial Hellholes: 2010
Source: American Tort Reform Association; Insurance Information Institute
South Florida
West VirginiaIllinois
Cook County
New Mexico
Appellate Courts
Watch List
California
Alabama
Madison County, IL
Jefferson County, MS
Texas Gulf Coast
Rio Grande Valley, TX
Dishonorable Mention
AR Supreme Court
MN Supreme Court
ND Supreme Court
PA Governor
MA Supreme Judicial Court
Sacramento County
New Jersey
Atlantic County (Atlantic City)
New York City

$725$756
$800 $799
$1,018 $1,022
$950
$1,077$1,046
$747
$500
$600
$700
$800
$900
$1,000
$1,100
$1,200
1999 2000 2001 2002 2003 2004 2005 2006 2007 2008
Average Jury Awards 1999 - 2008
Source: Jury Verdict Research; Insurance Information Institute.

164 163
231
188
111
173
241209 216
498
266
227 238
182
119
176
222
168
66
202
$0
$100
$200
$300
$400
$500
$600
91 92 93 94 95 96 97 98 99 00 01 02 03 04 05 06 07 08 09 10*
Securities Class Action Suits Filed: 1991-2010*
*Securities fraud suits filed in U.S. federal courts as of June 30, 2010
Source: Stanford University School of Law (securities.stanford.edu); Insurance Information Institute
After surging in 2007 and 2008,
litigation activity related to the
financial crisis began to ebb after
financial markets began to
recover in the 2nd quarter of 2009

Catastrophic Loss –
Catastrophe Losses Trends
Are Trending Adversely

$7
.5
$4
.7
$2
2.9
$5
.5 $1
6.9
$8
.3
$7
.4
$2
.6 $1
0.1
$8
.3
$4
.6
$2
6.5
$5
.9 $1
2.9 $2
7.5
$6
1.9
$9
.2
$6
.7
$2
7.1
$1
0.6
$6
.1
$1
00
.0
$2
.7
$0
$20
$40
$60
$80
$100
$120
89 90 91 92 93 94 95 96 97 98 99 0 1 2 3 4 5 6 7 8 9 10*20??
US Insured Catastrophe Losses
*Through June 30, 2010.
Note: 2001 figure includes $20.3B for 9/11 losses reported through 12/31/01. Includes only business and personal property claims, business interruption and auto claims. Non-prop/BI losses = $12.2B.
Sources: Property Claims Service/ISO; Munich Re; Insurance Information Institute.
2010 CAT Losses Are Running Below 2009, So FarFigures Do Not Include an Estimate of Deepwater Horizon Loss
$ Billions $100 Billion CAT Year is
Coming Eventually
First Half 2010
CAT Losses
Were Down 19%
or $1.4B from
first half 2009
2000s: A Decade of Disaster
2000s: $193B (up 117%)
1990s: $89B
Geophysical events
(earthquake, tsunami, volcanic activity)Meteorological events
(storm)
Hydrological events
(flood, mass movement)Climatological events
(extreme temperature, drought, wildfire)
Selection of significant natural
catastrophes (see table)
Global natural catastrophes
1
2
3
4
5
7
6
8 911 10
12
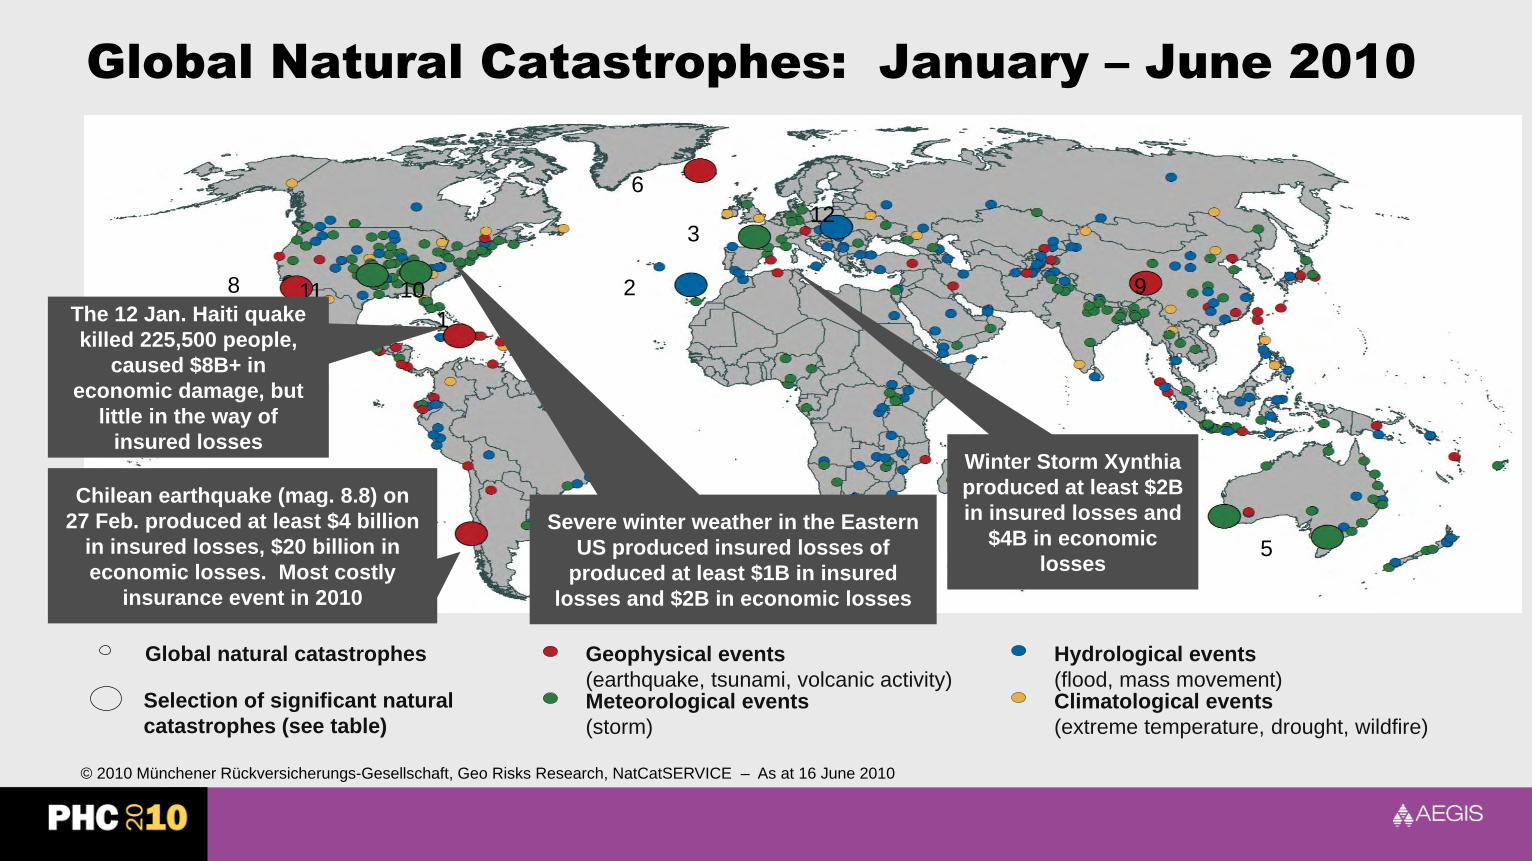
Severe winter weather in the Eastern
US produced insured losses of
produced at least $1B in insured
losses and $2B in economic losses
The 12 Jan. Haiti quake
killed 225,500 people,
caused $8B+ in
economic damage, but
little in the way of
insured losses
Chilean earthquake (mag. 8.8) on
27 Feb. produced at least $4 billion
in insured losses, $20 billion in
economic losses. Most costly
insurance event in 2010
Winter Storm Xynthia
produced at least $2B
in insured losses and
$4B in economic
losses
Global Natural Catastrophes: January – June 2010
© 2010 Münchener Rückversicherungs-Gesellschaft, Geo Risks Research, NatCatSERVICE – As at 16 June 2010
50
100
150
200
250
1980 1982 1984 1986 1988 1990 1992 1994 1996 1998 2000 2002 2004 2006 2008 2010
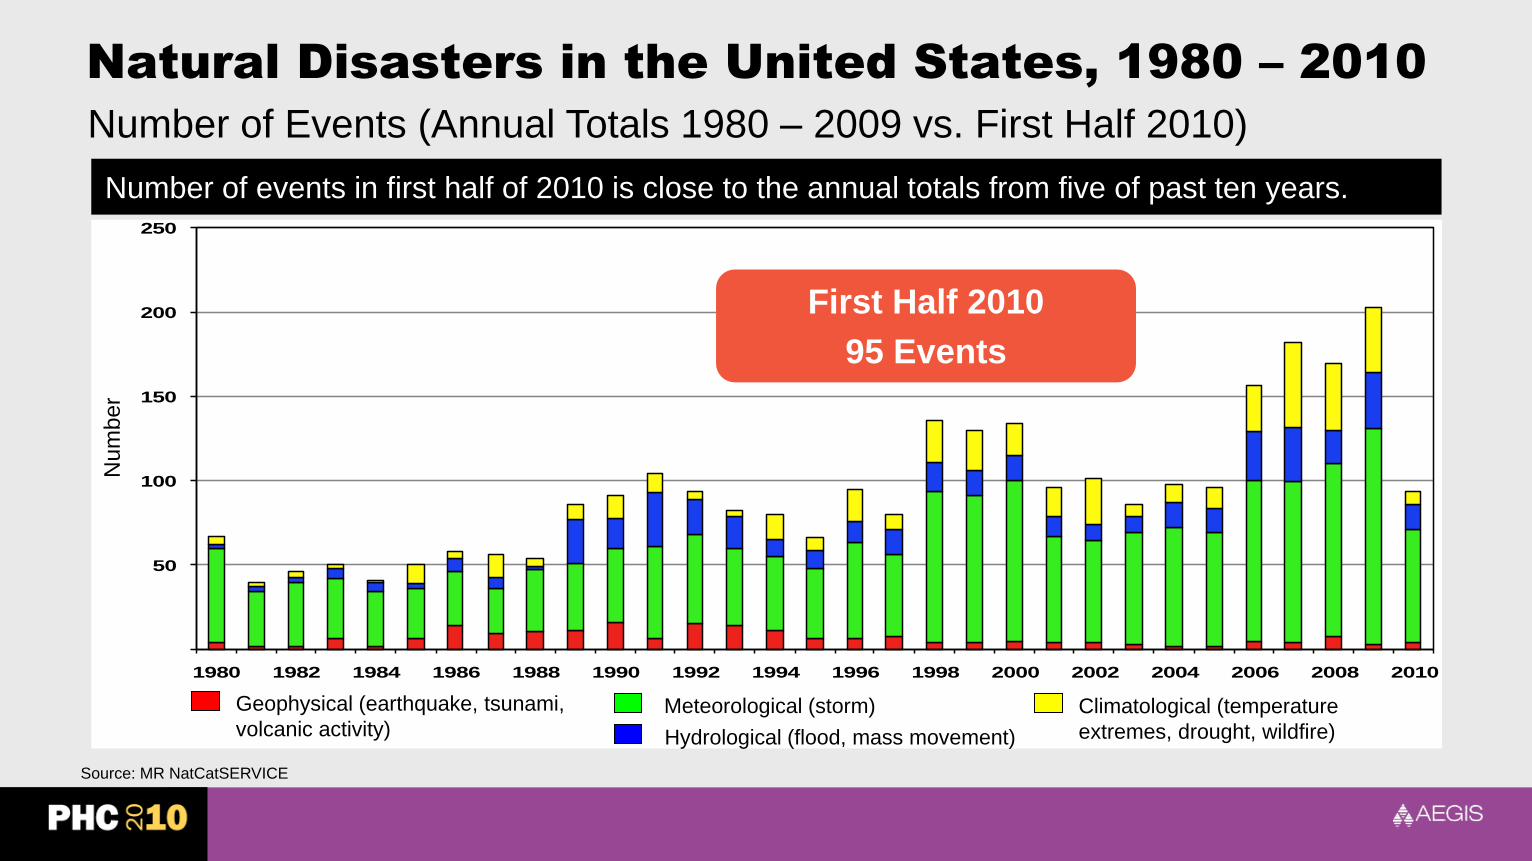
First Half 2010
95 Events
Number of events in first half of 2010 is close to the annual totals from five of past ten years.
Num
ber
Geophysical (earthquake, tsunami,
volcanic activity)Climatological (temperature
extremes, drought, wildfire)
Meteorological (storm)
Hydrological (flood, mass movement)
Natural Disasters in the United States, 1980 – 2010
Source: MR NatCatSERVICE
Number of Events (Annual Totals 1980 – 2009 vs. First Half 2010)

Source: Property Claims Service, MR NatCatSERVICE
Average annual winter storm losses have increased over 50% since 1980.
First Half 2010 $2.4 Bn
U.S. Winter Storm Loss Trends
Severe winter storms in early
2010 caused major damage to
energy infrastructure
Annual totals 1980 – 2009 vs. First Half 2010

Thunderstorm losses have quadrupled since 1980.
First Half 2010 $3.0 Bn
U.S. Thunderstorm Loss Trends
Source: Property Claims Service, MR NatCatSERVICE
Annual Totals 1980 – 2009 vs. First Half 2010

Outlook for 2010 North Atlantic Hurricane Season*
Forecast ParameterAverage
(1950-2000)2010 Forecast*
Named Storms 9.6 18
Named Storm Days 49.1 90
Hurricanes 5.9 10
Hurricane Days 24.5 40
Major Hurricanes 2.3 5
Major Hurricane Days 5.0 13
Accumulated Cyclone Energy 96.1 185
Net Tropical Cyclone Activity 100% 195%
*Forecast as of June 2, 2010
Source: Colorado State University, Department of Atmospheric Sciences; Insurance Information Institute
The 2010 hurricane season is expected to be nearly twice as active as the long-run average (195% of normal)
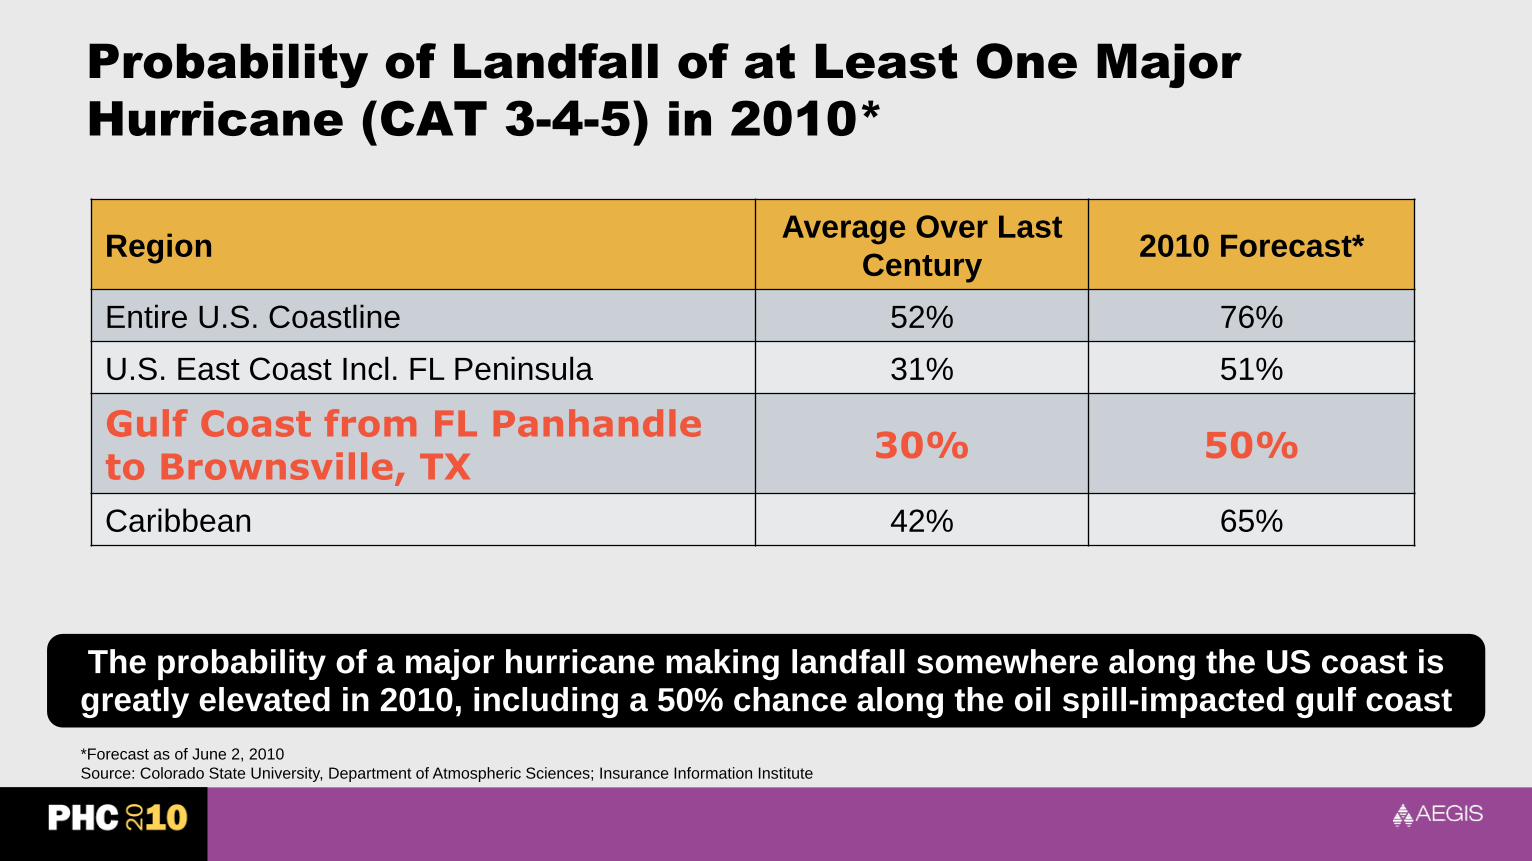
Probability of Landfall of at Least One Major
Hurricane (CAT 3-4-5) in 2010*
RegionAverage Over Last
Century2010 Forecast*
Entire U.S. Coastline 52% 76%
U.S. East Coast Incl. FL Peninsula 31% 51%
Gulf Coast from FL Panhandle to Brownsville, TX
30% 50%
Caribbean 42% 65%
*Forecast as of June 2, 2010
Source: Colorado State University, Department of Atmospheric Sciences; Insurance Information Institute
The probability of a major hurricane making landfall somewhere along the US coast is greatly elevated in 2010, including a 50% chance along the oil spill-impacted gulf coast
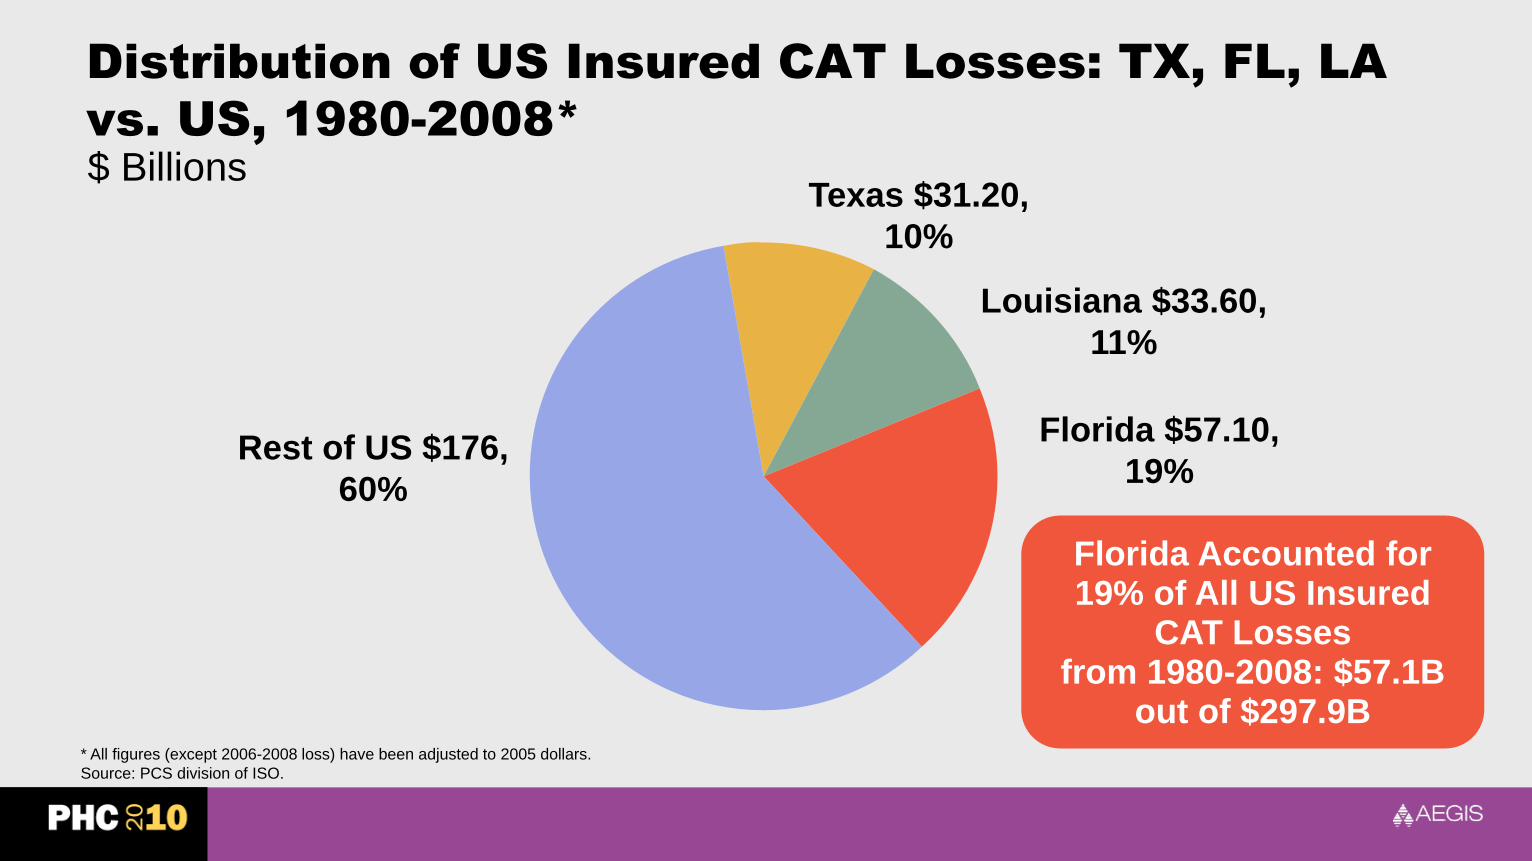
Distribution of US Insured CAT Losses: TX, FL, LA
vs. US, 1980-2008*
Louisiana $33.60,
11%
Texas $31.20,
10%
Florida $57.10,
19%
* All figures (except 2006-2008 loss) have been adjusted to 2005 dollars.
Source: PCS division of ISO.
Florida Accounted for 19% of All US Insured
CAT Losses from 1980-2008: $57.1B
out of $297.9B
Rest of US $176,
60%
$ Billions
The Deepwater Horizon Disaster
Insurance and Energy Market Implications
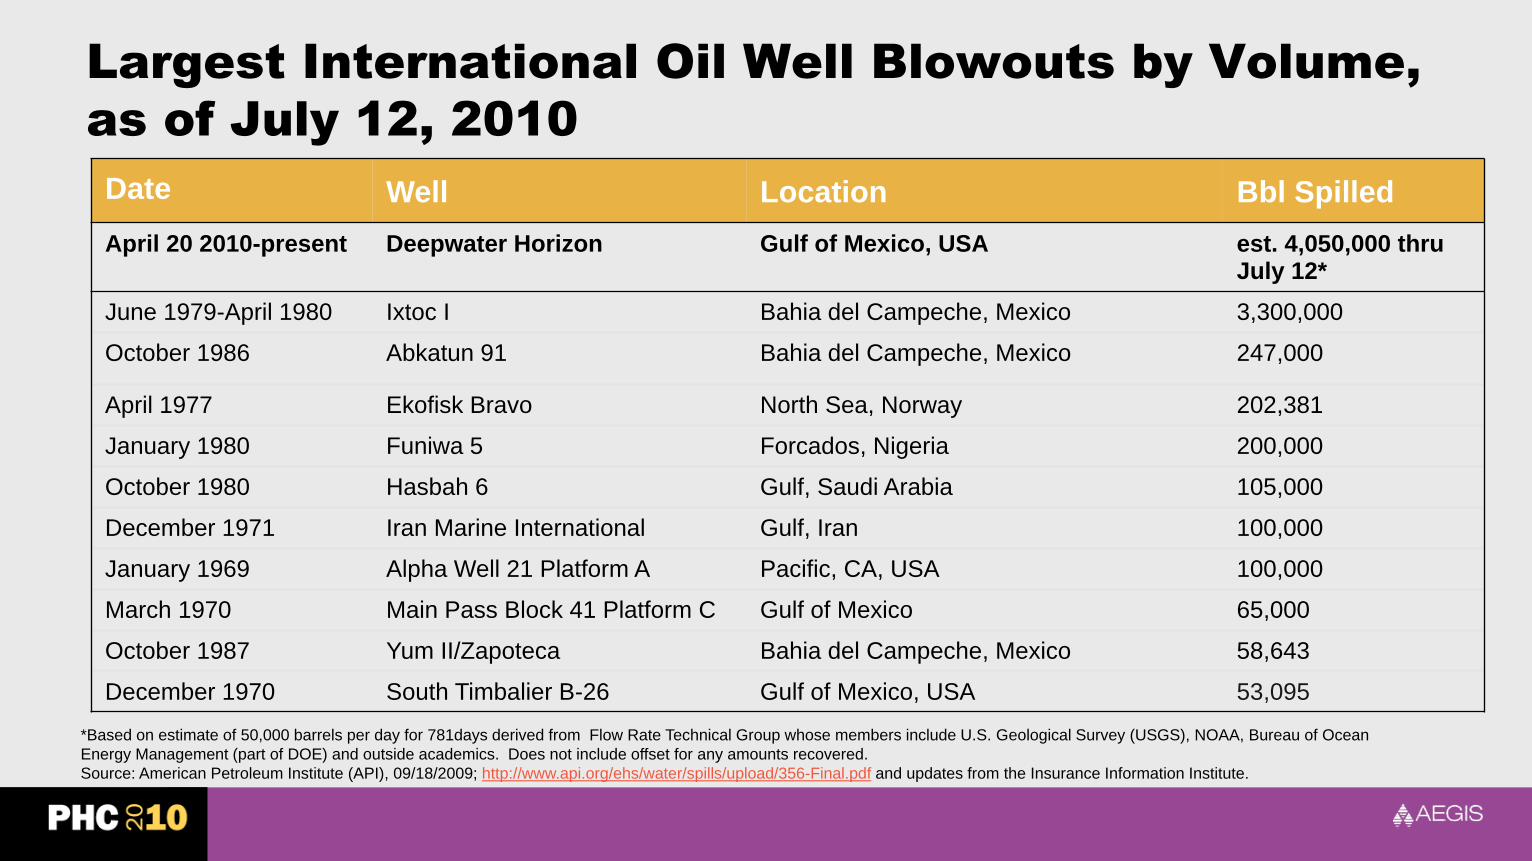
Largest International Oil Well Blowouts by Volume,
as of July 12, 2010
Date Well Location Bbl Spilled
April 20 2010-present Deepwater Horizon Gulf of Mexico, USA est. 4,050,000 thru July 12*
June 1979-April 1980 Ixtoc I Bahia del Campeche, Mexico 3,300,000
October 1986 Abkatun 91 Bahia del Campeche, Mexico 247,000
April 1977 Ekofisk Bravo North Sea, Norway 202,381
January 1980 Funiwa 5 Forcados, Nigeria 200,000
October 1980 Hasbah 6 Gulf, Saudi Arabia 105,000
December 1971 Iran Marine International Gulf, Iran 100,000
January 1969 Alpha Well 21 Platform A Pacific, CA, USA 100,000
March 1970 Main Pass Block 41 Platform C Gulf of Mexico 65,000
October 1987 Yum II/Zapoteca Bahia del Campeche, Mexico 58,643
December 1970 South Timbalier B-26 Gulf of Mexico, USA 53,095
*Based on estimate of 50,000 barrels per day for 781days derived from Flow Rate Technical Group whose members include U.S. Geological Survey (USGS), NOAA, Bureau of Ocean
Energy Management (part of DOE) and outside academics. Does not include offset for any amounts recovered.
Source: American Petroleum Institute (API), 09/18/2009; http://www.api.org/ehs/water/spills/upload/356-Final.pdf and updates from the Insurance Information Institute.

Gulf Coast Near Deepwater Horizon Site
Sources: Energy Information Administration
On April 20, 2010, an explosion and
fire occurred on the offshore drilling rig Deepwater Horizon,
which had been drilling an
exploratory well in approx. 5,000 ft of water in the Gulf of Mexico, 52 miles SE
of Venice, Louisiana.
The platform subsequently sank,
with 11 crewmembers
presumed dead, and the
uncompleted well leaking oil.

Operating Group for Deepwater Horizon:
Joint Venture
Mitsui Oil Exploration
10%
Anadarko Petroleum
25%
BP
66%
Source: Barclays Capital research note 05/10/10; I.I.I. research.
The operating group for Deepwater
Horizon is a joint venture led by BP.
BP has said it will assume liability for
all “legitimate claims caused by the
oil spill.
BP is self-insured, so large portion of
losses will not hit the insurance
industry.
On June 1, 2010, U.S. Attorney
General said federal authorities have
opened criminal and civil
investigations into the spill.
As of early July, BP says that its costs have exceeded $3 billion, including $105 million paid on 32,000 claims. BP CEO Tony Hayward is insisting “Other parties besides BP may be responsible for
costs and liabilities arising from the oil spill, and we expect those parties to live up to their obligations.” But Anadarko accuses BP of gross negligence.
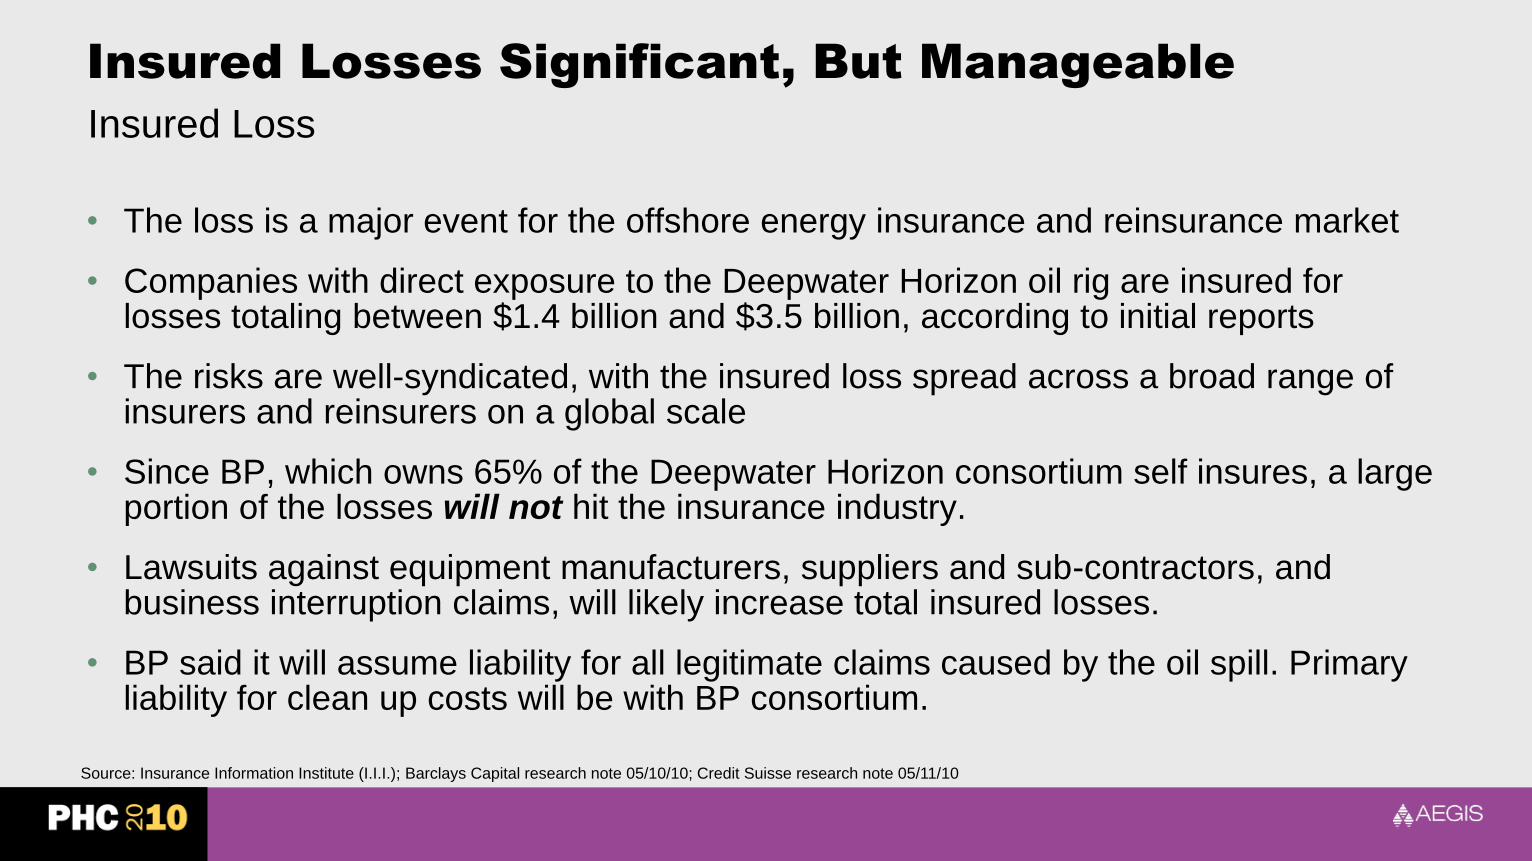
Insured Losses Significant, But Manageable
• The loss is a major event for the offshore energy insurance and reinsurance market
• Companies with direct exposure to the Deepwater Horizon oil rig are insured for losses totaling between $1.4 billion and $3.5 billion, according to initial reports
• The risks are well-syndicated, with the insured loss spread across a broad range of insurers and reinsurers on a global scale
• Since BP, which owns 65% of the Deepwater Horizon consortium self insures, a large portion of the losses will not hit the insurance industry.
• Lawsuits against equipment manufacturers, suppliers and sub-contractors, and business interruption claims, will likely increase total insured losses.
• BP said it will assume liability for all legitimate claims caused by the oil spill. Primary liability for clean up costs will be with BP consortium.
Source: Insurance Information Institute (I.I.I.); Barclays Capital research note 05/10/10; Credit Suisse research note 05/11/10
Insured Loss

Long-Run Implications of Deepwater Horizon on
Energy & Energy Insurance Markets
• Deepwater Horizon Will Become the Single Most Expensive Environmental Disaster in US History
• Reaction (and Overreaction) to Spill Will Have Multi-Decade Impact on Energy Business
– Impacts will not be confined to offshore oil & gas industry
Source: Insurance Information Institute
Long-Run Implications of Deepwater Horizon on
Energy & Energy Insurance Markets (cont’d)
• Current Administration’s Hostility Toward Some Energy Segments is Obvious and Politicization of Deepwater Incident Means There Are Potential Impacts On:
– Carbon legislation (cap & trade)
– Coal mining & equipment (not just in the US)
– Oil sands and pipeline project
– Utilities
– Nuclear power
– Alternative energy
– Fiscal policy/“stimulus”Source: Insurance Information Institute
Long-Run Implications of Deepwater Horizon:
US Energy Policy Shift
• Danger that Deepwater Results in “Three Mile Island Effect”
– Regulatory, political reaction could make future deep water drilling impossible (logistically, economically)
– Higher (unlimited) limits of financial responsibility
– Drilling moratorium remains in effect despite impact on jobs, economy
– CA, FL no longer willing to consider offshore drilling
• Hostility Toward Fossil Fuels Intensifies
– More regulation (not necessarily based on facts or science)
– Higher taxes on energy producers
– Higher costs for consumers
– Continued/higher subsidies for alternative fuels/technologiesSource: Insurance Information Institute

Long-Run Implications of Deepwater Horizon:
US Energy Policy Shift (cont’d)
• Corporate Governance
– Accountability for issue will quickly rise to the highest levels
– The Tony Hayward Legacy
Source: Insurance Information Institute

Oil Spill Testimony by I.I.I.

Insurance Information
Institute Online:
www.iii.org
Thank you for your timeand your attention!
Twitter: twitter.com/bob_hartwig