aftershocks of the june 20, 1978, greece earthquake: a multimode faulting sequence
TRANSCRIPT

Tectonophysics, 73 (1981) 343-363 Elsevier Scientific Publishing Company, Amsterdam - Printed in The Netherlands
343
AFTERSHOCKS OF THE JUNE 20,1978, GREECE EARTHQUAKE: A MULTIMODE FAULTING SEQUENCE
DAVID CARVER 1 and G.A. BOLLINGER 1-Z
’ U.S. Geological Survey, Box 25046, Denver Federal Center, Denver, Colo. (U.S.A.) ’ Department of Geological Sciences, Virginia Polytechnic Institute and State University, Blacksburg, Va. (U.S.A.)
(Received June 25,198O; revised version accepted August 29,198O)
ABSTRACT
Carver, D. and Bollinger, G.A., 1981. Aftershocks of the June 20, 1978, Greece earth- quake: a multimode sequence. Tectonophysics, 73: 343-363.
A 1 O-station portable seismograph network was deployed in northern Greece to study aftershocks of the magnitude (mb) 6.4 earthquake of June 20, 1978. The main shock occurred (in a graben) about 25 km northeast of the city of Thessaloniki and caused an east-west zone of surface rupturing 14 km long that splayed to 7 km wide at the west end. The hypocenters for 116 aftershocks in the magnitude range from 2.5 to 4.5 were determined. The epicenters for these events cover an area 30 km (east-west) by 18 km (north-south), and focal depths ranges from 4 to 12 km. Most of the aftershocks in the east half of the aftershock zone are north of the surface rupture and north of the graben. Those in the west half are located within the boundaries of the graben. Composite focal- mechanism solutions for selected aftershocks indicate reactivation of geologically mapped normal faults in the area. Also, strike-slip and dip-slip faults that splay off the western end of the zone of surface ruptures may have been activated.
The epicenters for four large (M > 4.8) foreshocks and the main shock were relocated using the method of joint epicenter determination. Collectively, those five epicenters form an arcuate pattern convex southward, that is north of and 5 km distant from the surface rupturing. The 5-km separation, along with a focal depth of 8 km (average after- shock depth) or 16 km (NEIS main-shock depth), implies that the fault plane dips north- ward 58’ or 73’, respectively. A preferred nodal-plane dip of 36’ was determined by B.C. Papazachos and his colleagues in 1979 from a focal-mechanism solution for the main shock. If this dip is valid for the causal fault and that fault projects to the zone of surface rupturing, a decrease of dip with depth is required.
INTRODUCTION
The magnitude 6.5 (Ms, NEIS) Greece earthquake of June 20,1978, was located in the vicinity of Lake Volvi and Lake Langadha (40,74’N, 2327’E, NEIS), approximately 25 km northeast of the city of Thessaloniki. There was extensive damage t~oughout the epicentral area, as well as in Thes- salon%, and at least 50 deaths were directly attributed to the earthquake. The main shock was preceded by four foreshocks of M 2 4.8, the largest of which was a magnitude 5.6 (Ms, NEIS) on May 23, 1978. Several thousand
0040-1951/81/0000--0000/$ 02.50 0 1981 Elsevier Scientific Publishing Company
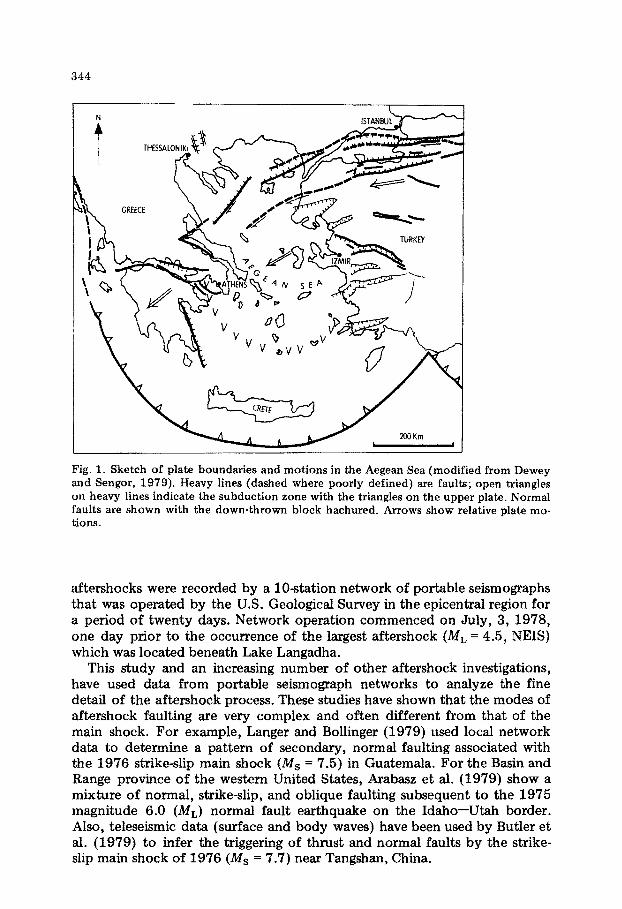
Fig. 1. Sketch of plate boundaries and motions in the Aegean Sea (modified from Dewey and Sengor, 1979). Heavy lines (dashed where poorly defined) are faults; open triangles on heavy lines indicate the subduction zone with the triangles on the upper plate. Normal faults are shown with the down-thrown block hachured. Arrows show relative plate mo- tions.
aftershocks were recorded by a lo-station network of portable seismographs that was operated by the U.S. Geological Survey in the epicentral region for a period of twenty days. Network operation commenced on July, 3, 1978, one day prior to the occurrence of the largest aftershock (ML = 4.5, NEIS) which was located beneath Lake Langadha.
This study and an increasing number of other aftershock investigations, have used data from portable seismograph networks to analyze the fine detail of the aftershock process. These studies have shown that the modes of aftershock faulting are very complex and often different from that of the main shock. For example, Langer and Bollinger (1979) used local network data to determine a pattern of secondary, normal faulting associated with the 1976 strike-slip main shock (Ms = 7.5) in Guatemala. For the Basin and Range province of the western United States, Arabasz et al. (1979) show a mixture of normal, strike-slip, and oblique faulting subsequent to the 1975 magnitude 6.0 (ML) normal fault earthquake on the Idaho-Utah border. Also, teleseismic data (surface and body waves) have been used by Butler et al. (1979) to infer the triggering of thrust and normal faults by the strike- slip main shock of 1976 (Ms = 7.7) near Tangshan, China.

345
I 6
Fig. 2. Comparison of maximum shear-stress trajectories. A. Northern Aegean trajectories (dashed lines) as deduced by Mercier et al. (1979) from a study of surface faulting (heavy lines) and focal mechanism data in the Balkans and Asia Minor. Alpha ((II) trajec- tories are for right-lateral strike-slip motions and beta (0) trajectories are for left-lateral movements. B. Theoretical trajectories at the terminus of a strikeslip fault (heavy line) formed under a uniaxial compression as calculated by Chinnery (1966a).
REGIONAL SETTING
The Volvi-Langadha Lakes area is within the diffuse northern boundary of the Aegean plate. The Aegean plate is generally thought (McKenzie, 1978; Dewey and Sengor; 1979) to be moving southwest in relation to the sur- rounding plates and is overthrusting the African plate at the Hellenic (also known as Cretan or Aegean) arc (Fig. 1). The Hellenic arc forms the south- em and western boundaries of the Aegean plate from southern Turkey

346
through the Mediterranean Sea to the western coast of Yugoslavia. The northern boundary of the Aegean plate is more complicated. On the
east, it is clearly defined by the Anatolian fault which runs through northern Turkey to the west coast of Turkey. However, west of the Anatolian fault, and under the Aegean Sea, there are no clearly defined seismic zones (Mer- tier et al., 1979) to mark the westward extension of the north Aegean plate boundary.
Most published earthquake focal mechanisms (Papazachos, 1976; McKen- zie, 1972; Ritsema, 1974) in the northern Aegean and in northern Greece can be interpreted as either left-lateral strike-slip faults trending northwest or NW-trending normal faulting (as was the 1978 Volvi-Langadha main shock). A map (Fig. 2A) published by Mercier et al. (1979) shows a pattern of right-lateral (a) and left-lateral (0) strike-slip faulting in the northern Aegean region as deduced from surface faulting and from focal mechanism principal stress (P and T) trajectories. The known seismogenic faults in the region and their senses of motion are also shown in Fig. 2A.
The Mercier et al. (1979a) pattern of strike-slip faulting trajectories resem- bles those derived theoretically for the terminus of a strike-slip fault by Chinnery (1966a; Fig. 2B). This similarity raises the possibility that the seis- mic activity in the study area, as well as in much of the northern Aegean region, may be a reflection of regional splay faulting at the western terminus of the Anatolian fault. Thus, the fault system in the Aegean plate may be explainable as the primary (Anatolian fault) and secondary structures within the fault system. Chinnery (1966b) has made this type of interpretation for the Alpine fault system (New Zealand), the San Andreas fault system (Cali- fornia), and the MacDonald fault system (Northwest Territories, Canada).
The Thessaloniki earthquake of 1978 occurred near the contact of two regional tectonic features, the Axios-Vardar zone (deformed Mesozoic metasediments) on the south and the Servomacedonian (Rhodope) massif (pre-Mesozoic crystalline rocks and schists) on the north (Fig. 3). The con- tact strikes to the northwest south of Lake Langadha and Lake Volvi. The valley (Mygdonia basin) in which the lakes are situated is an alluvium-filled graben (Mercier et al., 1980) which strikes E-W to the east of Lake Lan- gadha. To the west of Lake Langadha, the strike of the graben changes to northwest paralleling the Axios-Vardar zone-Servomacedonian massif con- tact. The details of the local and regional geologic setting as well as a discus- sion of the primary (surface rupturing) and secondary (liquefaction and landslides) surfical effects that accompanied the 1978 shock have been presented by Papazachos et al. (1979), Mercier et al. (1979), and Yerkes and Bufe (1981).
The main shock of June 20, 1978 (mb = 6.4) occurred in north-central Greece near Lakes Volvi and Langadha, about 25 km from Thessaloniki. The area has historically had moderate seismic activity. Most of the historical seismic energy release has occurred in two discrete time periods (1902-1906 and 1931-1932) during this century (Papazachos et al., 1976). Between 1902 and 1906 an earthquake sequence occurred which included three large earthquakes. The Volvi-Langadha Lakes area experienced the earliest, a magnitude 6.6 earthquake, in 1902. Next, a series’of earthquakes occurred
40.6'
: h
&TB
\ :
‘. :,
:.,..,
z
\ SE
RVO
MAC
EDO
NIAN
M
ASSI
F
/ (I.
.. 5
10 k
m
10.8
”
m.6
’
LJ.“
~
LO.
I LJ
.L
‘.J.J
‘G
7.W
Fig.
3.
JED
re
loca
ted
epic
ente
rs
(sol
id
dots
wit
h nu
mer
ic
mon
th
and
day
of o
ccur
renc
e)
for
the
four
lar
ger
fore
shoc
ks,
the
mai
n sh
ock
(6/2
0/78
) an
d th
e JE
D
calib
rati
on
even
t (a
fter
shoc
k ep
icen
ter,
71
4178
). N
inet
y-pe
rcen
t co
nfid
ence
el
lipse
s sh
own
for
each
rel
ocat
ed
epic
ente
r.
Foca
l m
echa
nism
s fr
om
Papa
zach
os
et a
l. (1
979)
, (p
redo
min
antly
st
rike
-slip
fr
om
shor
t-pe
riod
da
ta)
and
Papa
zach
os
et a
l. (1
980)
, (p
redo
min
antly
di
p-sl
ip
from
lo
ng-p
erio
d da
ta).
Hea
vy s
olid
an
d da
shed
lin
es
for
surf
ace
rupt
ures
(P
apaz
acho
s et
al
,, 19
79).
Lett
er
desi
gnat
ions
fo
r va
riou
s po
rtio
ns
of
thes
e ru
ptur
es
deno
te
segm
ents
di
scus
sed
in t
he t
ext.
Ope
n tr
iang
les
wit
h th
ree-
lett
er
code
ar
e po
rtab
le
netw
ork
stat
ion
loca
litie
s (d
escr
ibed
in
Tab
le
I).

348
about 100 km to the north in Bulgaria, which included a main shock with M = 7.6. Finally, in 1905, a magnitude 7.4 earthquake occurred 100 km to the southeast of the Volvi-Langadha Lakes in the Athos peninsula area. The second period of activity started in 1931 with a magnitude of 6.6 earthquake in southern Yugoslavia and continued in 1931-1932 when a magnitude 6.9 main shock 60 km southeast of Volvi-Langadha was followed by after- shocks in the Volvi-Langadha area.
CHARACTERISTICS OF THE FORESHOCK-MAIN-SHOCK SEQUENCE
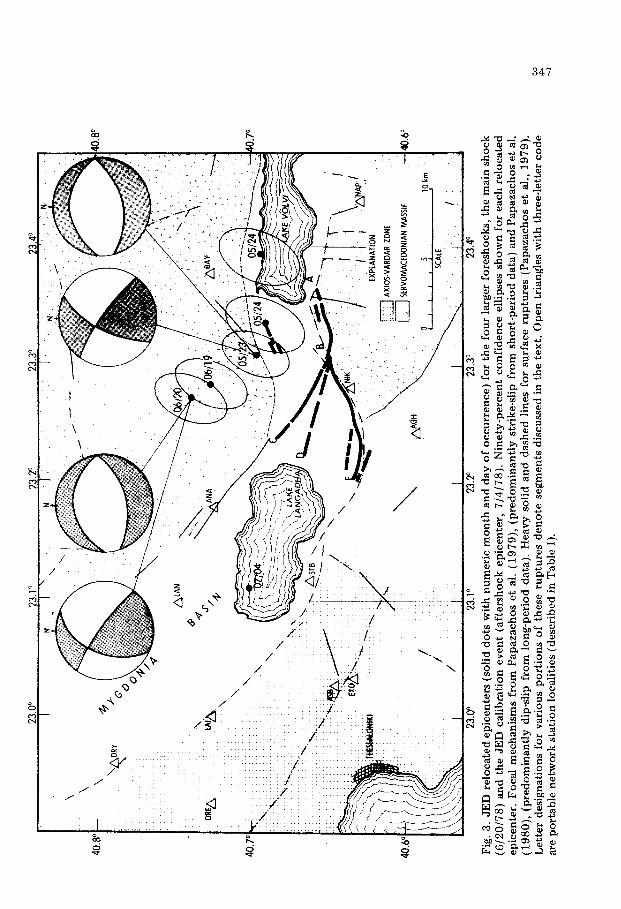
Papazachos et al. (1979, 1980) have published two papers (hereafter refer- red to as Papers 1 and 2, respectively) dealing with the surface rupturing and focal mechanisms of the foreshock-main-shock sequence. Figure 3 presents their focal mechanism results along with the relocated JED epicenters devel- oped in this study (to be discussed in a later section).
In Paper 1, focal mechanism solutions were presented for the largest fore- shock (23 May 1978, M = 5.8) and the main shock showing, both earth- quakes as caused predominately by strike-slip (sinistral) faults trending NW- SE. Paper 2 gave focal mechanism solutions for the same events that depicted E-W striking normal faults. In Paper 2, the authors noted that the strike-slip solutions were from short-period data while the normal fault solutions were from long-period data. For the main-shock short-period solution, the authors used their macroseismic epicenter (40.7°N-23.30E) and a focal depth of 16 km. For the main-shock long-period solution, they used the JED location of the present paper (40.75”N-27.27”E) and the focal depth (12 km) pub- lished by the Centre Seismologique Europeo-Mediterraneen (CSEM).
Paper 2 presented evidence that both shocks were double-events and used this doublet nature to explain both the dual mechanisms and the surface rupture pattern. A NW-trending rupture (SC in Fig. 3) moved first in each case (23 May and 20 June) giving the NW-trending strike-slip mechanism. This was followed by normal faulting on the E-trending rupture (AB) which yielded the normal fault solutions. Acting in concert, these motions then activated the rupture (BE) that trends northeast. The BD ruptures were not discussed in Paper 2.
Thus, the authors (Paper 2) argued that a block of the Servomacedonian massif, near its contact with the Axios-Vadar zone, failed in an arcuate manner as the northern block moved to the northwest (direction of slip vectors in the long-period mechanism). On a curved zone of failure, part of the motion was predominately normal (AB) and part was predominately strike slip (BC) in accord with the motions observed on the surface ruptures. Furthermore, normal faults along the southern boundary of the valley graben were reactivated by the northwesterly block movement and them- selves broke the surface, This reactivation is called upon to explain the west- ern migration of energy release during the early portions of the aftershock sequence (23 May).
Some of the above interpretations are admittedly speculative. However, the major factors that emerge in the foreshock-main-shock sequence are:
(1) The dominant mode of faulting was normal. It occurred in the crystal-

. .:
:.
.*. :
-0
..:
1: .._
+/
.,
,;,
Q
. l -
’ .‘;
y_
., a,
.:
:‘_
: ‘;
_“,L
\*,‘,
._‘,‘
.
&AN
I
r <
-I!
10.8
”
lo.7
0 4
1 3
.fit
/
\ =-
--
..
-r
I I
I a
23.1
’ 23
.20
23.3
’ F
ig.
4.
Epi
cen
ters
(s
olid
do
ts)
for
the
afte
rsh
ock
s fo
llow
ing
the
Jun
e 20
, 19
78,
eart
hqu
ake
in n
orth
ern
G
reec
e.
Su
rfac
e ru
ptu
rin
g (h
eavy
li
nes
) as
map
ped
by
Pap
azac
hos
et
al.
(197
9).
Por
tabl
e n
etw
ork
st
atio
n
loca
liti
es
indi
cate
d by
ope
n
tria
ngl
es w
ith
th
ree-
lett
er
stat
ion
co
de
(des
crib
ed
in T
able
I)
. H
ach
ure
d li
nes
are
nor
mal
fa
ult
bo
un
dari
es
of
vall
ey
grab
en.
Ser
vom
aced
onia
n
Mas
sif
(pre
-Mes
o-
zoic
cr
ysta
llin
e ro
cks
and
sch
ists
) an
d A
xios
-Vad
ar
Zon
e (d
efor
med
M
esoz
oic
met
ased
imen
ts)
show
n
by
diff
eren
t ba
ckgr
oun
d pa
t-
tern
s.

350
TABLE I
Station parameter
Name Sym- Location Eleva- Magnifi- Period of
bol tion cation operation
(ON) (‘E) (m) (@lo Hz
x 103)
Nea Apollonia NAP 40.629 23.439 112 172 7/03/78-7/23/78 Vaiokhorian BAY 40.723 23.377 220 172 7/04/78-7/23/78 Nikomidhinon NIK 40.635 23.280 153 86 7Jo3~7~-7123t7g
Analipsis ANA 40.724 23.178 140 172 7~0317g-7i2317~ Ayios Vasilios STB 40.661 23.116 120 86 7~03~7g-~t23J7a Exokhi EXO 40.632 23.033 510 172 7lO5l7g-7i2317a
Asvestokhorion ASB 40.646 23.027 435 172 7/03/78-7106178 Angelokhorion AGH 40.592 23.242 180 86 7/04/78-7/23/78 Oraiokastron ORE 40.725 22.924 280 86 7/03/7a-7123178
Lavina LA1 40.725 23.000 160 172 7/03/78-7123178 Dhrimos DRY 40.789 22.958 220 172 7/03/78-7/18/78 Langadhas LAN 40.747 23.097 120 86 7/20/78-7/23/78
line and metamo~hic rocks of the Se~omacedonian massif on E-W striking planes and the movement was down on the north.
(2) The attendant surface ruptures occurred several kilometers to the south in the sedimentary deposits (Neogene-Quaternary) of the Mygdonia basin.
(3) It is probable that some, but not all, of the surface ruptures are part of the causal fault.
(4) The evidence that the two largest shocks were double-events demon- strates a rather high level of complexity in the focal processes of the region.
FIELD PROCEDURE AND DATA REDUCTION
A ten-station network of portable seismo~aphs, with an average station spacing of 11 km and extending approximately 40 km east-west and 13 km north-south, was installed in the epicentral region (Fig. 4). Eight of the sta- tions were emplaced on July 3, 1978, and the remaining two installed the following day. This network operated with few changes (Table I) until July 23,1978, for a total period of 20 days.
All of the seismographs used short-period (To = 1 Hz) vertical seismometers and smoked paper drum recorders. Recording speed was 60 mm/mm with tick marks every second. The temperature-compensated crystal clock was synchronized every two days to a standard radio time source. Its drift was determined by a precision time comparator and no individual clock drifted more than 0.04 see per 48 hr. The drift was assumed linear and corrected for in the determination of the phase arrival times. Two seismographs were moved during the recording period. Station AS3 was moved on July 5,1978, to EXO, due to extreme cultural noise and because of tampering with the

351
instrument, DRY was moved on July 20 to LAN. System magnifications ranged from 86,000 to 172,000 at 10 Hz as indicated on Table I which lists the individual station coordinates and operational parameters.
P- and S-wave arrival times were read for 116 aftershocks that were well recorded throughout the local network of stations. Reading accuracy for these arrivals was typically better than 0.1 sec. Hypocenters were determined using HYPOELLIPSE (Lahr, 1979). Magnitudes (ML,,) were determined using the coda duration-magnitude relationship of Lee et al. (1972) for earthquakes on the San Andreas fault in central California.
The velocity model assumed for the aftershock locations had a linear velocity increase with depth. This model is specified by three parameters: the velocity at the surface (I’,), the velocity gradient (K), and the VP/V, ratio. These parameters were determined, by VELINV, an unpublished com- puter program (W. Gawthrop, personal communication, 1979) that uses damped least squares to simultaneously invert for both the above-mentioned velocity model parameters and the hypocenter locations. The arrival times for twelve selected aftershocks were used as input to VELINV to estimate the velocity structure. Station corrections were applied to help remove effects of near-surface lateral and vertical inhomogeneities and thereby to maximize location precision. These delays (+O.lO set to -0.10 set) were derived for each station by averaging residuals of the twelve selected after- shocks for each station from the VELINV run. A second iteration, determin- ing the velocity model while using these delays, gave the final velocity model (V = V,, + KZ) where V, = 5.712 km/set, K = 0.035 set-‘, and 2 is the depth in km.
Composite focal-mechanism solutions (CFMS) were determined using short period p-wave data plotted on a lower hemisphere equal-area projec- tion. Nodal planes were chosen by the method of Dillinger et al. (1972).
CHARACTERISTICS OF THE AFTERSHOCK SEQUENCE
The epicenters for the 116 aftershocks that were located by the portable network data extend some 30 km in an E-W direction and 18 km in a N-S direction in the vicinity of Lakes Langadha and Volvi (Fig. 4). About two- thirds of these locations are within the network. One-fourth of the after- shocks locate beneath the lakes themselves and the remaining three-fourths are to the north in the Servomacedonian massif. That distribution places the aftershock activity several kilometers away from the surface rupturing even though there were five stations within 10 km of the ruptures.
Regardless of their spatial relationship to the surface rupturing, the overall pattern of aftershock epicenters is diffuse. However, localized lineations or clusterings can be interpreted on the basis of vertical sections and epicenter locations to be associated with secondary faulting induced by the main shock’s fault movement. There is a large element of subjectivity in the defini- tion of epicenter lineations in this case. We restricted the search to well- located aftershocks (standard errors in the horizontal plane <5 km), and sought associations that exhibited some degree of both horizontal and verti- cal linearity and/or were in juxtaposition with tectonic elements in the
23.1” 23.2’ .4O
23.1’ 23.2’ 23.3’ 23.4”
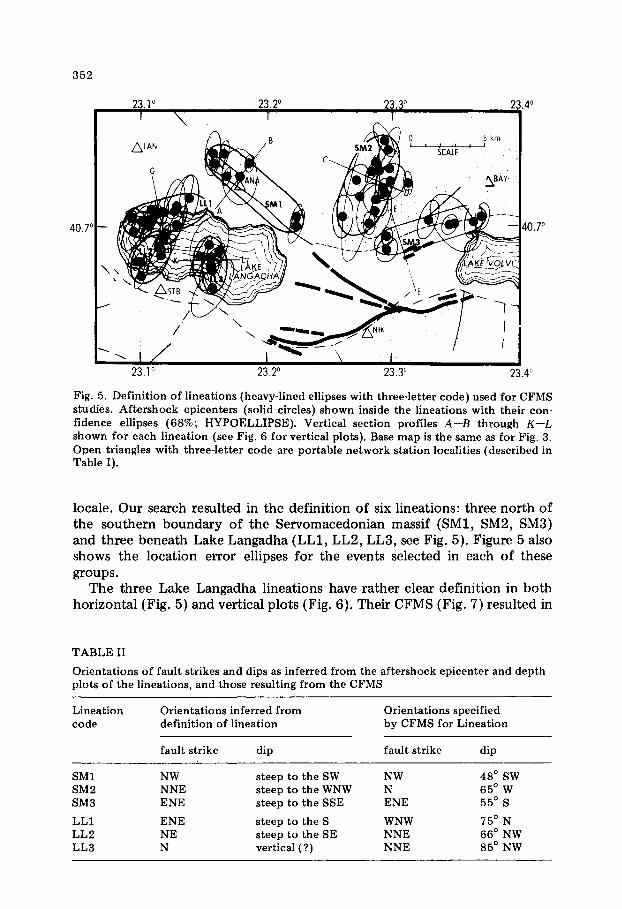
Fig. 5. Definition of lineations (heavy-lined ellipses with three-letter code) used for CFMS studies. Aftershock epicenters (solid circles) shown inside the lineations with their con- fidence ellipses (68%; HYPOELLIPSE). Vertical section profiles A-B through K--L shown for each lineation (see Fig. 6 for vertical plots). Base map is the same as for Fig. 3. Open triangles with three-letter code are portable network station localities (described in Table I).
locale. Our search resulted in the definition of six lineations: three north of the southern boundary of the Servomacedonian massif (SMl, SM2, SM3) and three beneath Lake Langadha (LLl, LL2, LL3, see Fig. 5). Figure 5 also shows the location error ellipses for the events selected in each of these groups.
The three Lake Langadha lineations have rather clear definition in both horizontal (Fig. 5) and vertical plots (Fig. 6). Their CFMS (Fig. 7) resulted in
TABLE II
Orientations of fault strikes and dips as inferred from the aftershock epicenter and depth plots of the lineations, and those resulting from the CFMS
Lineation code
SMl SM2 SM3
LLl LL2 LL3
Orientations inferred from definition of lineation
fault strike dip
NW steep to the SW NNE steep to the WNW ENE steep to the SSE
ENE steep to the S NE steep to the SE N vertical (?)
Orientations specified by CFMS for Lineation
fault strike dip
NW 48’ SW N 65’ W ENE 55O s
WNW 75’ N NNE 66’ NW NNE 85’ NW
353
SMI SM2 SM3
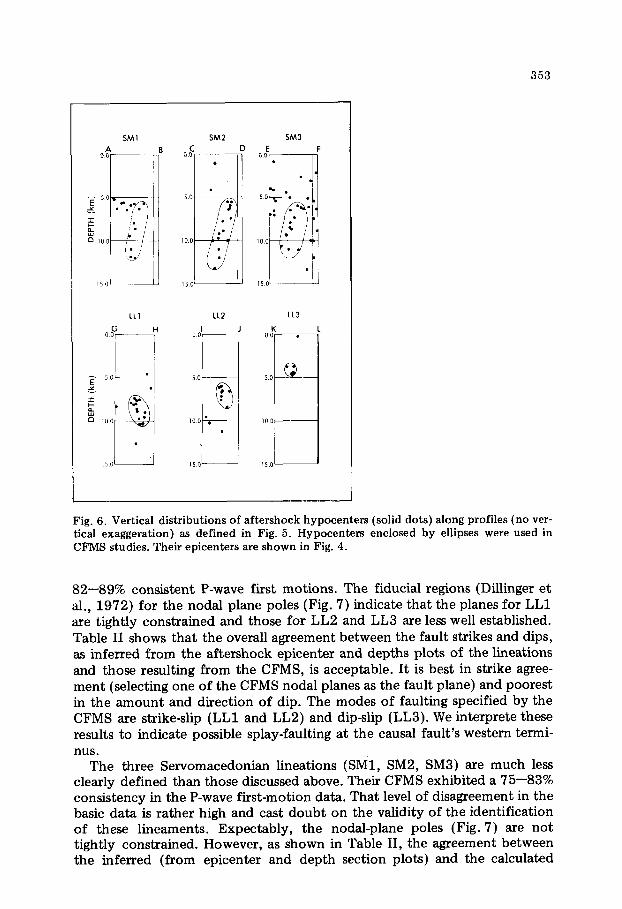
Fig. 6. Vertical distributions of aftershock hypocenters (solid dots) along profiles (no ver- tical exaggeration) as defined in Fig. 5. Hypocenters enclosed by ellipses were used in CFMS studies. Their epicenters are shown in Fig. 4.
82-89s consistent P-wave first motions. The fiducial regions (Dillinger et al, 1972) for the nodal plane poles (Fig. 7) indicate that the planes for LLl are tightly constrained and those for LL2 and LL3 are less well established. Table II shows that the overall agreement between the fault strikes and dips, as inferred from the aftershock epicenter and depths plots of the lineations and those resulting from the CFMS, is acceptable. It is best in strike agree- ment (selecting one of the CFMS nodal planes as the fault plane) and poorest in the amount and direction of dip. The modes of faulting specified by the CFMS are strike-slip (LLl and LL2) and dip-slip (LL3). We interprete these results to indicate possible splay-faulting at the causal fault’s western termi- nus.
The three Servomacedonian lineations (SMl, SM2, SM3) are much less clearly defined than those discussed above. Their CFMS exhibited a 7543% consistency in the P-wave first-motion data. That level of disagreement in the basic data is rather high and cast doubt on the validity of the identification of these lineaments. Expectably, the nodal-plane poles (Fig. 7) are not tightly constrained. However, as shown in Table II, the agreement between the inferred (from epicenter and depth section plots) and the calculated

354
-3
5 ‘2 F I- 5
. . . . . . ..,................. .‘.‘.~.~.~.‘.‘.~.~.‘.‘.‘.‘.~.‘.‘.’.’.’. . . . . . . . . . . . . . . ..I..

355
(from CFMS) fault strikes and dips is within reasonable limits. Normal fault- ing is indicated by the CFMS for SMl and SM3. The individual events for these composites are located along the northern boundary of the graben that contains Lakes Langadha and Volvi. On the southern boundary of the graben, Papazachos et al. (1979) and Yerkes and Bufe (1979) report a lo-km long zone of normal fault surface ruptures. Thus, local reactivation of the bound- ary faults is probable in this instance. The CFMS for SM2 gives a predomi- nately left-lateral strike-slip mode of faulting for the north-south plane (chosen because of the orientation of the epicenters used for the solution). The fiducial regions (Fig. 7) for the north-south plane show that it is poorly constrained. Given the level of uncertainty, it seems unlikely that we have a valid composite in this case even though the inferred and calculated fault strikes and dips are not too disparate.
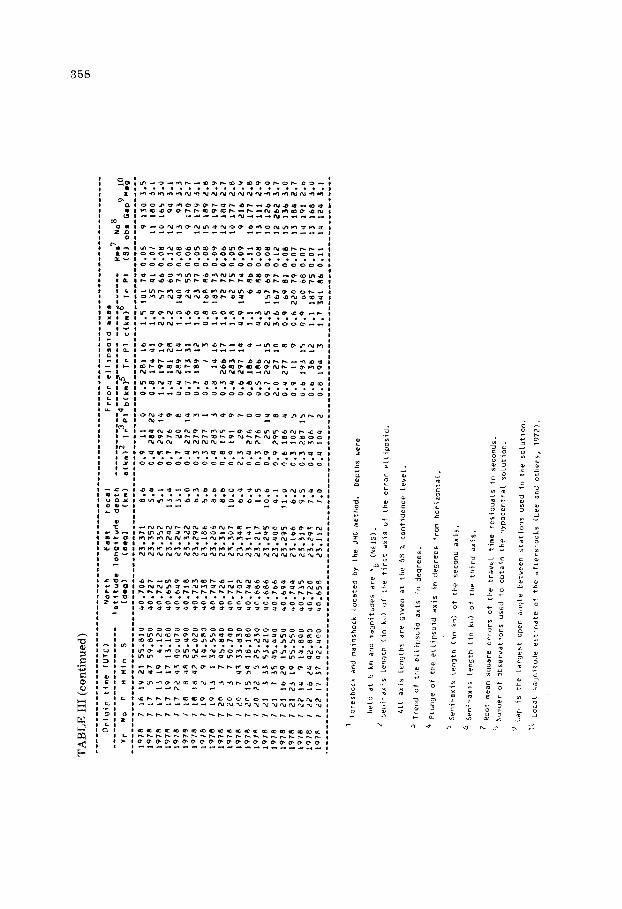
RELATIVE LOCATION OF THE FORESHOCKS, MAIN SHOCK, SURFACE RUPTURING AND AFTERSHOCKS (Table III)
The occurrence of a strong foreshock sequence (four of ma~itude 4.8 or larger), surface rupturing and an aftershock series, makes this a complete earthquake sequence. For the larger foreshocks and the main shock, we have three different locations derived from three different data types or anal- ysis techniques. NEIS used teleseismic data, B.C. Papazachos (personal com- munication, 1978) gave locations based upon his field macroseismic data and we have applied the joint epicenter determination (JED) relocation tech- nique. Our epicenters were computed using the joint hypocenter determina- tion program of Dewey (1971) with depths restrained to 8 km. The calibra- tion event chosen for that latter procedure was the m~nitude 4.5 aftershock of 4 July 1978 as located by the portable network of this study. Also, regional distance arrival-time data from the northeast quadrant, not available at the time of the NEIS location, were incorporated into the JED calcula- tions. The reason for the relocation was to resolve the 13 km separation between the macroseismic and teleseismic locations.
An independent constraint is the S-accelerograph trigger (S-AT) times ob- tained from Thessaloniki accelerograms (Maley et al., 1978) for the main shock, 20 July 1978, and the 4 July 1978 aftershock. These times, rather than the conventional (S-P) times, can be used to put bounds on the epieentral locations of the causal events. R.P. Maley (personal communication, 1979) read (S-AT) times of 3.25 set (main shock) and 2.25 see (aftershock). The start-un times for the aceelerograph is taken to be no more than 0.3 sec.
Fig. 7. Six CFMS solutions, lower hemisphere equal-area projections, obtained for after- shock lineations (see Figs. 5 and 6 for definition of lineations). Nodal-plane fiducial regions shown by light-line contours about the nodal-plane poles. The inner contours define the region within which the nodal-plane poles can move assuming one additional inconsistent data point. The outer contour assume three additional inconsistent data points (Dillinger et al., 1972). Percent consistent value refers to the agreement of first- motion P-wave data with the indicated solution. Strike and dip of nodal planes indicated by Q and 6, respectively. The preferred fault-planes are indicated as “A” planes. Compres- sional first motions are indicated by soiid circles and dilatations as open circles.

O’S
El1
01 IT
O’0
LL O
f o-1
El
so2 9-o
I 562
2.0 2'5
ULI'L2 hO
L’Ob
OU
S’D
I LE
91 d
L YLbI
6'2 hI1
6 LO
’0 09
LF2 I’2
0 9.2
b-t 5
911 b-0
h'R Y
ZI’E
Z
1OL’U
h 0fC
6hh bb
?I Q
1 9161
9-r LZI
01 hI’U
Lb
bloz w
-1 Zb
bI I'F
L III
6'0 2'11
SOI'f2 LQ
Y’un 019’60
“0 21
U L
9LbI 8'7
f91 h
51’0 hQ
b6I
2-h 5
QSf 6’1
2 *a
2'1 6-L
UL I’f2
OfL’O
h 027'81
9f 7
d 1
QLbt
O’f
LfI *I
60’0 19 fhi
n-1 L
982 z-0
s L
I L’O
h’s
YZ
Z’C
? IO
L’Uh
n2b’Lb Ib
fZ
L
L LllbI
t-r &?I
ZI R
O’U
5”: L71
n-1 II
962 5-o
z 92
L’O
b-L SC
f’f2 IO
L’Oh
09t’Qf
01 61
L L
#Lb
1
b'f 5LI
ZI 0-r
hit 21
LO’0
bZ 1'1
fl! fU
1 8.0
01 fez
1’0 2.6
f82’L?
SfL’Oh
OLB’O
Z ‘
91 L
1 UL61
60’0 ?L
95 8'1
El
061 2’1
21 282
9’0 Ir.8
b9L’fZ
fO
L’O
h O
fl’IS
2 LIL
1 Yf61
6’2 O
LI
II O
’S
Oil
zt 11'0
99 581
L-2 02
52 2-t
1 (62
L-0 b-b
I LZ’f2 02L’O
b O
UO’SL
IS 51
L L
BLbt .?f'O
OS bO2
f'D 65
82 S’F
2 902
1’2 6’01
U2Z
’fZ
LnL’Oh
OIL’9f
17 SI
L L
@Lb1
F’S
QSI
El fI'0
59 021
h-2 f2
IlQP
L.0 6
et O
’I b-6
962-f? 91L’r)h
Obh’B
b Lt
9 L
L bLbt
I'f 1LI
f1 11'0
COf 2-z
f 96
5'0 2
991 5'1
5'8 LSI’E?
bhL’Oh
Of6.61
5f ?
L L
QLbI
9'2 1st
21 11-u
z," IS
2'2 bt
002 b-1
8 262
9-o f’L
B2f'f.z bOL’Ob
OU
L’If
9x f2
9 L
QLbI
Z'f 991
R 90’0
fL 2b
2'2 91
ho? 2-t
S Sb2
9'0 f-9
ZbI'f2 bZL*O
h 090*hf
6 f2
9 L
916.1 6'2
fb1 "I
LO.0
51 66
1’2 b1
OOf s-0
5 602
L-0 2’9
Ubf'S2 fIL’O
h O
Pf*hl L2
I.2 9 L
ULbI
9'2 bZ1
FI OZ.0
IQ 001
1'0 6
002 7-t
0 01
5'1 O'S
Zbi'f? IO
L*Oh
nEb’f4 II?
IZ 9
I Q
Lbt Z'f
sot II
hI'0 29
LO2
2-r L
61 5'1
t 601
9'0 S'b
S51'f7 bL9’O
n nLh’t5
6” 61
9 L
YLbt 6’2
SII II
II'0 1L
Lb2 Q-2
b SZ
b.1 Q
911 9'0
5’6 D
bO’f2
Lb9’0h n9t'tt
fh (II
9 1
0161 a-2
SD1 II
80'0 ZL
Y? s-1
91 I81
9'0 L
EL2 h-0
b-5 IRE-f2
EOL’O
h 05.5’95
f2 9I
9 L
b’LbI L-2
SE1 b
SO'0 It)
ZOI z-1
b ?a.?
n-0 0
21 5'0
b-9 Y
9f’fZ
Ia9’0h 099’22
bi El
9 I
ULt.1
6’2 OLI
(r 60'0
bb 9OL
0-z SC
ISf 1-t
eI b
6 8.0
5’21 UfI~IZ
21L’Oh
nso*ss L?
h 9
L @
Lb1 b-2
QSI
6 71’0
OL
fb1 f'h
CI 01
b'l 1
101 9'0
S'b 9SI'fZ
IQ9’0h
OI2’L.z
22 Q
9
L blLbt
f’f c-91
f1 SO
’0 69
h61 Q'I
02 61
5'0 2
682 2’0
h-6 u91'fZ
OfL’O
h 069’1
i22 9
L Q
LbI 6'i!
191 01
SO
’0 99
002 0'9
z QZ
9-o 0
962 z-0
2'0 ZPI'SZ
S89’Oil
000’5 O
f F2
5 L
QLbt
6.7 OS1
b1 s1.0
bb LB
1 0’2
bk fZ
9.1 Q
S82 L-0
Z'FI O9.?'f2
90L’Ob
080’62 5
02 5
L !3L61
f-f 5st
nr 80*0
OL
IL 2-i
91 597
9-o 01
261 0'1
OLi’fZ
LBY’Ob
OLI'f bS
61 S
1 9161
0-f Ibt
II 50’0
19 122
E’I
02 fl
9'0 01
901 z-0
:-: - III'EZ
LOL’O
h OQE'65
91 91
5 L
9161 9-z
fbI 01
11'0 09
011 0-b
6 L62
9.0 1
LO2
2’1 b-9
LIf'f2 2hL’O
h O
SF’bZ u2
h1 5 L
@Lb1 0-r
ffl II
90'0 89
LO2
L’2 12
f1 0'1
s so1
f-0 I.9
LII'E? fb9’0h
OZO'OD 6
71s f
Qlbt
L’2 !a.?1 ?I
ZJ'O 19
212 f’f
Q? f.?
0-t b
511 s-0
b-8 911'S7
fQ9’0lT
Ofb'i!I
6 71
5 L
9161 Z'f
991 6
9G'O O
L b
IZ
9’2 81
6 0-t
B I01
0-u O
’R LI
I’S2
60L’Ob
0~2.0 LT
e 5
L ULbI
2-f IQ1
L S
O’0
19 O
IZ
0’0 z2
oz L’O
b
III
2'0 S'S
ZLI'LZ 02L-O
h OS2'95
db 1
5 L
ULbt 1'5
621 8
11’0 O
S to
2 Z
’f O
f I
9-s 01
b6 0-E
Z'LI 190'52
bW9’0h
OfL’Pf
us I
, 1
OLbt
0-r ZDI
01 SO
.0 r”:
002 b-0
th 21 z-0
h 9?1
z-0 t-a
80t*f7 OIL-Oh
OL2'FZ th
@O S
L YLbt
9-F
UfI
01 90'0
CO2
D’Z
97 b.2
R'O z
SII b-0
L-6 9OI'f2
OO
L’Oh
OL9.92
5 00
5 L
ULbI
0-S W
C1
21 81'0
OU
2tz Z
’S
6 e
z-2 Q
bb L-0
9’8 9ZI’iZ
60L’0” O
ZO’SS
L2 22
D L
QLbt S’b
SC1
It LO
’0 Q
S 9o
z 2-z
If 51
0.1 S
901 f-0
2'01 901'12
001 ‘O
h OZh'Q2
LZ
Z
Z
b 1
QLbt
L'f L91
01 fO
’0 01
et2 1’1
LI 6
s-0 6
201 z-0
6'01 Q51'CZ
QfL’O
h OIf'LZ
61 2.z h
L U
Lbt 8’7
ooz L
90.0 ::
961 D.9
9f bf
f'f 6
Lb2 b-0
t-11 bOL'fZ
9OL’O
b 021’92
02 It
” L
QLbt
a’2 991
II R
I.0 06
n-2 92
ZUZ 0'1
f 161
b-f L-a
Ibf'f.? Y29’0h
Ofh’ZE
52 1
h L
QLbt 0-f
bbt L
10’0 Qb
261 L-9
In tPt
L'I I
fQ.? 6’0
6'11 bLZ'f2
QtL*O
h O
Lb’L 521
h L
QLbt
b’f Q
LI 9
f1'0 Bb
bQ1 L’LI
b’i 12
S’L ?I
LO2 b'Z
9'bI V92'fZ
b99’0h Ob9.LI
zt "Z
s L
QLbt
0-b 591
9 ?I'0
bS
SQI O’LI
SE 91
0-L 9
18Z 9'1
2’6 fQ
L*f2 O
bP’Oh
ObZ'SI II
n2 f
L Q
Lbt 0.b
212 9
01'0 au
SQI Q
’ZL s
9.2 Z'b
2 9t.Z
S-1 0'1
18Z'CZ IhL’O
h O
bh’bb b
02 5
L Q
fbt I’S
691
L LO
’0 f9
so2 Z’S
9z 51
9-t b
LOI 9'0
f-1 92t*sz
ZIL’Oh
OD9'Qb ft
91 5
L 9161
b.9 fS
’0 fit
Z'F 52
D’S
O-8
992'22 6fL’O
k OYt'fZ
SO 02
02 9
2'S OP.0
bll 2.f
vz 9'S
0'9 ULZ'fc?
6tL’Oh
9161 O
Sf’90 It
'II 61 9
QL
bt O'S
01'0 ftt
9'2 fZ
2'9 0'8
QP
E’S
Z
169’0h O
DQ’LZ
LS S
U'D 59'0
kll a-c
e7 0'9
0'9 9QE'fZ
td9-0* O
t.0~62 21
7 9'S
05'0 ztt
I'f fZ
C'S O-Q
CO
f‘f? Lb9’0h
--~-~
-------~-~
-~----~
-~-~
-~-~
~~
-i-~~
~~
~~
~~
~~
~~
~~
~~
~~
~~
-~~
~~
~~
~~
~~
~~
~~
~~
~~
~~
~~
~~
~~
~~
~~
~~
~~
~~
~~
~~
~~
~~
~~
~~
~~
~~
_
-n
;-!I l w
(S
) Id
a1 (Y10
(6.P) 6
01 c-p)
U!W M
0 0"
JA $jwl
‘W ____,,z’:“‘:
‘yf,$y
yE
” z”3’m
--..___-_____
q*clep epn3!B"o(
epn)!)o, -_-_-_-_______-___-____
.ers pIO*d)It.
40443 10~93
1-3 V3~QN
(Yin, am!3
U!R!JO ~~~~~~~~~_~~~____~~~~~~~~~~~~~~~~~~~~~~~~~~~~~~~~~~~~~~~~~~~~~~~~~~~~~~~~~~~~~~~~~~~~~~~~~~~~~~~~~~~~~~~~___
III 318V
L

1970
19
78
1978
19
78
1978
19
78
1979
19
78
1978
19
78
1978
19
78
1970
19
78
1978
19
78
1970
19
78
1978
19
70
1978
19
7n
1978
i9
7e
197R
19
7R
1978
19
7.9
1978
19
78
197n
19
78
1970
19
7.4
1975
19
78
1978
19
79
1978
19
70
1978
19
78
1974
19
78
1970
1970
19
78
197a
19
71)
1974
7 S
19
36
34.9
00
7 9
4 I
59.3
50
7 9
s a
2 13
.870
7
9 7
la
30.6
10
7 9
9 30
10
.640
7
9 12
10
59
.860
7 9
lb
12
19.9
90
7 9
22
28
26.5
20
7 10
00
42
6.
580
7 10
2
17
15.0
90
7 10
8
59
42.9
50
7 10
10
5,
R
11.7
00
7 10
12
as
19
.330
7
10
13
JO
59.6
70
7 10
lb
20
54
.390
7
11
0 20
5S
.JO
U
7 11
9
24
3;05
0 7
ii
13
16
30.8
90
7 11
13
39
15
.190
7
II
I6
58
24.60
0 7
11
19
41
37.3
60
7 11
20
17
38
.090
7
11
23
17
3.89
0 7
12
1 18
44
.dR
O
7 12
3
a2
41.5
70
7 12
4
00
58.7
40
7 12
5
5 55
.400
I
12
21
56
33.4
40
7 13
a
29
51.8
90
7 13
0
20
31.7
40
7 13
7
15
31.5
00
7 13
7
36
1.46
0 7
13
8 31
as
.090
7
13
17
26
57.6
10
7 13
17
a3
59
.500
7
13
22
12
17.1
90
7 14
00
34
48
.540
7
14
3 45
24
.930
7
14
4 57
28
.735
7
14
b
19
lu.Z
lU
7 14
b
9 56
.610
7 14
18
la
25
.640
7
14
23
lb
3.53
0 7
la
23
II
23.7
60
7 15
i
42
3.34
0
7 1s
1
50
52.6
90
7 15
4
24
27.2
40
7 15
5
27
32.4
70
7 1s
17
48
19
.770
7
lb
18
57
2.81
0
40.7
7e
23.3
24
40.7
39
23.2
86
40.74
6 23
.296
40
.686
23
.359
40
.688
23.1
14
40.7
29
23.3
51
40.7
13
23.1
48
40.7
22
23.3
37
40.7
21
23.1
67
40.7
03
23.1
00
4fi.6
84
23.3
43
40.67
9 23
.353
40
.689
23.1
54
40.78
4 23
.184
40
.770
23
.301
40
.646
23.3
49
40.6
74
23.3
56
40.7
23
23.1
91
40.6
86
23.3
76
40.76
4 23
.112
40
.717
23
.130
40
.756
23
.106
40
.663
23
.156
40
.654
23.0
92
40.69
4 23
.317
40
.729
23.1
u7
40.64
7 23
.344
40
.705
23.0
93
40.6
76
23.1
55
40.7
14
23.2
60
40.6
75
23.3
53
40.7
35
23.2
97
40.67
9 23
.lU
O
40.6
.92
23.l
u2
40.67
9 23
.098
40
.690
.?3.
408
40.70
6 23
.192
ao
.7se
23
.199
40
.714
23.3
55
40.7
52
d3.7
93
40.60
2 23
.147
40
.679
23.0
07
40.70
6 23
.223
40
.700
23.2
23
40.70
9 23
.285
40
.670
23.1
00
40,69
4 23
.071
40
.727
23
.298
40
.721
23.3
63
40.73
4 23
.2.5
9
7.2
11.0
7.
7 5.
0 7.
1
:::
3.0
5.9
7.5
0.8
3.9
a.5
0.4
8.2
6.6
5.3
5.7
6.5 4.5
7.1)
10.3 3.
7 5.
2 4.4
8.3 4.1
8.5
4.4
Y.l
7.
0 5.
5 6.
5 6.0
6.6
a.9
5.
6 17
.2
2.6 9.6
3.7
7.5
11.9
ii
.8
6.3
6.6
6.6
5.5
13.3
e
.8
0.5
306
4 1.
0 39
28
0.
2 30
1 lb
0.4
3b
lb
0.5
295
1 2.
3 20
5 43
0.
6 lb
5 9
0.4
259
22
0.4
115
3 1.
3 25
6
0.4
300
2 1.
6 30
9
0.6
288
1 1.
6 19
0 9
0.3
293
9 0.
7 20
1 13
0.
3 28
9 0
1.0
199
11
0.5
?99
3 1.
5 LO
6 a2
2.
4 20
2 2
1.4
292
3 1.
7 15
4 7
1.3
da7
lb 1.
2 11
0 a
2.0
20
a 0.
4 29
5 3
1.0
203
36
2.2
291
0 3.
4 20
22
2.
8 2.
3~
17
7.9
21
LO
2.1
201
6 0.
9 29
3 15
0.
3 28
3 0
0.0
13
9 2.
3 27
9
1.7
294
13
0.7
270
0 1.
8 S
35
0.6
275
4 1.
7 7
21
0.9
ii0
3 3.
8 24
14
0.
9 10
9 2
2.3
19
8 0.
5 29
4 I
1.1
204
11
0.9
157
6 0.
6 24
7 8
0.9
290
2 4.
4 22
33
1.
0 29
5 5
1.3
26
11
0.5
20
7 0.
2 Il
l 9
0.3
779
1 0.
4 18
9 16
0.3
115
b U.
8 23
17
1.
3 22
6
0.7
291
0 1.
3 19
5 2
0.6
ZSt,
e
0.3
104
5 0.
6 19
5 15
0.
3 27
6 1
0.1)
18
6 11
0.
3 29
4 0
0.7
24
17
0.7
150
4 1.
1 24
5 a4
0.
3 10
0 2
0.6
9 25
0.
9 30
0 13
1.
7 36
24
1.2
291
8 1.
9 19
9 8
0.5
255
21
1.0
358
32
0.3
115
1 0.
0 24
33
0.
6 20
3 I
1.2
193
18
0.3
284
a 0.
9 19
0 44
1.
2 21
3
0.4
291
4 1.
8 18
1 5
0.9
272
15
0.3
118
b 1.
0 25
22
0.
3 11
3 2
0.0
22
12
1.2
a5
3 0.
9 31
5 13
1.
2 a1
21
0.
5 30
2 22
0.
4 19
5 2
0.1
286
0
3.7
209
61
0.00
0.
9 lb
8 67
0.
03
1.4
27
4b
0.08
1.
7 s4
b5
0.
08
2.1
231
83
0.08
6.
9 19
1)
80
0.08
2.
5 25
80
0.
10
2.5
57
74
0.06
1.3
19
79
0.06
0.
0 33
47
0.
06
25.3
78
86
0.
22
7.1
41
72
0.20
4.
2 24
5 04
O
.lU
0.
8 JO
53
0.
06
6.9
201
67
0.25
18
.0
156
63
0.23
6.
0 89
73
0.
17
1.0
193
01
0.04
3.
9 15
1 73
0.
22
3.5
lee
55
0.13
1.
3 17
9 68
0.
10
2.4
215
75
0.17
a.
3 21
2 el
0.
14
3.8
30
78
0.10
3.
5 30
80
0.
08
2.0
197
56
0.13
5.
1 18
1 77
0.
10
1.1
253
78
0.04
1.
0 13
73
0.
06
1.0
223
71
0.03
3.
8 14
9 79
0.
08
2.3
91
41
0.15
1.
0 35
7 74
0.
07
0.8
12
70
0.05
1.
5 20
4 73
0.
07
3.6
55
45
0.08
2.
4 19
4 ba
0.
06
a.3
184
62
0.12
6.
2 65
70
0.
18
1.6
137
SO
0.04
2.
8 20
6 56
0.0
4
1.9
17
71
0.12
1.
2 19
a5
0.
08
2.0
146
as
0.07
11
237
2.7
10
182
3.7
11
217
2.9
12
112
3.3
10
109
3.2
e 22
5 2.
5 9
126
5.1
11
161
3.2
10
178
2.9
9 12
1 3.
0 e
104
2.8
9 10
5 2.
6
8 83
3.
4 10
21
7 2.
9 9
210
2.7
6 lb
3 2.
7 10
10
7 3.
2 8
160
3.6
11
140
2.9
10
180
3.2
10
131)
3.
6 11
19
0 3.
4 8
129
2.9
9 18
1 2.
9 7
132
2.8
&I
IS6
3.1
7 lb
2 2.
8 12
12
4 3.
3 12
10
1 2.
9 e
194
2.6
7 19
5 2.
6 13
10
0 2.
6 12
97
2.
9 11
10
0 4.
0 12
97
3.
5 7
195
2.6
1 1 1 1
0 14
9 3.
3 1
185
3.9
B
171
2.9
7 23
9 3.
1 7
157
2.7
2 14
9 3.
6 a
144
3.1
1 13
4 3.
2 4.
5 73
74
0.
15
10
151
3.8
1.4
222
b7
0.07
11
16
5 3.
2 1.
2 21
2 77
0.
10
15
152
3.0
4.3
148
76
0.14
11
17
0 3.
8 1.
8 17
1 58
0.
09
13
163
3.3
0.8
91
81
0.02
9
177
3.2
358

359
With these times, the Vp/Vs ratio (1.77) and average path velocity (5.92 km/ set) from VELINV, we determine epicentral distances of 23.7 to 26.1 km for the main shock and 14.9 to 17.5 km for the 4 July aftershock. The ray paths were, of course, slightly longer as we have assumed a focal depth of 8 km for both events. There was inadequate local data to accurately com- plete the focal depth of the main shock and there is some uncertainty in the focal depths for the aftershocks as determined by the local network. The 8 km depth was chosen in the approximate average of all the aftershock focal depths obtained.
Location of fo~eskoeks and main shocks
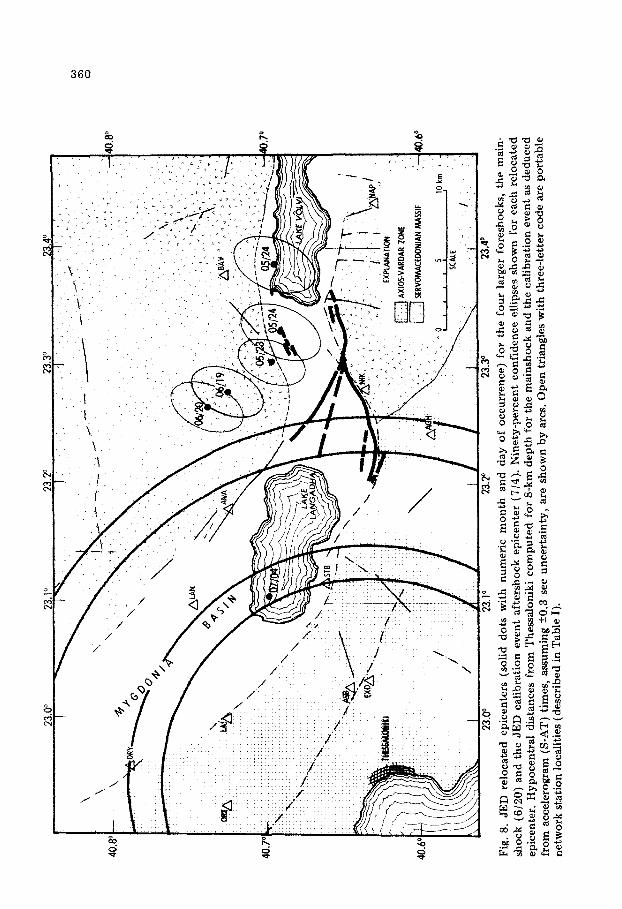
The JED locations for these events are thought to be most accurate to date. That accuracy is derived from the inclusion of new arrival-time data to the north and east of the epicentral area and also because the JED epicenters were computed with respect to a calibration event whose epicenter was well constrained by the data from the local network. The main-shock epicenter is within 3 km of the range allowed by the (S-AT) time. The closest approach of the 90% confidence ellipse is 1 km from the accelerogram range. Given the uncertainties in depth and velocity and the suggestion that the main shock was two events separated by 2: set (Yerkes and Bufe, 1979), this is acceptable. It is also approximately 2 km to the south-southe~t of the loca- tion published by the Centre Seismologique Europeo-M~dite~an~en (CSEM) at Strasbourg (47.5”N 23.26’E, depth = 13 km). Figure 8 shows the JED epicenters and their 90% confidence ellipses. The epicenters average about 5 km from mapped or inferred extensions of the NW-trending surface rup- tures. Note that the arcuate trend of foreshock and main-shock epicenters is subparallel to the arcuate trend of the NW-trending surface rupture.
If the focal depths of the foreshocks and main shock were 8 km (the aver- age aftershock focal depth), then the 5km epicenters-to-ruptures distance implies a fault-plane dip of 58”. On the other hand, if the focal depths were 16 km (NEIS; CSEM gave 15 km), then a dip of 73’ is implied. In either case, (58’ or 73’), the association of the JED epicenters and the surface rup- tures is within known unce~a~ties.
Location of the aftershocks
The aftershock epicenters were determined using only local network data. The eastern portion of those epicenters cluster about the foreshocks-main- shock epicenters and not about the surface ruptures. According to the pre- ceding arguments, this indicates that they were associated with the deeper, rather than the shallower, portions of the seismic fault.
The western portion of the aftershock activity (primarily Lake Langadha area) exhibits the same general level of location precision as does the eastern activity (Fig. 5). The Lake Langadha activity is to the west of the previously discussed surface ruptures and the foresho~k~a~-shock epicenters. It thus defines the western boundary of the earthquake sequence.
80.6
”
Fig.
8.
JED
re
loca
ted
epic
ente
rs
(sol
id
dots
w
ith
num
eric
m
onth
an
d da
y of
oc
curr
ence
) fo
r th
e fo
ur
larg
er
fore
shoc
ks,
the
mai
n-
shoc
k (6
/!&
O) a
nd t
he J
ED
calib
rati
on
even
t af
ters
hock
ep
icen
ter
(7/4
). N
inet
y-pe
rcen
t co
nfid
ence
el
lipse
s sh
own
for
each
re
loca
ted
epic
ente
r.
Hyp
ocen
tral
di
stan
ces
from
Th
essa
loni
ki
com
pute
d fo
r &
km
dept
h fo
r th
e m
ain
shoc
k
and
th
e ca
lib
rati
on
even
t as
ded
uce
d
from
ac
cele
rogr
am
(S-A
T)
tim
es,
assu
min
g +0
.3
see
unce
rtai
nty,
ar
e sh
own
by a
rcs.
Ope
n tr
iang
les
wit
h th
ree-
lett
er
code
are
por
tabl
e ne
twor
k st
atio
n lo
calit
ies
(des
crib
ed
in T
able
I)
.

361
Absence of aftershock activity on the surface ruptures
The preceding discussions present arguments for the correct epicentral locations - away from the surface ruptures - of the entire seismic sequence. Some of the surface rupturing occurs in the Servomacedonian massif, but it was mostly in a alluvial valley (Mygdonia basin). These ruptures did, how- ever, cut across rock structure and topographic features (Yerkes and Bufe, 1979) which lends credence to their being part of the causal fault. The absence of juxtaposed aftershocks may be due to the lateness of the survey and/or the low strength of the Quaternary alluvium in the valley.
DISCUSSION AND CONCLUSIONS
The suggestion is made in this paper that the regional stress pattern in the northern Aegean plate may be explained by a stress pattern related to the Anatolian fault system. Also, evidence is presented that the same type of stress system may have occurred on a much smaller time and distance scale in the Thessaloniki earthquake’s aftershock sequence. The theoretical model invoked for both of these interpretations is that of Chinnery (1966a) for the strike-slip trajectories at the terminus of a strike-slip fault. Chinnery’s theory was developed only for the initiation of secondary faulting. However, he gave examples of secondary fault patterns that extended over hundreds of kilometers in California, New Zealand and Canada. We are, in this instance, influenced by the similarities between Chinnery’s (1966a) and Mercier et al., (1979a) patterns of maximum shear-stress trajectories (Fig. 2). Perhaps the repeated, strike-slip movements on the Anatolian fault system have, over a long period of time, induced a regional, quasi-static stress pattern that is explainable by Chinnery’s (1966a, b) model.
The aftershock data developed in this study support the following conclu- sions:
(1) The epicenters for the four larger foreshocks (M 2 4.8) and the main- shock follow an arcuate trend that is subparallel to and about 5 km north of the mapped surface ruptures (Fig. 8).
(2) Strain release apparently began near the center of the eventual fault plane (23 May 1978 foreshock), progressed eastward several km (two 24 May 1978 foreshocks) and then northwestward some 4 km (19 June 1978 foreshock). Finally, the main-shock’s faulting (2 km to the northwest of the 19 June 1978 event) encompassed the area of the four foreshocks plus an unknown amount in the subsurface.
(3) From 2 to 5 weeks after the main shock, virtually no aftershocks were detected on the mapped surface ruptures. The lateness of the survey and/or the low-strength of the valley alluvium may account for this absence.
(4) The 116 aftershocks located by a ten-station portable network extended over an area of approximately 540 km* (30 km (east-west) X 18 km (northsouth)). They occur both to the north and west of the mapped surface ruptures.
(5) The southern boundary of the Servomacedonian massif is the normal- faulted north boundary of a graben that forms the alluvium-filled Mygdonia

362
valley. CFMS studies of events along that boundary imply reactivation of the boundary’s normal faults. Surface normal fault ruptures (10 km long} were found along the southern boundary of the valley graben (Yerkes and Bufe, 1979). Thus, reactivation of normal faults occurred at both boundaries of the graben but extended to the surface at only one boundary.
(6) CFMS studies of the western or Lake Langadha aftershocks showed strike-slip or vertical faulting. We interpret those results as splay-faulting at the causal fault’s western terminus. If this is indeed true, then secondary faulting occurred on only one side (southwest) of the causal fault.
ACKNOWLEDGMENTS
We gratefully acknowledge the valuable technical and logistical assistance given to us in Greece by Mr. Ronald Henrisey of the U.S. Geological Survey, and by Dr. B.C. Papazachos, Dr. George Leventakis, and Mr. Kiriacos Peftit- selis, all of the Geophysical Institute of the University of Thessaloniki.
In the field we benefited greatly from discussions with Dr. C.G. Bufe and Dr. R.F. Yerkes of the U.S. Geological Survey and Dr. Geoffrey C.P. King, Mr. Chistos Soufleris, and Mr. James Jackson of the Department of Geo- physics, Unive~ity of Cambridge.
Invaluable logistical assistance was also provided by Mr. Carl Sharek, Director of the American Center and his staff in Thessaloniki. We would also like to thank Mr. Dan Zachary, US. Consul General, for his support of our mission in Thessaloniki and, in Athens, Mr. Stavros Caramondanis of the U.S. Embassy helped facilitate our travel within Greece.
We would like to acknowledge the assistance of Mr. Wm. Gawthrop with the JED relocations and crustal model. Mr. W.A. Rinehart, Chief, Environ- mental Hazards Branch, National Oceanic and Atmospheric Administration provided computer time and his services for running the focal mechanism solution program. We thank Mr. C.J. Langer, Dr. J.W. Dewey, Dr. S.T. Har- ding, Mr. D.M. Perkins, Ms. Merridee Jones, and Dr. W~liam Spence for their many helpful discussions, comments, and suggestions.
REFERENCES
Arabasz, W.J., Richins, W.D. and Langer, C.J., 1979. The Idaho-Utah border (Pocatello Valley) e~thquake sequence of March-April, 1975. In: Earthquake Studies in Utah, 1850-1978. University of Utah, Dep. of Geology and Geophysics, pp. 339-373.
Butler, R., Stewart, G.S. and Kanamori, H., 1979. The July 27, 1976, Tangshan, China earthquake -a complex sequence of intraplate events, Bull. Seismol. Sot. Am., 69: 207-220.
Chinnery, M.A., 1966a. Secondary faulting, I. Theoretical aspects. Can. J. Earth Sci., 3: 163-174.
Chinnery, M.A., 1966b. ‘Secondary faulting, II. Geological aspects. Can. J. Earth Sci., 3: 175-190.
Dewey, J.W., 1971. Seismicity Studies with the Method of Joint Hypocenter Determina- tion. Ph.D. Dissertation, Univ. of Callif., Berkeley, Calif., 164 pp.
Dewey, J.F. and Sengor, A.M., 1979. Aegean and surroundingregions: complex multiplate and continuum tectonics in a convergent zone. Geol. Sot. Am. Bull., 90: 84-92.
DilIinger, W.H., Harding, ST. and Pope, A.J., 1972. Determining maximum likelihood

363
body-wave focal plane solutions. Geophys. J., 30: 315-329. Langer, C.J. and Bollinger, G.A., 1979. Secondary faulting near the terminus of a seismo-
genie strikeslip fault: aftershocks of the 1976 Guatemala earthquake. Bull. Seismol. Sot. Am., 69 (2): 427-444.
Lahr, J.C., 1979. HYPOELLIPSE: A computer program for determining local earthquake- hypocentral parameters, magnitude and first-motion pattern. U.S. Geol. Surv., Open- File Rep., 79-431. 233 pp.
Lee, W.H.K., Bennett, R.E. and Meagher, K.L., 1972. A method of estimating magnitude of local earthquakes from signal duration, U.S. Geol. Surv., Open-File Rep., 28 pp.
Maley, R.P., Bufe, C.G. and Yerkes, R.F., 1978. Preliminary report on the Northern Greece earthquake of June 20, 1978. Seismic Engineering Program Report, May- August 1978. U.S. Geol. Surv. Circ., 785-B: 4-7.
McKenzie, D., 1972. Active tectonics of the Mediterranean region. Geophys. J.R. Astron. Sot., 30: 109-185.
McKenzie, D., 1978. Active tectonics in the Alpine-Himalayan belt: the Aegean Sea and surrounding regions. Geophys. J.R. Astron. Sot., 55: 217-254.
Mercier, J.L., Delibassis, N., Gauthier, A., Jarrige, J.-J., Lemeitle, F., Philip, H., Sebrier, M. and Sorel, D., 1980. Neotectonics of the Aegean arc. Rev. Geogr. Phys. Geol. Dyn., Paris (in press).
Mercier, J.L., Monyaris, N., Simeakis, C., Roundoyannis, T. and Angelidhis, C., 1979. Intra-plate deformation: a quantitative study of the faults activated by the 1978 Thes- salonki earthquakes. Nature, 278. 45-48.
Papazachos, B.C., 1976. Seismotectonics of the northern Aegean area. Tectonophysics, 33: 199-209.
Papazachos, B., Mountrakis, D., Psilovikos, A. and Leventakis, G., 1979. Surface fault traces and fault-plane solutions of the May-June 1978 shocks in the Thessalonki area, Greece. Tectopnophysics, 53: 171-183.
Papazachos, B., Bountrakis, D., Psilovikos, A. and Leventakis, G., 1980. Focal pro- perties of the 1978 earthquakes in the Thessaloniki area. Bulgarian Geophys. J. (in press).
Ritsema, A.R., 1974. Fault-plane mechanisms of the Balkan earthquakes. Proc. Seminar on the Seismotectonic Map of the Balkan Region. UNESCO, Skopje, pp. 229-238.
Yerkes, R.F. and Bufe, C.G., 1981. Geologic-seismologic aspects of the May-July 1978 earthquakes, Langadha-Volvi Lakes area, Northern Greece. Bull. Seismol. Sot. Am. (in press).