afujfgf the university of oxford, in collaboration with the centre for the study of labour and...
TRANSCRIPT
afujfgf;+lIfKt uflj; ljj/0f
Bagwana VDC Profile
9 789937 296649
cover Bagwana.indd 1 9/13/2015 12:10:34 PM


afujfgf;+lIfKt uflj; ljj/0f
BAGWANAVDC Profile
df]xDdb co'a Mohammad Ayub ;'bLk uf}td Sudip Gautam 8]le8 Pg= u]Ng/ David N. Gellner lbg]z kf7s Dinesh Pathak alGbtf l;hfktL Bandita Sijapati cdGbf :g]nGh/ Amanda Snellinger k|s[lt yfdL Prakriti Thami

© Centre for the Study of Labour and Mobility and ESRC Alchemists Project, September 2015
ISBN: 978 9937 2 9664 9
Centre for the Study of Labour and MobilitySocial Science Baha345 Ramchandra Marg, Battisputali, Kathmandu – 9, NepalTel: +977-1-4472807, 4480091 • Fax: [email protected] • www.ceslam.org
Printed in Nepal
In addition to support from CESLAM, the Parsa Study 2014 surveys were funded by the UK’s Economic and Social Research Council [Grant Number ES/J011444/1] as part of the project ‘Alchemists of the Revolution? The Politics of Educated Unemployed Youth’ (2012-2016) led by Professor Craig Jeffrey (then of the University of Oxford, now University of Melbourne).
Nepali Translation: Mohan Bista, Sudip Gautam, Himalaya KharelLayout and Design: Chiran Ghimire and Ajay Subedi

ljifo;"rL (Contents)
!= k[i7e"ld (Background) 1@= cWoog ul/Psf] :yfg (Study Site) 2#= hg;f+lVos agf]6 (Demography) 4 #=! 3/w'/L / hg;+Vofsf] agfj6 (Household and Population Composition) 4 #=@ pd]/ ;d"x cg';f/ hg;+Vofsf] ljt/0f (Population and Age Distribution) 6$= ;fdflhs–cfly{s ;+/rgf (Socio-Economic Composition) 7 $=! hfthfltsf] j[xt juL{s/0f (Macro-Ethnic Category) 7 $=@ hfthflt (Caste and Ethnicity) 8 $=# wd{ (Religion) 10 $=$ j}jflxs l:ylt (Marital Status) 10 $=% d'Vo ultljlw (Primary Occupation/Activity Occupation/Activity) 11 $=^ z}lIfs l:ylt (Educational Attainment) 12 $=& z}lIfs l:ylt \-hgu0fgf @)!!_ (Educational Attainment ) [Census 2011] 13 $=* hfthflt / n}+lus cfwf/df lg/If/tfsf] b/ (Illiteracy Rate by 14 Caste and Ethnicity and Gender) $=( hGd :yfg (Place of Birth) 16 $=!) gful/stfsf] cj:yf (Citizenship Status) 17 $=!! 3/kl/jf/sf] ;DklQdf :jfldTj (Ownership of Household Assets) 18%= k|jf;g / /]ld6\ofG; (Migration and Remittances) 19 %=! k|jf;L / u}/ k|jf;L 3/kl/jf/ (Migrant and Non-Migrant Households) 20 %=@ n}+lussf] cfwf/df k|jf;L hg;+Vof (Migrant Population by Gender) 21 %=# k|jf;gsf sf/0f (Reason for Migration) 22 %=$ k|jf;gsf] klxnf] uGtJo (First Migration Destination) 23 %=% k|jf;L / clGtd uGtJosf] k];f (Migrants and Occupations at Last Destination) 24 %=^ /]ld6\ofG; / /]ld6\ofG;sf] /sd (Remittance and Amount Remitted) 25 %=& /]ld6ofG;sf] dfWod (Channels of Remittances) 26 %=* /]ld6\ofG; x:tfGt/0fsf] af/Daf/tf (Frequency of Remittance Transfer) 27^= k|jf;gsf ;fdflhs–cfly{s k|efjx¿ (Socio-Economic Impacts of Migration) 28 ^=! cfDbfgLsf] ;|f]tdf k|efj (Impact on Source of Income) 28 ^=@ 3/kl/jf/sf] vr{df k|efj (Impact on Household Expenditure) 29 ^=# k|jf;L 3/kl/jf/sf] :jf:Yo ;]jfdf k|fyldstf (Healthcare Preferences of Migrant 30
Households) ^=$ k|jf;gn] kf/]sf] cfly{s k|efjsf] d"Nof+sg (Assessment of the Economic Impact 31
of Migration) ^=% dlxnf ;xeflutf / lg0f{odf k|jf;gsf] k|efj (Impact of Migration on Female 32
Participation and Decision Making) ^=% j[4j[4fx¿df k|jf;gsf] k|efj (Impact of Migration on the Elderly Population) 33

List of Tables
Table 1: Household and Population Composition 4Table 2: Age and Gender Distribution of the Population 6Table 3: Distribution of Population by Caste/Ethnicity 9Table 4: Distribution of Population by Marital Status 10Table 5: Distribution of Population by Primary Occupation/Activity 11Table 6: Illiteracy Rates by Caste and Ethnicity and Gender 15Table 7: Migrant Households and Population 19Table 8: Distribution of Households by Migration Status 20Table 9: Migrant Population by Ward 21Table 10: Primary Reason for Migration 22Table 11: Amount Remitted 25Table 12: Primary Source of Income Pre- and Post-Migration 28Table 13: Distribution of Migrant Households by Primary Expenditure 29 Pre- and Post-Migration
List of Figures
Figure 1: Parsa District with Study Sites 3Figure 2: Distribution of Household by Macro-Ethnic Category 7Figure 3: Distribution of Population by Literacy Status 12Figure 4: Distribution of Population by Literacy Status [Census 2011] 13Figure 5: Distribution of Population by Place of Birth 16Figure 6: Distribution of Citizenship of Individuals 17Figure 7: Ownership of Household Assets 18Figure 8: First Migration Destination 23Figure 9: Distribution of Occupation at Last Destination 24Figure 10: Channels of Remittances 25Figure 12: Frequency of Remittance Transfers 26Figure 11: Primary Healthcare Preference Pre- and Post-Migration 30Figure 12: Self-Assessment of Economic Impact of Migration 31Figure 13: Migration and Women’s Decision-making within Household 32Figure 14: Impact of Migration on Elderly Population 33

1
The University of Oxford, in collaboration with the Centre for the Study of Labour and Mobility (CESLAM) and local partner Divya Youth Club, Parsa, conducted a census entitled ‘Labour Migration: Impacts on Households in Parsa’ in February-March 2014. The principal objective of this census (hereafter, Parsa Study 2014) was to provide information on the history and current trends in the migratory process in three VDCs in Parsa district—Bagwana, Biranchibarwa and Jhauwa Guthi. Parsa Study 2014 thus provides a general overview of migration with information ranging from reasons for migration, occupations in the country of destination and channels of remittance transfer to the different socio-economic impacts of migration. This report also discusses the findings of the study as they pertain to Bagwana VDC and, where comparable, refers to the data from the National Population and Housing Census 2011 to present a more time-sensitive depiction of the VDC.
cS;kmf]8{ ljZjljBfnon] ;]G6/ km/ b :68L ckm n]a/ PG8 df]laln6L -;]:nd_ / :yfgLo ;fem]bf/ lbJo o'jf Sna, k;f{;Fusf] ;xsfo{df …>d k|jf;gM k;f{df 3/kl/jf/df k|efjÚ gfds ;j]{If0f k]ma|'c/L–dfr{ @)!$ df u/]sf] lyof] . of] ;j]{If0f -o;kl5 k;f{ cWoog @)!$ elgg]_ k;f{ lhNnfsf] tLgj6f uflj; — afujfgf, la/GrLajf{ / emf}jfu'7Ldf ul/Psf] lyof] . o; cWoogsf] d'Vo p2]Zo k;f{ lhNnfsf 5flgPsf uflj;df k|jf;g ;DaGwL Oltxf; / clxn]sf] k|j[lQsf af/] tYof+s pknAw u/fpg' lyof] . k;f{ cWoog @)!$ n] k|jf;gsf sf/0fx¿, uGtJo d'n'sdf ckgfPsf] k];f, /]ld6\ofG; k7fpg] dfWod nufot k|jf;gsf ;fdflhs, cfly{s k|efj h:tf If]qx¿nfO{ ;d]6]/ k|jf;gsf] ;fdfGo ;dLIff u/]sf] 5 . o; l/kf]6{n]] afujfgf uflj;sf] cWoogaf6 k|fKt lgisif{x¿nfO{ ;d]6\g'sf ;fy} cfjZostf cg';f/ /fli6«o hgu0fgf @)!! sf] tYof+sx¿nfO{ klg ;d]6]sf] 5 .
!= k[i7e"ld (Background)

2
Bagwana VDC is located in the north-central area of Parsa district. It borders the Parsa Wild Life Reserve to the north and east, Madhuwan Mathwal VDC to the west, and Harpur VDC to the south. It lies at a distance of 22.7 km from the district headquarters of Birgunj and, with a total area of 35.86 sq km, is among the largest VDCs in the district.1 Since Bagwana is close to Jeetpur, a growing market centre of Bara, it has become a market centre for VDCs to the northwest.
According to local accounts, Bagwana was named for the tigers that used to be found in the area. The place played a key role in Nepal’s national history as the location where the Nepali forces held their ground against the East India Company during the Anglo-Nepali War of 1814-16, a fact marked by the Koilabhar Mandir. The territory of Bagwana was given as birta to Ranjit Chaudhari by King Girvan Yuddha Bikram Shah for Chaudhari and his people’s contribution in defending Nepal against the British.
Historically, the village’s majority population was Tharu. But, over time, the area experienced in-migration of Madhesi populations from the south and Pahadi groups from the north, with the newcomers buying land piecemeal from the large landowning families.
The majority of households in the VDC work in the agricultural sector. Of the total land in the VDC, 606 hectares is cultivated and 112 hectares is not cultivated. All households own some land though, with about a half owning
@= cWoog ul/Psf] :yfg (Study Site)
afujfgf uflj; k;f{ lhNnfsf] pQ/–dWo efu / dsjfgk'/ lhNnfsf] glhs kb{5 . o;sf] pQ/ / k"j{df k;f{ jGohGt' cf/If, klZrddf dw'jg d7jfn uflj; / blIf0fdf x/k'/ uflj; 5 . of] uflj; k;f{ lhNnfsf] ;b/d'sfd jL/uGhaf6 @@=& lsnf]ld6/ 6f9f 5 / o;sf]] If]qkmn #%=*^ ju{lsnf]ld6/ 5 . of] k;f{ lhNnfsf] 7"nf uflj;x¿dWo]df kb{5 .! afujfgf clxn] km}nFb} uO/x]sf] af/f lhNnfsf] hLtk'/ ahf/ glhs ePsfn] of] pQ/–klZrd uflj;x¿sf nflu Jofkfl/s s]Gb| klg xf] .
plxn] o; If]qdf af3x¿ a:g] ePsfn] o;sf] gfd afujfgf /xg uPsf] :yfgLox¿sf] egfO 5 . ;g\ !*!$ -lj=;+= !*&!_ sf] g]kfn–c+u|]h o'4sf a]nf Oi6 OlG8of sDkgLsf kmf}hnfO{ g]kfnL ;]gfn] o;} 7fpFdf /f]s]sfn] klg o; 7fpFsf] P]ltxfl;s dxTj 5 . sf]Onfef/ dlGb/ o;sf] k|df0f xf] . /l~ht rf}w/L / pgsf dflg;x¿n] c+u|]hnfO{ x/fpg ;xof]u u/]afkt afujfgf If]qnfO{ /fhf uLjf{0fo'4 ljqmd zfxn] latf{sf] ¿kdf lbPsf lyP .
klxnf–klxnf o; ufpFdf yf¿ hfltsf] afx'Notf lyof] t/ ;do;Fu} blIf0faf6 dw]zL / pQ/af6 kxf8] d"nsf dflg;x¿ o; 7fpFdf a:g yfn] . gofF cfpg]x¿n] hldg k|z:t ePsf hldgbf/ kl/jf/x¿af6 6'qmf–6'qmf hUuf lsg] .
oxfFsf clwsf+z 3/kl/jf/x¿ s[lif If]qdf nfu]sf 5g\ . uflj;df ePsf] hldgdWo] ^)^ x]S6/df v]tLkftL ul/Psf] 5 eg] !!@ x]S6/df v]tLkftL ul/Psf] 5}g . ;a} 3/kl/jf/;Fu hUuf eP tfklg sl/a cfwfhltsf] hUuf !) s6\7feGbf sd 5 .
3
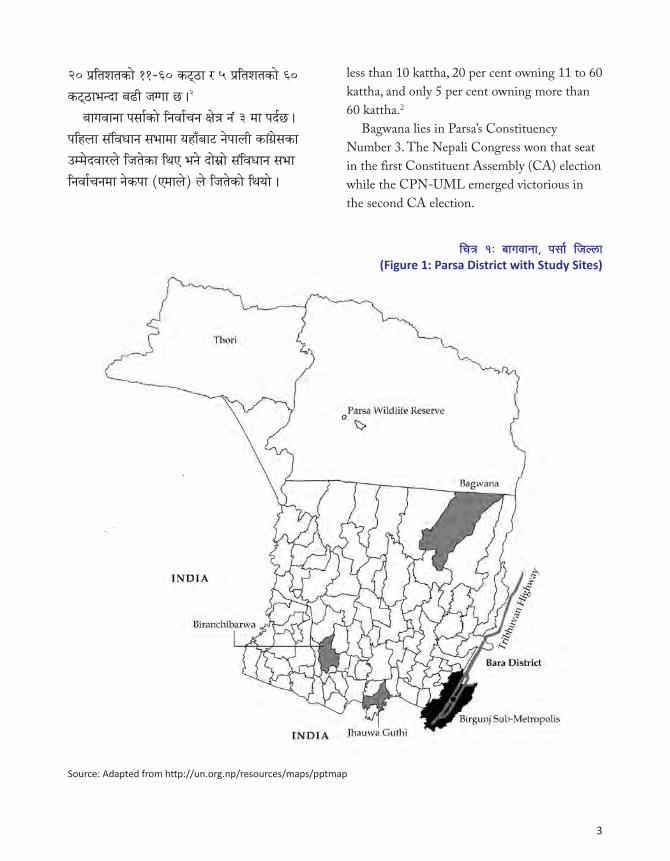
less than 10 kattha, 20 per cent owning 11 to 60 kattha, and only 5 per cent owning more than 60 kattha.2
Bagwana lies in Parsa’s Constituency Number 3. The Nepali Congress won that seat in the first Constituent Assembly (CA) election while the CPN-UML emerged victorious in the second CA election.
lrq !M afujfgf, k;f{ lhNnf (Figure 1: Parsa District with Study Sites)
Source: Adapted from http://un.org.np/resources/maps/pptmap
@) k|ltztsf] !!–^) s6\7f / % k|ltztsf] ^) s6\7feGbf a9L hUuf 5 .@
afujfgf k;f{sf] lgjf{rg If]q g++ # df kb{5 . klxnf ;+ljwfg ;efdf oxfFaf6 g]kfnL sf+u|];sf pDd]bjf/n] lht]sf lyP eg] bf];|f] ;+ljwfg ;ef lgjf{rgdf g]skf -Pdfn]_ n] lht]sf] lyof] .

4
#=! 3/w'/L / hg;+Vofsf] agfj6 (Household and Population Composition)
#= hg;f+lVos agfj6 (Demography)
l/kf]6{sf] o; v08n] cWoogsf] lgisif{ tyf 3/kl/jf/ / hg;+Vofsf] agfj6 b]vfpF5 . o;n] j8f:t/df n}+lussf] lx;fan] ul/Psf] hgu0fgf / uflj;sf afl;Gbfx¿sf] pd]/ ;d"x ;DaGwL hfgsf/Lx¿ klg pknAw u/fPsf] 5 .
This section of the report presents the findings of the study vis-à-vis household and population composition. It also provides gender-disaggregated population count at the ward level and information on the age composition of the residents of the VDC.
Parsa Study 2014 counted a total of 1210 households in Bagwana, spread over the 9 wards of the VDC. (The enumerators found 14 households locked at the time of enumeration.3) The average household size of the VDC is approximately 6.
The total population documented by Parsa Study 2014 is 7265, with 3702 males and 3561
k;f{ cWoog @)!$ cg';f/ afujfgf uflj;sf ( j6f j8fdf !@!) 3/w'/L /x]sf 5g\ . -;j]{If0fsf qmddf !$ 3/w'/Lx¿df tfNrf nufOP kfOof] .#_ uflj;sf] cf};t 3/kl/jf/sf] ;+Vof nueu ^ hgf /x]sf] lyof] .
k;f{ cWoog @)!$ n] u/]sf] ;j]{If0fdf oxfFsf] hg;+Vof &@^% /x]sf] lyof] eg] o;df #&)@ k'?if
tflnsf !M 3/w'/L / hg;+Vofsf] agfj6 (Table 1: Household and Population Composition)
WardParsa Study 2014 Census 2011
Households Male Female Total Households Male Female Total
1 73 249 250 499 63 191 203 3942 87 282 261 543 82 248 229 4773 138 426 420 846 171 405 462 8674 152 474 455 929 144 391 382 7735 91 260 255 515 85 251 255 5066 35 100 104 204 37 124 114 2387 155 443 418 862* 155 434 410 8448 174 523 518 1042 198 447 508 9559 305 945 880 1825 331 990 920 1910
Total 1210 3702 3562 7265 1266 3481 3483 6964* There was one individual in ward No 7 for whom information on gender was missing.

5
females. It is interesting to note that Wards Number 1 and 6 are the only ones where the female population is higher than the male population. There are 78 households with female household heads and 4 households with both males and females as heads of household. The gender ratio recorded in Bagwana is 104 in Parsa Study 2014, i.e., there are 104 males for every 100 females. Census 2011, on the other hand, gives the gender ratio to be 100.
Except for Wards 4, 8 and 9, the number of households and population in Parsa Study 2014 and Census 2011 are comparable, with a modest growth recorded. The decline in the number of households and population in Wards 4, 8 and 9 can possibly be attributed to outmigration from the VDC.
/ #%^! dlxnf /x]sf lyP . j8f g+ ! / ^ df dfq dlxnfx¿sf] hg;+Vof k'?ifx¿eGbf a9L /x]sf] /f]rs tYo km]nf k/]sf] lyof] . o; uflj;sf &* 3/w'/Ldf dlxnf 3/d"nL / $ 3/w'/Ldf dlxnf–k'?if b'j} 3/d"nL /x]sf 5g\ . afujfgfsf] n}+lus cg'kft k;f{ cWoog @)!$ cg';f/ !)$ /x]sf] 5 eg] /fli6«o hgu0fgf @)!! -@)^* lj=;+=_ df !)) pNn]v 5 cyf{t\, ToxfF !)) dlxnfsf nflu !)$ k'?if, k;f{ cWoog @)!$ cg';f/ / !)) g} k'?if /fli6«o hgu0fgf @)!! cg';f/ 5g\ .
j8f g+= $, * / ( df afx]s cGodf 3/w'/L / hg;+Vof k;f{ cWoog @)!$ / /fli6«o hgu0fgf @)!! aLr t'ngf ubf{ a9]sf] kfOPsf] 5 . j8f g+= $, * / ( sf] hg;+Vof / 3/w'/L 36\g'sf] sf/0f cGo :yfgdf a;fOF ;/]sfn] xf] .

6
afujfgf uflj;df $% k|ltzteGbf a9L @% jif{eGbf sd pd]/ ;d"xsf] hg;+Vof 5 . % jif{d'lgsf aRrfx¿sf] hg;+Vof sl/a ( k|ltzt /x]sf] 5 / &% jif{eGbf dflysf] hg;+Vof w]/} sd 5 . o; uflj;sf] s'n hg;+VofdWo] %–@$ jif{ pd]/ ;d"xsf] hg;+Vof $) k|ltzteGbf a9L /x]sf] 5 . sfd ug]{ pd]/ ;d"x -!%–%(_ sf] hg;+Vof ^! k|ltzt / pgLx¿dfly cfl>t hg;+Vof #( k|ltzt /x]sf] 5 . cfl>t b/ !% jif{eGbf d'lgsf / %( jif{eGbf dflysf hg;+VofnfO{ elgPsf] 5 . /fli6«o hgu0fgf @)!! ;Fu t'ngf ubf{ afujfgfsf] pd]]/ ;d"xsf] hg;+Vofdf vf;} kl/jt{g cfPsf] b]lvb}g .
Over 45 per cent of Bagwana’s population is below 25 years of age. Children below the age of 5 years account for approximately 9 per cent of the total, while the population above 75 years is merely 1.13 per cent. The age group 5-24 constitutes more than 40 per cent of the total population of the VDC. The working-age population (15-59) is 61 per cent while the dependency ratio is 39 per cent, wherein dependency ratio is defined as the population younger than 15 and older than 59 in relation to the working-age population. The age demography in Bagwana has not changed much in Parsa Study 2014 compared to Census 2011.
#=@ pd]/ ;d"x cg';f/ hg;+Vofsf] ljt/0f (Population and Age Distribution)
tflnsf @M hg;+Vofsf] pd]/ cg';f/sf] ljt/0f (Table 2: Age Distribution of Population)
Age Group
Parsa Study 2014 Census 2011Male Female Total Male Female Total
Pop. % Pop. % Pop. % Pop. % Pop. % Pop. %0-4 336 9.08 311 8.73 647 8.91 328 9.42 296 8.49 624 8.905-9 425 11.48 385 10.81 810 11.15 434 12.46 427 12.26 861 12.30
10-14 413 11.16 402 11.29 815 11.22 413 11.86 397 11.39 810 11.6015-19 390 10.53 413 11.6 803 11.05 384 11.03 462 13.27 846 12.1020-24 346 9.35 409 11.49 755 10.39 308 8.85 369 10.59 677 9.7025-29 353 9.54 350 9.83 703 9.68 269 7.73 275 7.89 544 7.8030-34 287 7.75 274 7.69 561 7.72 215 6.17 243 6.97 458 6.5035-39 251 6.78 213 5.98 464 6.39 245 7.03 231 6.63 476 6.8040-44 183 4.94 173 4.86 356 4.90 193 5.54 184 5.28 377 5.4045-49 171 4.62 154 4.32 325 4.47 193 5.54 168 4.82 361 5.1050-54 137 3.70 120 3.37 257 3.54 141 4.05 122 3.50 263 3.7055-59 105 2.84 92 2.58 197 2.71 120 3.45 91 2.61 211 3.0060-64 102 2.76 102 2.86 204 2.81 94 2.70 77 2.21 171 2.4065-69 81 2.19 63 1.77 144 1.98 63 1.81 66 1.89 129 1.8070-74 66 1.78 65 1.83 131 1.80 40 1.15 39 1.11 79 1.1075 + 50 1.35 32 0.90 82 1.13 41 1.17 36 1.03 77 1.10
Missing 6 0.16 3 0.08 11 0.15 N/A N/A N/A N/A N/A N/ATotal 3702 100.0 3562 100.0 7265 100.0 3481 3483 6964 100.0

7
$= ;fdflhs–cfly{s ;+/rgf (Socio-Economic Composition)
o; v08df hfthflt, hGd :yfg, gful/stfsf] cj:yf, wfld{s cf:yf, hfthfltsf] a[xt\ juL{s/0f, j}jflxs l:ylt, z}lIfs l:ylt / ufpFn]x¿sf d'Vo k];faf/] hfgsf/L lbOPsf] 5 . o;df 3/kl/jf/sf] ;DklQdf :jfldTj ;DaGwL klg hfgsf/L lbOPsf] 5 .
This section of the report presents information on the macro-ethnic composition of the population, caste and ethnicity, religious affiliation, marital status, primary activity of the population, educational attainment, place of birth and citizenship status. It also presents information on ownership of household assets.
$=! hfthfltsf] a[xt\ juL{s/0f (Macro-Ethnic Category)
afujfgf uflj;sf w]/}h;f] cyf{t\ %* k|ltzt 3/kl/jf/n] cfkm"nfO{ dw]zL eg]/ lrgfP eg] @$ k|ltzt 3/kl/jf/n] kxf8] tyf !* k|ltzt 3/kl/jf/n] cfk"mx¿ dw]zL / kxf8] b'j} gePsf] atfP . logLx¿df clwsf+z yf¿ lyP . ^&=! k|ltzt yf¿n] cfk"mnfO{ dw]zL eg]/ lrgfP eg] !=$ k|ltztn] kxf8] / #!=$ k|ltztn] b'j} gePsf] atfP .
In Bagwana VDC, the majority of households, i.e., 58 per cent, identified themselves as Madhesi, 24 per cent as Pahadi, and a significant 18 per cent as neither. The last group were nearly all Tharus. In all, 67.1 per cent of Tharus identified as Madhesi, 1.4 per cent as Pahadi, and 31.4 per cent as neither.
lrq @M d"nsf cfwf/df 3/kl/jf/ ljt/0f (Figure 2: Distribution of Household by Macro Ethnic Category)
Pahadi (24%) Madhesi (58%)
Others (18%)

8
k;f{ cWoog @)!$ cg';f/ afujfgf uflj;df ;+Vofsf] cfwf/df x]bf{ yf? hfltsf] afx'Notf %@ k|ltzteGbf a9L /x]sf] 5 . hfthfltsf] lj:t[t ljj/0f tflnsf # df lbOPsf] 5 . k;f{ cWoog @)!$ n] ;a} dw]zL blntx¿ / ;a} kxf8] blntx¿nfO{ Ps} ;d"xdf /fv]sf] 5 . ljleGg hfthfltx?sf] hg;+VofnfO{ t'ngf ug{ ldNg]5 oBlk hgu0fgf @)!! / k;f{ cWoog @)!$ df cGo hfthfltx¿sf] hg;+Vofdf yf]/} leGgtf b]lvPsf] 5 . k;f{ cWoog @)!$ df t/fO{ hflt sd 5g\ eg] hgu0fgf @)!! df t/fO{ blnt sd 5g\ .
Parsa Study 2014 recorded Tharus as the numerically dominant caste/ethnic group with over 52 per cent share of the population in Bagwana VDC. The detailed caste and ethnic breakdown is provided in Table 3. It should be noted here that Parsa Study 2014 grouped all Madhesi Dalits as one category and likewise with Pahadi Dalits. The population of various caste/ethnic groups are quite comparable although there are slight discrepancies between Parsa Study 2014 and Census 2011 such as fewer individuals of the Tarai Castes recorded in Parsa Study 2014 whereas fewer Tarai Dalits were recorded in Census 2011 than in Parsa Study 2014.
$=@ hfthflt (Caste and Ethnicity)

9
Parsa Study 2014 Census 2011
Caste/Ethnicity No % Caste/Ethnicity No %Hill Caste 1089 14.99 Hill Caste 1028 14.76
Bahun 687 9.46 Bahun 635 9.12Chhetri 393 5.41 Chhetri 393 5.64Sanyasi/Dasnami 9 0.12
Tarai Caste 613 8.43 Tarai Caste 681 9.78Mallah 194 2.67 Mallah 249 3.57Koiri/Kushwaha 126 1.73 Kurmi 118 1.69Kurmi 108 1.49 Koiri/Kushwaha 108 1.55Bin 41 0.56 Teli 51 0.73Hajjam/Thakur 36 0.5 Bin 50 0.71Sonar 27 0.37 Hajjam/Thakur 36 0.51Teli 24 0.33 Kanu 36 0.51Kanu 22 0.3 Sonar 19 0.27Yadav 12 0.17 Brahman-Tarai 14 0.2Brahman-Tarai 12 0.17 kalwar 6 0.08 Rajput 5 0.07
Hill Dalit 153 2.1 Hill Dalit 170 2.44 Kami 106 1.52 Sarki 40 0.57 Damai/Dholi 24 0.34Tarai Dalit 1030 14.18 Tarai Dalit 893 12.82 Musahar 570 8.18 Chamar/Harijan/Ram 261 3.74 Dusadh/Paswan/Pasi 62 0.89Hill Janajati 469 6.46 Hill Janajati 385 5.52
Tamang 334 4.6 Tamang 267 3.83Newar 76 1.05 Newar 86 1.23Magar 44 0.61 Magar 32 0.45Other Janajati 9 0.12 Bhujel 6 0.08
Tarai Janajati 3833 52.76 Tarai Janajati 3704 53.18Tharu 3778 52 Tharu 3704 53.18Majhi 55 0.76
Others 71 0.98 Others 55 0.79Muslim 71 0.98 Muslim 48 0.69
Missing/Not Stated 7 0.1 Others 7 0.0Total 7265 100.0 Toal 6964 100.0
tflnsf #M hfthfltsf cfwf/df hg;+Vof ljt/0f$ (Table 3: Distribution of Population by Caste/Ethnicity)4

10
tflnsf $ df b]vfOP cg';f/ bz jif{eGbf dfly pd]/ ;d"xsf ^) k|ltzt hg;+Vof ljjflxt lyP . @! hgfsf] ljjfx eO;s]sf] t/ …uf}gfÚ% afFsL /x]sf] lyof] . o; pd]/ ;d"xsf #$ k|ltzt cljjflxt /x]sf] kfOof] . @) jif{eGbf dfly pd]/ ;d"xnfO{ cfwf/ dfGg] xf] eg] of] !) k|ltzt dfq x'g cfpF5 . cWoogn] s]xL dfqfdf j}jflxs ;DaGw c;kmn ePsf] kfPsf] 5 — * hgfn] ;DaGwljR5]b u/]sf / !$ hgf cnu a;]sf 5g\ . o:t} u/L @^& hgf ljwjf÷ljw'/ /x]sf / !( hgfn] ax'ljjfx u/]sf] klg kfOof] .
$=$ j}jflxs l:ylt (Marital Status)
afujfgfsf clwsf+z 3/kl/jf/ cyf{t\ ($ k|ltzt lxGb" 5g\ . o;}u/L a'4 wd{ dfGg] $ k|ltzt, O:nfd wd{ dfGg] Ps k|ltzt /x]sf 5g\ / lqmlZrog wd{ dfGg] 3/kl/jf/ b'O{j6f dfq /x]sf] kfOof] . To:t} 3/kl/jf/sf] wfld{s cf:yf Ps} lsl;dsf] /x]sf] / 3/d"nLn] dfGg] wd{nfO{ g} kl/jf/sf ;b:ox¿n] ckgfPsf] kfOof] .
The vast majority of the households in Bagwana VDC, 94 per cent, identified themselves as Hindus. Buddhism is the religion of 4 per cent of the population while Islam is followed by only 1.25 per cent, and Christianity by less than 1 per cent (that is, by only two households in the VDC). The religious composition within all the households in the VDC is homogeneous with all the household members following the same religion.
As shown in Table 4, 60 per cent of the population over the age of 10 are married. Only 21 people reported being married without yet having performed gauna.5 While a significant proportion of 34 per cent from that age group reported being single, while considering the population above the age of 20, only 10 per cent are unmarried. There were a few cases of unsuccessful marriages recorded, i.e., 8 divorced and 14 separated. There were 267 cases of widows or widowers, and 19 cases of polygamy.
tflnsf $M j}jflxs l:ylt -pd]/ !) jif{ jf dfly_ sf cfwf/df hg;+Vofsf] ljt/0f (Table 4: Distribution of Population by Marital Status [aged 10 years and above])
Marital StatusMale Female Total
No. % No. % No. %Single 1073 36.55 899 31.41 1972 34.00Marriage without gauna 13 0.44 8 0.28 21 0.36Married 1732 58.99 1763 61.60 3495 60.26Divorced 4 0.14 4 0.14 8 0.14Separated 7 0.24 7 0.24 14 0.24Widowed 94 3.20 173 6.04 267 4.60Polygamy 12 0.41 7 0.24 19 0.33Missing 1 0.03 2 0.06 4* 0.07Total 2936 100.0 2862 100.0 5800 100.0
$=# wd{ (Religion)
* There was one individual for whom information on gender and marital status was missing.

11
tflnsf % n] afujfgf uflj;sf dflg;sf] d'Vo k];fnfO{ b]vfpF5 . k'?if hg;+Vofsf] #! k|ltztn] s[lif k];f ckgfPsf 5g\ eg] %( k|ltzt dlxnfx¿ u[lx0fL 5g\ . dlxnf / k'?if ljBfyL{ a/fa/ -@$ k|ltzt_ 5g\ . lghL If]qdf sfd ug]{ k'?ifx¿sf] ;+Vof pNn]Vo /x]sf] 5 . ^ k|ltzt k'?ifx¿ a]/f]huf/ jf sfdsf] vf]hLdf lyP .
$=% d'Vo k];f÷ultljlw -!) jif{ jf ;f]eGbf a9L pd]/sf_ (Primary Occupation/Activity [age 10 and above]) Occupation/Activity)
Table 5 shows the primary occupation/activity of the people of Bagwana VDC. The primary activity of the male population of Bagwana is farming (31 per cent) while 59 per cent of females are housewives. There are an equal proportion of 24 per cent students among both males and females. A significant number of people are employed in the private sector, and 6 per cent of males are unemployed or are looking for a job.
tflnsf %M d'Vo k];f÷ultljlwsf cfwf/df hg;+Vofsf] ljt/0f -!) jif{ jf ;f]eGbf a9L_ (Table 5: Distribution of Population by Primary Occupation/Activity [aged 10 years and above])
Primary ActivityMale Female Total
Individual % Individual % Individual %Housewife 12 0.41 1694 59.19 1706 29.41Student 697 23.74 693 24.21 1390 23.97Farmer 918 31.27 187 6.53 1105 19.05Private sector employee 453 15.43 32 1.12 485 8.36Self-employed (non-agriculture) 158 5.38 20 0.70 178 3.07Government employee 31 1.06 18 0.63 49 0.84Retired 2 0.07 0 0.00 2 0.03Unable to work 94 3.20 109 3.81 203 3.5Unemployed/Looking for work 178 6.06 13 0.45 191 3.29Other 391 13.32 95 3.32 486 8.38Missing 2 0.06 2 0.06 5* 0.08Total 2936 100.0 2862 100.0 5800 100.0
* There was one individual for whom information on gender and primary activity was missing.

12
lrq # n] afujfgf uflj;sf] z}lIfs l:yltaf/] hfgsf/L lbPsf] 5 . kfFr jif{dflysf ^^!) JolQmdWo] @)#) hgf -#! k|ltzt_ :s'n slxNo} klg uPsf lyPgg\ / n]vk9 ug{ klg ;Sb}gg\ . k;f{ cWoog @)!$ n] juL{s/0f u/]sf] …:s'n guPsf t/ ;fIf/Ú hg;+Vof ;d"xdf * k|ltzt -%*) hgf_ /x]sf] kfOof] . o;afx]s db/;f lzIff xfl;n u/]sf )=)! k|ltzt 5 . sf]i7df ePsf c+sn] k/:k/ pd]/ ;d"xsf k|ltztnfO{ hgfpF5 .
Figure 3 presents data on the educational attainment in Bagwana VDC. Of the 6610 individual aged 5 and above, 2030 (31 per cent) have never attended school and cannot read and write, and 8 per cent (580) have been classified as ‘no schooling but literate’. Only seven people (0.01 per cent) have received madrasa education.
lrq #M ;fIf/tfsf] cj:yf cg';f/sf] hg;+Vof ljt/0f -% jif{ jf ;f]eGbf dfly_ (Figure 3: Distribution of Population by Literacy Status [aged 5 and above])
Master’s (MA, MSc, etc) or higher
Bachelor's (BA, BSc, etc)
Grades 11 to 12
Grades 9 to 10
Grades 6 to 8
Grades 1 to 5
Below grade 1
Madrasa
No schooling/Literate
No schooling/Iliterate
31 (0.4%)
156 (2.36%)
291 (4.4%)
701 (10.61%)
888 (13.43%)
1817 (27.49%)
104 (1.57%)
7 (0.01%)
580 (8.77%)
2030 (30.71%)
$=^ z}lIfs l:ylt -% jif{ jf a9L_ (Educational Attainment [aged 5 and above])

13
lrq $M ;fIf/tfsf] cj:yf cg';f/ hg;+Vof ljt/0f -% jif{ jf ;f]eGbf dfly_ -hgu0fgf @)!!_ (Figure 4: Distribution of Population by Literacy Status [aged 5 and above] [Census 2011])
Level not stated
Non-formal education
Others
Post Graduate & equi.
Graduate & equi.
Intermediate & equi.
SLC & equi.
Secondary (9-10)
Lower Secondary (6-8)
Primary (1-5)
Beginner 42 (1.14%)
796 (21.61%)1869 (50.73%)
231 (6.27%)
188 (5.1%)
58 (1.57%)
12 (0.32%)
69 (1.87%)
40 (1.08%)
4 (0.11%)
375 (10.18%)
$=& z}lIfs l:ylt -% jif{ jf ;f]eGbf a9L_ -hgu0fgf @)!!_ (Educational Attainment [aged 5 and above] [Census 2011])
lrq $ n] afujfgf uflj;sf] z}lIfs l:yltsf af/]df hgu0fgf @)!! sf] tYof+snfO{ b]vfPsf] 5 . hgu0fgfn] z}lIfs tx k"/f u/]sfnfO{ dfq ;d]6]sf] 5 / s'g} klg lsl;dsf] :s'n guPsfnfO{ 5f]8]sf] 5 . kfFr jif{dflysf / s'g} klg vfnsf :s'n uPsf, cfwf hg;+Vofn] k|fylds tx, @! k|ltztn] lgDgdfWolds, !) k|ltztn] dfWolds / ^ k|ltztn] P;Pn;L k"/f u/]sf 5g\ . yf]/}n] dfq pRr lzIff xfl;n u/]sf 5g\ .
Figure 4 presents data from the Census 2011 on educational attainment in Bagwana VDC. The Census provides data on the levels completed only and omits the population who never went to any kind of school. Of the 3684 individuals above the age of five who received schooling of some kind, half have completed primary education, 21 per cent have completed lower secondary, and 10 per cent secondary, and only 6 per cent SLC. Higher education has been received by less than 7 per cent of this population.

14
tflnsf ^ n] afujfgf uflj;sf ljleGg hfthfltsf] z}lIfs l:yltsf af/]df b]vfPsf] 5 . ;g\ @)!! sf] hgu0fgfn] afujfgfdf $# k|ltzt lg/If/ b]vfPsf]df k;f{ cWoog @)!$ n] 36]/ #! k|ltztdf k'u]sf] kfPsf] 5 .^ Ps ;o hgfeGbf a9L hg;+Vof ePsf] hfthfltsf] ;d"xdWo] a9L lg/If/ -%$=$$ k|ltzt_ dw]zL blnt / To;kl5 dNnfx -$( k|ltzt_ kfOPsf] 5 .
Table 6 presents data on the educational attainment of various caste/ethnic groups of Bagwana VDC. Census 2011 recorded 43 per cent illiteracy in Bagwana VDC which appears to have declined significantly to 31 per cent at the time of Parsa Study 2014.6 Among the caste/ethnic groups with a population size larger than 100, Madhesi Dalits have the highest illiteracy (54.44 per cent) followed by Mallah (49 per cent).
$=* hfthflt / n}+lus cfwf/df lg/If/tfsf] b/ -% jif{ / dfly_ Illiteracy Rate by Caste and Ethnicity and Gender [5 years and above])

15
tflnsf ^M hfthflt / ln+usf] cfwf/df lg/If/tfsf] b/ -% jif{ / dfly_ (Table 6: Illiteracy Rate by Caste and Ethnicity and Gender [5 years and above])
Caste/EthnicityMale Female Total
Individual % Individual % Individual %
Tharu 374 21.33 655 37.99 1029 29.59
Madhesi Dalit 213 47.75 274 61.16 487 54.44
Mallah 32 39.02 52 57.78 84 48.83
Bahun 27 8.46 57 17.48 84 13.02
Pahadi Chhetri 23 12.17 47 27.32 70 19.39
Tamang 28 17.72 38 26.57 66 21.85
Pahadi Dalit 23 27.05 21 30.80 44 28.93
Majhi 13 0.50 20 86.97 33 67.35
Kurmi 9 0.18 21 0.50 30 32.6
Koiri 8 12.50 16 31.37 24 20.87
Bin 8 38.09 7 50.00 15 42.86
Newar 2 4.76 8 25.50 10 13.51
Hajam 2 9.52 8 61.53 10 29.41
Muslim 1 3.22 8 30.77 9 15.79
Teli 3 25.00 5 50.00 8 36.36
Magar 3 15.79 4 20.00 7 17.94
Yadav 2 40.0 2 28.57 4 33.33
Sonar 2 13.33 2 16.66 4 14.81
Kanu 1 11.11 2 16.67 3 14.28
Madhesi Rajput 1 50.00 1 50.00 2 50.00
Kalwar 1 33.33 1 33.33 2 33.33
Other Janajati 1 25.00 1 25.00 2 25.00
Brahman-Tarai 0 0.00 1 33.33 1 8.33
Bhujel 0 0.00 0 0.00 0 0.00
Sanyasi 0 0.00 0 0.00 0 0.00
Missing 1 33.33 1 33.33 2 33.33
Total 778 1252 2030

16
tn lrq % df b]vfOP cg';f/ hg;+Vofsf] 7"nf] lx:;f -*% k|ltzt_ k;f{ lhNnfdf hlGdPsf] kfOPsf] 5 . s'n hg;+Vofsf] !$ k|ltzt g]kfnsf] cGo lhNnfx¿df hGd]sf / Ps k|ltztn] rflx+ ef/tdf hGd]sf] eg]sf 5g\ . Ps hgfn] g]kfn / ef/tafx]s cGo :yfgdf hGd]sf] eg]sf 5g\ .
As seen in Figure 5 below, the vast majority, 85 per cent, of the population was born in Parsa district, 14 per cent was born in another district of Nepal while only 1 per cent reported his or her birthplace as India. Only one instance of birth outside Nepal or India was recorded.
$=( hGd :yfg (Place of Birth)
lrq %M hGd :yfgsf] cfwf/df hg;+Vof ljt/0f (Figure 5: Distribution of Population by Place of Birth)
FemaleMaleTotal
81.3%
17.0%
1.7%
88.4%
11.3%
0.3%
84.9%
14.1%
1.0%
In another district within Nepal IndiaParsa
Note: 3 missing/unstated values.

17
gful/stf k|fKt ug{sf nflu of]Uo eO;s]sf hg;+Vof $*!$ -^^ k|ltzt_ dWo] #&!@ hgf;Fu g]kfnL gful/stfsf] k|df0fkq 5 eg] @@ k|ltzt cyf{t\ !)&( hgfn] g]kfnL gful/stfsf nflu lgj]bg lbPsf 5}gg\ . gful/stf k|df0fkq lng of]Uo t/ k|df0fkq gePsfdWo]df ^* k|ltzt dlxnf / #@ k|ltzt k'?if lyP . oxfF a:g] !) hgf;Fu eg] ef/tsf] gful/stf lyof] .
$=!) gful/stfsf] cj:yf -!^ jif{ jf ;f]eGbf dfly_ (Citizenship Status [aged 16 and above])
Out of the total 4814 individuals (66 per cent) eligible for citizenship, 3712 (77 per cent) have Nepali citizenship papers while a sizeable 22 per cent (1079 individuals) do not. Of the eligible population who have not applied for citizenship, 68 per cent are female and 32 per cent are male. There are 10 residents with Indian citizenship.
Male Female Total
2094
3
343
1618
7
736
3712
10
1079
Indian No citizenshipNepali
lrq ^M gful/stfsf] cfwf/df hg;+Vof ljt/0f -!^ jif{ jf ;f]eGbf dfly_ (Figure 6: Distribution of Citizenship of Individuals [aged 16 and above])
Note: 13 missing/unstated values.

18
$=!! 3/kl/jf/sf] ;DklQdf :jfldTj (Ownership of Household Assets)
afujfgf uflj;df ;j]{If0f ul/Psf !@!) 3/kl/jf/dWo] ^*% 3/kl/jf/ -%& k|ltzt_ ;Fu v]tL ug]{ hldg lyof] eg] $# k|ltzt;Fu v]tLof]Uo hldg lyPg . **% -&# k|ltzt_ 3/kl/jf/;Fu 6]lnkmf]gsf] ;'ljwf -df]afOn / NofG8 nfOg b'j}_ /x]sf], *)( 3/kl/jf/ -^& k|ltzt_ ;Fu ;fOsn ePsf] / $! k|ltzt;Fu 6]lnlehg ePsf] kfOof] . sDKo'6/ ePsf eg] #=% k|ltzt dfq lyP .
Of the 1210 households enumerated in Bagwana VDC, even though all households own a minimal amount of land, only 685 (57 per cent) households own agricultural land, which means that a significant 43 per cent do not have agricultural land. A considerable 885 (73 per cent) households have telephone connectivity (which includes both mobiles and landlines), 809 households (67 per cent) have bicycles, and 41 per cent of households have televisions. Ownership of a computer is only among 3.5 per cent of the households.
lrq &M 3/kl/jf/sf] ;DklQdf :jfldTj -3/kl/jf/sf] ;+Vof_ Figure 7: Ownership of Household Assets [Number of Households])
Tele
phon
e/M
obile
Cycl
e
Agric
ultu
ral L
and
Radi
o
Mot
orcy
cle
Gas S
tove
Com
pute
r
TV
868
810
688
506
239
105 9743

19
%= k|jf;g / /]ld6\ofG; (Migration and Remittances)
k|jf;g v08df k;f{ cWoog k|ZgfjnLn] ;j]{If0f ul/Psf 3/kl/jf/sf] s'g} klg ;b:o s'g} klg ;do, w]/} jf yf]/} cjlwsf nflu st} uPsf -cfGtl/s jf afXo jf b'j}_, klxn] jf clxn] k|jf;gdf uPsf 3/kl/jf/sf] ;b:ox¿nfO{ ;"rLs[t u/]sf] lyof] . /fli6«o hgu0fgfn] k|jf;gsf nflu ^ dlxgf 3/b]lv cg'kl:yt /xg'kg]{ / uflj; aflx/ uPsf] x'g'kg]{ Joj:yf u/]sf] eP tfklg k;f{ cWoog @)!$ n] eg] o;sf] ;Ldf tf]s]sf] 5}g .
k;f{ cWoog @)!$ n] æs'g} 3/kl/jf/ h;af6 Ps hgf dfq} eP klg k|jf;df /x]sf] jf s'g} a]nf uPsf] ePdf To:tf 3/kl/jf/nfO{ k|jf;L 3/kl/jf/ eg]/ kl/eflift u/]sf] 5 .Æ !@!) 3/kl/jf/dWo] cWoogn] %)% 3/kl/jf/ -$@ k|ltzt_ nfO{ k|jf;g 3/kl/jf/ / s'n k|jf;g hg;+Vof *## -!!=$* k|ltzt_ /x]sf] kfPsf] 5 .
The migration section of the Parsa Study questionnaire started by listing the names of each family member of the surveyed household who had left the house for any amount of time and gone elsewhere (internally, externally or both), either in the past or currently. It should be noted here that Parsa Study 2014 did not place any time limit for movement away from the VDC to count as migration unlike the six months’ absence required by the national census. Parsa Study 2014, thus, defined a migrant household as a household which has/had at least one migrant at any point of time and a migrant as someone who has/had migrated away from the VDC at any point of time. Accordingly, of the total 1210 households, the study counted 505 (42 per cent) as migrant households with a total migrant population of 833 (11.48 per cent).
tflnsf ^M k|jf;L 3/kl/jf/ / hg;+Vof (Table 6: Migrant Households and Population)
Migrant Households 505Migrant Population 833*
Male 706Female 126
* There was one individual for whom information on gender was missing.

20
%=! k|jf;L / u}/k|jf;L 3/kl/jf/sf] ljt/0f (Migrant and Non-Migrant Households)
tflnsf * n] afujfgf uflj;sf] j8f cg';f/ k|jf;L hg;+VofnfO{ b]vfPsf] 5 . kl/0ffdn] ´G8} cfwfh;f] 3/w'/Laf6 s'g} g s'g} ;dodf kl/jf/sf] sDtLdf Ps hgf ;b:o k|jf;gdf uPsf] b]vfPsf] 5 . j8f g+= $ / * df %) k|ltzteGbf a9L k|jf;L 3/kl/jf/ 5 .
Table 7 looks at the state of migrant households of Bagwana VDC by ward. The results show that almost half the households have had at least one migrant at some point of time. Wards Number 4 and 8 stand out with more than 50 per cent migrant households.
tflnsf &M k|jf;gsf] cj:yf cg';f/ 3/w'/Lsf] ljt/0f (Table 7: Distribution of Households by Migration Status)
Ward Non-migrant Migrant Total Percentage of migrant households1 53 20 73 27.392 75 12 87 13.793 91 47 138 34.054 65 87 152 57.235 64 27 91 29.676 25 10 35 28.577 95 60 155 38.718 81 93 174 53.449 156 149 305 48.85
Total 705 505 1210 41.75

21
%=@ n}+lus cfwf/df k|jf;L hg;+Vof (Migrant Population by Gender)
tflnsf * n] afujfgf uflj;sf] j8f cg';f/ k|jf;L hg;+VofnfO{ b]vfPsf] 5 . k|jf;gdf n}+lus k|efj k/]sf] :ki6 b]lvPsf] 5 . k|jf;gdf hfg]x¿df k'?ifsf] dfqf a9L cyf{t\ *% k|ltzt /x]sf] 5 . uflj;af6 k|jf;gdf hfg] k'?ifx¿sf] cf};t pd]/ @@ jif{ 5 / dlxnfsf] !* jif{ 5 .
Table 8 shows the migrant population of Bagwana VDC. It is clear that migration is a gendered phenomenon wherein males comprise 85 per cent of the migrant population. The average age at first migration for males is 22 years while for females it is 18 years.
tflnsf *M k|jf;L / u}/k|jf;L 3/w'/Lsf] afF8kmfF8 (Table 8: Migrant Population by Ward)
Ward Male FemaleTotal
Number Per cent of population1 30 10 40 8.02 13 2 15 2.83 70 10 80 9.04 148 45 193 21.05 38 7 45 8.76 10 0 10 5.07 77 4 81 9.08 120 25 146 14.09 200 23 223 12.0
Total 706 126 833 12.0

22
´G8} tLgrf}yfOn] k|jf;gdf hfg'sf] k|d'v sf/0f /f]huf/L ePsf] atfP . To;kl5 lzIff / tflndsf nflu k|jf;gdf uPsf] kfOof] . w]/} sdn] dfq w]/} tna / pRr hLjg:t/sf nflu k|jf;gdf hfg'sf] d'Vo sf/0f eg]sf lyP . ToxfF /x]sf bz hgfn] eg] kfl/jfl/s bafa k|jf;gdf hfg'sf] d'Vo sf/0f ePsf] atfP .
%=# k|jf;gsf sf/0f (Reason for Migration)
Employment is found to be the main reason for migration with nearly three quarters giving this as the reason for migration, followed by education and training. Very few give the search for high salaries or a better standard of living as the principal reason for migration. There are 10 migrants who specified family pressure as the primary reason for migration.
tflnsf (M k|jf;gsf k|d'v sf/0fx? (Table 9: Primary Reason for Migration)
Reason of Migration Individual Per centEmployment 623 74.82Higher salary/Income 10 1.2Marriage 7 0.84Better standard of living 6 0.72Better infrastructural facilities 6 0.72Education/Training 112 13.49Family/Peer pressure 10 1.2Other 29 3.49Missing 30 3.49Total 833 100.0

23
afujfgf uflj;sf %! k|ltzt k|jf;Lx¿sf] klxnf] uGtJo g]kfnleq} lyof] . To;kl5sf !^÷!^ k|ltztn] eg] ef/t / dn]l;of /f]h]sf] kfOof] . pNn]vgLo hg;+Vofn] rflx+ klxnf] k|jf;g uGtJosf] ¿kdf dWok"j{sf b]zx¿nfO{ /f]h]sf] kfOof] .
%=$ k|jf;gsf] klxnf] uGtJo (First Migration Destination)
For 51 per cent of migrants from Bagwana, the first destination of migration was within Nepal, followed by India and Malaysia with 16 per cent each. A good number also reported their first migration destination to be countries in the Middle East.
lrq *M k|jf;gsf] klxnf] uGtJo (Figure 8: First Migration Destination)
Within Nepal (52.5%)
India (16.0%)
Malaysia (15.8%)
Saudi Arabia (5.7%)
Qatar (5.3%)Others (1.7%)
UAE (3.0%)
Note: 24 missing/unstated values.
24
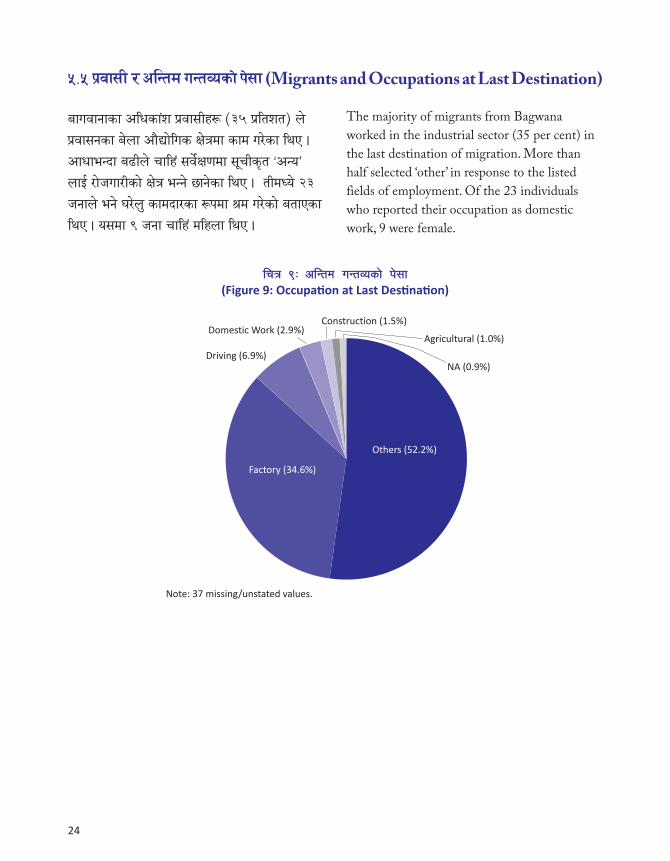
afujfgfsf clwsf+z k|jf;Lx¿ -#% k|ltzt_ n] k|jf;gsf a]nf cf}Bf]lus If]qdf sfd u/]sf lyP . cfwfeGbf a9Ln] rflx+ ;j]{If0fdf ;"rLs[t …cGoÚ nfO{ /f]huf/Lsf] If]q eGg] 5fg]sf lyP . tLdWo] @# hgfn] eg] 3/]n' sfdbf/sf ¿kdf >d u/]sf] atfPsf lyP . o;df ( hgf rflx+ dlxnf lyP .
%=% k|jf;L / clGtd uGtJosf] k];f (Migrants and Occupations at Last Destination)
The majority of migrants from Bagwana worked in the industrial sector (35 per cent) in the last destination of migration. More than half selected ‘other’ in response to the listed fields of employment. Of the 23 individuals who reported their occupation as domestic work, 9 were female.
lrq (M clGtd uGtJosf] k];f (Figure 9: Occupation at Last Destination)
Others (52.2%)
Factory (34.6%)
Driving (6.9%)
Domestic Work (2.9%)Construction (1.5%)
Agricultural (1.0%)
NA (0.9%)
Note: 37 missing/unstated values.

25
k|jf;gdf uPsf *## dWo] $&) -%^ k|ltzt_ n] /]ld6\ofG; k7fPsf lyP eg] ##! -$) k|ltzt_ n] cfˆgf] 3/kl/jf/nfO{ slxNo} klg /]ld6\ofG; k7fPgg\ . sl/a *# k|ltztn] !),)))–%),))) ?k}ofF;Dd Ps k6sdf k7fPsf lyP . !$ k|ltztn] %),)))–!,)),))) ?k}ofF / Ps hgfn] @)),))) ?k}ofFeGbf a9L /sd k|ltk6s k7fPsf lyP .
%=^ /]ld6\ofG; /sd (Remittance Amount)
Of the 833 migrants, 470 (56 per cent) sent remittances while 331 (40 per cent) never sent any money to their households. Almost 83 per cent of the remitters transferred in the range of NPR 10,000-50,000 or less in one transaction. Only 14 per cent remitted NPR 50,000-100,000; there was only one remitter who transferred more than NPR 200,000 per transaction.
tflnsf !)M /]ld6\ofG;sf] /sd (Figure 10: Amount Remitted)
Amount in NRP Number of Remitters Per cent
Less than 10,000 153 32.53
10,000-20,000 139 29.57
30,000-50,000 98 20.85
50,000-100,000 66 14.04
100,000-200,000 11 2.34
More than 200,000 1 0.21
Missing 34 7.23

26
/]ld6\ofG; k7fpg ljleGg vfnsf dfWodx¿sf] k|of]u ul/Psf] lyof] h;df $@ k|ltztn] dlg 6«fG;km/ Ph]G;Laf6 cfˆgf] kl/jf/sf nflu /sd k7fP eg] !( k|ltztn] a}+s /f]h] . pNn]vgLo dfqf -@%=)% k|ltzt_ n] /]ld6\ofG; ;fyL jf kl/lrtdfkm{t k7fPsf / !@ k|ltztn] cfkm" kms{+bf ;Fu} lnP/ cfPsf lyP .
%=& /]ld6\ofG;sf] dfWod (Channels of Remittances)
Various channels were used for remittance transfer of which 42 per cent reported money transfer agencies as the medium for sending remittances to their families, while only 19 per cent reported using banks. A significant proportion (25 per cent) sent remittances through friends or acquaintances and 12 per cent brought back money with themselves upon their return.
Others (1.1%)
Relatives (1.1%)
Money Transfer(41.8%)
Friends/Acquaintance(25.1%)
Banks (19.3)
Self (12.0%)
lrq !)M /]ld6\ofG;sf] dfWod (Figure 10: Channels of Remittances
Note: 33 missing/unstated values.

27
/]ld6\ofG; k7fPsf $&) k|jf;LdWo] #( k|ltztn] # dlxgf, !^ k|ltztn] ^ dlxgfsf] cGt/fndf / #) k|ltztn] eg] cfjZostf cg';f/ k7fPsf] kfOof] . o:tf] d'VotofM cfGtl/s k|jf;Lx¿n] u/]sf lyP .
%=* /]ld6\ofG; x:tfGt/0fsf] af/Daf/tf (Frequency of Remittance Transfers)
Of the 470 migrants who sent remittances, 39 per cent used to send money intervals of three months, 16 per cent sent it every six months, and 30 per cent sent money whenever funds were required and this was predominantly the case with internal migrants.
lrq !!M /]ld6\ofG; x:tfGt/0fsf] af/Daf/tf (Figure 11: Frequency of Remittance Transfers)
Once every three months (38.9%)
Whenever required (30.3%)
Once every six months
(16.5%)
Upon return (4.7%)
Yearly (3.8%)Others (5.8%)
Note: 32 missing/unstated values.

28
^= k|jf;gsf ;fdflhs–cfly{s k|efjx¿ (Socio-Economic Impacts of Migration)
l/kf]6{sf] o; v08df k|jf;gsf] ;fdflhs–cfly{s k|efjsf af/]df rrf{ ul/Psf] 5 . o;n] cfDbfgLsf] ;|f]tx¿, vr{ ug]{ tf}/tl/sf / :jf:Yodf lbOPsf] k|fyldstfsf ;DaGwdf ePsf tYox¿nfO{ s]nfPsf] 5 . o; v08n] k|jf;gn] kf/]sf] ;fdflhs k|efjsf af/]df klg vf]hLgLlt u/]sf] 5 .
This section of the report discusses the findings of the study with regard to the socio-economic impact of migration. It presents findings on income sources, expenditure patterns, and healthcare preferences in migrant households. This section also presents the findings on some of the social impacts of migration.
k|jf;gn] ubf{ 3/d"nLdfly 3/kl/jf/sf] lge{/tf s]xL dfqfdf 36]sf] b]lvPsf] lyof] . k|jf;gcl3 $^@ 3/kl/jf/df -(^ k|ltzt_ cfDbfgLsf] ;|f]t 3/d"nL lyP eg] k|jf;gkl5 of] $$# -*# k|ltzt_ df ´/]sf] 5 . k|jf;gkl5 aflnu ;Gtfg klg cfosf] ;|f]tsf ¿kdf -# b]lv * k|ltzt_ /x]sf] kfOof] .
Dependence on the household head as breadwinner appears to decrease slightly with the incidence of migration. A total of 462 household heads, 96 per cent, were the main source of income prior to migration, a figure that declined to 443, 87 per cent, after someone from the household had migrated. Adult children as a source of income also increased after migration, from 3 to 8 per cent.
^=! cfDbfgLsf] ;|f]tdf k|efj (Impact on Source of Income)
tflnsf !!M d'Vo cfDbfgLsf] ;|f]t -k|jf;g cl3 / kl5_ (Table 11: Primary Source of Income Pre and Post-migration)
Source of Income Pre-Migration Post-Migration
Head of household 462 443Spouse 9 14Adult children 15 39Sibling 1 1Other Household Member 8 3Interest/Investment/Loan 1 2Other Missing 0Total 505 505

29
tnsf] tflnsfn] 3/kl/jf/sf] k|jf;gcl3 / kl5sf] vr{sf] ;+/rgfnfO{ b]vfPsf] 5 . cfDbfgLsf] clwsf+z lx:;f vfBfGg, lzIff, :jf:Yo / lgdf{0fdf vr{ u/]sf] kfOof] . k|jf;gkl5 vfBfGgdf ul/g] vr{df sdL cfPsf] tyf lzIff, :jf:Yo / lgdf{0fdf vr{ a9]sf] kfOof] .
The table below lays out the expenditure patterns of migrant households before and after migration. For most households, the highest proportion of their income is spent on food, education and healthcare. After migration, the proportion spent on food went down while increases were seen in the share spent on education, health and construction.
^=@ 3/kl/jf/sf] vr{df k|efj (Impact on Household Expenditure)
tflnsf !@M k|jf;gcl3 / kl5 3/kl/jf/sf] d'Vo vr{sf] ljt/0f (Table 12: Distribution of Households by Primary Expenditure Pre- and Post-Migration)
Primary expenditurePost-Migration Pre-Migration
Number of Households Per cent Number of Households Per cent
Food items 389 77.03 422 83.56
Education 77 15.25 48 9.50
Health care 30 5.94 24 4.75
Construction 1 0.20 1 0.02
Land purchase 1 0.20 0 0.00
Repaying debts 1 0.20 0 0.00
Luxury goods 1 0.20 0 0.00
Marriage/Funeral 0 0.00 2 0.04
Other 5 0.99 4 0.79
Missing 0 0.00 4 0.79
Total 505 100.0 505 100.0

30
tnsf] lrqn] k|jf;L / u}/k|jf;L 3/kl/jf/n] :jf:Yo ;'wf/sf nflu b]vfPsf] k|j[lQdf vf;} km/s gkf/]sf] b]vfPsf] 5 . k|jf;L 3/kl/jf/sf] wfdL´fFqmLsxfF hfg] qmd eg] rf/ u'0ffn] 36]sf] kfOPsf] 5 .
The figure below shows that there has not been much difference in the health-seeking behaviour of migrant households before and after migration. There was, however, a nearly four-fold decrease among migrant households seeking the help of faith-healers.
^=# k|jf;L 3/kl/jf/sf] :jf:Yo ;]jfdf k|fyldstf (Healthcare Preferences of Migrant Households)
lrq !@M k|jf;L 3/kl/jf/sf] :jf:Yo k|fyldstf -k|jf;g cl3 / kl5_ (Figure 12: Primary Healthcare Preference Pre- and Post-Migration)
Local Pharmacy Health Post Government Hospital
Ojha/Dhami/Jhakri
Private Hospital OthersCommunity Healthcare Worker
306
241
107
131
3120 26
97
4 8 318
2 0
Post-migration Pre-migration
2 missing/unstated values pre-migration; 14 missing/unstated values post-migration.

31
k|jf;g 3/kl/jf/nfO{ 3/sf] Ps ;b:o k|jfl;t x'Fbf csf]{ ;b:on] sfd ug{ 5f8]sf] lyof] eg]/ k|Zg ul/Psf] lyof] . (^ k|ltzteGbf a9L k|jf;g 3/kl/jf/n] o:tf] gePsf] atfP . 3/kl/jf/sf] ;b:o k|jf;gdf uPkl5 kfFr hgf pQ/bftfn] dfq sfd ug{ 5f8]sf] atfP . oLdWo] b'O{n] cfly{s cfjZostf k"/f ePsf sf/0fn], csf]{ Ps hgfn] 3/sf] sfdsf] af]em ylkPsfn] / c¿ b'O{ hgfn] cGo sf/0fn] ubf{ klxn] ul//x]sf] sfd 5f8]sf] atfP .
k|jf;gn] 3/kl/jf/df csf]{ vfnsf] cfly{s k|efj klg kf/]sf] 5 . !$ k|ltzt pQ/bftfn] k|jf;gkl5 3/kl/jf/df k/]sf] cfly{s k|efj w]/} ;sf/fTds ePsf] atfPsf lyP . emG8} tLgrf}yfO pQ/bftf -@%# hgf jf &) k|ltzt_ n] clnslt jf w]/} ;sf/fTds k|efj k/]sf] atfP eg] &@ hgf -!$ k|ltzt_ s'g} k|efj gk/]sf] 7fGb5g\ .
Migrant households were asked whether the migration of a member of the household has resulted in members of the household having stopped working. More than 96 per cent of the migrant households reported that was not the case. Only five respondents reported that they had quit working because of a member’s migration of which two reported that was because the financial needs had now been fulfilled, one said that the household work burden had increased while two provided other reasons.
There are other economic impacts of migration as well. Approximately 14 per cent of the respondents think that migration of a member from the family has had a positive impact on their household. Nearly three quarters (253 or 70 per cent) think that the impact has been positive while 72 (14 per cent) believe it had had no effect.
^=$ k|jf;gn] kf/]sf] cfly{s k|efjsf] d"Nof+sg (Assessment of the Economic Impact of Migration)
lrq !#M k|jf;gsf] cfly{s k|efj :jd"Nof+sg (Figure 13: Self-Assessment of Economic Impact of Migration)
283
72 7056
5 3
16 missing/unstated values.
Slightly positively
Very positively
No effect Don't know Slightly negatively
Very negatively

32
k|jf;g 3/kl/jf/df 3/sf] ;b:o k|jfl;t x'Fbf ;fj{hlgs If]qdf dlxnfsf] ;xeflutfnfO{ k|efj kf/]sf] lyof] jf lyPg eGg] k|Zg klg ;f]lwPsf] lyof] . afujfgf uflj;df @@% -$% k|ltzt_ hgfn] ;sf/fTds pQ/ lbP eg] @^^ -%# k|ltzt_ n] s'g} kl/jt{g gePsf] atfP . Ps hgf pQ/bftfn] eg] ;xeflutfdf sdL cfPsf] hgfP .
o;}u/L @!# pQ/bftfx¿ -$@ k|ltzt_ 3/kl/jf/sf] ;b:o k|jfl;t x'Fbf 3/kl/jf/leq dlxnfsf] lg0f{o ug]{ Ifdtfdf j[l4 ePsf] 7fGb5g\ eg] @&% -%$ k|ltzt_ n] s'g} kl/jt{g gePsf] hgfPsf 5g\ .
Respondents from migrant households were also asked whether the migration of a household member had had any effect on women’s participation in the public sphere. In Bagwana VDC, 225 (45 per cent) of the migrant households reported in the positive while 266 (53 per cent) reported no change at all. Only one respondent reported reduced participation.
Similarly, 213 respondents (42 per cent) thought that migration of a household member had increased women’s decision-making within the household and 275 (54 per cent) reported no change.
^=% dlxnf ;xeflutf / lg0f{odf k|jf;gsf] k|efj (Impact of Migration on Female Participation and Decision Making)
lrq !$M k|jf;g / 3/kl/jf/df dlxnfsf] lg0f{o (Figure 14: Migration and Women’s Decision-making within Household)
No change (56%)Increase (43%)
Decreased (43%)
14 missing/unstated values.

33
3/kl/jf/sf] ;b:o k|jf;gdf /xFbf ;d'bfodf dlxnfx¿sf] ;xeflutf / lg0ff{os Ifdtfdf ;sf/fTds k|efj k/]sf] eP tfklg k|jf;gn] j[4j[4fnfO{ eg] kmfObf lbPsf] 5}g . afujfgf uflj;sf] #@ -^ k|ltzt_ pQ/bftfn] dfq k|jf;gn] j[4j[4fdf ;sf/fTds k|efj kf/]sf] atfP eg] !) -@ k|ltzt_ n] gsf/fTds k|efj k/]sf] eg] / $@$ -*$ k|ltzt_ rflx+ j[4j[4fsf] cj:yfdf s'g} kl/jt{g gcfPsf] 7fGb5g\ .
Unlike the somewhat significant positive changes in women’s participation in the community and household decision-making, elderly members of the households did not benefit much from the migration of a family member. In Bagwana VDC, only 32 (6 per cent) respondents reported that migration has had a positive impact on the elderly, 10 (2 per cent) thought it had affected them negatively, and 424 (84 per cent) believed it had had no impact.
^=^ j[4j[4fx¿df k|jf;gsf] k|efj (Impact of Migration on the Elderly Population)
lrq !%M j[4j[4fx?df k|jf;gsf] k|efj (Figure 15: Impact of Migration on Elderly Population)
No change (91%)
Positive (7%)Negative (2%)
Note: 39 missing/unstated values.

34
Endnotes
1. Mega Publication and Research Centre, Village Development Committee and Demographic Profile of Nepal 2013. Kathmandu: Mega Publication and Research Centre, 2013.
2. Parsa DDC, VDC Household Survey, 2067. Birgunj: Parsa DDC.3. A household was termed as locked if the enumerators visited three times during the enumeration and
found it locked on each occasion. These households are not included in any of the calculations.4. Sharma, Pitamber, Some Aspects of Nepal’s Social Demography: Census 2011 Update. Kathmandu: Social Science Baha and Himal Books, Kathmandu, 2014.5. The final part of a marriage ceremony performed to officially send the bride to live with the groom’s family,
which usually occurs about a couple of years after the wedding.6. ‘Illiterate’ denotes those who cannot read and write.


afujfgf;+lIfKt uflj; ljj/0f
Bagwana VDC Profile
9 789937 296649
cover Bagwana.indd 1 9/13/2015 12:10:34 PM