age and arts participation: a case against demographic … · 2013-03-21 · age and arts...
TRANSCRIPT

National Endowment for the Arts
Age and arts participation: A case against demographic destiny
Mark J. Stern University of Pennsylvania


National Endowment for the Arts
Age and arts participation: A case against demographic destiny
Mark J. Stern University of Pennsylvania
Based on the 2008 Survey of Public Participation in the Arts

Research Report #53
February 2011
National Endowment for the Arts 1100 Pennsylvania Avenue, NW Washington, DC 20506-0001 Telephone: 202-682-5400
Prepared by Mark J. Stern
Produced by the Office of Research & Analysis Sunil Iyengar, Director Sarah Sullivan, Senior Program Analyst
Other staff contributors: Tom Bradshaw, Bonnie Nichols, Ellen Grantham, Patricia Shaffer, Nona Milstead, and Michael Acton
Designed by Roman/Thayer Design Inc.
Front Cover Photo: Dartmouth College students get down with members of Young@Heart. Photo by Kawakahi Amina
Printed in the United States of America
Library of Congress Cataloging-in-Publication DataStern, Mark J. Age and arts participation : a case against demographic destiny / Mark J.Stern. p. cm. -- (Research report ; #53) “Based on the 2008 Survey of public participation in the arts.” Includes bibliographical references and indexes. 1. Arts audiences--United States. 2. Arts surveys--United States. 3. Arts--United States--Citizen participation. I. Title. II. Title: Case against demographic destiny. NX220.S74 2011 700.973’090511--dc22 2010054573
Available after February 24, 2011, in the PDF version of the report at www.arts.gov.
202-682-5496 Voice/TTY (a device for individuals who are deaf or hearing-impaired)
Individuals who do not use conventional print materials may contact the Arts Endowment’s Office for AccessAbility at 202-682-5532 to obtain this publication in an alternate format.
This publication is available free of charge at www.arts.gov, the website of the National Endowment for the Arts.

CHAIRMAN’S NOTE
“Art works.” Those two words — with their three meanings — are perhaps the simplest and clearest declaration of what we are about at the National Endowment for the Arts. They first refer to works of art themselves, to the creations of artists. They also remind us that art works on audiences, to comfort, challenge, and inspire us. And finally, they are a bold reminder of the artists and arts workers across this country who earn wages, pay taxes, and contribute toward our country’s economy.
Our 2008 Survey of Public Participation in the Arts seems to report that art is working for fewer Americans, a finding that is deeply disturbing to all of us who care about the arts in our country. It reports a 5 percentage point decline in arts participation by Americans.
But as I have been traveling across this country, those findings did not ring true with what I was seeing: young people signing on to Pandora and plugged into all manner of mp3 players; people of all ages watching Dancing with the Stars and So You Think You Can Dance; the prevalence of etsy.com and the quarter of a million military families who visited one of our 920 Blue Star Museums over 4 months this summer; the Kindles and Nooks in front of every airport passenger; Netflix and YouTube allowing all manner of film and media, past and present, to be consumed anywhere. And how about Glee?
I am witness to a voracious American appetite for the arts that does not seem to track with a decline in arts participation. Luckily, Sunil Iyengar, our director of research and analysis, had the foresight to commission a series of deeper looks at this data, and asked fellow researchers to interrogate this data about the roles that technology, arts education, age, and personal arts creation play in American arts participation.
Each of these reports individually expands and shades our understanding of the arts participation numbers. Collectively they report that one factor, above all others, is the prime indicator of arts participation — a factor not surprising to any Glee-ks:
Arts education in childhood is the most significant predictor of both arts attendance and personal arts creation throughout the rest of a person’s life.
All of us who care about the arts in this country have to care about arts education, about exposing young people, early and often, to the arts in rich, rigorous, and repeated ways. That is largely why, over the past year, we funded arts education projects in every Congressional district in America.
The reports on technology and personal creation greatly expand our institutional understanding of meaningful arts participation.
And the report on age shows that it’s not the audiences who are graying, it’s our country: the age distribution of audiences generally mirrors the adult population of the United States. Baby Boomers continue to dominate audiences, just as we did in the 1980s, when we were among the youngest audience members.
Taken together, the 2008 Survey of Public Participation in the Arts with its follow-up reports, present the most nuanced understanding of arts participation that the NEA has yet presented. I am pleased to share these reports with you, and proud of the way we are expanding our understanding of how art works in America.
Rocco Landesman Chairman National Endowment for the Arts
Photo by Michael Eastman

National Endowment for the Arts6
“I was so much older then; I’m younger than that now.”
– Bob Dylan
TABLE OF CONTENTS
11 PREFACE 15 EXECUTIVE SUMMARY 25 INTRODUCTION 27 Consumption across the life cycle 28 Civic participation
33 CHAPTER 1. BENCHMARK ARTS PARTICIPATION BY AGE AND COHORT 33 Introduction 33 Summary measures 33 Any benchmark participation 33 Number of activities 34 Events attended 34 Analysis 36 Individual activities 36 Participation rates by age 37 Participation rates by cohort 38 Audience share 42 Educational attainment and age: a confounding relationship 43 Multivariate analysis of benchmark activities 43 Number of activities and age 46 Number of activities and cohort 47 Conclusion
49 CHAPTER 2. PATTERNS OF PARTICIPATION 49 Introduction 49 Cluster analysis 50 Patterns of participation by age and cohort 52 The impact of declining omnivore behavior on total attendance 53 Conclusion
55 CHAPTER 3. LITERARY READING 55 Introduction 55 What factors are correlated with reading? 55 Education 56 Gender, race, and ethnicity 56 Age and cohort 58 Multivariate analysis
61 CHAPTER 4. MEDIA-BASED AND PERSONAL ARTS PARTICIPATION 61 Introduction 61 Overall patterns in media-based and personal arts participation 61 Media-based and personal arts participation by age and cohort 62 Conclusion
65 CHAPTER 5. CONCLUSION AND IMPLICATIONS 69 REFERENCES 73 TECHNICAL APPENDIX

LIST OF TABLES
34 Table 1: Percent of respondents who reported attending at least one event of a given type by year 35 Table 2: Distribution of respondents by birth cohort, 1982–2008 38 Table 3: Distribution of participants by age and year, benchmark arts activities 39 Table 4: Audience share by age, benchmark participants 40 Table 5: Jazz participation: audience share by age and year of survey 40 Table 6: Ballet participation: audience share by age and year of survey 41 Table 7: Classical music participation: audience share by age and year of survey 42 Table 8: Average age of benchmark arts participants, by activity and year 43 Table 9: Benchmark participation index, by year. General linear analysis 43 Table 10: Average number of activities. General linear model, summary statistics 44 Table 11: Average number of activities. General linear model (age included), summary statistics 46 Table 12: Average number of activities. General linear model (cohort included), summary statistics 50 Table 13: Distribution of U.S. adults by arts participation patterns, by survey year 56 Table 14: Percent of respondents reporting any reading, by gender, educational attainment, ethnicity, and year 58 Table 15: Percent of respondents who read any novels or short stories, poetry, or plays in the previous year.
General linear model analysis, summary statistics 62 Table 16: Media-based and personal arts participation rates by age and year 62 Table 17: Media-based and personal arts participation rates by birth cohort and year

LIST OF FIGURES
17 Figure A: Indices of arts participation by age, U.S. adults, 1982–2008 17 Figure B: Percent of U.S. adults who attended different types of events, by cohort, 1982–2008 18 Figure C: Percent of U.S. adults who attended any benchmark event, by age and birth cohort, 1982–2008 20 Figure D: Percent of U.S. adults classified as omnivores, by age and birth cohort, 1982–2008 27 Figure 1: Expenditures: Nondurables 34 Figure 2: Indices of arts participation by age, U.S. adults, 1982–2008 36 Figure 3: Number of activities attended and percent attending any benchmark events, U.S. adults,
by birth cohort, 1982–2008 36 Figure 4: Percent of U.S. adults who attended different types of events, by age, 1982–2008 37 Figure 5: Percent of U.S. adults who attended different types of events, by cohort, 1982–2008 37 Figure 6: Percent of U.S. adults who attended any benchmark event, by age and birth cohort, 1982–2008 45 Figure 7: Average number of activities attended by U.S. adults, by age, uncontrolled and controlling for
other variables, 1982–2008 45 Figure 8: Strength of relationship between age and average activities attended by U.S. adults, uncontrolled
and controlling for other variables, 1982–2008 47 Figure 9: Average number of events attended by U.S. adults, by birth cohort, uncontrolled and controlling
for other variables, 1982–2008 51 Figure 10: Percent of U.S. adults classified as omnivores, by age and birth cohort, 1982–2008 51 Figure 11: Percent of U.S. adults classified as highbrow participants, by age and birth cohort, 1982–2008 52 Figure 12: Percent of U.S. adults by type of participant and number of events attended 53 Figure 13: Average number of events attended by U.S. adults, by type of participant, 1982–2008 55 Figure 14: Percent of U.S. adults who read any novels or short stories, poetry, or plays in the previous year,
1992–2008 56 Figure 15: Percent of U.S. adults who read any novels or short stories, poetry, or plays in the previous year,
by age of respondent, 1992–2008 57 Figure 16: Percent of U.S. adults who read any novels or short stories, poetry, or plays in the previous year,
by birth cohort, 1992–2008 57 Figure 17: Percent of U.S. adults who read any novels or short stories, poetry, or plays in the previous year,
by age and birth cohort, 1982–2008

National Endowment for the Arts10

11Age and arts participation: A case against demographic destiny
PREFACE
The National Endowment for the Arts’ Survey of Public Participation in the Arts (SPPA) is the nation’s largest periodic survey of adult involvement in arts and cultural activities. For more than a quarter-century, since the survey was first conducted, researchers at the Arts Endowment have issued summary reports and key findings to the public. In addition to reporting the survey results as a whole, the NEA has made the data files available to other arts and cultural researchers for their own analyses and publications.1
The 2008 SPPA provided a fascinating glimpse into changing patterns of arts participation. Since the prior survey period of 2001–2002, rapid advances in technology had enabled more access to arts events and arts creation through portable devices and the Internet. Also, in 2007–2008, many representatives of Gen Y (or the “Millennials”) — the second largest generation since the Baby Boomers — became eligible for taking the survey.
These factors alone would have made the 2008 SPPA data an attractive prospect for researchers. But in still other ways the 2007–2008 survey year marked an aberration. For the first time since 1982, attendance rates declined for virtually all art forms captured by the survey; also for the first time, many of those declines occurred for adults 45 years or older — an age group that historically has accounted for the largest share of arts audiences.
Therefore, even before the 2008 SPPA results had been announced, the NEA posted the survey data online, to allow researchers to conduct their own analyses. The NEA also commissioned reports on five cross-cutting topics: media and technology, arts education, arts creation, age, and race and ethnicity.2
Results from the study of media, technology, and arts participation appeared in June 2010.3 For the remaining topics, the NEA was fortunate to obtain the services of four researchers or research teams already renowned for their work in characterizing trends in arts participation. Those researchers included Mark Stern, University of Pennsylvania, and separate teams at WolfBrown and the National Opinion Research Center (NORC) at the University of Chicago.
Each of these researchers has added a vitally new dimension to the NEA’s official summary of the 2008 data, as published in 2009.4 This report, one of three to become available in 2011, is a direct result of their efforts.
In their analysis, NORC researchers Nick Rabkin and Eric Hedberg test and ultimately confirm the validity of an assumption made with prior SPPA data, that participation in arts lessons and classes is the most significant predictor of arts participation later in life, even after controlling for other variables. They also show that long-term declines in Americans’ reported rates of arts learning align with a period in which arts education has been widely acknowledged as devalued in the public school system. Nor are the declines distributed equally across all racial and ethnic groups.
Working along quite different lines, Mark Stern similarly concludes that arts education is the most important known factor in influencing arts participation trends. But he is much more skeptical about the impact of other variables, especially age. Practically since the SPPA began, in 1982, there has been much talk about the “graying” of arts audiences. And while it is certainly true that the audiences
12 National Endowment for the Arts
for many art forms tracked by the SPPA are aging more rapidly than the U.S. population, Stern brings out the sobering fact that age and generational cohort differences account for less than 1 percent of the variance in the total number of arts events that Americans attended over the period of 1982–2008. Observing that arts attendance may be far less dependent on age than usually considered, he gives the lie to the notion of “demographic destiny” when it comes to arts engagement.
Based on their own analysis of the SPPA data, Jennifer Novak-Leonard and Alan Brown advance a “multi-modal” framework for understanding arts participation. Novak-Leonard and Brown challenge the orthodoxy of representing overall participation rates merely as a function of visual or performing arts attendance. They suggest that a more expansive benchmarking system — one accounting for participation across three modes (arts creation or performance; arts engagement through media; and attendance at a broader array of activities) — would produce more relevant results for arts funders, arts managers, and the general public.
The NEA’s Office of Research & Analysis already has begun to incorporate the ideas of these report-writers into its deliberations about the future of the SPPA. The authors offer three distinctive takes on a federal data source which, since 1982, has shaped much of the conversation about how arts and cultural policies and programming can engage audiences more effectively. By supporting independent research of this type, we hope to broaden the scope of that conversation.
Sunil Iyengar Director, Research & Analysis National Endowment for the Arts

13Age and arts participation: A case against demographic destiny
NOTES1 For example, see the National Endowment for the Arts website,
Supplementary Materials Related to the NEA’s 2008 Survey of Public Participation in the Arts, www.nea.gov/research/SPPA/index.html.
2 The report on race/ethnicity and arts participation is still in progress. Authored by Vincent Welch, et al. of the National Opinion Research Center (NORC), it will be made available via the NEA website in 2011.
3 This report was published in multi-media and PDF versions as Audience 2.0: How Technology Influences Arts Participation, based on research by Sameer Bawa, Kevin Williams, and William Dong, BBC Research & Consulting. Audience 2.0, Research Report #50 (Washington, DC: National Endowment for the Arts, 2010), available online, www.nea.gov/research/ResearchReports_chrono.html.
4 See 2008 Survey of Public Participation in the Arts, Research Report #49 (Washington, DC: National Endowment for the Arts, 2009), available online, www.nea.gov/research/2008-SPPA.pdf. The Executive Summary of that data appeared as Arts Participation 2008: Highlights from a National Survey (Washington, DC: National Endowment for the Arts, 2009), available online, www.nea.gov/research/NEA-SPPA-brochure.pdf.

National Endowment for the Arts14
The predictive powers of age and cohort were never particularly strong, and they declined over time.
15Age and arts participation: A case against demographic destiny
EXECUTIVE SUMMARY
INTRODUCTIONA century ago, many Americans did not know exactly how old they were, so they often would round off their age to the nearest five years, a phenomenon that demographers call “age-heaping.” As late as 1910, for example, the U.S. Census listed 24 percent more 20-year-olds than 19-year-olds. The disappearance of age-heaping and its replacement by age consciousness — an increased sensitivity to the role of age and generation on behavior — by the middle of the 20th century represents a profound change in how Americans thought about their lives and their relationship to the rest of society. Today, age consciousness has so penetrated our society that one’s membership in a particular generation or birth cohort is often offered to explain a variety of behaviors — from consumption decisions to political preferences.
Age consciousness has affected our understanding of arts participation as well. Differences in rates of arts participation of the Baby Boomers and earlier and later generations have been of particular concern. Yet we might ask: has age consciousness gotten out of hand?
Specifically, does age matter to arts participation? The answer to that question depends on who is asking it. To an arts administrator who sees the average age of her audience increase year after year, it does matter, even if what she’s noting is simply the general aging of the population. From a sociological viewpoint, however, the question can be reframed: does knowing a person’s age or year of birth allow one to more accurately predict his or her level of arts engagement?
Age and cohort have a statistically significant — but weak — relationship to different measures of arts participation. Knowing someone’s age or year of birth provides very little power in explaining his or her level of arts participation. In this specific sense, age does not seem to matter. Other influences — educational attainment and gender, in particular — have a much stronger role in explaining arts participation.
Arts participation as consumption and civic engagement
Economists have long been interested in the influence of age, cohort, and the business cycle on consumption. Empirical research has produced general agreement that the life-cycle of individuals plays an important role in explaining aggregate trends in consumption. Consumption rises through one’s twenties and thirties, peaks during one’s forties, and then declines steadily as one ages.
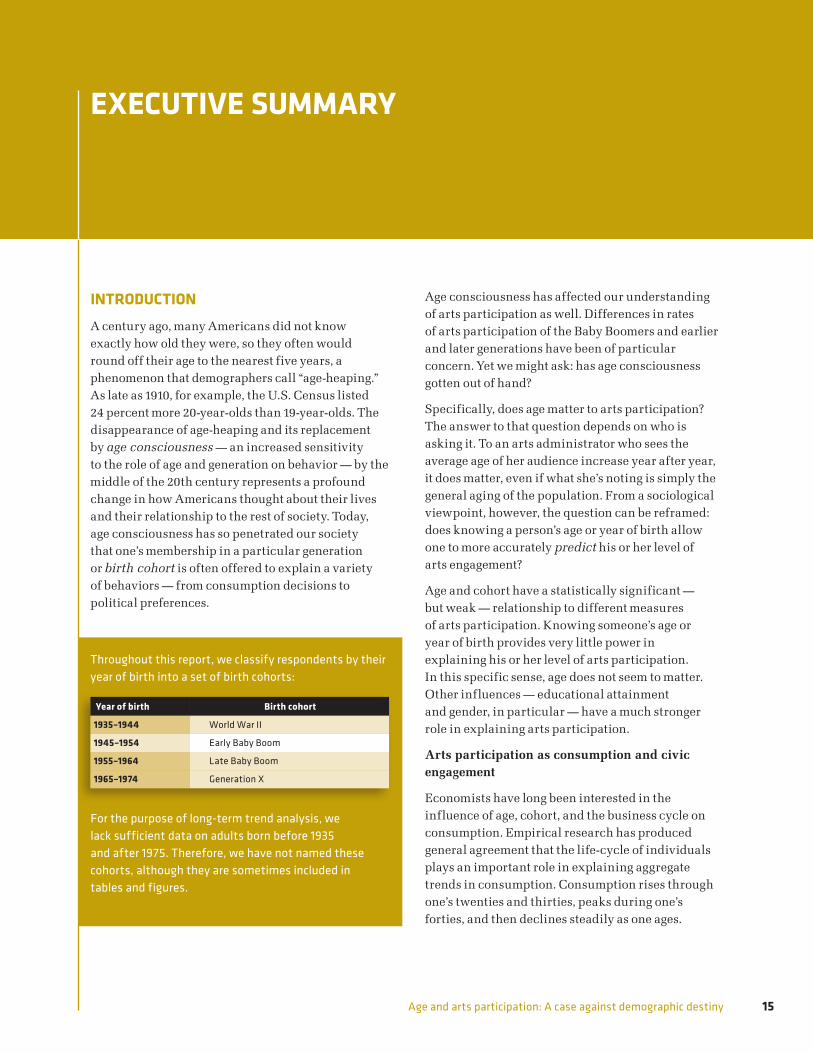
Throughout this report, we classify respondents by their year of birth into a set of birth cohorts:
Year of birth Birth cohort
1935–1944 World War II
1945–1954 Early Baby Boom
1955–1964 Late Baby Boom
1965–1974 Generation X
For the purpose of long-term trend analysis, we lack sufficient data on adults born before 1935 and after 1975. Therefore, we have not named these cohorts, although they are sometimes included in tables and figures.

16 National Endowment for the Arts
Fears about falling rates of arts participation echo a broader debate over declines in Americans’ civic engagement. Robert Putnam has argued strenuously that Americans born since the 1930s have been less involved in community life than earlier generations. Other scholars — including the authors of A New Engagement? — have sought to counter Putnam by expanding the definition of engagement. They conclude that more conventional forms of political involvement rise with age, while civic engagement in a broader sense is highest among Baby Boomers, with older and younger age-groups having somewhat lower rates.
Certainly, it would be a mistake to ignore cohort effects on civic participation, but a close examination of data from these studies suggests that the influence of age and cohort may be less important than the authors suggest.5 The same observation may hold true for arts participation, if prior NEA research offers a clue.
In 1996, the National Endowment for the Arts issued a monograph exploring the influence of age and cohort on arts participation in the United States. That report, authored by Richard A. Peterson et al., focused on the decline of arts participation among Baby Boomers, compared with the preceding generational cohort. The study uses methods similar to the present report, to correct for confounding factors. Peterson’s analysis makes clear that other variables — above all, educational attainment — have a stronger influence on arts participation than age and birth cohort.
Peterson’s more important contribution to our understanding of arts participation patterns is connected with his SPPA-based analysis of cultural omnivores. With the first SPPA in 1982, the survey has included information on the musical tastes of respondents. In 1992 Peterson and Simkus used these data to test theories of cultural capital, particularly the correlation between individuals’ occupational status and their musical tastes. While their analysis largely confirmed the theory that musical tastes were a status marker, the researchers were surprised by one finding: respondents with higher occupational status not only had higher rates of appreciation for potentially “elite” cultural forms, but they had higher rates of appreciation for middle- and lowbrow forms as well.
BENCHMARK ARTS PARTICIPATION BY AGE AND COHORT Age consciousness has led many scholars to assume that age and cohort strongly influence arts participation. Yet, as with civic engagement generally, we need to distinguish three aspects of the relationship of age, cohort, and arts participation.
■ From the standpoint of description, we may find a pattern of relationships. Average participation may go up or down for older age groups or cohorts born earlier or later.
■ In addition, because the Baby-Boom cohorts are larger than those born before or after, age has a compositional effect on the make-up of the arts audience.
■ However, we need to distinguish these issues from the predictive value of age and cohort.
When we control for other influences — especially the role of educational attainment — the predictive value of age and cohort turns out to be quite minor. Although they are statistically significant, the relationships of age and cohort to levels of arts participation are generally quite weak.
Summary measures
In order to get an overview of general trends, this report uses three measures of overall arts attendance: a dichotomous measure of any involvement in the SPPA “benchmark” activities (attendance at jazz, classical music, opera, musical plays, non-musical plays, ballet, and other dance; and visits to art museums and galleries); the number of activities that a respondent did at least once; and the totalnumber of individual events attended, inclusive of frequency. (See Figure A.)
The relationships of these three summary measures to age exhibit the same curvilinear relationship. Very young and very old respondents have lower scores than those in the middle of the age distribution. The drop-off among older respondents appears sharper for the number of events attended than for the breadth of activities attended.

17Age and arts participation: A case against demographic destiny
In aggregate, the strength of the relationships between age and these summary measures declined over time, with the most profound fall between 2002 and 2008. While this link remained statistically significant, it suggests that the predictive value of age went through a steady decline since the 1980s and that this tendency accelerated between 2002 and 2008.
Early Baby Boomers consistently had the highest rate of arts participation overall. In each of the five survey waves, 44 percent of early Baby Boomers reported attending at least one benchmark activity during the previous year. However, the differences across the four central cohorts are hardly dramatic — ranging from 44 to 41 percent.
The predictive powers of age and cohort were never particularly strong, and they declined over time. Age and cohort predicted between one and two percent of the variance in number of activities and any benchmark participation in the 1980s. By 2008, however, their predictive power had fallen to less than one percent. The predictive power of number of events never exceeded one-half of one percent.
Individual disciplines
Overall, the SPPA has tracked a precipitous decline in attendance at benchmark arts events since 1992. With the exception of attendance at musicals — which held steady — the percent of respondents who reported attending at least one event in the previous year dropped for all of the benchmark indicators.
EXEC
UTIV
E SU
MM
ARY
FIGURE AIndices of arts participation by age, U.S. adults, 1982-2008
Age
Prop
ortio
n/av
erag
e
0.0
0.2
0.4
0.6
0.8
1.0
1.2
1.4
1.6
1.8
2.0
Percent who attended any benchmark arts eventAverage number of types of activities attendedAverage number of events attended
70 and ove
r
65–6960–64
55–5950–54
45–4940–44
35–3930–34
25–29
Less th
an 25
Source: Author’s calculations from Survey of Public Participation in the Arts, 1982–2008 combined file.
FIGURE BPercent of U.S. adults who attended different types of events, by cohort, 1982–2008
Birth Cohort
Perc
ent o
f U.S
. adu
lts
0%
5%
10%
15%
20%
25%
30%
Art museumsOther dance
BalletPlaysMusicals
OperaClassicalJazz
After 19
75
Generation X
Late Baby Boom
Early Baby B
oom
World W
ar II
Before 1934
Source: Author’s calculations from Survey of Public Participation in the Arts, 1982–2008 combined file
18 National Endowment for the Arts
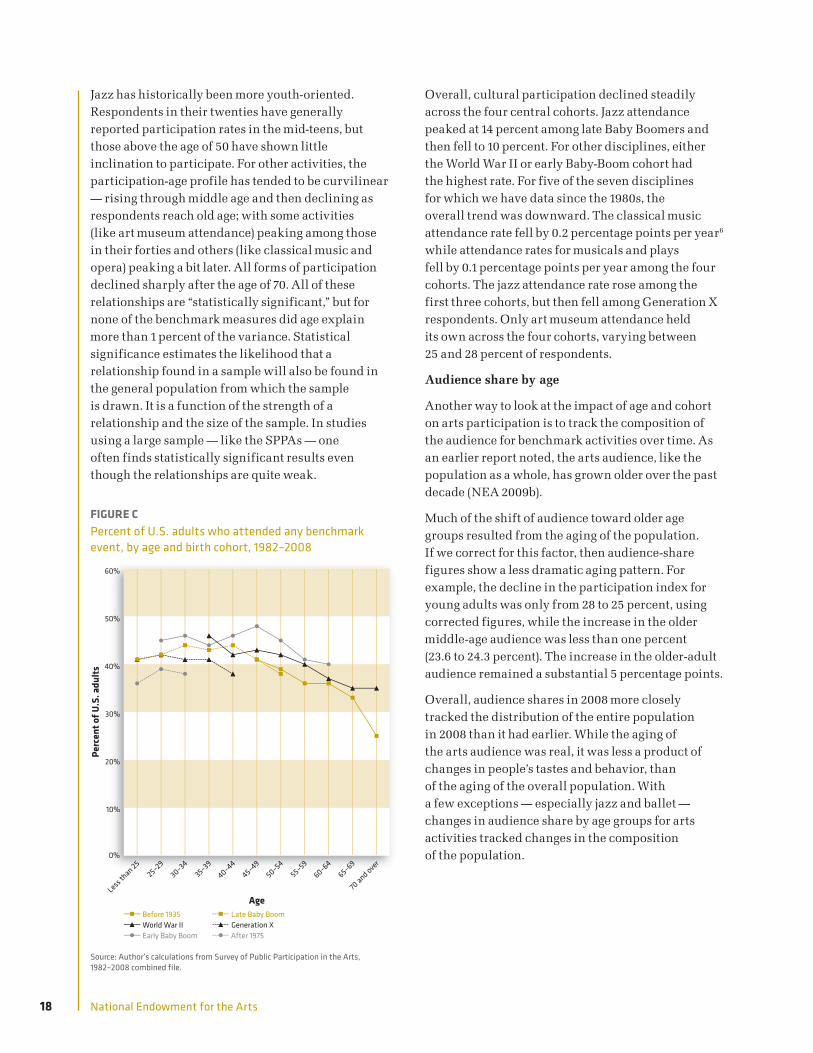
Jazz has historically been more youth-oriented. Respondents in their twenties have generally reported participation rates in the mid-teens, but those above the age of 50 have shown little inclination to participate. For other activities, the participation-age profile has tended to be curvilinear — rising through middle age and then declining as respondents reach old age; with some activities (like art museum attendance) peaking among those in their forties and others (like classical music and opera) peaking a bit later. All forms of participation declined sharply after the age of 70. All of these relationships are “statistically significant,” but for none of the benchmark measures did age explain more than 1 percent of the variance. Statistical significance estimates the likelihood that a relationship found in a sample will also be found in the general population from which the sample is drawn. It is a function of the strength of a relationship and the size of the sample. In studies using a large sample — like the SPPAs — one often finds statistically significant results even though the relationships are quite weak.
Overall, cultural participation declined steadily across the four central cohorts. Jazz attendance peaked at 14 percent among late Baby Boomers and then fell to 10 percent. For other disciplines, either the World War II or early Baby-Boom cohort had the highest rate. For five of the seven disciplines for which we have data since the 1980s, the overall trend was downward. The classical music attendance rate fell by 0.2 percentage points per year6 while attendance rates for musicals and plays fell by 0.1 percentage points per year among the four cohorts. The jazz attendance rate rose among the first three cohorts, but then fell among Generation X respondents. Only art museum attendance held its own across the four cohorts, varying between 25 and 28 percent of respondents.
Audience share by age
Another way to look at the impact of age and cohort on arts participation is to track the composition of the audience for benchmark activities over time. As an earlier report noted, the arts audience, like the population as a whole, has grown older over the past decade (NEA 2009b).
Much of the shift of audience toward older age groups resulted from the aging of the population. If we correct for this factor, then audience-share figures show a less dramatic aging pattern. For example, the decline in the participation index for young adults was only from 28 to 25 percent, using corrected figures, while the increase in the older middle-age audience was less than one percent (23.6 to 24.3 percent). The increase in the older-adult audience remained a substantial 5 percentage points.
Overall, audience shares in 2008 more closely tracked the distribution of the entire population in 2008 than it had earlier. While the aging of the arts audience was real, it was less a product of changes in people’s tastes and behavior, than of the aging of the overall population. With a few exceptions — especially jazz and ballet — changes in audience share by age groups for arts activities tracked changes in the composition of the population.
FIGURE CPercent of U.S. adults who attended any benchmark event, by age and birth cohort, 1982–2008
Age
Perc
ent o
f U.S
. adu
lts
0%
10%
20%
30%
40%
50%
60%
After 1975Generation XLate Baby Boom
Early Baby BoomWorld War IIBefore 1935
70 and ove
r65–69
60–6455–59
50–5445–49
40–4435–39
30–3425–29
Less th
an 25
Source: Author’s calculations from Survey of Public Participation in the Arts, 1982–2008 combined file.
19Age and arts participation: A case against demographic destiny
Educational attainment and age: a confounding relationship
Age has a statistically significant, but weak relationship to our summary measures of arts participation. However, we can judge the importance of this relationship only in comparison to other variables that might influence participation.
As virtually all research on participation has demonstrated, educational attainment is the strongest predictor of cultural engagement (DiMaggio and Ostrower 1992; Peterson et al. 2000). Not only is education strongly correlated with arts participation, but before 2008, it had a strong relationship with age as well. During the 1980s, individuals with less than a high school diploma and those with a graduate degree were considerably older than those with either a high school degree or some college.
Multivariate analysis allows us to answer two questions. First, does adjusting for age or cohort change our conclusions about the rapid decline in benchmark participation over time? Second, if we adjust for other factors, how strongly do age and cohort influence benchmark participation?
The year-to-year declines in the participation indices were unaffected by adjusting for cohort or age. For example, controlling for other variables, including gender, marital status, educational attainment, ethnicity, and year of survey, attendance fell by 9 percentage points between 1992 and 2008, three percentage points more than the uncontrolled figure. The decline in benchmark attendance was not the result of changes in the influence of age or cohort.
Controlling for other variables, age and cohort effects — which were already quite weak influences — grew a bit weaker. They remain statistically significant, but not strong determinants of these measures of arts participation.
PATTERNS OF PARTICIPATIONIn this section we examine how age and cohort influence patterns of participation — that is, how individuals mix and match different types of participation. In particular, we examine two patterns that have been of interest to Peterson and other researchers. One is “highbrow,” the tendency of people who are active in one high-status cultural form to be active in one or more other high-status form. The other is “omnivore.” Following Richard A. Peterson, we define omnivores as individuals who are involved in both “highbrow” and middle- or lowbrow activities. For example, an omnivore might report they they attended highbrow disciplines such as ballet and classical music, as well as lesser-status art forms such as musicals, while a highbrow would restrict his or her attendance to higher-status events like art museums, ballet, and classical music.
Admittedly, these categories are largely subjective. Yet they can shed light on the variance in arts participation rates for “benchmark” arts events tracked by the SPPA.
Approximately twice as many respondents were classified as omnivores than highbrows. Omnivore representation declined from 15 percent in 1982 to 10 percent in 2008. Highbrows represented just over 7 percent of all respondents in 1985 and 1992 and then declined to 5.3 percent in 2008.
The omnivore pattern of cultural participation is associated with distinctive age and cohort features. First, the proportion of cultural omnivores tends to decline with age. Younger adults are more likely to be omnivores than older adults. Second, omnivores are more likely to have been born between 1935 and 1954. The omnivore pattern is most associated with the World War II and early Baby-Boom cohorts than with later groups.
Highbrow participation was not as strongly associated with age. With the exception of an increase in highbrow participation among older members of the World War II cohort, the highbrow rate remained relatively flat within each cohort. Only those born after 1975 showed a distinctly lower rate of highbrow participation.
EXEC
UTIV
E SU
MM
ARY

20 National Endowment for the Arts
The impact of omnivore decline on total attendance
Omnivores represent the most active segment of the entire arts audience. They go to more types of arts activities than other groups, and they go to more individual events than others. In fact, although the omnivores represented only 13 percent of the population, they accounted for 58 percent of all events attended between 1992 and 2008.
Between 2002 and 2008, a double blow hit cultural participation. First, the proportion of the population that we characterize as omnivores — individuals who attend a variety of different cultural forms — dropped sharply. At the same time, like the rest of the population, the number of events that omnivores attended fell as well, by more than one event per respondent. Taken together, the decline of omnivores’ share of the population and their drop in average events attended represented 82 percent of the entire decline in attendance at benchmark events between 2002 and 2008.
LITERARY READINGIn this chapter we examine the variables on literary reading that have been included in the SPPA since 1992. The yes/no questions ask whether the respondent had read any novels or short stories, poetry, or plays during the previous 12 months.
Since 1992, the reading rates of Americans have declined (NEA 2004, 2007). In 1992, 52 percent of SPPA respondents reported reading a novel or short story in the previous year. Ten years later, this figure had fallen to 45 percent. Although it rose to 47 percent in 2008, the percentage was still below that for 1992 (NEA 2009b). In contrast, poetry and play reading both fell from survey to survey. The 2008 rates for these two activities were less than half what they had been in 1992.
Age and birth cohort have had a relatively minor influence on reading rates. Educational attainment, gender, and ethnicity are stronger predictors of reading. In 1992, middle-aged adults were more likely to report any reading than older adults. The highest rates were among those in their forties — at around 60 percent — while those in their twenties and sixties had rates nearer 50 percent. Rates dropped across the board in 2002, although the declines among Americans in their fifties were much smaller than for other age groups.
The World War II cohort (1935–44) had the lowest reading rate in all three years, and the early Baby Boomers had the highest. The late Baby Boomers rate, which fell from 56 percent in 1992 to 49 percent in 2008, was closer to that of the World War II cohort in all three years. This finding is consistent with age-related data from the SPPA. That data suggest that as the early Baby Boomers aged, their reading rate tended to rise, while the age group behind them — populated by the late Baby Boomers — tended to fall.
FIGURE DPercent of U.S. adults classified as omnivores, by age and birth cohort, 1982–2008
Age
Perc
ent o
f U.S
. adu
lts
0%
2%
4%
6%
8%
10%
12%
14%
16%
18%
20%
After 1975Generation XLate Baby Boom
Early Baby BoomWorld War IIBefore 1935
70 and ove
r65–69
60–6455–59
50–5445–49
40–4435–39
30–3425–29
Less th
an 25
Source: Author’s calculations from Survey of Public Participation in the Arts, 1982–2008 combined file.
Note: See text and appendix for explanation of classification procedure.

21Age and arts participation: A case against demographic destiny
MEDIA AND PERSONAL PARTICIPATIONIn this chapter we turn to two topics to fill in our portrait of participation: consumption of cultural content through media,7 and personal performance or creation of arts.8 The core conclusions of our analysis are similar to those we have reached in other aspects of this project. The most important determinants of participation within survey years are educational attainment and gender. While age and cohort in most cases have a statistically significant effect on participation, the magnitude of the effect is quite modest. Furthermore, when we control for other variables, even this apparent effect-size is reduced.
Overall, media-based arts engagement and personal performace or creation of art have experienced the same declines as live attendance since 1992. That year, 58 percent of respondents reported some media-based participation and 55 percent some form of personal participation. The proportion of respondents reporting media participation fell sharply after 1992, from 63 to 41 percent in 2008. Personal participation fell from 56 in 1992 to 44 percent in 2002 and 42 percent in 2008.
Between 1992 and 2008, neither media nor personal participation exhibited a distinctive relationship to age. Media participation was lower among those under the age of 25 and over the age of 70; for other age groups, however, it hovered between 58 and 54 percent across the three SPPA years. Personal participation exhibited a somewhat stronger relationship. It was lower among respondents in their twenties, rose to about 48 percent among age groups between 40 and 64, and then fell off slightly. Age differences explained less than one-half of one percent of the variation in arts participation rates, for both media-based and personal participation.
Cohort, too, had little influence on either media or personal participation. The youngest and oldest cohorts had the lowest rates, while the World War II and the two Baby-Boom cohorts had the highest rates. Generation X’s media and personal participation rates were about five percentage points below those of the Baby-Boom generations.
CONCLUSION AND IMPLICATIONSGiven the various dimensions of arts engagement examined in this report, it is striking how consistent the findings are. For each dimension, we discovered that age and cohort have statistically significant, but extremely modest impacts on levels of participation. Indeed, when educational attainment and gender are taken into consideration, the roles of age and cohort fade even more.
This is not to say there are no patterns related to age and cohort. It appears that, overall, Americans born between 1935 and 1954 are more likely to participate in arts-related activities than those born since 1955. The strongest relationship noted in this report tied these cohorts to the omnivore cultural pattern. The decline of omnivores is a major cause of the decline in overall arts attendance since 1992. Generally, participation is higher among middle-aged persons than among very young adults and older Americans.
The interest with age and cohort has as much to do with the future as with the past. If age and cohort are strong predictors of arts participation, it is reasoned, then we may be able to better predict the future of cultural audiences by looking at younger cohorts and examining their preferences. The life-cycle literature with its conception of life trajectory supports this line of reasoning. If younger adults get into the habit of attending events, it is hoped, they will keep this habit as they age. Viewed this way, the decline of youth interest in a number of activities — not only classical music, but also jazz — may indicate that the future of these activities is in jeopardy.
This study suggests that such reasoning is wrong on two counts. First, the power of age and cohort are limited for explaining past and current patterns of participation. Factors that explain a few thousandths of the variation in participation will hardly define the future of art in America for either good or ill.
EXEC
UTIV
E SU
MM
ARY

22 National Endowment for the Arts
More importantly, this approach underestimates how broader changes in personal life are influencing civic and arts participation. The middle of the 20th century represented the high-point of processes that standardized the life-course of individuals. After 1970, this uniformity gave way to a new diversity of personal decision-making. The transition to adult-hood became more protracted and characterized by diversity and autonomy. Models for growing old also varied; workers no longer retired in their early and mid-sixties, and the “empty nest” life-cycle stage went from an exceptional to a typical household form for older adults.
This same pursuit of flexibility and informality has influenced the art world as well. If we are correct that the cultural omnivore is in decline, it may be because the omnivore represented a transitional stage in our cultural development. After all, the omnivore concept originated with the surprise that Peterson and his collaborators experienced in discovering that the straitjacket of cultural capital, which they had expected to define musical tastes, was no longer as tight as it had been (or was presumed to have been). Cultural participants were no longer willing to let their social status define what cultural tastes were acceptable for them. Although the omnivore — as measured by the SPPA — may be foundering, this quest for a more personal, flexible, and protean approach to cultural engagement appears to be very much alive.
The findings from this study suggest that age and cohort are not destiny. The ability of established or emerging arts groups to attract participants will have less to do with the age distribution of the population than with their ability to connect to the creative aspirations of their potential audiences.
23Age and arts participation: A case against demographic destiny
NOTES 5 “The Strange Disappearance of Civic America,” Robert D.
Putnam, The American Prospect 24 (Winter 1996), 44; and A New Engagement? Political Participation, Civic Life, and the Changing American Citizen, Cliff Zukin, Scott Keeter, Molly Andolina, Krista Jenkins, and Michael X. Delli Carpini (Oxford and New York: Oxford University Press, 2006).
6 Thus, between 2002 and 2008, the proportion of U.S. adults who attended classical music performances fell by 1.2 percentage points.
7 This mode of arts participation includes engaging with art through the Internet or watching or listening to recorded or live broadcasted arts performances on TV, radio, or on the computer, including watching or listening on portable media devices such as an iPod, cell phone, or portable DVD player.
8 This includes personal arts activities such as: working with pottery, ceramics, jewelry or any leatherwork or metalwork; weaving, crocheting, quilting, needlepoint, or sewing; making photographs, movies, or video tapes as an artistic activity; painting, drawing, sculpture, or printmaking; creative writing such as stories, poems, or plays; owning original pieces of art; playing a musical instrument; performing or rehearsing jazz, classical music, or opera; singing or acting in a musical play; acting in a non-musical play; singing with a chorale, choir, or glee club; or dancing ballet or other dance such as modern, folk, tap, or Broadway-style.
EXEC
UTIV
E SU
MM
ARY

National Endowment for the Arts24
Knowing someone’s age or year of birth provides very little power in explaining his or her level of arts participation.

25Age and arts participation: A case against demographic destiny
INTRODUCTION
A century ago, many Americans did not know exactly how old they were, so they often would round off their age to the nearest five years. As late as 1910, the U.S. Census listed 24 percent more 20-year-olds than 19-year-olds — a phenomenon demographers refer to as “age-heaping.” By the middle of the 20th century, age-heaping had virtually disappeared. Age-heaping is not simply a technical data problem; its decline represented a profound change in how Americans thought about their lives and their relationship to the rest of society. Age consciousness has so penetrated our society that one’s membership in a particular generation or birth cohort — a group defined by the years in which they were born — is now often offered as an explanation of a variety of behaviors — from consumption decisions to political preferences (Katz and Stern 2006).9
The size of the Baby-Boom generations born in the 20 years after the end of World War II are largely responsible for this heightened use of “generation” as the template for understanding social change. As Baby Boomers aged, their developmental challenges became the agenda for the entire society, whether erecting new school buildings in the 1950s, accommodating labor force entrants in the 1970s, or preparing for their retirement since the 1990s (Easterlin 1978). Indeed, other cohorts have had to scramble to keep up with the Baby Boomers by defining their own identities — the “greatest generation,” Generation X, and the Millennials — in contrast to Baby Boomers.
Still, the importance of age emerges in multiple, sometimes contradictory, ways. Sociologists often see people’s lives as a developmental trajectory in which each generation follows a similar course. At the same time, we know that history — the impact of external events on behavior — can alter the trajectory of particular cohorts. For example, the Great Depression had a profound impact on the generation that came of age during the 1930s, an impact that could be observed decades later (Elder 1974). Finally, age has a compositional effect on behavior. If a particularly large generation engages in a particular activity — for example, delaying marriage or having more children — this tendency can have a disproportionate effect on overall rates.
Age consciousness has had an impact on our understanding of arts participation as well. At least since Peterson et al. (1996), trends in arts participation have been seen as a function of cohort and age. “Life-course influences,” they write, “have a direct and tangible bearing on how often individuals are able to attend live artistic performances and exhibits, and these effects vary with age.” Differences in rates of arts participation of the Baby Boomers and earlier and later generations have been of special concern.
This tendency to interpret changes in cultural participation through the lens of age and cohort continued with the early interpretations of the 2008 Survey of Public Participation in the Arts (SPPA). The first overview of the data focused on the aging of the arts audience and the decline in arts participation among both young and middle-aged adults (NEA 2009a).
26 National Endowment for the Arts
But the importance of age or cohort is an empirical question. We need to ask if demography really is destiny. Given the host of other influences on behavior, should we sustain the argument that one’s year of birth defines behavior, even partly? Indeed, there is a certain irony in the association of the Baby-Boom generation with the rise in age- consciousness. While it is true that the Baby Boomers — at a time when they had considerably less weight and more hair — called on themselves to “not trust anyone over 30,” it was this very generation that spawned an identity politics, which highlighted the role of race, ethnicity, gender, social class, and sexual orientation. Given the vast literature that supports the influence of these factors on social behavior, we may want to retain a healthy skepticism about age and birth cohort’s influences on social behavior.
Those who argue that age and cohort have a strong influence on social behavior are, to some extent, swimming against the tide. A review of life-course behavior over the 20th century leads to the conclusion that the call to “act one’s age” has lost much of its power. At mid-century, it is true, the timing of life events — such as entering the work force, getting married, or having children — became more standardized. But at least since the 1970s, that standardization has given way to a new flexibility in life events.
So, does age matter to arts participation? The answer to that question depends on who is asking it. To an arts administrator who sees the average age of her audience increase year after year, it does, even if what she’s noting is primarily the aging of the general population.
From a sociological point of view, however, the question can be reframed. We should ask if a person’s age or year of birth has an influence on decisions about arts participation. Specifically, does knowing a person’s age or year of birth allow one to better predict levels of arts engagement?
Age and cohort have a statistically significant relationship to different measures of arts participation. This report suggests, however, that those relationships are consistently quite weak. Knowing someone’s age or year of birth provides very little power in explaining his or her level of arts participation. In this specific sense, age does not seem to matter. Other influences — educational attainment and gender, in particular — have a much stronger role in explaining arts participation. In addition, while the present analysis confirms a dramatic drop in levels of arts participation over time, age and birth cohort shifts were not the cause of this decline.
Given the minor influences that age and cohort have on participation, why has so much attention been paid to them? One answer to this question is the “white bear” phenomenon in social psychology. This experimental approach to “thought suppression” asks subjects to not think about some trivial image (white bears, pink rhinoceros, etc.). Researchers find that such an instruction generally leads an increase in the subject’s attention to that image (Wegner 1989).
So it is with generation. The template of generational and age difference, which a century ago barely existed, is now so strong that we apply it to phenomena to which it has little relevance. And yet, as we become more sophisticated in our understanding of the forces that do influence arts participation, we may wish to reassess this automatic response and place age and cohort in their proper, more modest, perspective.
This report begins with a review of existing social-science literature on age and cohort. It suggests that arts participation can be seen from at least two perspectives. On the one hand, it might be seen as a consumption decision — deciding to buy a ticket to a performance or exhibition. On the other hand, it can be viewed as a form of civic engagement — a way of participating in community life. Both of these perspectives offer ways of thinking about how age influences arts participation.
27Age and arts participation: A case against demographic destiny
After the literature review, this report then examines specific forms of arts participation. It begins with an examination of the benchmark standards of arts participation that form the core of the NEA’s Survey of Public Participation in the Arts (SPPA). It then turns to patterns of participation, in particular, using Peterson’s concepts of omnivore and highbrow patterns of participation to examine SPPA data. Subsequent sections of the report focus on reading, media participation, and personal participation in the arts.
Whatever the form of participation, we conclude that age and cohort have two broad influences. The shifting size of different generations — especially the large size of the Baby-Boom generation and the smaller size of Generation X — has had an impact on the composition of arts audiences. At the same time, age and cohort have a weak impact on the likelihood that a respondent will participate in the arts.
The relationship of age to arts participation is informed by previous work in economics and sociology. For economists, arts participation is primarily a consumption decision. For sociologists, arts participation is often seen as a form of civic engagement. Existing literature on how age influences consumption and civic engagement provides a useful starting point for thinking through the relationship between age and arts participation.
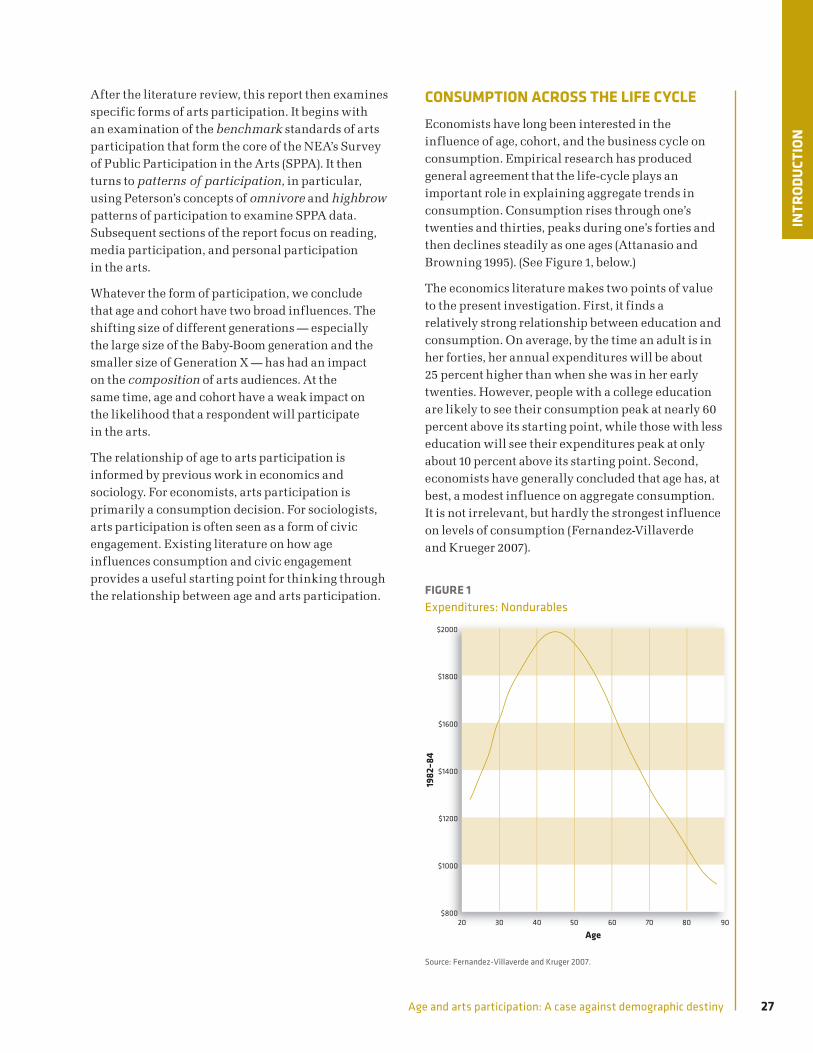
CONSUMPTION ACROSS THE LIFE CYCLEEconomists have long been interested in the influence of age, cohort, and the business cycle on consumption. Empirical research has produced general agreement that the life-cycle plays an important role in explaining aggregate trends in consumption. Consumption rises through one’s twenties and thirties, peaks during one’s forties and then declines steadily as one ages (Attanasio and Browning 1995). (See Figure 1, below.)
The economics literature makes two points of value to the present investigation. First, it finds a relatively strong relationship between education and consumption. On average, by the time an adult is in her forties, her annual expenditures will be about 25 percent higher than when she was in her early twenties. However, people with a college education are likely to see their consumption peak at nearly 60 percent above its starting point, while those with less education will see their expenditures peak at only about 10 percent above its starting point. Second, economists have generally concluded that age has, at best, a modest influence on aggregate consumption. It is not irrelevant, but hardly the strongest influence on levels of consumption (Fernandez-Villaverde and Krueger 2007).
FIGURE 1Expenditures: Nondurables
Age
1982
–84
$800
$1000
$1200
$1400
$1600
$1800
$2000
9080706050403020
Source: Fernandez-Villaverde and Kruger 2007.
INTR
ODUC
TION

28 National Endowment for the Arts
CIVIC PARTICIPATIONVirtually since Alexis de Tocqueville spotlighted the importance of civic engagement to the strength of our democracy, Americans have used levels and intensity of civic involvement as a measure of our overall social health. For much of that time, a narrative of decline has dominated this conversation. Today’s young people, it has been argued over and over again, are not as responsible and do not care as much as earlier generations.
In recent years, however, the Tocquevillian question — how an active civil society makes democracy work — has gained academic interest. Both in the United States and abroad, scholars have pointed to the importance of civil society as the foundation of prosperous and democratic social life.
No scholar is more responsible for this equation of civic health, democratic institutions, and economic prosperity than Robert Putnam. In Making Democracy Work (Putnam 1993), Putnam argued that inter-regional patterns of civic engagement in Italy were the best predictor of economic and political development over the past five centuries. He then turned to the United States where, in Bowling Alone (Putnam 2000), he argued that decline was the dominant pattern of civic participation, from 4-H clubs to the Kiwanis.
Putnam concluded that the decline in civic engagement was the result of generational shifts — a cohort effect. Using data from the General Social Survey (GSS), Putnam argued that a “long civic generation” including people born before World War II had propped up participation rates for a long time, but that as it had aged, younger birth cohorts exhibited progressively lower rates of engagement.
Putnam believes that a variety of social phenomena — civic involvement, social trust, voting, and reading newspapers — are all involved in the generational shift. The consistency of this pattern led Putnam to conclude:
By any standard, these intergenerational differences are extraordinary. Compare, for example, the generation born in the early 1920s with the generation of their grandchildren born in the late 1960s. Controlling for educational disparities, members of the generation born in the 1920s belong to almost twice as many civic associations as those born in the late 1960s (roughly 1.9 memberships per capita, compared to roughly 1.1 memberships per capita). The grandparents are more than twice as likely to trust other people (50–60 percent compared with 25 percent for the grandchildren). They vote at nearly double the rate of the most recent cohorts (roughly 75 percent compared with 40–45 percent), and they read newspapers almost three times as often (70–80 percent read a paper daily compared with 25–30 percent). And bear in mind that we have found no evidence that the youngest generation will come to match their grandparents’ higher levels of civic engagement as they grow older (Putnam 1996: 44).
Zukin et al. (2006) sought to counter Putnam in their study of civic engagement by widening the forms of civic involvement examined. Their study focused on four cohorts: Dutifuls (people born before the end of World War II); Boomers (born between 1945 and 1964); GenXers (born between 1965 and 1976); and DotNets (born after 1976). Based on the National Civic Engagement Survey 1, conducted in 2002, the authors examined four dimensions of engagement — electoral engagement, political voice, cognitive engagement, and civic engagement.10 They concluded that more conventional forms of political involvement rose with age, while civic engagement — the form most relevant for this study — was highest among Baby Boomers, with older and younger groups having somewhat lower rates.
29Age and arts participation: A case against demographic destiny
The authors concluded that among the oldest age group, nearly a third of respondents were “political specialists,” meaning they were politically, but not civically, involved. Younger age groups — GenXers and DotNeters — had higher numbers of “civic specialists,” but fewer who were both politically and civically involved. Although the authors argued that “simple claims that today’s youth...are apathetic and disengaged from civic life are simply wrong,” their data shows a much higher number of totally disengaged respondents among the young than among older groups (Zukin et al, 2006: 189).
Putnam and Zukin et al. take opposing views of the narrative of civic decline, but they agree that generations matter. It is curious, however, that in both cases, the authors did not report standard summary statistics to support their contention that cohort or age is an important determinant of participation. A re-analysis of their data, moreover, demonstrates that age and cohort’s influences on participation are much more modest that the authors’ assertions would suggest.
Do the data support Putnam’s assertion that cohort differences are “extraordinary”?11 A multivariate analysis supports Putnam’s assertion that, after education, cohort had the largest impact on memberships, but the magnitudes of the two types of impact are quite different. In fact, educational attainment had a partial eta-square of 0.12, indicating that educational attainment “explains” 12 percent of the variance in group memberships. Cohort’s partial eta-square was 0.007, about one-seventeenth as strong as education.12
This re-analysis of the GSS data parallels our analysis of the SPPA in a number of important ways. First, educational attainment is by far the most important influence on participation. Second, age and cohort have statistically significant influences on participation. Finally, although statistically significant, age and birth cohorts’ influences are decidedly modest. “Extraordinary” is ultimately in the eyes of the beholder, but a reasonable person might conclude that a more modest characterization is in order.
The National Civic Engagement Survey on which Zukin et al. based their conclusions was a single survey, so it is impossible to differentiate age and birth cohort effects. Still, as with Putnam, a secondary analysis of the data suggests that age had relatively modest explanatory power.13 The respondent’s age/cohort explained 1 percent of variance in the scale when controlling for education. For the sake of comparison, the explanatory power of educational attainment was 8 percent in the same analysis.
Indeed, variation in participation by education within generational categories tended to dwarf the generation differences, except among the very youngest respondents (many of whom may still finish a college degree). For example, on a 4-point civic engagement scale, among Boomers, the college-educated had an average score of 1.9, high-school graduates a score of 0.9, and those without a high-school degree, a score of 0.5. The range of generational scores — from 0.9 among the older respondents to 1.3 among Boomers — was much smaller.14
These two studies of civic participation have important lessons for the study of arts participation. The same forces that shape civic engagement influence arts participation. In particular, the dominant role of educational attainment in both forms of participation frames the far more modest influence of age and cohort. The most important lesson to draw from this analysis is to resist the reflex to see social differences through a generational lens. It would be a mistake to ignore cohort’s influences on participation, but at the same time, to view it as dominant hardly seems justified. Yet, as these important studies suggest, the generational narrative is difficult to resist.
INTR
ODUC
TION
30 National Endowment for the Arts
This same tendency is apparent in a previous full monograph devoted to the influence of age and cohort on arts participation in the United States — a 1996 study for the National Endowment for the Arts.15 Authored by Richard A. Peterson et al., the report focused on the decline of arts participation among Baby Boomers compared to the cohort before them. It uses methods similar to the present study, to correct for confounding influence. The analysis makes it clear that other variables — above all, educational attainment — influence rates of cultural participation more than one’s generational identity. The report was important in establishing the waning involvement in many art forms by younger respondents, a pattern that was obscured to some extent by the bulge of middle-aged participants because of the Baby Boom.
Peterson’s more important contribution to our understanding of patterns of arts participation is associated with his analysis of cultural omnivores. Since the first SPPA in 1982, the survey has included information on the musical tastes of respondents. In 1992, Peterson and Simkus used these data to test theories of cultural capital, particularly the correlation between individuals’ occupational status and their musical tastes. While their analysis largely confirmed the theory that musical tastes are a status-marker, the researchers were surprised by one finding: respondents with higher occupational status not only had higher rates of appreciation for the cultural forms that the researchers termed “elite,” but those respondents had higher rates of appreciation for “middle-“ and “lowbrow” forms as well.
These findings led Peterson to articulate the theory of the cultural omnivore:
In effect, elite taste is no longer defined simply as the expressed appreciation of the high art forms and a corresponding moral disdain of, or patronizing tolerance for, all other aesthetic expressions. Insofar as this view is correct, the aesthetics of elite status are being redefined as the appreciation of all distinctive leisure activities and creative forms along with the appreciation of the classic fine arts. Because status is gained by knowing about, and participating in (that is to say, by consuming) many if not all forms, the term ‘omnivore’ seems appropriate for those at the top of the emerging status hierarchy (Peterson 1992: 252).
One consequence of the omnivore thesis is to suggest that in making sense of arts participation, we should examine both rates of participation and patterns of participation as well. The variety of activities in which individuals choose to engage may be as important as the number of performances or exhibits they attend. As we shall see, these patterns of participation are associated with distinctive age and cohort influences.
31Age and arts participation: A case against demographic destiny
NOTES9 Throughout this report, the terms cohort and birth cohort are
used interchangeably.
10 Zukin and his collaborators differentiate four types of engagement. Civic engagement focuses on an involvement in community affairs, including: working on community problems; volunteering; group membership; and fundraising for charities. Political engagement refers to traditional political activities such as voting; persuading others; displaying buttons, signs, and stickers; making campaign contributions; and volunteering on a political campaign. Public voice — taking public stands on issues — includes: contacting officials; contacting the print or broadcast media; and participating in political demonstrations, petition drives, and boycotts, or canvassing for a social group. Finally, cognitive engagement refers to an intellectual involvement with issues, including: tracking public policy issues in the news; talking with friends and family members about political issues; knowledge of politics; and attention to the news media. A New Engagement? Zukin et al., 57–58.
11 The source of Putnam’s measure of civic engagement is a series of data on organizational memberships that has been collected by the General Social Survey (GSS) since the 1970s. “Strange Disappearance” Putnam, 34-48. The GSS asked whether respondents were members of 16 different categories of organizations ranging from professional associations and unions to hobby clubs to veterans’ groups. Putnam used a summary measure that counts the number of types of memberships as his core indicator of participation.
Of the 16 different types of organizations, only five actually recorded declines between the 1970s and the first decade of this century: labor unions, fraternal organizations, church membership, veterans’ groups, and farm organizations. Over the same period, several types of memberships, including professional associations, literary groups, hobby groups, and school and youth organizations, recorded relatively healthy increases.
Of the groups recording declines, four account for the bulk of the decline in participation. The decline in membership in religious organizations alone accounted for more than 40 percent of the decline in overall membership. Because church membership was so common (more than half of respondents), the modest drop in participation — from 54 percent in the 1970s to 51 percent in the 2000s — had a large impact on the overall indicator. The drop in two other forms of participation — farm organizations (from 6 to 4 percent) and labor unions (23 to 19 percent) — represent large structural changes in the economy, rather than the disappearance of civic America. Along similar lines, the decline in veterans’ organizations is primarily a result of the impact of a declining number of World War II veterans. These four types of participation — church, farm, labor unions, and veterans — represent nearly 100 percent of the decline in the summary measure. So the overall decline in civic participation comes down to drops in religious affiliation, shifts in the economy, and the shrinking number of active World War II veterans.
12 See the Technical Appendix for an explanation of the summary statistics. Another way of estimating the explanatory power of a variable in a multivariate analysis is to remove the factor and calculate how much power the model loses as a result. This is typically measured by the drop in R-square — the total variance in the dependent variable explained by the model. Surprisingly, when cohort is removed from the GLM, the adjusted R-square remains unchanged at .131. By this measure, cohort had no unique explanatory value in the model.
13 Using a four-category profile-of-engagement variable, the chi-square showed a statistically significant relationship between respondents’ type of engagement and generation. However, the lambda with one’s civic engagement type as dependent was .000, indicating that age/cohort did not improve one’s ability to identify a person’s participation profile.
14 Certainly, age/cohort has a modest influence on civic engagement. It is striking, however, given educational attainment’s far stronger statistical association with the indicator, that Zukin et al. use generation as their major lens for analyzing the data and give little attention the role of educational attainment. A NEA Research Note on civic engagement and the arts does note that education is a particularly strong predictor of volunteering. Art-Goers in Their Communities: Patterns of Civic and Social Engagement, NEA Research Note #98 (Washington, D.C.: National Endowment for the Arts, 2009), 13.
15 Peterson et al. conducted a study of age and arts participation using the 1997 survey. Their study reported summary statistics from a multivariate analysis: Age and Arts Participation: 1982–1997, Richard A. Peterson, Pamela C. Hull, and Roger M. Kern, NEA Research Report #42 (Santa Ana, CA: Seven Locks Press, 2000). However, because the 1997 survey used a different method from previous and later surveys, and arguably led to inflated participation rates, we have followed previous scholars in not incorporating the 1997 results into this report.
INTR
ODUC
TION

National Endowment for the Arts32
Overall, audience shares in 2008 more closely tracked the distribution of the entire U.S. population than it had in previous years.

33Age and arts participation: A case against demographic destiny
CHAPTER 1
BENCHMARK ARTS PARTICIPATION BY AGE AND COHORT
INTRODUCTIONAge consciousness has led many scholars to assume that age and cohort strongly influence arts participation. Yet, as with civic engagement generally, we need to distinguish three aspects of the relationship of age, cohort, and arts participation. From the standpoint of description, we may find a pattern of relationships. Average participation may go up or down for older age groups or cohorts born earlier or later. In addition, because the Baby-Boom cohorts are larger than those born before or later, age has a compositional effect on the make-up of the arts audience. Finally, we need to distinguish the predictive value of age and cohort. From this perspective, the question is: to what extent does knowing people’s age or year of birth allow one to estimate their level of arts participation?
As we have seen, in the civic engagement literature, interest in the descriptive value of age and cohort effects has often obscured their limited predictive value. And yet, if we are to attribute some causal importance to age and cohort — that is, if we are to argue that age or cohort influences people’s behavior, we need to demonstrate their power to predict participation and how such power compares with that of other variables. When we control for other influences — especially the role of educational attainment — the predictive value of age and cohort turns out to be quite minor. Although they are statistically significant, the relationships of age and cohort to levels of arts participation are weak.
SUMMARY MEASURESTo provide an overview of general trends, this report uses three measures of overall participation: a dichotomous measure of any involvement in the benchmark activities; the number of activities in which a respondent was involved; and the number of individual events attended.
The SPPA’s “benchmark” questions focus on eight specific forms of arts participation: attendance at jazz, classical music, opera, musical plays, non-musical plays, ballet, other dance; and visits to art museums or galleries. For each of these activities, the survey asks whether the respondent had participated in the previous 12 months.16
Any benchmark participation
The simplest measure of participation is a yes/no variable based on any reported benchmark activity. This measure showed no particular trend between 1982 and 2002, but then fell sharply from 40 percent in 2002 to 36 percent in 2008. See Technical Appendix for additional details. (See Table 1, page 34.)
Number of activities
Another measure of overall arts engagement is the number of different activities in which one participated during the survey year. This score was computed by assigning one point to each case for each different type of arts activity in which the respondent reported participating. We analyzed data

34 National Endowment for the Arts
for nine activities (attendance at jazz, salsa music, classical music, opera, musical plays, non-musical plays, ballet, other dance; and visits to art museums) although “other dance” was not included in the survey until 1992 and “salsa and Latin music” were not included until 2008. See Technical Appendix for additional details.
Events attended
The final summary measure included the total number of times the respondent reported attending events. This measure used total events attended for the nine benchmark activities. The data for this measure, however, were first collected in 1992. The average number of events attended fell from 2.6 in 1992 to 2.5 in 2002 and then plunged to 2.0 in 2008. More information is available in the Technical Appendix.
Analysis
AgeThese three summary measures for age exhibit the same curvilinear relationship. Very young and very old respondents have lower scores than those in the middle of the age distribution. (See Figure 2, below.)
The strength of the relationships between age and these summary measures declined over time, with the most profound decline between 2002 and 2008.17 Although this measure remained statistically significant, the predictive value of age went through a steady decline since the 1980s, and its explanatory power continued to decline between 2002 and 2008.
Birth cohortsFor this analysis, we classify respondents into six cohorts based on their year of birth — before 1935, 1935–44, 1945–1954, 1955–1964, 1965–1974, and 1975 and beyond. We identify the four middle cohorts as World War II, early Baby Boom, late Baby Boom, and Generation X.18
TABLE 1Percent of respondents who reported attending at least one event of a given type by year
1982 1985 1992 2002 2008
Jazz 10.0% 10.0% 11.0% 11.0% 8.0%
Classical 13.0% 13.0% 12.0% 12.0% 9.0%
Opera 3.0% 3.0% 3.0% 3.0% 2.0%
Musicals 19.0% 17.0% 17.0% 17.0% 17.0%
Plays 12.0% 12.0% 13.0% 12.0% 9.0%
Ballet 4.0% 4.0% 5.0% 4.0% 3.0%
Other dance 7.0% 6.0% 5.0%
Visit art museum 22.0% 22.0% 27.0% 26.0% 23.0%
Types of activities (mean) 0.8 0.8 1.0 0.9 0.8
Average number of events 2.6 2.5 2.0
Any benchmark participation 39.2% 37.6% 42.4% 40.3% 36.2%
Source: Author’s calculations from Survey of Public Participation in the Arts, 1982–2008 combined file.
FIGURE 2Indices of arts participation by age, U.S. adults, 1982–2008
Age
Prop
ortio
n/av
erag
e
0.0
0.2
0.4
0.6
0.8
1.0
1.2
1.4
1.6
1.8
2.0
Percent who attended any benchmark arts eventAverage number of types of activities attendedAverage number of events attended
70 and ove
r
65–6960–64
55–5950–54
45–4940–44
35–3930–34
25–29
Less th
an 25
Source: Author’s calculations from Survey of Public Participation in the Arts, 1982–2008 combined file.

35Age and arts participation: A case against demographic destiny
As expected, the early and late Baby-Boom cohorts are larger than the World War II and Generation X cohorts. The two Baby-Boom cohorts together represent 41 percent of all respondents to the five SPPAs, while the World War II and Generation X cohorts include only 25 percent of all respondents. (See Table 2, below.)
The raw data on the relationship of cohort to arts participation indicates that the early Baby-Boom cohort had the highest rate of cultural participation overall. Forty-four percent of early Boomers reported attending at least one benchmark activity during the previous year. Nevertheless, the difference between different cohorts was relatively small. (See Figure 3, page 36.)
The predictive powers of age and cohort were never particularly strong and declined over time. Age and cohort predicted between 1 and 2 percent of any benchmark participation in the 1980s, and the variance in the number of those activities; but, by 2008, their predictive power had fallen to less than 1 percent. The predictive power of number of events never exceeded one-half of 1 percent.
These summary measures underline the key findings of this report. Certainly, age mattered as a descriptive feature of arts participation. Age groups and cohorts had different levels of participation and some of these differences persisted over time. Yet from a statistical viewpoint the relationship of age and cohort to arts participation was always quite weak and, beginning at a low level, appears to have declined even further by the first decade of the twenty-first century.
CHAP
TER
1
TABLE 2Distribution of respondents by birth cohort, 1982–2008
1982 1985 1992 2002 2008 Total
Before 1934 38.4% 33.8% 24.2% 13.1% 8.3% 22.9%
World War II 15.1 14.7 13.5 11.0 9.2 12.5
Early Baby Boom 21.5 20.4 19.6 17.2 15.4 18.7
Late Baby Boom 25.0 24.8 23.6 21.7 19.9 22.8
Generation X 0.0 6.3 19.1 18.9 18.3 12.5
After 1975 0.0 0.0 0.0 18.1 28.8 10.6
Total 100.0% 100.0% 100.0% 100.0% 100.0% 100.0%
Source: Author’s calculations from Survey of Public Participation in the Arts, 1982–2008 combined file.
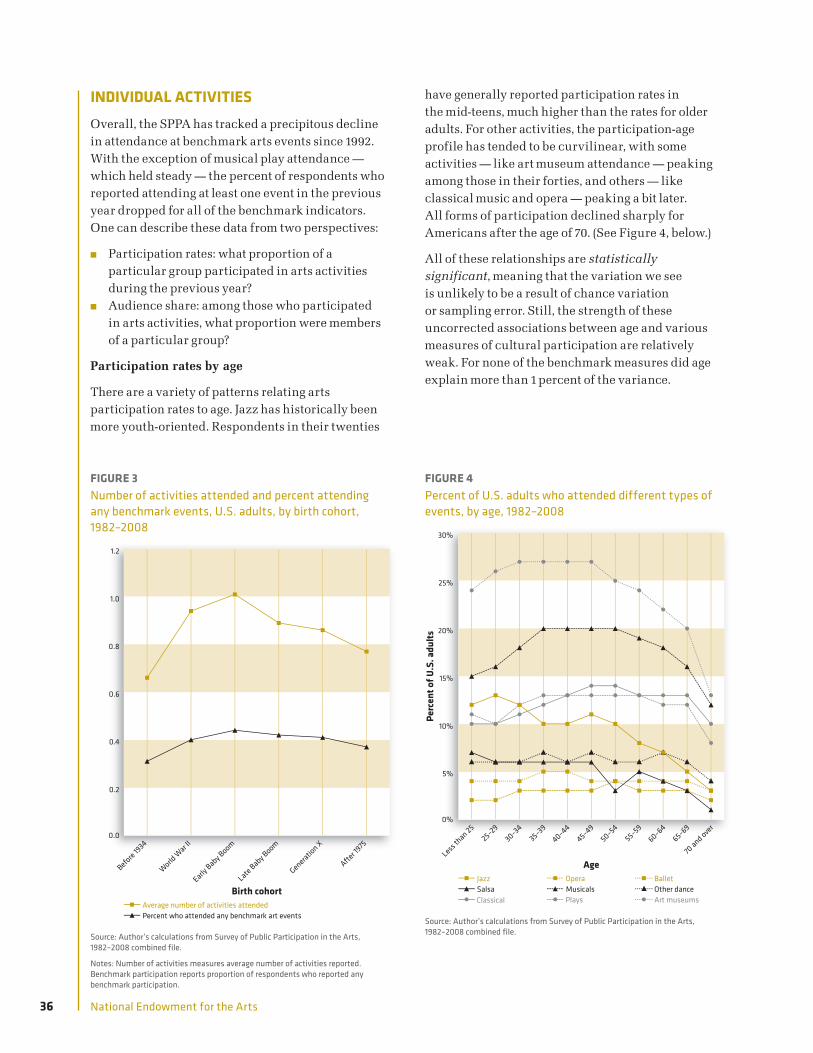
36 National Endowment for the Arts
INDIVIDUAL ACTIVITIESOverall, the SPPA has tracked a precipitous decline in attendance at benchmark arts events since 1992. With the exception of musical play attendance — which held steady — the percent of respondents who reported attending at least one event in the previous year dropped for all of the benchmark indicators. One can describe these data from two perspectives:
■ Participation rates: what proportion of a particular group participated in arts activities during the previous year?
■ Audience share: among those who participated in arts activities, what proportion were members of a particular group?
Participation rates by age
There are a variety of patterns relating arts participation rates to age. Jazz has historically been more youth-oriented. Respondents in their twenties
have generally reported participation rates in the mid-teens, much higher than the rates for older adults. For other activities, the participation-age profile has tended to be curvilinear, with some activities — like art museum attendance — peaking among those in their forties, and others — like classical music and opera — peaking a bit later. All forms of participation declined sharply for Americans after the age of 70. (See Figure 4, below.)
All of these relationships are statistically significant, meaning that the variation we see is unlikely to be a result of chance variation or sampling error. Still, the strength of these uncorrected associations between age and various measures of cultural participation are relatively weak. For none of the benchmark measures did age explain more than 1 percent of the variance.
FIGURE 3Number of activities attended and percent attending any benchmark events, U.S. adults, by birth cohort, 1982–2008
Birth cohort
0.0
0.2
0.4
0.6
0.8
1.0
1.2
Percent who attended any benchmark art eventsAverage number of activities attended
After 19
75
Generation X
Late Baby Boom
Early Baby B
oom
World W
ar II
Before 1934
Source: Author’s calculations from Survey of Public Participation in the Arts, 1982–2008 combined file.
Notes: Number of activities measures average number of activities reported. Benchmark participation reports proportion of respondents who reported any benchmark participation.
FIGURE 4Percent of U.S. adults who attended different types of events, by age, 1982–2008
Age
Perc
ent o
f U.S
. adu
lts
0%
5%
10%
15%
20%
25%
30%
Art museumsOther danceBallet
PlaysMusicalsOpera
ClassicalSalsaJazz
70 and ove
r65–69
60–6455–59
50–5445–49
40–4435–39
30–3425–29
Less th
an 25
Source: Author’s calculations from Survey of Public Participation in the Arts, 1982–2008 combined file.

37Age and arts participation: A case against demographic destiny
Participation rates by cohort
Overall, cultural participation declined steadily across the four central cohorts. Jazz attendance peaked at 14 percent among late Baby Boomers and then fell to 10 percent. For other activities, either the World War II or early Baby-Boom cohort had the highest rate. For five of the seven activities for which we have data since the 1980s, the overall trend was downward. The classical music attendance rate fell by 0.2 percent per year while musical and non-musical play attendance rates fell by 0.1 percent per year for the four cohorts. The jazz attendance rate rose among the first three cohorts, but then fell for Generation X respondents. Only art museum attendance held its own across the four cohorts, varying from 25 to 28 percent of respondents. (See Figure 5, below.)
Age and cohortBecause the SPPA provides data over a 26-year period, we are unable to calculate participation across any cohort’s entire life cycle. For the older cohorts, we lack data on their behavior as young adults. Younger cohorts are still in their young-adult years. Therefore, it is useful to examine cohort differences within particular age groups.
Here we examine just one measure — whether a respondent reported any benchmark participation in the previous year. These data confirm our previous assessment that the World War II cohort and the early Baby-Boom cohort exhibited the highest rates of cultural participation. The late Baby-Boom cohort’s rates were generally quite close to those of the two preceding cohorts. Of the four central cohorts, only Generation X had rates that were distinctly lower. This general appraisal is confirmed by summary statistics suggesting that within no age group did cohort differences account for even one-half of 1 percent of the variance. (See Figure 6, below.)
FIGURE 5Percent of U.S. adults who attended different types of events, by cohort, 1982–2008
Birth Cohort
Perc
ent o
f U.S
. adu
lts
0%
5%
10%
15%
20%
25%
30%
Art museumsOther dance
BalletPlaysMusicals
OperaClassicalJazz
After 19
75
Generation X
Late Baby Boom
Early Baby B
oom
World W
ar II
Before 1934
Source: Author’s calculations from Survey of Public Participation in the Arts, 1982–2008 combined file.
FIGURE 6Percent of U.S. adults who attended any benchmark event, by age and birth cohort, 1982–2008
Age
Perc
ent o
f U.S
. adu
lts
0%
10%
20%
30%
40%
50%
60%
After 1975Generation XLate Baby Boom
Early Baby BoomWorld War IIBefore 1935
70 and ove
r65–69
60–6455–59
50–5445–49
40–4435–39
30–3425–29
Less th
an 25
Source: Author’s calculations from Survey of Public Participation in the Arts, 1982–2008 combined file.
CHAP
TER
1

38 National Endowment for the Arts
Audience share
Another way to look at the impact of age and cohort on arts participation is to track the composition of the audience for benchmark activities over time. As an earlier report noted, the arts audience, like the population as a whole, has grown older over the past decade (NEA 2009a).
Certainly, the overall trend has been toward the aging of audiences for virtually all arts activities. Jazz is the most dramatic example. In 1982, two-thirds of its audience was under the age of 35; by 2008, the fraction had slipped to three-tenths.
Ballet, too, experienced a sharp aging of its audience; young adults fell from 43 to 25 percent of ballet audience members between the 1982 and 2008 SPPAs. (See Table 3, below.)
In order to use data from all five surveys — instead of just the start and end points — we calculated the trend line for each activity and the annual decline in audience share. Among younger adults, the jazz audience fell by 1.5 percent per year, while those for classical music, plays, and ballet fell by 0.6, 0.5 and 0.8 percent, respectively. Over the 26 years of the SPPA, these figures translate into a 39 percentage-point decline for jazz and a 21 percentage-point decline for ballet.
TABLE 3Distribution of participants by age and year, benchmark arts activities
Activity Age 1982 1985 1992 2002 2008
Jazz Under 35 67.0% 59.9% 42.8% 30.7% 29.2%
35-59 27.5 33.1 45.3 56.4 53.2
60 and over 5.5 7.1 11.9 12.9 17.5
Total 100.0% 100.0% 100.0% 100.0% 100.0%
Classical Under 35 38.2% 35.8% 29.2% 22.9% 22.8%
35-59 43.9 43.0 48.8 55.0 49.5
60 and over 17.9 21.2 22.0 22.1 27.7
Total 100.0% 100.0% 100.0% 100.0% 100.0%
Opera Under 35 31.7% 30.0% 29.7% 25.3% 21.2%
35-59 46.8 49.3 47.8 52.3 50.8
60 and over 21.6 20.7 22.5 22.4 28.1
Total 100.0% 100.0% 100.0% 100.0% 100.0%
Musicals Under 35 40.5% 37.7% 32.8% 27.4% 28.0%
35-59 43.6 44.6 47.9 54.2 50.4
60 and over 15.9 17.7 19.3 18.4 21.6
Total 100.0% 100.0% 100.0% 100.0% 100.0%
Plays Under 35 39.6% 39.0% 33.3% 27.6% 28.4%
35-59 44.2 42.9 47.8 54.8 46.8
60 and over 16.2 18.1 18.9 17.6 24.7
Total 100.0% 100.0% 100.0% 100.0% 100.0%
Ballet Under 35 43.4% 42.7% 38.4% 25.0% 24.9%
35-59 42.0 41.0 44.5 58.6 50.3
60 and over 14.6 16.4 17.1 16.4 24.9
Total 100.0% 100.0% 100.0% 100.0% 100.0%
Other dance Under 35 37.2% 29.5% 29.9%
35-59 43.7 55.1 46.1
60 and over 19.1 15.4 24.0
Total 100.0% 100.0% 100.0%
Art museum Under 35 46.1% 43.6% 39.1% 29.8% 31.7%
35-59 40.4 41.2 45.3 53.9 50.0
60 and over 13.5 15.2 15.5 16.4 18.3
Total 100.0% 100.0% 100.0% 100.0% 100.0%
Source: Author’s calculations from Survey of Public Participation in the Arts, 1982–2008 combined file.
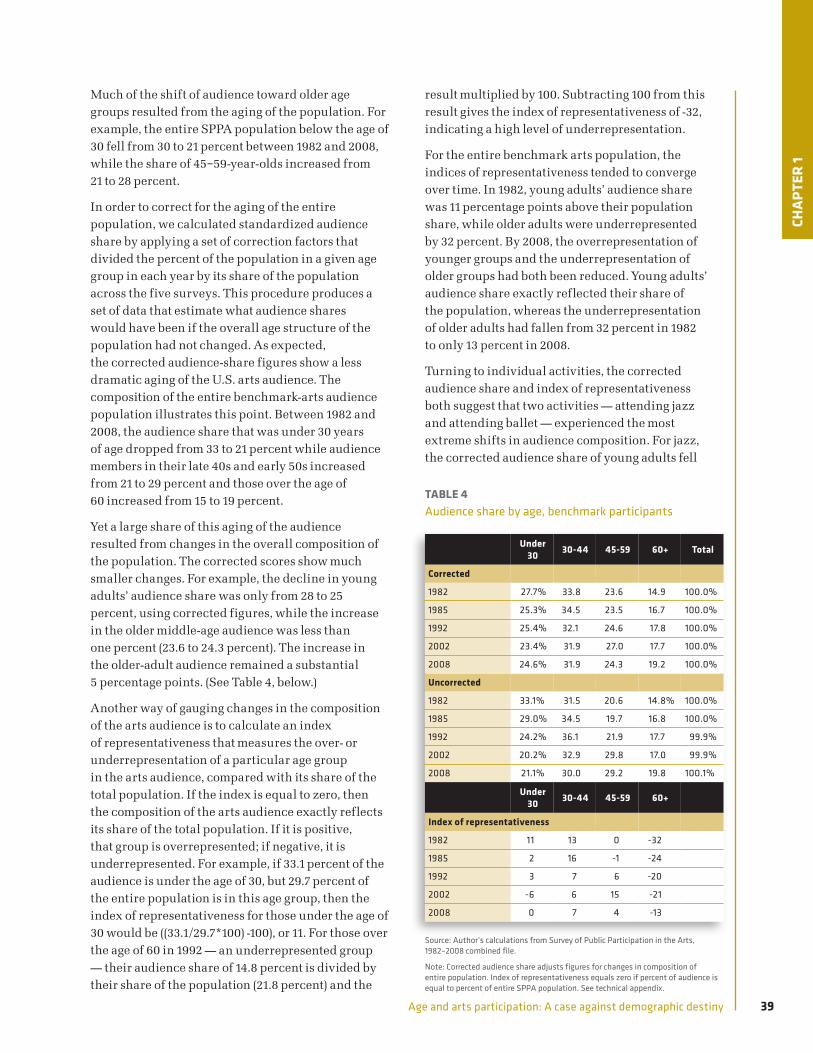
39Age and arts participation: A case against demographic destiny
Much of the shift of audience toward older age groups resulted from the aging of the population. For example, the entire SPPA population below the age of 30 fell from 30 to 21 percent between 1982 and 2008, while the share of 45–59-year-olds increased from 21 to 28 percent.
In order to correct for the aging of the entire population, we calculated standardized audience share by applying a set of correction factors that divided the percent of the population in a given age group in each year by its share of the population across the five surveys. This procedure produces a set of data that estimate what audience shares would have been if the overall age structure of the population had not changed. As expected, the corrected audience-share figures show a less dramatic aging of the U.S. arts audience. The composition of the entire benchmark-arts audience population illustrates this point. Between 1982 and 2008, the audience share that was under 30 years of age dropped from 33 to 21 percent while audience members in their late 40s and early 50s increased from 21 to 29 percent and those over the age of 60 increased from 15 to 19 percent.
Yet a large share of this aging of the audience resulted from changes in the overall composition of the population. The corrected scores show much smaller changes. For example, the decline in young adults’ audience share was only from 28 to 25 percent, using corrected figures, while the increase in the older middle-age audience was less than one percent (23.6 to 24.3 percent). The increase in the older-adult audience remained a substantial 5 percentage points. (See Table 4, below.)
Another way of gauging changes in the composition of the arts audience is to calculate an index of representativeness that measures the over- or underrepresentation of a particular age group in the arts audience, compared with its share of the total population. If the index is equal to zero, then the composition of the arts audience exactly reflects its share of the total population. If it is positive, that group is overrepresented; if negative, it is underrepresented. For example, if 33.1 percent of the audience is under the age of 30, but 29.7 percent of the entire population is in this age group, then the index of representativeness for those under the age of 30 would be ((33.1/29.7*100) -100), or 11. For those over the age of 60 in 1992 — an underrepresented group — their audience share of 14.8 percent is divided by their share of the population (21.8 percent) and the
result multiplied by 100. Subtracting 100 from this result gives the index of representativeness of -32, indicating a high level of underrepresentation.
For the entire benchmark arts population, the indices of representativeness tended to converge over time. In 1982, young adults’ audience share was 11 percentage points above their population share, while older adults were underrepresented by 32 percent. By 2008, the overrepresentation of younger groups and the underrepresentation of older groups had both been reduced. Young adults’ audience share exactly reflected their share of the population, whereas the underrepresentation of older adults had fallen from 32 percent in 1982 to only 13 percent in 2008.
Turning to individual activities, the corrected audience share and index of representativeness both suggest that two activities — attending jazz and attending ballet — experienced the most extreme shifts in audience composition. For jazz, the corrected audience share of young adults fell
TABLE 4Audience share by age, benchmark participants
Under 30 30-44 45-59 60+ Total
Corrected
1982 27.7% 33.8 23.6 14.9 100.0%
1985 25.3% 34.5 23.5 16.7 100.0%
1992 25.4% 32.1 24.6 17.8 100.0%
2002 23.4% 31.9 27.0 17.7 100.0%
2008 24.6% 31.9 24.3 19.2 100.0%
Uncorrected
1982 33.1% 31.5 20.6 14.8% 100.0%
1985 29.0% 34.5 19.7 16.8 100.0%
1992 24.2% 36.1 21.9 17.7 99.9%
2002 20.2% 32.9 29.8 17.0 99.9%
2008 21.1% 30.0 29.2 19.8 100.1%
Under 30 30-44 45-59 60+
Index of representativeness
1982 11 13 0 -32
1985 2 16 -1 -24
1992 3 7 6 -20
2002 -6 6 15 -21
2008 0 7 4 -13
CHAP
TER
1
Source: Author’s calculations from Survey of Public Participation in the Arts, 1982–2008 combined file.
Note: Corrected audience share adjusts figures for changes in composition of entire population. Index of representativeness equals zero if percent of audience is equal to percent of entire SPPA population. See technical appendix.

40 National Endowment for the Arts
from 46 to 24 percent, considerably less than the uncorrected decline from 52 to 20 percent. Jazz had become an art form dominated by persons over the age of 30. (See Table 5, below.)
This pattern is confirmed by the index of representativeness. The young-adult figure declined from 76 to -6 percent, while the older adult figure increased from -75 to -23 percent. The young middle-aged adult figure fell from 1 percent to -6 percent — indicating that it shifted from slightly overrepresented to slightly underrepresented — while the older middle-aged adult figure increased from -32 percent in 1982 to 17 percent in 2002 and 29 percent in 2008.
Ballet experienced a similar shift. Both the young adult and young middle-aged shares of the ballet audience declined — even when correcting for population composition. By 2008, young adults were the only age group underrepresented among ballet participants. (See Table 6, below.)
Symphony orchestras have expressed concerns about the rapid aging of their audiences, a pattern confirmed by a recent study by the League of American Orchestras (League of American Orchestras 2010). The uncorrected audience-share decline of young adults (under 30) from 26 to 16 was dramatic. Yet, if corrected for overall population
TABLE 5 Jazz participation: audience share by age and year of survey
Jazz Under 30 30-44 45-59 60+ Total
Corrected
1982 46.1% 31.0 17.1 5.8 100.0%
1985 36.1% 38.7 18.1 7.1 100.0%
1992 29.2% 36.6 22.2 12.1 100.0%
2002 25.7% 33.2 27.5 13.6 100.0%
2008 23.7% 28.5 30.4 17.3 100.0%
Uncorrected
1982 52.4% 28.1 14.1 5.5 100.1%
1985 40.1% 38.2 14.6 7.1 100.0%
1992 27.7% 40.8 19.7 11.9 100.1%
2002 22.0% 34.5 30.5 12.9 99.9%
2008 20.0% 26.4 36.0 17.6 100.0%
UNDER 30
30-44 45-59 60+
Index of representativeness
1982 76 1 -32 -75
1985 41 28 -26 -68
1992 17 21 -5 -46
2002 2 12 17 -40
2008 -6 -6 29 -23
Source: Author’s calculations from Survey of Public Participation in the Arts, 1982–2008 combined file.
Note: Corrected audience share adjusts figures for changes in composition of entire population. Index of representativeness equals zero if percent of audience is equal to percent of entire SPPA population. See technical appendix.
TABLE 6Ballet participation: audience share by age and year of survey
Ballet Under 30 30-44 45-59 60+ Total
Corrected
1982 24.5% 40.1 20.7 14.7 100.0%
1985 24.5% 39.4 19.6 16.4 100.0%
1992 26.0% 32.2 24.7 17.1 100.0%
2002 17.9% 36.3 28.4 17.3 100.0%
2008 20.5% 31.0 24.2 24.3 100.0%
Uncorrected
1982 29.4% 37.5 18.3 14.7 99.9%
1985 27.9% 39.1 16.6 16.4 100.0%
1992 24.7% 36.4 22.0 17.0 100.1%
2002 15.2% 37.1 31.4 16.4 100.1%
2008 17.5% 29.1 28.7 24.8 100.1%
Under 30 30-44 45-59 60+ Total
Total population
1982 29.7% 27.9 20.6 21.8 100.0%
1985 28.4% 29.8 19.8 22.1 100.1%
1992 23.6% 33.6 20.7 22.1 100.0%
2002 21.5% 30.9 26.0 21.6 100.0%
2008 21.2% 28.0 28.0 22.8 100.0%
Under 30 30-44 45-59 60+
Index of representativeness
1982 -1 34 -11 -33
1985 -2 31 -16 -26
1992 5 8 6 -23
2002 -29 20 21 -24
2008 -17 4 2 9
Source: Author’s calculations from Survey of Public Participation in the Arts, 1982–2008 combined file.
Note: Corrected audience share adjusts figures for changes in composition of entire population. Index of representativeness equals zero if percent of audience is equal to percent of entire SPPA population. See technical appendix.

41Age and arts participation: A case against demographic destiny
aging, the decline was from 22 to 19 percent. At the same time, the 8-point decline among young middle-aged adults (from 33 to 25 percent) did not change appreciably when corrected for population declines (from 35 to 27 percent).
Younger adults were always underrepresented in the classical music audience and their index of representativeness fell slightly for young adults between 1985 and 2008 from -20 to -26. Between 2002 and 2008, however, the representation of older middle-aged adults (35 to 14 percent) and older adults (2 to 22 percent) changed dramatically as more respondents over the age of 60 and fewer respondents between 45 and 59 years of age reported attending classical music events. (See Table 7, below.)
The interpretation of these data depends on one’s perspective. For a symphony or opera company, the rapid shrinking of a demographic group can have an impact on how many tickets it sells. So, while our analysis concludes that a large share of the change in the composition of the arts audience is attributable to the composition of the general population — and not to changes in who participates in the arts — we must keep in mind that these broader population trends, too, have an impact on arts organizations.
School attendance provides a useful analogy. During the 1950s, the Baby-Boom generation put enormous strain on public school systems as the number of school-age children increased rapidly. If one were a school administrator, this increase was a challenging and worrisome situation, although it told us nothing about the likelihood that children would attend school. Similarly, classical music organizations have reason to be concerned about attendance rates, even if the trends do not indicate radical shifts in people’s behavior.
The same trends can be seen in changes in the average and median age of participants. Again, one needs to compare shifts in these figures with changes in figures for the entire population. For example, while the average age of a benchmark arts participant increased from 40 to 45 between 1982 and 2008, the average age of the entire SPPA population increased from 43 to 46. We can gauge shifts in age by dividing the average age for participants by that for the entire population and multiplying the resulting figure by 100. A score
TABLE 7 Classical music participation: audience share by age and year of survey
Classical music Under 30 30-44 45-59 60+ Total
Corrected
1982 21.6% 35.0 25.6 17.7 100.0%
1985 19.6% 35.8 23.9 20.8 100.0%
1992 19.6% 27.9 30.7 21.8 100.0%
2002 18.4% 26.0 32.4 23.2 100.0%
2008 18.6% 26.9 27.1 27.5 100.0%
Uncorrected
1982 26.4% 33.0 22.9 17.9 100.2%
1985 22.6% 36.0 20.2 21.2 100.0%
1992 18.8% 31.6 27.6 21.9 99.9%
2002 15.7% 26.9 35.2 22.1 99.9%
2008 15.6% 24.9 31.8 27.8 100.1%
Under 30 30-44 45-59 60+ Total
Total population
1982 29.7% 27.9 20.6 21.8 100.0%
1985 28.4% 29.8 19.8 22.1 100.1%
1992 23.6% 33.6 20.7 22.1 100.0%
2002 21.5% 30.9 26.0 21.6 100.0%
2008 21.2% 28.0 28.0 22.8 100.0%
Under 30 30-44 45-59 60+
Index of representativeness
1982 -11 18 11 -18
1985 -20 21 2 -4
1992 -20 -6 33 -1
2002 -27 -13 35 2
2008 -26 -11 14 22
CHAP
TER
1
Source: Author’s calculations from Survey of Public Participation in the Arts, 1982–2008 combined file.
Note: Corrected audience share adjusts figures for changes in composition of entire population. Index of representativeness equals zero if percent of audience is equal to percent of entire SPPA population. See technical appendix.

42 National Endowment for the Arts
below 100 indicates that the audience age is younger than the general population; a figure over 100 indicates that it is above the population figure. In the case of all benchmark participants, this calculation results in an increase in the index from 93 in 1982 to 98 in 2008. Again, these indicators suggest that the arts audience in 2008 more closely mirrored the entire population than they had in the 1980s. (See Table 8, below.)
These general conclusions hold for individual activities as well. There was a general drift up in terms of average age, but, with the exception of jazz and ballet, the changes were not dramatic. Jazz’s index increased from 74 to 102, while ballet rose from 95 to 102. Classical music and opera had the highest index scores in 1982 and retained this distinction in 2008, although opera’s index actually fell from 1982 to 2008 from 110 to 107.
Overall, then, audience shares in 2008 more closely tracked the distribution of the entire population than it had earlier. Whereas in 1982, young adults and the middle-aged were strongly overrepresented among arts participants, the 2008 audience share looked more like the population as a whole. Although the aging of the arts audience was real, its cause was less the result of changes in people’s tastes and behavior than the overall aging of the population. With a couple of exceptions — especially jazz and ballet — changes in audience share by age groups for arts activities tracked changes in the composition of the population.
EDUCATIONAL ATTAINMENT AND AGE: A CONFOUNDING RELATIONSHIPAge has a statistically significant, but weak relationship to our summary measures of arts participation. Moreover, we can judge the importance of this relationship only in comparison to other variables that might influence participation.
As virtually all research on arts participation has demonstrated, educational attainment is the strongest predictor of cultural engagement (DiMaggio and Ostrower 1992; Peterson et al. 2000; Rabkin and Hedberg 2011). This is certainly the case with our three summary measures, all of which show a clear relationship between educational attainment and arts participation. While the strength of this relationship has declined somewhat since the 1980s — and especially between 2002 and 2008 — it continues to explain 16–17 percent of the variance in our measures of participation.
Not only is education strongly correlated with cultural participation, but before 2008, it had a strong relationship with age as well. During the 1980s, individuals with less than a high-school diploma and those with a graduate degree were considerably older than those with either a high-school degree or some college experience. Over time, this relationship faded. In 2008, educational attainment had only a fraction of the explanatory power than it did in 1982.19
The weakening relationship between age and education has implications for our interpretation of the link between age and arts participation. At least a share of the apparent correlation of age and participation was accounted for by the correlation of age and educational attainment. In the 1980s, the correlation between age and education made the correlation between age and participation appear stronger than it really was. As the correlation between age and education declines, the correlations between age and participation should decline as well, even though age’s actual influence might remain unchanged. To disentangle these confounding effects, we must turn to multivariate analysis.
TABLE 8 Average age of benchmark arts participants, by activity and year
1982 1985 1992 2002 2008
Any benchmark activity
40.1 41.0 42.4 44.2 44.8
Jazz 33.1 35.2 39.6 42.6 45.2
Classical 42.5 43.3 45.5 47.5 48.9
Opera 45.0 44.3 45.2 47.0 48.4
Musicals 41.5 42.2 43.8 45.0 45.9
Plays 41.7 42.0 43.6 44.7 46.8
Ballet 40.3 40.7 41.9 44.7 46.5
Other dance 42.6 43.7 45.6
Art museum 39.7 40.4 41.3 44.1 44.1
Source: Author’s calculations from Survey of Public Participation in the Arts, 1982–2008 combined file.

43Age and arts participation: A case against demographic destiny
MULTIVARIATE ANALYSISMultivariate analysis allows us to answer two questions. First, does adjusting for age or cohort change our conclusions about the rapid decline in benchmark participation over time? Second, if we adjust for other factors, how strongly do age and cohort influence benchmark participation? (See Table 9, below.)
The answer to the first question is clear. The year-to-year declines in the participation indices were unaffected by adjusting for cohort or age. For example, controlling for other variables, the decline in the attendance rate at any benchmark arts activity between 1992 and 2008 actually increased from 6 percent to 9 percent. Also, changes in the number of activities attended were slight. The decline in benchmark attendance was not the result of changes in the influence of age or cohort.
TABLE 9Benchmark participation index, by year. General linear analysis
Number of activities by age
To assess the relative strength of age and cohort, we conducted a set of multivariate analyses. The variables included in the analysis are gender, marital status, educational attainment, ethnicity, year of birth, and the interaction effect between year and educational attainment. (See Table 10, below.)
As we have noted, educational attainment overwhelms all other variables in the analysis.20 The entire model explains 20 percent of the variance in number of activities, but educational attainment alone explains 18 percent of the variance. Although the impact of other variables is statistically significant, none explains more than 0.7 percent of the variance in number of activities attended. (See Table 11, page 44.)
Uncorrected Corrected for other variables
Year Number of activities Any benchmark activity Number of activities Any benchmark activity
1982 0.8 39.2% 1.1 45.5%
1985 0.8 37.6% 1.0 43.2%
1992 1.0 42.4% 1.1 45.5%
2002 0.9 40.3% 1.0 41.1%
2008 0.8 36.2% 0.8 36.4%
Source: Author’s calculations from Survey of Public Participation in the Arts, 1982–2008 combined file.
Note: Other variables entered in equation: educational attainment, marital status, ethnicity, gender, and age.
TABLE 10 Average number of activities. General linear model, summary statistics
Tests of Between-Subjects Effects
Source Type III Sum of Squares df Mean Square F Significance Partial Eta
Squared
Corrected model 31422 31 1014 668 0.000 0.206
Intercept 11360 1 11360 7490 0.000 0.086
Gender 904 1 904 596 0.000 0.007
Marital status 420 2 210 138 0.000 0.003
Educational attainment 27266 4 6816 4494 0.000 0.183
Ethnicity 685 4 171 113 0.000 0.006
Year 457 4 114 75 0.000 0.004
Interaction: education and year 306 16 19 13 0.000 0.003
Error 121441 80063 2
Total 210690 80095
Corrected total 152863 80094
CHAP
TER
1
df = degrees of freedom F = F-ratio

44 National Endowment for the Arts
Adding age to the analysis makes a few changes to the overall explanatory pattern. With the addition of age as a main effect and two interaction terms (age/year and education/age), educational attainment’s partial eta declines from 18 to 15 percent. Yet the three additional terms only add 0.4, 0.1, and 0.3 percent to the model’s explanatory power.
Another notable feature of this model, compared with that in the previous table, is the addition to adjusted R square. Without age present, the model explained 20.5 percent of the variance in total activities. Adding age and its interaction terms, this figure increases by 0.6 percent to 21.1 percent. Again, although age is statistically significant — that is, its effect is not zero — its impact is minor.
The analysis allows us to examine the age profile of participation, correcting for other influences, by comparing the uncorrected age profile for “number of activities attended” with the estimated marginal means of the regression analysis. As we have noted, the strong correlation of age with education (older respondents having lower educational attainment) had a large impact on the age profile. Specifically, the uncorrected data tended to overestimate the decline in participation as respondents aged. If all age groups had the same educational attainment, participation would remain steady among the middle aged and the “young old.” Only respondents over the age of 70 showed a marked decline in participation when corrected for other influences. (See Figure 7, page 45.)
TABLE 11 Average number of activities. General linear model (age included), summary statistics
Tests of Between-Subjects Effects
Source Type III Sum of Squares df Mean Square F Significance Partial Eta
Squared
Corrected model 32375 121 268 178 0.000 0.212
Intercept 11111 1 11111 7375 0.000 0.084
Gender 911 1 911 605 0.000 0.008
Marital status 498 2 249 165 0.000 0.004
Educational attainment 22002 4 5501 3651 0.000 0.154
Ethnicity 637 4 159 106 0.000 0.005
Year 502 4 125 83 0.000 0.004
Interaction: education and year 267 16 17 11 0.000 0.002
Age 540 10 54 36 0.000 0.004
Interaction: age and year 107 40 3 2 0.002 0.001
Interaction: age and education 341 40 9 6 0.000 0.003
Error 120488 79973 2
Total 210690 80095
Corrected total 152863 80094
R Squared = .212 (Adjusted R Squared = .211) df = degrees of freedom F = F-ratio
Source: Author’s calculations from Survey of Public Participation in the Arts, 1982–2008 combined file.

45Age and arts participation: A case against demographic destiny
This pattern did not change much from survey to survey. The summary data for the interaction of age and year remained statistically significant — although it had the lowest level of significance of any term in the analysis — but explained less than 0.1 percent of the variance in number of activities attended. What is more, much of the change in the age profile from year to year is accounted for by the large decline in participation in 2008. If we leave aside 2008, it is hard to discern any important change in the age profile over time.
Finally, the regression analysis suggests that while age’s explanatory power declined over time, the decline was not as precipitous as the uncorrected data suggest. The correlation of age and education in the early surveys made age’s influence on participation appear stronger than it was. (See Figure 8, below.)
If we use age’s impact on the R-square of the model, then the decline in age’s influence is even smaller. In 1982, age added 0.8 percent to the model’s explanatory value. This amount rose as high as 1.1 percent in 1985. In the last three surveys (1992, 2002, and 2008), however, the contribution to R-square remained at 0.6 or 0.5 percent. Again, while age never had the degree of influence apparent in the uncorrected data, its modest influence has not declined as much as those data suggest.
FIGURE 7Average number of activities attended by U.S. adults, by age, uncontrolled and controlling for other variables, 1982–2008
Age
Aver
age
num
ber o
f act
iviti
es
0.0
0.2
0.4
0.6
0.8
1.0
1.2
UncorrectedEstimated marginal mean
70 and ove
r
65–6960–64
55–5950–54
45–4940–44
35–3930–34
25–29
Less th
an 25
Source: Author’s calculations from Survey of Public Participation in the Arts, 1982–2008 combined file. See Table 11 for detailed results.
Note: General linear model analysis results, controlled for gender, marital status, educational attainment, ethnicity, and year of survey.
FIGURE 8Strength of relationship between age and average activities attended by U.S. adults, uncontrolled and controlling for other variables, 1982–2008
Year
Stre
ngth
of r
elat
ions
hip
0.000
0.005
0.010
0.015
0.020
eta squaredpartial eta squared
20082002199219851982
Source: Author’s calculations from Survey of Public Participation in the Arts, 1982–2008 combined file. See Table 11 for detailed results.
Note: General linear model analysis results, controlled for gender, marital status, educational attainment, ethnicity, and year of survey.
CHAP
TER
1

46 National Endowment for the Arts
Number of activities and cohort
An analysis of cohort and number of activities attended, controlling for other demographic variables, yields a similar result. The explanatory value of cohort is statistically significant, but it explains only two-tenths of one percent (or one five-hundredth) of the variance in number of benchmark activities. Again, cohort’s influence is dwarfed by educational attainment and overshadowed by gender, marital status, and ethnicity as well. (See Table 12, below.)
As with age, correcting for other influences reduces the differences between cohorts. For example, the relatively low average number of activities for the two earliest cohorts rises when educational attainment and other influences are controlled for. The one substantive change of this adjustment relates to the World War II cohort. Using raw scores, it appears that the World War II cohort’s average number of benchmark activities was somewhat lower than that for the early Baby-Boom cohort. Yet, when correcting for other influences — especially the World War II cohort’s average educational attainment, which was lower than for subsequent generational cohorts — its average number of activities is actually higher than that of early Baby-Boom generations. (See Figure 9, page 47.)
TABLE 12 Average number of activities. General linear model (cohort included), summary statistics
Tests of Between-Subjects Effects
Source Type III Sum of Squares df Mean Square F Significance Partial Eta
Squared
Corrected model 32001 72 444 294 0.000 0.209
Intercept 10769 1 10769 7130 0.000 0.082
Gender 920 1 920 609 0.000 0.008
Marital status 539 2 270 178 0.000 0.004
Educational attainment 20087 4 5022 3325 0.000 0.143
Ethnicity 642 4 161 106 0.000 0.005
Year 298 4 75 49 0.000 0.002
Interaction: year and education 215 16 13 9 0.000 0.002
Cohort 257 5 51 34 0.000 0.002
Interaction: cohort and year 176 16 11 7 0.000 0.001
Interaction: cohort and education 170 20 8 6 0.000 0.001
Error 120863 80022 2
Total 210690 80095
Corrected total 152863 80094
R Squared = .209 (Adjusted R Squared = .209) df = degrees of freedom F = F-ratio
Source: Author’s calculations from Survey of Public Participation in the Arts, 1982–2008 combined file.
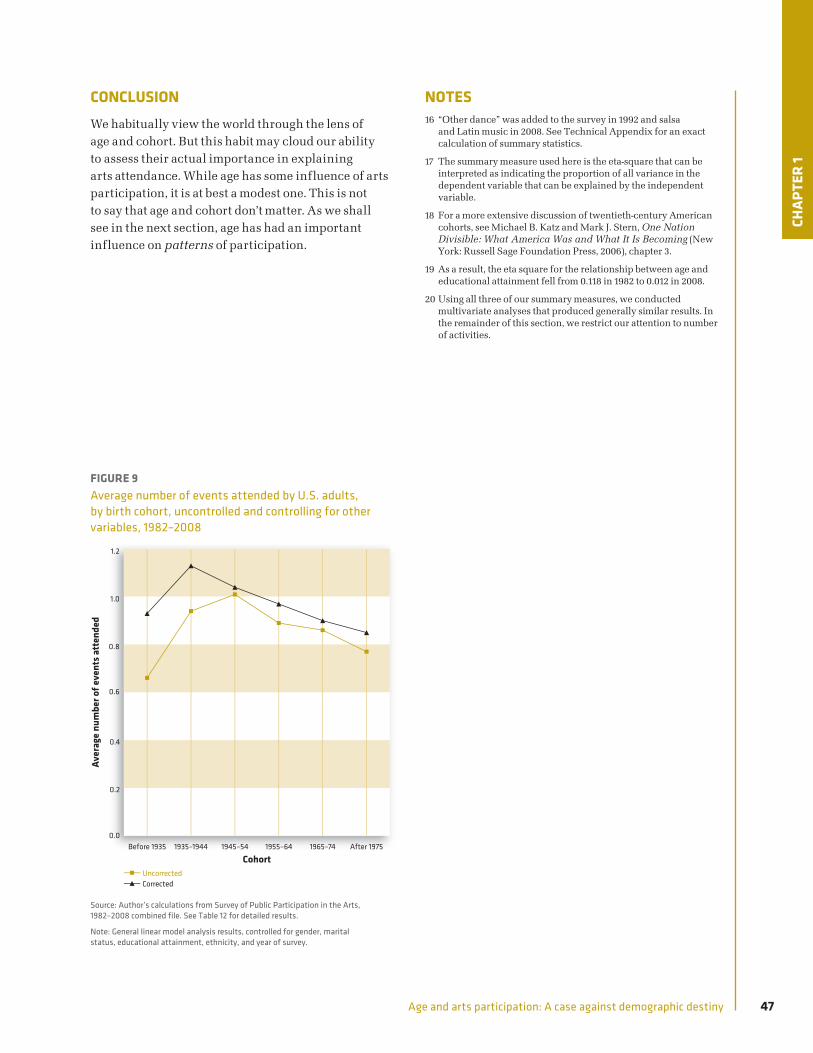
47Age and arts participation: A case against demographic destiny
CONCLUSIONWe habitually view the world through the lens of age and cohort. But this habit may cloud our ability to assess their actual importance in explaining arts attendance. While age has some influence of arts participation, it is at best a modest one. This is not to say that age and cohort don’t matter. As we shall see in the next section, age has had an important influence on patterns of participation.
NOTES16 “Other dance” was added to the survey in 1992 and salsa
and Latin music in 2008. See Technical Appendix for an exact calculation of summary statistics.
17 The summary measure used here is the eta-square that can be interpreted as indicating the proportion of all variance in the dependent variable that can be explained by the independent variable.
18 For a more extensive discussion of twentieth-century American cohorts, see Michael B. Katz and Mark J. Stern, One Nation Divisible: What America Was and What It Is Becoming (New York: Russell Sage Foundation Press, 2006), chapter 3.
19 As a result, the eta square for the relationship between age and educational attainment fell from 0.118 in 1982 to 0.012 in 2008.
20 Using all three of our summary measures, we conducted multivariate analyses that produced generally similar results. In the remainder of this section, we restrict our attention to number of activities.
FIGURE 9Average number of events attended by U.S. adults, by birth cohort, uncontrolled and controlling for other variables, 1982–2008
Cohort
Aver
age
num
ber o
f eve
nts a
tten
ded
0.0
0.2
0.4
0.6
0.8
1.0
1.2
CorrectedUncorrected
After 19751965–741955–641945–541935–1944Before 1935
Source: Author’s calculations from Survey of Public Participation in the Arts, 1982–2008 combined file. See Table 12 for detailed results.
Note: General linear model analysis results, controlled for gender, marital status, educational attainment, ethnicity, and year of survey.
CHAP
TER
1

National Endowment for the Arts48
The “cultural omnivore” pattern is more associated with the World War II and early Baby-Boom cohorts than with later generations.

49Age and arts participation: A case against demographic destiny
CHAPTER 2
PATTERNS OF PARTICIPATION
INTRODUCTIONThe previous section examined the impact of age and cohort on aggregate measures of cultural participation. It found their influence to be statistically significant, but having relatively little explanatory value, especially when other variables have been controlled for.
Still, these variables can influence participation in other ways. In this section we examine how age and cohort influence patterns of arts participation — that is, how individuals mix and match different types of participation. In particular, we examine two patterns that have been of interest to other research-ers. One is “highbrow,” the tendency of people who are active in one “high-status” cultural form (as determined by the researcher) to be active in one or more other high-status forms. The other pattern is that of the cultural “omnivore.” Following Peterson, we define omnivores as individuals who are active in both “highbrow” and so-called middle- or lowbrow arts activities.
This chapter undertakes two tasks. First, it uses cluster analysis as a means of identifying individuals by how they combine one or more cultural forms into a particular palette of activities. Second, it uses the resulting clusters to assess change over time in the size of different clusters and their relationship to age and year of birth.
The analysis is complicated by the sudden and dramatic downturn in cultural participation reported in the 2008 SPPA. One question posed by these data is whether the 2008 data represent a one-time shock to the cultural system — perhaps caused by the economic recession that began in late 2007 — or represent a longer trend. After all, although the drop in participation in 2008 was dramatic, the benchmark arts attendance rates have not increased since 1992.
This paper finds evidence of both a one-time shock — what statisticians would call a period effect — and a longer-term trend — or cohort effect. In particular, the number of omnivores dropped at the same time that they attended fewer events on average.
CLUSTER ANALYSISCluster analysis is a statistical technique for identifying regularities among different variables. Here we use it to identify SPPA respondents who share particular patterns of participation. Using Peterson’s typology, we identified omnivore and “highbrow” patterns of participation. We also report data on an “other” category of participants that did not fit into either of Peterson’s constructs. (See Technical Appendix, page 73, for an explanation of how these clusters were determined.)
Approximately twice as many respondents were classified as omnivores as highbrows. Together, these two groups represent 19 percent of all respondents and more than half of all respondents that reported any type of arts attendance. The distribution of respondents varied markedly by year. The number of respondents with little or no participation peaked in 2008 at 67 percent after remaining relatively stable in earlier years.

50 National Endowment for the Arts
Omnivore representation declined from 15 percent in 1982 to 10 percent in 2008. Highbrows represented just over 7 percent of all respondents in 1985 and 1992 and then declined to 5 percent in 2008. Finally, the “other” category showed no clear trend across the five surveys. (See Table 13, below.)
The ethnic and educational backgrounds of the four clusters are consistent with Peterson’s theory. More than 34 percent of adults holding a graduate degree were omnivores and 14 percent were highbrows. At the other extreme, only 7 percent of adults with a high-school diploma were omnivores, and 4 percent were highbrows. Whites were overrepresented among omnivores and highbrows. Asians and Pacific Islanders were overrepresented among highbrows, while the multi-racial/Native American category was overrepresented among omnivores.21
PATTERNS OF PARTICIPATION BY AGE AND COHORTThe omnivore pattern of cultural participation is associated with distinctive age and cohort features. First, the proportion of cultural omnivores tends to decline with age. Younger adults are more likely to be omnivores than older adults. Second, omnivores are more likely to have been born before 1955 than after. The omnivore pattern is more associated with the World War II and early Baby-Boom cohorts than with later groups.
These two features of the omnivore pattern can obscure each other. At the time of the first survey in 1982, members of the World War II cohort were already in their late thirties and early forties, beyond their prime omnivore years. We capture late Baby Boomers and Generation Xers during early adulthood, a factor that tends to overestimate their propensity to be omnivores.
TABLE 13 Distribution of U.S. adults by arts participation patterns, by survey year
1982 1985 1992 2002 2008 Total
Nonparticipants Count 10,517 8,557 7,804 10,825 12,391 50,094
Percent 61.0% 62.6% 61.3% 63.2% 67.2% 63.2%
Omnivores Count 2,612 1,897 1,740 2,173 1,866 10,288
Percent 15.1% 13.9% 13.7% 12.7% 10.1% 13.0%
High brow Count 1,156 982 907 1,008 977 5,030
Percent 6.7% 7.2% 7.1% 5.9% 5.3% 6.3%
Other Count 2,969 2,238 2,285 3,129 3,210 13,831
Percent 17.2% 16.4% 17.9% 18.3% 17.4% 17.5%
Total Count 17,254 13,674 12,736 17,135 18,444 79,243
Percent 100.0% 100.0% 100.0% 100.0% 100.0% 100.0%
Source: Author’s calculations from Survey of Public Participation in the Arts, 1982–2008 combined file.
Note: See text for explanation.
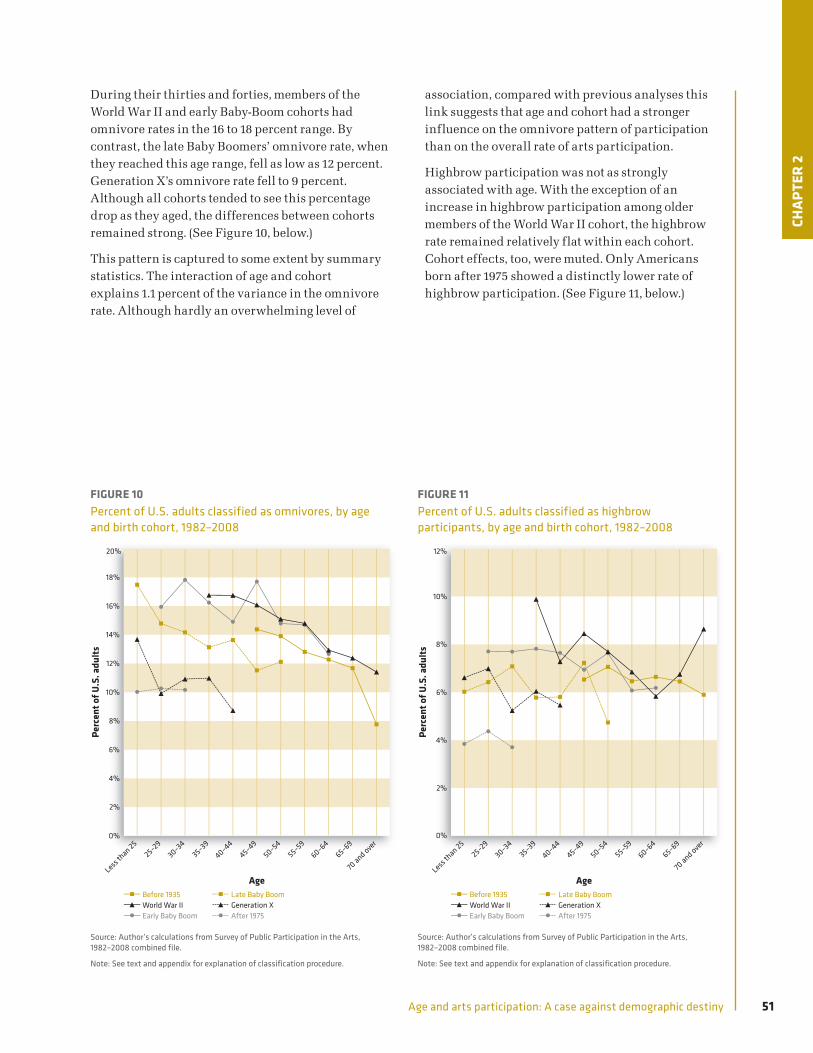
51Age and arts participation: A case against demographic destiny
During their thirties and forties, members of the World War II and early Baby-Boom cohorts had omnivore rates in the 16 to 18 percent range. By contrast, the late Baby Boomers’ omnivore rate, when they reached this age range, fell as low as 12 percent. Generation X’s omnivore rate fell to 9 percent. Although all cohorts tended to see this percentage drop as they aged, the differences between cohorts remained strong. (See Figure 10, below.)
This pattern is captured to some extent by summary statistics. The interaction of age and cohort explains 1.1 percent of the variance in the omnivore rate. Although hardly an overwhelming level of
association, compared with previous analyses this link suggests that age and cohort had a stronger influence on the omnivore pattern of participation than on the overall rate of arts participation.
Highbrow participation was not as strongly associated with age. With the exception of an increase in highbrow participation among older members of the World War II cohort, the highbrow rate remained relatively flat within each cohort. Cohort effects, too, were muted. Only Americans born after 1975 showed a distinctly lower rate of highbrow participation. (See Figure 11, below.)
CHAP
TER
2
FIGURE 10Percent of U.S. adults classified as omnivores, by age and birth cohort, 1982–2008
Age
Perc
ent o
f U.S
. adu
lts
0%
2%
4%
6%
8%
10%
12%
14%
16%
18%
20%
After 1975Generation XLate Baby Boom
Early Baby BoomWorld War IIBefore 1935
70 and ove
r65–69
60–6455–59
50–5445–49
40–4435–39
30–3425–29
Less th
an 25
Source: Author’s calculations from Survey of Public Participation in the Arts, 1982–2008 combined file.
Note: See text and appendix for explanation of classification procedure.
FIGURE 11Percent of U.S. adults classified as highbrow participants, by age and birth cohort, 1982–2008
Age
Perc
ent o
f U.S
. adu
lts
0%
2%
4%
6%
8%
10%
12%
After 1975Generation XLate Baby Boom
Early Baby BoomWorld War IIBefore 1935
70 and ove
r
65–6960–64
55–5950–54
45–4940–44
35–3930–34
25–29
Less th
an 25
Source: Author’s calculations from Survey of Public Participation in the Arts, 1982–2008 combined file.
Note: See text and appendix for explanation of classification procedure.

52 National Endowment for the Arts
THE IMPACT OF DECLINING OMNIVORE BEHAVIOR ON TOTAL ATTENDANCEOmnivores represent the most active segment of the entire arts audience. They go to more types of arts activities than other groups, and they go to more individual events than others. In 1982 and 1985, the SPPA asked about events attended at benchmark activities during the previous month. As the following figures show, omnivores accounted for a large share of respondents, with more than one event attended during the previous month. (See Figure 12, below.)
In 1992 and afterward, we received more precise information on the number of events attended during the previous year. With the exception of classical music, omnivores attended more events in all the benchmark cultural activities over the last three SPPAs, typically with average attendance rates at three or more times those of other groups. Although the omnivores represented only 13 percent of the population, they accounted for 58 percent of all events attended in those years.
The average number of events attended by omnivores and highbrows dropped sharply between 2002 and 2008. Omnivores’ average number of events attended fell from 12.1 to 11.0 events per year, a decline of 9 percent. Highbrow attendance fell by 11 percent — from 6.1 to 5.5 events per year — while other participants’ attendance held steady. (See Figure 13, page 53.)
Between 2002 and 2008, a double blow hit cultural participation. First, the proportion of the population that we characterize as omnivores — individuals who attend a variety of different cultural forms — dropped sharply. At the same time, as with the rest of the population, the number of events that omnivores attended also fell — by more than one event per respondent. Taken together, the decline of omnivores’ share of the population and their drop in average number of events attended represented 82 percent of the entire decline in individual attendance at benchmark arts events between 2002 and 2008.22
FIGURE 12Percent of U.S. adults by type of participant and number of events attended
Number of eventsNumber of events
1982 1985
0%
10%
20%
30%
40%
50%
60%
70%
80%
90%
100%
OtherHighbrow
OmnivoresNonparticipants
5+2–41None0%
10%
20%
30%
40%
50%
60%
70%
80%
90%
100%
OtherHighbrow
OmnivoresNonparticipants
5+2–41None
Source: Author’s calculations from Survey of Public Participation in the Arts, 1982–2008 combined file.
Note: See text and appendix for explanation of classification procedure.

53Age and arts participation: A case against demographic destiny
CONCLUSIONThis chapter has focused on the relationship between the omnivore pattern of cultural participation and age and birth cohort. We have discovered that the omnivore pattern was particularly common among respondents born between 1935 and 1954, and that this pattern has declined in popularity. The declines in the number of omnivores and in their participation rate explain most of the overall decline in participation between 2002 and 2008, at least by total number of events attended.
The role of age and cohort in this decline was indirect. Omnivores — a small minority of the population — account for a disproportionate share of all arts participation. Because the omnivore pattern is associated with both age (omnivores are more likely to be young adults) and cohort (the World War II and early Baby-Boom cohorts), the aging of these birth cohorts has had a strong impact on overall arts participation.
NOTES21 The U.S. Census began in 2000 to allow respondents to check
more than one racial category. As a result, the multi-racial category was included in the 2002 and 2008 SPPAs.
22 Correcting for differences in sample sizes, omnivores accounted for 82 percent of the total decline in events attended by survey respondents between 2002 and 2008.
CHAP
TER
2
FIGURE 13Average number of events attended by U.S. adults, by type of participant, 1982–2008
Year
Aver
age
num
ber o
f eve
nts
0
2
4
6
8
10
12
14
OtherHighbrowOmnivores
200820021992
Source: Author’s calculations from Survey of Public Participation in the Arts, 1982–2008 combined file.
Note: See text and appendix for explanation of classification procedure.

National Endowment for the Arts54
Gender and educational attainment seem the most important influences on literary reading.

55Age and arts participation: A case against demographic destiny
CHAPTER 3
LITERARY READING
INTRODUCTIONIn previous chapters, we found that age and cohort have statistically significant, but relatively weak, relationships to participation in live cultural events. However, they are relevant for various patterns of cultural participation, particularly for the rise and fall of the omnivorous pattern first identified by Richard A. Peterson.
In this chapter we examine the three SPPA variables on literary reading that have been included in the surveys since 1992. The yes/no questions ask whether the respondent had read any novels or short stories, poetry, or plays during the previous 12 months.
Since 1992, the literary reading rates of Americans have declined (NEA 2004, 2007). In 1992, 52 percent of SPPA respondents reported reading a novel, play, or short story in the previous year. Ten years later, this figure had fallen to 45 percent. Although it rose to 47 percent in 2008, this rate is still below the 1992 figure (NEA 2009c). In contrast, poetry and play reading both fell from survey to survey. The 2008 rates for these two activities were less than half what they had been in 1992. (See Figure 14, below.)
WHAT FACTORS ARE CORRELATED WITH LITERARY READING?Education
As with other forms of arts or cultural engagement, education was consistently the most important determinant of reading. Respondents with a graduate degree were roughly three times more likely to do any literary reading in the previous year than those with less than a high-school diploma. Overall, this relationship remained fairly stable, although the gaps narrowed a bit. By 2008, the figure for those with a graduate degree was 70 percent compared to a figure of 29 percent for those with less than a high-school diploma. (See Table 14, page 56.)
FIGURE 14Percent of U.S. adults who read any novels or short stories, poetry, or plays in the previous year, 1992–2008
Survey year
Perc
ent o
f U.S
. adu
lts
0%
10%
20%
30%
40%
50%
60%
PlaysPoetryNovels
200820021992
Source: Author’s calculations from Survey of Public Participation in the Arts, 1982–2008 combined file.
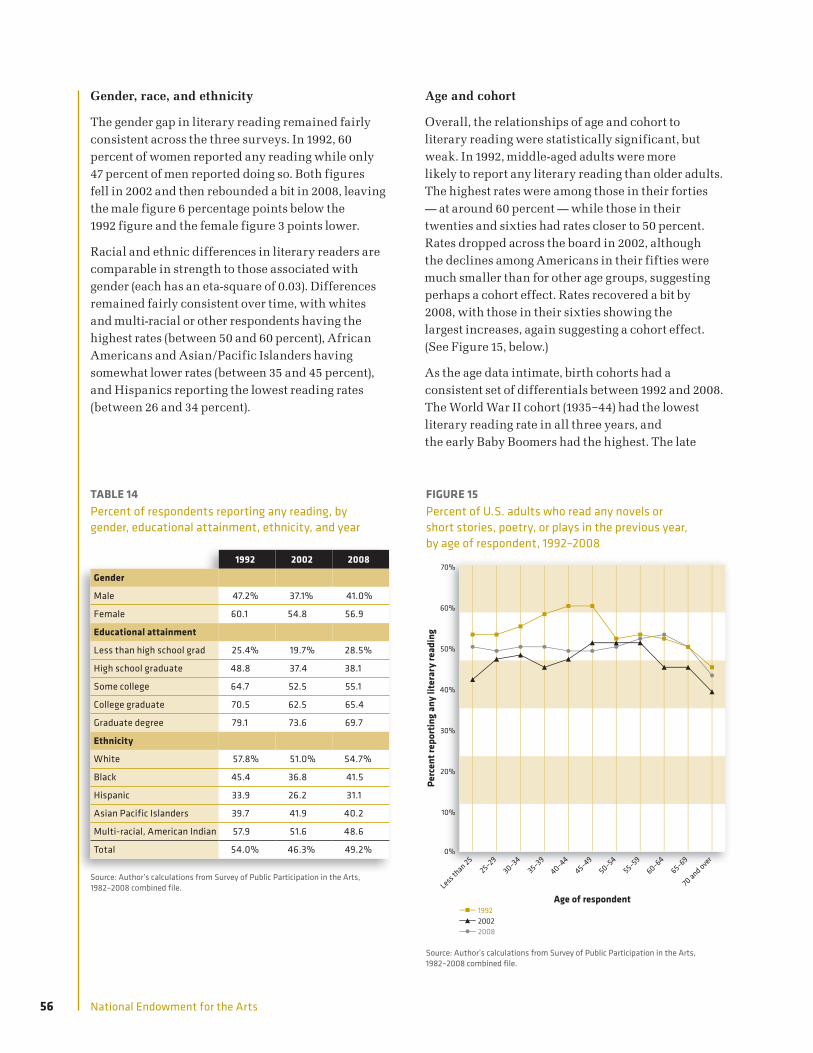
56 National Endowment for the Arts
Gender, race, and ethnicity
The gender gap in literary reading remained fairly consistent across the three surveys. In 1992, 60 percent of women reported any reading while only 47 percent of men reported doing so. Both figures fell in 2002 and then rebounded a bit in 2008, leaving the male figure 6 percentage points below the 1992 figure and the female figure 3 points lower.
Racial and ethnic differences in literary readers are comparable in strength to those associated with gender (each has an eta-square of 0.03). Differences remained fairly consistent over time, with whites and multi-racial or other respondents having the highest rates (between 50 and 60 percent), African Americans and Asian/Pacific Islanders having somewhat lower rates (between 35 and 45 percent), and Hispanics reporting the lowest reading rates (between 26 and 34 percent).
Age and cohort
Overall, the relationships of age and cohort to literary reading were statistically significant, but weak. In 1992, middle-aged adults were more likely to report any literary reading than older adults. The highest rates were among those in their forties — at around 60 percent — while those in their twenties and sixties had rates closer to 50 percent. Rates dropped across the board in 2002, although the declines among Americans in their fifties were much smaller than for other age groups, suggesting perhaps a cohort effect. Rates recovered a bit by 2008, with those in their sixties showing the largest increases, again suggesting a cohort effect. (See Figure 15, below.)
As the age data intimate, birth cohorts had a consistent set of differentials between 1992 and 2008. The World War II cohort (1935–44) had the lowest literary reading rate in all three years, and the early Baby Boomers had the highest. The late
TABLE 14 Percent of respondents reporting any reading, by gender, educational attainment, ethnicity, and year
1992 2002 2008
Gender
Male 47.2% 37.1% 41.0%
Female 60.1 54.8 56.9
Educational attainment
Less than high school grad 25.4% 19.7% 28.5%
High school graduate 48.8 37.4 38.1
Some college 64.7 52.5 55.1
College graduate 70.5 62.5 65.4
Graduate degree 79.1 73.6 69.7
Ethnicity
White 57.8% 51.0% 54.7%
Black 45.4 36.8 41.5
Hispanic 33.9 26.2 31.1
Asian Pacific Islanders 39.7 41.9 40.2
Multi-racial, American Indian 57.9 51.6 48.6
Total 54.0% 46.3% 49.2%
Source: Author’s calculations from Survey of Public Participation in the Arts, 1982–2008 combined file.
FIGURE 15Percent of U.S. adults who read any novels or short stories, poetry, or plays in the previous year, by age of respondent, 1992–2008
Age of respondent
Perc
ent r
epor
ting
any
liter
ary
read
ing
0%
10%
20%
30%
40%
50%
60%
70%
200820021992
70 and ove
r65–69
60–6455–59
50–5445–49
40–4435–39
30–3425–29
Less th
an 25
Source: Author’s calculations from Survey of Public Participation in the Arts, 1982–2008 combined file.

57Age and arts participation: A case against demographic destiny
Baby Boomers rate, which fell from 56 percent in 1992 to 49 percent in 2008, were closer to that of the World War II cohort in all three years. This trend is consistent with age data suggesting that as the early Baby Boomers aged, their reading rates tended to rise, while those of age groups behind them — including the late Boomers — tended to fall. (See Figure 16, below.)
Nevertheless, a raw comparison of cohorts is always a problematic because one is catching them at different points in their life cycles. To correct for this factor, we need to examine age and birth cohorts together. (See Figure 17, below.)
Disaggregating the results by age and cohort lead to a number of surprising results. First, these data suggest a fairly consistent decline in literary reading within each cohort as it ages. The World War II cohort, which we can chart only from the time these adults were in their late 40s, saw their reading rate
decline from 58 to 47 percent as it aged. The early Baby Boomer began with a 57 percent rate when they were in their late 30s and then declined to as low as 51 percent for those in their fifties. (Americans who were over 60 in 2008 had a 54 percent reading rate.) Finally, the late Baby Boomers began their late twenties with a literary reading rate at 55 percent, which fell to 50 percent when they were in their early fifties. Americans born after 1975 — often referred to as Millennials — reported low reading rates when they were under 25, but by the time they were in their late 20s, their rate was higher than that of respondents in Generation X.
At the same time, disaggregating the results by age changes our view of cohort behavior. The World War II cohort, instead of having the lowest literary reading rate, actually had the highest rate for every age group except those in their early sixties.
CHAP
TER
3
FIGURE 16Percent of U.S. adults who read any novels or short stories, poetry, or plays in the previous year, by birth cohort, 1992–2008
Year
Perc
en t
of re
spon
dent
s
0%
10%
20%
30%
40%
50%
60%
70%
1965–741955–64
1945–541935–1944Before 1935
200820021992
Source: Author’s calculations from Survey of Public Participation in the Arts, 1982–2008 combined file.
FIGURE 17Percent of U.S. adults who read any novels or short stories, poetry, or plays in the previous year, by age and birth cohort, 1982–2008
Age
Perc
ent o
f res
pond
ents
0%
10%
20%
30%
40%
50%
60%
70%
After 1975After 1975Generation X
Late Baby BoomEarly Baby BoomWorld War II
70 and ove
r65–69
60–6455–59
50–5445–49
40–4435–39
30–3425–29
Less th
an 25
Source: Author’s calculations from Survey of Public Participation in the Arts, 1982–2008 combined file.
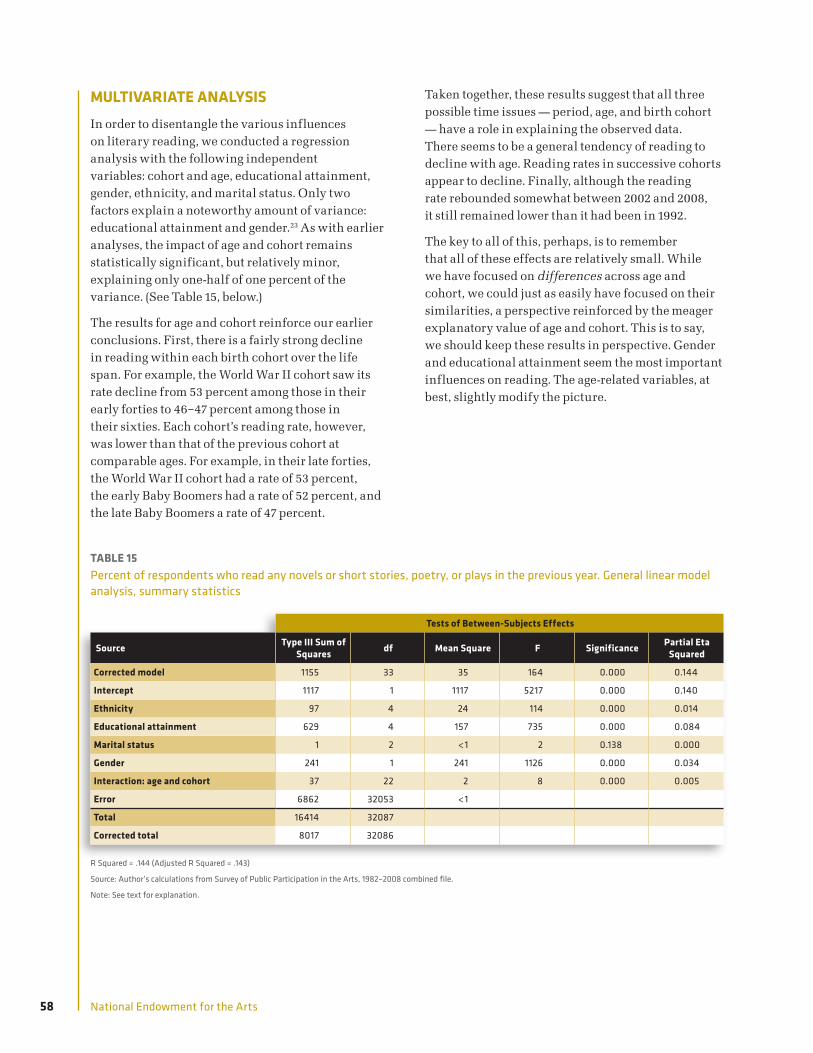
58 National Endowment for the Arts
MULTIVARIATE ANALYSISIn order to disentangle the various influences on literary reading, we conducted a regression analysis with the following independent variables: cohort and age, educational attainment, gender, ethnicity, and marital status. Only two factors explain a noteworthy amount of variance: educational attainment and gender.23 As with earlier analyses, the impact of age and cohort remains statistically significant, but relatively minor, explaining only one-half of one percent of the variance. (See Table 15, below.)
The results for age and cohort reinforce our earlier conclusions. First, there is a fairly strong decline in reading within each birth cohort over the life span. For example, the World War II cohort saw its rate decline from 53 percent among those in their early forties to 46–47 percent among those in their sixties. Each cohort’s reading rate, however, was lower than that of the previous cohort at comparable ages. For example, in their late forties, the World War II cohort had a rate of 53 percent, the early Baby Boomers had a rate of 52 percent, and the late Baby Boomers a rate of 47 percent.
Taken together, these results suggest that all three possible time issues — period, age, and birth cohort — have a role in explaining the observed data. There seems to be a general tendency of reading to decline with age. Reading rates in successive cohorts appear to decline. Finally, although the reading rate rebounded somewhat between 2002 and 2008, it still remained lower than it had been in 1992.
The key to all of this, perhaps, is to remember that all of these effects are relatively small. While we have focused on differences across age and cohort, we could just as easily have focused on their similarities, a perspective reinforced by the meager explanatory value of age and cohort. This is to say, we should keep these results in perspective. Gender and educational attainment seem the most important influences on reading. The age-related variables, at best, slightly modify the picture.
TABLE 15 Percent of respondents who read any novels or short stories, poetry, or plays in the previous year. General linear model analysis, summary statistics
Tests of Between-Subjects Effects
Source Type III Sum of Squares df Mean Square F Significance Partial Eta
Squared
Corrected model 1155 33 35 164 0.000 0.144
Intercept 1117 1 1117 5217 0.000 0.140
Ethnicity 97 4 24 114 0.000 0.014
Educational attainment 629 4 157 735 0.000 0.084
Marital status 1 2 <1 2 0.138 0.000
Gender 241 1 241 1126 0.000 0.034
Interaction: age and cohort 37 22 2 8 0.000 0.005
Error 6862 32053 <1
Total 16414 32087
Corrected total 8017 32086
R Squared = .144 (Adjusted R Squared = .143)
Source: Author’s calculations from Survey of Public Participation in the Arts, 1982–2008 combined file.
Note: See text for explanation.

59Age and arts participation: A case against demographic destiny
NOTES23 Educational attainment remains the most important, with a
partial eta-square of .08. Gender’s partial eta square was .03, about the same as its raw eta-square. When controlled for educational attainment, a large share of ethnicity’s explanatory power disappears. Its partial eta-square of .01 is about half of its raw eta-square.
CHAP
TER
3

National Endowment for the Arts60
The analysis of media and personal arts involvement fills in our view of overall arts participation, but does not alter the basic outline of the story.

61Age and arts participation: A case against demographic destiny
CHAPTER 4
MEDIA-BASED AND PERSONAL ARTS PARTICIPATION
INTRODUCTIONIn earlier chapters, we have examined different dimensions of arts participation from the perspective of age and cohort. We discovered, in most cases, that age and cohort have had a modest, but statistically significant, influence on live attendance at arts events and on literary reading behavior.
In this chapter, we turn to two topics to fill in our portrait of participation: consuming cultural content through the media, and personal or creative involvement in the arts. The core conclusions of our analysis are similar to those we have reached in other aspects of this study. The most important determinants of participation are educational attainment and gender. Although age and cohort in most cases have a statistically significant effect on participation, the magnitude of the effect is quite modest. Furthermore, when we control for other variables, even this apparent effect is reduced.
OVERALL PATTERNS IN MEDIA-BASED AND PERSONAL ARTS PARTICIPATIONOverall, media-based participation in the arts and personal participation have experienced the same declines as live attendance since 1992. By 1992, 58 percent of respondents reported some media-based participation and 55 percent some form of personal participation. The proportion of respondents reporting media-based arts participation fell sharply after 1992, from 63 to 41 percent in 2008. Personal participation in the arts (activities such as art-making, the performance of art, and the acquisition of artwork) fell from 56 in 1992 to 44 percent in 2002 and 42 percent in 2008.24
MEDIA-BASED AND PERSONAL ARTS PARTICIPATION BY AGE AND COHORTBetween 1992 and 2008, neither media-based nor personal arts participation exhibited a distinctive relationship to age. Media participation was lower among those under the age of 25 and over the age of 70, but for other age groups, it hovered between 58 and 54 percent across the three years. Personal participation exhibited a somewhat stronger relationship. It was lower among respondents in their twenties, rose to about 48 percent among age groups between 40 and 64, and then fell off slightly. Age differences explained less than one-half of one percent of the variation for both media-based and personal arts participation rates.
There was little change in these patterns from year to year. Rather, the overall declines in participation tended to shift the age curves down, without appreciable changes to their shapes. The relationships of age to these indicators — although weak to begin with — declined in explanatory power over time. In 2008, age explained less than 0.2 percent of the variance in media participation and 0.4 percent of the variance in personal participation. (See Table 16, page 62.)
Cohort, too, had little influence on either media or personal participation. The youngest and oldest cohorts had the lowest rates, while the World War II and the two Baby-Boom cohorts had the highest rates. Generation X’s media and personal participation rates were about five percentage points below those of the Baby-Boom generations. (See Table 17, page 62.)
The relationship of media participation to cohort declined over time. All cohorts experienced significant declines in participation across survey years. For example, the early Baby-Boom cohort saw its media-based arts participation rate decline
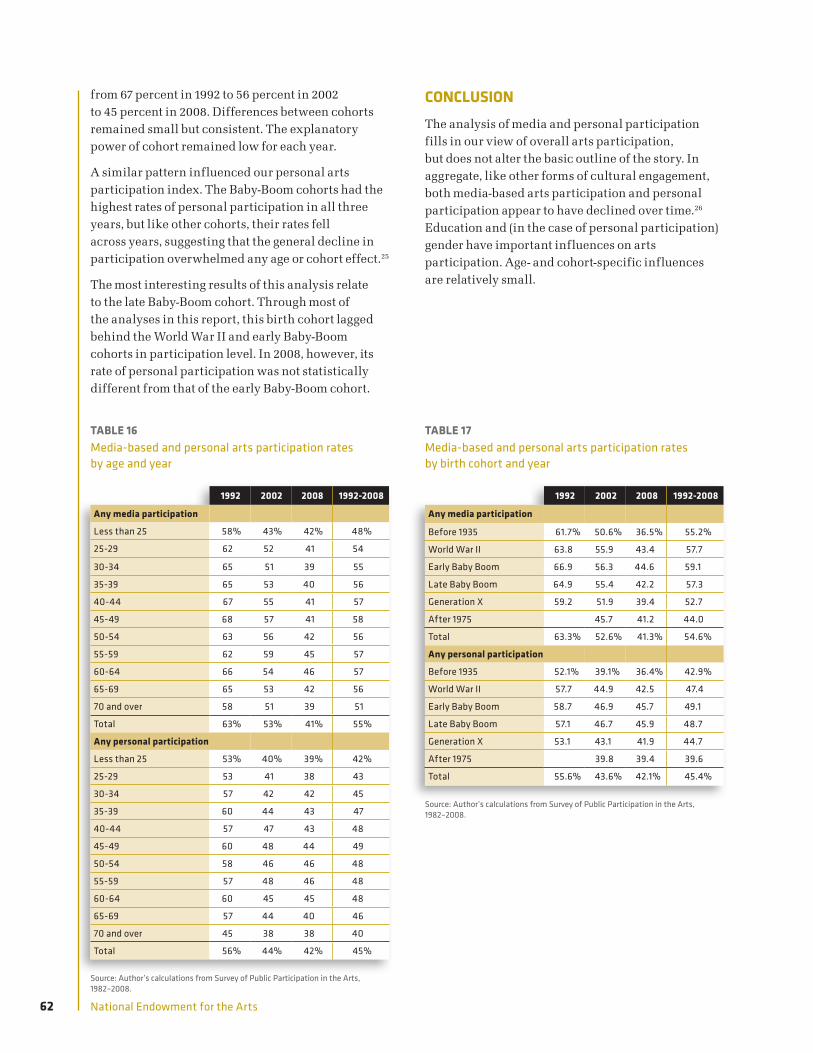
62 National Endowment for the Arts
from 67 percent in 1992 to 56 percent in 2002 to 45 percent in 2008. Differences between cohorts remained small but consistent. The explanatory power of cohort remained low for each year.
A similar pattern influenced our personal arts participation index. The Baby-Boom cohorts had the highest rates of personal participation in all three years, but like other cohorts, their rates fell across years, suggesting that the general decline in participation overwhelmed any age or cohort effect.25
The most interesting results of this analysis relate to the late Baby-Boom cohort. Through most of the analyses in this report, this birth cohort lagged behind the World War II and early Baby-Boom cohorts in participation level. In 2008, however, its rate of personal participation was not statistically different from that of the early Baby-Boom cohort.
CONCLUSIONThe analysis of media and personal participation fills in our view of overall arts participation, but does not alter the basic outline of the story. In aggregate, like other forms of cultural engagement, both media-based arts participation and personal participation appear to have declined over time.26 Education and (in the case of personal participation) gender have important influences on arts participation. Age- and cohort-specific influences are relatively small.
TABLE 16 Media-based and personal arts participation rates by age and year
1992 2002 2008 1992-2008
Any media participation
Less than 25 58% 43% 42% 48%
25-29 62 52 41 54
30-34 65 51 39 55
35-39 65 53 40 56
40-44 67 55 41 57
45-49 68 57 41 58
50-54 63 56 42 56
55-59 62 59 45 57
60-64 66 54 46 57
65-69 65 53 42 56
70 and over 58 51 39 51
Total 63% 53% 41% 55%
Any personal participation
Less than 25 53% 40% 39% 42%
25-29 53 41 38 43
30-34 57 42 42 45
35-39 60 44 43 47
40-44 57 47 43 48
45-49 60 48 44 49
50-54 58 46 46 48
55-59 57 48 46 48
60-64 60 45 45 48
65-69 57 44 40 46
70 and over 45 38 38 40
Total 56% 44% 42% 45%
Source: Author’s calculations from Survey of Public Participation in the Arts, 1982–2008.
TABLE 17Media-based and personal arts participation rates by birth cohort and year
1992 2002 2008 1992-2008
Any media participation
Before 1935 61.7% 50.6% 36.5% 55.2%
World War II 63.8 55.9 43.4 57.7
Early Baby Boom 66.9 56.3 44.6 59.1
Late Baby Boom 64.9 55.4 42.2 57.3
Generation X 59.2 51.9 39.4 52.7
After 1975 45.7 41.2 44.0
Total 63.3% 52.6% 41.3% 54.6%
Any personal participation
Before 1935 52.1% 39.1% 36.4% 42.9%
World War II 57.7 44.9 42.5 47.4
Early Baby Boom 58.7 46.9 45.7 49.1
Late Baby Boom 57.1 46.7 45.9 48.7
Generation X 53.1 43.1 41.9 44.7
After 1975 39.8 39.4 39.6
Total 55.6% 43.6% 42.1% 45.4%
Source: Author’s calculations from Survey of Public Participation in the Arts, 1982–2008.

63Age and arts participation: A case against demographic destiny
NOTES24 See the Technical Appendix for discussion of these variables.
The SPPA questions on personal and media participation have changed considerably from survey to survey, making accurate measurement of trends difficult. Sometimes general questions (played jazz) were replaced with more specific questions (performed jazz in public). In other cases, new categories were added, as composing music was in 1992, or dropped, as that same category was in 2008. Media participation went through some predictable changes; for example, television-watching in 1992 and earlier was replaced by TV-, VCR-, and DVD-watching in 2002. In addition, the 2008 survey reduced the number of media questions by combining questions on watching and listening to art programming.
25 The eta-square for the cohort was .003 in 1992 and .004 in 2002 and 2008.
26 However, see Footnote 25 (above) for a cautionary note about interpreting trend data for media-based and personal arts participation.
CHAP
TER
4
National Endowment for the Arts64
Factors that explain a few thousandths of the variation in participation will hardly define the future of art in America for good or ill.
65Age and arts participation: A case against demographic destiny
CHAPTER 5
CONCLUSION AND IMPLICATIONS
This paper has examined the role that age and cohort play in various forms of arts participation. It has examined four different dimensions of participation:
■ Live attendance at “benchmark” arts events ■ Literary reading ■ Personal participation in the arts ■ Media-based participation in the arts
Given the diversity of these various dimensions of cultural engagement, it is striking how consistent the findings are. Over the four dimensions, we discovered that age and cohort have statistically significant, but extremely modest impacts on levels of participation. Indeed, when educational attainment and gender are taken into consideration, the role of age and cohort fades even more.
This is not to say there are no patterns related to age and cohort. Overall, it appears that Americans born between 1935 and 1954 are more likely to participate in arts-related activities than those born after 1955. The strongest relationship noted in this report tied these cohorts to the omnivore cultural pattern. The decline of omnivores is a major cause of the decline in overall arts attendance since 1992. Generally, participation is higher among middle-aged persons than among very young adults and older Americans.
These broad findings appear to fly in the face of current understanding of civic participation, of which cultural participation is one element. As previously noted, Robert Putnam and the authors of A New Engagement? have suggested that birth cohorts provide the best framework for making sense of current patterns of civic engagement. Yet, as our re-analysis of their data reveals, age and cohort have a weak relationship to civic engagement and provide little power in explaining trends in participation.
The interest with age and cohort has as much to do with the future as the past. If age and cohort are strong predictors of arts participation, it is reasoned, then we may be able to better predict the future of the cultural audience by looking at younger cohorts and examining their preferences. The life-cycle literature’s concept of life trajectory supports this line of reasoning. If younger adults get into the habit of attending events, it is hoped, they will keep this habit as they age. Viewed another way, the decline of youth interest in a number of activities — not only classical music, but also jazz — may indicate that the future of these activities is in jeopardy.
A recent report by the League of American Orchestras (LAO 2010) epitomizes this approach. It suggests that the fate of classical music is tied to the behavior of cohorts. Graphing the same data used in this report — but with different cohort categories and a shortened vertical axis — the LAO report identifies a blip in classical music attendance as most cohorts age.
66 National Endowment for the Arts
In his New Yorker Blog, Unquiet Thoughts: Notes on Music, Alex Ross commented on the LAO study by underlining the strength of the “age-as-destiny” narrative:
You can see clearly how various generations experienced a bump in participation as they got older. The so-called Generation X, however, has yet to exhibit an upward spike as it moves into middle age. Every classical organization in America should print out this graph, pin it on the bulletin board, and ponder what is to be done. If the light-gray line doesn’t reverse direction in the next 10 years, those organizations may begin to fold (Ross 2010).
The present study’s findings challenge this perspective on two counts. First, age and cohort have little statistical power in explaining changes in arts participation. Factors that explain a few thousandths of the variation in participation will hardly define the future of art in America for either good or ill.
More importantly, this perspective underestimates how broader changes in personal life are influencing civic and arts participation. As we noted earlier, the middle of the 20th century represented the high-point of processes that standardized the life-course. A combination of the opportunity structure and coercive social norms created an environment in which a variety of personal decisions — when one married, entered the labor force, gave birth, or retired — occurred in lock-step fashion for a large share of the population. After 1970, this uniformity gave way to a new diversity of personal decision-making. The transition to adulthood became more protracted and characterized by diversity and autonomy. The timing of life-events for older Americans — retirement and household configurations — also became more varied; retirement ages have become less standardized and the “empty nest” life-cycle stage went from an exceptional to a typical household form for older adults. The growth of the population over the age of 85 led to a rethinking of old age (Stanger-Ross, Collins, and Stern 2005; Katz and Stern 2006).
This same pursuit of flexibility and informality has influenced the art world as well. If we are correct that the cultural omnivore is in decline, it may be because the omnivore represented a transitional stage in our cultural development. After all, Peterson and his collaborators discovered the omnivore pattern because of the unexpected loosening of the straitjacket of “cultural capital” associated with musical preference. Cultural participants were no longer willing to let their social status define what cultural tastes were acceptable for them. Although the omnivore — as measured by the SPPA — may be foundering, this quest for a more personal, flexible, and protean approach to cultural engagement appears very much alive.
A recent study by Alan Brown (2009) of WolfBrown Associates that measures the “cultural engagement index” for metropolitan Philadelphia illustrates the implications of this new perspective. Instead of beginning with a traditional view of arts participation as exemplified by the NEA’s “benchmark” arts activities, Brown began his surveys by engaging his respondents in their own definitions of creativity. Creativity turned up in some surprising places. Who anticipated that the “most common forms of dance participation are ‘watching TV shows about dance or dance competitions’ (32% ‘very important’), followed by ‘social dancing at clubs or parties’ (21% ‘very important’)”? Who would have expected that “‘writing for business purposes’ and ‘writing in a journal, diary or blog’ are the most common forms of creative expression through writing”?
By inviting his respondents to define cultural engagement rather than respond to a predetermined list of activities, Brown generated a surprising “top 10” list of cultural activities:
1. Listen to music on a local radio station. 2. Read books, magazines or newspapers. 3. Watch programs about science or history on TV. 4. Sing.5. Watch TV shows about dance. 6. Hear music as part of a worship service. 7. Do gardening or landscaping for fun.8. Prepare ethnic or traditional foods of your
heritage.9. Buy music for your own collection.10. Download music or listen to Internet radio/
streaming audio.

67Age and arts participation: A case against demographic destiny
Admittedly, Brown’s approach was not limited to “arts” activities, but it extended rather to a consideration of broader types of cultural participation. Still, for many activities that parallel the SPPA — such as reading — the method appears to generate much higher rates of cultural engagement than the SPPA. It does raise the possibility, moreover, that the SPPA’s methods — rather than Americans’ actual behavior — have influenced the trends in arts participation identified by the SPPA.
Notwithstanding the ultimate reason for changes in the SPPA trend line, the present study suggests that age and cohort are not destiny. Although age and cohort may shape the contours of the potential U.S. audience for the arts, the success of arts organizations will be guided by their ability to connect to the creative aspirations of current and future participants.
CHAP
TER
5

National Endowment for the Arts68
69Age and arts participation: A case against demographic destiny
REFERENCES
Attanasio, Orazio P. and Martin Browning. “Consumption over the Life Cycle and over the Business Cycle.” American Economic Review 85, no. 5 (December 1995): 1118–37.
Brown, Alan. Philadelphia Cultural Engagement Index. San Francisco: WolfBrown, 2009.
DiMaggio, Paul and Francie Ostrower. Race, Ethnicity, and Participation in the Arts. National Endowment for the Arts, Research Report #25. Washington, D.C.: Seven Locks Press, 1992.
Easterlin, Richard A. “What Will 1984 Be Like? Socioeconomic Implications of Recent Twists in Age Structure.” Demography 15, no. 4 (November 1978): 397–432.
Elder, Glen H. Children of the Great Depression: Social Change in Life Experience. Chicago: University of Chicago Press, 1974.
Fernandez-Villaverde, Jesus and Dirk Krueger. “Consumption over the Life Cycle: Facts from Consumer Expenditure Survey Data.” Review of Economic and Statistics 89, no. 3 (2007): 552–65.
Katz, Michael B. and Mark J. Stern. One Nation Divisible: What America Was and What It Is Becoming. New York: Russell Sage Foundation, 2006.
League of American Orchestras (LAO). Audience Demographic Research Review. New York and Washington, D.C.: League of American Orchestras, 2010.
National Endowment for the Arts. (2009b) Art-Goers in Their Communities: Patterns of Civic and Social Engagement. NEA Research Note #98. Washington, D.C.: National Endowment for the Arts, 2009.
————. Reading at Risk: A Survey of Literary Reading in America. Research Division Report #46. Washington, D.C.: National Endowment for the Arts, 2004.
————. (2009c) Reading on the Rise: A New Chapter in American Literacy. Washington, D.C.: National Endowment for the Arts, 2009.
————. To Read or Not To Read: A Question of National Consequence. Research Report #47. Washington, D.C.: National Endowment for the Arts, 2007.
————. (2009a) 2008 Survey of Public Participation in the Arts. Research Report #49. Washington, D.C.: National Endowment for the Arts, 2009.
Peterson, Richard A. “Understanding audience segmentation: From elite and mass to omnivore and univore.” Poetics 21, no. 4 (1992): 243–58.
Peterson, Richard A., Pamela C. Hull, and Roger M. Kern. Age and Arts Participation: 1982–1997. National Endowment for the Arts, Research Division Report #42. Santa Ana, CA: Seven Locks Press, 2000.
Peterson, Richard A., Darren E. Sherkat, Judith Huggins Balfe, and Rolf Meyersohn. Age and Arts Participation with a Focus on the Baby Boom Cohort. National Endowment for the Arts, Research Division Report #34. Santa Ana, CA: Seven Locks Press, 1996.

70 National Endowment for the Arts
Peterson, Richard A. and Albert Simkus. “How Musical Taste Groups Mark Occupational Status Groups.” In Cultivating Differences: Symbolic Boundaries and the Making of Inequality, edited by Michele Lamont and Marcel Fournier, 152–68. Chicago, IL: University of Chicago Press, 1992.
Putnam, Robert D. Making Democracy Work: Civic Traditions in Modern Italy. Princeton: Princeton University Press, 1993.
————. “Tuning In, Tuning Out: The Strange Disappearance of Social Capital in America.” PS: Political Science and Politics 28, no. 4 (December 1995): 664–83.
————. “The Strange Disappearance of Civic America.” The American Prospect 24 (Winter 1996): 34–48.
————. Bowling Alone: The Collapse and Revival of American Community. New York: Simon and Shuster, 2000.
Ross, Alex. Unquiet Thoughts: Notes on Music, The New Yorker Blog; “The Fatal X,” blog entry posted February 3, 2010. www.newyorker.com/online/blogs/alexross/2010/02/more-on-audiences.html.
Stanger-Ross, Jordan, Christina Collins, and Mark J. Stern. “Falling Far from the Tree: Transitions to Adulthood and the Social History of Twentieth-Century America.” Social Science History 29, no. 4 (Winter 2005): 625–48.
Wegner, D. M. White Bears and Other Unwanted Thoughts: Suppression, Obsession, and the Psychology of Mental Control. New York: Viking, 1989.
Zukin, Cliff, Scott Keeter, Molly Andolina, Krista Jenkins, and Michael X. Delli Carpini. A New Engagement? Political Participation, Civic Life, and the Changing American Citizen. Oxford and New York: Oxford University Press, 2006.

71Age and arts participation: A case against demographic destiny
REFE
REN
CES

National Endowment for the Arts72

73Age and arts participation: A case against demographic destiny
TECHNICAL APPENDIX
DATA SETSThe bulk of this analysis was conducted using the combined 1982–2008 Survey of Public Participation in the Arts file produced by the National Endowment for the Arts in November 2009. For most analyses, the file was weighted using the “normalized weights.” The analysis of media and personal participation used the individual SPPA files available on the Cultural Policy and the Arts National Data Archive (CPANDA) website. The constructed variables from this file were then merged into the 1982–2008 files.
The secondary analysis of civic participation in Chapter 1 used two datasets: the General Social Survey (GSS) conducted by the National Opinion Research Corporation (NORC) and the National Civic Engagement Survey I commissioned by the Center for Information and Research on Civic Learning and Engagement (CIRCLE) of the University of Maryland. The GSS dataset was downloaded from the Survey Documentation and Analysis website of the University of California-Berkeley. The NCES dataset was downloaded from CIRCLE’s website.
DEPENDENT VARIABLESMeasures of arts participation
Chapter 2 focuses on the “benchmark” measures of arts participation. These measures consist of a set of questions asked about live attendance at arts events in the previous year. The art activities included: jazz, salsa (added in 2008), classical music, opera, musical plays, non-musical plays, ballet, other dance (added in 1992), and art museums. These are dichotomous variables that are answered yes or no.
The SPPA has also included questions about the frequency of attendance at each of these activities. For 1982 and 1985, these questions asked about number of times attended in the previous month; in subsequent surveys, the question asked about number of times attended in the previous year. No effort was made to reconcile the two sets of questions.
■ We use three summary measures of benchmark participation:
■ Attendance at any benchmark activity — a dichotomous variable
■ Number of activities — how many types ofbenchmark activities a respondent reported attending in the previous year.
■ Number of events (1992–2008) — the aggregate number of events reported for all benchmark activities.
74 National Endowment for the Arts
Because this study focuses on the relationship of arts participation to age and cohort, rather than trends in overall attendance over time, “other dance” and “salsa and Latin music” have been included in our calculation of summary measures, to provide wider measures of attendance. We conducted a sensitivity analysis that determined that excluding these two variables would not have influenced any of the substantive findings of the study. However, our method increases the attendance indices in 1992, 2002, and 2008, and it understates the overall decline in attendance between 2002 and 2008. For example, if the two variables were excluded, the average number events attended would be 0.2 events lower in 1992, 0.1 events lower in 2002, and 0.2 events lower in 2008. Similarly, the average number of types of activities would have been 0.07, 0.06, and 0.08 lower in 1992, 2002, and 2008, respectively. Finally, attendance at any benchmark event would have been 1.1 percent, 0.7 percent, and 1.5 percent lower in 1992, 2002, and 2008, respectively.
Our decision to include “other dance” and salsa and Latin music in our calculations also tends to understate the decline in attendance that occurred between 2002 and 2008. Our method led to declines of 0.51 in average events, 0.13 in number of activities, and 4.1 percent in attendance at any benchmark event. Excluding “other dance” and salsa and Latin music would lead to estimated declines of 0.59 in number of events, 0.15 in number of activity types, and 4.9 percent in attendance in the three indices, respectively.
Chapter 4 examines the benchmark activities from the standpoint of patterns of participation. This analysis used a k-means clustering technique that aimed at assigning every case in the combined SPPA file to one of 10 clusters based on the similarity in its pattern of cultural participation. Cluster analysis is not driven by a particular theory; it simply looks for regularities within a body of data and seeks to group cases based on those regularities. The program allows the researcher to set the number of clusters. Using fewer than 10 resulted in clusters in which several of the least popular activities (opera and ballet) were not represented. The final cluster centers show that each of the eight activities was represented in at least one cluster.
The 10 clusters were then regrouped using Peterson’s theoretical constructs. As these tables show, one cluster — number 4 — epitomizes an omnivorous pattern; respondents in this group generally had been involved in all eight activities. In addition, four other clusters — numbers 3, 5, 9, and 10 — were characterized by multiple and diverse activities. Two clusters — numbers 6 and 8 — are consistent with Peterson’s concept of “highbrow” in that they involve more than one discipline that fit a traditional idea of “high art.” Over half of the respondents were members of cluster 1, which represented those involved in few or no activities. Finally, we group the remaining three categories into an “other” category. Although this report provides data on all of these clusters, we pay particular attention to the omnivore category. (See tables, page 75.)

75Age and arts participation: A case against demographic destiny
Chapter 4 uses the SPPA questions about literary reading. For some analyses, separate counts for novels, plays, and poetry are reported. For other analyses, we used a dichotomous variable based on a respondent’s report of reading any of these forms of literature.
Chapter 5 uses constructed indices for media and personal participation. These topics pose two methodological challenges. First, the questions used to track these areas have not been consistent over time. When the first SPPA was conducted in 1982, CDs, DVDs, and videocassettes were not in common use; as media have changed, so have the questions. Second, in a number of years, these questions were asked to only some respondents. As a result, the statistical power of the analysis of these data is weaker than for other elements of the study.
Because of these variations in the number, wording, and order of questions, it is difficult to conduct much analysis of trends in personal or media-based participation. For a study of age and cohort, this limitation is particularly constraining because it makes any attempt at tracking birth cohorts over time challenging.
Clearly, there is no way to overcome the limitation in the data. However, for exploratory purposes, we experimented with several summary measures to assess if they could tell us anything about how these dimensions of arts participation changed over time. (See tables, page 76.)
Cluster analysis. Benchmark arts activities a. Final cluster centers
Cluster # Jazz Opera Musicals Plays Ballet Art museum Classical Other
dance
1 0 0 0 0 0 0 0 0
2 0 0 1 0 0 0 0 0
3 1 0 1 1 0 1 0 0
4 1 1 1 1 1 1 1 1
5 1 0 0 0 0 0 0 1
6 0 0 0 0 1 1 0 0
7 0 0 0 0 0 1 0 0
8 0 0 0 0 0 1 1 0
9 0 0 1 0 0 1 1 0
10 0 0 1 0 0 0 1 0
Unweighted Weighted
Nonparticipants 49,536 50,094
Musicals 6,084 5,909
Jazz, musicals, plays, museums 3,861 3,768
Everything 1,556 1,499
Jazz, other dance 2,260 2,274
Ballet, museums 1,285 1,261
Museums 7,897 7,828
Museums, classical 3,866 3,770
Musicals, museums, classical 1,652 1,604
Musicals, classical 1,173 1,144
79,170 79,149
TECH
NIC
AL A
PPEN
DIX
b. Number of cases in each cluster
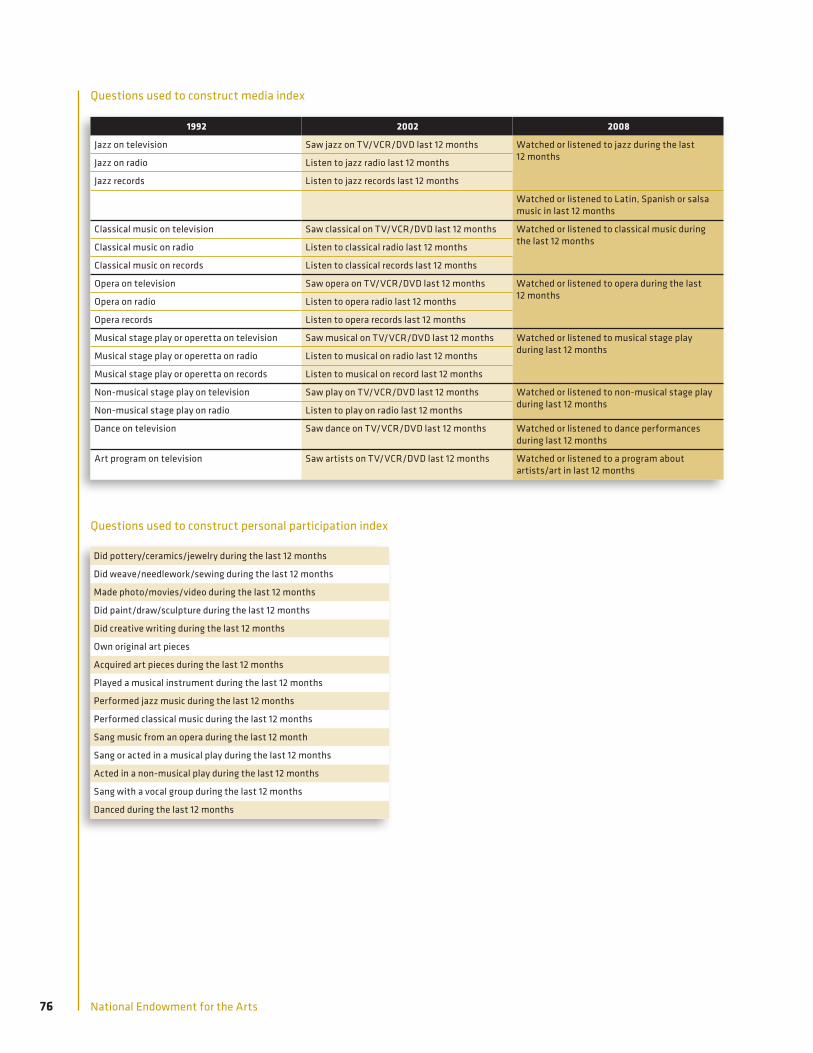
76 National Endowment for the Arts
Questions used to construct media index
1992 2002 2008
Jazz on television Saw jazz on TV/VCR/DVD last 12 months Watched or listened to jazz during the last 12 monthsJazz on radio Listen to jazz radio last 12 months
Jazz records Listen to jazz records last 12 months
Watched or listened to Latin, Spanish or salsa music in last 12 months
Classical music on television Saw classical on TV/VCR/DVD last 12 months Watched or listened to classical music during the last 12 monthsClassical music on radio Listen to classical radio last 12 months
Classical music on records Listen to classical records last 12 months
Opera on television Saw opera on TV/VCR/DVD last 12 months Watched or listened to opera during the last 12 monthsOpera on radio Listen to opera radio last 12 months
Opera records Listen to opera records last 12 months
Musical stage play or operetta on television Saw musical on TV/VCR/DVD last 12 months Watched or listened to musical stage play during last 12 monthsMusical stage play or operetta on radio Listen to musical on radio last 12 months
Musical stage play or operetta on records Listen to musical on record last 12 months
Non-musical stage play on television Saw play on TV/VCR/DVD last 12 months Watched or listened to non-musical stage play during last 12 monthsNon-musical stage play on radio Listen to play on radio last 12 months
Dance on television Saw dance on TV/VCR/DVD last 12 months Watched or listened to dance performances during last 12 months
Art program on television Saw artists on TV/VCR/DVD last 12 months Watched or listened to a program about artists/art in last 12 months
Questions used to construct personal participation index
Did pottery/ceramics/jewelry during the last 12 months
Did weave/needlework/sewing during the last 12 months
Made photo/movies/video during the last 12 months
Did paint/draw/sculpture during the last 12 months
Did creative writing during the last 12 months
Own original art pieces
Acquired art pieces during the last 12 months
Played a musical instrument during the last 12 months
Performed jazz music during the last 12 months
Performed classical music during the last 12 months
Sang music from an opera during the last 12 month
Sang or acted in a musical play during the last 12 months
Acted in a non-musical play during the last 12 months
Sang with a vocal group during the last 12 months
Danced during the last 12 months

77Age and arts participation: A case against demographic destiny
STATISTICAL TESTSFor the most part, this report relies on simple computation of means and cross-tabulations. In a number of cases, the report used regression analysis to control for the correlations between independent variables. Specifically, we used SPSS’s general linear model (GLM) program because it provided several benefits. First, it allowed the use of categorical variables without the separate computation of dummy variables. This same feature allows the analyst to enter interaction terms in the regression equation without the computation of separate interaction variables. The program computes a partial eta-square statistic that expresses the strength of the association between each independent variable and the dependent variable. Finally, the program computes estimates of marginal means — that is, the means of each factor, controlling for the effects of other factors in the equation.
One of the drawbacks of using GLM with dichotomous variables is that they violate several assumptions about the variance of the dependent variable. We conducted a set of logistic regressions that produced results similar to the GLM findings we reported. We chose to use the GLM findings because they are easier to explain to a general audience.
Because this report is primarily interested in the impact of age and birth cohort on participation, we have not reported all results from the general linear model analysis. Instead, we have reported summary statistics that estimate the relative strength of different factors and the estimated marginal means for age and birth cohort.
TECH
NIC
AL A
PPEN
DIXCORRECTED AUDIENCE SHARE AND INDEX
OF REPRESENTATIVENESSIn Chapter 2, we calculate audience shares corrected for changes in the composition of the entire SPPA population. The goal is to estimate how audience shares of different age groups would have changed if the overall composition of the population had not changed. In other words, we aimed to isolate changes in audience share that resulted from changes in respondents’ participation behavior from those that resulted simply from the growth or shrinkage of the size of a group.
These estimates require two steps. First, we calculated a set of correction factors that compare the population composition in each year to its composition across all five years. As these factors suggest in the 1980s, very young and very old age groups were overrepresented, compared with those between the ages of 40 and 59. By the end of the period, the Baby Boom had moved from young adulthood to older middle age. As a result, ages between 40 and 64 were overrepresented. (See Correction factor 1 table, page 78.)
The uncorrected audience share figures were divided by this correction factor to adjust for population change. However, because of differences in the composition of the participant population, this adjustment did not assure that the audience shares would add to 100 percent. Therefore, a second factor was applied to the preliminary corrected audience shares for each benchmark activity within each year so that they would add to 100 percent. This resulted in the final corrected audience share figures. (See Correction factor 2 table, page 78.)

78 National Endowment for the Arts
An alternative method for correcting audience share for population change is the calculation of an index of representativeness. The index was calculated by dividing each audience-share figure by that age group’s share of the entire population. This number was then multiplied by 100. Finally, we subtracted 100 from the resulting figure, so that a positive number indicates overrepresentation and a negative number indicates underrepresentation
This index can be interpreted as the percent by which the audience share for a particular age group is larger or smaller than its share of the entire population. If the number is positive, then audience share exceeds share of population; if negative, then audience share is less than population share.
Correction factor 1
Age 1982 1985 1992 2002 2008
Less than 25 1.204 1.114 0.900 0.900 0.886
25–29 1.197 1.197 1.032 0.827 0.818
30–34 1.054 1.091 1.148 0.894 0.884
35–39 0.931 1.012 1.154 1.043 0.911
40–44 0.807 0.883 1.076 1.195 1.033
45–49 0.795 0.795 0.985 1.210 1.163
50–54 0.881 0.830 0.843 1.111 1.251
55–59 0.985 0.929 0.816 0.999 1.182
60–64 1.038 1.055 0.923 0.907 1.055
65–69 1.060 1.060 1.060 0.887 0.964
70 and over 0.921 0.940 1.013 1.059 1.050
Correction factor 2
1982 1985 1992 2002 2008
Jazz 0.946 0.968 0.988 0.986 0.985
Classical music 1.016 1.010 1.007 0.983 0.980
Opera 1.028 1.021 1.006 0.991 0.984
Musicals 1.009 1.006 1.002 0.990 0.995
Plays 1.008 1.006 1.005 0.990 0.995
Ballet 1.000 0.992 1.000 0.977 0.994
Other dance 1.000 0.988 0.997
Art museum 0.996 0.996 0.996 0.992 1.003


National Endowment for the Arts 1100 Pennsylvania Ave, NW
Washington, DC 20506-0001 (202) 682-5400 www.arts.gov
Not for sale. Available for free at www.arts.gov