age dependency of beat-to-beat fluctuations in hemodynamic variables: spectral analysis of heart...
TRANSCRIPT
IournaI of the American SocieEy of Echocardiography Volume 9 Number 3 Abstracts 377
102B Regional Wall Motion Assessment using Acoustic Quantification Color Kinesis in Normal Subjects David Kovacich, Stephen G. Sawada, Harvey Feigenbaum, Douglas S. Segar, Indiana University, Indianapolis, IN
Acoustic Quantification Color Kinesis (AQCK) uses radiofrequency and integrated backscatter data on-line to determine the extent of endocardial excursion. We compared wall motion scores using conventional 2D imaging and AQCK in 25 normal volunteers, Methods: Parasternal long and short axis, apical 4 and 2 chamber views were captured digitally in both gray scale and AQCK in 25 normal volunteers (age<35, no cardiac history). The views were divided into 16 segments and wall motion graded in a blinded fashion as follows: 1=normal, 2=hypokinetic, 3=akinetic. Segments in the short axis view were graded independently from the other three views. Images from the normal subjects were interspersed among images from an additional 50 subjects referred to the lab for stress testing. Results:Segments (n=550) were graded in each modality; 19 segments in the gray scale group and 38 segments in the AQCK group were graded as hypokinetic. No segment in either group was graded as akinetic. Only one common segment was graded as hypokinetic using both modalities. In the AQCK group, 29/38 hypokinetic segments occured in four patients and were the result of either 1)incomplete tracking of the endocardium throughout systole or 2)false walls created by excessive use of lateral gain. Conclusions: Normal regional wall motion can be interpreted correctly using AQCK in a majority of patients. The echocardiographer, however, must be aware of potential artifacts before interpreting wall motion as abnormal.
102D Tbree-Dimeasional Echocardiographic Reconstruction of the Left Ventricular Cavity Using Three Differer~t Myocardial Wall Encoding and Endoeardial Border Imaging Techniques. Miguel Garcia-Fernandez PhD, Jose Azevedo MD, Pablo Puerta RN, Mar Moreno PhD, Daniel SanRoman MD, Esteban Torrecilla MD, Esteban Lopez de Sa MD, Jose Vallejo PhD, Juan Luis Delcan PhD. Laboratorio de Ecocardiografia, Sorvicio de Cardiologia, Hospital Universitario "Gregerio Mara~on", Madrid, Espada
Dynamic three-dimenalona] echocardiographic reconstruction (3-DR) of the left ventricle (LV) is a recently developed technique through which we are able to derive and at calculate volumetric and functional data of this cardiac chamber, Endoeardial border resolution and automated detection are critical steps in this process of 3-DR and calculation of LV volumes. Our purpose was to apply several myocardial wall encoding techniques and to evaluate their differences in terms of LV volumetric calculation after a common computerized process of 3-DR Using a polyhedral surface algorithm, LV volumes were calculated at end syslole (ESVol/ml), endiastole (EDVol/ml) as well as the stroke volume (StVol/ml) and ejection fraction (LV%EF/%). LV parameters were calculated using two- dimensional (2-DE), conventional (3-DE), color Doppler tissue (3-DE CD) and gray scale level conversion of CD (3-DE GL) 3-DR. Variation of the different techniques for the same parameters (% Var/%), intra-observer variability (lOb VarP/o) and mean correlation coefficient for these techniques compared to 2-DE were obtained and are the following:
DTI ESVo[ EDVol StVoI LV%EF lOb Vat r Coef 2-DE 77±20 151+19 74+15 49-+11 12+_6 3-DE 72&23 140-+15 68±18 4.9~10 9±6 0193 3-DE CD 75-+21 147=1:13 72~16 51±10 6+4 0,92 2*DE GL 64_+16 t30_+14 66+15 51±12 16+8 0.81 % Vat 17o/o I4% 11% 4% - - p Value <.01 .01 .02 ns <.01 <.001
Three-dimensional echocardiographic reconstruction of the left ventricle can be performed using different myocardial encoding techniques. Color Doppler tissue imaging is a feasible technique with the lowest variability. Three-dimensional reconstruction using the gray scale level conversion of the Doppler tissue imaging underestimates left ventricular volumes.
102C Age Dependency of Beat-to-beat Fluctuations in Hemodynamic Variables: Spectral Analysis of Heart Rate, Blood Pressure and Acoustic Quantification LV-Area Signals
Victor Mor-Avi PhD, Solange Akselrod PhD, Yael Amitay BS, Allan Jorge BS, Claudia Korcarz DVM, Joanne Sandelski RDMS, Jakob Karin PhD, Roberto Lang MD, Tel Aviv University, Israel and University of Chicago, Chicago IL
Spectral analysis of fluctuations in the instantaneous heart rate (IHR) and arterial blood pressure (ABP) provides valuable insight into the autonomic control of the cardiovascular system. Recently, noninvasive access to variations in LV area has been achieved with acoustic quantification (AQ) technology. This study was aimed to determine whether spectral analysis of AQ signals can demonstrate age- dependent fluctuations in LV dimensions as observed in the spectra of IHR and ABP. Normal subjects were studied and divided into two age groups: 20 to 35 yrs (n=13), and 36 to 52 yrs (n=13). Data were simultaneously acquired and digitized: (1) IHR; (2) noninvasive ABP (Ohmeda Finapress); (3) LV area AQ. Spectral analysis was performed using a fast Fourier transform (128 see). For inter-signal comparisons, power spectrum of each signal was normalized by the square of its mean value. Inter-group comparisons were performed by integrating over low frequency (LF) and respiratory frequency (RF) bands. Results. (1) In all subjects, fluctuations in LV area were detectable and quantifiable using spectral analysis. (2) In both age groups, fluctuations in IHR and LV-area were of the same magnitude, whereas ABP spectra were higher in LF band. (3) Older subjects had reduced power in both the LF and RF bands in both IHR and ABP spectra, whereas LV-area fluctuations were reduced only in the RF band. Conclusions: Since spectral analysis of AQ LV-area signals is feasible and indicates that the autonomic regulation of LV dimension differs from that of IHR and ABP, it may provide new information on the autonomic regulation of the mechanical properties of the heart.
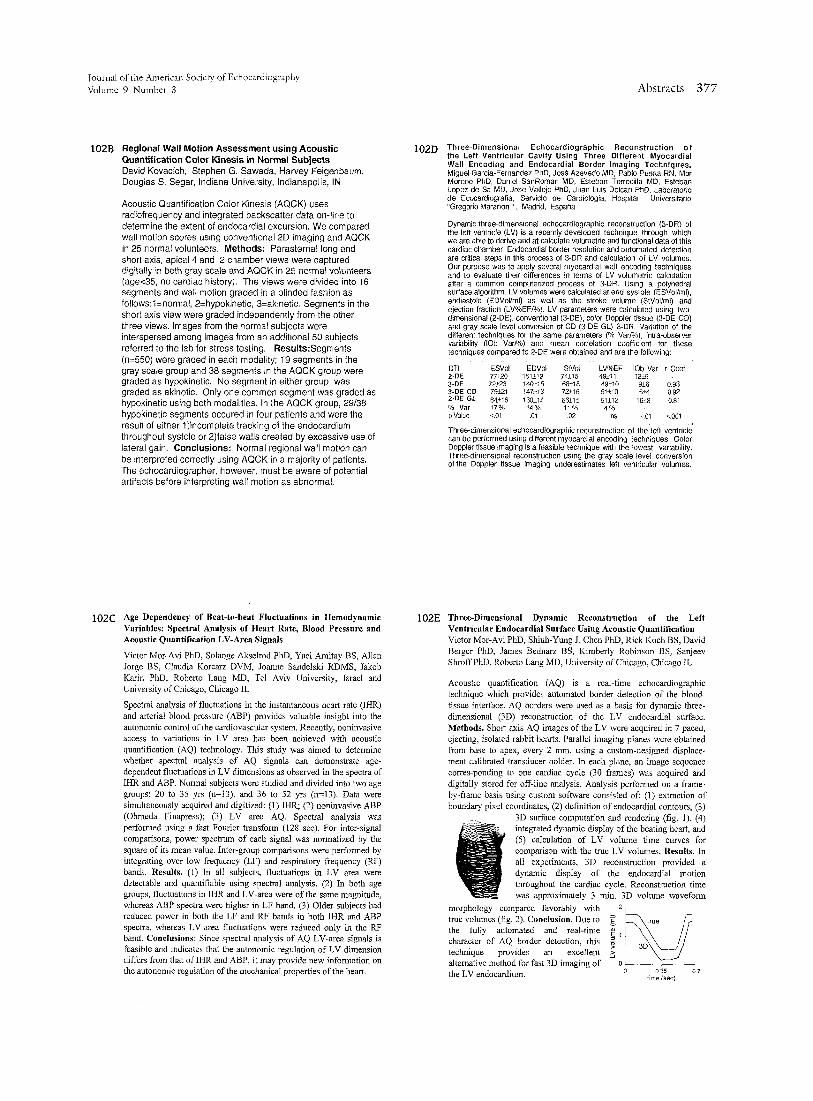
102E Three-Dimensional Dynamic Reconstruction of the Left Ventricular Endocardial Surface Using Acoustic Quantification Victor Mor-Avi PhD, Shiuh-Yung J, Chen PhD, Rick Koch BS, David Berger PhD, James Bednarz BS, Kimberly Robinson BS, Sanjeev Shroff PhD, Roberto Lang MD, University of Chicago, Chicago IL
Acoustic quantification (AQ) is a real-time echocardiographic technique which provides automated border detection of the blood- tissue interface. AQ borders were used as a basis for dynamic three- dimensional (3D) reconstruction of the LV endocardial surface. Methods. Short axis AQ images of the LV were acquired in 7 paced, ejecting, isolated rabbit hearts. Parallel imaging planes were obtained from base to apex, every 2 mm, using a custom-designed displace- ment-calibrated transducer holder. In each plane, an image sequence corres-ponding to one cardiac cycle (30 frames) was acquired and digitaiiy stored for off-line analysis. Analysis perfomled on a frame- by-frame basis using custom software consisted of: (1) extraction of boundary pixel coordinates, (2) definition of endocardial contours, (3)
3D surface computation and rendering (fig. 1), (4) integrated dynamic display of the beating heart, and (5) calculation of LV volume time curves for comparison with the true LV volumes. Results. In all experiments, 3D reconstruction provided a dynamic display of the endocardial motion throughout the cardiac cycle. Reconstruction time was approximately 3 rain. 3D volume waveform
morphology compared favorably with > 2 ~ ~ , - ~ r r ~ / true volumes (fig. 2). Conclusion. Due to true the fully automated and real-time ~ r \ / / character of AQ border detection, this technique provides an excellent ~ J alternative method for fast 3D imaging of o ~ - - - - - ~ the LV endocardium, o o.s5 0.7 time (see)