ageing, health inequalities and welfare state regimes a ...792086/fulltext01.pdf · which provide...
TRANSCRIPT
1
Ageing, health inequalities and welfare
state regimes – a multilevel analysis
Björn Högberg
Sociologiska institutionen
Mastersuppsats i sociologi 30 hp
Ht 2015
2
Abstract The paper studies class inequalities in health over the ageing process in a comparative
perspective. It investigates if health inequalities among the elderly vary between European
welfare state regimes, and if this variation is age-dependent. Previous comparative research
on health inequalities have largely failed to take age and ageing into account, and have not
investigated whether cross-country variation in health inequalities might differ for different
age categories. Since the elderly belong to the demographic category most dependent on
welfare policies, an ageing perspective is warranted. The study combines fives data rounds
(2002 to 2010) from the European Social Survey. Multilevel techniques are used, and the
analysis is stratified by age, comparing the 50-64 year olds with those aged 65-80 years.
Health is measured by self-assessed general health and disability status.
Two results stand out. First, class differences in health are strongly reduced or vanish
completely for the 65-80 year olds in the Social democratic welfare states, while they remain
stable or are in some cases even intensified in almost all other welfare states. Second, the
cross-country variation in health inequalities is much larger for the oldest (aged 65-80 years)
than is the case for the 50-64 year olds. It is concluded that welfare policies seem to
influence the magnitude of health inequalities, and that the importance of welfare state
context is greater for the elderly, who are more fragile and more reliant on welfare policies
such as public pensions and elderly care.
Keywords: health inequalities; social gradient in health; ageing; active ageing; welfare state;
welfare state regimes;
3
Contents
Page
Abstract 2
Contents 3
Introduction 4
Active ageing – a class blind concept? 5
Previous research 6
Welfare state regimes, health and ageing 10
Hypotheses 14
Data 15
Variables and operationalization 16
Statistical methods 19
Results 22
Conclusions and discussion 33
References 40
Appendix 1 - Descriptive statistics of outcome variables 46
Appendix 2 - Descriptive statistics of independent variables 49
Appendix 3 - Structure of missing values for social class 52
Appendix 4 - Graphical presentation of class-health associations for
50-64 and 65-80 year olds 53
4
Introduction
Demographic transitions pose challenges to welfare states all over Europe. An ageing
population, longer life expectancy, and a shrinking working age population as the post-war
baby boomers reach retirement puts the financial sustainability and viability of the welfare
state in question. Against the backdrop of these demographic developments, ageing has
taken centre stage of the political agenda around Europe (Häusermann, 2010). It is argued
that longer working lives and postponed retirement is necessary in the future: “active
ageing” has become the buzzword of contemporary political and scientific jargon (e.g. Corsi,
2012). But active ageing and the policies that comes with it, such as labour market or
retirement reform, are contentious issues and the equity considerations of active ageing
easily go unnoticed. Is the ability to continue working in old age equally distributed? Can
everyone enjoy the fruits of an active and healthy ageing to the same extent?
The political imperative of “active ageing” have ushered in an increased scientific and policy
interest in issues such the health of older workers and of retirees, of the consequences of
retirement and of how pensions strain public finances. However, despite a wide range of
studies on these topics, class remains invisible in much debate on active ageing. This
invisibility is all the more surprising considering the increasing interest in health inequalities
today (Marmot, 2004; Wilkinson, 2005). The existence of a social gradient in health –
meaning that health improves as one move up the social ladder – is a well-established fact
today, despite increased prosperity in the Western world (e.g. Commission on Social
Determinants of Health (CSDH), 2008). The mechanisms underlying this social gradient are
less well understood, however, with competing, though not necessarily incompatible,
theories (Carpiano et al., 2008). Inequality over the ageing process is a particularly pertinent
subject from this health equity perspective, as the elderly arguably are the most physically
fragile and simultaneously most reliant on welfare policies such as public pensions and
health care. The structure of welfare states, in turn, differs substantially between countries,
which provide scope for investigating how different welfare policies relate to health and
health inequalities in older age.
To date, comparative approaches to class differences in health and morbidity over the
ageing process have been a neglected area of research (Avendano et al., 2009). The
comparative literature on health inequalities have provided many important insights on
nearby issues, but have thus far not explicitly made morbidity for the elderly the focus of
analysis. This study aims to remedy this want of a class perspective on health and ageing,
thereby deepening and nuancing our understanding of the interplay of class, health and
welfare in later life. More specifically, the paper aims to investigate how health aspects
essential for an active ageing process – disability status and self-assessed general health –
varies depending on social class and age, and how these class differences in turn vary
between European welfare states. The overall objective is approached by answering three
concrete research questions: First, are class-based health inequalities age-dependent, that
5
is, do they differ for the relatively younger and older elderly? Second, do these health
inequalities among the elderly vary between European countries? Third, can country and age
differences in health inequalities be understood from a welfare state regime perspective;
that is, do class-based health inequalities among the elderly vary between welfare state
regimes, and is this regime variation relative to the age category studied? These questions
are approached within a multilevel analytical framework and with data from the European
Social Survey.
The study is structured as follows. First, previous research with relevance to the subject is
presented. Second, this research is related to the welfare state regime typology originally
developed by Gösta Esping-Andersen. On the basis is this three hypotheses are derived,
corresponding to our three research questions. Third, the data, statistical methods to be
employed and operationalization of variables is discussed. Fourth, the results are presented,
beginning with calculating health inequalities in each country separately, after which
multilevel models with welfare regimes as macro variables are calculated in order to test our
three hypotheses. All analyses are stratified by age. Last, the results are discussed against
the background of the welfare regime typology and put in relation to the existing research
previously presented.
Active ageing - a class-blind concept?
As stated, the ageing workforce and a practice of early retirement in Europe have ushered in
a new policy paradigm of “active ageing”. While the concept of active ageing in itself is
potentially multidimensional – in principle, it incorporates “lifelong learning, increased
leisure and an absence of retirement as we currently understand it” (Maltby, 2007: p 176) –
when translated into actual policy, it more often than not is reduced to prolonging working
lives. In line with this, the European Commission's “Active Ageing Index” ranges from
employment to social participation and health among the elderly, but the concrete targets
are usually confined to the employment domain: 50 % employment rate among the 50 - 64
year olds, and five years delayed work exit for older workers (Kasneci, 2007). Hence, beyond
lofty declarations, active ageing policies have mainly been restricted to curb early retirement
programs and provide financial incentives for work in older age (Loretto, 2007).
Moreover, notwithstanding this implicit economic bias, most “soft” targets in the “Active
Ageing Index”, e.g. regarding health or social and political participation, only refer to
averages over the whole of the population, and do not consider differences in the ability to
reach them. Only two (material deprivation and poverty risk) out of 22 indicators of active
ageing take inequalities into consideration (European Commission, Active Ageing Index).
Confining measurement of active ageing to population averages will inevitably mask large
variation within the respective population, as not everyone have equal resources and
capabilities to deal with, and are not affected by, ageing in the same way. This blindness to
individual differences and social inequality when it comes to active ageing is all the more
troubling when put in the context of the increased awareness and knowledge of often huge
6
and growing inequalities in contemporary societies. Concerns regarding (widening) social
cleavages are of course directed at economic inequality and poverty (Piketty, Stiglitz, 2012),
but increasingly focus on health and wellbeing as well (Wilkinson, 2005; CSDH, 2008; Sen,
2009). Socio-economic status – whether measured as social class, educational level or
income – has been shown to shape health trajectories and to determine life expectancy
(CSDH, 2008). Health, and health equity, should be a constitutive component of the active
ageing concept, not only in theory, but in actual policy as well. A growing body of literature
speaks of “accumulated advantage” as shaping life course inequalities: advantages or
disadvantages have a tendency to be self-reinforcing, thereby widening the gap between the
haves and the have nots as time passes (Cullatti et al., 2014; Merton, 1968; Willson, Shuey &
Elder, 2007; Shuey & Wilson, 2008). A class and inequality perspective should thus be even
more salient in active ageing policy and research.
Previous research
The research questions of this study touch upon three dimensions: the temporal, the spatial
and the social. The social dimension concerns social class and the social gradient in health.
This research field has already been touched upon, and it is too extensive and variegated to
be covered here; suffice is to say that the social gradient in health is a well-established fact,
but that the underlying mechanisms, as well as the causal direction, are sometimes in
dispute (Carpiano et al., 2008). The temporal dimension concerns how health inequalities
develop over the ageing process, and is in this section approached by discussing the theory
of accumulated advantage, and research on inequality in ageing, not least with regard to
retirement. The spatial dimension is geographical, that is, cross-country and cross-welfare
state, variation, and is approached by reviewing the literature on welfare state regimes and
comparative research on health inequalities in Europe.
Accumulated advantage and inequality in ageing
Accumulated advantage theory approach social inequalities through a life course
perspective, and takes feedback mechanisms as its starting point: a small advantage early in
life can, through a variety of feedback loops, turn into a self-reinforcing process of ever
increasing disparities (Cullatti et al., 2014; Merton, 1968; Willson, Shuey & Elder, 2007;
Shuey & Wilson, 2008). A minor difference in school grades can, for example, have far-
reaching long term consequences by shaping career trajectories. In its most deterministic
variant, accumulated advantage predicts a trajectory of ever widening gaps between the
haves and have nots over the life course. A more realistic reading, however, might be that
inequalities in later life cannot be isolated from earlier life events, and that countervailing
forces might be necessary at all stages of the life course so as to prevent that inequalities
reach unacceptable levels. In the context of this paper, accumulated advantage would imply
that, in the absence of public policies to counteract self-reinforcing diverging tendencies,
labour market based economic inequalities (remember that social class is constituted by
7
occupation and labour market position) will persist or even magnify in later life and
especially after retirement, and this will in turn translate into diverging health disparities as
well. Accumulated advantage theory has found empirical support regarding variables ranging
from self-rated health (Shuey & Willson, 2008) to mobility and cognitive functions (Leopold
& Engelhardt, 2011) and poverty risk (Kangas & Palme, 2000).
Retirement is of particular importance with regard to accumulated advantage in older age,
as it is arguably the major life-changing event that people experience in this stage of life. No
scientific consensus has thus far been established concerning the health effects of
retirement, whether early or at statutory age (van Solinge & Henkens, 2008; Wang, Henkens
& van Solinge, 2011). Some studies have described a seemingly paradoxical situation, where
the well-deserved rest at the autumn of life rather turns out to be detrimental for health
(e.g. Tsai et al., 2005). Other studies have taken the opposite stand, and argue that (early)
retirement is rather beneficial for health, and thereby, in a sense, facilitating for active
ageing (Brockmann, Müller & Helmert, 2009; Coe & Zamarro, 2011). Still others view
retirement as a basically minor or even negligible life event in terms of health effects; in
itself, it is neither favourable nor harmful, and other, pre-retirement factors are more
paramount (Hyde et al., 2004; Hult, Stattin, Janlert & Järvholm, 2009; Halleröd, Örestig &
Stattin, 2013). An emerging consensus seems to be that retirement effects are
heterogeneous and non-uniform: the consequences are context-dependent and vary for
different sub-groups in different situations (Nordenmark & Stattin, 2009; Wang, Henkens &
van Solinge, 2011; van der Heide et al., 2013). This would make it particularly relevant to
introduce a social class and inequality approach to the subject. The, admittedly rare, studies
that have examined retirement effects from an inequality perspective have not confirmed
the predictions of accumulated advantage theory; rather, they have come to the conclusion
that retirement can counteract a diverging trajectory in health inequalities. Westerlund and
colleagues found that the trajectory of divergence in perceived health between lower and
higher grade employees is reversed after retirement: health disparities are not diminished,
but stops growing. Also, workers with physically demanding jobs benefited more from
retirement (Westerlund et al., 2009). A study by Berg et al. (1988) drew similar conclusions:
the health differences (measured as musculoskeletal symptoms) between manual and office
workers increased for those who stayed in employment during follow-up, but stayed
constant for those who retired (Berg et al., 1988). Some evidence thus point to that
retirement can, at least temporarily, halt a diverging trajectory in class-based health
differences, which would imply that health inequalities over the ageing process might have a
different dynamic than for working age individuals. In this sense, we might say that the
validity of accumulated advantage theory is conditional on age and welfare context.
Ageing, health inequalities and the welfare state
Ageing and inequalities over the ageing process have thus far received rather scant attention
from a comparative perspective (Avendano et al., 2009), but the comparative literature on
8
health and health inequalities in the overall population is extensive. Much of this research
has taken so called welfare state regimes as point of departure (Bergqvist et al., 2013; Chung
& Muntaner, 2007). The underlying logic is that research in social epidemiology have
demonstrated that the resources – constituting what is often termed the social
determinants of health – available to individuals and households shape health and health
inequalities. These resources range from material goods, such as working conditions and
housing, to “health literacy” and to the capability to lead a healthy life (Hurrelmann,
Rathmann & Richter, 2010). The social determinants of health are in turn shaped by welfare
policies; either generated directly through welfare services (e.g. public health care), or
indirectly (re)distributed by the welfare state through for example public pensions and
family support (Lundberg, 2008). And as stated, the significance of welfare policies is even
greater for fragile groups such as the elderly.
The insight that material resources and conditions are determinate for health, and that they
in turn are shaped by the welfare state, constitutes the basis for putting welfare states – and
more specifically welfare state regimes, as theorized by Gösta Esping-Andersen (Esping-
Andersen, 1990) – at the center of analysis of health inequalities. Esping-Andersen's
typology has been widely discussed; at times fundamentally criticized, at times modified,
with new regimes added and specific countries moved from one regime to another. Today it
is common practice in European welfare state research to distinguish between five regimes:
a Social democratic regime, comprising the Nordic countries; a Liberal regime, covering the
Anglo-Saxon world plus Switzerland; a Conservative regime in Continental Europe; a
Southern regime, comprising the Mediterranean countries; and an Eastern regime,
comprising the post-communist countries in Central and Eastern Europe (Eikemo, 2008a;
Eikemo, 2008b). We shall return to the more specific characteristics of the respective
regimes soon; here suffice is to say that the Social democratic regime is characterized by
universal policies, a high degree of redistribution and a central position for the public sector;
the Conservative regime by occupationally based and status maintaining welfare policies
with a central position for the family; the Liberal regime by residual welfare policies and a
central position for the market; while the Southern and Eastern regimes can be considered
as rudimentary and less developed versions of the Conservative and Liberal regimes,
respectively. The Social democratic regime is considered as having the highest degree of
social equality, followed by the Conservative regime, with the Liberal, Southern and Eastern
regimes being least equal.
The literature on cross-country or cross-welfare state variation in health and health
inequalities gives a somewhat ambiguous picture. Much of the empirical inconsistency
between studies is probably due to different conceptualizations of socio-economic inequality
(that is, are inequalities based on social/occupational class, education or income?), health
measures (mortality, self-assessed health, long-term illness), age groups (adolescents,
working-age population) and countries studied. Two systematic reviews of the comparative
literature regarding health, health inequalities and welfare state regimes arrived at similar
9
judgments: one concluded that just under half of studies reported overall population health
to be best in the Social democratic regime, but that evidence is less consistent on the matter
of health inequalities (Brennenstuhl et al., 2012), while another found that a majority of
studies reported better population health in Social democratic countries, but that, again,
evidence on health disparities based on socio-economic status and gender were less
conclusive (Muntaner et al., 2011).
In terms of education based inequalities in self-assessed health and disability for the full
adult population, Eikemo et al. (2008a) report that inequalities are smallest in the
Conservative regime, highest in the Southern regime with Social democratic, Liberal and
Eastern regimes in between. The large education-based inequalities in self-assessed health
in Southern Europe are confirmed by Kunst et al (2005), but they instead found inequalities
to be smallest in Social democratic countries. Mackenbach et al. (2008) combined mortality
data across countries, and found education based mortality differences to be smallest in
Spain and Italy, followed by Continental European and Nordic countries, with Eastern Europe
showing by far the largest inequalities. Finland stood out with much larger inequalities than
its Nordic neighbors, and, alongside France and England had the largest inequalities in
Western Europe. A compilation of eight national surveys with disability free life expectancy
as outcome found absolute differences between educational groups to be largest in
Lithuania (the only Eastern European country), also large in France, Austria, Finland and
Norway, and small in Italy and Spain (Mäki et al., 2013). With long-term illness as outcome
measure, Espelt et al. (2008), instead found that Spain and Portugal have the largest
differences between educational groups for the 50 -74 year old population, with
Conservative countries being more equal than Social democratic ones. Using health
transitions (that is, incidence of self-assessed health, disability, and any chronic disease) over
a two year follow up in 10 countries, Avendano et al. (2009) found that education was most
strongly related to transition to morbidity in Southern Europe, and least strong in Northern
Europe (Sweden and Denmark). This study investigated a similar age cohort as the present
one (50 years +), but used a more limited country sample, health transitions as outcome and
did not stratify the sample by age.
For health inequalities based on income, van Doorslaer and Koolman found no consistent
regime pattern in self-assessed health, but inequalities appear to be smallest in Continental
Europe and largest in Portugal, Denmark and the UK (van Doorslaer & Koolman, 2004). A
similarly constructed paper reported the largest income based health inequalities in the US
and the UK, and smallest in Finland and Sweden (van Doorslaer et al., 1997). High income
based inequalities (for self-assessed health and disability) in Liberal welfare states such as
the UK have also been reported by Eikemo et al. (2008c), but their results point to
intermediate-sized inequalities in Southern Europe, and lower inequalities in Conservative
than in Social democratic welfare states.
10
The equivalent literature based on class is largely restricted to mortality as health outcome,
whereas the literature on morbidity is quite meagre. Espelt et al. (2008) report class
differences in Southern Europe being larger than in Conservative and Social democratic
countries. A compilation of national surveys found relative and absolute mortality
differences between occupational classes (operationalized on the EGP schema) to be highest
in Finland, Switzerland and Lithuania (the only Eastern European country), and smallest in
Spain, Italy and the Netherlands. This study was restricted to economically active men aged
30-59, however (Toch-Marquardt et al., 2014). Studies using data from the 1980s give a
more mixed picture. One study of men aged 45-59 found a north-south divide with larger
class-based mortality differences in Northern Europe (England, Wales, Ireland and the
Nordic countries) than in the Mediterranean countries and France (Kunst et al., 1998a), but
in another study, also restricted to men aged 45-59, only France stood out with above
average mortality risk ratios for manual workers; the Scandinavian countries and England
were on par with Spain, Portugal and Italy (Kunst et al., 1998b). These latter studies, with
mortality as outcome (including those studying education-based mortality differences), have
not been explicitly oriented to welfare regimes, and have used fairly small country samples,
wherefore general conclusions regarding welfare regimes are difficult to make.
The two comparative studies cited above with focus on those aged 50 years or more (e.g.
Espelt et al., 2008; Avendano et al., 2009) have not stratified the analysis by age, and not
investigated if health inequalities among the elderly differ for the oldest as compared to the
relatively younger. The explicit conceptualization of ageing as a non-uniform process, in line
with accumulated advantage theory, distinguishes the present study from these two.
A couple of papers have controlled for differences between age groups when studying
health and ageing, but these have not compared individual countries or welfare regimes, but
instead the effects of specific policies. Norström and Palme (2010) distinguished between
basic (universal) and income (earnings-related) pensions, and found that basic incomes
reduce old age excessive mortality (excessive compared to middle age mortality) but income
pensions do not. Basic pensions have particularly strong effect for women, which is
explained by the poverty alleviating impact of universal benefits, above all for those with
weak employment records (Norström & Palme, 2010). In a similar vein, Palme & Esser
(2010), studied cross-country differences in excess morbidity and reached similar
conclusions: generous basic security significantly reduces excess morbidity, again most of all
for women (Esser & Palme, 2010). These studies have not focused on the social gradient in
health, however.
Welfare state regimes, health and ageing
As is evident from the “Previous research”-section, much comparative health research has
taken welfare state regimes as point of departure. The present paper joins this approach:
instead of only analyzing countries separately, or only combining observations from all
11
countries into one dataset, it groups countries into theoretically informed clusters, or
welfare regimes. This enables a deeper understanding of how specific welfare policies might
shape health inequalities. Theoretical typologies, such as welfare regimes, can moreover be
a fruitful heuristic tool for deriving hypotheses and research questions, a tool to reduce,
structure and explain empirical complexity, to enable comparison and to identify causal
relations. Having said that, it must be kept in mind that ideal-types, such as the welfare
regimes typology, are theoretical constructions that can never be found in pure form in the
empirical world; they are designed deductively, so as to be internally and logically
consistent, not to fully correspond to reality. The litmus test of a theoretical ideal type is
how well it captures regularities of a complex reality while maintaining a maximum of
conceptual parsimony. Ideally, in this case, the theory should be able to integrate the
pension system with the labour market and welfare services, and on the basis of this derive
hypotheses or provide explanations regarding health inequalities in older age.
In contemporary European welfare state research it is, as mentioned, common practice to
distinguish between five welfare regimes (Eikemo, 2008a; Eikemo, 2008b). However, the
original regime typology was developed on the basis of a smaller, western European country
sample, why the principles underlying the regime classification are derived from the three
Western European regimes: the Liberal, Conservative and Social democratic ones. This need
not be a problem, as the Eastern and Southern regimes can be regarded less developed or
rudimentary versions of the Liberal and Conservative ideal types respectively, and with Karl
Marx “the anatomy of man is a key to the anatomy of the ape” (Marx, 1993(1858)). The
anatomy, or structure, of the Liberal and Conservative regimes has bearing on the
functioning of the Southern and Eastern regimes as well. The following discussion will thus
concentrate on how the three original regime types are logically distinct from one another
concerning the central dimensions of pension system, welfare services and the labour
market, and how different policies on these dimensions in turn might influence material and
by extension health inequalities. The underlying principles and the mechanisms whereby
these relate to health inequalities can then be extended to the Southern and Eastern
regimes.
Concerning the social security system, including the pension system, Esping-Andersen
distinguishes between two governing principles and the three “combinations” that these can
constitute (Esping-Andersen, 1999). Social security can be contributory on the financing
dimension, in which case eligibility and coverage are based on contributions and
employment, benefits are earnings-related, and the system is basically status maintaining.
This is the Bismarckian model (Bonoli, 1997; Bonoli, 2003), and is found in what Esping-
Andersen labels as Conservative welfare states. A crucial feature of the Conservative regime
is that social security tends to be fragmented: occupational groups have their own disparate
collective agreements, which creates a segmented social landscape, and ties pension
benefits closely to occupational status. The social security system can also be tax-financed,
universal in coverage and provide flat-rate minimum benefits. This is characteristic of so
12
called Liberal countries, where benefits are in principle universal, but often means-tested,
meagre, and directed at the poor, so as to prevent absolute poverty (i.e. residual welfare).
Social democratic welfare states, on the other hand, combines these two principles: workers
are covered by earnings-related social security, while those falling outside the earning-
related schemes are covered by universal benefits (Korpi & Palme, 1998). Unlike in Liberal
welfare states, the universal benefits in Social democratic countries are in principle not
means-tested, but given as a social right, and they are in general more generous and thus
much more redistributive. These different governing principles have far-reaching
distributional consequences: the class differences tend to be much smaller in Social
democratic countries than in both the other regime types. Liberal countries are least
redistributive, as they mainly rely on market mechanisms, which basically reproduce existing
labour market inequalities. Conservative countries are slightly more redistributive than
Liberal ones, but the redistribution is more horizontal, i.e. limited to distribution within
social classes or occupational groups, rather than vertical, i.e. between social classes (Bonoli,
1997). Rudimentary Eastern and Southern welfare states are also characterized by a low
degree of redistribution and equality.
Not only monetary resources are important for health in older age, but also welfare services
such as health care and elderly care. A characteristic feature of the Social democratic welfare
regime, distinguishing it from the other four regimes, is that it is uniquely service oriented
(Esping-Andersen, 1999). Whereas the sometimes equally high social expenditures in the
Conservative and Southern regimes are transfer-heavy, social expenditure in the Social
democratic regime are to a large extent spent on public production of welfare services.
Liberal and Eastern, more market based, welfare states rely more on market and/or informal
family provision of care services, while Conservative and especially Southern welfare states
are “familialistic”, that is, the family have the principal responsibility for care provision. Of
particular importance here is elderly care (Bettio & Verashchagina, 2010; Rodriquez, Huber
& Lamura, 2012). Elderly care, if universally provided, can be expected to have a double
health-promoting and equalizing effect: a direct positive effect on the recipient of care, and
an indirect positive effect on the recipient's spouse or relatives, who are relieved of their
care responsibilities. When care responsibilities are taken over by the public, individual
material resources (to buy care in private markets) and family (to provide informal care) are
less decisive for the quality and quantity of care provision.
Accumulated advantage theory asserts that inequalities are shaped and accumulated
continuously over the life course, why labour market inequalities must be taken into account
here. Again, this aspect distinguishes the Social democratic regime from the four others.
Unions in the other regimes are, in general, either weak (e.g. in Eastern and Liberal
countries) or occupationally or sectorally fragmented and with a more narrow membership
base (e.g. in Conservative and Southern countries) (Rothstein, 1992). Weak unions in
combination with unregulated labour markets, such as in Liberal countries, tend to give rise
to high wage dispersion and an extensive low wage sector (Esping-Andersen, 1999).
13
Fragmented but strong or militant unions but with a narrow membership base in
combination with regulated labour markets, such as in Conservative or Southern countries,
tend to produce dualized labour markets: in sectors and occupational categories where
unions are weak – often dominated by women, young workers and workers with a-typcial
contracts – pensions and other benefits are likely to be less generous and less redistributive
than for core workers (Emmenegger et al., 2012). Centralized, encompassing unions with a
larger membership base, characteristic of the Social democratic countries, are less likely to
contribute to this kind of dualization, since more “non-core” workers are also represented
within the unions (Anderson & Meyer, 2003). Hence labour market inequalities, both in
terms of earnings (and thus pensions) and in terms of working conditions (also relevant for
health), can be expected to be smallest in Social democratic countries, largest in Liberal (and
Eastern) countries, and have a dualized character in Conservative (and Southern) countries.
The Southern regime can perhaps best be understood as a rudimentary or radicalized
version of the Conservative regime. It shares the same fragmented pension system, transfer-
heavy welfare policies, family-based care provision and dualized labour market, but in more
radical versions: it is more fragmented, have less developed public care services, more
familialistic and have a sharper insider-outsider divide than its Continental European
neighbors (Ferrera, 1996; Esping-Andersen, 1999). The Eastern, post-communist regime is
the newest member of the welfare regime group, and the least theoretically developed due
to its transition status. The Eastern countries have been moving towards a Liberal, free-
market economy, and the Eastern welfare regime, though heterogeneous, is characterized
by high economic inequality, low social expenditure, meagre public provision of care
services, including health care, and an under-developed pension system. Unlike in Liberal
welfare states, the private welfare market is as yet quite rudimentary and fragmented,
leaving a vacuum ever since much public welfare was dismantled after 1989 (Kovacs, 2002;
Richter et al., 2012).
A final remark on the actuality of Esping-Andersen's welfare regime approach: it was first
formulated in 1990, and it might be questioned whether or not it is still applicable in
contemporary settings. Especially with regard to pension policy and employment policy
directed at older workers and women, major reforms have been initiated in most welfare
states in recent years (European Commission, 2012; Häusermann, 2010), reforms that may
have rendered the regime typology partially obsolete. On the other hand, institutional
theory suggests that reform tend to be path-dependent in that existing institutional
structures shape reform trajectories (Pierson, 2000). Institutional change therefore is usually
incremental and builds upon existing arrangements, as has been shown with regard to
pension reform (Bonoli, 2003). So even if the regimes would be gradually disintegrating,
traces should still be visible today. Moreover, welfare state regimes, although sometimes
with minor modifications, are still in wide use in contemporary comparative welfare state
research (Bambra, 2007), which bear witness of their continued actuality.
14
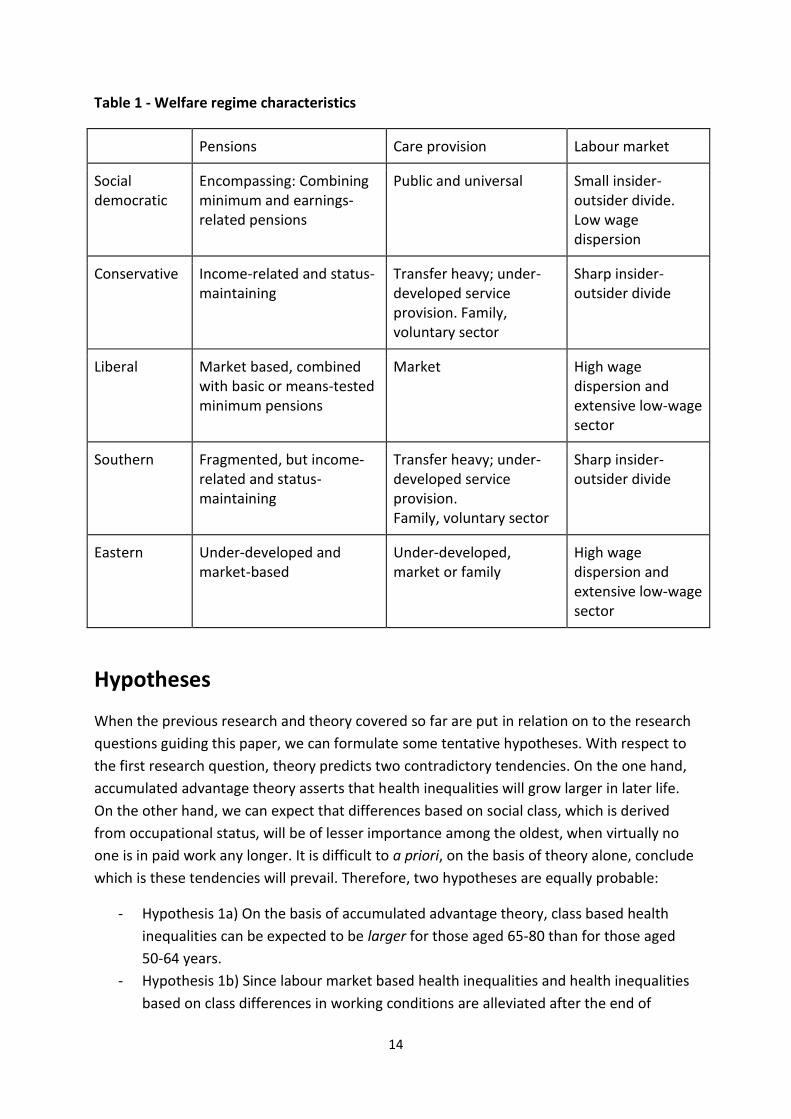
Table 1 - Welfare regime characteristics
Pensions Care provision Labour market
Social democratic
Encompassing: Combining minimum and earnings-related pensions
Public and universal Small insider-outsider divide. Low wage dispersion
Conservative Income-related and status-maintaining
Transfer heavy; under-developed service provision. Family, voluntary sector
Sharp insider-outsider divide
Liberal Market based, combined with basic or means-tested minimum pensions
Market High wage dispersion and extensive low-wage sector
Southern Fragmented, but income-related and status-maintaining
Transfer heavy; under-developed service provision. Family, voluntary sector
Sharp insider-outsider divide
Eastern Under-developed and market-based
Under-developed, market or family
High wage dispersion and extensive low-wage sector
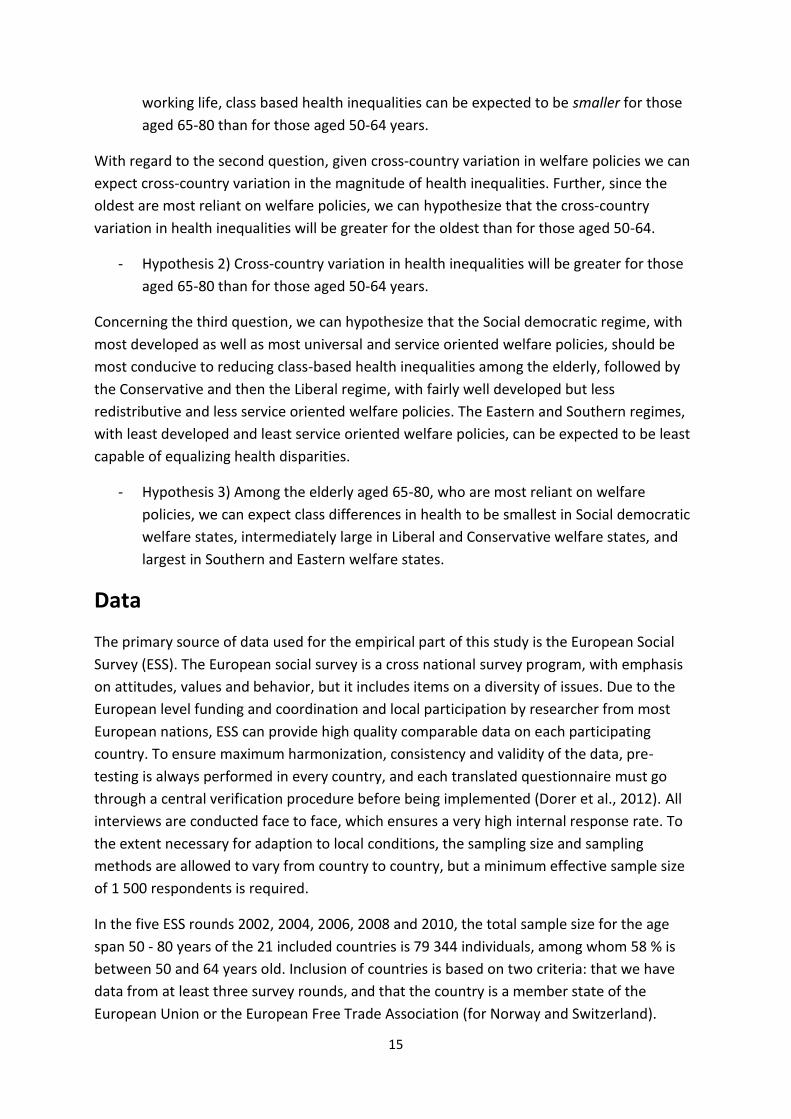
Hypotheses
When the previous research and theory covered so far are put in relation on to the research
questions guiding this paper, we can formulate some tentative hypotheses. With respect to
the first research question, theory predicts two contradictory tendencies. On the one hand,
accumulated advantage theory asserts that health inequalities will grow larger in later life.
On the other hand, we can expect that differences based on social class, which is derived
from occupational status, will be of lesser importance among the oldest, when virtually no
one is in paid work any longer. It is difficult to a priori, on the basis of theory alone, conclude
which is these tendencies will prevail. Therefore, two hypotheses are equally probable:
- Hypothesis 1a) On the basis of accumulated advantage theory, class based health
inequalities can be expected to be larger for those aged 65-80 than for those aged
50-64 years.
- Hypothesis 1b) Since labour market based health inequalities and health inequalities
based on class differences in working conditions are alleviated after the end of
15
working life, class based health inequalities can be expected to be smaller for those
aged 65-80 than for those aged 50-64 years.
With regard to the second question, given cross-country variation in welfare policies we can
expect cross-country variation in the magnitude of health inequalities. Further, since the
oldest are most reliant on welfare policies, we can hypothesize that the cross-country
variation in health inequalities will be greater for the oldest than for those aged 50-64.
- Hypothesis 2) Cross-country variation in health inequalities will be greater for those
aged 65-80 than for those aged 50-64 years.
Concerning the third question, we can hypothesize that the Social democratic regime, with
most developed as well as most universal and service oriented welfare policies, should be
most conducive to reducing class-based health inequalities among the elderly, followed by
the Conservative and then the Liberal regime, with fairly well developed but less
redistributive and less service oriented welfare policies. The Eastern and Southern regimes,
with least developed and least service oriented welfare policies, can be expected to be least
capable of equalizing health disparities.
- Hypothesis 3) Among the elderly aged 65-80, who are most reliant on welfare
policies, we can expect class differences in health to be smallest in Social democratic
welfare states, intermediately large in Liberal and Conservative welfare states, and
largest in Southern and Eastern welfare states.
Data
The primary source of data used for the empirical part of this study is the European Social
Survey (ESS). The European social survey is a cross national survey program, with emphasis
on attitudes, values and behavior, but it includes items on a diversity of issues. Due to the
European level funding and coordination and local participation by researcher from most
European nations, ESS can provide high quality comparable data on each participating
country. To ensure maximum harmonization, consistency and validity of the data, pre-
testing is always performed in every country, and each translated questionnaire must go
through a central verification procedure before being implemented (Dorer et al., 2012). All
interviews are conducted face to face, which ensures a very high internal response rate. To
the extent necessary for adaption to local conditions, the sampling size and sampling
methods are allowed to vary from country to country, but a minimum effective sample size
of 1 500 respondents is required.
In the five ESS rounds 2002, 2004, 2006, 2008 and 2010, the total sample size for the age
span 50 - 80 years of the 21 included countries is 79 344 individuals, among whom 58 % is
between 50 and 64 years old. Inclusion of countries is based on two criteria: that we have
data from at least three survey rounds, and that the country is a member state of the
European Union or the European Free Trade Association (for Norway and Switzerland).
16
Combined national sample sizes varies between a low of 2 398 in Austria and a high of 6 131
in Germany; national response rates varies between 30 % for Germany in 2010 to around 80
% for Greece in 2010 and Spain in 2004. The disturbingly high non-response rate for
Germany is compensated by above 50 % response rates for the other rounds. France and
Switzerland also have problematically low response rates, below 50 %, in many rounds. The
target response rate for all countries is 70 % (European Social Survey, 2013). The data is
freely and consensually available on the ESS website and do not give rise to any ethical
dilemmas.
Variables and operationalization
Dependent variables
Two outcomes measuring morbidity are used in the study: disability status and self-assessed
general health. Combined they should give a broad picture of aspects essential for an active
and healthy ageing. Disability status gives a good indication of to what degree the health
problem of the individual restricts him/her in his/her daily life, that is, how much the health
problem influence other areas of life. Disability status can be considered constitutive for
what Amartya Sen terms "capability": the ability to do what and live as one wishes (Sen,
2009). Self-assessed general health is relevant in two respects. First, it has been validated as
a reliable predictor of mortality (Benjamins et al., 2004; Idler & Benjamini, 1997; Jylha et al.,
1998; Mackenbach et al., 2002), and second, it is arguably the broadest and most inclusive
health indicator as it takes into account how the individual asses his/her general health
status (i.e. it is not based on specific diseases). The principal limitation with both measures is
that they are self-reported and thus sensitive to cultural bias: individuals might understand
concepts such as disability or bad health differently depending on cultural context. Self-
reported measures should have high validity, but might experience difficulties with
reliability, not least in cross-national settings. However, since the focus is on health
inequalities within countries, and since multilevel techniques are used where national
context is accounted for, this should not be a critical problem.
Both outcome measures are categorical, and in order to facilitate interpretation they are
operationalized as binary variables. Self-assessed general health is examined through the
question ”How is your health in general?”, which is recoded as a binary variable with the two
lowest answer categories – “bad” and “very bad” health – collapsed into the measure “ill
health”, and the rest of the alternatives – “fair”, “good” and “very good” health – serving as
reference category. The rationale for using this cut-off point is that the arguably most
important dividing line runs between those who regard their health as bad and those who
do not. Fair health is not optimal, but it is acceptable and reasonable; bad health is not.
Disability status is measured by the question “Are you hampered in your daily activities in
any way by any longstanding illness, or disability, infirmity or mental health problem? If yes,
is that a lot or to some extent?”. The alternatives “Yes, a lot” and “Yes, to some extent” is
17
combined to indicate that the respondent suffers from a disability, while the third
alternative “No” functions as reference category. The rationale for using this cutoff-point is
twofold. First, the difference between "yes, a lot" and "yes, to some extent" is somewhat
arbitrary. Second, and analogous to the previous line of argument, the dividing line
separating no disability from some disability is the most relevant from an active ageing
perspective. Both dependent variables have response rates of virtually 100 %.
Independent variables
All research on social inequalities grapple with how to conceptualize the social hierarchy: is it
to be based on occupational/social class, educational level, income or status, or on a mixture
of these (Weber, 1972 (1922))? This study takes social or occupational class as its starting
point, for two reasons. First, class – as compared to education – has been more neglected so
far in research on active ageing and health inequalities. Second, class, unlike education,
directly captures work-related aspects, which is of interest given the welfare state focus of
the study: occupational class is directly related to pension systems and welfare entitlements;
education is not. Class is thus considered to be more theoretically relevant for the present
study purposes. An alternative would be to combine social class and education in the same
statistical model – they relate to different aspects of social inequality (Lareau & Conley,
2008) and can have diverse effects on health (Geyer et al., 2006) – but the very high
intercorrelation between education and social class make this unadvisable, as high
multicollinerarity make estimation of parameters and standard errors inaccurate and
produce volatile results.
Class is operationalized in accordance with the well-established EGP-classification scheme,
developed as an internationally comparable tool to classify occupations (Erikson, Goldthorpe
& Portocarero, 1992). It combines occupations into larger classes on the basis of both the
work situation (the level of autonomy in, and control over, work) and the market situation
(type of employment or wage contract, required skill level, advancement opportunities) of
the workers holding these occupations. These two dimensions combined provide a broad
measure of the power and resources inherent to specific occupations. This paper makes use
of two different re-classifications of the original eleven class categories. Due to the smaller
sample sizes in each country when analyzed separately, a three-class model is used,
consisting of the professionals, or the service class (class category I & II in the "full version";
see Erikson, Goldthorpe & Portocarero, 1992: 38-39), routine non-manual workers (classes
IIIa & IIIb) and manual workers (classes V through VIIb). With too few observations in each
separate country, farmers (IVc) and the petty bourgeoisie (IVa & IVb) are excluded from the
country specific analysis. In the multilevel analysis, with a combined larger sample size, a six
class schema is employed: service class / professionals (classes I & II), routine non-manual
workers (IIIa & a IIIb), petty bourgeoisie / self-employed (IVa & IVb), farmers (IVc), skilled
workers (V & VI), and unskilled workers (VIIa &VIIb). The original ISCO occupational variable
in the ESS dataset was recoded into the EGP classification following Ganzeboom (1996) with
18
some minor modifications following Leiulfsrud, Bison and Jensberg (2005). Social class is
derived from occupational status, but not all respondents have ever had an occupation, and
therefor lack class status. In the sample, we lack information of class for 5.5 % among
respondents aged 50 to 64 and 10.9 % of respondents aged 65-80 years. More women than
men, more with low than with high education, and more respondents in southern Europe
lack class status (see Appendix 3 - Structure of missing values for social class). To deal with
this problem of missing values, statistical models were checked with various methods of
replacing missing values: series mean, mean of nearby points, linear interpolation and linear
trend at point. Since these robustness tests did not alter the results, the numbers presented
in the tables are from models without imputation for missing values.
Basic demographic information regarding age, cohabiting status and gender are controlled
for in the models. Age is measured in years of age, but collapsed into age classes with 5 year
intervals to account for possible non-linear association between health and age, as would be
expected on the basis of accumulated advantage theory. Gender is coded as "man" or
"woman", and cohabiting status as “single (not living with a partner)” and “living with
partner”.
Macro variables
Welfare regimes are ideal types, meaning that they are theoretical constructions, created in
order to be logically coherent and internally consistent. The real world, however, is
inevitably messy, and empirically existing welfare states cannot always be neatly fitted into
ideal regimes. The problem is compounded by the fact that the original regime typology was
constructed more than two decades ago, and much as happed since then in terms of welfare
state reform. This gives rise to some questions regarding how specific welfare states should
be classified. Since the welfare state dimensions – regarding pension systems, welfare
services and employment policies – are derived from Esping-Andersen’s original typology, it
is used as base in this study, but with some modification, necessary to encompass the
Mediterranean and Eastern European countries. Ferrera’s proposal of a Southern regime is
recognized, comprising Greece, Spain and Portugal (data for Italy is unfortunately
incomplete) (Ferrera, 1996; Ferrera, 1998). The post-communist countries in Eastern Europe
are not included in the original regime typology, but are customarily merged together under
an “Eastern” label. The tricky, and controversial, classification decision regards the affiliation
of some Western welfare states: Finland, Switzerland and the Netherlands are often
considered hybrid cases (Ebbinghaus, 2012). The Netherlands was originally affiliated to the
Social democratic regime, but is in most contemporary analysis considered as a Conservative
welfare state (Bambra, 2007), while Switzerland, originally a Conservative welfare state, is
usually treated as part of the Liberal regime (Ebbinghaus, 2012). Finland was also originally
affiliated with the Conservative regime, but is often included as an outlier or laggard with its
Nordic neighbors in the Social democratic regime. Here it is analyzed separately, that is,
neither as Conservative nor as Social democratic. The rationale is that previous research
19
have demonstrated a particular theoretical interest in the Social democratic regime, as this is
considered the most developed and equitable type of welfare state (Eikemo, Skalická &
Avendano, 2009; Bambra, 2011). A focus on the most characteristic and developed form of a
phenomena is warranted in this context, since it gives clues to understanding the functioning
and consequences of the less developed forms as well. In other words, it is of particular
relevance to study the Social democratic regime in its original and most developed form,
which excludes Finland.
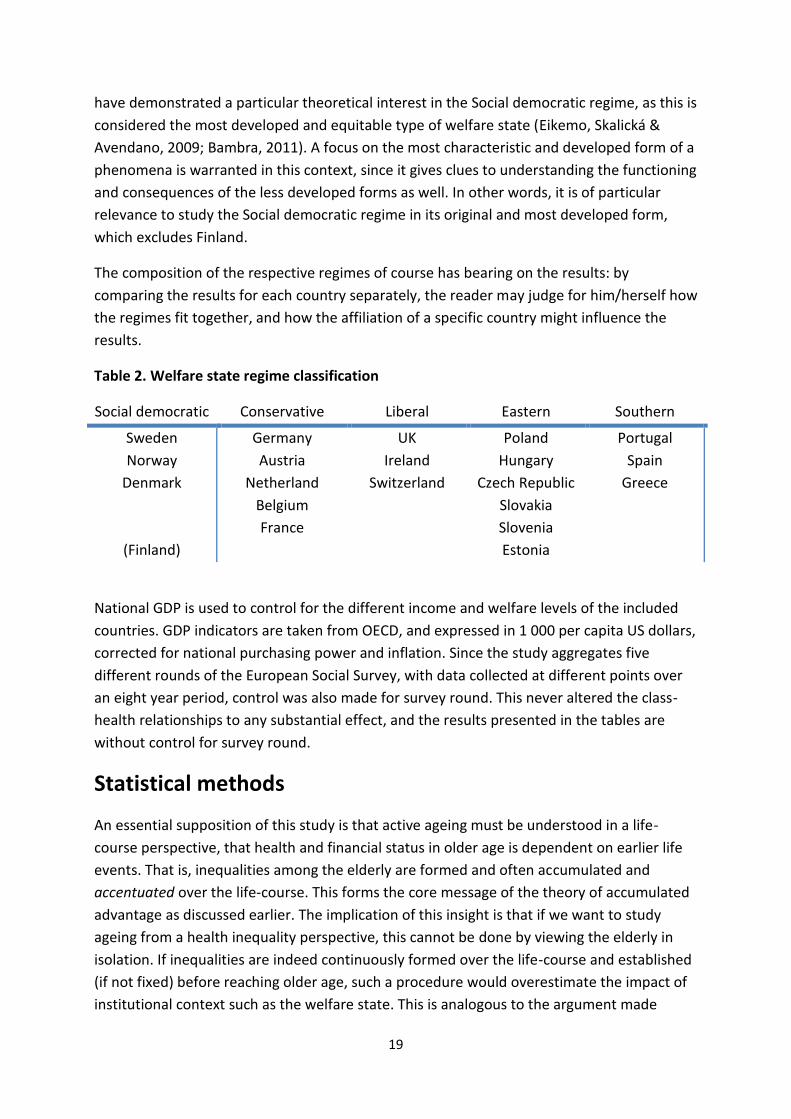
The composition of the respective regimes of course has bearing on the results: by
comparing the results for each country separately, the reader may judge for him/herself how
the regimes fit together, and how the affiliation of a specific country might influence the
results.
Table 2. Welfare state regime classification
Social democratic Conservative Liberal Eastern Southern
Sweden
Norway
Denmark
(Finland)
Germany
Austria
Netherland
Belgium
France
UK
Ireland
Switzerland
Poland
Hungary
Czech Republic
Slovakia
Slovenia
Estonia
Portugal
Spain
Greece
National GDP is used to control for the different income and welfare levels of the included
countries. GDP indicators are taken from OECD, and expressed in 1 000 per capita US dollars,
corrected for national purchasing power and inflation. Since the study aggregates five
different rounds of the European Social Survey, with data collected at different points over
an eight year period, control was also made for survey round. This never altered the class-
health relationships to any substantial effect, and the results presented in the tables are
without control for survey round.
Statistical methods
An essential supposition of this study is that active ageing must be understood in a life-
course perspective, that health and financial status in older age is dependent on earlier life
events. That is, inequalities among the elderly are formed and often accumulated and
accentuated over the life-course. This forms the core message of the theory of accumulated
advantage as discussed earlier. The implication of this insight is that if we want to study
ageing from a health inequality perspective, this cannot be done by viewing the elderly in
isolation. If inequalities are indeed continuously formed over the life-course and established
(if not fixed) before reaching older age, such a procedure would overestimate the impact of
institutional context such as the welfare state. This is analogous to the argument made
20
earlier for a theoretical framework that extends beyond pension systems and incorporate
employment and welfare policies. Therefore, separate analysis will be undertaken for the 50
- 64 year olds (below statutory retirement age in almost all included countries) and the 65 -
80 year olds (above statutory retirement age in most countries) respectively. This age
stratification, moreover, is in line with the first research question. The cutoff point is of
course somewhat arbitrary – the official retirement age varies between countries, and many
retire before or, much less common, after official retirement age – but it can serve as a
reasonable proxy for how developmental trajectories before and after the end of working
life.
At the first stage of analysis descriptive statistics of country specific class-health associations
(odds ratios) is presented: crude, that is, without controls for potential confounders, class
differences for two health measures (self-rated health and disability status) is presented for
each country respectively. The method used is binary logistic regression analysis. Since, at
this first stage, the country variation per se (that is, results aggregated on national level) is
the outcome of interest, the nested/hierarchical structure of the data proves no problem. All
models are run and analyzed separately for each respective country to calculate country
specific excess risks for manual and non-manual routine workers, as compared to
professionals. The purpose of this section is mainly descriptive, to serve as a springboard to
further analysis, not to test hypotheses.
At the second stage of analysis, the three hypotheses are tested within a multilevel
framework, where all countries are merged in one large dataset. This makes possible to
investigate whether the cross-country variation in health inequalities is statistically
significant; that is, whether there is enough cross-country variation to explore it further by
analyzing cross-level interactions between class and welfare regime. The earlier stage looked
at health inequalities in individual countries taken separately, but that type of analysis
cannot give a measure of how large this cross-country variation is. Multilevel techniques, on
the other hand, makes possible to measure the magnitude of cross-country variation in a
strict and formalized way, which tests our second hypotheses. With only one large dataset to
consider, we also have opportunity to extend the class analysis by using a more fine-grained
class schema (with six as opposed to three class categories), and add control variables (age,
gender and cohabiting status) to examine whether the crude class-health associations
calculated in the previous section are robust. In line with the first research question, the
multilevel models are also stratified by age. A step-wise, "bottom up" strategy is employed,
in which we begin with a simple model and add parameters step by step while
simultaneously controlling for the significance of the added parameters and assessing
changes in the variance terms (Hox, 2010: 56). The rationale for using a step-wise strategy is
that it makes possible to identify how much of the total variation that is accounted for by
each set of variables. In other words, it gives a measure of the explanatory power of each
respective determinant (Hox, 2010).
21
In the first step of the multilevel model, an empty, intercept-only model is analyzed to
calculate the intraclass correlation (i.e. how much of the total variance that is accounted for
by the between-country variation) and the random variation in the slope for social class (i.e.
if the cross-country variation in class differences is statistically significant). At various stages
level 1 (social class and control variables) and then level 2 (welfare regimes and GDP)
parameters are added to the model (Hox, 2010). The first hypothesis is tested by comparing
the size of the odds ratios (that is, the magnitude of the morbidity risks for the different
classes) for the respective age categories. The second hypothesis is tested by analyzing the
cross-country variation in health inequalities (the random slope for social class) for each
model. When measurement of cross-country variation in health inequalities proved that this
variation is indeed statistically significant, the multilevel models are extended to include
cross-level interactions. At this third stage of analysis, macro-level welfare regimes and
micro-level social class are interacted to investigate how the effect of class on health is
mediated by welfare regimes. This third stage tests the third hypotheses, regarding whether
cross-country variation in health inequalities can be understood form a welfare regime
perspective. Cross-level interaction effects are of interest as a systematic between-regime
variation in the magnitude of class differences would give clues as to why health inequalities
vary between countries.
Due to the hierarchical structure of the data multilevel methods are warranted to account
for the interdependence of respondents nested within countries. It is, as argued,
hypothesized that welfare institutions matter for class differences in active ageing, but since
institutions are national in scope, and varies between countries, the individual respondents
from the same country will not be independent from each other. The effect of any a given
variable can thus not be expected to be unrelated to, and have the same strength and
direction for, the various national contexts (Hox, 2010). Random intercept multilevel models
– with individuals constituting level 1 and the respective countries constituting level 2, and
with random intercepts for countries – account for this dependency of individual
observations on national context. Multilevel models are, moreover, advantageous in two
other respects. First, they can be used to separate the variation in the dependent variable
into individual (level 1) and country (level 2) variation, respectively. This gives a measure of
how important institutional country level factors are in accounting for the overall variation.
Second, multilevel techniques not only makes possible to control for country (level 2)
variation, but they also permit inclusion of macro level variables in the same model as the
individual level determinants. With the possibility to combine level 1 and 2 variables comes
the opportunity to investigate cross-level interaction, that is, how the effect of individual
characteristics can vary in combination with a given institutional configuration (Twisk, 2006).
Because the outcome variables are dichotomous and thus violate the normality assumption
underlying "standard" multilevel analysis, a specific kind of multilevel level technique is
utilized: a multilevel generalized linear model, with a logit link function (Heck, Thomas &
Tabata, 2012). Combining generalized linear and multilevel analysis is not straightforward,
22
and involves choosing between different methods and calculation techniques, none of which
is flawless and which may produce slightly different estimations depending on the structure
of the data (Hox, 2010). In general, regardless of calculation technique, the precision of
estimates in multilevel generalized linear models are high and acceptable when, as in this
study, the intraclass variation is not high and the groups or clusters are few in numbers and
large in terms of included individuals (Hox, 2010). In any case, some comments on specific
methodological aspects of generalized linear multilevel models with categorical outcomes
might be warranted. The conventional measure of how much of the total variance that a
model accounts for, or of model fit, – the reduction in residual variation as new parameters
are added to the model – is not applicable, since the underlying variance in level 1 variables
is rescaled to the same level each time a new model is run (Hox, 2010). This also affects how
intraclass correlation is calculated, why some caution is warranted when interpreting
changes in explained level 2 variation (Heck, Thomas & Tabata, 2012). To account for
possible violations of model assumptions (such as normality) or incorrectly specified models,
robust estimations of covariances (or the so called Huber-White sandwich estimator), which
sets higher standards for statistical significance, is used in all models (Heck, Thomas &
Tabata, 2012; Freeman, 2006).
Results
The Results-section is divided into three parts. First, all countries are analyzed separately in
order to get a descriptive overview of the inter-European variability. Second, hypotheses
1a/1b and 2 are tested in four multilevel models, after which hypothesis 3 is tested in two
separate multilevel models with interaction effects.
Descriptive results
The first part of the results-section is mainly descriptive and does not test any hypotheses;
this caveat notwithstanding, the results presented gives a good overview of the variation in
health inequalities between European countries. In line with the comparative approach of
this study, we begin by presenting one-level aggregated logistic regression models with
results separated for each respective country. Table 3 and 4 presents the excess risk (odds
ratios) of ill health for routine non-manual workers and manual workers as compared to
professionals. The analysis is stratified by age, comparing those aged 50-64 with those aged
65-80.
23
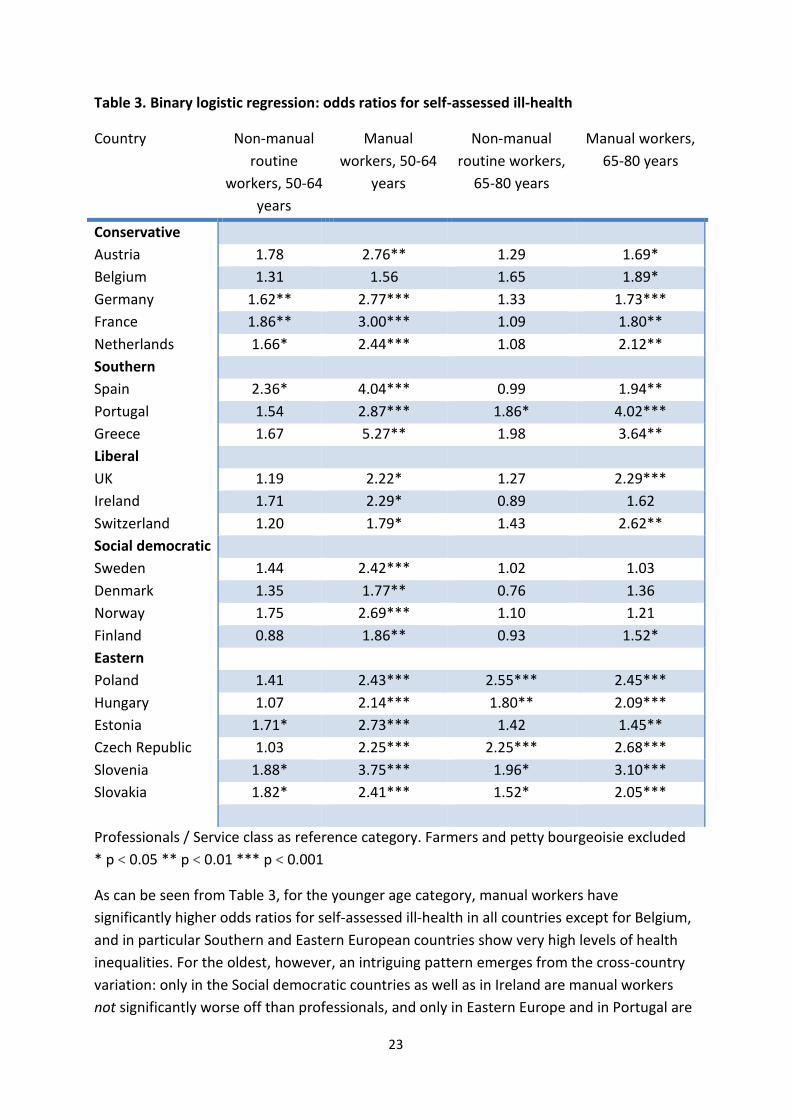
Table 3. Binary logistic regression: odds ratios for self-assessed ill-health
Country Non-manual
routine
workers, 50-64
years
Manual
workers, 50-64
years
Non-manual
routine workers,
65-80 years
Manual workers,
65-80 years
Conservative
Austria 1.78 2.76** 1.29 1.69*
Belgium 1.31 1.56 1.65 1.89*
Germany 1.62** 2.77*** 1.33 1.73***
France 1.86** 3.00*** 1.09 1.80**
Netherlands 1.66* 2.44*** 1.08 2.12**
Southern
Spain 2.36* 4.04*** 0.99 1.94**
Portugal 1.54 2.87*** 1.86* 4.02***
Greece 1.67 5.27** 1.98 3.64**
Liberal
UK 1.19 2.22* 1.27 2.29***
Ireland 1.71 2.29* 0.89 1.62
Switzerland 1.20 1.79* 1.43 2.62**
Social democratic
Sweden 1.44 2.42*** 1.02 1.03
Denmark 1.35 1.77** 0.76 1.36
Norway 1.75 2.69*** 1.10 1.21
Finland 0.88 1.86** 0.93 1.52*
Eastern
Poland 1.41 2.43*** 2.55*** 2.45***
Hungary 1.07 2.14*** 1.80** 2.09***
Estonia 1.71* 2.73*** 1.42 1.45**
Czech Republic 1.03 2.25*** 2.25*** 2.68***
Slovenia 1.88* 3.75*** 1.96* 3.10***
Slovakia 1.82* 2.41*** 1.52* 2.05***
Professionals / Service class as reference category. Farmers and petty bourgeoisie excluded
* p < 0.05 ** p < 0.01 *** p < 0.001
As can be seen from Table 3, for the younger age category, manual workers have
significantly higher odds ratios for self-assessed ill-health in all countries except for Belgium,
and in particular Southern and Eastern European countries show very high levels of health
inequalities. For the oldest, however, an intriguing pattern emerges from the cross-country
variation: only in the Social democratic countries as well as in Ireland are manual workers
not significantly worse off than professionals, and only in Eastern Europe and in Portugal are
24
non-manual routine workers significantly worse off. In general, for the oldest, class
differences are most pronounced in Eastern and Southern Europe, but also quite substantial
for manual workers in the Liberal UK and Switzerland, slightly less pronounced in the
Conservative countries, and non-existent in Scandinavia and Ireland. This pattern is not
apparent for the 50-64 year olds.
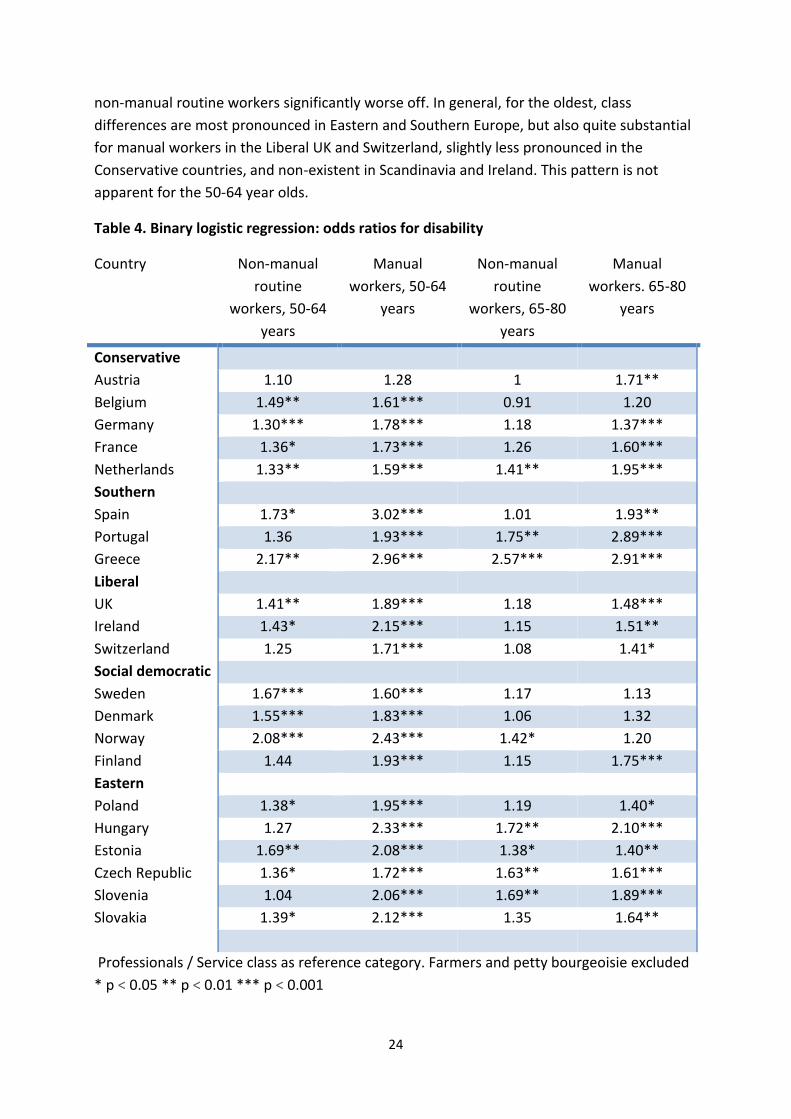
Table 4. Binary logistic regression: odds ratios for disability
Country Non-manual
routine
workers, 50-64
years
Manual
workers, 50-64
years
Non-manual
routine
workers, 65-80
years
Manual
workers. 65-80
years
Conservative
Austria 1.10 1.28 1 1.71**
Belgium 1.49** 1.61*** 0.91 1.20
Germany 1.30*** 1.78*** 1.18 1.37***
France 1.36* 1.73*** 1.26 1.60***
Netherlands 1.33** 1.59*** 1.41** 1.95***
Southern
Spain 1.73* 3.02*** 1.01 1.93**
Portugal 1.36 1.93*** 1.75** 2.89***
Greece 2.17** 2.96*** 2.57*** 2.91***
Liberal
UK 1.41** 1.89*** 1.18 1.48***
Ireland 1.43* 2.15*** 1.15 1.51**
Switzerland 1.25 1.71*** 1.08 1.41*
Social democratic
Sweden 1.67*** 1.60*** 1.17 1.13
Denmark 1.55*** 1.83*** 1.06 1.32
Norway 2.08*** 2.43*** 1.42* 1.20
Finland 1.44 1.93*** 1.15 1.75***
Eastern
Poland 1.38* 1.95*** 1.19 1.40*
Hungary 1.27 2.33*** 1.72** 2.10***
Estonia 1.69** 2.08*** 1.38* 1.40**
Czech Republic 1.36* 1.72*** 1.63** 1.61***
Slovenia 1.04 2.06*** 1.69** 1.89***
Slovakia 1.39* 2.12*** 1.35 1.64**
Professionals / Service class as reference category. Farmers and petty bourgeoisie excluded
* p < 0.05 ** p < 0.01 *** p < 0.001
25
From Table 4 it is evident that for the younger age category, manual workers have
significantly higher odds ratios for disability in all countries, only Austria being an exception
to this rule. Moving to the elderly, a similar pattern emerges as for self-assessed ill-health:
the Social democratic countries, this time joined by Belgium, show no significant class
differences at all. The Southern countries still show the highest odds ratios for manual
workers, but also, alongside Eastern Europe, for non-manual routine workers. Again, in most
countries (except for Austria and Portugal) class differences are rather stable or decrease
somewhat for the older age group.
Again, this section did not formally test any hypotheses, but some preliminary conclusions
can nevertheless be drawn from the results presented. With respect to our first research
question, the class differences changes when we move from the younger to the older age
category, but the strength and direction of this change between age categories varies
between countries: most countries show diminishing or stable class differences, while in a
sizeable minority of countries we observe intensified health inequalities. With respect to our
second research question, national context seem to matter for active ageing: the cross-
country variation in health disparities appear to be substantial. Concerning welfare state
regimes, the regime typology appear to describe the observed patterns fairly well, at least
for those aged 65-80: the Social democratic countries, excluding Finland, stand out by
consistently having the smallest, or rather non-existent, class differences for the oldest. The
Southern regime have among the largest class differences in health, whereas the
Conservative countries, as expected, end up in the middle range in terms of health
inequalities, with clearly significant but not extreme class differences. The Liberal welfare
states are internally somewhat inconsistent, with Ireland showing very small or insignificant
class differences. The Eastern regime has, in line with expectations, consistently high or very
high odds ratios for manual workers, but also stands out with having the worst health among
non-manual routine workers. Regarding the age dimension – how class-differences in health
changes when we move to the older cohort – most countries show slightly reduced or stable
class differences, but only in the Social democratic countries – Sweden, Denmark and
Norway – are health inequalities consistently (that is, for both outcomes) eliminated for the
elderly.
Multilevel models
Next, we turn to the multilevel analysis to formally test our three hypotheses, and to
introduce welfare regimes in the analysis. The models are built in a step-wise fashion, as
described in the Methods-section. In the last stage of this section, cross-level interaction
effects between social class and welfare state regimes are investigated in separate multilevel
models. The sample is again stratified by age, and models for the respective age groups are
analyzed separately. The first hypotheses – 1a and 1b – are tested by comparing the class-
specific odds ratios for bad health and disability between the two age categories. The second
hypothesis is tested by comparing the random variation in the slope for social class (i.e.
26
whether or not the cross-country variation in class differences is statistically significant). The
third hypothesis is tested by the cross-level interaction models, where the magnitude of the
class differences in the respective regimes is compared. It should again be highlighted that
data round is controlled for in all models, but since this never altered the principal results it
is not included in the tables. The Social democratic regime is used as reference category for
the welfare regimes; this is because previous research in the field has displayed a specific
theoretical interest in how the extensive welfare policies associated with social democratic
welfare states influence public health (Bambra, 2011). It is frequently hypothesized that the
Social democratic regime should have better population health as well as smaller health
inequalities than less developed welfare states.
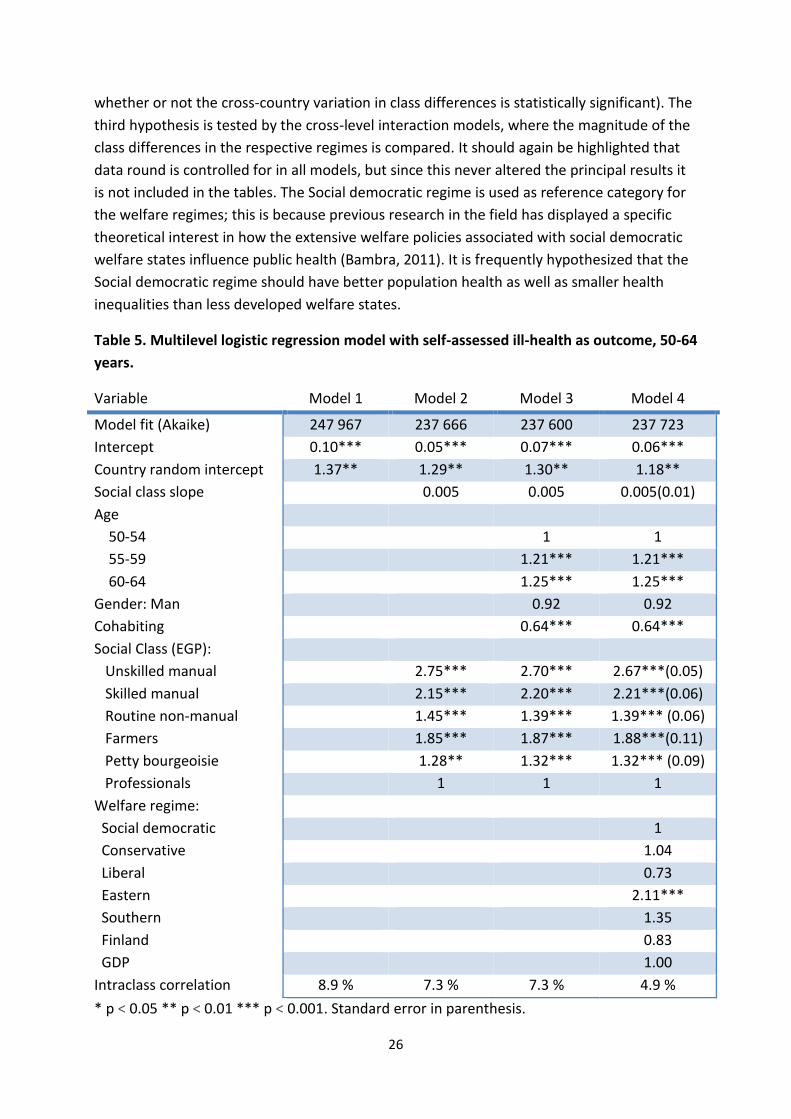
Table 5. Multilevel logistic regression model with self-assessed ill-health as outcome, 50-64
years.
Variable Model 1 Model 2 Model 3 Model 4
Model fit (Akaike) 247 967 237 666 237 600 237 723
Intercept 0.10*** 0.05*** 0.07*** 0.06***
Country random intercept 1.37** 1.29** 1.30** 1.18**
Social class slope 0.005 0.005 0.005(0.01)
Age
50-54 1 1
55-59 1.21*** 1.21***
60-64 1.25*** 1.25***
Gender: Man 0.92 0.92
Cohabiting 0.64*** 0.64***
Social Class (EGP):
Unskilled manual 2.75*** 2.70*** 2.67***(0.05)
Skilled manual 2.15*** 2.20*** 2.21***(0.06)
Routine non-manual 1.45*** 1.39*** 1.39*** (0.06)
Farmers 1.85*** 1.87*** 1.88***(0.11)
Petty bourgeoisie 1.28** 1.32*** 1.32*** (0.09)
Professionals 1 1 1
Welfare regime:
Social democratic 1
Conservative 1.04
Liberal 0.73
Eastern 2.11***
Southern 1.35
Finland 0.83
GDP 1.00
Intraclass correlation 8.9 % 7.3 % 7.3 % 4.9 %
* p < 0.05 ** p < 0.01 *** p < 0.001. Standard error in parenthesis.
27
We begin with the 50-64 years olds, by calculating the empty model without predictors for
our first outcome variable, self-assessed ill-health, to find the crude cross-country variation,
in Table 5. The important statistics to note here are the country random intercept and the
intraclass correlation. The country random intercept is significantly different from one,
which suggests that the intercept for ill-health (that is, the average level of population
health) varies between countries. The measure of intraclass correlation suggests that 8.9 %
of the total variability in ill-health lies between countries. The central variable, social class, is
added in model 2. Professionals function as reference category, and the odds ratios point to
substantial class differences, with farmers and particularly manual workers having worse
health. Notably, the slope for social class does not vary between countries on a statistically
significant level (p=0.49), indicating that the cross-country variation in class differences in ill-
health is limited or non-existent. The class-health odds ratios hardly change when
demographic factors – age, gender and cohabiting status – are controlled for. When macro-
level welfare regimes are added in model 4, only the Eastern regime show levels of ill-health
significantly different (worse) from those in the Social democratic regime. National GDP is
not significant, and neither GDP nor welfare regimes change the class-health associations. As
argued in the methods-section, cautiousness must be exercised when interpreting changes
in intraclass correlation; nevertheless, the reduction from 7.3 % to 4.9 % point to that
welfare regimes do account for a part of the cross-country variation in ill-health. Since the
slope for class does not reach statistical significance, the results indicate that it is not enough
cross-country variation in how ill-health varies depending on class to give reason to
investigate it further. The cross-country variation in aggregated or average ill-health is
significant, but the cross-country variation in the association between ill-health and social
class is not, and it is the latter that is the focus of this study. Accordingly, for the 50-64 year
olds, we do not continue with analyzing how macro-level welfare regimes interact with
health inequalities.
The equivalent model is presented for respondents aged 65-80 years in Table 6. The empty
model show that the country random effect is again significant and now quite substantial,
yielding an intraclass correlation of 18.1 %, more than twice as large as that for the younger
age group. Cross-country variation in average population health appears to be more
pronounced for the older age category. Compared to the younger age group, overall class
differences in ill-health are reduced, but the pattern, the social gradient, remains the same.
In contrast to the younger age group, the slope for social class varies significantly between
countries (p=0.038), which give reason to investigate cross-country variation in class
differences further: the slope variability indicates that the magnitude of the relationship
between social class and ill-health is dependent on national context. Demographic control
variables barely alter the class-health pattern, and nor do macro variables. Introduction of
welfare regimes produce a very large reduction in intraclass variation, by almost three
quarters. Eastern and Southern Europe and (much less) Finland have significantly worse
overall health levels than the Social democratic regime, while GDP is not statistically
significant.
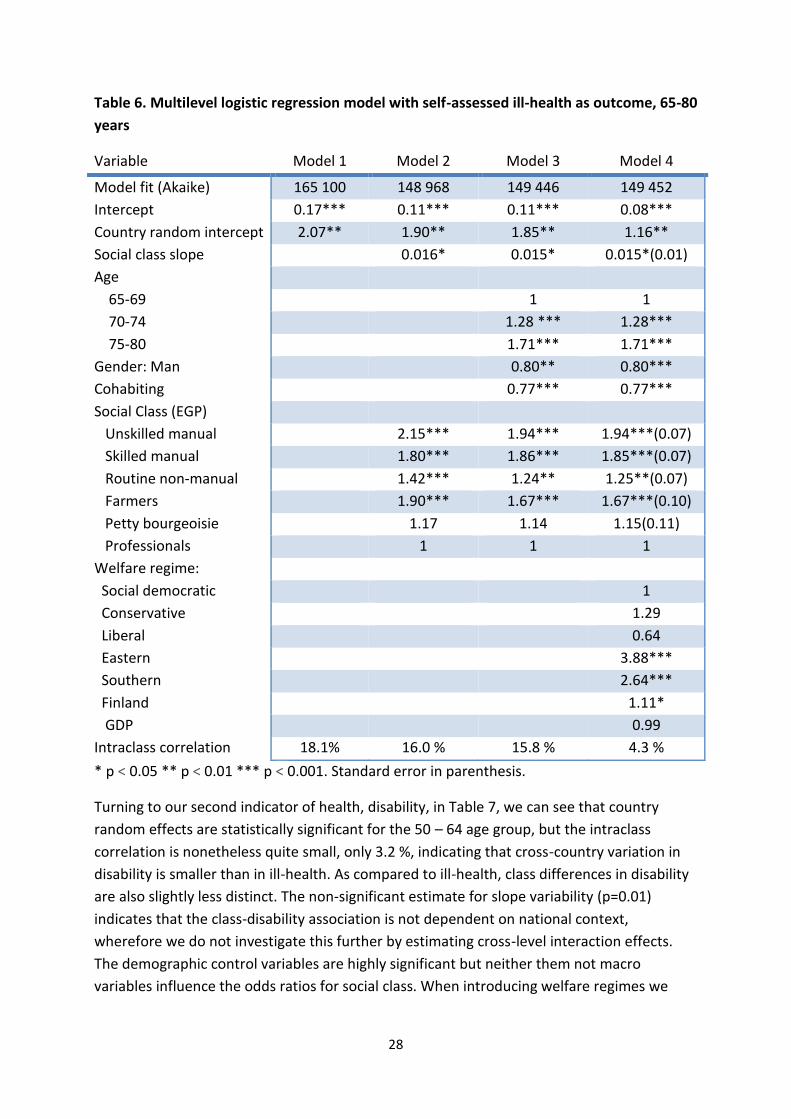
28
Table 6. Multilevel logistic regression model with self-assessed ill-health as outcome, 65-80
years
Variable Model 1 Model 2 Model 3 Model 4
Model fit (Akaike) 165 100 148 968 149 446 149 452
Intercept 0.17*** 0.11*** 0.11*** 0.08***
Country random intercept 2.07** 1.90** 1.85** 1.16**
Social class slope 0.016* 0.015* 0.015*(0.01)
Age
65-69 1 1
70-74 1.28 *** 1.28***
75-80 1.71*** 1.71***
Gender: Man 0.80** 0.80***
Cohabiting 0.77*** 0.77***
Social Class (EGP)
Unskilled manual 2.15*** 1.94*** 1.94***(0.07)
Skilled manual 1.80*** 1.86*** 1.85***(0.07)
Routine non-manual 1.42*** 1.24** 1.25**(0.07)
Farmers 1.90*** 1.67*** 1.67***(0.10)
Petty bourgeoisie 1.17 1.14 1.15(0.11)
Professionals 1 1 1
Welfare regime:
Social democratic 1
Conservative 1.29
Liberal 0.64
Eastern 3.88***
Southern 2.64***
Finland 1.11*
GDP 0.99
Intraclass correlation 18.1% 16.0 % 15.8 % 4.3 %
* p < 0.05 ** p < 0.01 *** p < 0.001. Standard error in parenthesis.
Turning to our second indicator of health, disability, in Table 7, we can see that country
random effects are statistically significant for the 50 – 64 age group, but the intraclass
correlation is nonetheless quite small, only 3.2 %, indicating that cross-country variation in
disability is smaller than in ill-health. As compared to ill-health, class differences in disability
are also slightly less distinct. The non-significant estimate for slope variability (p=0.01)
indicates that the class-disability association is not dependent on national context,
wherefore we do not investigate this further by estimating cross-level interaction effects.
The demographic control variables are highly significant but neither them not macro
variables influence the odds ratios for social class. When introducing welfare regimes we
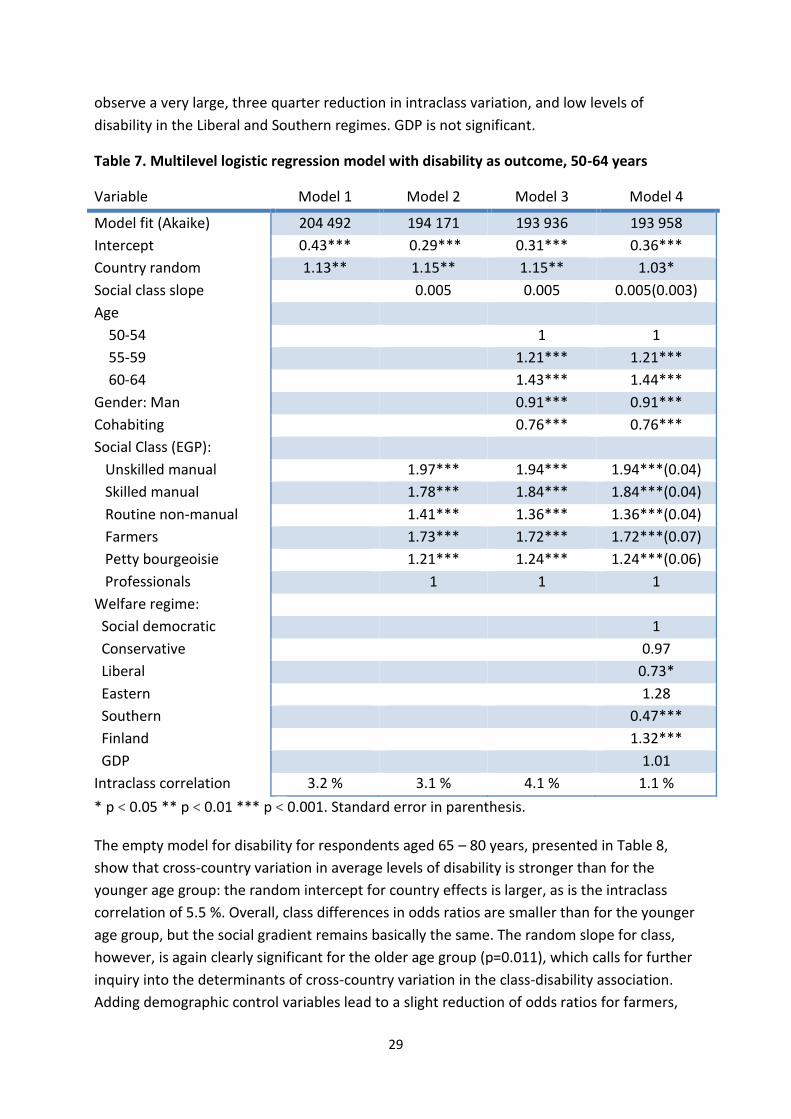
29
observe a very large, three quarter reduction in intraclass variation, and low levels of
disability in the Liberal and Southern regimes. GDP is not significant.
Table 7. Multilevel logistic regression model with disability as outcome, 50-64 years
Variable Model 1 Model 2 Model 3 Model 4
Model fit (Akaike) 204 492 194 171 193 936 193 958
Intercept 0.43*** 0.29*** 0.31*** 0.36***
Country random 1.13** 1.15** 1.15** 1.03*
Social class slope 0.005 0.005 0.005(0.003)
Age
50-54 1 1
55-59 1.21*** 1.21***
60-64 1.43*** 1.44***
Gender: Man 0.91*** 0.91***
Cohabiting 0.76*** 0.76***
Social Class (EGP):
Unskilled manual 1.97*** 1.94*** 1.94***(0.04)
Skilled manual 1.78*** 1.84*** 1.84***(0.04)
Routine non-manual 1.41*** 1.36*** 1.36***(0.04)
Farmers 1.73*** 1.72*** 1.72***(0.07)
Petty bourgeoisie 1.21*** 1.24*** 1.24***(0.06)
Professionals 1 1 1
Welfare regime:
Social democratic 1
Conservative 0.97
Liberal 0.73*
Eastern 1.28
Southern 0.47***
Finland 1.32***
GDP 1.01
Intraclass correlation 3.2 % 3.1 % 4.1 % 1.1 %
* p < 0.05 ** p < 0.01 *** p < 0.001. Standard error in parenthesis.
The empty model for disability for respondents aged 65 – 80 years, presented in Table 8,
show that cross-country variation in average levels of disability is stronger than for the
younger age group: the random intercept for country effects is larger, as is the intraclass
correlation of 5.5 %. Overall, class differences in odds ratios are smaller than for the younger
age group, but the social gradient remains basically the same. The random slope for class,
however, is again clearly significant for the older age group (p=0.011), which calls for further
inquiry into the determinants of cross-country variation in the class-disability association.
Adding demographic control variables lead to a slight reduction of odds ratios for farmers,
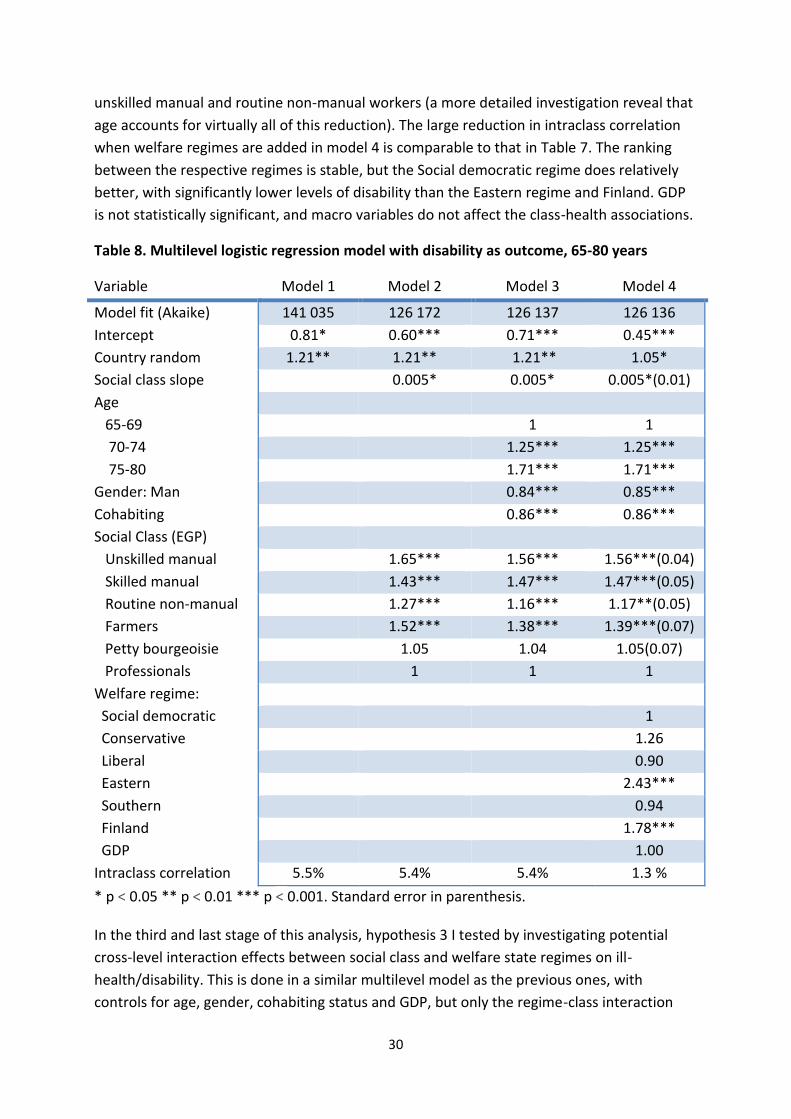
30
unskilled manual and routine non-manual workers (a more detailed investigation reveal that
age accounts for virtually all of this reduction). The large reduction in intraclass correlation
when welfare regimes are added in model 4 is comparable to that in Table 7. The ranking
between the respective regimes is stable, but the Social democratic regime does relatively
better, with significantly lower levels of disability than the Eastern regime and Finland. GDP
is not statistically significant, and macro variables do not affect the class-health associations.
Table 8. Multilevel logistic regression model with disability as outcome, 65-80 years
Variable Model 1 Model 2 Model 3 Model 4
Model fit (Akaike) 141 035 126 172 126 137 126 136
Intercept 0.81* 0.60*** 0.71*** 0.45***
Country random 1.21** 1.21** 1.21** 1.05*
Social class slope 0.005* 0.005* 0.005*(0.01)
Age
65-69 1 1
70-74 1.25*** 1.25***
75-80 1.71*** 1.71***
Gender: Man 0.84*** 0.85***
Cohabiting 0.86*** 0.86***
Social Class (EGP)
Unskilled manual 1.65*** 1.56*** 1.56***(0.04)
Skilled manual 1.43*** 1.47*** 1.47***(0.05)
Routine non-manual 1.27*** 1.16*** 1.17**(0.05)
Farmers 1.52*** 1.38*** 1.39***(0.07)
Petty bourgeoisie 1.05 1.04 1.05(0.07)
Professionals 1 1 1
Welfare regime:
Social democratic 1
Conservative 1.26
Liberal 0.90
Eastern 2.43***
Southern 0.94
Finland 1.78***
GDP 1.00
Intraclass correlation 5.5% 5.4% 5.4% 1.3 %
* p < 0.05 ** p < 0.01 *** p < 0.001. Standard error in parenthesis.
In the third and last stage of this analysis, hypothesis 3 I tested by investigating potential
cross-level interaction effects between social class and welfare state regimes on ill-
health/disability. This is done in a similar multilevel model as the previous ones, with
controls for age, gender, cohabiting status and GDP, but only the regime-class interaction
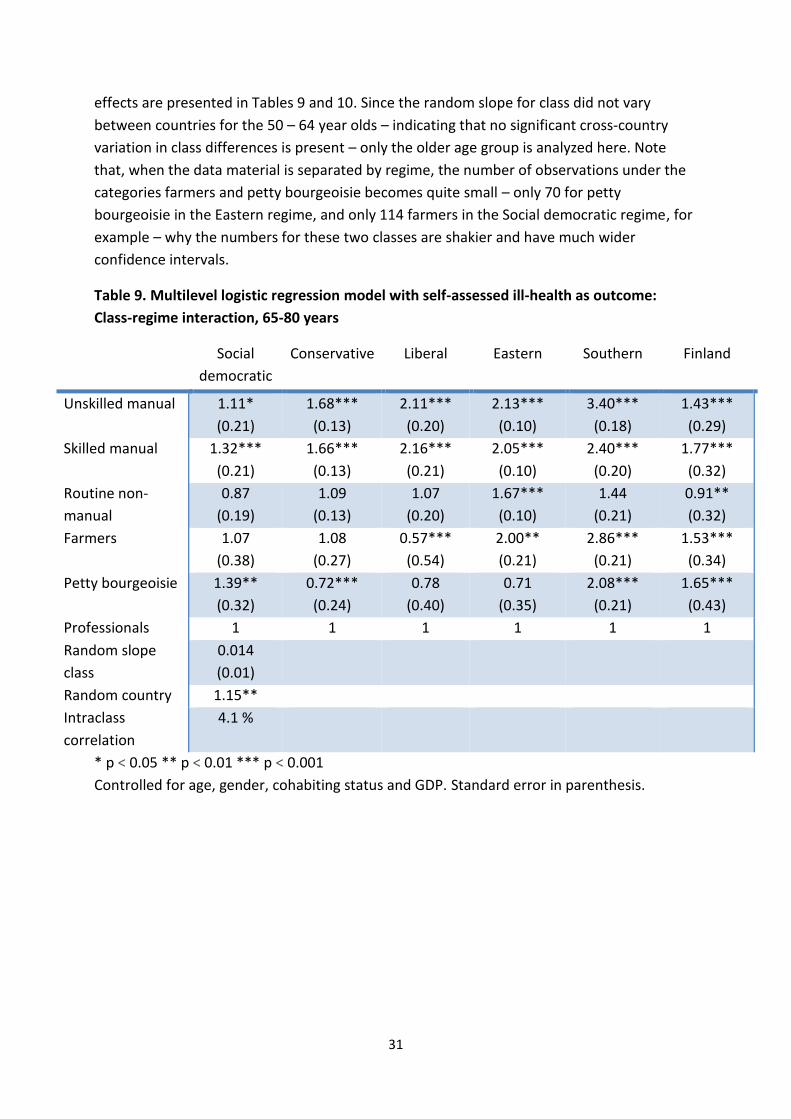
31
effects are presented in Tables 9 and 10. Since the random slope for class did not vary
between countries for the 50 – 64 year olds – indicating that no significant cross-country
variation in class differences is present – only the older age group is analyzed here. Note
that, when the data material is separated by regime, the number of observations under the
categories farmers and petty bourgeoisie becomes quite small – only 70 for petty
bourgeoisie in the Eastern regime, and only 114 farmers in the Social democratic regime, for
example – why the numbers for these two classes are shakier and have much wider
confidence intervals.
Table 9. Multilevel logistic regression model with self-assessed ill-health as outcome:
Class-regime interaction, 65-80 years
Social
democratic
Conservative Liberal Eastern Southern Finland
Unskilled manual 1.11*
(0.21)
1.68***
(0.13)
2.11***
(0.20)
2.13***
(0.10)
3.40***
(0.18)
1.43***
(0.29)
Skilled manual 1.32***
(0.21)
1.66***
(0.13)
2.16***
(0.21)
2.05***
(0.10)
2.40***
(0.20)
1.77***
(0.32)
Routine non-
manual
0.87
(0.19)
1.09
(0.13)
1.07
(0.20)
1.67***
(0.10)
1.44
(0.21)
0.91**
(0.32)
Farmers 1.07
(0.38)
1.08
(0.27)
0.57***
(0.54)
2.00**
(0.21)
2.86***
(0.21)
1.53***
(0.34)
Petty bourgeoisie 1.39**
(0.32)
0.72***
(0.24)
0.78
(0.40)
0.71
(0.35)
2.08***
(0.21)
1.65***
(0.43)
Professionals 1 1 1 1 1 1
Random slope
class
0.014
(0.01)
Random country 1.15**
Intraclass
correlation
4.1 %
* p < 0.05 ** p < 0.01 *** p < 0.001
Controlled for age, gender, cohabiting status and GDP. Standard error in parenthesis.
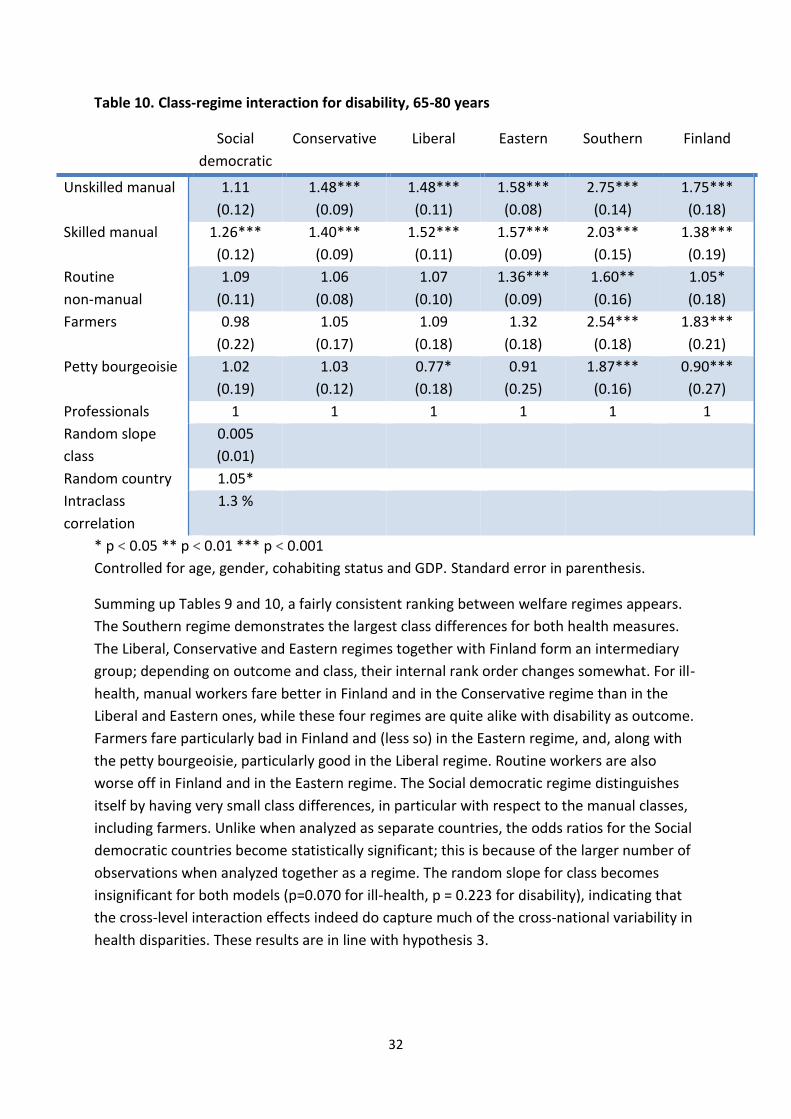
32
Table 10. Class-regime interaction for disability, 65-80 years
Social
democratic
Conservative Liberal Eastern Southern Finland
Unskilled manual 1.11
(0.12)
1.48***
(0.09)
1.48***
(0.11)
1.58***
(0.08)
2.75***
(0.14)
1.75***
(0.18)
Skilled manual 1.26***
(0.12)
1.40***
(0.09)
1.52***
(0.11)
1.57***
(0.09)
2.03***
(0.15)
1.38***
(0.19)
Routine
non-manual
1.09
(0.11)
1.06
(0.08)
1.07
(0.10)
1.36***
(0.09)
1.60**
(0.16)
1.05*
(0.18)
Farmers 0.98
(0.22)
1.05
(0.17)
1.09
(0.18)
1.32
(0.18)
2.54***
(0.18)
1.83***
(0.21)
Petty bourgeoisie 1.02
(0.19)
1.03
(0.12)
0.77*
(0.18)
0.91
(0.25)
1.87***
(0.16)
0.90***
(0.27)
Professionals 1 1 1 1 1 1
Random slope
class
0.005
(0.01)
Random country 1.05*
Intraclass
correlation
1.3 %
* p < 0.05 ** p < 0.01 *** p < 0.001
Controlled for age, gender, cohabiting status and GDP. Standard error in parenthesis.
Summing up Tables 9 and 10, a fairly consistent ranking between welfare regimes appears.
The Southern regime demonstrates the largest class differences for both health measures.
The Liberal, Conservative and Eastern regimes together with Finland form an intermediary
group; depending on outcome and class, their internal rank order changes somewhat. For ill-
health, manual workers fare better in Finland and in the Conservative regime than in the
Liberal and Eastern ones, while these four regimes are quite alike with disability as outcome.
Farmers fare particularly bad in Finland and (less so) in the Eastern regime, and, along with
the petty bourgeoisie, particularly good in the Liberal regime. Routine workers are also
worse off in Finland and in the Eastern regime. The Social democratic regime distinguishes
itself by having very small class differences, in particular with respect to the manual classes,
including farmers. Unlike when analyzed as separate countries, the odds ratios for the Social
democratic countries become statistically significant; this is because of the larger number of
observations when analyzed together as a regime. The random slope for class becomes
insignificant for both models (p=0.070 for ill-health, p = 0.223 for disability), indicating that
the cross-level interaction effects indeed do capture much of the cross-national variability in
health disparities. These results are in line with hypothesis 3.
33
Conclusions and discussion
The overall objective of this study was to investigate how health aspects essential for active
ageing varies depending on social class, and how these class differences in turn varies
between European welfare states. This overall objective was approached by answering three
concrete research questions. First, whether class-based health inequalities among the
elderly are age-dependent. Second, if these health inequalities among the elderly vary
between European countries. The third research question asked whether country and age
differences in health inequalities can be understood from a welfare states regime
perspective.
For both health measures investigated here (self-assessed health and disability) and for both
age groups (50-64 and 65-80 years) the social gradient in health remains basically the same:
unskilled workers are consistently worst off, closely followed by skilled workers and farmers.
The gap (in terms of odds ratios) separating these classes from routine non-manual workers
is consistent and large. Routine workers, on the other hand, are consistently worse off than
the petty bourgeoisie and especially professionals. The professional class is either
significantly better off than all the other classes, or, for the older age group, on par with the
petty bourgeoisie. This – a continuous social gradient in health – is what was expected on
the basis of theory and earlier research. Less is known concerning how the social gradient
varies between age categories and between European welfare states, which was the
problems approached by this paper.
With respect to the first and second research question and corresponding hypotheses, the
cross-country variation in health inequalities (as opposed to average health) becomes much
larger for the older age group: the random slope for class goes from statistical insignificance
to clear significance when switching age group. So while overall or average class differences
in most countries become slightly less distinct with increasing age, as evident from the
Tables 5 to 8, the size of this reduction becomes more sensitive to national (or welfare state)
context. This seems logical against the backdrop of the theory discussed earlier: the elderly,
for whom labour income is no longer a realistic option, are more reliant on public welfare
policies, and in lack of these policies they are dependent on family relations or on having
accumulated enough private resources during working life. In short, the elderly are more
reliant on welfare state policies, and welfare policies in turn vary strongly between the
countries covered here. This interpretation is supported by the finding that the intraclass
correlation (measuring variation in average population health) for both health outcomes is
about twice as large for the older age group as compared to the younger. An interesting
pattern thus emerges: overall, class differences in health decrease in old age, but only where
welfare policies are extensive and developed enough to secure a decent living and health
care for all residents, regardless of employment history. As discussed, contradictory
theoretical predictions made it difficult to formulate stringent hypotheses concerning if
health inequalities can be expected to grow larger or smaller in later life; two opposing
34
hypotheses were stated (1a and 1b), neither of which received unqualified support by the
findings presented here. Rather, we might say that the absence of an evident hypothesis is
supported: the trajectory of health disparities is non-uniform, with some welfare states that
manage to reduce inequalities, while in others they are intensified. Greater cross-country
heterogeneity in health inequalities among the oldest is, however, in line with the second
hypotheses of the paper.
This naturally leads to the third research question and hypothesis. The results presented in
this study provide some interesting support for the hypothesis that welfare states do shape
health inequalities and that welfare regimes, as theorized by Esping-Andersen, can account
for this. The most convincing results in support for this inference is that cross-country
heterogeneity in both overall population health and in health inequalities increase as people
grow older, retire and become more reliant on public welfare, and that this increased
heterogeneity largely correspond to the welfare regime typology. This is most clear with
regard to the Social democratic regime and the Eastern and Southern regimes respectively:
for the older age group, for whom welfare policies matter most, overall population health
does not deteriorate and class differences are significantly reduced or even removed in
Social democratic countries (see Appendix 4), while population health deteriorates
considerably in Eastern and Southern Europe at the same times as class differences remain
large in the Eastern regime, and are even intensified in the Southern regime. The trajectory
for Conservative countries can also be considered to be in line with predictions based on
welfare regime theory: a status maintaining but nonetheless extensive welfare state should
demonstrate stable or slightly reduced, and not excessively large, class differences in older
age. The Liberal regime, with extensive private welfare provision, have, as expected, clearly
larger excess morbidity for manual workers (relative to professionals) than the Social
democratic regime, and this excess morbidity does not seem do decrease with age. On the
other hand, the middle class (professionals, routine workers and the petty bourgeoisie)
seem to fare very well in Liberal countries.
Although the results for farmers and the petty bourgeoisie, with relatively few observations
when separated by regime type, should be interpreted more cautiously, they do
demonstrate some intriguing cross-regime variation. The very good health of the petty
bourgeoisie is striking: in the Liberal regime most of all, but also in the Conservative and
Eastern regimes, they appear to be healthier than the professional class. The particularly
good position of the petty bourgeoisie and (not least) of farmers in the Liberal regime can be
seen as indicating that a market-based welfare system is beneficial for entrepreneurs, who
are less reliant on social security and who can take advantage of the opportunities offered
by a free market. Farmers have on average (that is, over the whole data material) almost as
bad health as manual workers, but with large variation between regimes. In the
Conservative and Liberal regimes, less so in the Social democratic, we can discern a major
reduction in morbidity when moving from manual workers to farmers. These are also the
early industrializers among the countries analyzed, why farmers there are probably more
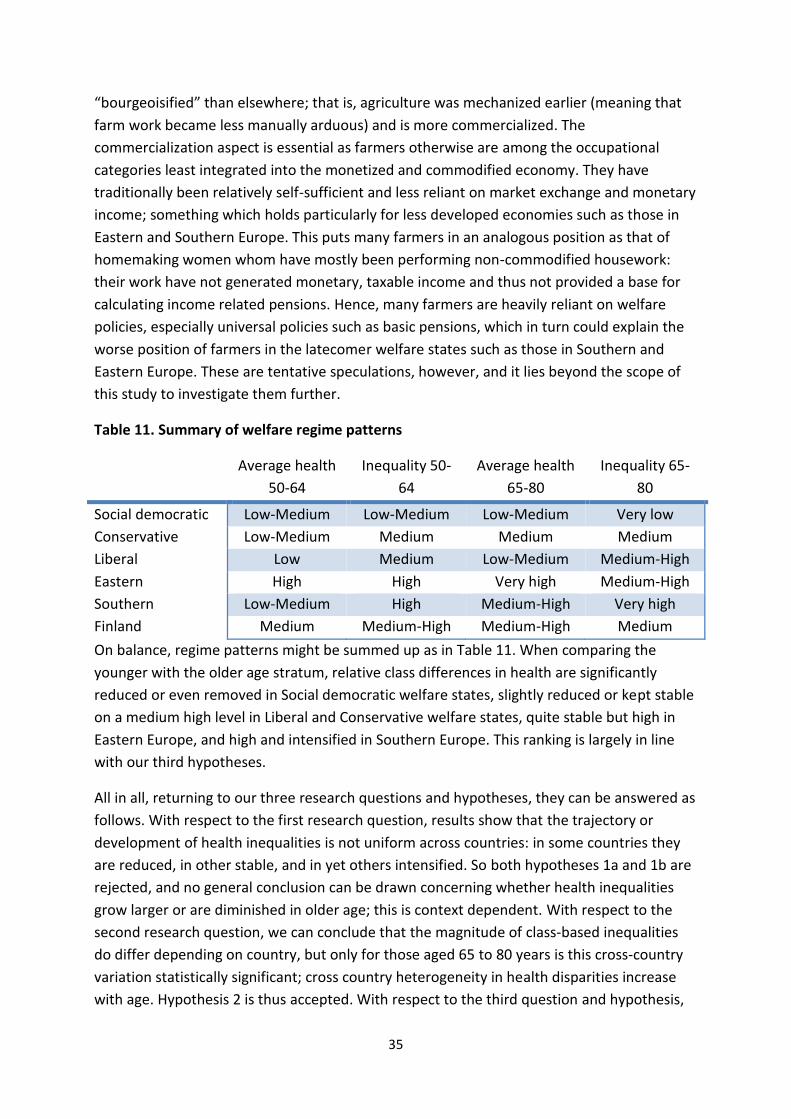
35
“bourgeoisified” than elsewhere; that is, agriculture was mechanized earlier (meaning that
farm work became less manually arduous) and is more commercialized. The
commercialization aspect is essential as farmers otherwise are among the occupational
categories least integrated into the monetized and commodified economy. They have
traditionally been relatively self-sufficient and less reliant on market exchange and monetary
income; something which holds particularly for less developed economies such as those in
Eastern and Southern Europe. This puts many farmers in an analogous position as that of
homemaking women whom have mostly been performing non-commodified housework:
their work have not generated monetary, taxable income and thus not provided a base for
calculating income related pensions. Hence, many farmers are heavily reliant on welfare
policies, especially universal policies such as basic pensions, which in turn could explain the
worse position of farmers in the latecomer welfare states such as those in Southern and
Eastern Europe. These are tentative speculations, however, and it lies beyond the scope of
this study to investigate them further.
Table 11. Summary of welfare regime patterns
Average health
50-64
Inequality 50-
64
Average health
65-80
Inequality 65-
80
Social democratic Low-Medium Low-Medium Low-Medium Very low
Conservative Low-Medium Medium Medium Medium
Liberal Low Medium Low-Medium Medium-High
Eastern High High Very high Medium-High
Southern Low-Medium High Medium-High Very high
Finland Medium Medium-High Medium-High Medium
On balance, regime patterns might be summed up as in Table 11. When comparing the
younger with the older age stratum, relative class differences in health are significantly
reduced or even removed in Social democratic welfare states, slightly reduced or kept stable
on a medium high level in Liberal and Conservative welfare states, quite stable but high in
Eastern Europe, and high and intensified in Southern Europe. This ranking is largely in line
with our third hypotheses.
All in all, returning to our three research questions and hypotheses, they can be answered as
follows. With respect to the first research question, results show that the trajectory or
development of health inequalities is not uniform across countries: in some countries they
are reduced, in other stable, and in yet others intensified. So both hypotheses 1a and 1b are
rejected, and no general conclusion can be drawn concerning whether health inequalities
grow larger or are diminished in older age; this is context dependent. With respect to the
second research question, we can conclude that the magnitude of class-based inequalities
do differ depending on country, but only for those aged 65 to 80 years is this cross-country
variation statistically significant; cross country heterogeneity in health disparities increase
with age. Hypothesis 2 is thus accepted. With respect to the third question and hypothesis,
36
we can state that hypothesis 3 is accepted: cross-country variation in the magnitude of
health inequalities largely correspond to the hypothesized welfare regime pattern, at least
as far as the oldest age group is concerned. This fact, together with the finding that we
observe increased cross-country heterogeneity in health disparities for the oldest and hence
most welfare dependent population, support the conclusion that health inequalities are
indeed shaped by welfare state institutions and can be reduced by adequate welfare
policies. Precisely which underlying welfare policies are most important in this respect
remain unanswered by this study, as welfare regimes are operationalized as institutional
configurations and not decomposed into single policies.
Interface with previous research
How do these results relate to prior research and theory on the subject, discussed earlier?
The arguably foremost result of the study – increased cross-country heterogeneity in health
inequalities for the oldest – is not altogether in tune with the theory of accumulated
advantage. Whereas some countries indeed show intensified class differences for the
elderly, in line with accumulated advantage theory, the overall picture is that class
differences on the contrary are stable or become smaller in older age. But, and this is the
crucial point, this class-age relationship is cross-country heterogeneous and conditional on
welfare state context: in the absence of equalizing and counteracting policies, health
advantages indeed appear to be accumulated and reinforced in older life, but the results
presented here suggest that widening disparities is not a necessary trajectory. A related
point to make with regard to the research discussed previously is that the importance of
welfare policies for equitable active ageing cannot be overstated. Kangas and Palme describe
how, before public pension systems were constructed, poverty risks followed the life cycle
and often peaked in older age (Kangas & Palme, 2000). An analogous argument can be made
for health risks: in the absence of welfare policies such as old age pensions and universal
health services, old age will not only mean declining health (physical decay is, after all, a
biological necessity), but also worse health disparities. Moreover, and again in the context of
active ageing, these results put the currently predominating active ageing strategies in
doubt. If class differences in health are indeed this large for the 50-64 year old (“pre-
retirement”) population, the current almost exclusive focus on prolonging working life is not
neutral from a class perspective. Many manual workers are not healthy enough to work
longer, not least since manual occupations typically are much more physically arduous. If
pension systems are reformed to incentivize postponed retirement, economic disparities
among retirees will grow larger as well, as involuntarily early retired (due to health
problems) will see their pensions shrink in relative terms. Wider economic disparities are in
turn likely to translate into widening health disparities. Longer working life can also have a
direct effect on class differences in health: if the supposition made in this study – that
reduced health inequalities in older age are to some extent due to the fact that work-related
health problems are alleviated after retirement – longer working life will postpone this
37
equalizing retirement effect, and possibly make work related health problems permanent
and more difficult to reverse.
Research concerning health effects of retirement has, as mentioned, mostly concentrated on
average measures and not explicitly on health inequalities. While the present study does not
focus on the effect of retirement per se – that would be difficult with cross-sectional data –
the results can nonetheless be taken as indirectly supporting the view that retirement is
good for health, at least as far as manual workers in richer countries with adequate welfare
provisions are concerned: the deterioration in overall population health between the age
groups is very small in the Liberal and Conservative regimes, and practically non-existing in
the Social democratic one (see Appendix 4). The literature concerning retirement effects on
health inequalities is more meagre, but cautiously point to diminishing class differences with
retirement (Berg et al., 1988; Westerlund et al., 2009). That conclusion is supported here,
but with an essential qualification: reduced health inequalities in older age are welfare state
or context-dependent.
The comparative literature of health and welfare regimes has, as discussed, not converged
on an entirely clear and consistent regime pattern. Contrary to at least some previous
studies (see Bambra, 2011 for a good overview), but in line with theoretical predictions, the
Social democratic countries have by far the smallest health inequalities among the countries
studied. The contradictory results could partly be due to different health measures
(morbidity in contrast to mortality), different conceptualizations of inequality (most
morbidity studies have studied income or education-based inequality, not inequality based
on occupational class), or due to this study’s explicit focus on ageing and the elderly.
Previous studies comparing welfare regimes have typically focused on the entire adult
population, or on the working age population, not on ageing. Nor have previous studies
stratified the sample by age and explicitly compared age categories. This study shows that it
can be seriously misleading to neglect the age-dimension when studying health inequalities.
Life course epidemiology not only teaches that factors in early life can have long-term health
consequences, but also that different health determinants are of varying importance
depending on timing, age and point in the life course (Ben-Shlomo & Kuh, 2002). As
emphasized, the elderly are both one of the most fragile population categories and those
most reliant on public welfare policies; this makes them a particularly pertinent study object
from a welfare regime perspective.
Strengths and weaknesses
The most obvious weakness of the present study is undoubtedly the cross-sectional nature
of the data. As often acknowledged, cross sectional data is well-suited for descriptive
purposes, but when it comes to drawing causal inferences, it is more problematic. Causality
is dependent on temporality, and the temporal order cannot be determined with data
collected at one point in time. Causal inferences are then left to be made on the basis of
relevant theory, logic, common sense and reasoning. It is up to the reader to judge whether
38
this reasoning is sensible or not. Due to the cross-sectional design of this study, it cannot be
ruled out that some or all of the differences between age categories is a cohort effect. Nor
can the possibility of a selection bias in the data be disregarded: with declining health overall
among the elderly, a larger part of the total population is at risk of being institutionalized for
health reasons, and they are not included in the sample (Esser & Palme, 2010). Another
possible flaw of the study is that, in contrast to education, occupational status, and hence
social class, is, at least in principle, potentially fluid even in later life. Thus, a health selection
effect into manual occupations – a reversed causation – cannot be ruled out. With respect to
the large regime differences in health inequalities, this would imply that health selection is a
much stronger mechanism in for example the Southern regime than in the Social democratic
one. Health selection is, however, a less plausible explanation for the reduced class
differences in later life. The institutional analysis can also be criticized. Clear differences in
health inequalities between European countries was demonstrated, and to a large extent
these correspond to the welfare state regime typology, but the causal path leading from
welfare policies to health inequalities have not been empirically established. After all, many
aspects besides welfare state institutions distinguish European countries from one another,
and it cannot be ruled out that these non-welfare regime factors account for the observed
cross-country variation. Another imperfection of the study is that it only investigates relative
health inequalities; relative measures are sensitive to the baseline level, that is, to the
overall prevalence of a health outcome in a country, and absolute health inequalities might
give a different picture (Eikemo, Skalická & Avendano, 2009; Lahelma & Lundberg, 2009).
These weaknesses are, in turn, balanced by some important advantages of the study. The
data material from the European Social Survey is both large in terms of the number of
observations (approaching 80 000), and extensively harmonized across countries, which
makes the results reliable and robust. This robustness is further underlined by the stability of
the core results across health measures and despite a range of controls. Of particular
relevance here is that the class-health pattern across welfare regimes was basically the same
for both health measures (at least as far as the older age group is concerned). The almost
completely stable ranking in odds ratios between the respective classes for both outcomes is
testimony of the validity of the respective health measures. It indicates that both measures
refer to a related basic condition, with similar symptoms and similar causes: both appear to
be manifestations of an underlying dimension of morbidity. Another strength is the
decomposition of the analysis into separate age groups, which revealed interesting cross-
regime heterogeneity in how health inequalities develop over the ageing process. The
foremost advantage of the study, though, is the theoretically driven multilevel approach: not
only is the cross-country database utilized to increase the sample size (a micro level
approach), or to empirically describe differences between countries (a macro level
approach), but the individual and country levels are linked within a common analytical
framework. The study is thus able to theoretically as well as empirically account for both
micro- and macro-level factors at the same time, to clarify how macro-level factors might
interact with, and modify the effect of, individual characteristics such as social class.
39
Future research should focus on specific institutions and policies, rather than only on
institutional configurations such as welfare regimes, in order to disentangle and identify the
concrete mechanisms linking institutions to population health. Future comparative research
should also aim to decompose the analysis further, e.g. to specific age groups or by
investigating how social class interacts with gender. This study shows that social and
demographic groups are not uniform in how they are influenced by welfare policies, and that
different health determinants are of varying importance depending on where in the life
course one is. Additionally, the present study use a quite crude indication of the ageing
process: a simple cut-off point roughly corresponding to official retirement age in the
majority of countries. Longitudinal data would provide an opportunity to study e.g. cross-
country heterogeneity in retirement effects more directly.
40
References
Anderson, K M. & Meyer, T. (2003) Social Democracy, Unions, and Pension Politics in Germany and Sweden. Journal of Public Policy. Volume 23, Issue 01, January 2003, pp 23-54
Avendano, M.; Jürges, H & Mackenbach, J (2009). Educational level and changes in health across Europe: longitudinal results from SHARE. Journal of European Social Policy. October 2009 vol. 19 no. 4. pp 301-316
Bambra, C. (2007). ‘Sifting the Wheat from the Chaff’: A Two-dimensional Discriminant Analysis of Welfare State Regime Theory. Social Policy & Administration. Volume 41, Issue 1, pp 1–28
Bambra C. (2011). Health inequalities and welfare state regimes: theoretical insights on a public health 'puzzle'. J Epidemiol Community Health. 2011 Sep;65(9):740-5.
Benjamins, M.R.; Hummer R.A.; Eberstein I.W.; Nam C.B. (2004). Self-reported health and adult mortality risk: an analysis of cause-specific mortality. Soc Sci Med. 2004 Sep;59(6):1297-306.
Ben-Shlomo Y. & Kuh D. (2002). A life course approach to chronic disease epidemiology: conceptual models, empirical challenges and interdisciplinary perspectives. Int J Epidemiol. 2002 Apr;31(2):285-93.
Berg M.; Sandén A.; Torell G.; Järvholm B. (1988). Persistence of musculoskeletal symptoms: a longitudinal study. Ergonomics. 1988 Sep;31(9):1281-5.
Bergqvist K; Yngwe M.A.; Lundberg O. (2013). Understanding the role of welfare state characteristics for health and inequalities - an analytical review. BMC Public Health. 2013 Dec 27;13:1234.
Bettio, F. & Verashchagina, A. (ed.) (2010). Long-Term Care for the elderly. Provisions and providers in 33 European countries. Luxembourg: Publications Office of the European Union, 2012
Bonoli, G. (1997). Classifying Welfare States: a Two-dimension Approach. Journal of Social Policy. Volume 26, Issue 03, July 1997, pp 351-372
Bonoli, G. (2003). Two Worlds of Pension Reform in Western Europe. Comparative Politics, Vol.35, No. 4, July 2003
Brennenstuhl S.; Quesnel-Vallée A; McDonough P. (2012). Welfare regimes, population health and health inequalities: a research synthesis. J Epidemiol Community Health. 2012 May;66(5):397-409
Brockmann, H.; Müller, R.; Helmert, U. (2009). Time to retire--time to die? A prospective cohort study of the effects of early retirement on long-term survival. Soc Sci Med. 2009 Jul;69(2):160-4.
Carpiano, R; Link, B; Phelan, J. (2008). “Social inequality and health: future directions for the fundamental cause explanation” in Lareau & Conley (2008) Social class: how does it work?
Chung, H. & Muntaner, C. (2007). Welfare state matters: A typological multilevel analysis of wealthy countries. Health Policy Volume 80, Issue 2, February 2007, Pages 328–339
Coe, N B. & Zamarro, G. (2011). Retirement effects on health in Europe. J Health Econ. 2011 Jan;30(1):77-86
CSDH (Commision on Social Determinants of Health) (2008). Closing the gap in a generation: health equity through action on the social determinants of health. Final Report of the Commission on Social Determinants of Health. Geneva, World Health Organization.
41
Dorer, B.; Widdop, S; Gatrell, L. & Wäyrynen, L. (2012) “ESS6 - verification instructions for national coordinators”. Mannheim, European Social Survey, GESIS
Ebbinghaus, B. (2012). Comparing Welfare State Regimes: Are Typologies an Ideal or Realistic Strategy? Draft Paper presented at European Social Policy Analysis Network, ESPAnet Conference, Edinburgh, UK, September 6‐8, 2012.
Eikemo T.; Huisman M.; Bambra C.; Kunst A E. (2008a). Health inequalities according to educational level in different welfare regimes: a comparison of 23 European countries. Sociol Health Illn. 2008 May;30(4):565-82
Eikemo, T.; Bambra, C; Judged, K; Ringdala, K. (2008b). Welfare state regimes and differences in self-perceived health in Europe: A multilevel analysis. Social Science & Medicine Volume 66, Issue 11, June 2008, Pages 2281–2295
Eikemo T; Bambra C; Joyce K.; et al. (2008c). Welfare state regimes and income related health inequalities: a comparison of 23 European countries. Eur J Public Health 2008 Volume 18, Issue 6, pp. 593 - 599
Eikemo T; Skalická V; Avendano M. (2009). Variations in relative health inequalities: are they a mathematical artefact? Int J Equity Health. 2009 Aug 27;8:32
Emmenegger, P; Häusermann, S; Palier, B & Seeleib-Kaiser, M. (2012). The Age of Dualization The Changing Face of Inequality in Deindustrializing Societies. Oxford. Oxford University Press
Espelt A; Borrell C; Rodríguez-Sanz M; Muntaner C; Pasarín M; Benach J; Schaap M; Kunst A.E.; Navarro V. (2008). Inequalities in health by social class dimensions in European countries of different political traditions. Int J Epidemiol. 2008 Oct;37(5):1095-105.
Esping-Andersen, G. (1990). The three worlds of welfare capitalism. Cambridge: Polity
Esping-Andersen, G. (1999). Social foundations of postindustrial economies. New York: Oxford University Press
Esser, I. & Palme, J. (2010). Do public pensions matter for health and wellbeing among retired persons? Basic and income security pensions across 13 Western European countries. International Journal of Social Welfare, Volume 19, Issue Supplement s1, pages 103–S120
European Commision (2012). Active ageing and gender equality policies The employment and social inclusion of women and men of late working and early retirement age. Luxembourg: Publications Office of the European Union, 2012
European Social Survey (2013). Round 7 Specification for Participating Countries. London: Centre for Comparative Social Surveys, City University London.
Ferrera, M. (1996). The southern model of welfare in social Europe. Journal of European Social Policy, Vol 6, 1, 17–37.
Ferrera, M. (1998). “The Four 'Social Europes': Between Universalism and Selectivity“ in The future of European welfare : a new social contract? edited by Martin Rhodes and Yves Mény. Basingstoke: Macmillan
Freeman, D A. (2006). “On the So-Called "Huber Sandwich Estimator" and "Robust Standard Errors"”. The American Statistician, Vol. 60, No. 4 (Nov., 2006), pp. 299-302
42
Ganzeboom, H. (1996). “Internationally Comparable Measures of Occupational Status for the 1988 International Standard Classification of Occupations”. Social science research, Vol 25, 201-239, article no. 0010
Geyer, S.; Hemström, Ö.; Peter, R. & Vågerö, D. (2006). Education, income, and occupational class cannot be used interchangeably in social epidemiology. Empirical evidence against a common practice. J Epidemiol Community Health. Sep 2006; 60(9): 804–810.
Goldthorpe, J H. & Erikson, R. (1992). The constant flux : a study of class mobility in industrial societies. Oxford : Clarendon
Häusermann, S. (ed) (2010). The politics of welfare state reform in continental Europe: modernization in hard times. New York ; Cambridge University Press
Halleröd, B.; Örestig, J.; Stattin, M. (2013). Leaving the labour market: the impact of exit routes from employment to retirement on health and wellbeing in old age. European Journal of Ageing, 10 ( 1 ) s. 25-35
Hox, J. (2010). Multilevel analysis - techniques and applications. New York: Routledge.
Hult, C.; Stattin, M.; Janlert, U.; Järvholm, B. (2009). Timing of retirement and mortality--a cohort study of Swedish construction workers. Soc Sci Med. 2010 May;70(10):1480-6.
Hurrelmann, K.; Rathmann, K.; Richter, M. (2010). Health inequalities and welfare state regimes. A research note. J Public Health, (2011) 19:3–13
Hyde, M; Ferrie, J; Higgs, P; Mein, G; Nazroo, J; (2004). The effects of pre-retirement factors and retirement route on circumstances in retirement: findings from the Whitehall II study. Ageing and Society, 24(2), pp. 279-296.
Idler E.L.; Benyamini Y. (1997). Self-rated health and mortality: a review of twenty-seven community studies. J Health Soc Behav, 1997 Mar;38(1):21-37.
Jylhä M; Guralnik J.M; Ferrucci L.; Jokela J; Heikkinen E. (1998). Is self-rated health comparable across cultures and genders?. J Gerontol B Psychol Sci Soc Sci. 1998 May;53(3):144-52.
Kangas, O. & Palme, J. (2000). Does social policy matter? Poverty cycles in OECD countries. Int J Health Serv. 2000;30(2):335-52.
Kasneci, D. (2007). Active Ageing: the EU Policy Response to the Challenge of Population Ageing. The European Paper on the new Welfare, Paper No. 8, September 2007: Issues on the Counter-Ageing Society
Korpi, W. & Palme, J. (1998). The Paradox of Redistribution and Strategies of Equality: Welfare State Institutions, Inequality, and Poverty in the Western Countries. American Sociological Review, Vol. 63, No. 5 (Oct., 1998), pp. 661-687
Kovacs, J.M. (2002). Approaching the EU and reaching the US? Rival narratives on transforming welfare regimes in East-Central Europ. West European Politics, Vol 25, 2, 175–204.
Kunst A.E; Groenhof F; Mackenbach J.P.; Health E.W. (1998a). Occupational class and cause specific mortality in middle aged men in 11 European countries: comparison of population based studies. EU Working Group on Socioeconomic Inequalities in Health. BMJ. 1998 May 30;316(7145):1636-42.
43
Kunst A.E; Groenhof F; Mackenbach JP. (1998b). Mortality by occupational class among men 30-64 years in 11 European countries. EU Working Group on Socioeconomic Inequalities in Health. Soc Sci Med. 1998 Jun;46(11):1459-76.
Kunst AE; Bos V; Lahelma E; Bartley M; Lissau I; Regidor E; Mielck A; Cardano M: Dalstra JA; Geurts JJ; Helmert U; Lennartsson C; Ramm J; Spadea T; Stronegger WJ; Mackenbach JP. (2005). Trends in socioeconomic inequalities in self-assessed health in 10 European countries. Int J Epidemiol. 2005 Apr;34(2):295-305. Epub 2004 Nov 24
Lahelma, E. & Lundberg, O. (2009). Health inequalities in European welfare states European Journal of Public Health, Vol. 19, No. 5, 445–446
Lareau, A. & Conley, D. (2008). Social class : how does it work? New York : Russell Sage Foundation
Leiulfsrud, H.; Bison, I; Jensberg, H. (2005). Social class in Europe. European Social Survey 2002/3. NTNU Social Research Ltd., Trondheim 2005
Loretto, W. (2007). The future for older workers : new perspectives. Bristol, UK : Policy Press
Lundberg O. (2008) Commentary: Politics and public health--some conceptual considerations concerning welfare state characteristics and public health outcomes. Int J Epidemiol. 2008 Oct;37(5):1105-8
Mackenbach JP; Simon JG; Looman CW; Joung IM. (2002). Self-assessed health and mortality: could psychosocial factors explain the association? Int J Epidemiol. 2002 Dec;31(6):1162-8.
Mackenbach JP; Stirbu I; Roskam AJ; Schaap MM; Menvielle G; Leinsalu M; Kunst AE; (2008) Socioeconomic inequalities in health in 22 European countries. N Engl J Med. 2008 Jun 5;358(23):2468-81.
Maltby, T. (2007): “The employability of older workers: what works?” in Loretto, Wendy (2007). “The future for older workers : new perspectives"
Marmot, M. (2004). Status syndrome : how your social standing directly affects your health and life expectancy. London : Bloomsbury
Marx, K. (1993) (1858): Grundrisse: Foundations of the Critique of Political Economy. London. Penguin Books
Merton, R. (1968): The Matthew Effect in Science. Science, 159(3810) pp 56-63
Muntaner, C; Borrell, C.; Ng, E.; Chung, H.; Espelt, A.; Rodriguez-Sanz, M.; et al. (2011). Politics, welfare regimes, and population health: controversies and evidence. Sociology of Health & Illness, Sep;33(6):946-64
Mäki N; Martikainen P; Eikemo T; Menvielle G; Lundberg O; Ostergren O; Jasilionis D; Mackenbach JP;. (2013). Educational differences in disability-free life expectancy: a comparative study of long-standing activity limitation in eight European countries. Social Science & Medicine, 2013 Oct;94:1-8
Nordenmark, M. & Stattin, M. (2009). Psychosocial wellbeing and reasons for retirement in Sweden. Ageing and Society, Volume 29, Issue 03, April 2009, pp 413-430
Norström, T. & Palme, J. (2010). Public pension institutions and old-age mortality in a comparative perspective International. Journal of Social Welfare, Volume 19, Issue Supplement s1, pages S121–S130
44
Pierson, P. (2000). Increasing Returns, Path Dependence, and the Study of Politics. The American Political Science Review Vol. 94, No. 2 (Jun., 2000), pp. 251-267
Piketty, T. (2013). Capital in the Twenty-first Century. Cambridge, Mass: Belknap Press of Harvard University Press
Richter M; Rathman K; Nic Gabhainn S; Zambon A; Boyce W; Hurrelmann K. (2012). Welfare state regimes, health and health inequalities in adolescence: a multilevel study in 32 countries. Sociol Health Illn. 2012 Jul;34(6):858-79
Rodriquez, R; Huber, M; & Lamura, G. (2012). Facts and Figures on Healthy Ageing and Long-term Care Europe and North America. Vienna : European Centre for Social Welfare Policy and Research
Rothstein, B. (1992). “Labor -market institutions and working-class strength” in Structuring politics : historical institutionalism in comparative analysis. edited by Sven Steinmo, Kathleen Thelen, and Frank Longstreth Cambridge ; Cambridge University Press
Shuey KM; Willson AE. (2008). Cumulative disadvantage and black-white disparities in life-course health trajectories. Research on Aging, Mar; 30 (2): 200-25.
Sen, A. (2009). The Idea of Justice. Cambridge : Belknap Press of Harvard University Press
Stiglitz, J. (2012). The Price of Inequality. New York: W.W. Norton & Company Inc.
Toch-Marquardt M; Menvielle G; Eikemo TA; Kulhánová I; Kulik MC; Bopp M; Esnaola S; Jasilionis D; Mäki N; Martikainen P; Regidor E; Lundberg O; Mackenbach JP. (2014). Occupational Class Inequalities in All-Cause and Cause-Specific Mortality among Middle-Aged Men in 14 European Populations during the Early 2000s. PLoS One. 2014 Sep 30;9(9)
Twisk, J. (2006). Applied multilevel analysis : a practical guide. Cambridge : Cambridge University Press
van der Heide I; van Rijn RM; Robroek SJ; Burdorf A; Proper KI. (2013). Is retirement good for your health? A systematic review of longitudinal studies. BMC Public Health. 2013 Dec 13;13:1180.
van Doorslaer E; Koolman X. (2004). Explaining the differences in income-related health inequalities across European countries. Health Econ. 2004 Jul;13(7):609-28.
van Doorslaer E; Wagstaff A; Bleichrodt H; Calonge S; Gerdtham UG; Gerfin M; Geurts J; Gross L; Häkkinen U; Leu RE; O'Donnell O; Propper C; Puffer F; Rodríguez M; Sundberg G; Winkelhake O; (1997). Income-related inequalities in health: some international comparisons. J Health Econ. 1997 Feb;16(1):93-112.
van Solinge, H. & Henkens, K. (2008). Adjustment to and Satisfaction With Retirement: Two of a Kind?. Psychology and Aging, 2008, Vol. 23, No. 2, 422– 434
Wang, M; Henkens, K; van Solinge, H. (2011). Retirement adjustment: A review of theoretical and empirical advancements. Am Psychol. 2011 Apr;66(3):204-13
Weber, M. (1972). Wirtschaft und Gesellschaft : Grundriss der verstehenden Soziologie., rev. Aufl., Tübingen: Mohr
Westerlund, H; Kivimäki, M; Singh-Manoux, A; Melchior, M; Ferrie, JE; Pentti, J; Jokela, M; Leineweber, C; Goldberg, M; Zins, M; Vahtera, J. (2009). Self-rated health before and after retirement in France (GAZEL): a cohort study. Lancet, Volume 374, Issue 9705, 5–11 December 2009, Pages 1889–1896

45
Wilkinson, R. (2005). The impact of inequality : how to make sick societies healthier. London: Routledge
Willson, A. E; Shuey, K M.; Elder, G H.: (2007). Cumulative Advantage Processes as Mechanisms of Inequality in Life Course Health. American Journal of Sociology, Vol. 112, No. 6, May 2007
Internet
European Commission, Active Ageing Index http://www1.unece.org/stat/platform/display/AAI/Active+Ageing+Index+Home Accessed on the 9th of October 2014, 09.30 a.m.
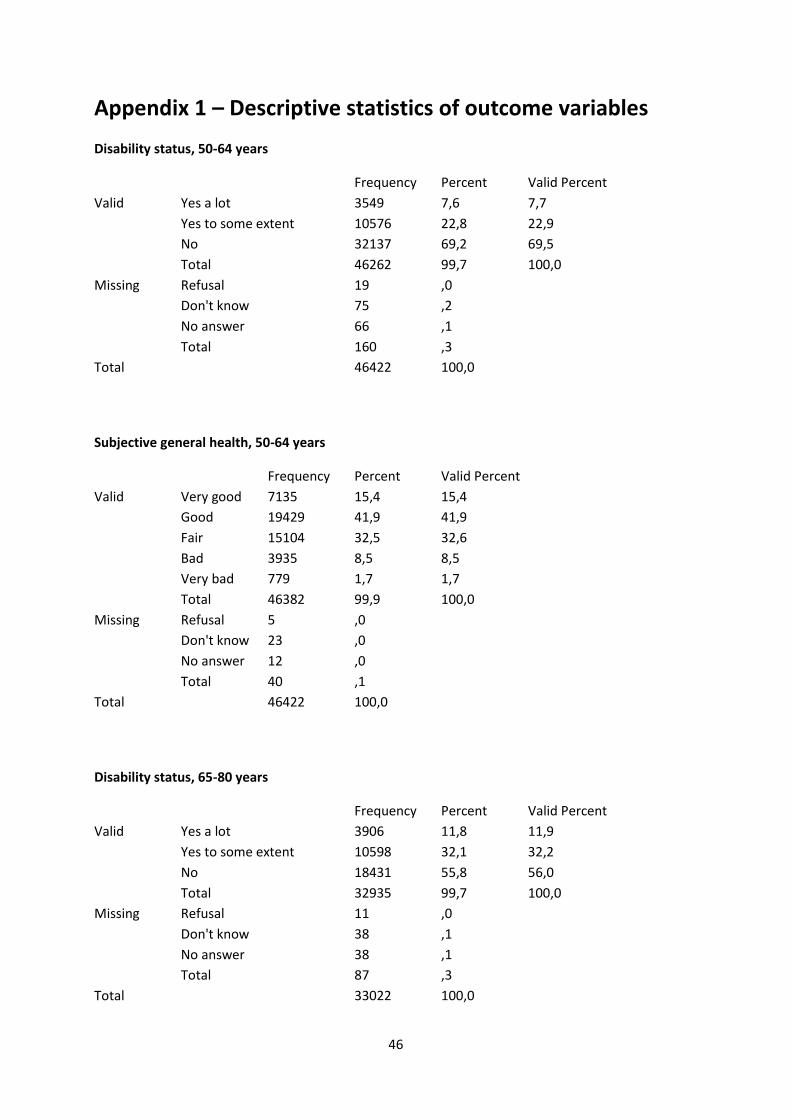
46
Appendix 1 – Descriptive statistics of outcome variables
Disability status, 50-64 years
Frequency Percent Valid Percent
Valid Yes a lot 3549 7,6 7,7
Yes to some extent 10576 22,8 22,9
No 32137 69,2 69,5
Total 46262 99,7 100,0
Missing Refusal 19 ,0
Don't know 75 ,2
No answer 66 ,1
Total 160 ,3
Total 46422 100,0
Subjective general health, 50-64 years
Frequency Percent Valid Percent
Valid Very good 7135 15,4 15,4
Good 19429 41,9 41,9
Fair 15104 32,5 32,6
Bad 3935 8,5 8,5
Very bad 779 1,7 1,7
Total 46382 99,9 100,0
Missing Refusal 5 ,0
Don't know 23 ,0
No answer 12 ,0
Total 40 ,1
Total 46422 100,0
Disability status, 65-80 years
Frequency Percent Valid Percent
Valid Yes a lot 3906 11,8 11,9
Yes to some extent 10598 32,1 32,2
No 18431 55,8 56,0
Total 32935 99,7 100,0
Missing Refusal 11 ,0
Don't know 38 ,1
No answer 38 ,1
Total 87 ,3
Total 33022 100,0
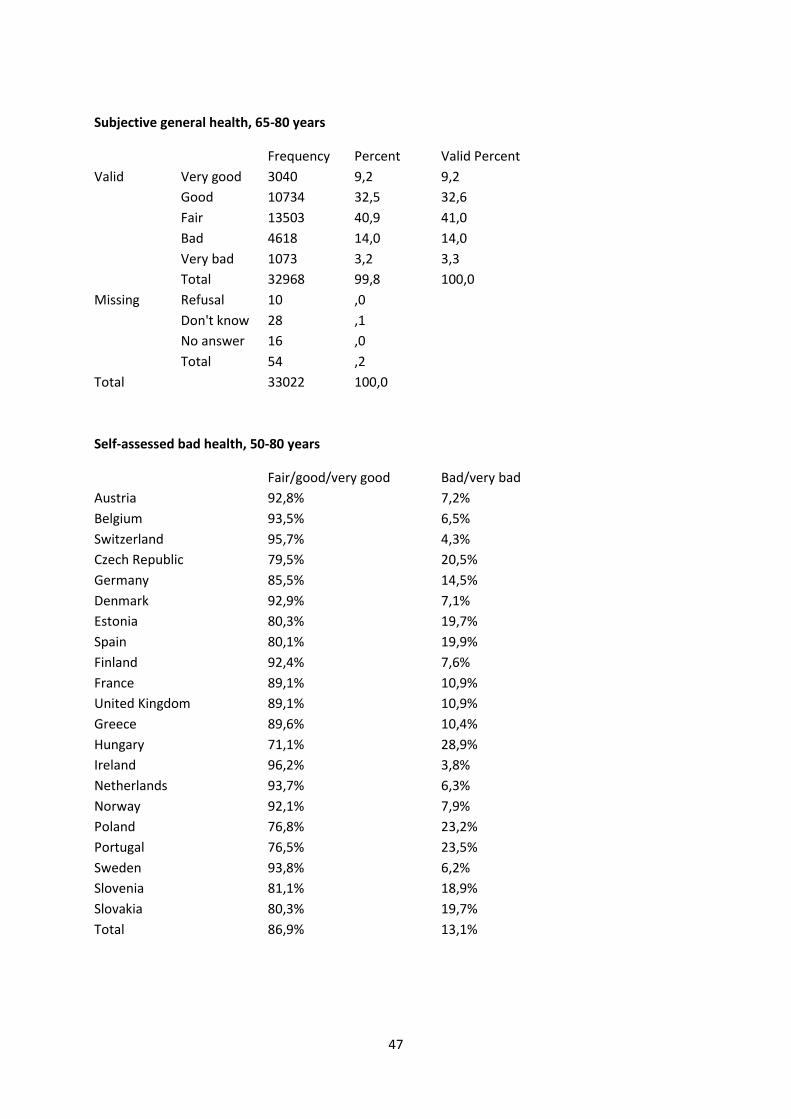
47
Subjective general health, 65-80 years
Frequency Percent Valid Percent
Valid Very good 3040 9,2 9,2
Good 10734 32,5 32,6
Fair 13503 40,9 41,0
Bad 4618 14,0 14,0
Very bad 1073 3,2 3,3
Total 32968 99,8 100,0
Missing Refusal 10 ,0
Don't know 28 ,1
No answer 16 ,0
Total 54 ,2
Total 33022 100,0
Self-assessed bad health, 50-80 years
Fair/good/very good Bad/very bad
Austria 92,8% 7,2%
Belgium 93,5% 6,5%
Switzerland 95,7% 4,3%
Czech Republic 79,5% 20,5%
Germany 85,5% 14,5%
Denmark 92,9% 7,1%
Estonia 80,3% 19,7%
Spain 80,1% 19,9%
Finland 92,4% 7,6%
France 89,1% 10,9%
United Kingdom 89,1% 10,9%
Greece 89,6% 10,4%
Hungary 71,1% 28,9%
Ireland 96,2% 3,8%
Netherlands 93,7% 6,3%
Norway 92,1% 7,9%
Poland 76,8% 23,2%
Portugal 76,5% 23,5%
Sweden 93,8% 6,2%
Slovenia 81,1% 18,9%
Slovakia 80,3% 19,7%
Total 86,9% 13,1%
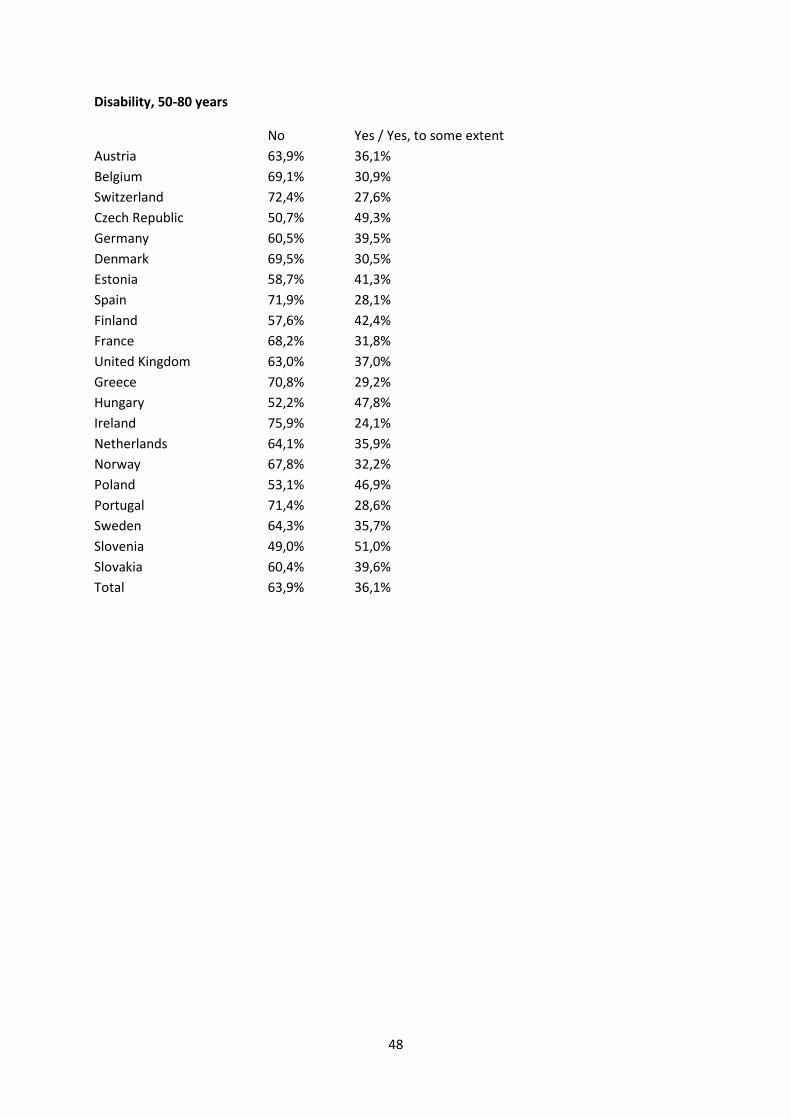
48
Disability, 50-80 years
No Yes / Yes, to some extent
Austria 63,9% 36,1%
Belgium 69,1% 30,9%
Switzerland 72,4% 27,6%
Czech Republic 50,7% 49,3%
Germany 60,5% 39,5%
Denmark 69,5% 30,5%
Estonia 58,7% 41,3%
Spain 71,9% 28,1%
Finland 57,6% 42,4%
France 68,2% 31,8%
United Kingdom 63,0% 37,0%
Greece 70,8% 29,2%
Hungary 52,2% 47,8%
Ireland 75,9% 24,1%
Netherlands 64,1% 35,9%
Norway 67,8% 32,2%
Poland 53,1% 46,9%
Portugal 71,4% 28,6%
Sweden 64,3% 35,7%
Slovenia 49,0% 51,0%
Slovakia 60,4% 39,6%
Total 63,9% 36,1%
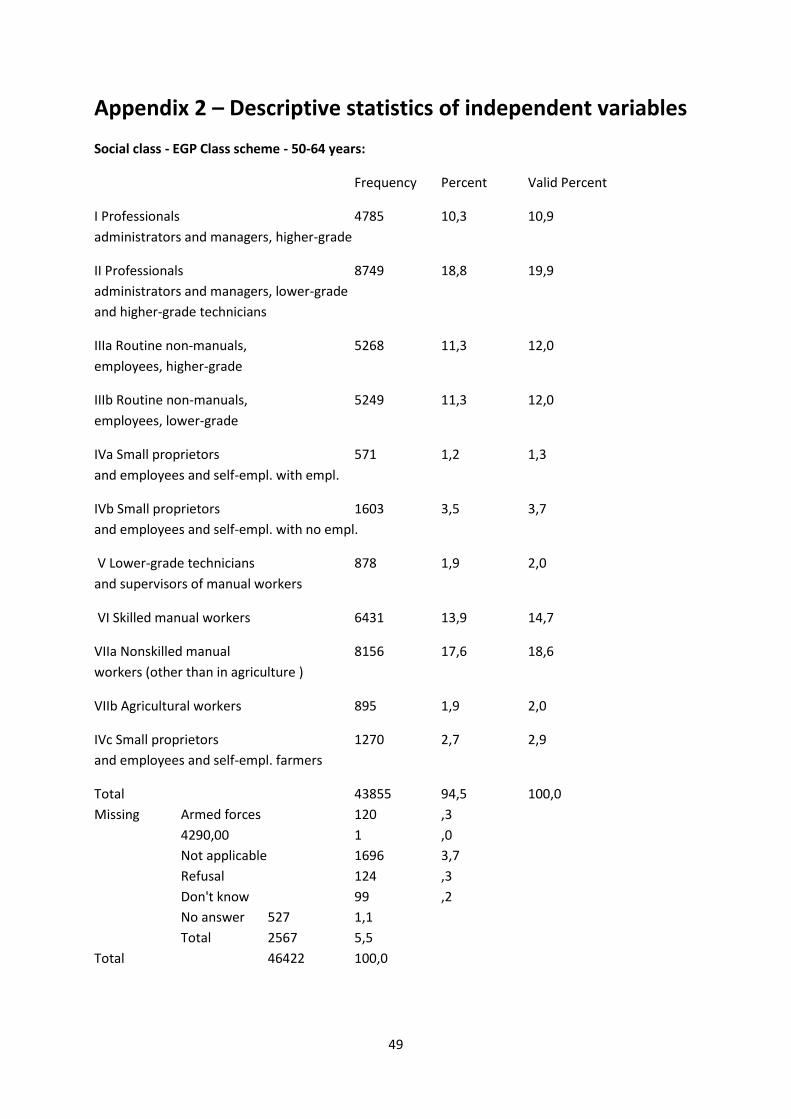
49
Appendix 2 – Descriptive statistics of independent variables
Social class - EGP Class scheme - 50-64 years:
Frequency Percent Valid Percent
I Professionals 4785 10,3 10,9
administrators and managers, higher-grade
II Professionals 8749 18,8 19,9
administrators and managers, lower-grade
and higher-grade technicians
IIIa Routine non-manuals, 5268 11,3 12,0
employees, higher-grade
IIIb Routine non-manuals, 5249 11,3 12,0
employees, lower-grade
IVa Small proprietors 571 1,2 1,3
and employees and self-empl. with empl.
IVb Small proprietors 1603 3,5 3,7
and employees and self-empl. with no empl.
V Lower-grade technicians 878 1,9 2,0
and supervisors of manual workers
VI Skilled manual workers 6431 13,9 14,7
VIIa Nonskilled manual 8156 17,6 18,6
workers (other than in agriculture )
VIIb Agricultural workers 895 1,9 2,0
IVc Small proprietors 1270 2,7 2,9
and employees and self-empl. farmers
Total 43855 94,5 100,0
Missing Armed forces 120 ,3
4290,00 1 ,0
Not applicable 1696 3,7
Refusal 124 ,3
Don't know 99 ,2
No answer 527 1,1
Total 2567 5,5
Total 46422 100,0
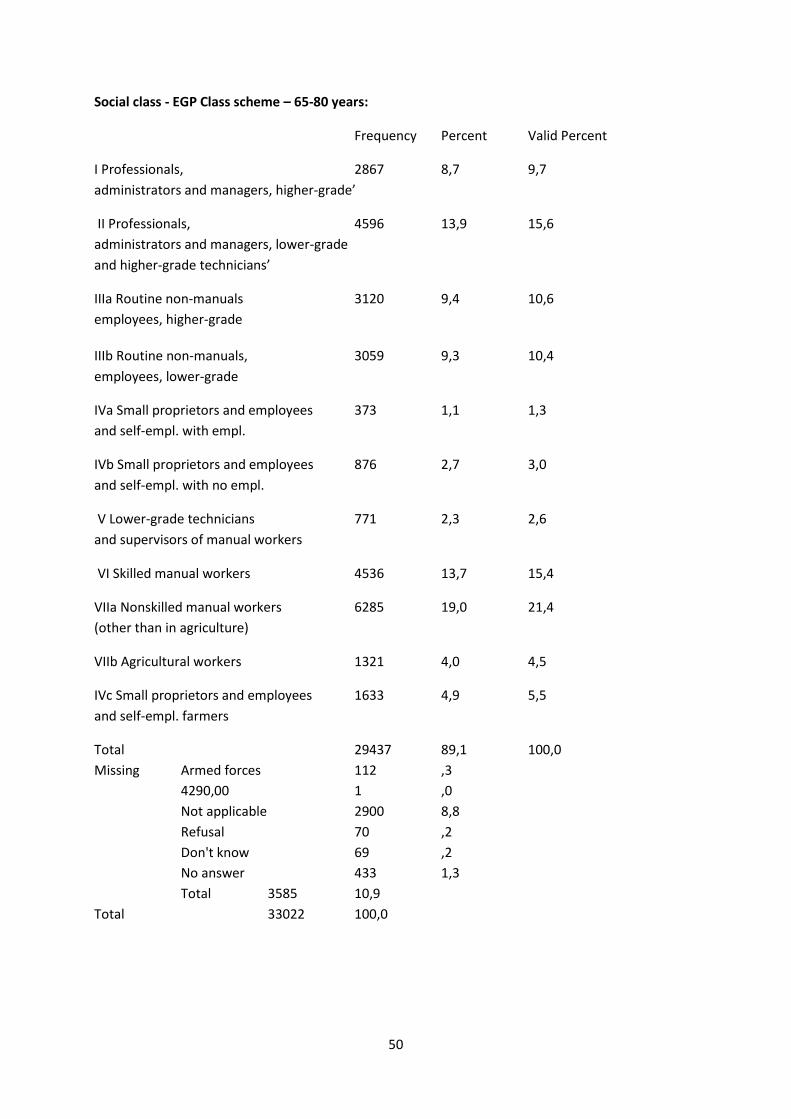
50
Social class - EGP Class scheme – 65-80 years:
Frequency Percent Valid Percent
I Professionals, 2867 8,7 9,7
administrators and managers, higher-grade’
II Professionals, 4596 13,9 15,6
administrators and managers, lower-grade
and higher-grade technicians’
IIIa Routine non-manuals 3120 9,4 10,6
employees, higher-grade
IIIb Routine non-manuals, 3059 9,3 10,4
employees, lower-grade
IVa Small proprietors and employees 373 1,1 1,3
and self-empl. with empl.
IVb Small proprietors and employees 876 2,7 3,0
and self-empl. with no empl.
V Lower-grade technicians 771 2,3 2,6
and supervisors of manual workers
VI Skilled manual workers 4536 13,7 15,4
VIIa Nonskilled manual workers 6285 19,0 21,4
(other than in agriculture)
VIIb Agricultural workers 1321 4,0 4,5
IVc Small proprietors and employees 1633 4,9 5,5
and self-empl. farmers
Total 29437 89,1 100,0
Missing Armed forces 112 ,3
4290,00 1 ,0
Not applicable 2900 8,8
Refusal 70 ,2
Don't know 69 ,2
No answer 433 1,3
Total 3585 10,9
Total 33022 100,0
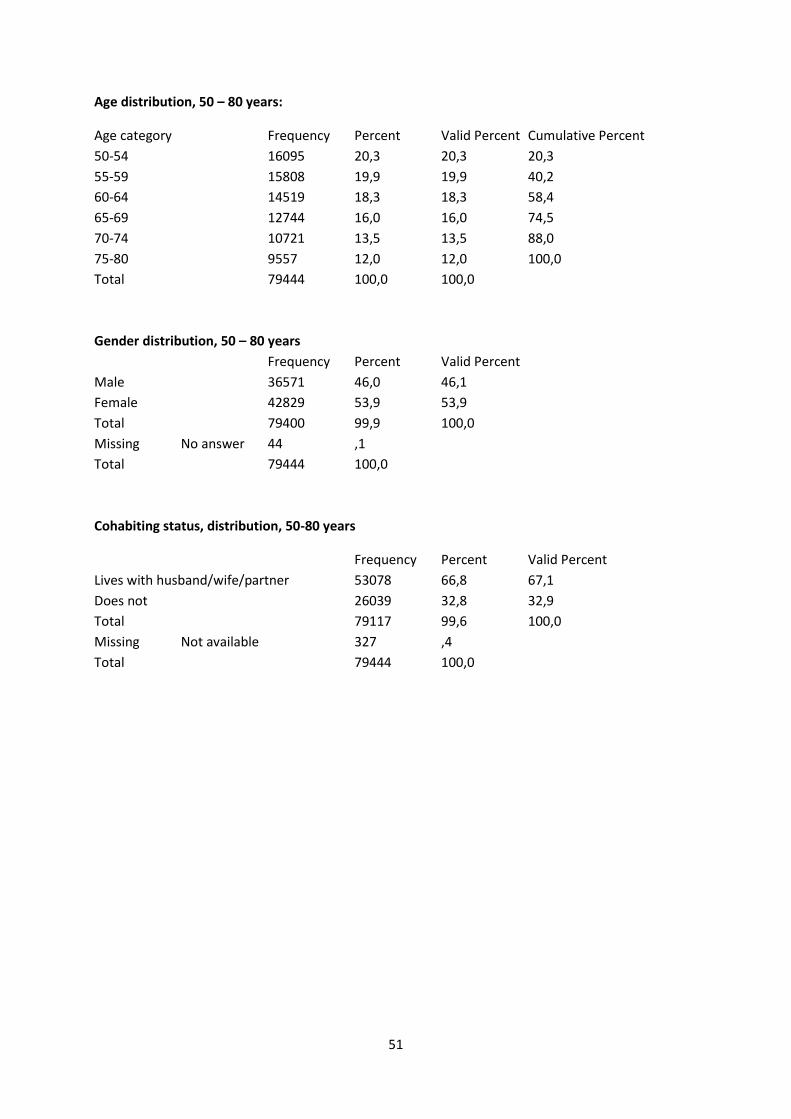
51
Age distribution, 50 – 80 years:
Age category Frequency Percent Valid Percent Cumulative Percent
50-54 16095 20,3 20,3 20,3
55-59 15808 19,9 19,9 40,2
60-64 14519 18,3 18,3 58,4
65-69 12744 16,0 16,0 74,5
70-74 10721 13,5 13,5 88,0
75-80 9557 12,0 12,0 100,0
Total 79444 100,0 100,0
Gender distribution, 50 – 80 years
Frequency Percent Valid Percent
Male 36571 46,0 46,1
Female 42829 53,9 53,9
Total 79400 99,9 100,0
Missing No answer 44 ,1
Total 79444 100,0
Cohabiting status, distribution, 50-80 years
Frequency Percent Valid Percent
Lives with husband/wife/partner 53078 66,8 67,1
Does not 26039 32,8 32,9
Total 79117 99,6 100,0
Missing Not available 327 ,4
Total 79444 100,0
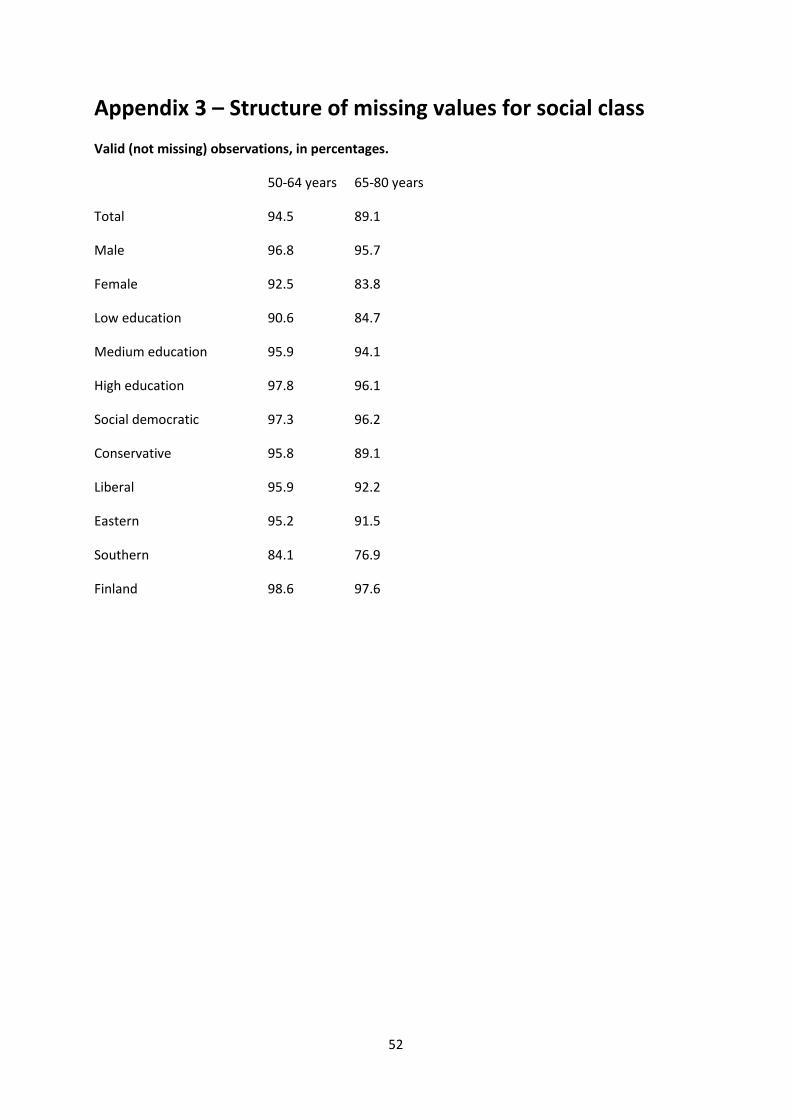
52
Appendix 3 – Structure of missing values for social class
Valid (not missing) observations, in percentages.
50-64 years 65-80 years
Total 94.5 89.1
Male 96.8 95.7
Female 92.5 83.8
Low education 90.6 84.7
Medium education 95.9 94.1
High education 97.8 96.1
Social democratic 97.3 96.2
Conservative 95.8 89.1
Liberal 95.9 92.2
Eastern 95.2 91.5
Southern 84.1 76.9
Finland 98.6 97.6
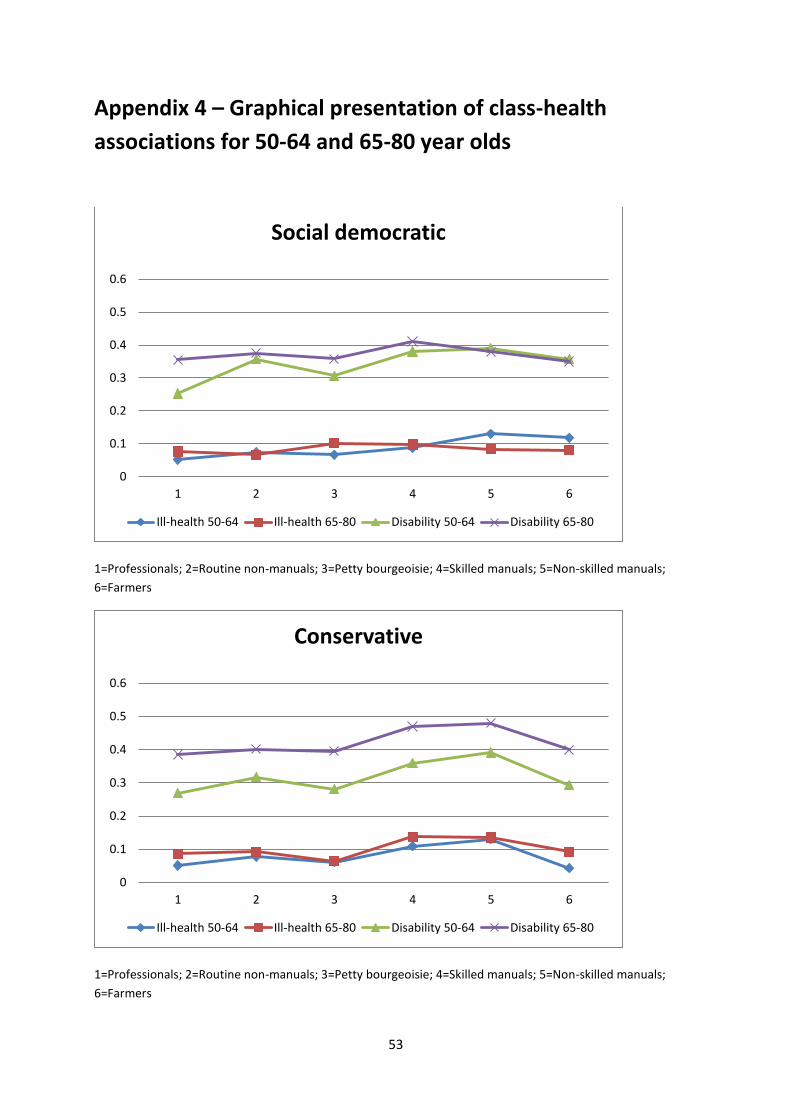
53
Appendix 4 – Graphical presentation of class-health
associations for 50-64 and 65-80 year olds
1=Professionals; 2=Routine non-manuals; 3=Petty bourgeoisie; 4=Skilled manuals; 5=Non-skilled manuals;
6=Farmers
1=Professionals; 2=Routine non-manuals; 3=Petty bourgeoisie; 4=Skilled manuals; 5=Non-skilled manuals;
6=Farmers
0
0.1
0.2
0.3
0.4
0.5
0.6
1 2 3 4 5 6
Social democratic
Ill-health 50-64 Ill-health 65-80 Disability 50-64 Disability 65-80
0
0.1
0.2
0.3
0.4
0.5
0.6
1 2 3 4 5 6
Conservative
Ill-health 50-64 Ill-health 65-80 Disability 50-64 Disability 65-80
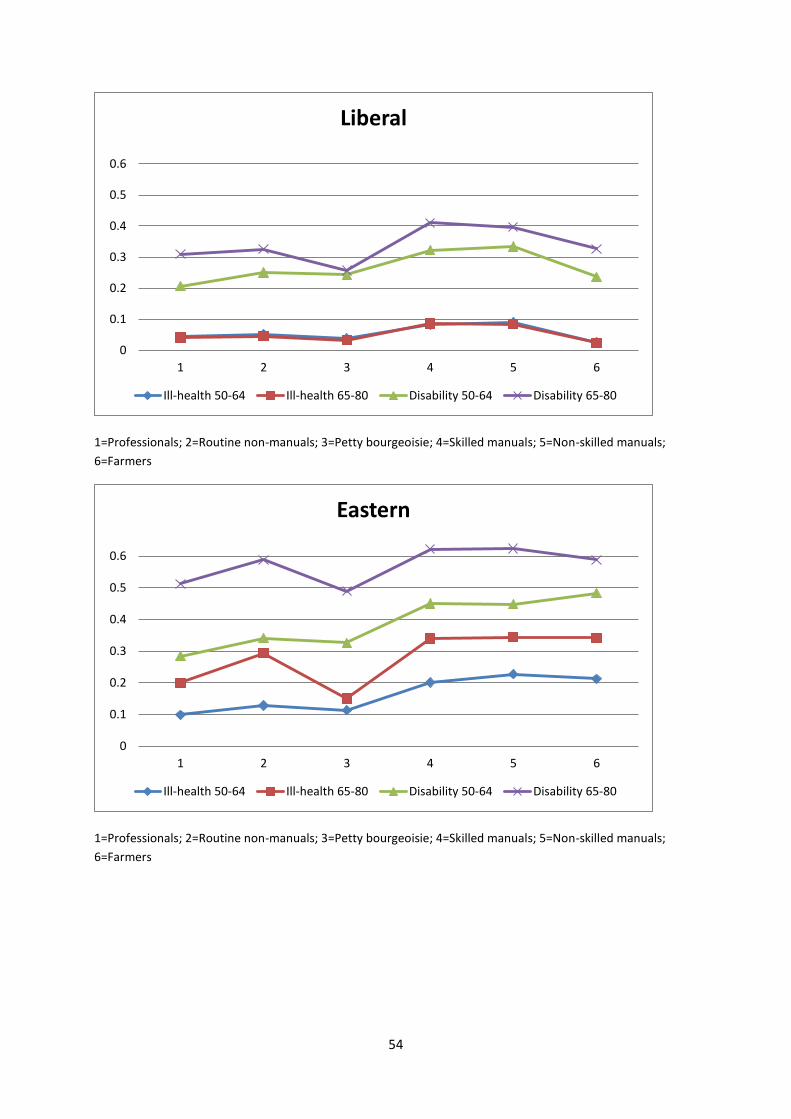
54
1=Professionals; 2=Routine non-manuals; 3=Petty bourgeoisie; 4=Skilled manuals; 5=Non-skilled manuals;
6=Farmers
1=Professionals; 2=Routine non-manuals; 3=Petty bourgeoisie; 4=Skilled manuals; 5=Non-skilled manuals;
6=Farmers
0
0.1
0.2
0.3
0.4
0.5
0.6
1 2 3 4 5 6
Liberal
Ill-health 50-64 Ill-health 65-80 Disability 50-64 Disability 65-80
0
0.1
0.2
0.3
0.4
0.5
0.6
1 2 3 4 5 6
Eastern
Ill-health 50-64 Ill-health 65-80 Disability 50-64 Disability 65-80
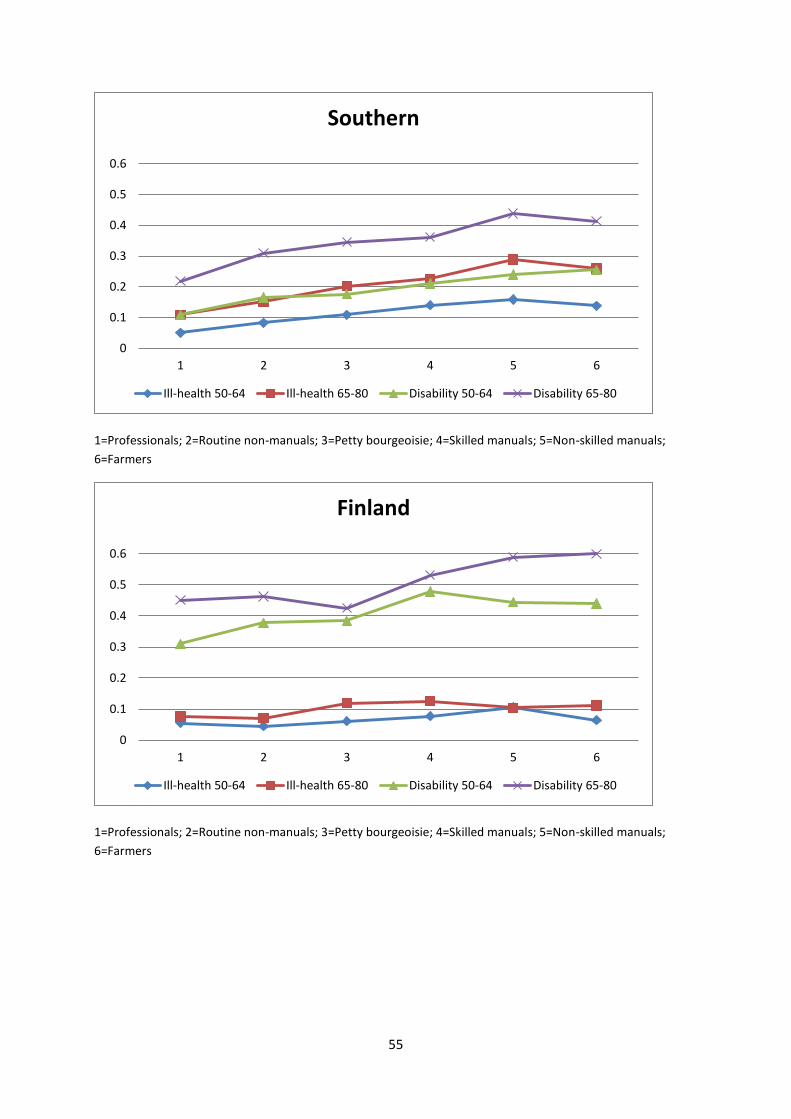
55
1=Professionals; 2=Routine non-manuals; 3=Petty bourgeoisie; 4=Skilled manuals; 5=Non-skilled manuals;
6=Farmers
1=Professionals; 2=Routine non-manuals; 3=Petty bourgeoisie; 4=Skilled manuals; 5=Non-skilled manuals;
6=Farmers
0
0.1
0.2
0.3
0.4
0.5
0.6
1 2 3 4 5 6
Southern
Ill-health 50-64 Ill-health 65-80 Disability 50-64 Disability 65-80
0
0.1
0.2
0.3
0.4
0.5
0.6
1 2 3 4 5 6
Finland
Ill-health 50-64 Ill-health 65-80 Disability 50-64 Disability 65-80