agency budget statements - finance.gov.au · part c: aec - overview 73 australian electoral...
TRANSCRIPT

71
Australian Electoral Commission
Agency Budget Statements

THIS PAGE IS INTENTIONALLY LEFT BLANK

Part C: AEC - Overview
73
AUSTRALIAN ELECTORAL COMMISSION
Section 1: Overview, Appropriations and Budget Measures Summary
OVERVIEW
The Australian Electoral Commission (AEC) is an independent statutory body established under the CommonwealthElectoral Act 1918.
The AEC seeks to provide the Australian people with an independent electoral service which meets their needs,encourages them to understand and participate in the electoral process, and to enhance free and fair electoral processesthroughout the world.
The purpose of the Australian Electoral Commission is ‘to help people have their say’.
It does this by:
• maintaining the electoral roll;
• conducting elections and referendums; and
• providing electoral information, education programs and related services.
The impact on the Australian community of actions by the AEC in fulfilling its role is in three areas. These Outcomesare summarised below.
Outcome 1 (An effective electoral roll)
Australians have an electoral roll which ensures their voter entitlement and provides the basis for the planning ofelectoral events, and electoral redistributions.
Outcome 2 (Impartiality and independence)
Stakeholders/customers have access to, and advice on impartial and independent electoral services andparticipate in electoral events.
Outcome 3 (An informed community)
An Australian community which is well informed about electoral matters.
APPROPRIATIONS
The total appropriation for the AEC in the 2001-02 Budget is $ 184m.
Table 1.1, on the following page, shows the total appropriations for the AEC for 2001-02 by the three GovernmentOutcomes, by administered expenses and by price of output appropriation.

Part C: AEC - Overview
74
Australian Electoral Commission — Appropriations 2001-02
Table 1.1: Appropriations and Other Revenue ($’000)Outcomes Departmental (Price of Outputs) Administered
Revenue from Government (Appropriations) Revenuefrom other
sources4
Price of Outputs3 Annual Appropriations2 SpecialApprops5
TotalAdministered
Appropriations
TotalAppropriations1
Bill No 1 SpecialApprops
Total Bill No 1 Bill No 2(SPPs &
NAOs)(A) (B) (C=A+B) (D) (E= C+D) (F) (G) (H) (I=F+G+H) (J=C+I)
An EffectiveElectoral Roll
32,174 9,000 41,174(C1)
i (92.2%)
3,500 44,674(E1)
- - - - 41,174
Impartial andIndependentElectoral Services
97,640 - 97,640(C2)
i (97.2%)
2,801 100,441(E2)
- - 39,924 39,924(I2)
137,564
An InformedCommunity
5,259 - 5,259(C3)
i (99.1%)
50 5,309(E3)
- - - - 5,259
Total 135,0736 9,000 144,073(K1)
i (95.8%)
6,351 150,424 - - 39,924 39,924(K2)
183,997
Departmental Capital (Equity Injections and Loans) 2. (K3) -Administered Capital 2. -
Total Appropriations 183,997Notes:1. Cells C1 and E1 refer to information provided in Table 2.1.1, C2, E2 and I2 to Table 2.3.2 and C3 and E3 to Table 2.5.3. Amounts K1 to Table 3.1: Budgeted Statement of
Revenues and Expenses, K2 to Table 3.6: Statement of Administered Revenues and Expenses, and amounts K3 to Table 3.4: Capital Budget.2. Under the appropriation structure, Bill No 2 includes Specific Purpose Payments (SPP’s), New Agency Outcomes (NAO’s), administered capital and departmental capital via departmental injections and
loans.3. Refer to Budgeted Statement of Revenue and Expense for application of agency revenue.4. Revenue from other sources includes other revenue from government (eg resources free of charge) and revenue from other sources (eg sales of goods and services).
Non-appropriated departmental and administered revenues are detailed in Appendix 1.5. Estimated expenses from individual Special Appropriations are shown in Appendix 2.6. Includes $3,046k from a previous years appropriation.i Percentage figures indicate the percentage contribution of Revenue from Government (Departmental Appropriations) to the Total Price of Outputs, by outcome.

Part C: AEC - Overview
75
Section 2: Outcomes and Outputs Information
OUTCOMES AND OUTPUT GROUPS
The map on the following page shows the relationship between outcomes and the contributing outputs for the AustralianElectoral Commission (AEC).
Non-financial information and financial details for the Outcomes by outputs and output groups appear in the tableslisted under each Outcome.
APPROPRIATIONS BY OUTCOMES
The following chart lists departmental appropriations by Outcomes.
Chart 1: Departmental Appropriation by Outcome
Outcome 2 - Impartial and Independent
Electoral Services 67.7%
Outcome 1 - An Effective
Electoral Roll28.6%
Outcome 3 - An Informed
Community3.7%

Part C: AEC - Outcome 1
76
Outcomes and Output Groups
Australian Electoral CommissionElectoral Commissioner: Mr Andy Becker
Total Price of Outputs $150.4mDepartmental Outputs Appropriation $144.1mTotal Administered Expenses $39.9m
Outcome 1
Australians have an electoral roll which ensurestheir voter entitlement and provides the basis for
the planning of electoral events, and electoralredistributions
Total Price $44.7mDept Outputs Appropriation $41.2m
Outcome 2
Stakeholders/customers have access to and advice onimpartial and independent electoral services and
participate in electoral events
Total Price $100.4mDept Outputs Appropriation $97.6mAdministered Expenses $39.9m
Outcome 3
An Australian community which is well informed aboutelectoral matters
Total Price $5.3mDept Outputs Appropriation $5.3m
Output Group 3.1
Electoral Education
Total Price $5.3mAppropriation $5.3m
Output Group 2.1
Elections, Ballots and Referendums
Total Price $100.4mAppropriation $97.6mAdministered Expenses $39.9m
Output Group 1.1
Electoral Roll Management
Total Price $44.7mAppropriation $41.2m

Part C: AEC - Outcome 1
77
OUTCOME 1 — AUSTRALIANS HAVE AN ELECTORAL ROLL WHICH ENSURES THEIR VOTERENTITLEMENT AND PROVIDES THE BASIS FOR THE PLANNING OF ELECTORAL EVENTS ANDELECTORAL REDISTRIBUTIONS.
The AEC undertakes enrolment processing activities and focuses on meeting the requirements of internal and externalusers of roll-based products. During 2001-2002 the AEC will continue to undertake roll maintenance activities,including the accurate and timely processing of enrolments, to ensure that accurate and complete joint electoral rolls(Commonwealth and State/Territory) are available to meet the requirements of internal and external users.
During 2001-2002, Continuous Roll Update (CRU) activities will be further expanded to provide a mature CRUprogram. The AEC also has in place plans for the implementation of Electoral and Referendum Amendment Act (No.1)1999. Implementation will commence on the making of Regulations and the subsequent proclamation of the relevantsections of the legislation. This legislation contains new procedures to upgrade witnessing and to check the citizenshipstatus of persons enrolling, and to require the sighting of proof of identity documents for first time enrollees.
The areas of focus in 2001-2002 will be reflected in the AEC achieving the planned targets for 2001-2002 as set out inTable 2.2.1.

Part C: AEC - Outcome 1
78
Outcome 1 — Output Structure
Outcome 1
Australians have an electoral roll which ensures their voterentitlement and provides the basis for the planning of
electoral events, and electoral redistributions
Total Price of Outputs $44.7mDepartmental Outputs Appropriation $41.2mRevenue from Other Sources $3.5m
Output Group 1.1
Electoral roll management
Output 1.1.1
Electoral roll (RMANS)
Total Price $24.8mApprops $21.9mRevenue $2.9m
Output 1.1.2
Electoral roll updates(ERR/CRU)
Total Price $18.3mApprops $18.3mRevenue $0m
Output 1.1.3
Roll products andservices
Total Price $1.3mApprops $0.7mRevenue $0.6m
Output 1.1.4
Support services forelectoral redistributions
Total Price $0.3mApprops $0.3mRevenue $0m
Note: Revenue from Government (Appropriations) contributes 92.2 per cent to the Total Price of Output for Outcome 1for 2001-02.

Part C: AEC - Outcome 1
79
OUTCOME 1 — RESOURCING
Table 2.1.1: Total Resources for Outcome 1 ($’000)Estimated
ActualBudget
Estimate2000-01($’000)
2001-02($’000)
Departmental appropriationsCommonwealth Electoral Act 1918 – Electoral Roll Review – SpecialAppropriationOutput 1.1.2 — Electoral Roll Updates (ERR/CRU) 9,000 9,000
Subtotal special appropriation 9,000 9,000Output group 1.1Output 1.1.1 — Electoral roll (RMANS)Output 1.1.2 — Electoral roll updates (ERR/CRU)Output 1.1.3 — Roll products and servicesOutput 1.1.4 — Support services for electoral Redistributions
26,4499,286
630414
21,9249,286
650316
Subtotal output group 1.1 36,779 32,176Total revenue from government (appropriations)
Contributing to price of departmental outputs45,779 41,176
Revenue from other sources 3,500 3,500Total revenue from other sources 3,500 3,500
Total Price of departmental outputs(Total revenue from Government and from other sources)
49,279 44,676
Total estimated resourcing for outcome 1(Total price of outputs and admin expenses)
49,279 44,676
2000-01 2001-02Average Staffing Level (Number) 405 294
In addition the AEC employs casuals to assist with enrolment activities. Estimated full time equivalent number for2000-01 is 58 and 2001-02 is 88.

Part C: AEC - Outcome 1
80
OUTCOME 1 — CONTRIBUTION OF OUTPUTS
Justification for the outputs chosen to achieve Outcome 1 is described in table 2.2.1. The table provides information onthe means by which Outcome 1 will be delivered, and shows the links between the outputs and the outcomes.
PERFORMANCE INFORMATION FOR OUTCOME 1
Table 2.2.1: Performance Information for Outcome 1
Effectiveness — Overall achievement of the Outcome(Measures, indicators and targets used as appropriate)
• Percentage of people eligible to vote who are on the electoral roll - 95%
• Extent to which Australians have access to their voting entitlement - 100%
• Extent to which the electoral roll provides the basis for planning of electoralevents and electoral redistributions - meets 90% of requirements
• Level of stakeholder and customer satisfaction with electoral products andservices - meets Customer Service Charter requirements
Performance Information for Departmental Outputs
Output Group 1.1 – Electoral Roll Management—
Output 1.1.1 —Electoral roll (RMANS) Quality:• 95% of eligible people are on the electoral rollQuantity:• Minimum of 2.3m enrolment transactions (not being deletions) processed per
annum• Enrolment forms are processed within 3 business days of receiptPrice:• Less than $2.75 per entry on RMANS database
Output 1.1.2 — Electoral roll updates(ERR/CRU)
Quality:• Vacant addresses eligible for enrolment are maintained at 10% or less after
allowance for non-citizen occupantsQuantity:• 2.5m habitations reviewed per annum• 1.4m enrolment transactions processed from review activitiesPrice:• Less than $4.50 per habitation reviewed
Output 1.1.3 — Roll products andservices
Quality:• Greater than 98% accuracy in products delivered• Greater than 98% of delivery deadlines achieved• Achieve a Customer Service Index of 4.0 or greater (Scale 0-5) for
stakeholder and customer satisfaction with electoral products and servicesQuality:• 100% of ordered products are supplied
Output 1.1.4 — Support services forelectoral redistributions
Quality:• Redistribution Committees have a high level of satisfaction with services
provided• Services to Redistribution Committees comply with legislative timeframesQuantity:• Provide services to 1 Redistribution Committee
Table 2.2.1, above, lists the performance information that the AEC will use to assess the level of its achievement ofOutcome 1 during 2001-2002. The table also shows the efficiency of the outputs in contributing to Outcome 1.Information shown is both quantitative and qualitative. Targets for effectiveness have been included. Achievement ofplanned performance will be reported in the AEC’s 2001-2002 Annual Report.

Part C: AEC - Outcome 1
81
EVALUATIONS
In January 2002, the Electoral Council of Australia, which comprises the AEC and heads of all the State and Territoryelectoral authorities, will undertake an evaluation of the effectiveness of Continuous Roll Update activities. Theoutcomes of this activity will be summarised in the AEC 2001-2002 Annual Report.
COMPETITIVE TENDERING AND CONTRACTING
The printing of forms and letters required for enrolment processing and Continuous Roll Update activities is subject tocompetitive tendering. The AEC is also examining alternative ways of printing enrolment acknowledgement cards andintends to go back out into the market during 2001-2002.
Following the awarding of the contract for the upgrade of arrangements for the imaging and archiving of enrolmentdocuments in 2000-2001, the AEC is implementing this project with the successful tenderer.
The AEC's Market Testing and Contracting Out (MTACO) program for corporate service functions will continueduring 2001-2002. The initial component of the program, which was to identify functions and areas for market testing,has been completed and a timetable developed. During 2001-2002, market testing of the AEC's internal audit, corporateand support services and legal services will continue and subject to the outcome, either outsourced or re-engineered toimprove efficiency and effectiveness. Under Evaluations for Outcome 2 in the 1999-2000 Portfolio Budget Statements,a review into corporate service and support functions was mentioned. The agreed recommendations arising from thatevaluation have been included in the overall MTACO program.
As the MTACO process supports all of the AEC's Outcomes, it is listed under Outcome 1 for convenience only.

Part C: AEC - Outcome 2
82
OUTCOME 2 — STAKEHOLDERS/CUSTOMERS HAVE ACCESS TO AND ADVICE ONIMPARTIAL AND INDEPENDENT ELECTORAL SERVICES AND PARTICIPATE IN ELECTORALEVENTS
To achieve this Outcome, the AEC provides impartial and independent electoral services for Parliamentary elections,non-parliamentary elections and ballots, including ATSIC and industrial elections, services for registering politicalparties, and international advice and assistance in overseas elections.
For 2001-2002 the AEC will:
• Be fully prepared to conduct the Federal Election, expected before January 2002.
• Provide professional and effective electoral services associated with the conduct of non-parliamentary elections andballots.
• Continue provision of comprehensive and effective electoral information services to the Australian people andother electoral events conducted by the AEC.
• Support Australian foreign policy through the provision of effective international electoral assistance.
This Outcome includes administered expenses for Election Public Funding. This funding is provided to registeredpolitical parties and independent candidates following parliamentary elections.
The extent to which the AEC achieves this Outcome is reflected in the planned targets 2001-2002 as set out in Table2.4.2.

Part C: AEC - Outcome 2
83
OUTCOME 2 — OUTPUT STRUCTURE
Outcome 2
Stakeholders/customers have access to and advice onimpartial and independent electoral services and
participate in electoral events
Total Price of Outputs $100.4mDepartmental Outputs Appropriation $97.6mRevenue from Other Sources $2.8mAdministered Expenses 39.9m
Output Group 2.1
Elections, Ballots and Referendums
As Above
Output 2.1.1
Federal elections, by-electionsand referendums
Total Price $76.0mApprops $75.5mRevenue $0.5m
Output 2.1.2
Party registrations
Total Price $0.4mApprops $0.4mRevenue $0m
Output 2.1.3
Funding and disclosureservices
Total Price $1.0mApprops $1.0mRevenue $0mAdmin Expenses 39.9m
Output 2.1.4
Public awareness campaigns,media releases
Total Price $8.9mApprops $8.9mRevenue $0m
Output 2.1.5
Information services
Total Price $5.6mApprops $5.6mRevenue $0m
Output 2.1.6
Industrial elections, and ballots fororganisations
Total Price $5.7mApprops $5.4mRevenue $0.3m
Output 2.1.7
ATSIC elections
Total Price $0.5mApprops $0mRevenue $0.5m
Output 2.1.8
State and localgovernment elections
Total Price $0.2mApprops $0mRevenue $0.2m
Output 2.1.9
Advice and assistance in overseaselections
Total Price $2.1mApprops $0.8mRevenue $1.3m
Note: Revenue from Government (Appropriations) contributes 97.2 per cent to the Total Price of Outputs for Outcome 2 for 2001-02.

Part C: AEC - Outcome 2
84
OUTCOME 2 — RESOURCING
Table 2.3.2: Total Resources for Outcome 2 ($’000)Estimated
ActualBudget
Estimate2000-01($’000)
2001-02($’000)
Administered appropriationsCommonwealth Electoral Act 1918 - Election Public Funding 224 39,924
Total administered expenses 224 39,924Departmental appropriations
Output group 2.1Output 2.1.1 — Federal elections, by-elections and ReferendumsOutput 2.1.2 — Party registrationsOutput 2.1.3 — Funding and disclosure servicesOutput 2.1.4 — Public awareness campaigns, media releasesOutput 2.1.5 — Information servicesOutput 2.1.6 — Industrial elections and ballots for organisationsOutput 2.1.7 — ATSIC electionsOutput 2.1.8 — State and local government electionsOutput 2.1.9 — Advice and assistance in overseas elections
30,625
4071,115
982
9435,356
--
816
75,476
4211,0378,856
5,6095,403
--
838
Subtotal output group 2.1 40,244 97,640Total revenue from government (appropriations)
Contributing to price of departmental outputs40,244 97,640
Revenue from other sources 7,730 2,801Total revenue from other sources 7,730 2,801
Total Price of departmental outputs(Total revenue from Government and from other sources)
47,974 100,441
Total estimated resourcing for outcome 2(Total price of outputs and admin expenses)
48,198 140,365
2000-01 2001-02Average Staffing Level (Number) 363 474
In addition the AEC employs casuals to assist with electoral events. Estimated full time equivalent number for 2000-01is 9 and 2001-02 is 709.

Part C: AEC - Outcome 2
85
OUTCOME 2 — CONTRIBUTION OF OUTPUTS
Justification for the outputs chosen to achieve Outcome 2 is described in table 2.4.2. The table provides information onthe means by which Outcome 2 will be delivered, and shows the links between the outputs and the outcomes
.PERFORMANCE INFORMATION FOR OUTCOME 2
Table 2.4.2: Performance Information for Outcome 2
Effectiveness — Overall achievement of the Outcome — (Measures, indicators and targets used asappropriate)
• Extent to which stakeholders and customers have access to and advice onimpartial and independent electoral services - 100%
• Percentage of voter turnout at electoral events - 96%
• Extent to which legislative requirements are met - 100%
• Extent to which Customer Service Charter standards are met - 100%
Performance Information for Departmental Outputs
Output Group 2.1 — Elections Ballots and Referendums -
Quality:
• In accordance with timetables, 100% of operational systems, equipmentand procedures are in place and on time for the electoral event
• 100% of legislative requirements are met by the AEC
• Logistical capacity to conduct 100% of by-elections
• Between 5% and nil electoral litigation cases will have costs orderedagainst the AEC
• Between 80% to 100% of AEC recommendations to the JSCEM arereflected in the final report
• Between 80% to 100% of complaints of electoral offences against theCEA are dealt with appropriately
• 100% of legislation is developed and in force in order to conduct anelection
Output 2.1.1 —Federal elections,By-elections and referendums
Quantity:
• Maintain a level of preparedness which will enable the conduct of onefederal election, if called, and any necessary federal by-elections
Output 2.1.2 — Party registrations Quality:
• 100% compliance with legislative requirements
• The Party Register will at all times be 100% accurate and current
• 100% of registration of new parties and amendments to the Register willoccur within specified timeframes
Quantity:
• Capable of processing all applications and changes to the Register ofPolitical Parties during the year. (Estimate 10 applications and 80 changesto be processed)
Price:
• Less than $11,300 per application or change to the register

Part C: AEC - Outcome 2
86
Quality:
• 100% compliance with legislative requirements
• 100% of public funding payments comply with statutory requirements andtimeframes
• 100% of Annual Returns and Candidate Returns lodged will be available forpublic inspection on prescribed dates
• 100% of legislative timeframes are met for publication of Returns
Output 2.1.3 — Funding and disclosureservices
Quantity:
• 180 annual returns
• 1,000 donor returns
• 3,000 election returns
• Capable of conducting compliance investigations in accordance withrequirements (estimated to be 100)
Quality:
• 96% voter turnout
• 96% of votes are formal
• 80% awareness and understanding by the public of AEC electoralcampaigns
• Information provided is 100% accurate
Output 2.1.4 — Public awarenesscampaigns, media releases
Quantity:
• 75% of AEC stories get media coverage
• 100% voter coverage is achieved through advertising campaigns
Quality:
• 100% of information is accurate
• 90% of calls to the AEC Call Centre are answered
• All information, including the web site is up to date, user friendly andaccessible
Quantity:
• Capability to answer over 550,000 calls in the election period
• 900,000 page views/users/downloads on the AEC Webpage
Output 2.1.5 — Information services
Price:
• Average cost per ‘call centre’ call less than $2.40
Quality:
• 100% of legislative and other requirements met
• Less than 1% court challenged elections upheld through AEC proceduralfaults
• 98% satisfaction by stakeholders
Quantity:
• 100% capability to conduct all elections
Output 2.1.6 — Industrial electionsand ballots for organisations
Price:
• Full cost recovery for commercial elections
Output 2.1.7 — ATSIC elections Quality:
• 100% of legislative and other requirements met
• Between 5% and nil ATSIC electoral litigation cases in which costs areordered against the AEC
• 98% satisfaction by stakeholders
• 100% capability to conduct all ATSIC Regional, Zone and Office Holderelections
• 100% logistical capacity to conduct ATSIC casual vacancies as they occur
Part C: AEC - Outcome 2
87
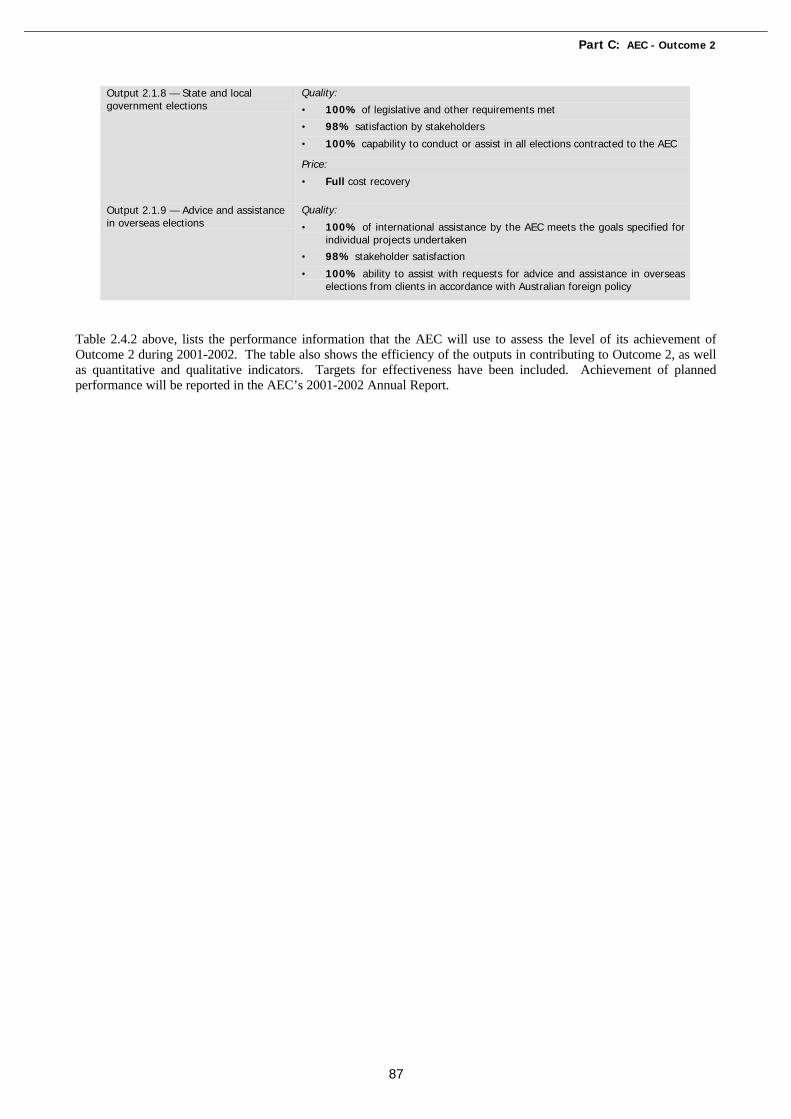
Quality:
• 100% of legislative and other requirements met
• 98% satisfaction by stakeholders
• 100% capability to conduct or assist in all elections contracted to the AEC
Output 2.1.8 — State and localgovernment elections
Price:
• Full cost recovery
Output 2.1.9 — Advice and assistancein overseas elections
Quality:
• 100% of international assistance by the AEC meets the goals specified forindividual projects undertaken
• 98% stakeholder satisfaction
• 100% ability to assist with requests for advice and assistance in overseaselections from clients in accordance with Australian foreign policy
Table 2.4.2 above, lists the performance information that the AEC will use to assess the level of its achievement ofOutcome 2 during 2001-2002. The table also shows the efficiency of the outputs in contributing to Outcome 2, as wellas quantitative and qualitative indicators. Targets for effectiveness have been included. Achievement of plannedperformance will be reported in the AEC’s 2001-2002 Annual Report.

Part C: AEC - Outcome 2
88
EVALUATIONS
In line with usual practice, the federal election expected before January 2002 will provide a focus for a series of internaland external evaluation activities. The Joint Standing Committee on Electoral Matters is expected to continue itspractice of conducting a major enquiry into all aspects of the conduct of this electoral event. In addition, the JSCEM iscurrently conducting other, separate, enquiries.
The AEC will also conduct a variety of evaluation activities to measure the effectiveness of its performance inconducting the election. These will include public surveys related to awareness of information and advertisingactivities, debriefings of operational staff and post election conferences.
The outcomes of this activity will also be summarised in the AEC’s 2001-2002 Annual Report.
COMPETITIVE TENDERING AND CONTRACTING
The AEC has improved the extent of its tendering and contract management processes in relation to business criticalsuppliers. The printing of forms and letters required for election activities is subject to competitive tendering and theCertified List printing contract will be determined this year.

Part C: AEC - Outcome 3
89
OUTCOME 3 — AN AUSTRALIAN COMMUNITY WHICH IS WELL INFORMED ABOUTELECTORAL MATTERS
To provide a comprehensive and effective electoral education service to the Australian community, the AEC has arange of services. These include Electoral Education Centres (EEC) in Canberra, Melbourne and Adelaide, a nationalSchools and Community Visits Program (SCVP), a professional development program for training and practicingteachers and the provision of electoral education resources to educational institutions and the community. It alsoprovides advice and input on electoral education to curriculum development projects in Federal, State and Territoryeducation sectors.
The extent to which the AEC expects to achieve this outcome is reflected in the planned targets for 2001-2002 as set outin Table 2.6.3
Outcome 3 — Output Structure
Outcome 3
An Australian community which is well informed aboutelectoral matters
Total Price of Outputs $5.3mDepartmental Outputs Appropriation $5.3mRevenue from Other Sources $0m
Output Group 3.1
Electoral education
Output 3.1.1
Electoral EducationCentres
Total Price $1.7mApprops $1.7m
Output 3.1.2
School and communityprogrammes
Total Price $3.6mApprops $3.6m
Note: Revenue from Government (Appropriations) contributes 99.1 per cent to the Total Price of Outputs for Outcome3 for 2001-02.

Part C: AEC - Outcome 3
90
OUTCOME 3 — RESOURCING
Table 2.5.3: Total Resources for Outcome 3 ($’000)Estimated
ActualBudget
Estimate2000-01($’000)
2001-02($’000)
Departmental appropriations
Output group 3.1Output 3.1.1 — Electoral Education CentresOutput 3.1.2 — School and community programmes
1,6523,422
1,6983,561
Subtotal output group 3.1 5,074 5,259Total revenue from government (appropriations)
Contributing to price of departmental outputs5,074 5,259
Revenue from other sources 965 50Total revenue from other sources 965 50
Total Price of departmental outputs(Total revenue from Government and from other sources)
6,039 5,309
Total estimated resourcing for outcome 3(Total price of outputs and admin expenses)
6,039 5,309
2000-01 2001-02Average Staffing Level (Number) 46 46

Part C: AEC - Outcome 3
91
OUTCOME 3 — CONTRIBUTION OF OUTPUTS
Justification for the outputs chosen to achieve Outcome 3 is described in table 2.6.3. The table provides information onthe strategies chosen to deliver Outcome 3, and shows the links between the outputs and the outcomes.
PERFORMANCE INFORMATION FOR OUTCOME 3
Table 2.6.3: Performance Information for Outcome 3
Effectiveness — Overall achievement of the Outcome — (Measures, indicators and targets used asappropriate)
• The level of understanding by the Australian community of electoral matters -75%
• The level of understanding of electoral events and processes by participants ineducation sessions - 75%
• Level of customer satisfaction – 95%
Performance Information for Departmental Outputs
Output Group 3.1 — Electoral Education
Quality:
• 95% of participants leave AEC EEC education sessions with an enhancedunderstanding of electoral events and processes
• 90% of electoral education programs meet needs of all participants
Quantity:
• 115,000 visitors
• 3,200 sessions
• 95% of requests are met
Output 3.1.1 — Electoral EducationCentres
Price:
• Less than $600 per session
Quality:
• 95% of participants leave SCVP sessions with an enhanced understanding ofelectoral events and processes
• Requests for electoral educational resources satisfied
• Requests for electoral education State/Territory curriculum support satisfied
• 98% level of customer satisfaction
Output 3.1.2 — School andcommunity programs
Quantity:
• 110,000 participants
• 25 teacher development sessions conducted
Table 2.6.3 above lists the performance information that the AEC will use to assess the level of its achievement ofOutcome 3 during 2001-2002. The table also shows the efficiency of the outputs in contributing to Outcome 3, as wellas quantitative and qualitative indicators. Targets for effectiveness have been included. Achievement of plannedperformance will be reported in the AEC’s 2001-2002 Annual Report.
EVALUATIONS
An evaluation and performance improvement review was undertaken in 2000-2001 and the report is currently beingconsidered. There are no further evaluations planned for the 2001-2002 financial year.

Part C: AEC - Outcome 3
92
COMPETITIVE TENDERING AND CONTRACTING
There are no major Competitive Tendering and Contracting activities planned for Outcome 3 during 2001-02.

Part C: AEC - Financial Statements
93
Section 3: Budget Financial Statements
The following budgeted financial statements for the AEC are presented in this section. The budgeted financialstatements will form the basis of the financial statements that will appear in the AEC’s 2001-02 annual report, and formthe basis for the input into the Whole of Government Accounts.
Budgeted Statement of Revenue and Expenses(Operating Statement)
This statement provides a picture of the expected financial results for the AEC by identifying full accrual expenses andrevenues, which highlights whether the AEC is operating at a sustainable level in the short run.
Budgeted Statement of Assets and Liabilities(Balance Sheet)
This statement shows the financial position of the AEC. It enables decision-makers to track the management of theAEC’s assets and liabilities.
Budgeted Cash Flow Statement
Budgeted cash flows, as reflected in the statement of cash flows, provides important information on the extent andnature of cash flows by categorising them into expected cash flows from operating activities, investing activities andfinancing activities.
Capital Budget
Shows all planned capital expenditure (capital expenditure on non-financial assets), whether funded either throughcapital appropriations for additional equity or borrowings, or from funds from internal sources.
Non-financial Assets — Summary of Movement
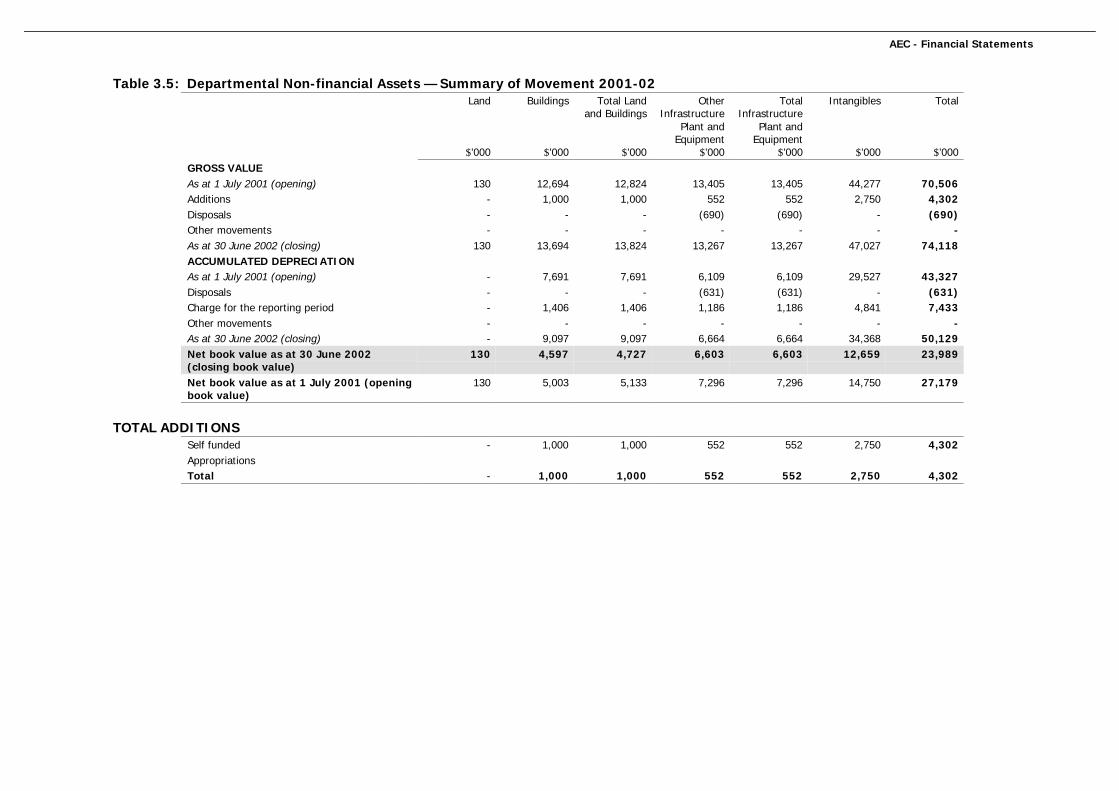
Shows budgeted acquisitions and disposals of non-financial assets during the budget year.

Part C: AEC - Financial Statements
94
Table 3.1: Budgeted Statement of Revenue and Expenses(for the period ended 30 June each year)
EstimatedActual
2000-01$’000
BudgetEstimate2001-02
$’000
ForwardEstimate2002-03
$’000
ForwardEstimate2003-04
$’000
ForwardEstimate2004-05
$’000
REVENUERevenue from government 91,097 144,073 94,069 96,287 145,217Revenue from other sources
Other sources of non-taxation revenue 920Sales of goods and services 9,135 5,030 4,874 4,874 4,874Interest 1,327 1,327 1,327 1,327 1,327
Total revenue 102,479 150,430 100,270 102,488 151,418
EXPENSESEmployees 51,722 80,489 57,369 56,698 83,877Suppliers and Other 48,823 61,893 32,031 34,867 58,086GrantsDepreciation and amortisation 6,986 7,433 7,946 7,946 8,500
Total expenses 107,531 149,815 97,346 99,511 150,463
Operating surplus (deficit) beforeextraordinary items
(5,052) 615 2,924 2,977 955
Extraordinary items - - - - -Operating surplus (deficit) afterextraordinary items
(5,052) 615 2,924 2,977 955
Aggregate of amounts transferred to/fromReserves
- - - - -
Capital user charge paid (2,829) (2,389) (2,442) (2,495) (2,342)Operating surplus (deficit) afterextraordinary items and CUC
(7,881) (1,774) 482 482 (1,387)
Cash transfers to Finance (2,500)Operating surplus (deficit) afterextraordinary items, CUC and transfers
(10,381) (1,774) 482 482 (1,387)

Part C: AEC - Financial Statements
95
Table 3.2: Budgeted Statement of Assets and Liabilities(as at 30 June each year)
EstimatedActual
2000-01$’000
BudgetEstimate2001-02
$’000
ForwardEstimate2002-03
$’000
ForwardEstimate2003-04
$’000
ForwardEstimate2004-05
$’000
ASSETSFinancial assets
Cash 15,369 15,384 17,698 21,264 23,647Receivables 2,071 2,077 2,091 2,090 2,090
Total financial assets 17,440 17,461 19,789 23,354 25,737
Non-financial assetsLand and buildings 5,133 4,727 4,221 3,665 3,059Infrastructure, plant and equipment 7,296 6,603 6,232 5,926 5,546Inventories 3,629 1,629 1,629 1,629 1,629Intangibles 14,750 12,659 10,224 7,789 5,005Other 1,614 1,624 1,644 1,664 1,664
Total non-financial assets 32,422 27,242 23,950 20,673 16,903
Total assets 49,862 44,703 43,739 44,027 42,640LIABILITIESDebt
Leases 1,261 1,071 882 693 693Total debt 1,261 1,071 882 693 693
Provisions and payablesEmployees 17,659 17,525 18,384 18,399 18,399Suppliers 2,045 2,030 2,010 1,990 1,990Other 5,406 2,360 264 264 264
Total provisions and payables 25,110 21,915 20,658 20,653 20,653Total liabilities 26,371 22,986 21,540 21,346 21,346
EQUITYCapital 4,230 4,230 4,230 4,230 4,230Reserves 17,317 17,317 17,317 17,317 17,317Accumulated surpluses (deficits) 1,944 170 652 1,134 (253)
Total equity 23,491 21,717 22,199 22,681 21,294
Total liabilities and equity
Current liabilities 13,127 9,842 7,752 7,547 7,547Non-current liabilities 13,244 13,144 13,788 13,799 13,799Current assets 22,683 20,714 23,162 26,647 29,030Non-current assets 27,179 23,989 20,577 17,380 13,610

Part C: AEC - Financial Statements
96
Table 3.3: Budgeted Statement of Cash Flows(for the period ended 30 June each year)
EstimatedActual
2000-01$’000
BudgetEstimate2001-02
$’000
ForwardEstimate2002-03
$’000
ForwardEstimate2003-04
$’000
ForwardEstimate2004-05
$’000
OPERATING ACTIVITIESCash received
Appropriations for outputs 91,101 141,027 91,973 96,287 145,217Sales of goods and services 9,033 5,024 4,860 4,875 4,874Interest 1,327 1,327 1,327 1,327 1,327GST Input Credit Receipts 2,540 3,952 1,668 1,968 4,068GST Receipts from Customers 1,063 948 932 932 932Other 920
Total cash received 105,984 152,278 100,760 105,389 156,418
Cash usedEmployees 51,597 80,623 57,354 56,713 83,877Suppliers 51,250 59,918 31,207 34,887 58,086GST Payments to Suppliers 3,603 4,900 2,600 2,900 5,000
Total cash used 106,450 145,441 91,161 94,500 146,963
Net cash from operating activities (466) 6,837 9,599 10,889 9,455
INVESTING ACTIVITESCash received
Proceeds from sales of property, plant andequipment
63 59 44 44 -
Other - - - -Total cash received 63 59 44 44 -
Cash usedPurchase of property, plant and equipment (5,938) (4,302) (4,678) (4,693) (4,730)Other - - - -
Total cash used (5,938) (4,302) (4,678) (4,693) (4,730)
Net cash from investing activities (5,875) (4,243) (4,634) (4,649) (4,730)
FINANCING ACTIVITIESCash Received
Proceeds from issuing equity instruments - - - - -Other 4 - - 10 -
Total cash received 4 - - 10 -
Cash usedRepayments of debt - (190) (189) (189) -Capital use and dividends paid (4,770) (2,389) (2,442) (2,495) (2,342)Payments to OPA (2,500)Other - - (20) - -
Total cash used (7,270) (2,579) (2,651) (2,684) (2,342)
Net cash from financing activities (7,266) (2,579) (2,651) (2,674) (2,342)
Net increase in cash heldCash at the beginning of the reporting period 28,976 15,369 15,384 17,698 21,264Cash at the end of the reporting period 15,369 15,384 17,698 21,264 23,647

Part C: AEC - Financial Statements
97
CAPITAL BUDGET
Table 3.4: Departmental Capital Budget Statement
CAPITAL BUDGET
EstimatedActual
2000-01$’000
BudgetEstimate2001-02
$’000
ForwardEstimate2002-03
$’000
ForwardEstimate2003-04
$’000
ForwardEstimate2004-05
$’000
CAPITAL APPROPRIATIONSAppropriation of Previous Years Carryover
Represented by:Purchase of non-current assetsPURCHASE OF NON-CURRENT ASSETSFunded by capital appropriationsFunded internally by departmental resources 5,018 4,302 4,678 4,693 4,730
Total 5,018 4,302 4,678 4,693 4,730
AEC - Financial Statements
Table 3.5: Departmental Non-financial Assets — Summary of Movement 2001-02Land
$’000
Buildings
$’000
Total Landand Buildings
$’000
OtherInfrastructure
Plant andEquipment
$’000
TotalInfrastructure
Plant andEquipment
$’000
Intangibles
$’000
Total
$’000GROSS VALUEAs at 1 July 2001 (opening) 130 12,694 12,824 13,405 13,405 44,277 70,506Additions - 1,000 1,000 552 552 2,750 4,302Disposals - - - (690) (690) - (690)Other movements - - - - - - -As at 30 June 2002 (closing) 130 13,694 13,824 13,267 13,267 47,027 74,118ACCUMULATED DEPRECIATIONAs at 1 July 2001 (opening) - 7,691 7,691 6,109 6,109 29,527 43,327Disposals - - - (631) (631) - (631)Charge for the reporting period - 1,406 1,406 1,186 1,186 4,841 7,433Other movements - - - - - - -As at 30 June 2002 (closing) - 9,097 9,097 6,664 6,664 34,368 50,129Net book value as at 30 June 2002(closing book value)
130 4,597 4,727 6,603 6,603 12,659 23,989
Net book value as at 1 July 2001 (openingbook value)
130 5,003 5,133 7,296 7,296 14,750 27,179
TOTAL ADDITIONSSelf funded - 1,000 1,000 552 552 2,750 4,302AppropriationsTotal - 1,000 1,000 552 552 2,750 4,302

Part C: AEC - Financial Statements
99
Table 3.6: Note of Budgeted Administered Financial Performance(for the period ended 30 June each year)
EstimatedActual
2000-01$’000
BudgetEstimate2001-02
$’000
ForwardEstimate2002-03
$’000
ForwardEstimate2003-04
$’000
ForwardEstimate2004-05
$’000
REVENUETaxation
Other – Penalties 184 577 184 54 577Total taxation 184 577 184 54 577
Non-taxationRevenues from government 224 39,924 - - 44,486Other sources of non-taxation revenues 3,735 3,874 4,334 4,464 3,941
Total non-taxation 3,959 43,798 4,334 4,464 48,427Total revenue administered on behalf of theGovernment 4,143 44,375 4,518 4,518 49,004
EXPENSESGrants 224 39,924 - - 44,486
Total expenses administered on behalf of theGovernment 224 39,924 - - 44,486
Extraordinary items - - - - -Net contribution (cost) to the budget outcome 3,919 4,451 4,518 4,518 4,518Transfers to the official public account
Account remitted from administered revenues (3,894) (4,391) (4,498) (4,498) (4,498)Net surplus (deficit) 25 60 20 20 20

Part C: AEC - Financial Statements
100
Table 3.7: Statement of Administered Assets and Liabilities(as at 30 June each year)
EstimatedActual
2000-01$’000
BudgetEstimate2001-02
$’000
ForwardEstimate2002-03
$’000
ForwardEstimate2003-04
$’000
ForwardEstimate2004-05
$’000
ASSETSFinancial assets
Cash - 40 40 60 80Receivables 876 896 916 916 916
Total financial assets 876 936 956 976 996Non-financial assets - - - - -
Total non-financial assets - - - - -Total assets administered on behalf of theGovernment
876 936 956 976 996
LIABILITIESDebt - - - - -Total Debt - - - - -Provisions and payables - - - - -
Total provisions and payables - - - - -Total liabilities - - - - -
EQUITYCapital - - - - -ReservesAccumulated surplus or deficits 876 936 956 976 996
Total equity 876 936 956 976 996
Total liabilities and equity
Current liabilities - - - - -Non-current liabilities - - - - -Current assets 876 936 956 976 996Non-current assets - - - - -
*Note: ‘Equity’ is the residual interest in assets after deductions of liabilities.

Part C: AEC - Financial Statements
101
Table 3.8: Note of Budgeted Administered Cash Flow(for the period ended 30 June each year)
EstimatedActual
2000-01$’000
BudgetEstimate2001-02
$’000
ForwardEstimate2002-03
$’000
ForwardEstimate2003-04
$’000
ForwardEstimate2004-05
$’000
OPERATING ACTIVITIESCash received
Appropriations for outputs 224 39,924 - - 44,486Other 3,966 4,431 4,498 4,518 4,518
Total cash received 4,190 44,355 4,498 4,518 49,004Cash used
Grants 224 39,924 - - 44,486Cash to Official Public Account 3,967 4,391 4,498 4,498 4,498
Total cash used 4,191 44,315 4,498 4,498 48,984
Net cash from operating activities (1) 40 - 20 20INVESTING ACTIVITIESCash received - - - - -Total cash received - - - - -Cash used - - - - -Total cash used - - - - -Net cash from investing activities - - - - -FINANCING ACTIVITIESCash received - - - - -Total cash received - - - - -Cash used - - - - -Total cash used - - - - -Net cash from financing activities - - - - -Net increase in cash held (1) 40 - 20 20
Cash at beginning of reporting period 1 - 40 40 60Cash at end of reporting period - 40 40 60 80
Part C: AEC - Financial Statements
102
NOTES TO THE FINANCIAL STATEMENTS
Departmental
Delays have been experienced with the implementation of the Electoral and Referendum Amendment Act (No.1) 1999.As indicated in Section 2 implementation will commence on making of Regulations. As a result, the AEC is carryingsome of these funds in cash balances with a corresponding liability to the Department of Finance and Administration.
Estimates of expenditure and revenue for 2001-02 include items associated with the conduct of the next federal election.
Departmental Financial Statements and Administered Items
Under the Commonwealth’s accrual budgeting framework, and consistent with Australian Accounting Standards,transactions that agencies control (departmental transactions) are separately budgeted for and reported on fromtransactions agencies do not have control over (Administered transactions). This ensures that agencies are only heldfully accountable for the transactions over which they have control.
• Departmental assets, liabilities, revenues and expenses in relation to an agency or authority are those which arecontrolled by the agency. Departmental expenses include employee and supplier expenses and other administrativecosts, which are incurred by the agency in providing its goods and services.
• Administered items are revenues, expenses, assets and liabilities which are managed by an agency or authority onbehalf of the Government. Administered expenses include subsidies, grants and personal benefit payments andAdministered revenues include taxes, fees, fines and excises.
Appropriations in the Accrual Budgeting Framework
Under the Commonwealth’s accrual budgeting framework, separate annual appropriations are provided for:
• Departmental price of outputs appropriations: representing the Government’s purchase of outputs from agencies.
Special appropriations continue under the accrual appropriation framework.
Capital-Use Charge
A Capital-Use Charge is levied on agencies and authorities to reflect the cost of the Commonwealth’s investment inthose entities. It is levied on agencies closing Departmental net assets (equity) at a rate of 11 per cent from 2001-02onwards, the rate was 12 per cent for 1999-00 and 2001-02. Funding for the Capital-Use Charge is included in agenciesand authorities Departmental price of outputs appropriations. The Capital-Use Charge is accounted for as a ‘belowOperating Result line’ dividend payment.
Asset valuation
Commonwealth agencies and authorities are required to value Property, Plant & Equipment and other Infrastructureassets using the deprival method of valuation. This essentially reflects the current cost the entity would face inreplacing that asset.
Performance against Outcomes and Outputs
Performance against Outcomes and Outputs can be found in Section 2 of this document.

Part C: AEC – Purchaser/Provider Arrangements
103
Section 4 – Purchaser/Provider Arrangements
The Aboriginal and Torres Strait Islander Commission Act 1989 tasks the AEC with the conduct of elections forATSIC. In recognition of this requirement Output 2.1.7 is identified as one of AEC’s outputs, refer Section 2 of thisdocument.

AEC - Appendix
104
Appendix 1
Non-Appropriation Departmental and Administered RevenueEstimated Revenue
2000-01$’000
Estimated Revenue2001-02
$’000
Departmental: Sale of Goods and Services 9,135 5,030 Other 2,247 1,327Administered: Electoral Fines 184 577 Sale of Goods and Services 3,690 3,874Total Estimated Revenue 15,256 10,808
Appendix 2
Estimates of Expenses from Special AppropriationsEstimated Expense
2000-01$’000
Estimated Expense2001-02
$’000Commonwealth Electoral Act 1918Electoral Roll Review 9,000 9,000Election Public Funding 224 39,924
Total Estimated Expenses 9,224 48,924

105
THIS PAGE IS INTENTIONALLY LEFT BLANK

106
THIS PAGE IS INTENTIONALLY LEFT BLANK