agency compensation task force operations management education
TRANSCRIPT

PROFITAgency Compensation Task Force Operations Management Education
Dana Perry – BBDODavid Weiss – InterpublicFebruary 1, 2012
It is a socialist idea that making profits is a vice. I consider the real vice is making losses.
– Winston Churchill “
“

What is an Ad worth?
2

3
4

What is an Ad worth?
5

One of The 10 best Super Bowl ads of the (young) century
6

The Profit Motive
7

8

WHY IS MAKING A PROFIT SO IMPORTANT?
9
An agency’s job is to increase sales and awareness of its clients generated by the ideas and programs the agency creates
Studies have shown that the most creative and innovative campaigns are the most effective in generating business results (Peter Field, “The Link Between Creativity and Effectiveness, Peter Gunn, McKinsey)
This takes talent that must be attracted to and retained by successful agencies. Top talent demands top payment and the opportunity to accumulate wealth
The best talent can only be attracted to and retained by a profitable growing enterprise
Agencies also need to be profitable to have access to capital so they can invest in people and technology

10
MORGAN STANLEY ON AGENCY PROFIT…
Companies that fail to deliver to its investors financial performance that merits their talent (employees) and capital (investors) risks losing the loyalty and attention of its clients and employees…
One common denominator you have in enticing and rewarding the talent and wisdom of these two investors is the proper maintenance of your financial performance…

11
AGENCIES ARE FRAGILE ENTERPRISES
The agency business is high risk– Often first to feel the impact of pending economic declines
– Often one of the last sectors to turnaround in an economic recovery
– If the Agency isn’t able to sell its time, it loses the opportunity cost
– In a relationship based business, major client contracts are mandatory for clients and discretionary for agencies:
Typically cancelable on 90 days notice in spite of investments made on behalf of the client in people, technology and real estate
No matter on what basis agency profits are examined, their profitability is substantially lower than its major advertiser clients

+
0%
5%
10%
15%
20%
25%
30%
Procter & Gamble
Verizon AT&T General Motors
Pfizer Johnson & Johnson
Walt Disney Time Warner L'Oreal Kraft Foods
Top 10 US Ad Spending Advertisers Profit Margin2010 Profit Margin
8.4%
11.6%
15.0%
11.0%
12.0%
0.0%
2.0%
4.0%
6.0%
8.0%
10.0%
12.0%
14.0%
16.0%
Interpublic Omnicom Publicis WPP Havas
Agency Holding Companies2010 Profit Margin
On average the
operating profit
margin level of the
top 10 US advertisers
isone third higher than for the holding
companies of the
agencies they engage
Average12.0%
Average16.5%
Agency vs Client Profitability

Agency Margins
“Agency margins may well be below where the agency community would like them, but the average agency margin reported by advertisers in this survey remained flat at 14% compared to three years ago. Although margins may have remained flat, the actual dollar profits at many agencies likely did decline over the past couple years as clients reduced spending and total agency fees.”– David Beals, Trends in Agency Compensation, 15th edition. P.16.
13

REPORTED AGENCY PROFITABILITY | NOTE DERIVED FROM ANA SOURCES, NOT AAAA’S
14
AGENCIES ARE IN A VERY DIFFERENT PROFIT PLACE THAN THEIR CLIENTSAgency Pre-Tax Profits: Reported Versus Client And Agency Expectation – Trend Data
Profit Margin Reported By Agency (Among Those Whose
Agencies Report Profit)
Profit Margin Considered Acceptable By Client (Among
All Respondents)
Agency Request For Acceptable Profit Margin (Among All Respondents)
2003 2006 2010 2003 2006 2010 2003 2006 2010
Base: Total Answering % % % % % % % % %
Under 5% 4 5 3 - 2 3 1 1 1
5% - 7.5% 4 3 5 6 4 6 - 1 1
7.6% - 10% 22 4 8 7 14 8 4 4 3
10.1% - 12.5% 6 9 16 22 8 26 5 3 6
12.6% - 15.0% 16 24 16 22 32 23 8 11 12
15.1% - 17.5% 18 14 14 13 15 7 8 10 12
17.6% - 20.0% 8 5 14 10 5 6 19 19 18
20.1% - 22.5% 2 5 - 3 3 1 13 11 6
22.6% - 25.0% - 2 3 2 - - 4 5 1
25.1% or more - - - - - - 3 - -
Don't know/not sure 20 30 22 15 16 21 36 36 40
Average Profit (%) 12% 14% 14% 14% 14% 12% 18% 16% 16%
Almost half of our major clients believe that an agency profit of 10 to 15% is acceptable and the proportion is growing
Over 40% of agency request a profit margin of between 12.6 and 20%
One third of agencies report agency margin of 10 to 15%
Just under one third report margins of over 17.6%

Mark Up Vs. Margin
15

16
SOME DEFINITIONS
Profit– Profit represents the difference between agency client revenues (from media
commissions, mark-ups, fees or other forms of client compensation) and agency operating Expenses.
Profit Margin– Profit margin expresses profit as a percentage of revenue.
Cost Mark-up– Agency profit is sometime looked at in relationship to agency operating
expenses (costs), i.e. a profit mark-up
PROFIT MARGIN & COST MARK-UP MUST NOT BE CONFUSED
CONFUSING A 20% MARKUP FOR A 20% MARGIN RESULTS IN A 16.67% MARGIN

17
EXAMPLES
$100Agency Client
Revenue/(Client Commissions,
Mark-ups, Fees, etc)
$80Agency Operating
Expense (Client Direct Labor plus Overhead)
$20Profit
Profit margin and cost markup are the two ways that agency profit is typically described
The example calculation of these uses the following values
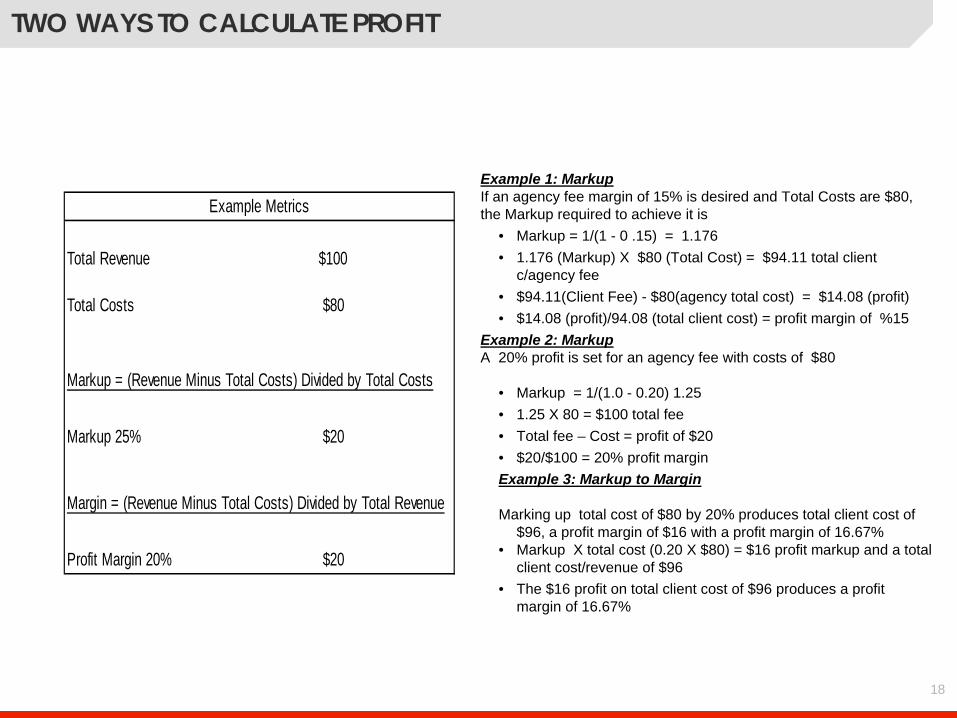
Example 1: MarkupIf an agency fee margin of 15% is desired and Total Costs are $80, the Markup required to achieve it is
• Markup = 1/(1 - 0 .15) = 1.176• 1.176 (Markup) X $80 (Total Cost) = $94.11 total client
c/agency fee• $94.11(Client Fee) - $80(agency total cost) = $14.08 (profit)• $14.08 (profit)/94.08 (total client cost) = profit margin of %15
Example 2: MarkupA 20% profit is set for an agency fee with costs of $80
• Markup = 1/(1.0 - 0.20) 1.25• 1.25 X 80 = $100 total fee• Total fee – Cost = profit of $20• $20/$100 = 20% profit marginExample 3: Markup to Margin
Marking up total cost of $80 by 20% produces total client cost of $96, a profit margin of $16 with a profit margin of 16.67%
• Markup X total cost (0.20 X $80) = $16 profit markup and a total client cost/revenue of $96
• The $16 profit on total client cost of $96 produces a profit margin of 16.67%
Total Revenue $100
Total Costs $80
Markup 25% $20
Margin = (Revenue Minus Total Costs) Divided by Total Revenue
Profit Margin 20% $20
Markup = (Revenue Minus Total Costs) Divided by Total Costs
Example Metrics
18
TWO WAYS TO CALCULATE PROFIT

19
Typical Client Financial Statements
Sales 1,000,000 % Sales
COGS (400,000)
Gross Profit 600,000 60.0%
Operating Expenses (480,000)
Operating Profit 120,000 12.0%
Interest & Non-op Expense (20,000)
Profit Before Tax 100,000 10.0%
Tax (35,000)
Net income 65,000 6.5%
Client

20
Typical Client P&L at an Agency
Revenue 150,000
Operating Expenses (120,000)
Operating Profit 30,000 20%

21
“Grossed Up” Agency Financial Statement
Billings 1,000,000 % Sales % Gross Profit
Media / Production / Billable OOP (850,000)
Gross Profit (Agency Revenue) 150,000 15.0%
Agency Operating Expenses (120,000) salary, rent, etc.
Operating Profit 30,000 3.0% 20%
Interest & Non-op Expense (5,000)
Profit Before Tax 25,000 2.5%
Tax (8,333)
Net income 16,667 1.7%

22
Comparing Financial Statements
Sales / Billings 1,000,000 % Sales 1,000,000 % Sales
COGS / Third Party OOP (400,000) (850,000)
Gross Profit 600,000 60.0% 150,000 15.0%
Operating Expenses (480,000) (120,000)
Operating Profit 120,000 12.0% 30,000 3.0%
Interest & Non-op Expense (20,000) (5,000)
Profit Before Tax 100,000 10.0% 25,000 2.5%
Tax (35,000) (8,750)
Net income 65,000 6.5% 16,250 1.6%
Client Agency

23
Comparing Financial Statements
Sales / Billings 1,000,000 % Sales 1,000,000 % Sales % GP
COGS / Third Party OOP (400,000) (850,000)
Gross Profit 600,000 60.0% 150,000 15.0%
Operating Expenses (480,000) (120,000)
Operating Profit 120,000 12.0% 20% 30,000 3.0% 20%
Interest & Non-op Expense (20,000) (5,000)
Profit Before Tax 100,000 10.0% 25,000 2.5%
Tax (35,000) (8,750)
Net income 65,000 6.5% 16,250 1.6%
Client Agency

24
INCENTIVE COMPENSATION IS NOT PROFIT
Some compensation consultants tell clients that an agency should realize a profit should realized by only with outstanding performance incentives
Incentive compensation is not a substitute for profit – it is a reward (or a penalty) for work that achieves or exceeds agreed to objectives.
Companies may choose to put some profit at risk when there is the opportunity to earn a sizable reward to offset the risk

25
OPERATING PROFIT VS. HOLDING COMPANY PROFIT
A holding company may provide its agencies varying degrees of centralized services– Some provide a high level of centralized service as they believe
it is less expensive
– Some believe it allows agency management to focus on clients and growth and not on day-to-day administrative matters/support
– Others leave most to operating company management
– There is no right or wrong method

26
OPERATING PROFIT VS. HOLDING COMPANY PROFIT
HOLDING COMPANY
PROFIT MARGIN
HOLDING COMPANY
COSTS
AGENCY PROFIT
MARGINS

27
For a variety of tax and other reasons, not all of the service cost can be charged back to the agencies
So the operating company/agency is getting service at no cost that inflates or misrepresents its true operating profit level
The agency profit target must be higher to reconcile the overstated operating profit level and so the holding company can achieve a competitive profit level
HOLDING COMPANY SERVICES
HOLDING COMPANY CENTRALIZED SERVICES CAN INCLUDE
PAYROLL PROCUREMENT
Employee Benefits Audit
Real Estate Tax
Legal/General Business Treasury
Legal/Ad Copy Clearance Insurance
Travel Marketing Intelligence
28
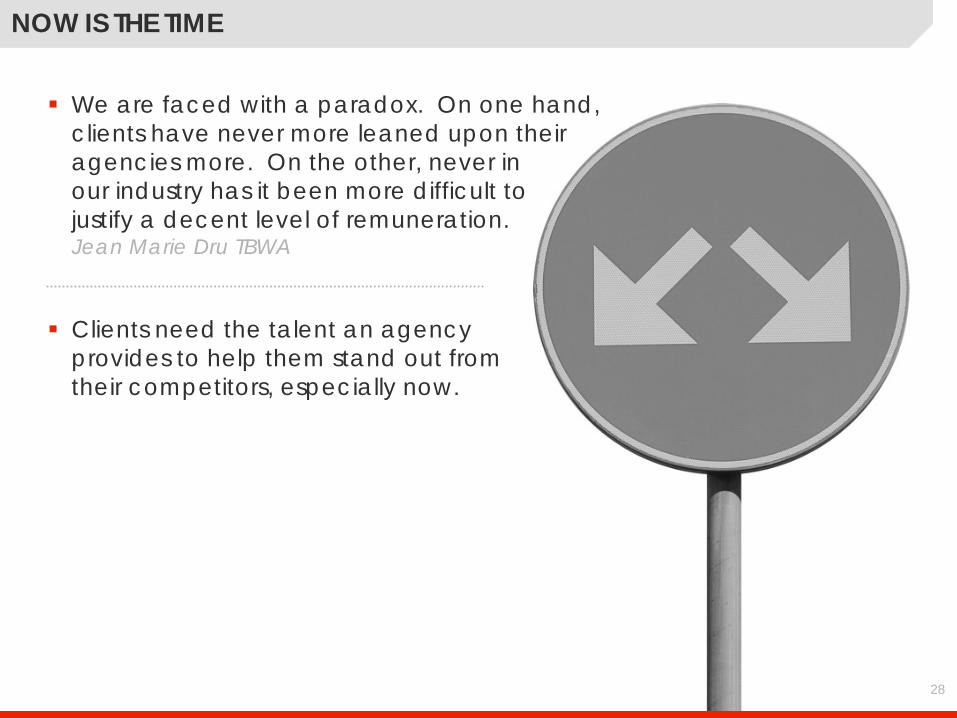
NOW IS THE TIME
We are faced with a paradox. On one hand, clients have never more leaned upon their agencies more. On the other, never in our industry has it been more difficult to justify a decent level of remuneration. Jean Marie Dru TBWA
Clients need the talent an agency provides to help them stand out from their competitors, especially now.

29
VIGOROUSLY DEFEND A FAIR AND REASONABLE PROFIT
Use the facts and points-of-view expressed here to help support your right to and requirement for a fair and reasonable profit