agency for healthcare research and quality quality ... · pdf fileagency for healthcare...
TRANSCRIPT
Agency for Healthcare Research and Quality Quality Indicators (AHRQ QI)
Prevention Quality Indicators (PQI) Composite Measure Workgroup
Final Report April 7, 2006

Table of Contents
1. Introduction............................................................................................................................................. 1 2. Workgroup Development ....................................................................................................................... 1 3. Overview of the Prevention Quality Indicators ................................................................................... 1 4. Workgroup Discussion .......................................................................................................................... 2 5. Analysis .................................................................................................................................................... 3 6. Results ...................................................................................................................................................... 4
6.1 Data ..................................................................................................................................................... 4 6.2 Descriptive Statistics........................................................................................................................... 5 6.3 Validation and Evaluation................................................................................................................... 7 6.4 Summary ............................................................................................................................................. 8
Appendix A. PQI Composite Measure Workgroup Members...........................................................A-1 Appendix B. AHRQ QI PQI Composite Tables .................................................................................. B-1 Appendix C. AHRQ QI PQI Composite Figures ................................................................................C-1 Appendix D. Response to Reviewer Comments on the Draft Report................................................D-1

PQI Composite Workgroup Report Final April 7, 2006
1
AHRQ Quality Indicators (AHRQ QI) PQI Composite Measure Workgroup
Final Report April 7, 2006
1. Introduction This report summarizes the work of the PQI Composite Measure Workgroup, which was convened to assist AHRQ in developing a composite measure based on the Prevention Quality Indicators for use in the National Healthcare Quality Report and National Healthcare Disparities Report1. The intended use of the PQI composite is to provide national estimates that can be tracked over time, and to provide state estimates than can be compared with the national estimate and to each other. 2. Workgroup Development To provide feedback to AHRQ on the development of the composite, the Agency sought nominations for participants in the PQI Composite Measure Workgroup through an announcement on the AHRQ Quality Indicator (AHRQ QI) listserv and on the AHRQ QI website (http://qualityindicators.ahrq.gov). Members were selected to represent individuals from a variety of fields and perspectives (epidemiology, health services research, medicine, performance measurement, etc.). AHRQ received many nominations of well-qualified individuals. Selection was made based upon the most properly qualified individuals within the following areas: · Peer-reviewed publications relevant to the development of composite measures · Knowledge of recent composite methodologies published in the literature · Experience with development of measures based on administrative data and its uses · Expertise in statistical methods relevant to the development of composite measures · Representative of material user perspectives. The PQI Composite Measure Workgroup was comprised of seven individual members and four organizational members, representing a wealth of experience and organizations dedicated to health care quality (See Appendix A for a list of Workgroup members). The goal of the PQI Composite Measure Workgroup was to utilize a structured approach for developing a composite measure at the national and state level. The Workgroup evaluated appropriate technical and feasible methodological approaches currently available to create a beneficial measure. The general process for the Workgroup was 1) to review background material on the PQI and to provide initial comments on the potential structure and methods for constructing a composite; 2) to participate in a conference call with a facilitated discussion of the material and summary of the initial comments; and 3) to review and comment on revised material based on the initial discussion and comments. Those revised materials constitute the content of this report. 3. Overview of the Prevention Quality Indicators The Prevention Quality Indicators (PQIs) are one of four current AHRQ Quality Indicator (AHRQ QI) modules2. The PQIs are measures of potentially avoidable hospitalizations for Ambulatory Care-Sensitive Conditions (ACSCs). They rely on hospital discharge data, but are not intended as measures of 1 The 2005 NHQR and NHDR are available at http://qualitytools.ahrq.gov. 2 The others are the Inpatient Quality Indicators (IQI), the Patient Safety Indicators (PSI) and the new Pediatric Quality Indicators (PedQI).

PQI Composite Workgroup Report Final April 7, 2006
2
hospital quality. Rather, they reflect issues of access to high quality ambulatory care in a system of care, defining the system of care in the case of the National Healthcare Quality Report to be the United States or the individual states. The PQI have been adopted by states, health plans and payers for quality improvement purposes. These measures have little direct relevance to individual hospitals that are not part of a health plan or health care system. The issues of attribution for performance on the PQI can be complex. That is part of the rationale in focusing initially on their use in the NHQR/NHDR. The PQIs as currently implemented are defined at the county level based on the location of the patient’s residence, not on the location of the hospital. In other words, the PQI are hospitalization rates for residents of the county, regardless of whether the hospital is located in-side or out-side the county (or state). 4. Workgroup Discussion In the initial conference call, Workgroup participants were ask to comment on a set of general questions related to the potential content and structure of a PQI composite measure in order to help frame and organize the discussion. What is the audience for the PQI Composite? The answer was provided by the AHRQ staff that convened the Workgroup: the intended audience is users of the National Healthcare Quality Report and National Healthcare Disparities Report (NHQR and NHDR). What is the intended use of the PQI Composite? Similarly, AHRQ staff indicated that the intended use was to provide national estimates that can be tracked over time, and to provide state estimates than can be compared with the national estimate and to each other. What criteria might guide our development of the PQI Composite? Given the audience and intended use, there was general agreement that the composite measure needed to be easy to understand by a lay person, to be substantively coherent (have face validity from a clinical perspective) and to be empirically coherent (e.g., the composite components should be related to each other empirically). Might there be a single composite or separate composites based on the type of condition? The Workgroup offered several suggestions for how the composite might be structured. Some commented that a single composite would be the most straightforward approach. Others thought that the clinical concept and data might support separate composites for acute and chronic conditions. There were further suggestions to develop composites for specific conditions, specifically diabetes, or by important drivers of quality, like common quality improvement practices. 1. A single composite – the concept of “avoidable hospitalization” - The Workgroup felt that an overall composite captures the concept of avoidable hospitalization that connects the individual PQI. There was some concern about how “actionable” a single composite might be given than the individual components might “cancel” each other out. Another concern was that the composite might be dominated by the most

PQI Composite Workgroup Report Final April 7, 2006
3
prevalent conditions. However, overall there was agreement that a single composite was an acceptable initial construct. There was agreement that Low Birth Weight and Perforated Appendix would not be included in the composite because they have a different structure (with a discharge based denominator) and because LBW can be measured using vital statistics. 2. Separate composites - Acute versus Chronic – There was also agreement that separate composites for acute and chronic conditions was worth investigating as there might be different factors influencing hospitalization rates for each type of condition. 3. Separate composites - Cardiovascular and Diabetes Risk Management – There was a suggestion to combine measures of diabetes and cardiovascular conditions into a single composite because of common clinical practice patterns related to risk management. The concept of condition-specific or practice-specific measures will be explored secondary to an overall, acute and chronic composite measure. 5. Analysis After discussion of the composite contents, the discussion turned to the types of analysis that would help inform whether the composite was conceptual and empirically sound. How should the composite components be combined? The Workgroup agreed that since the PQI have a common denominator across individual composite components, that the best way to combine components would be to sum the component numerators (i.e. hospitalizations). That would be most straight-forward and easy to explain to users of the composite. An alternative that the Workgroup discussed was constructing a ratio of observed/expected events and then combining the ratios (i.e. as averages or weighted averages). This construct would emphasize those areas or populations with more events than we would expect based on their demographic or area characteristics (e.g., age and gender distribution, disease prevalence, insurance status, or socio-economic status). However, the Workgroup felt that initially it would be better to look at the relationships with these characteristics directly as potential mechanisms or drivers for quality improvement rather than imbedding them into the computation of an expected rate. The Workgroup also briefly discussed more empirical methods of constructing composites (e.g., latent variable models) but these methods were considered too complicated for the intended use. How should the composite components be weighted? The Workgroup felt that the components should be weighted based on the prevalence of the condition (i.e. the number of hospitalizations for each component). However, because prevalence does not necessarily equate to importance, the Workgroup expressed an interest in comparing composites weighted by hospital days and hospital costs (as determined from charges). Conditions that resulted in higher days or costs would then be weighted more heavily in the composite. One concern raised is that weighting of area hospitalization rates based on costs or days introduces a potential confounding influence of hospital quality based on where the patient is admitted to the extent that hospital attributes drive the length of stay or costs.

PQI Composite Workgroup Report Final April 7, 2006
4
How should the composite be evaluated? The Workgroup discussed the following analysis plan to help inform the composite measure development process. The work was done by the Support for Quality Indicators (SQI) team at AHRQ. 1. The analytic team will define a single composite measure that encompasses the PQI indictors and that excludes the Low Birth Weight and Perforated Appendix indicators. The team will also construct separate composite measures for acute and chronic conditions. 2. The baseline composite will be constructed by summing the numerator events (i.e., the hospitalizations) and dividing by the area population. The team will explore alternative sums using hospital days and estimated costs (using an AHRQ methodology to compute costs from charges). 3. The team will compute national rates, state rates, and local area rates for the baseline composite and alternatives and report descriptive statistics (i.e., means, standard deviation, correlation across measures and over time, forecasts) overall and for major subpopulations by age, gender and race/ethnicity. 4. To help validate the measures, the team will look at the relationship between the composite and other area measures that might be related to access to care, such as the number of hospital beds per population and primary care physician density using data from the Area Resource File. 5. Using data available on disease prevalence for selected areas, the team will analyze to what extent variability is driven by disease prevalence for asthma, diabetes and cardiovascular disease. 5. To help determine the confounding influence of socioeconomic status, the team will analyze to what extent variability is driven by poverty status. 6. Results
6.1 Data The data used in the analysis are the 2003 State Inpatient Data (SID) from the Healthcare Cost and Utilization Project (HCUP)3. The 2003 SID includes all-payer discharge data from 38 participating states for approximately 29 million discharges for persons residing in 2,500 counties in the U.S. Denominator
3 The state data organizations that participated in the 2003 HCUP SID: Arizona Department of Health Services; California Office of Statewide Health Planning & Development; Colorado Health & Hospital Association; Connecticut - Chime, Inc.; Florida Agency for Health Care Administration; Georgia: An Association of Hospitals & Health Systems; Hawaii Health Information Corporation; Illinois Health Care Cost Containment Council; Indiana Hospital & Health Association; Iowa Hospital Association; Kansas Hospital Association; Kentucky Department for Public Health; Maine Health Data Organization; Maryland Health Services Cost Review; Massachusetts Division of Health Care Finance and Policy; Michigan Health & Hospital Association; Minnesota Hospital Association; Missouri Hospital Industry Data Institute; Nebraska Hospital Association; Nevada Department of Human Resources; New Hampshire Department of Health & Human Services; New Jersey Department of Health & Senior Services; New York State Department of Health; North Carolina Department of Health and Human Services; Ohio Hospital Association; Oregon Association of Hospitals & Health Systems; Pennsylvania Health Care Cost Containment Council; Rhode Island Department of Health; South Carolina State Budget & Control Board; South Dakota Association of Healthcare Organizations; Tennessee Hospital Association; Texas Health Care Information Council; Utah Department of Health; Vermont Association of Hospitals and Health Systems; Virginia Health Information; Washington State Department of Health; West Virginia Health Care Authority; Wisconsin Department of Health & Family Services. http://hcup-us.ahrq.gov.

PQI Composite Workgroup Report Final April 7, 2006
5
data come from the U.S. Census Bureau, total resident population estimates (excluding armed forces overseas) for states and counties for calendar year 20034. Additional data used in the analysis come from other sources and were matched to the discharge and census data using the FIPS state and county code or Metro Area code based on the location of the patient residence. The Area Resource File5 provided area level estimates of the number of primary care physicians, hospital beds, SNF beds and home health agencies. The Selected Metropolitan/Micropolitan Area Risk Trends (SMART) project from the Centers for Disease Control and Prevention provided estimates of the prevalence of adult asthma, diabetes and hypertension from the Behavioral Risk Factor Surveillance System (BRFSS)6. Finally, the Small Area Income & Poverty Estimates program at the U.S. Census Bureau provided county level percentages of the number of persons living below the U.S. poverty threshold7.
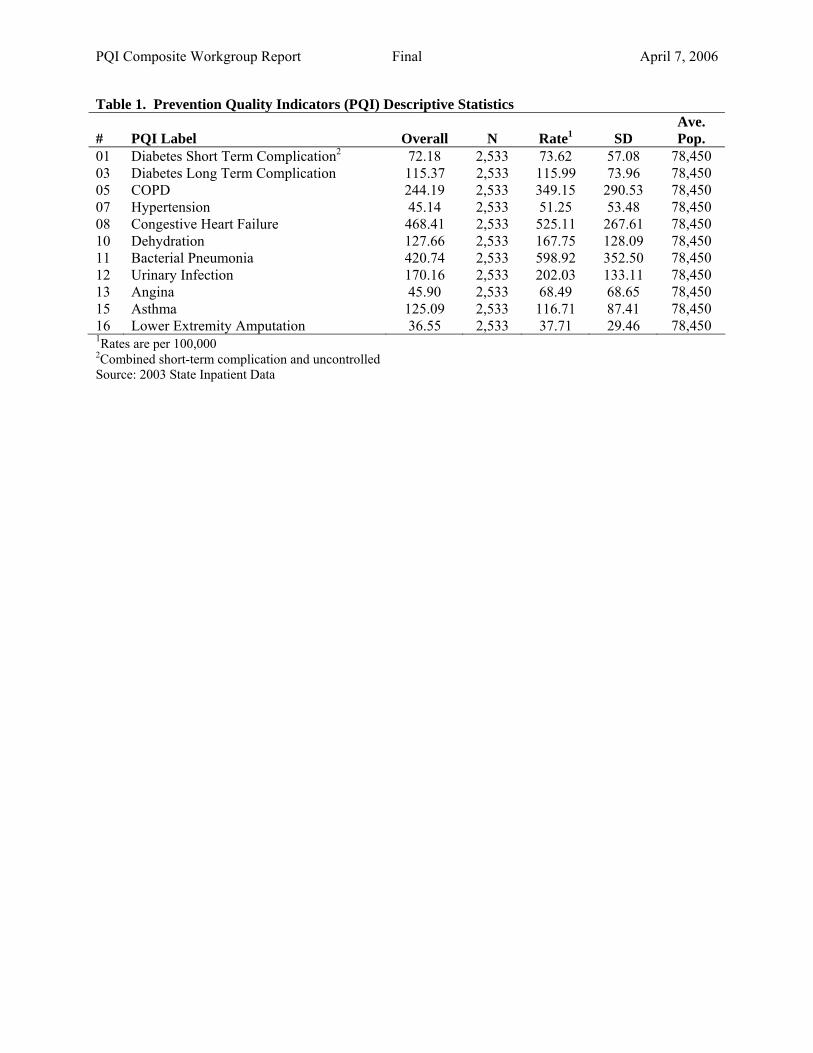
6.2 Descriptive Statistics The purpose of the descriptive statistics is to provide empirical support for the construction of a PQI composite. As stated above, one of the evaluation criteria for a composite is that the composite components be related conceptually as well as empirically. Note that these results use the number of hospitalizations as the “weight” for combining the component indicators. Separate analyses were conducted using hospital days and costs but these analyses are not reported here as the results were substantively similar. The one exception was that lower extremity amputation tended to contribute more to the composite measure based on days and costs due to longer than typical lengths-of-stay (in excess of 10 days per stay). But the differences were marginal and not material. Table 1 (see Appendix B) provides descriptive statistics for the eleven (11) Prevention Quality Indicators included in this analysis. Two pediatric indicators (asthma and gastroenteritis) are now included in the new Pediatric Quality Indicator module (PedQI). Two diabetes indicators (short-term complications and uncontrolled diabetes) were combined into a single indicator. Only adults (age 18 and over) are included in this analysis. The rates are reported as hospitalizations per 100,000 persons for the entire dataset and by county (N=2,533). The rates vary considerably by condition from a high of 468 hospitalizations per 100,000 for Congestive Heart Failure to a low of 45 hospitalizations per 100,000 for hypertension and angina. All of the rates show considerable variability across counties. The average county size was 78,000 persons. Table 2 and Table 3 provide correlation and factor loading statistics for the PQI based on the county level rates (adjusted for age and gender). The correlation statistics in Table 2 confirm that the individual PQI are positively correlated in that counties with higher rates of COPD, for example, tend also to have higher rates of each of the other PQI. Conversely, counties with lower rates of COPD tend to have lower rates of
4 Population Estimates Program, Population Division, U.S. Bureau of the Census. Release Date: August 11, 2005). http://www.census.gov/popest/datasets.html. 5 National Center for Health Workforce Analysis, Bureau of Health Professions, Health Resources and Services Administration, Department of Health and Human Services. http://www.arfsys.com. 6 National Center for Chronic Disease Prevention and Health Promotion, Behavioral Risk Factor Surveillance System, CDC. http://apps.nccd.cdc.gov/brfss-smart/index.asp. 7 Small Area Income & Poverty Estimates, U.S. Census Bureau. http://www.census.gov/hhes/www/saipe/saipe.html.

PQI Composite Workgroup Report Final April 7, 2006
6
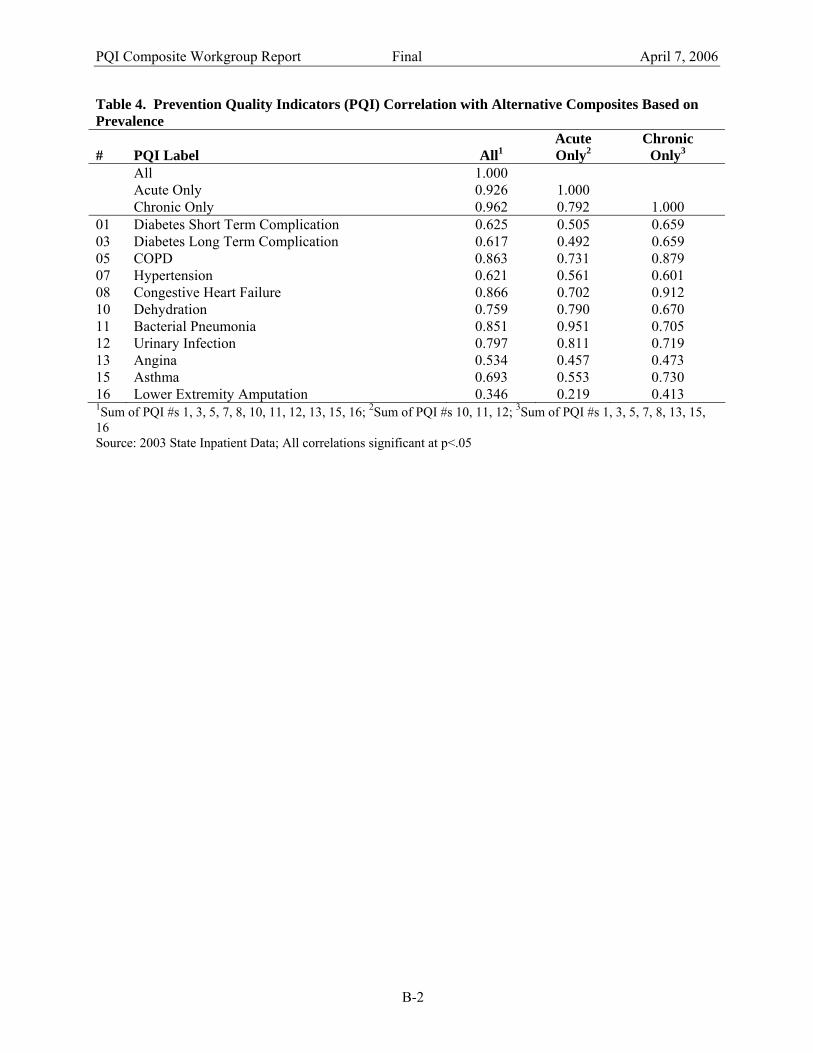
each of the other PQI. The strength of the association varies with most of the correlations between 0.40 and 0.60. The positive correlations and resulting factor loading statistics in Table 3 also tend to support a single composite in that all the individual components have positive factor loadings on the first factor and that factor explains 94 percent of the common variation. Factor analyses ask the question: how much of the county level variation in the individual components can be explained by a single construct or “factor” and are there independent constructs that can explain the remaining variation? These constructs can often be thought of as dimensions of high quality ambulatory care or other factors driving the county level rates. The results here also suggest that a separate diabetes-related composite might be warranted given the high factor loadings for the three diabetes measures on the second factor. Table 4 shows the correlation at the county level for three alterative composite measures and the individual components. An “overall” composite includes all eleven PQI. An “acute-only” composite includes only acute conditions (dehydration, bacterial pneumonia and urinary infection). A “chronic-only” composite includes only chronic conditions (diabetes, COPD, hypertension, CHF, angina and asthma). The three composites are highly correlated with each other, with the correlation between the overall and acute-only composite being 0.930 and the correlation between the overall and chronic-only composite being 0.962. The correlation between the acute-only and chronic-only is slightly lower at 0.792 suggesting that separate composites based on the type of condition may provide additional information. The correlations with the individual components support this view, with the correlations for the chronic conditions being higher for the chronic-only composite than for the acute-only composite, and conversely the correlations for the acute conditions being higher for the acute-only composite than for the chronic-only composite. Table 6 takes a slightly different perspective on the same question, and examines how well the three composites in 2002 predict the composites and individual components in 2003. The results show that the composites have higher prediction accuracy (higher year-to-year correlations) when predicting the composites than when predicting the individual components. In addition, the prediction accuracy between the composites and the individual components are much higher than the with-in year correlations between the individual components themselves (as seen in Table 2). These finding suggest that the composites are reflecting something “larger” than the individual components, and that some of the year-to-year and across area variability in the individual components is smoothed out in the composites. The composites may in fact be more useful for discriminating across areas and for identifying the determinants of variability across areas than the individual components. Finally, Table 5 examines some of the differences in the composites across demographic groups. The overall rate for the composite is 1,724 hospitalizations per 100,000 persons, with about 40% of those hospitalizations for acute conditions and 60% for chronic conditions. Composite rates are higher in females than in males, especially for acute conditions. This is largely due to the higher average age among females, and the composite rates vary substantially by age, with rates for the elderly substantially higher. This strongly suggests that the composites should be adjusted and perhaps reported separately by age. In generally, the rates for blacks are higher than for non-blacks, especially for chronic conditions. The results by race/ethnicity should be interpreted with caution given the variability in reporting of racial categories across the participating states. In the preparation of the NHQR and NHDR, AHRQ has developed better datasets for reporting disparities by race and ethnicity that those used in this analysis. However, the results do indicate that reporting composite rates by race/ethnicity is likely to reveal substantial differences.

PQI Composite Workgroup Report Final April 7, 2006
7
Similarly, there will likely be substantial difference when reporting composite rates regionally. Even at the state level there is considerable variability in the composite rates, especially among the chronic conditions. This could be due to the relative importance of capacity, disease prevalence and socioeconomic status, which the next section will examine in greater detail.
6.3 Validation and Evaluation As mentioned in the overview, the Prevention Quality Indicators are intended to reflect access to high quality ambulatory care. As such, the PQI are indicators of both access to care and quality of care. However, there are other factors in addition to access and to quality that may also influence hospitalization rates for these ambulatory care sensitive conditions, most notably the prevalence of the underlying chronic illnesses and the socioeconomic status of patients, which has been shown in the research literature to be related to hospitalization rates independently of access to care. The figures in this report are intended only has suggestions for the types of analyses that the reporting of the composite will help to stimulate and the types of considerations those using the composite should bear in mind when interpreting the results. This report examines composite rates (overall, acute and chronic) based on area level measures of health care capacity, disease prevalence and socioeconomic status. In each of the figures (Appendix C) a county or metro area is assigned to equal-sized groups based on the value of some measure. The figures then report the composite rate (along the y-axis) for each group (along the x-axis) with the lowest values for the measure on the left and the higher values for the measure on the right. In Figures 1-3 and Figure 7 the 2,500 counties are assigned to ten (10) equal groups based on data from the Area Resource File and the U.S. Census. In Figures 4-6 rates are reported for one of 134 metropolitan areas assigned to five (5) equal groups based on disease prevalence data from CDC. In Figure 1, counties are assigned to ten (10) groups or deciles based on the number of primary care physicians per person residing in the county. A primary care physician is defined as either general or family practice or internal medicine. Areas with lower rates of primary care physicians per person have lower hospitalization rates based on the composite than areas with higher rates until the middle deciles, and then the trend reverses itself, both for the overall composite and the condition-specific composites. The relationship in the lower deciles is contrary to the notion that greater access to primary care would result in lower hospitalization rates. Perhaps areas with higher rates of primary care physicians per person also have higher rates of specialty physicians per person, or that a certain minimum concentration of primary care physicians is necessary to realize benefits. In Figure 2, counties are assigned to deciles based on the number of hospital beds per person. The results show that areas with higher rates of hospital beds per person have higher hospitalization rates based on the composite, both for the overall composite and the condition-specific composites (although perhaps slightly more so for the chronic conditions). This relationship is consistent with the notion that the “supply” of health care (in the form of hospital beds) might sometimes drive the “demand” for health care (in the form of hospital utilization). It may be that chronic conditions may be more “supply-sensitive” than acute conditions. To explore this issue further, Figure 3 examines whether the availability of alternatives to acute hospital care might lead to lower hospitalization rates. In this figure counties are assigned to deciles based on the value of a simple index for non-acute care as measured by the availability of SNF beds and home health care agencies. There does not appear to be a consistent relationship between the availability of non-acute

PQI Composite Workgroup Report Final April 7, 2006
8
alternatives and hospitalization rates as measured by the composite, except perhaps among the acute conditions where hospitalization rates might be very slightly higher on average. Figures 4-6 looks that whether metro areas with higher rates of disease prevalence (as determined by respondent answers to the question “have you ever been told by a doctor that you have (asthma, diabetes, hypertension)?” The initial impression would be that areas with higher rates of disease prevalence would also have higher rates of hospitalizations for complications from those diseases. Figure 4 looks at hospitalization rates for the composite measures based on the prevalence of adult asthma, and the opposite relationship appears to hold, in that areas with higher rates of asthma prevalence have lower rates of asthma hospitalizations. The anticipated relationship holds for both diabetes (Figure 5) and hypertension (Figure 6), in which areas with higher rates of disease prevalence have higher hospitalization rates, especially among the chronic-only composite measures. These results highlight the importance of considering the prevalence of the underlying chronic disease when comparing composite rates across areas or demographic groups at least for diabetes and hypertension. The contrary relationship with asthma suggests that some other confounding factor is at work. Finally, Figure 7 shows that the hospitalization rates are strongly associated with area socioeconomic status, in this case measured by the percent of persons living below the U.S. poverty threshold. Areas with lower rates of poverty have much lower hospitalization rates than areas with higher rates of poverty, both for the overall composite and for the condition-specific composites. As mentioned before, socioeconomic status has been shown to have an effect on hospitalization rates independent of access to care. These finding suggest that in addition to reflecting issues with access to care and quality of care, the PQI composites also reflect issues of capacity, disease prevalence and socioeconomic status that must be considered when examining the composite rates.
6.4 Summary The purpose of this report is to summarize the work done by the PQI Composite Workgroup to develop an approach to constructing a composite measure based on the Prevention Quality Indicators for the National Healthcare Quality Report and the National Healthcare Disparities report, and to provide conceptual and empirical support for the construction of a single composite and separate composites for acute and chronic conditions. Based on the Workgroup discussion and analysis, the intent is to develop an overall composite using eleven (11) of the individual PQI and separate composites for the acute and chronic conditions. The composite will be constructed by summing the hospitalizations across the component conditions and dividing by the population. Rates will be adjusted for age and gender when comparing across regions or demographic groups. In addition, the report suggests some of the considerations that should be taken into account when using the composite rates for comparisons across areas or demographic groups. The composite measures will provide an additional tool for users of the NHQR and NHDR to further explore the important determinants of access to high quality health care in the U.S.

PQI Composite Workgroup Report Final April 7, 2006
A-1
A. Appendix A. PQI Composite Measure Workgroup Members

PQI Composite Workgroup Report Final April 7, 2006
A-2
AHRQ would like to thank the members of the workgroup for their participation and assistance. Individual members John Adams, RAND Gail Amundson, HealthPartners David Ballard, Baylor Health Care System Christina Bethell, Oregon Health Sciences University Cheryl Damberg, Pacific Business Group on Health Mary Beth Landrum, Harvard Medical School Patrick Roohan, New York State Department of Health Organizational members Russell Mardon, NCQA Ernie Moy, AHRQ National Healthcare Quality Report Stephen Schmaltz, JCAHO Cathy Schoen, Commonwealth Fund Support for Quality Indicator members Mamatha Pancholi, AHRQ Project Officer Marybeth Farquhar, Senior Advisor Quality Indicators Initiative Jeffrey Geppert, Battelle Memorial Institute Laura Puzniak, Battelle Memorial Institute

PQI Composite Workgroup Report Final April 7, 2006
B-1
B. Appendix B. AHRQ QI PQI Composite Tables
PQI Composite Workgroup Report Final April 7, 2006
Table 1. Prevention Quality Indicators (PQI) Descriptive Statistics
# PQI Label Overall N Rate1 SD Ave. Pop.
01 Diabetes Short Term Complication2 72.18 2,533 73.62 57.08 78,450 03 Diabetes Long Term Complication 115.37 2,533 115.99 73.96 78,450 05 COPD 244.19 2,533 349.15 290.53 78,450 07 Hypertension 45.14 2,533 51.25 53.48 78,450 08 Congestive Heart Failure 468.41 2,533 525.11 267.61 78,450 10 Dehydration 127.66 2,533 167.75 128.09 78,450 11 Bacterial Pneumonia 420.74 2,533 598.92 352.50 78,450 12 Urinary Infection 170.16 2,533 202.03 133.11 78,450 13 Angina 45.90 2,533 68.49 68.65 78,450 15 Asthma 125.09 2,533 116.71 87.41 78,450 16 Lower Extremity Amputation 36.55 2,533 37.71 29.46 78,450 1Rates are per 100,000 2Combined short-term complication and uncontrolled Source: 2003 State Inpatient Data

PQI Composite Workgroup Report Final April 7, 2006
Table 2. Prevention Quality Indicators (PQI) Correlation Statistics # PQI Label 01 03 05 07 08 10 11 12 13 15 16 01 Diabetes Short Term Complication 1.000 0.504 0.489 0.418 0.553 0.446 0.414 0.504 0.277 0.473 0.320 03 Diabetes Long Term Complication 1.000 0.410 0.380 0.565 0.437 0.386 0.497 0.228 0.483 0.598 05 COPD 1.000 0.478 0.683 0.571 0.633 0.641 0.445 0.543 0.169 07 Hypertension 1.000 0.506 0.524 0.469 0.544 0.383 0.490 0.194 08 Congestive Heart Failure 1.000 0.589 0.571 0.633 0.366 0.621 0.387 10 Dehydration 1.000 0.609 0.567 0.366 0.481 0.221 11 Bacterial Pneumonia 1.000 0.633 0.420 0.440 0.124 12 Urinary Infection 1.000 0.344 0.517 0.263 13 Angina 1.000 0.331 0.101 15 Asthma 1.000 0.282 16 Lower Extremity Amputation 1.000 Source: 2003 State Inpatient Data

PQI Composite Workgroup Report Final April 7, 2006
B-1
Table 3. Prevention Quality Indicators (PQI) Factor Loading1 Statistics # PQI Label Factor 1 Factor 2 Uniqueness 05 COPD 0.788 0.198 0.577 11 Bacterial Pneumonia 0.779 0.165 0.355 12 Urinary Infection 0.730 0.301 0.340 10 Dehydration 0.699 0.241 0.579 08 Congestive Heart Failure 0.695 0.473 0.294 07 Hypertension 0.612 0.217 0.453 15 Asthma 0.591 0.363 0.365 13 Angina 0.528 0.088 0.377 01 Diabetes Short Term Complication 0.483 0.436 0.713 03 Diabetes Long Term Complication 0.348 0.724 0.519 16 Lower Extremity Amputation 0.069 0.696 0.510 Proportion 0.936 0.134 1Principal components with varimax rotation Source: 2003 State Inpatient Data
PQI Composite Workgroup Report Final April 7, 2006
B-2
Table 4. Prevention Quality Indicators (PQI) Correlation with Alternative Composites Based on Prevalence
# PQI Label All1 Acute Only2
Chronic Only3
All 1.000 Acute Only 0.926 1.000 Chronic Only 0.962 0.792 1.000 01 Diabetes Short Term Complication 0.625 0.505 0.659 03 Diabetes Long Term Complication 0.617 0.492 0.659 05 COPD 0.863 0.731 0.879 07 Hypertension 0.621 0.561 0.601 08 Congestive Heart Failure 0.866 0.702 0.912 10 Dehydration 0.759 0.790 0.670 11 Bacterial Pneumonia 0.851 0.951 0.705 12 Urinary Infection 0.797 0.811 0.719 13 Angina 0.534 0.457 0.473 15 Asthma 0.693 0.553 0.730 16 Lower Extremity Amputation 0.346 0.219 0.413 1Sum of PQI #s 1, 3, 5, 7, 8, 10, 11, 12, 13, 15, 16; 2Sum of PQI #s 10, 11, 12; 3Sum of PQI #s 1, 3, 5, 7, 8, 13, 15, 16 Source: 2003 State Inpatient Data; All correlations significant at p<.05

PQI Composite Workgroup Report Final April 7, 2006
B-3
Table 5. Composite Measure Descriptive Statistics
Composite Level All1 Acute Only2
Chronic Only3
National (SID) Rate per 100,000 1,724 662 1,062 Male 1,520 550 970 Female 1,915 767 1,148 Age 18 to 39 342 143 198 Age 40 to 64 1,241 391 850 Age 65 to 74 4,142 1,414 2,728 Age 75+ 8,804 3,949 4,855 White 1835 749 1085 Black 2588 722 1866 Hispanic 1090 380 710 Asian or PI 594 251 343 Native American 1003 362 641 State N 38 38 38 Rate per 100,000 1,831 731 1,100 Standard Deviation 505 177 344 Area (County) N 2,533 2,533 2,533 Rate per 100,000 2,307 969 1,338 Standard Deviation 1,196 543 725 1Sum of PQI #s 1, 3, 5, 7, 8, 10, 11, 12, 13, 15, 16; 2Sum of PQI #s 10, 11, 12; 3Sum of PQI #s 1, 3, 5, 7, 8, 13, 15, 16 Source: 2003 State Inpatient Data

PQI Composite Workgroup Report Final April 7, 2006
B-4
Table 6. Prevention Quality Indicators (PQI) Forecasts with Alternative Composites Based on Prevalence (2002-03) PQI in 2002
# PQI in 2003 All1 Acute Only2
Chronic Only3
All 0.871 0.806 0.850 Acute Only 0.806 0.841 0.720 Chronic Only 0.837 0.710 0.867 01 Diabetes Short Term Complication 0.548 0.458 0.573 03 Diabetes Long Term Complication 0.536 0.440 0.569 05 COPD 0.751 0.650 0.767 07 Hypertension 0.560 0.515 0.547 08 Congestive Heart Failure 0.744 0.628 0.776 10 Dehydration 0.659 0.668 0.603 11 Bacterial Pneumonia 0.737 0.794 0.637 12 Urinary Infection 0.699 0.688 0.657 13 Angina 0.467 0.407 0.421 15 Asthma 0.597 0.484 0.634 16 Lower Extremity Amputation 0.271 0.185 0.319 1Sum of PQI #s 1, 3, 5, 7, 8, 10, 11, 12, 13, 15, 16; 2Sum of PQI #s 10, 11, 12; 3Sum of PQI #s 1, 3, 5, 7, 8, 13, 15, 16 Source: 2002-2003 State Inpatient Data; All correlations significant at p<.05

PQI Composite Workgroup Report Final April 7, 2006
C-1
C. Appendix C. AHRQ QI PQI Composite Figures

Figure 1. Primary Care Physicians per Person
0.00
500.00
1000.00
1500.00
2000.00
2500.00
1 2 3 4 5 6 7 8 9 10
Decile (Lowest to Highest)
Com
posi
te R
ate
per 1
00,0
00
Overall Acute Only Chronic Only
PQI Composite Workgroup Report Final April 7, 2006
C-2
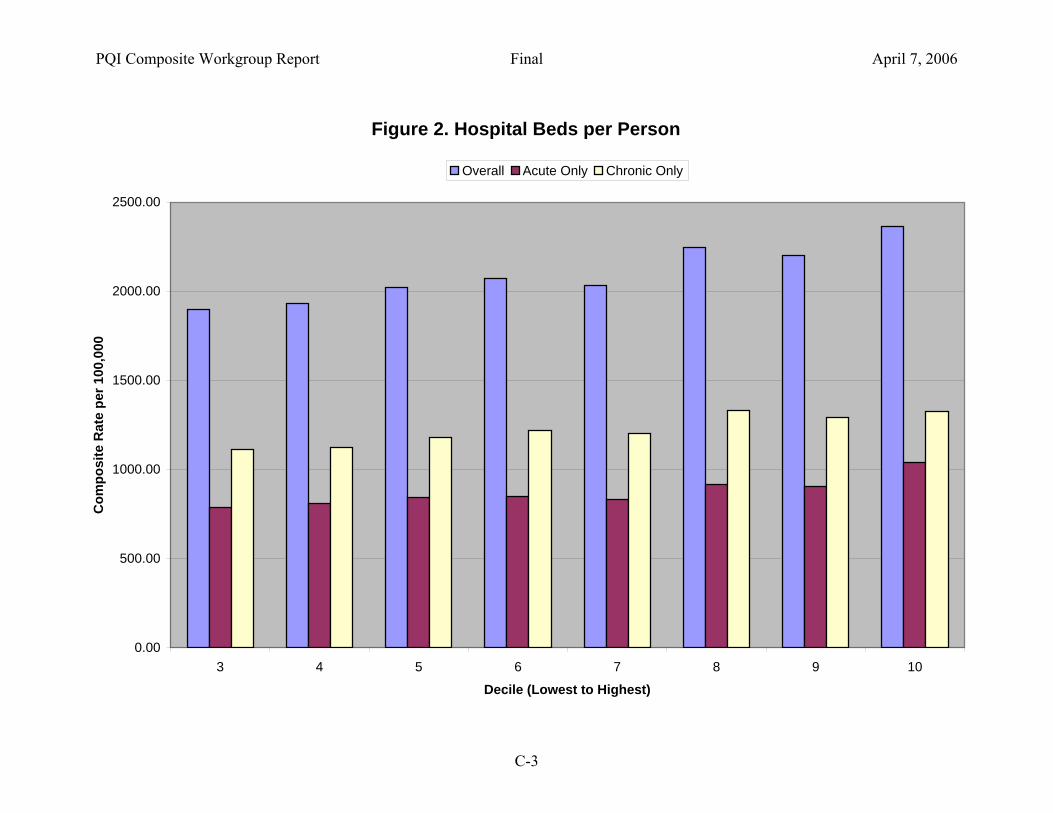
Figure 2. Hospital Beds per Person
0.00
500.00
1000.00
1500.00
2000.00
2500.00
3 4 5 6 7 8 9 10
Decile (Lowest to Highest)
Com
posi
te R
ate
per 1
00,0
00
Overall Acute Only Chronic Only
PQI Composite Workgroup Report Final April 7, 2006
C-3

Figure 3. SNF Beds and HHA per Person
0.00
500.00
1000.00
1500.00
2000.00
2500.00
1 2 3 4 5 6 7 8 9 10
Decile (Lowest to Highest)
Com
posi
te R
ate
per 1
00,0
00
Overall Acute Only Chronic Only
PQI Composite Workgroup Report Final April 7, 2006
C-4

Figure 4. Asthma Prevalence
0.00
500.00
1000.00
1500.00
2000.00
2500.00
1 2 3 4 5
Quintile (Lowest to Highest)
Com
posi
te R
ate
per 1
00,0
00
Overall Acute Only Chronic Only
PQI Composite Workgroup Report Final April 7, 2006
C-5

Figure 5. Diabetes Prevalence
0.00
500.00
1000.00
1500.00
2000.00
2500.00
1 2 3 4 5
Quintile (Lowest to Highest)
Com
posi
te R
ate
per 1
00,0
00
Overall Acute Only Chronic Only
PQI Composite Workgroup Report Final April 7, 2006
C-6
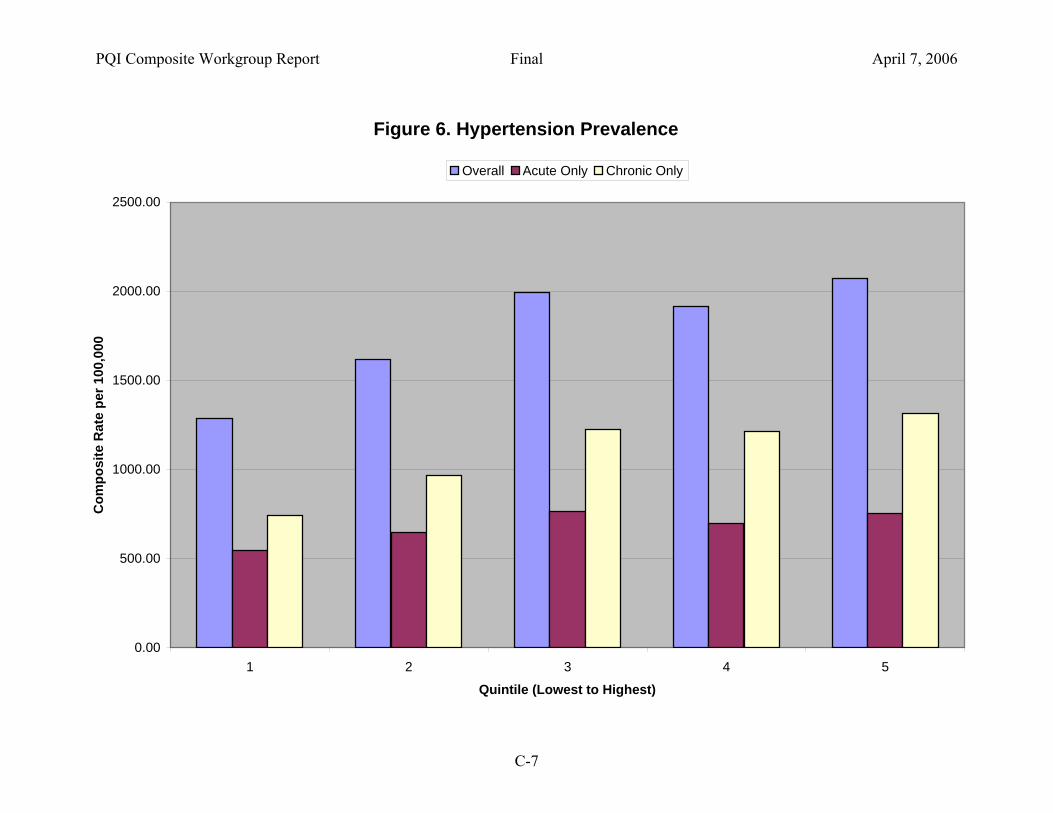
Figure 6. Hypertension Prevalence
0.00
500.00
1000.00
1500.00
2000.00
2500.00
1 2 3 4 5
Quintile (Lowest to Highest)
Com
posi
te R
ate
per 1
00,0
00
Overall Acute Only Chronic Only
PQI Composite Workgroup Report Final April 7, 2006
C-7
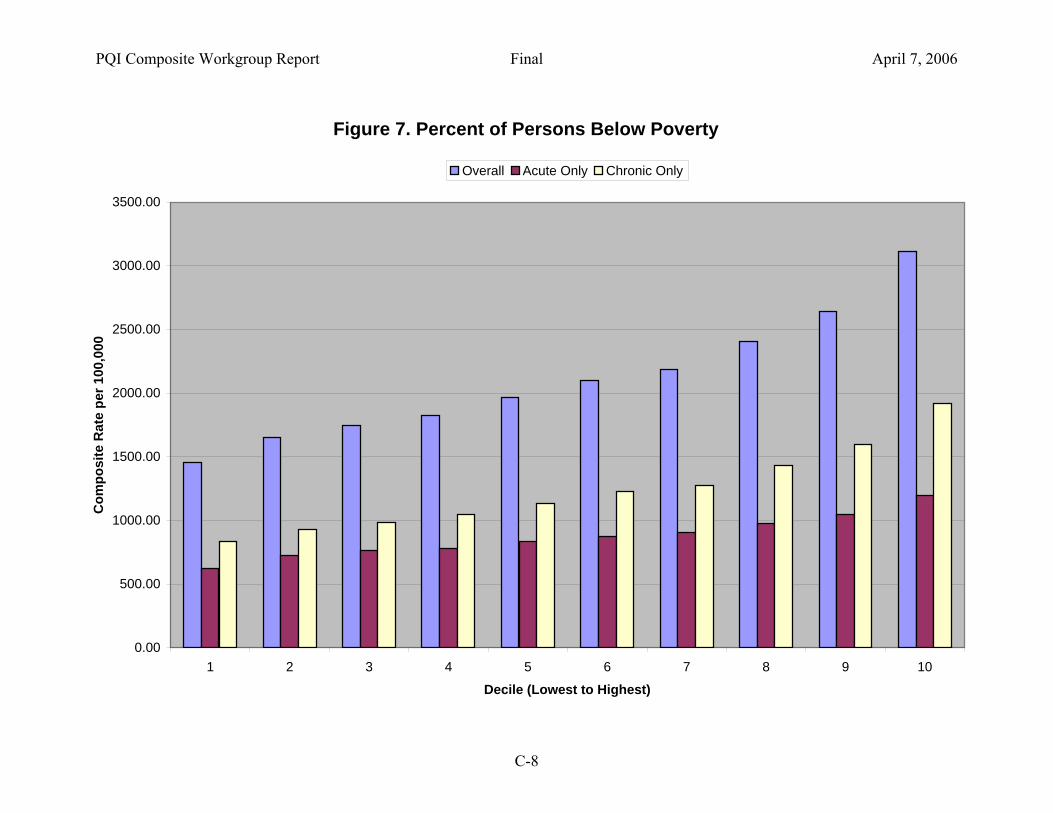
Figure 7. Percent of Persons Below Poverty
0.00
500.00
1000.00
1500.00
2000.00
2500.00
3000.00
3500.00
1 2 3 4 5 6 7 8 9 10
Decile (Lowest to Highest)
Com
posi
te R
ate
per 1
00,0
00
Overall Acute Only Chronic Only
PQI Composite Workgroup Report Final April 7, 2006
C-8

PQI Composite Workgroup Report Final April 7, 2006
D-1
D. Appendix D. Response to Reviewer Comments on the Draft Report

PQI Composite Workgroup Report Final April 7, 2006
D-2
Comment #1 The comment was directed to the statement in the draft report that “Conditions that result in higher days or costs would then be weighted more heavily in the composite” (p. 3). The reviewer suggested that the component measures in the composite be evenly weighted under the rationale that an evenly weighted composite might better identify those systems, processes and structures that have broad impact across several PQI conditions. Response to Comment #1 We agree that the approach to weighting the components of a composite will depend on the intended purpose of the analysis. The PQI Workgroup was charged with developing a PQI Composite for the National Healthcare Quality Report, and weighting the component measures by the prevalence of the condition (that is, the number of potential preventable hospitalizations) was felt to best reflect the number of opportunities for improvement. However, alternative weighting approaches might reflect other objectives. For example, weighting the composite by hospital days or costs might best reflect opportunities to reduce expenditures. An un-weighted composite might best identify important drivers that yield the biggest “bang for the buck” in terms of reducing potentially preventable hospitalizations across a broad spectrum of conditions. As the AHRQ QI Composite measures develop, alternative approaches to weighting will be incorporated to support multiple types of analyses. Comment #2 The comment was directed to the statement in the draft report that “the best way to combine components would be to sum the component numerators (i.e. hospitalizations)” (p. 3). The reviewer suggested that the component measures be risk-adjusted before combining the components into the composite in order to account for component-specific factors (e.g., age, gender, SES, disease prevalence) that might vary across regions. Response to Comment #2 As indicated in the report, there are many factors that might influence PQI rates, including demographics, disease prevalence, socioeconomic status, insurance status, and supply factors like the number of observation beds or hospital beds or primary care physicians per population. In the current PQI composite, the composite rate is computed first, and then that composite rate is adjusted for age and gender differences across regions (or reported separately for age and gender). This methodology was considered the most transparent to potential users of the composite. There was also concern that embedding risk-adjustment into the construction of the composite would remove focus from the factors themselves, which were considered important areas for future analysis and research, at least with the initial release of the information to the public.