agenda€¦ · · 2016-05-272016 to receive appeals from applicants that did not receive funding...
TRANSCRIPT
In compliance with Oakland’s policy for people with chemical allergies, please refrain from wearing strongly scented products to meetings. In compliance with the American Disabilities Act, if you need assistance to participate in the meetings for the Oakland Fund for Children and Youth
Planning & Oversight Committee, please contact the Oakland Fund for Children and Youth at 510-238-6379. Notification 48 hours prior to the meeting will enable the City of Oakland to make reasonable arrangements to ensure accessibility. If you have questions regarding this agenda or
related materials, please contact our office at the number above.
Oakland Fund for Children and Youth
Meeting of the Planning and Oversight Committee (POC)
June 1st, 2016 – 6:00 p.m. – 9:00 p.m. Oakland City Hall, Hearing Room #4
1 Frank H. Ogawa Plaza, Oakland, CA 94612
AGENDA
1. Call to Order
Introductions &Announcements
Agenda Review/Modifications
2. Adoption of Prior Meeting Minutes from April 20th 2016 action
3. Recognition of POC Youth Members informational
4. Ad-Hoc Appeals Subcommittee Report of Findings informational
5. Update on Life Enrichment Committee meeting May 24, 2016 Action for OFCY FY2016-2017 Grant Awards
informational
6. OFCY Interim Evaluation Presentation
Report on All Other Strategies Presented by Social Policy Research Associates
Report on School Based After School Programs Presented by Public Profit
action
7. Administrative Matters
General Announcements
Upcoming Meetings/ Scheduling
informational
8. Open Forum
9. Adjournment action
Public Comment: The POC welcomes you to its meetings and your interest is appreciated.
If you wish to speak before the POC, please fill out a speaker card and hand it to the staff of the POC.
If you wish to speak on a matter not on the agenda, please sign up for Open Forum and wait for your name to be called.
If you wish to speak on a matter on the agenda, please approach the Committee when called, give your name, and your comments.
Please be brief and limit your comments to the specific subject under discussion. Only matters within the POC’s jurisdiction may be addressed. Time limitations shall be at the discretion of the Chair.
MINUTES TO BE APPROVED Oakland Fund for Children and Youth (OFCY)
Planning and Oversight Committee (POC) Meeting
Oakland City Hall, 1 Frank H. Ogawa Plaza, City Council Chambers, Oakland, CA 94612 Wednesday, April 20, 2016
6:00 p.m. – 9:00 p.m.
Committee Members present: Kathy Teng Dwyer, Steven Wirt, M Shawn Cunningham II, Julie Waters, Gerald Williams, Kevin Wong, Ajani Torres-Cedillo, Anakarita Allen, Marcus Montague, Karen Lara, Kisha Jackson and Jared Utley
Committee Members absent: Bolor-Erdene-Erdenebat and Fred Price
Staff Members present: Sandy Taylor, Mike Wetzel, Scott Kim and Sachelle Heavens
1. Call to Order The meeting was called to order at 6:20 p.m.
2. Open Forum for Youth and Parents of Young Children The following youth members of grantee organizations spoke:
AYPAL: Building API Community Power
Bay Area Girls Rock Camp
Youth Together
Beyond Emancipation
East Bay Spanish Speaking Citizen’s Foundation
Health Initiatives for Youth, Inc.
BAY-Peace
Girls Inc. 3. Adoption of Prior Meeting Minutes from February 3, 2016
Ajani Torres-Cedillo made a motion, seconded by Jared Utley, to approve the meeting minutes from the February 3rd POC meeting. The POC unanimously approved the minutes of the meeting. (12 Ayes, 0 Nays)
4. Adoption of POC Ad-Hoc Review Subcommittee OFCY Grant Funding Recommendations for
FY2016-2019 Steven Wirt made a motion, seconded by Kisha Jackson, to approve the POC Ad-Hoc Review Subcommittee OFCY Grant Funding Recommendations for FY2016-2019 as presented in the memo, recommending funding to support 150 programs with $14.8M in grant awards in FY2016-2017. (10 Ayes, 0 Nays, 2 Abstentions [Anakarita Allen, Marcus Montague])
5. Administrative Matters
Appeals Process OFCY staff described the appeals process for organizations who did not receive a funding recommendation from the POC. The POC was reminded of the importance of the
MINUTES TO BE APPROVED Oakland Fund for Children and Youth (OFCY)
Planning and Oversight Committee (POC) Meeting
Oakland City Hall, 1 Frank H. Ogawa Plaza, City Council Chambers, Oakland, CA 94612 Wednesday, April 20, 2016
6:00 p.m. – 9:00 p.m.
Strategic Investment Plan, which guides the strategies that govern proposals that are submitted within a particular category. Gerald Williams asked a question regarding scoring criteria for the application review. Sandy Taylor referred to the RFP and its listed criteria for how organizations are scored relative to the section of the proposal narrative.
General Announcements There were no announcements.
Upcoming Meetings/Scheduling The ad-hoc Appeals subcommittee will meet on May 5, 2016 to hear appeals. The next full POC meeting will take place on the third Wednesday of May (5/18/2016).
6. Open Forum
Individuals representing or supporting the following agencies and programs spoke:
Attitudinal Healing Connection, Inc.
Fresh Lifelines for Youth (FLY)
East Bay College Fund
BAY-Peace
Bay Area Girls Rock Camp
AYPAL: Building API Community Power
Beyond Emancipation
Health Initiatives for Youth, Inc.
Prescott Circus Theatre
Boys and Girls Club of Oakland
Rising Sun Energy Center
Acta Non Verba
Girls Inc.
Youth Together
American Indian Child Resource Center
Oakland Parents Together
OUSD – Early Childhood
Biotech Partners
7. Adjournment
The meeting was adjourned at 9:10pm.
City of Oakland, Human Services Department
Oakland Fund for Children and Youth
Page 1 of 2
To: Planning and Oversight Committee (POC), OFCY
From: OFCY Staff
Date: May 18, 2016
Re: Ad-Hoc Appeals Subcommittee Report of Findings
Summary The Ad-Hoc Appeals Subcommittee held a hearing on May 5th 2016 to receive appeals from applicants that did not receive funding recommendations from the Planning and Oversight Committee (POC) for grant awards for FY2016-2017. The Ad-Hoc Appeals Subcommittee received written and oral appeals from two agencies in regards to three applications. The committee determined that the two agencies did not have sufficient grounds for appeals in regards to the three applications. The appeals were denied by the Ad-Hoc Appeals Subcommittee. Appeals Process and Report of Findings As stated in the RFP released in November 2015, applicants have the right to appeal the POC’s preliminary funding recommendations to the Ad-Hoc Appeals Subcommittee.
An appeal must be based on one or more of three criteria:
Unfair process (e.g., the appellant’s proposal was treated differently than others)
Material error (e.g., the appellant’s proposal was reviewed under the wrong funding category or based on some other objective error occurred), or
Conflict of interest potentially leading to financial gain by a POC member or their immediate families.
Appeals instructions noted that substantive disagreement with the funding recommendations is not grounds for appeal, and that no appeals would be accepted that challenge the review process as a whole. In addition, the appellants were not to submit any new or updated information about their proposal in their appeal.
OFCY received appeals from two agencies for three applications submitted.
Businesses United in Investing, Lending, and Development (BUILD) o BUILDing 21st Century Skills Through Entrepreneurship
Youth Together o One Land One People o Summer Enrichment

Page 2 of 2
Each appellant provided a written response to establish one of the three bases for appeal and how, as a result, the appellant’s proposal was affected negatively.
Each of the appellants was afforded fifteen minutes to provide an oral presentation to the Ad-Hoc Appeals Subcommittee to support their written appeal for each application. After completion of the oral presentation, OFCY staff provided their response to the appeal. The Ad-Hoc Appeals Subcommittee then made their determination as to the validity of the appeal. The subcommittee found that none of the appellants had grounds for appeals based on the criteria established and included in the RFP.
City of Oakland, Human Services Department
Oakland Fund for Children and Youth
Page 1 of 1
To: Planning and Oversight Committee (POC), OFCY
From: OFCY Staff
Date: June 1, 2016
Re: Oakland City Council Life Enrichment Committee Action on OFCY FY2016-2017 Grant Awards
Summary
The Oakland City Council Life Enrichment Committee (LEC) met on May 24th 2016 to receive the Planning and Oversight Committee (POC) funding recommendations for programs in FY2016-2017. The LEC forwarded the POC recommendations to fund 150 programs for $14.8M to the City Council for final approval and made a motion for the City Administrator to find additional funding, outside of OFCY, to fund Youth Together programs at Skyline and Castlemont High Schools. The Committee additionally requested that a legal opinion to be provided regarding how the City Charter governs City Council approval of OFCY funding. The full body of the Oakland City Council will receive the funding recommendation and motion from the LEC for consideration on the June 7, 2016 Council meeting.

Mid-Year Report
FY2015-2016
Prepared by:
Castle Sinicrope
Mika Clark
Social Policy Research
Associates (SPR)

ACKNOWLEDGEMENTS
Social Policy Research Associates (SPR) would like to thank the Oakland Fund for Children
and Youth staff members who have worked with us on this evaluation project, including
Sandra Taylor, Mike Wetzel, Scott Kim, Debra Chester, and Terry Hill. Thanks also to the
OFCY Planning and Oversight Committee for their ongoing feedback and support.
SPR staff who supported the data collection, analysis, and writing of this report include:
Heather Lewis-Charp, Rachel Estrella, Miloney Thakrar, Verenice Chavoya-Perez, Mayte Cruz,
and Allie Bollella.
Finally, we would like to give a special thanks to the staff, participants, and volunteers of the
OFCY programs for completing program surveys, hosting site visits, tracking their data in
Cityspan, and generously sharing insights about their programs.
OFCY Programs
Mid-Year Evaluation Summary FY2015-2016 S O C I A L P O L I C Y R E S E A R C H
A S S O C I A T E S
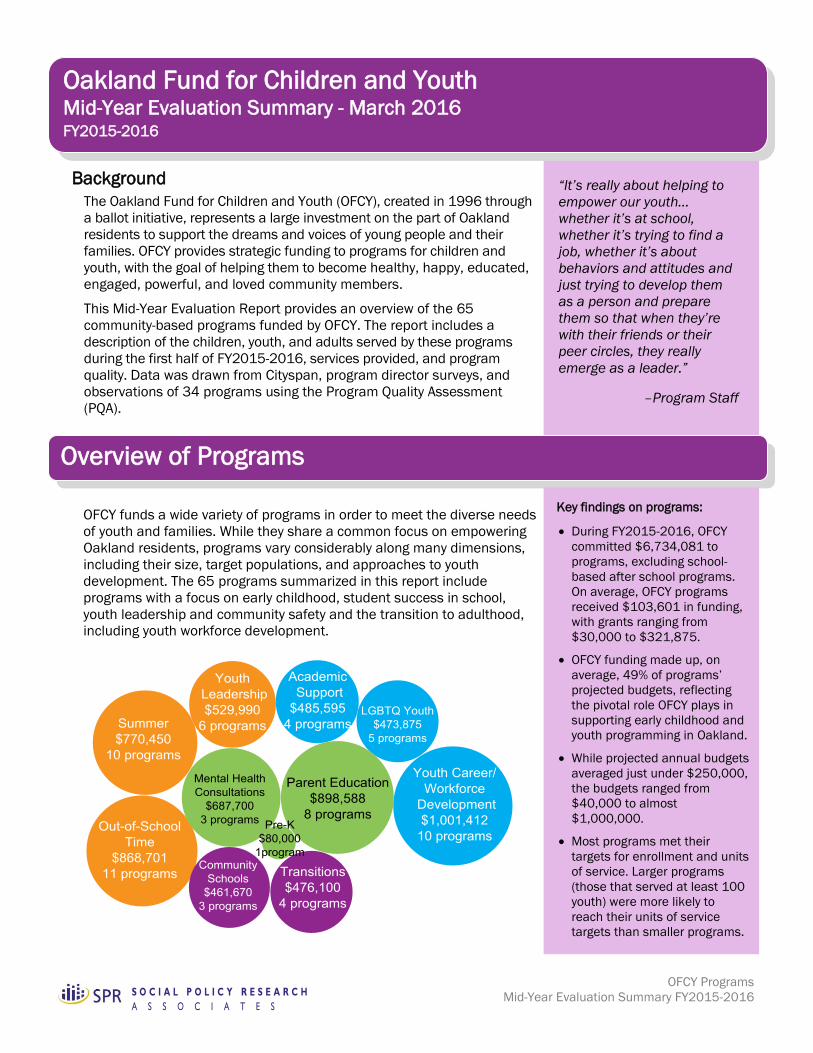
Background
The Oakland Fund for Children and Youth (OFCY), created in 1996 through
a ballot initiative, represents a large investment on the part of Oakland
residents to support the dreams and voices of young people and their
families. OFCY provides strategic funding to programs for children and
youth, with the goal of helping them to become healthy, happy, educated,
engaged, powerful, and loved community members.
This Mid-Year Evaluation Report provides an overview of the 65
community-based programs funded by OFCY. The report includes a
description of the children, youth, and adults served by these programs
during the first half of FY2015-2016, services provided, and program
quality. Data was drawn from Cityspan, program director surveys, and
observations of 34 programs using the Program Quality Assessment
(PQA).
OFCY funds a wide variety of programs in order to meet the diverse needs
of youth and families. While they share a common focus on empowering
Oakland residents, programs vary considerably along many dimensions,
including their size, target populations, and approaches to youth
development. The 65 programs summarized in this report include
programs with a focus on early childhood, student success in school,
youth leadership and community safety and the transition to adulthood,
including youth workforce development.
“It’s really about helping to
empower our youth…
whether it’s at school,
whether it’s trying to find a
job, whether it’s about
behaviors and attitudes and
just trying to develop them
as a person and prepare
them so that when they’re
with their friends or their
peer circles, they really
emerge as a leader.”
–Program Staff
Oakland Fund for Children and Youth
Mid-Year Evaluation Summary - March 2016
FY2015-2016
Overview of Programs
Key findings on programs:
During FY2015-2016, OFCY
committed $6,734,081 to
programs, excluding school-
based after school programs.
On average, OFCY programs
received $103,601 in funding,
with grants ranging from
$30,000 to $321,875.
OFCY funding made up, on
average, 49% of programs’
projected budgets, reflecting
the pivotal role OFCY plays in
supporting early childhood and
youth programming in Oakland.
While projected annual budgets
averaged just under $250,000,
the budgets ranged from
$40,000 to almost
$1,000,000.
Most programs met their
targets for enrollment and units
of service. Larger programs
(those that served at least 100
youth) were more likely to
reach their units of service
targets than smaller programs.

OFCY Programs
Mid-Year Evaluation Summary FY2015-2016 S O C I A L P O L I C Y R E S E A R C H
A S S O C I A T E S
During the first half of FY2015-2016, OFCY programs evaluated by SPR
served 12,906 youth and 1,330 adults across all neighborhoods in
Oakland, with over 20% of participants coming from 94601, around
Fruitvale and along International Boulevard, and over 50% coming from
other neighborhoods in East Oakland, reflecting where the majority of
OFCY program sites are located.
During Summer and Fall 2015, 34 of the 65 community-based programs
(54%) were observed by evaluators, using the Weikart Program Quality
Assessment (PQA) tool. The tool captures program quality along four key
dimensions for youth development programs: safety, supportive
environment, interaction, and engagement. The Final Report will draw on
additional sources of data to assess program quality, including in-depth
site visits and participant surveys.
Overview of Participants
Key findings on participants:
The vast majority of OFCY youth
participants were children and
youth of color, with Hispanic
(36%) and African American
(34%) children and youth
making up most of the
participants, followed by
Asian/Pacific Islander (14%),
multiracial (3%), and Caucasian/
White (4%) children and youth.
Just over 30% of youth receiving
services from OFCY-funded
programs received “light touch”
services (fewer than 10 hours),
while about one in five received
“intensive” services (120 hours
or more).
The Youth Leadership and
Community Safety funding area
served the most participants
(30%), followed by Student
Success in School (30%), and
Healthy Development of Young
Children (22%).
Key findings for program quality:
Programs were consistently
rated higher in the areas of
safety and supportive
environment than they were in
the areas of interaction and
engagement.
Areas of strength included
providing emotional safety, a
healthy environment, and an
accommodating environment.
Areas for improvement included
planning and youth leadership.
About two-thirds were rated as
performing and one-third were
given the highest rating of
thriving.
Programs that served least 100
participants in Q1 and Q2 of
FY2015-2016 received higher
PQA scores on average than
programs that served fewer
participants.
Quality
1 | Prepared by Social Policy Research Associates
INTRODUCTION
It’s really about helping to empower our youth…whether it’s at school, whether it’s trying to
find a job, whether it’s about behaviors and attitudes and just trying to develop them as a
person and prepare them so that when they’re with their friends or their peer circles, they
really emerge as a leader.
- Program Staff
This Mid-Year Report provides an overview of children and youth programs funded by the Oakland Fund
for Children and Youth (OFCY), with the exception of school-based afterschool programs. The report
includes a description of the children, youth, and adults served by these programs during the first
half of FY2015-2016, services provided, and program quality. The report covers a broad range of
programs, from early childhood to youth workforce development: In total, 65 programs are included
in the Mid-Year Report, representing 51% of the programs funded by OFCY in FY2015-2016.1
Data Sources
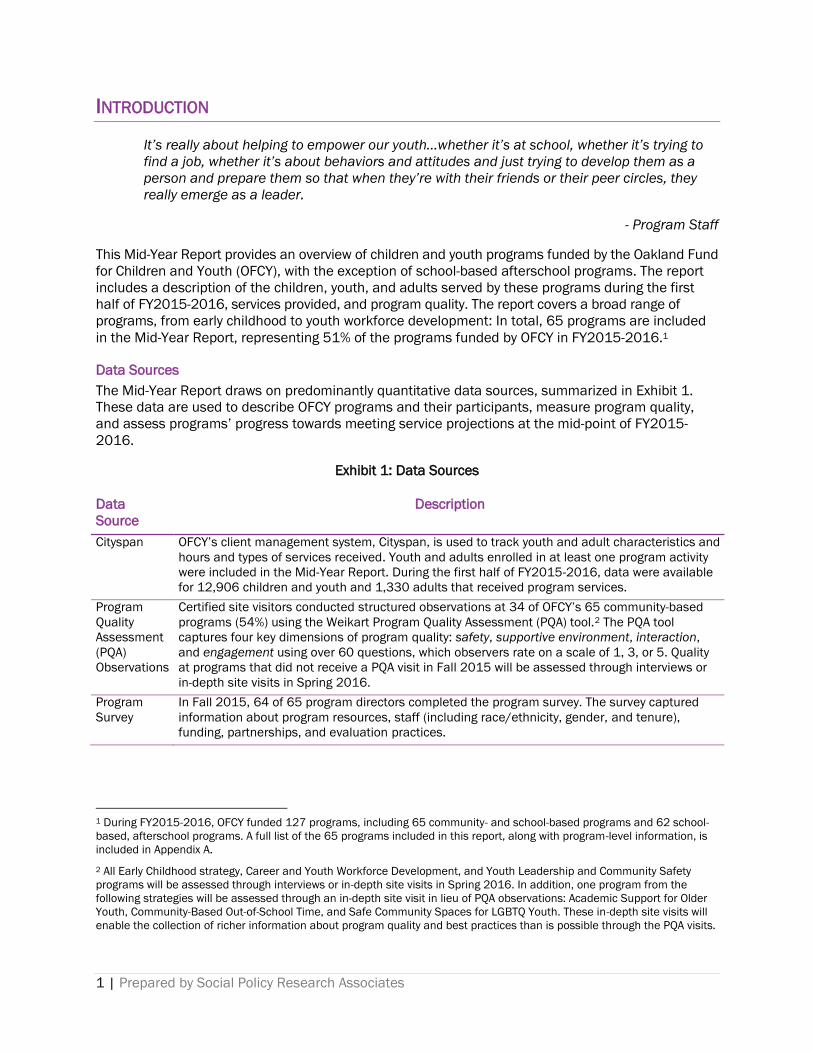
The Mid-Year Report draws on predominantly quantitative data sources, summarized in Exhibit 1.
These data are used to describe OFCY programs and their participants, measure program quality,
and assess programs’ progress towards meeting service projections at the mid-point of FY2015-
2016.
Exhibit 1: Data Sources
Data
Source
Description
Cityspan OFCY’s client management system, Cityspan, is used to track youth and adult characteristics and
hours and types of services received. Youth and adults enrolled in at least one program activity
were included in the Mid-Year Report. During the first half of FY2015-2016, data were available
for 12,906 children and youth and 1,330 adults that received program services.
Program
Quality
Assessment
(PQA)
Observations
Certified site visitors conducted structured observations at 34 of OFCY’s 65 community-based
programs (54%) using the Weikart Program Quality Assessment (PQA) tool.2 The PQA tool
captures four key dimensions of program quality: safety, supportive environment, interaction,
and engagement using over 60 questions, which observers rate on a scale of 1, 3, or 5. Quality
at programs that did not receive a PQA visit in Fall 2015 will be assessed through interviews or
in-depth site visits in Spring 2016.
Program
Survey
In Fall 2015, 64 of 65 program directors completed the program survey. The survey captured
information about program resources, staff (including race/ethnicity, gender, and tenure),
funding, partnerships, and evaluation practices.
1 During FY2015-2016, OFCY funded 127 programs, including 65 community- and school-based programs and 62 school-
based, afterschool programs. A full list of the 65 programs included in this report, along with program-level information, is
included in Appendix A.
2 All Early Childhood strategy, Career and Youth Workforce Development, and Youth Leadership and Community Safety
programs will be assessed through interviews or in-depth site visits in Spring 2016. In addition, one program from the
following strategies will be assessed through an in-depth site visit in lieu of PQA observations: Academic Support for Older
Youth, Community-Based Out-of-School Time, and Safe Community Spaces for LGBTQ Youth. These in-depth site visits will
enable the collection of richer information about program quality and best practices than is possible through the PQA visits.
2 | Prepared by Social Policy Research Associates
Overview of the Report
The report is structured as follows:
Programs: Provides an overview of OFCY community-based programs, including size, location,
and progress towards projections.
Participants: Summarizes characteristics and hours of service of OFCY program participants.
Quality: Summarizes program quality drawing on structured site visits using the PQA tool.
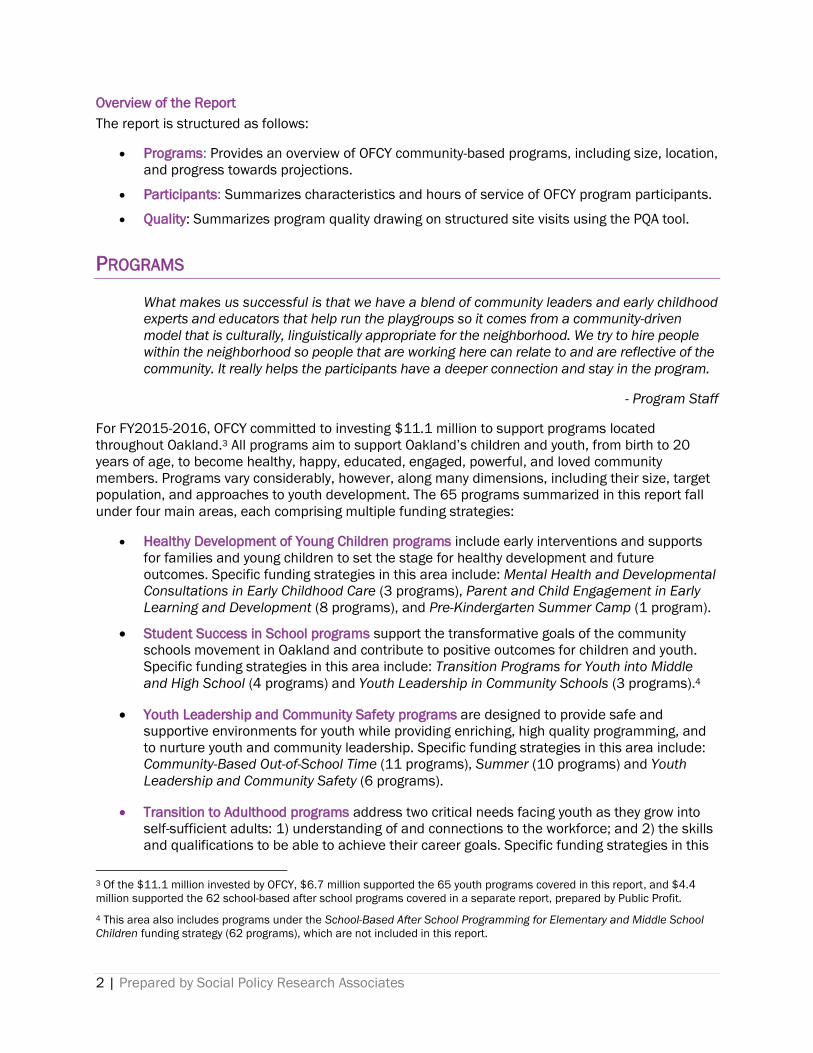
PROGRAMS
What makes us successful is that we have a blend of community leaders and early childhood
experts and educators that help run the playgroups so it comes from a community-driven
model that is culturally, linguistically appropriate for the neighborhood. We try to hire people
within the neighborhood so people that are working here can relate to and are reflective of the
community. It really helps the participants have a deeper connection and stay in the program.
- Program Staff
For FY2015-2016, OFCY committed to investing $11.1 million to support programs located
throughout Oakland.3 All programs aim to support Oakland’s children and youth, from birth to 20
years of age, to become healthy, happy, educated, engaged, powerful, and loved community
members. Programs vary considerably, however, along many dimensions, including their size, target
population, and approaches to youth development. The 65 programs summarized in this report fall
under four main areas, each comprising multiple funding strategies:
Healthy Development of Young Children programs include early interventions and supports
for families and young children to set the stage for healthy development and future
outcomes. Specific funding strategies in this area include: Mental Health and Developmental
Consultations in Early Childhood Care (3 programs), Parent and Child Engagement in Early
Learning and Development (8 programs), and Pre-Kindergarten Summer Camp (1 program).
Student Success in School programs support the transformative goals of the community
schools movement in Oakland and contribute to positive outcomes for children and youth.
Specific funding strategies in this area include: Transition Programs for Youth into Middle
and High School (4 programs) and Youth Leadership in Community Schools (3 programs).4
Youth Leadership and Community Safety programs are designed to provide safe and
supportive environments for youth while providing enriching, high quality programming, and
to nurture youth and community leadership. Specific funding strategies in this area include:
Community-Based Out-of-School Time (11 programs), Summer (10 programs) and Youth
Leadership and Community Safety (6 programs).
Transition to Adulthood programs address two critical needs facing youth as they grow into
self-sufficient adults: 1) understanding of and connections to the workforce; and 2) the skills
and qualifications to be able to achieve their career goals. Specific funding strategies in this
3 Of the $11.1 million invested by OFCY, $6.7 million supported the 65 youth programs covered in this report, and $4.4
million supported the 62 school-based after school programs covered in a separate report, prepared by Public Profit.
4 This area also includes programs under the School-Based After School Programming for Elementary and Middle School
Children funding strategy (62 programs), which are not included in this report.

3 | Prepared by Social Policy Research Associates
area include: Youth Career and Workforce Development (10 programs), Academic Support
for Older Youth (4 programs), and Safe Community Spaces for LGBTQ Youth (5 programs).
Community-Based Out-of-School Time made up the largest percentage of grantees (17%), followed
by Youth Career and Workforce Development and Summer Programs (15% each). As in the previous
year, the smallest funding strategies in terms of number of programs continued to be Pre-
Kindergarten Summer Camp (2%; 1 program), Mental Health and Developmental Consultations in
Early Care and Education (5%; 3 programs), and Youth Leadership in Community Schools (5%; 3
programs).
Exhibit 2 illustrates key characteristics of OFCY programs, including the location of their sites, OFCY
funding, program budget, and OFCY grant as a percentage of program budget. With some exceptions,
programs maintained the same funding, budget, and reliance on OFCY as in FY2014-2015 as well as
many of the same locations.
Location
OFCY programs, excluding school-based afterschool programs,5 continued to be hosted at sites
located throughout Oakland in the last year of the 2013-2016 grant. As in 2014-2015, the greatest
concentration (19%) of program sites is located in the 94601 zip code, clustered along International
Boulevard and in Fruitvale. Uptown and Downtown Oakland (94612, 12%) are home to a large
concentration of programs, as is Chinatown and West Oakland (94607, 12%). Healthy Development
of Young Children programs had the widest distribution across Oakland as a whole, with many sites
in Downtown and Fruitvale as well throughout neighborhoods in the Southeast edges of Oakland,
including Eastmont and Elmhurst. Program sites are clustered in areas participants live in (East
Oakland, Fruitvale) or that are readily accessible by public transportation networks (Downtown and
Chinatown).
Between the second and third year of the grant, the total number of program sites, including
placement sites for jobs and internships, decreased by about 10%. Youth Career and Workforce
Development6 and Transition Programs for Youth into Middle and High School dropped the most
sites while Community-based Out-of-School Time added the most sites. Youth Career and Workforce
Development, despite dropping some placement sites, continued to have the most sites due to a
wide variety of placement opportunities for youth, including transportation (Caltrans, BART), hospital
and health clinics (e.g., Alta Bates, Kaiser Permanente, and Children's Hospital & Research Center
Oakland), parks and recreation (YMCA, O.Co Coliseum, Metro Golf Links), and city agencies (e.g.,
East Bay Municipal Utilities District (EBMUD), City of Oakland - Public Works Agency).
5 Throughout the remainder of the Mid-Year Report, we refer to OFCY programs, excluding school-based afterschool
programs, as OFCY programs. School-based afterschool programs are summarized in a separate Mid-Year Report, prepared
by Public Profit.
6 Placement sites for Youth Career and Workforce Development programs vary year-to-year based on relationships with
local organizations and youth placements.

4 | Prepared by Social Policy Research Associates
Exhibit 2: Overview of OFCY Programs in FY2015-2016

5 | Prepared by Social Policy Research Associates
Foundation and government grants are the
most common types of external support for
OFCY programs. On the program survey,
14% of programs reported receiving
foundation support, and 11% reported
receiving government funding. Examples of
external funding sources for OFCY-funded
programs include Wells Fargo Foundation,
The California Endowment, College Bound
Brotherhood, Gap Foundation, the East Bay
College Fund, SAMHSA, Workforce
Innovation Opportunity Act, and Alameda
County.
Many programs receive in-kind support and
funding from their sponsoring agencies. For
example, the YouthBridge Career and
Workforce Development Program received
funding from Better Health East Bay, a
foundation supported by the Alta Bates
Summit Medical Center, Eden Medical
Center and Sutter Delta Medical Center.
OFCY Funding
During FY2015-2016, OFCY is providing its continuing portfolio of programs with a total funding
amount of $6,734,081. This declined slightly (2%) from FY2014-2015 because OFCY did not renew
one program’s funding and decreased one program’s funding.7 On average, programs received
$103,601 in funding, with grants ranging from $30,000 (Prescott Circus Theatre, a Summer
Program) to $321,875 (Integrated Early Childhood Consultation Program at the Jewish Family &
Children's Services of the East Bay, a Mental Health and Developmental Consultations in Early Care
and Education program). A total of nine programs received grants of less than $50,000, and only
four programs received grants of $200,000 or more.
OFCY programs are expected to diversify their funding
sources and draw on outside funding to augment their
program budgets, with a targeted match of at least
25% of their total OFCY grant. Examples of projected
matches include leveraged support from sponsoring
agencies and grant funding from foundations or
government agencies. Of 65 programs, at the mid-point
of FY2015-2016, 64 anticipated match of 25% or
more, with one program just shy of the target.8
During FY2015-2016, OFCY programs continued to rely
extensively on OFCY with OFCY grants making up, on
average, 49% of programs’ projected budgets. This
illustrates the important role that OFCY plays in
supporting early childhood and youth programming in
Oakland, as well as the challenges programs face in
procuring other sources of funding. Given that FY2015-
2016 represents the third and final year of the current
OFCY funding cycle, it is important for programs to
assess their ability to bring in non-OFCY funding to
sustain their programs beyond the ending grant cycle.
Programs in the funding strategies under Healthy Development of Young Children were most reliant
on OFCY funding (69% of program budget on average) while programs in the funding strategies
under Transitions to Adulthood, excluding Safe Community Spaces for LGBTQ Youth programs, were
the least reliant (34% of program budget on average).9 As in the previous year, smaller programs
with budgets under $150,000 (29% of programs) were significantly more likely to rely on OFCY
funding than larger programs with budgets over $350,000 (20% of programs): OFCY grants
comprised, on average, 58% of smaller program budgets versus 34% of larger program budgets.
7 Youth Uprising’s YU Excel program was not re-funded in FY2015-2016 and AIDS Project East Bay’s Save Our LGBTI-Youth
(SOL) grant decreased from $150,000 to $90,000.
8 The only program whose project match was not at least 25% of its OFCY grant was program Health Initiatives for Youth's
LGBTQIQ Youth Safe Space Initiative (24.22%)
9 Programs under two of the strategies in Transitions to Adulthood did not rely as heavily on OFCY funding: Academic
Support for Older Youth (32%) and Youth Career and Workforce Development (34%).However, programs under Safe
Community Spaces for LGBTQ Youth relied considerably on OFCY funding (67% of program budget).

6 | Prepared by Social Policy Research Associates
Program Size
Programs supported by OFCY funding ranged considerably in size, with an average projected annual
budget of just under $250,000, on par with FY2014-2015 program budgets. In the final year of the
grant cycle, Prescott Circus Theatre Summer Program ($40,000) and La Clinica de La Raza’s Juntos
program ($60,931) remained the smallest programs with relatively constant budgets while the
largest programs, Alameda Health System’s Model Neighborhood Program ($694,196) and College
Track-Oakland ($995,660), grew 22% and 14% respectively.10 As OFCY moves forward with the
selection and planning process for the FY2016-2019 grantees, it will be critical to keep in mind that
programs of different sizes vary in the kinds of supports that will help them reach their target
populations and their programmatic goals.
Progress Towards Projections
The mid-point of each year offers an opportune time to monitor the progress of programs in meeting
their recruitment and service goals. Two important standards for grant renewal are program
enrollment and progress towards projected units of service (total hours of service). At the beginning
of each fiscal year, programs set their anticipated enrollment and units of service in their work plans.
Each quarter, programs are checked against targets for enrollment and units of service for that
quarter. The specific targets at the mid-year are the following:
OFCY Standards for Enrollment at Mid-Year: By the end of Quarter 2, full-year programs have
enrolled at least 35% of projected unduplicated youth11 for the fiscal year. By the end of
Quarter 1, programs that operate only during the summer have enrolled at least 80% of
projected unduplicated youth to be served for the fiscal year.12
OFCY Standards Units of Service at Mid-Year: By the end of Quarter 2, full-year programs
have achieved at least 80% of their projected Units of Service for the first half of the year. By
the end of Quarter 1, programs that operate only during the summer have achieved at least
80% of their projected units of service for the fiscal year.13
A majority of programs had met the targets for enrollment and units of service at the midpoint of
FY2015-2016. Additional findings related to progress towards projections at the mid-point of
FY2015-2016, summarized in Exhibit 3, include:14
Similar to FY2014-2015, programs made greater progress toward enrollment than units of
service projections. Across all programs, 95% met the standard for enrollment, and 85% met
the standard for units of service. All summer programs met their both their enrollment and
units of service projections while 94% of year-round programs met enrollment targets and
80% met units of service targets. This mirrors findings from the FY2014-2015 Mid-Year
Report, reflecting that some year-round programs still have room to improve in terms of
either providing higher levels of service to youth they enroll and/or setting more realistic and
attainable projections for the youth they intend to serve. One possible explanation for less
10 The larger program budgets in FY2015-2016 could be due, in part, to inconsistencies in reporting match funds.
11 OFCY asks programs to project the number of unduplicated youth and adult participants. The term youth is used for
participants ranging from birth to 20, including children served by programs under Healthy Development of Young Children.
12 During FY2015-2016, there were 15 programs that operated during the summer: ten programs under the Summer
funding strategy as well as three Youth Career and Workforce Development programs (Exploring College & Career Options
in Oakland (ECCO!), Career Try-Out, and Hack the Hood Summer Boot Camp), one Youth Leadership and Community Safety
Program (Friday Night in the Park Program Support), and the Pre-K Summer Camp).
13 Progress towards projected units of service includes both youth and adult hours of service.
14 For progress toward enrollment and units of service goals by individual program, see Appendix A.

7 | Prepared by Social Policy Research Associates
Exhibit 3: Progress Towards Projections at Mid-Year
progress towards projected units of service among year-round programs, particularly for
programs under Student Success in School, is that many school-based programs have slower
recruitment in the beginning of the year, with programming starting as late as October.
There was some variation in progress towards enrollment and units of service by funding
strategy but no clear patterns for missing units of service targets. In terms of enrollment, all
programs except three programs within the Safe Community Spaces for LGBTQ Youth (under
Transitions to Adulthood) met targets for enrollment. Compared to FY2014-2015, programs
in the Parent and Child Engagement in Early Learning and Development strategy showed
considerable progress in meeting their units of service, perhaps as a result of improved

8 | Prepared by Social Policy Research Associates
tracking of adult participation. Only one of these programs fell short of meeting its target of
80% of projected units of service (reaching 79% of projected units of service delivered). As in
FY2014-2015, programs under the newest funding strategy, Safe Community Spaces for
LGBTQ Youth, were least likely to reach enrollment and units of service targets for the mid-
year: Only 40% met enrollment and units of service standards (2 out of 5 programs).
Programs that served more youth were more likely to reach their units of service targets.
Programs that enrolled 100 or more youth were more likely to provide 80% of their projected
units of service by the mid-year point than programs that enrolled fewer than 100 youth: 92%
of programs that enrolled 100 or more youth met their units of service targets compared to
75% of programs that enrolled fewer than 100 youth.15 Unlike previous years, there did not
seem to be any relationship between program budget and meeting projected units of service.
PARTICIPANTS
Our service model is called Creative, Connected, Resourceful and Whole. And those words
are very intentionally chosen, because that’s how we believe our young people are: creative,
connected, resourceful and whole. Our work is really to help connect them with that identity
of themselves.
- Program Staff
During the first half of FY2015-2016, 12,906 youth and 1,330 adults participated in the OFCY
programs summarized in this Mid-Year Report. As at the mid-point of FY2014-2015, programs under
the area of Youth Leadership and Community Safety served the most participants (33%), with
programs under Student Success in School (29%) and Healthy Development of Young Children
(27%) also contributing large percentages of participants. Together, the three funding strategies
under Transitions to Adulthood served about 12% of participants.
This section describes the characteristics of participants in OFCY programs and the hours of services
they received. For the most part, this section’s discussion of participant characteristics focuses on
children and youth served by OFCY programs, summarized in Exhibit 4. Thanks to improvements in the
completeness of adult participant data, we include a brief section on adult participants in the Parent
and Child Engagement in Early Learning and Development programs.
Characteristics
OFCY programs provide direct services to children and youth from birth to 20 years and their parents.
Within this broad age group, specific OFCY funding strategies have a more focused target population
including children from birth to 5 and their parents, middle school students transitioning to high
school, and LGBTQ youth. During the first half of FY2015-2016, OFCY programs served participants
from all neighborhoods in Oakland. OFCY programs draw the most participants from neighborhoods
in East Oakland: Over a fifth (22%) of youth participants came from 94601, around Fruitvale and
along International Boulevard, mirroring where a large portion of program sites are located. Another
quarter of program participants come from other neighborhoods in East Oakland, including 13% from
Webster Tract and East of Coliseum (94621) and 12% from Highland Park, San Antonio, and East
Lake (94606). Continuing trends from previous years, fewer participants live in Chinatown and
Downtown (10% total) although these locations are home to nearly a quarter of program sites.
15 At 0.06, this finding was just shy of being statistically significant at the 0.05 level.
9 | Prepared by Social Policy Research Associates
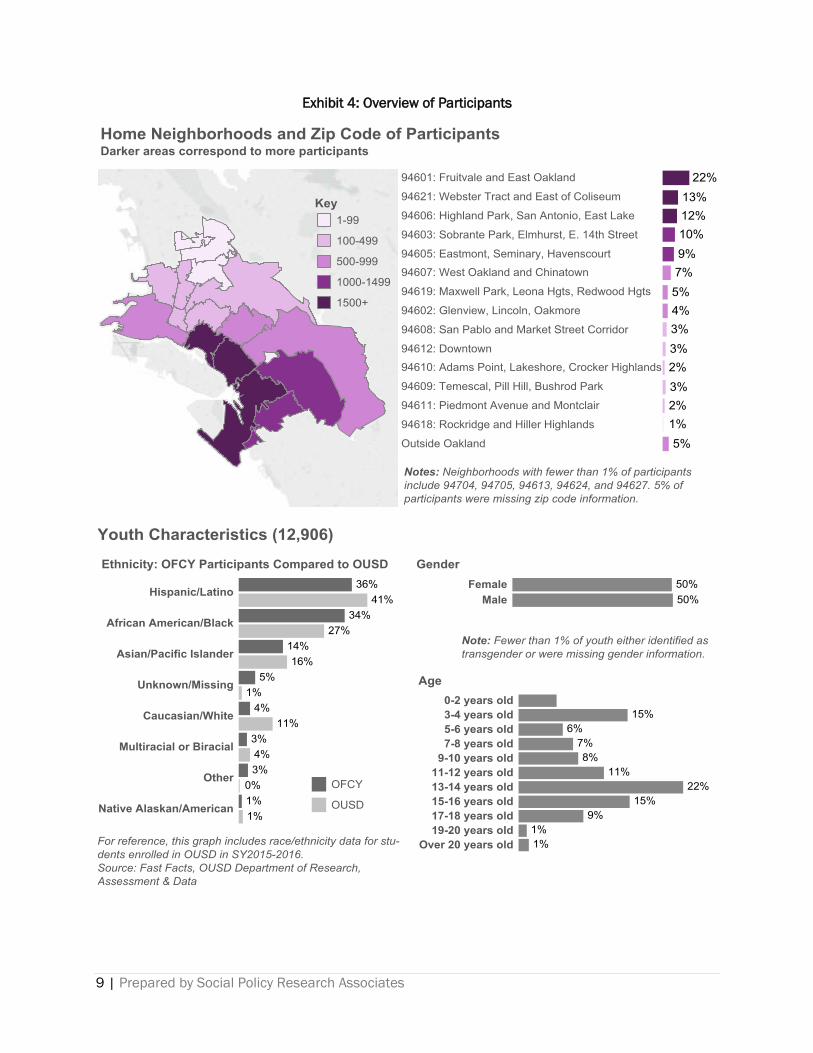
Exhibit 4: Overview of Participants

10 | Prepared by Social Policy Research Associates
Program staff are diverse but
do not mirror the
race/ethnicity of
participants. During FY2015-
2016, a third of staff were
African American (33%),
followed by Hispanic (22%)
and White (16%). Mental
Health and Developmental
Consultations in Early Care
and Education programs had
the highest proportion of
White staff (55%) while
programs under Youth
Leadership and Community
Safety had the highest
percentage of Hispanic staff
(43%) and Safe Community
Spaces for LGBTQ Youth had
the highest percentage of
African American staff (59%).
For the most part, programs
serving predominantly one
racial/ethnic group were led
by staff of the same
race/ethnicity.
Most program staff are
female, but staff gender
varies by strategy and
program. Across all OFCY-
funded programs 70% of
program staff were female.
Over 90% of staff at early
childhood programs under
Healthy Development of
Young Children were female
while males made up roughly
half of staff members at
Youth Leadership and
Community Safety (50%),
Youth Career and Workforce
Development (46%), and
Safe Community Spaces for
LGBTQ Youth (45%)
programs. A total of 5
programs were led entirely by
male staff while 13 programs
were led by all female staff
during FY2015-2016.
OFCY programs continue to reach a very diverse population. As
in previous years, the vast majority of OFCY youth participants
were children and youth of color. At the mid-point of FY2015-
2016, Hispanic youth made up the largest percentage (36%),
a change from FY2014-2015, followed by African American
(34%) and Asian/Pacific Islander (14%). Although Hispanic
youth were still underrepresented in OFCY programs relative to
OUSD, they now make up the largest group of children and
youth served by OFCY programs. White children are also
underrepresented relative to OUSD, making up only 4% of
OFCY program participants compared to 11% of OUSD
students while African American youth are slightly
overrepresented. At the mid-point of FY15-16, 10 programs
(15%) served predominantly one racial/ethnic group, defined
as 75% or more of participants being from the same
racial/ethnic group. These programs included programs
sponsored by ethnic-specific agencies [Leading the
Independence of our Barrios for Raza Empowerment (LIBRE)
at Spanish Speaking Citizens' Foundation, 93% Hispanic; API
Youth Promoting Advocacy and Leadership (AYPAL) at EBAYC,
93% Asian/Pacific Islander] as well as programs that serve
predominantly African American youth (Oakland Freedom
School and Summer Cultural Enrichment Program, 92% and
94% African American) and parent programs (Listening to
Children Parent Cafes, 76% African American; and Parent Child
Education Support Program, 83% Hispanic)].
Although overall participation was split evenly between male
and female participants, some programs targeted specific
genders and a few programs served predominantly one
gender. Across all programs, 50% of children and youth
participants were female and 50% were male, with less than
1% transgender or missing gender information. In terms of
funding strategies, programs under Safe Community Spaces
for LGBTQ Youth continued to be predominantly female (68%).
Pre-Kindergarten Summer Camp was 60% female while
programs under Youth Leadership and Community Safety
were, overall, 57% male. Gender-specific programs continued
to focus on their target populations: Concordia Park Summer
Program and Girls in Oakland Achieve and Lead at Girls
Incorporated of Alameda County (100% female); and Brothers,
UNITE! at Brothers on the Rise (100% male). Programs that
served predominantly one gender group at the mid-point of
both FY2014-2015 and FY2015-2016 were: Rites of Passage
(94% and 92% female), Moving in the Movement (71% and
82% female), and Friday Night in the Park (78% and 84%
male). Programs with considerable shifts in the balance of
participants’ gender at the mid-point of the year from FY2014-
2015 to FY2015-2016 include: Get Active Urban Arts Program
(93% versus 65% male), Hack the Hood (56% versus 76%
male), and Health Initiatives for Youth's LGBTQIQ Youth Safe
Space Initiative (56% female versus 76% female).
11 | Prepared by Social Policy Research Associates
Ages of participating children and youth continued to vary greatly by funding strategy. Across
all programs, the age ranges most frequently served were 13-14 year olds (22%), 3-4 year
olds (15%), and 15-16 year olds (15%). The vast majority of children under the age of 5
continued to be served through programs funded through Healthy Development of Young
Children (98%), with an average age of 4. On the other end of the spectrum, a majority of
youth aged 19 and above (55%) were served through programs under Transitions to
Adulthood--the average age for participants in these programs was 16.6. Across all
programs, just over 1% of youth participants were older than 20 years old, the upper range of
OFCY’s target age range for youth.
Improved adult participant data suggests OFCY programs are reaching diverse, but mostly
female, parents in their thirties. With demographic data available for 65%-75% of adult
parents in Parent and Child Engagement in Early Learning and Development programs, a
picture of parent participants is beginning to emerge. At the mid-point of FY2015-2016,
parents were mostly Hispanic/Latino (48%) or African American (24%) and predominantly
female (81%). Across all parent play group programs, the average age was 35, and nearly
half of all parent participants were between 30 and 40 years of age (49%). Important to note
is that while Parent and Child Engagement in Early Learning and Development programs, as
a strategy, serve a diverse group of parents, the individual programs themselves seem to
attract a specific population and are less diverse themselves. Chatterbox and Listening to
Children Parent Cafes served predominantly African American parents (90% and 85%) while
Parent Child Education Support Program served mostly Hispanic parents (88%). Nearly half
of parents in Building Strong Children in LGBTQ Families were White (48%). Of the eight
programs, Parent Child Education Support Program was the most balanced in terms of
gender, serving 66% female and 34% male. In terms of age, Chatterbox served the youngest
parent population (average age of 28) while Building Strong Children in LGBTQ Families
served the oldest (average age of 39). Although the completeness of demographic data for
parents improved considerably over the previous year, 86% of zip codes were missing.
Services Received
At the mid-point of FY2015-2016, OFCY participants had received an average of 62.4 hours of
service, with children and youth averaging 65.9 hours and adults averaging 28.6 hours. Across all
programs, 43% of youth received at least 40 hours of program services, and 20% of adult
participants received at least 40 hours of service.
As shown in Exhibit 5, participants received services that fell into nine broad service categories,
ranging from academics and arts to family engagement and vocational training.16 As in FY2014-
2015, youth received the most hours in academics (23.6 hours), followed by health and recreation
(9.6), civic engagement and youth leadership (9.3), and arts and culture (8.9). Adult participants
received the most hours in academics (9.2) and family engagement (8.1), followed by supportive
services (6.4).
16 Each funding area has between 19 and 26 specific service categories. To allow for high-level comparisons of types of
services across programs and funding areas, we recoded specific service categories into nine broad categories: 1)
academics; 2) arts and culture; 3) civic engagement and youth leadership; 4) family engagement; 5) health and recreation;
6) life skills; 7) supportive services; 8) vocational; and 9) other.

12 | Prepared by Social Policy Research Associates
Exhibit 5: Average Hours of Service Received for Children and Youth
Key findings in services by youth and program characteristics include the following:
Median hours of service increased although service dosage continued to be unevenly
distributed across participants. At the midpoint of FY2015-2016, the average hours of
service for youth participants was 65.9, and the median was 24 hours, an increase of 33%
from FY2014-2015 (18 hours). The funding strategies that experienced the highest increase
in median service hours include Youth Leadership in Community Schools, Youth Leadership
and Community Safety, and Parent and Child Engagement in Early Learning and
Development. Data show that programs continued to provide about a third of participants
with light-touch services (32% received fewer than 10 hours, averaging 3.3 hours) and a fifth
receive more intensive services (21% received over 120 hours, averaging of 209.7).
There was considerable variation in hours of service by both funding area and funding
strategy. Summer programs had completed their offerings for FY2015-2016 and had the
highest average hours of service (164.4), pulling up the average for its funding area, Youth
Leadership and Community Safety (130.0). Children and youth participants received the
fewest hours under Healthy Development of Young Children (22.3) and only slightly more
hours, on average, in programs under Student Success in School (26.0). As noted at the mid-
year of FY2014-2015, adults in programs funded under Healthy Development of Young

13 | Prepared by Social Policy Research Associates
Children received more hours than children and youth (35.4 versus 22.34), which makes
sense given two of the strategies under this funding area target adults. Funding strategies
that had provided a high level of services at the mid-point of FY2015-2016 included Youth
Career and Workforce Development (104.2), Youth Leadership and Community Safety
(89.5), and Community-Based Out-of-School Time Programs (86.5). Across all of the
programs, average hours of service per child or youth participant ranged from below 5 hours
(Health Initiatives for Youth's LGBTQIQ Youth Safe Space Initiative and Peer Restorative
Justice Program at OUSD) to over 200 hours (East Oakland Boxing Association’s SmartMoves
Education and Enrichment Program and the City of Oakland - Office of Parks and
Recreation’s Summer Camp Explosion). The percentage of youth who received 40 hours or
more of services also ranged: 10 programs provided 10% of youth with at least 40 hours of
service and 12 programs provided 90% of youth with at least 40 hours of service.
As in previous years, there was no overall difference in number of hours of service by gender,
though male and females received different types of services. Overall, male participants
received 65.1 hours of service, and female participants received 66.8 hours of service.
Similar to FY2014-2015, female participants received more services in arts than males (10.0
versus 7.8) while males received more hours in academics (24.4 versus 22.7). Female
participants also received, on average, more hours in vocational training and life services
compared to males.
Children and youth in the smallest racial/ethnic groups received, on average, the most hours
of service. Children and youth identified as Other and Native Alaskan/American made up just
3% of program participants but received high levels of services (137.6 and 110.3 hours). The
high overall average for Native Alaskan/American youth comes from participation in
Indigenous Youth Voices: 60% of Native Alaskan/American youth participated in this program
and averaged 125 hours of service. Multiracial, African American, and Asian/Pacific Islander
youth also received more than the average hours of service. However, Hispanic youth, who
made up the largest group, received on average, less than all other ethnic groups (54.1)
except White youth. White youth, who made up the smallest percentage of youth
participants, received the fewest hours of service on average (29.4), even fewer hours than
at the midpoint of FY2014-2015.
Hours of service was highest for children aged 9-10 and decreased with age. At the midpoint
of FY2015-2016, average hours of service peaked for children aged 9-10 (134.4) and youth
aged 5-8 (124.8) before declining and remaining between 40-55 hours for youth aged 13
and up. The finding that youth between the ages of 5 and 10 received the most intensive
services at the midpoint of the year is likely due to the fact that roughly 60% of these youth
participated programs that operated during the summer and had received all of their hours
of service by the midpoint of the year. Not only have summer programs completed their
operations by the midpoint of the year, but they also provide more intensive services on
average. Following trends from the previous year, younger youth were more likely to receive
academic services while older youth were more likely to participate in youth leadership and
civic engagement activities and vocational training. The drop in average house of service for
13-14 year olds could reflect the nature of the Transition Programs for Youth into Middle and
High School, which tend to provide lighter touch services.17
17 At the mid-point of FY2015-2016, 50% of 13-14 year olds were enrolled in Transition Programs for Youth into Middle
and High School. During FY2014-2015, many 13-14 year olds received lower intensity services at Transition Programs for
Youth into Middle and High School in the spring. In FY2015-2016, some of this programming may have shifted to the fall,
resulting in lower average hours of service in the fall.
14 | Prepared by Social Policy Research Associates
Types of services received varied by program budget. While there was no overall difference in
total hours received across large and small programs, there were significant differences in
the types of services provided. Children and youth in programs with budgets under $150,000
received more hours of art and culture, civic engagement and youth leadership, family
engagement, and other services. In contrast, youth in programs with budgets greater than
$150,000 received, on average, more hours of academics, health and recreation, life skills,
support services, and vocational training.
Children and youth in programs that enrolled fewer students received more hours of service.
Children and youth in programs that enrolled fewer than 100 students received, on average,
77.7 hours of service, compared to 64.4 hours for children and youth in programs that
enrolled 100 students or more. Children and youth in smaller programs received, on average,
more hours of service in all areas services except youth leadership and family engagement.
These findings are consistent with FY2014-2015 reporting which found that programs
serving fewer youth are able to provide a more intensive level of service.
The level of service received by parents in the playgroups varied by race/ethnicity but not by
gender or age. On average, adult participants in Parent and Child Engagement in Early
Learning and Development programs received 34.1 hours of services, more than any other
strategy with a significant number of adult participants except Mental Health and
Developmental Consultations in Early Care and Education (41.5 hours).18 Across all
playgroup programs, 30% of adult participants received 40 hours or more of services, and
academic and family engagement services accounted for almost all services received. Unlike
youth participants, however, White adult participants received more than the average hours
of service (45.6), while Hispanic adults received about the average (34.9) and African
American parents received less intensive services (27.9). Similar to youth, there were no
significant differences in the hours of service received by male and female adult participants.
By age, there was some, but not much, variation in the intensity of services received: Adult
participants under 20 years of age received the lowest intensity of services (26.7 hours) and
adults aged 30 to 40 received the highest intensity (37.2).
QUALITY
I think it’s important to note that the experience in the program is not only about job placement
and career readiness but about individual youth empowerment. We want them to understand
that tech is an ecosystem that’s in their community. It’s not just in San Francisco or Silicon
Valley. That they have the inherent ability to play a substantial role in it if they want to.
- Program Staff
During Summer and Fall 2015, 34 of the 65 community-based programs (54%) were observed by
evaluators, using the Weikart Program Quality Assessment (PQA) tool.19 The tool captures program
18 There were four adult participants in Youth Career and Workforce Development programs who averaged 98 hours of
services but are not discussed here because those programs do not target adult participants. Among adult participants in
Mental Health and Developmental Consultations in Early Care programs, three are recorded as having received more than
1,000 hours of service. Excluding those three individuals, the average hours of service for adult participants was 17.4
hours.
19 All Early Childhood strategy, Career and Youth Workforce Development, and Youth Leadership and Community Safety
programs will be assessed through interviews or in-depth site visits in Spring 2016. In addition, one program from the
following strategies will be assessed through an in-depth site visit: Academic Support for Older Youth, Community-Based
Out-of-School Time, and Safe Community Spaces for LGBTQ Youth. One program (Alternatives in Action-Life

15 | Prepared by Social Policy Research Associates
quality along four key dimensions for youth development programs: safety, supportive environment,
interaction, and engagement. This section summarizes PQA scores, identifies areas of strength and
weakness and investigates variation in program quality by funding strategy, program budget, and
enrollment.
The Program Quality Assessment tool is a structured observation conducted by certified site visitors.
During a 2-3.5 hour visit, site visitors rate programs on over 60 questions that make up the four key
dimensions.20 While the version of the tool for younger youth (School-Aged PQA) differs from the
version for older youth (Youth PQA) for some questions and subdimensions, both tools capture the
same underlying dimensions of safety, supportive environment, interaction, and engagement.
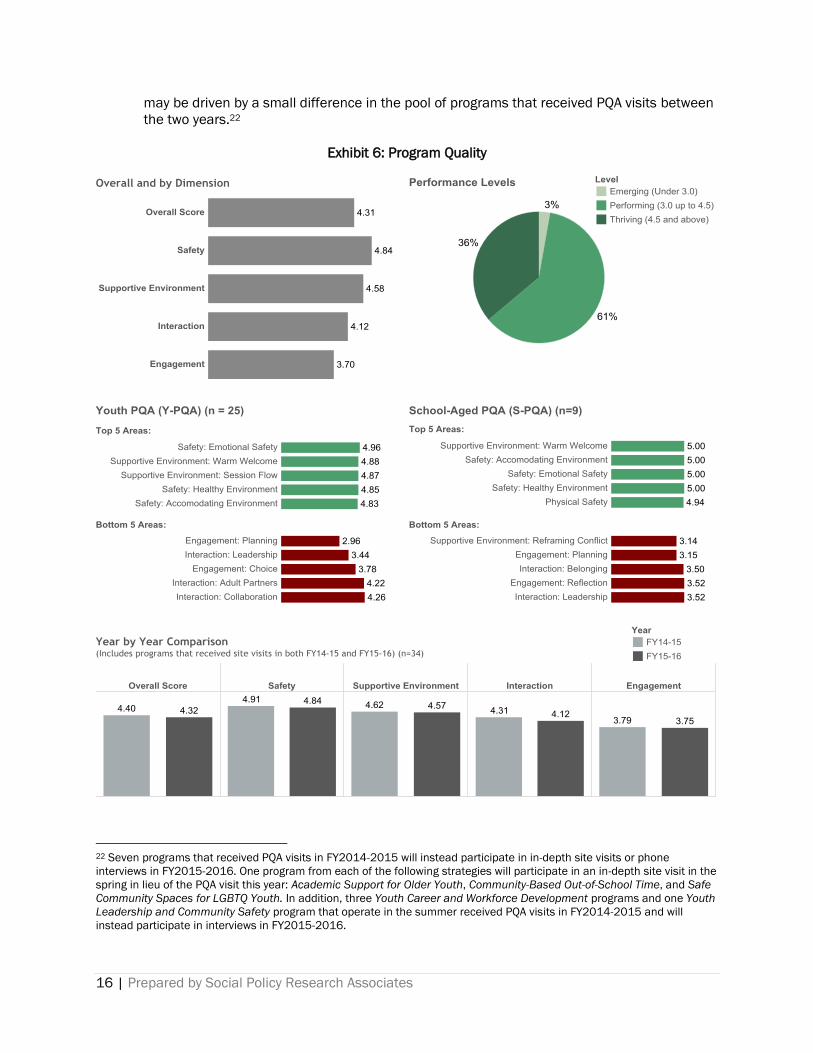
Almost all programs visited in Summer and Fall 2015 received overall scores of either Performing or
Thriving, the two highest categories of performance.21 Only one program received a score of
Emerging. Other findings related to program quality include:
Programs were rated consistently higher for safety and supportive environment than
interaction and engagement in FY2015-2016. This finding is in line with the findings from
FY2014-2015, as well as national trends, and reflects the challenge of providing opportunities
for peer collaboration and youth leadership. Programs consistently received high scores for
providing emotional and physical safety and healthy and accommodating environments but
many were less successful in providing opportunities for youth to act as group facilitators and
mentors, help shape program planning, and reflect on what they have done. Programs that
received high scores in these areas utilized different tactics to promote engagement and
interaction among youth. For example, the Peer Restorative Justice Program at OUSD asked
youth to rotate and take turns leading different activities every week and provided
opportunities for older youth to mentor the younger youth. As another example, participants
from Rites of Passages at Dimensions Dance Theater had frequent opportunities to meet as
a group and discuss what they had learned through their activities as a reflection process.
Programs received similar scores on their program quality assessments compared to
previous years. On average, programs that received PQA visits in both years received an
overall score of 4.32 in FY2015-2016 and 4.40 in FY2014-2015. The difference was only
statistically significant in the area of interaction, which was lower in FY2015-2016 than in
the previous year (4.12 in FY2015-2016 versus 4.31 in FY2014-2015).
Funding strategy does not seem to play a large or consistent role in program quality
assessment scores. Although there was modest variation in program strengths and areas of
improvement by funding strategy in both FY2014-2015 and FY2015-2016, these strengths
and weaknesses within strategies were inconsistent across the two years. This inconsistency
Academy/McClymonds) received three separate PQA scores, one for each component of its program. All three scores are
included in this analysis.
20 The tool uses a scale of 1, 3, and 5 with descriptions of the ratings at each level for each of the questions. In general,
rating of 1 indicates that the practice was not observed while the visitor was on site, or that the practice is not a part of the
program, a rating of 3 indicates that the practice is implemented relatively consistently across staff and activities, and a
rating of 5 indicates that the practice was implemented consistently and well across staff and activities.
21 Programs that received overall scores of 4.5 or higher across all four dimensions were categorized as Thriving and
defined as programs that provide high quality services across all four quality domains and practice areas. Programs that
received average scores between from 3.0 up to 4.5 were categorized Performing and defined as programs that provide high
quality service in almost all program quality domains and practice areas and have a few areas for additional improvement.
16 | Prepared by Social Policy Research Associates
may be driven by a small difference in the pool of programs that received PQA visits between
the two years.22
Exhibit 6: Program Quality
22 Seven programs that received PQA visits in FY2014-2015 will instead participate in in-depth site visits or phone
interviews in FY2015-2016. One program from each of the following strategies will participate in an in-depth site visit in the
spring in lieu of the PQA visit this year: Academic Support for Older Youth, Community-Based Out-of-School Time, and Safe
Community Spaces for LGBTQ Youth. In addition, three Youth Career and Workforce Development programs and one Youth
Leadership and Community Safety program that operate in the summer received PQA visits in FY2014-2015 and will
instead participate in interviews in FY2015-2016.
17 | Prepared by Social Policy Research Associates
The relationship between program quality and program size is unclear, especially when
considering trends over time. As we observed last year, programs with budgets of less than
$150,000 generally received higher program quality assessment scores. For example,
smaller programs received an average overall score of 4.50 compared to 4.25 for larger
programs. However, the specific quality dimensions that were related to budget size were not
consistent from year to year. Finally, while total enrollment was not related to program quality
assessment scores in FY2014-2015, programs that served at least 100 participants in Q1
and Q2 of FY2015-2016 received higher scores on average than programs that served fewer
participants.
The Final Report for FY2015-2016 will further explore program quality by identifying specific
strategies and best practices utilized by a sample of high performing programs, as well as
highlighting participant perspectives on program quality drawn from focus groups and surveys.
CONCLUSION
I definitely think that JUMA has helped me see myself differently. Before JUMA, I was like,
“I’m not even gonna finish high school, let alone go on to college.” I thought I was gonna be
that typical stereotype. I was thinking of myself as a stereotype because I was just going
down the wrong path and stuff wasn’t really going good in my life. But then coming here, we
get a lot of motivation and inspiration and opportunities as well.
- Participant
In FY2015-2016, OFCY continues to provide vital funding to community-based organizations serving
a diverse group of children and youth from birth to 20 years of age. OFCY-funded programs provide a
range of services to children and youth from across the city, particularly from Fruitvale, East Oakland,
Chinatown, and West Oakland.
Many of the trends identified at the mid-point of FY2014-2015 are still relevant in FY2015-2016. For
example, progress toward units of service goals is similar to the progress made by the midpoint in
FY2014-2015. While OFCY community-based programs are generally on track to provide their
anticipated levels of service to participants, programs in the newest funding strategy, Safe
Community Spaces for LGBTQ Youth, continued to have difficulty recruiting youth and providing
anticipated levels of service. In addition, the level and types of service provided to youth continued to
vary, with younger school-aged youth more likely to receive more hours of service and participate in
academic services, while older youth were more likely to participate in youth leadership and civic
engagement activities and vocational training. Demonstrating the different program models offered
across OFCY’s funding portfolio, the level of service continues to vary across funding area and
funding strategy.
The FY2015-2016 Mid-Year report builds on the previous report with some new observations. For
example, we observed that the type of service offered to participants in FY2015-2016 varied by
program budget size. Programs with smaller budgets tended to offer services in art and culture, civic
engagement and youth leadership, and family engagement, while larger programs tended to offer
more hours of academic support, health and recreation, life skills, support services, and vocational
training. This report also includes information on adult participants of OFCY programs, most of whom
are enrolled in Parent and Child Engagement in Early Learning and Development programs. While
these programs served a diverse group of predominantly female parents, the demographic
composition of parents varied significantly across programs, suggesting that playgroup programs
often target specific populations.
18 | Prepared by Social Policy Research Associates
Moving forward, the Final Report will explore these themes in more depth by including information
from in-depth interviews, focus groups, and program observations to deepen our analysis of program
quality and surface best practices. We will also explore progress towards outcomes using the
participant survey data.

19 | Prepared by Social Policy Research Associates
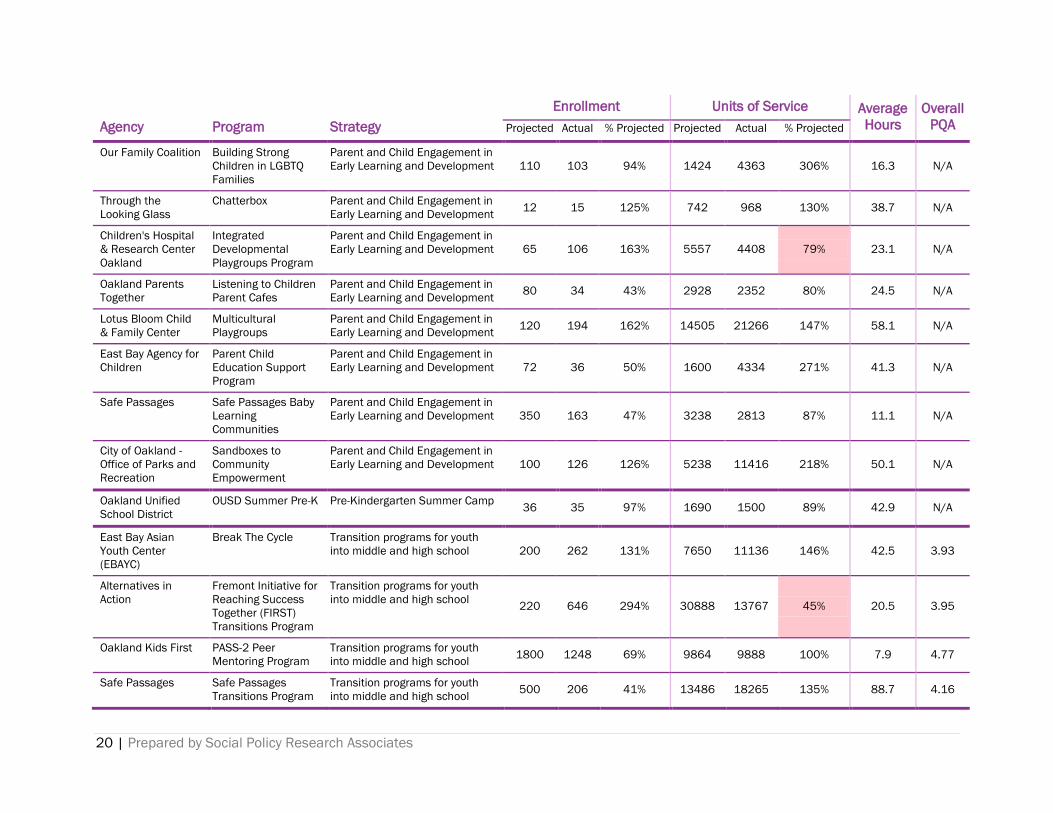
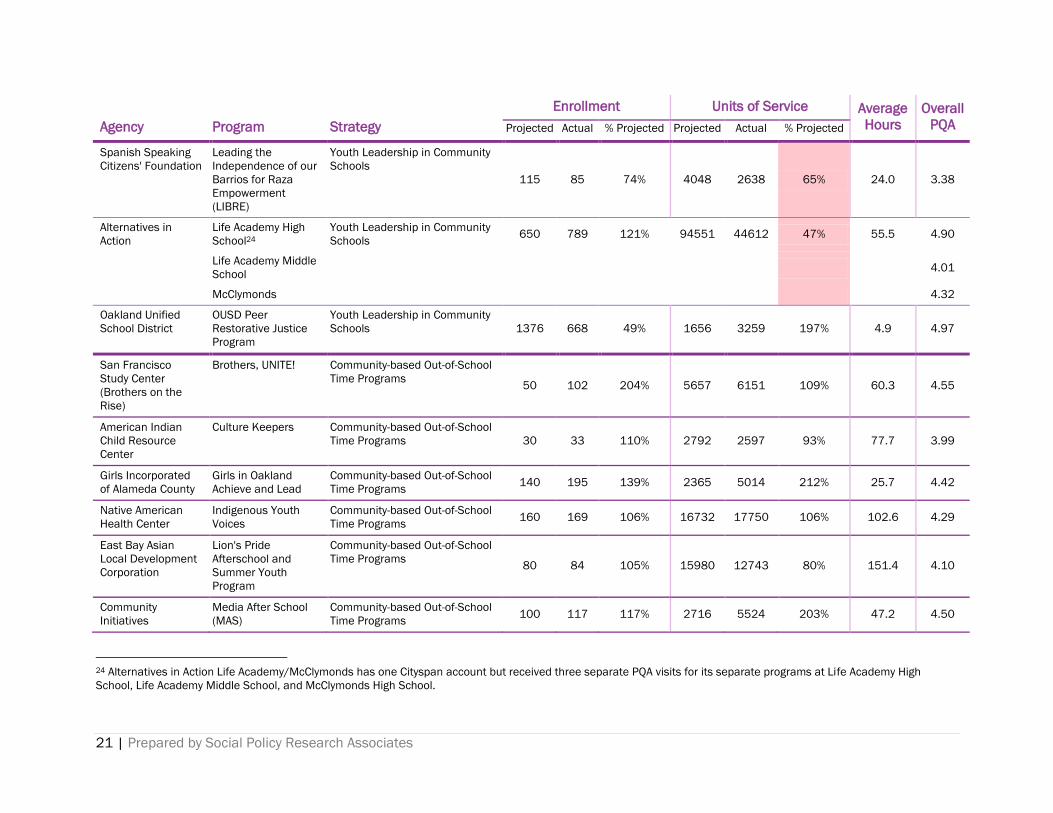
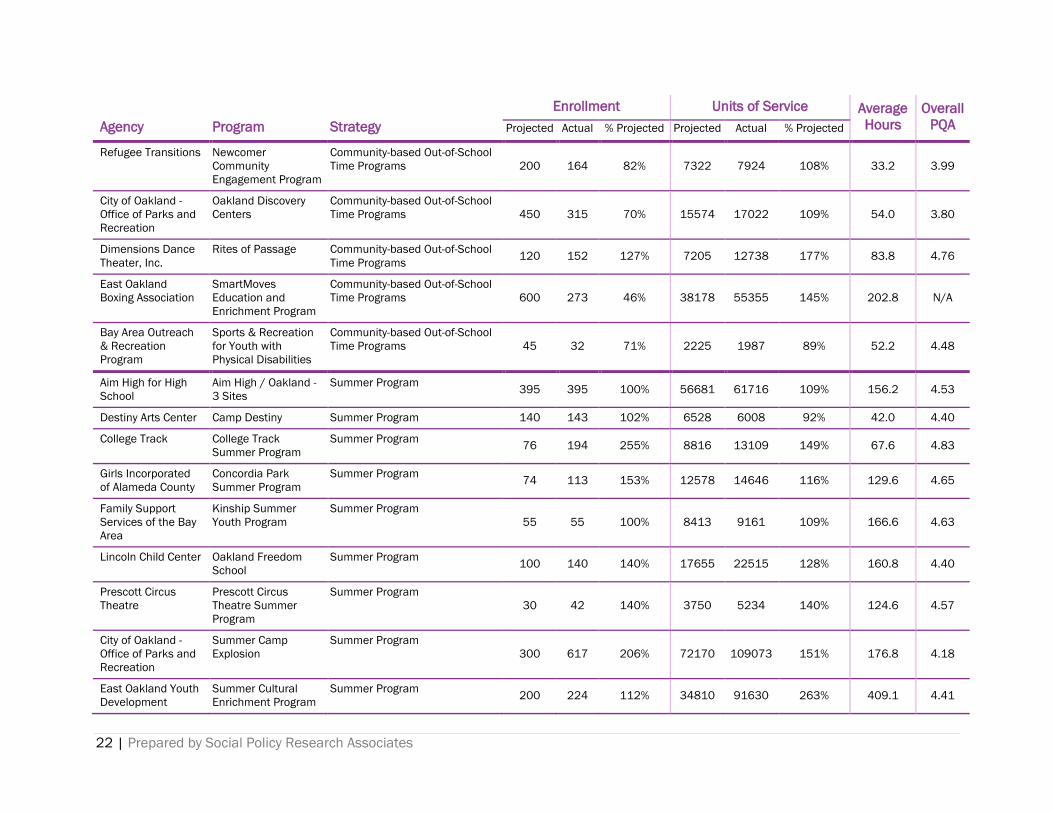
APPENDIX 1: PROGRAM-LEVEL INFORMATION
The following table provides program-level information at the mid-point of FY2015-2016, including the number of unduplicated youth who
participated in program activities and progress towards projected enrollment for the fiscal year; actual units of service and progress towards
projected units of service (for the fiscal year for programs that operate during the summer, for Q1 and Q2 for full-year programs); average
hours of service per youth participant at the mid-point of the year (includes adults for programs under the Parent and Child Engagement in
Early Learning and Development strategy); and overall PQA score, if applicable. Progress towards projected enrollment and units of service
draws on the Cityspan Administrative Reports and includes adult hours of service while enrollment only includes children and youth.
Red shading indicates programs that did not meet their enrollment or units of service targets at the mid-point of the year, defined as:
OFCY Standards for Enrollment at Mid-Year: By mid-year and end of Quarter 2, full-year programs have enrolled at least 35% of
projected unduplicated children and youth for the fiscal year. By the end of Quarter 1, programs that operate during summer have
enrolled at least 80% of projected unduplicated youth to be served for the fiscal year.23
OFCY Standards Units of Service at Mid-Year: By mid-year and end of Quarter 2, full-year programs have achieved at least 80% of
their projected Units of Service for the first half of the year. By the end of Quarter 1, programs that operate during summer have
achieved at least 80% of their projected units of service for the fiscal year.
OFCY Quality Standard.: Programs categorized as ‘emerging’ (receive an overall score below 3.0 for YPQA/SAPQA site visit) are
flagged for quality.
Agency
Program
Strategy
Enrollment Units of Service Average
Hours Projected Actual % Projected Projected Actual % Projected
Lincoln Child Center Early Childhood Mental
Health Consultation
Mental Health and Developmental
Consultations in Early Care and Education 350 320 91% 1186 1020 86% 42.0
Jewish Family &
Children's Services
of the East Bay
Integrated Early Childhood
Consultation Program
Mental Health and Developmental
Consultations in Early Care and Education 728 894 123% 1514 2113 140% 15.3
Family Paths The Early Childhood Mental
Health Collaborative
Mental Health and Developmental
Consultations in Early Care and Education 1148 850 74% 1592 1567 98% 11.2
Note: Units of Service for Mental Health and Developmental Consultations in Early Care and Education programs represent consultation
hours provided at sites instead of service hours each child received.
23 During FY2015-2016, there were 15 programs that operated during the summer: 10 programs under the Summer funding strategy as well as 3 Youth Career and
Workforce Development programs (Exploring College & Career Options in Oakland (ECCO!), Career Try-Out, and Hack the Hood Summer Boot Camp), 1 Youth Leadership
and Community Safety Program (Friday Night in the Park Program Support), and the Pre-K Summer Camp.
20 | Prepared by Social Policy Research Associates
Agency
Program
Strategy
Enrollment Units of Service Average
Hours
Overall
PQA Projected Actual % Projected Projected Actual % Projected
Our Family Coalition Building Strong
Children in LGBTQ
Families
Parent and Child Engagement in
Early Learning and Development 110 103 94% 1424 4363 306% 16.3 N/A
Through the
Looking Glass
Chatterbox Parent and Child Engagement in
Early Learning and Development 12 15 125% 742 968 130% 38.7 N/A
Children's Hospital
& Research Center
Oakland
Integrated
Developmental
Playgroups Program
Parent and Child Engagement in
Early Learning and Development 65 106 163% 5557 4408 79% 23.1 N/A
Oakland Parents
Together
Listening to Children
Parent Cafes
Parent and Child Engagement in
Early Learning and Development 80 34 43% 2928 2352 80% 24.5 N/A
Lotus Bloom Child
& Family Center
Multicultural
Playgroups
Parent and Child Engagement in
Early Learning and Development 120 194 162% 14505 21266 147% 58.1 N/A
East Bay Agency for
Children
Parent Child
Education Support
Program
Parent and Child Engagement in
Early Learning and Development 72 36 50% 1600 4334 271% 41.3 N/A
Safe Passages Safe Passages Baby
Learning
Communities
Parent and Child Engagement in
Early Learning and Development 350 163 47% 3238 2813 87% 11.1 N/A
City of Oakland -
Office of Parks and
Recreation
Sandboxes to
Community
Empowerment
Parent and Child Engagement in
Early Learning and Development 100 126 126% 5238 11416 218% 50.1 N/A
Oakland Unified
School District
OUSD Summer Pre-K Pre-Kindergarten Summer Camp 36 35 97% 1690 1500 89% 42.9 N/A
East Bay Asian
Youth Center
(EBAYC)
Break The Cycle Transition programs for youth
into middle and high school 200 262 131% 7650 11136 146% 42.5 3.93
Alternatives in
Action
Fremont Initiative for
Reaching Success
Together (FIRST)
Transitions Program
Transition programs for youth
into middle and high school 220 646 294% 30888 13767 45% 20.5 3.95
Oakland Kids First PASS-2 Peer
Mentoring Program
Transition programs for youth
into middle and high school 1800 1248 69% 9864 9888 100% 7.9 4.77
Safe Passages Safe Passages
Transitions Program
Transition programs for youth
into middle and high school 500 206 41% 13486 18265 135% 88.7 4.16
21 | Prepared by Social Policy Research Associates
Agency
Program
Strategy
Enrollment Units of Service Average
Hours
Overall
PQA Projected Actual % Projected Projected Actual % Projected
Spanish Speaking
Citizens' Foundation
Leading the
Independence of our
Barrios for Raza
Empowerment
(LIBRE)
Youth Leadership in Community
Schools
115 85 74% 4048 2638 65% 24.0 3.38
Alternatives in
Action
Life Academy High
School24
Youth Leadership in Community
Schools 650 789 121% 94551 44612 47% 55.5 4.90
Life Academy Middle
School
4.01
McClymonds 4.32
Oakland Unified
School District
OUSD Peer
Restorative Justice
Program
Youth Leadership in Community
Schools 1376 668 49% 1656 3259 197% 4.9 4.97
San Francisco
Study Center
(Brothers on the
Rise)
Brothers, UNITE! Community-based Out-of-School
Time Programs 50 102 204% 5657 6151 109% 60.3 4.55
American Indian
Child Resource
Center
Culture Keepers Community-based Out-of-School
Time Programs 30 33 110% 2792 2597 93% 77.7 3.99
Girls Incorporated
of Alameda County
Girls in Oakland
Achieve and Lead
Community-based Out-of-School
Time Programs 140 195 139% 2365 5014 212% 25.7 4.42
Native American
Health Center
Indigenous Youth
Voices
Community-based Out-of-School
Time Programs 160 169 106% 16732 17750 106% 102.6 4.29
East Bay Asian
Local Development
Corporation
Lion's Pride
Afterschool and
Summer Youth
Program
Community-based Out-of-School
Time Programs 80 84 105% 15980 12743 80% 151.4 4.10
Community
Initiatives
Media After School
(MAS)
Community-based Out-of-School
Time Programs 100 117 117% 2716 5524 203% 47.2 4.50
24 Alternatives in Action Life Academy/McClymonds has one Cityspan account but received three separate PQA visits for its separate programs at Life Academy High
School, Life Academy Middle School, and McClymonds High School.
22 | Prepared by Social Policy Research Associates
Agency
Program
Strategy
Enrollment Units of Service Average
Hours
Overall
PQA Projected Actual % Projected Projected Actual % Projected
Refugee Transitions Newcomer
Community
Engagement Program
Community-based Out-of-School
Time Programs 200 164 82% 7322 7924 108% 33.2 3.99
City of Oakland -
Office of Parks and
Recreation
Oakland Discovery
Centers
Community-based Out-of-School
Time Programs 450 315 70% 15574 17022 109% 54.0 3.80
Dimensions Dance
Theater, Inc.
Rites of Passage Community-based Out-of-School
Time Programs 120 152 127% 7205 12738 177% 83.8 4.76
East Oakland
Boxing Association
SmartMoves
Education and
Enrichment Program
Community-based Out-of-School
Time Programs 600 273 46% 38178 55355 145% 202.8 N/A
Bay Area Outreach
& Recreation
Program
Sports & Recreation
for Youth with
Physical Disabilities
Community-based Out-of-School
Time Programs 45 32 71% 2225 1987 89% 52.2 4.48
Aim High for High
School
Aim High / Oakland -
3 Sites
Summer Program 395 395 100% 56681 61716 109% 156.2 4.53
Destiny Arts Center Camp Destiny Summer Program 140 143 102% 6528 6008 92% 42.0 4.40
College Track College Track
Summer Program
Summer Program 76 194 255% 8816 13109 149% 67.6 4.83
Girls Incorporated
of Alameda County
Concordia Park
Summer Program
Summer Program 74 113 153% 12578 14646 116% 129.6 4.65
Family Support
Services of the Bay
Area
Kinship Summer
Youth Program
Summer Program
55 55 100% 8413 9161 109% 166.6 4.63
Lincoln Child Center Oakland Freedom
School
Summer Program 100 140 140% 17655 22515 128% 160.8 4.40
Prescott Circus
Theatre
Prescott Circus
Theatre Summer
Program
Summer Program
30 42 140% 3750 5234 140% 124.6 4.57
City of Oakland -
Office of Parks and
Recreation
Summer Camp
Explosion
Summer Program
300 617 206% 72170 109073 151% 176.8 4.18
East Oakland Youth
Development
Summer Cultural
Enrichment Program
Summer Program 200 224 112% 34810 91630 263% 409.1 4.41
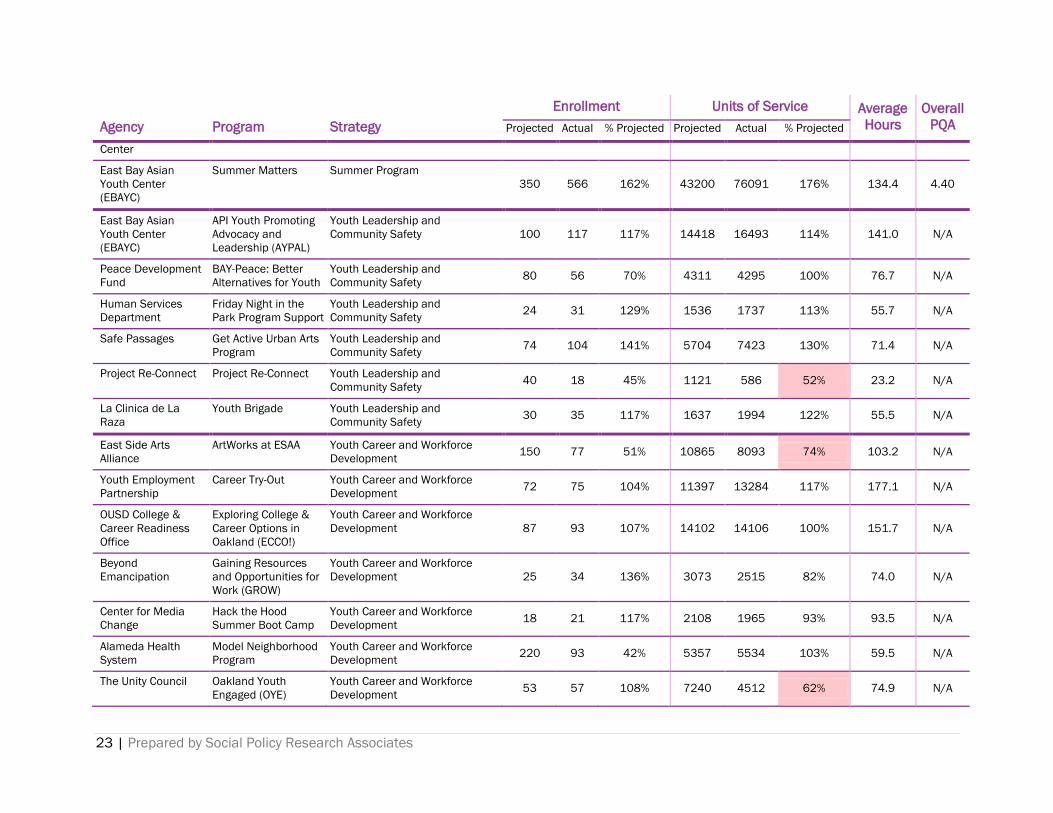
23 | Prepared by Social Policy Research Associates
Agency
Program
Strategy
Enrollment Units of Service Average
Hours
Overall
PQA Projected Actual % Projected Projected Actual % Projected
Center
East Bay Asian
Youth Center
(EBAYC)
Summer Matters Summer Program
350 566 162% 43200 76091 176% 134.4 4.40
East Bay Asian
Youth Center
(EBAYC)
API Youth Promoting
Advocacy and
Leadership (AYPAL)
Youth Leadership and
Community Safety 100 117 117% 14418 16493 114% 141.0 N/A
Peace Development
Fund
BAY-Peace: Better
Alternatives for Youth
Youth Leadership and
Community Safety 80 56 70% 4311 4295 100% 76.7 N/A
Human Services
Department
Friday Night in the
Park Program Support
Youth Leadership and
Community Safety 24 31 129% 1536 1737 113% 55.7 N/A
Safe Passages Get Active Urban Arts
Program
Youth Leadership and
Community Safety 74 104 141% 5704 7423 130% 71.4 N/A
Project Re-Connect Project Re-Connect Youth Leadership and
Community Safety 40 18 45% 1121 586 52% 23.2 N/A
La Clinica de La
Raza
Youth Brigade Youth Leadership and
Community Safety 30 35 117% 1637 1994 122% 55.5 N/A
East Side Arts
Alliance
ArtWorks at ESAA Youth Career and Workforce
Development 150 77 51% 10865 8093 74% 103.2 N/A
Youth Employment
Partnership
Career Try-Out Youth Career and Workforce
Development 72 75 104% 11397 13284 117% 177.1 N/A
OUSD College &
Career Readiness
Office
Exploring College &
Career Options in
Oakland (ECCO!)
Youth Career and Workforce
Development 87 93 107% 14102 14106 100% 151.7 N/A
Beyond
Emancipation
Gaining Resources
and Opportunities for
Work (GROW)
Youth Career and Workforce
Development 25 34 136% 3073 2515 82% 74.0 N/A
Center for Media
Change
Hack the Hood
Summer Boot Camp
Youth Career and Workforce
Development 18 21 117% 2108 1965 93% 93.5 N/A
Alameda Health
System
Model Neighborhood
Program
Youth Career and Workforce
Development 220 93 42% 5357 5534 103% 59.5 N/A
The Unity Council Oakland Youth
Engaged (OYE)
Youth Career and Workforce
Development 53 57 108% 7240 4512 62% 74.9 N/A

24 | Prepared by Social Policy Research Associates
Agency
Program
Strategy
Enrollment Units of Service Average
Hours
Overall
PQA Projected Actual % Projected Projected Actual % Projected
Juma Ventures Pathways to
Advancement
Youth Career and Workforce
Development 67 86 128% 3577 3020 84% 35.1 N/A
Youth Radio Pathways to Digital Youth Career and Workforce
Development 70 89 127% 7146 8106 113% 91.1 N/A
Alta Bates Summit
Foundation
Youth Bridge Career
and Workforce
Development
Program
Youth Career and Workforce
Development 90 118 131% 14664 16708 114% 141.6 N/A
College Track College Track
Oakland
Academic Support for Older
Youth 276 285 103% 10601 15101 142% 53.0 4.67
Youth Radio Pathways to Higher
Education and
Careers
Academic Support for Older
Youth 80 145 181% 2070 2230 108% 15.4 4.67
Centro Legal de la
Raza
Youth Law Academy Academic Support for Older
Youth 74 63 85% 1484 1491 100% 23.6 N/A
Youth Together, Inc. Youth Together's
Academic Support For
Older Youth
Academic Support for Older
Youth 203 232 114% 1792 2294 128% 9.9 4.17
Health Initiatives for
Youth (HIFY)
Health Initiatives for
Youth's LGBTQIQ
Youth Safe Space
Initiative
Safe Community Spaces for
LGBTQ Youth 85 66 78% 698 283 41% 3.9 2.94
La Clinica de La
Raza
Juntos Safe Community Spaces for
LGBTQ Youth 73 14 19% 651 280 43% 20.0 4.45
Destiny Arts Center Moving in the
Movement
Safe Community Spaces for
LGBTQ Youth 29 11 38% 848 602 71% 54.7 N/A
AIDS Project East
Bay
Save Our LGBTI-Youth
(SOL)
Safe Community Spaces for
LGBTQ Youth 150 48 32% 1040 1302 125% 26.7 4.05
Youth UpRising YU's Queer & Allies
Initiative
Safe Community Spaces for
LGBTQ Youth 118 33 28% 429 515 120% 15.3 3.97

2015-16 School-Based After School Interim Evaluation Report P R E P A R E D F O R T H E O A K L A N D F U N D F O R C H I L D R E N A N D Y O U T H
M A R C H 2 0 1 6
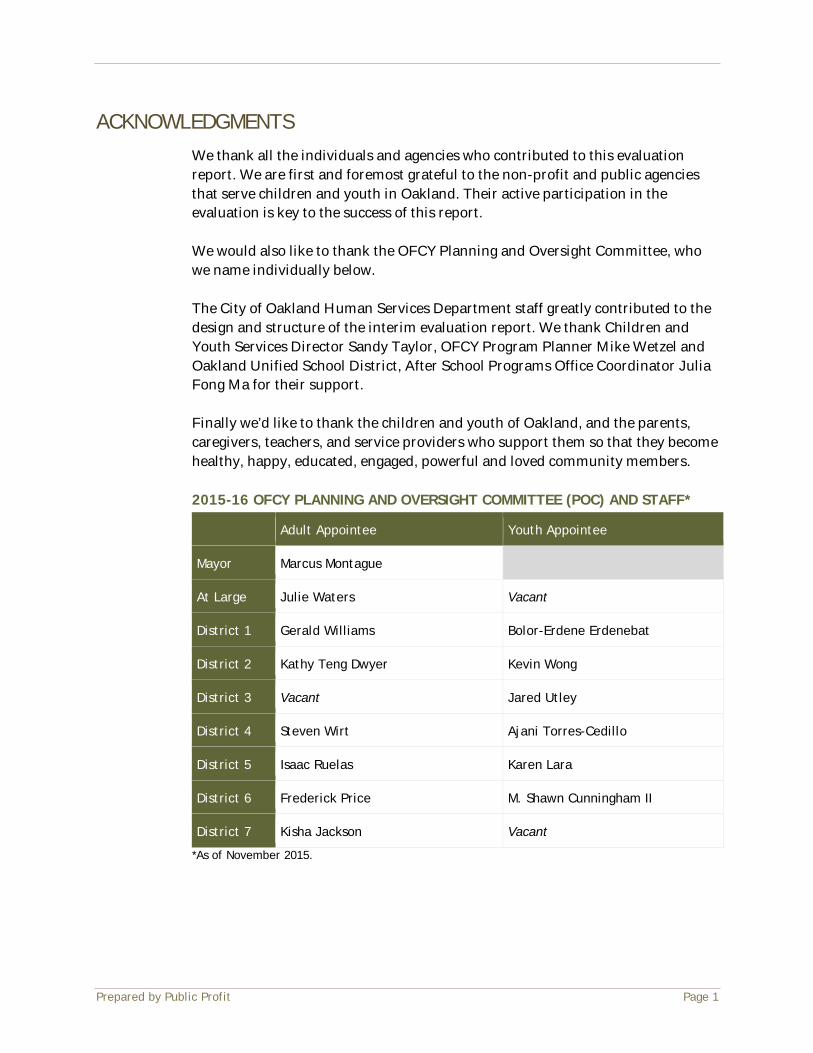
Prepared by Public Profit Page 1
ACKNOWLEDGMENTS We thank all the individuals and agencies who contributed to this evaluation report. We are first and foremost grateful to the non-profit and public agencies that serve children and youth in Oakland. Their active participation in the evaluation is key to the success of this report. We would also like to thank the OFCY Planning and Oversight Committee, who we name individually below. The City of Oakland Human Services Department staff greatly contributed to the design and structure of the interim evaluation report. We thank Children and Youth Services Director Sandy Taylor, OFCY Program Planner Mike Wetzel and Oakland Unified School District, After School Programs Office Coordinator Julia Fong Ma for their support. Finally we’d like to thank the children and youth of Oakland, and the parents, caregivers, teachers, and service providers who support them so that they become healthy, happy, educated, engaged, powerful and loved community members. 2015-16 OFCY PLANNING AND OVERSIGHT COMMITTEE (POC) AND STAFF*
Adult Appointee Youth Appointee
Mayor Marcus Montague
At Large Julie Waters Vacant
District 1 Gerald Williams Bolor-Erdene Erdenebat
District 2 Kathy Teng Dwyer Kevin Wong
District 3 Vacant Jared Utley
District 4 Steven Wirt Ajani Torres-Cedillo
District 5 Isaac Ruelas Karen Lara
District 6 Frederick Price M. Shawn Cunningham II
District 7 Kisha Jackson Vacant
*As of November 2015.

Prepared by Public Profit Page 2
O F C Y S T A F F
Sandra Taylor – Children and Youth Services Manager Mike Wetzel – Program Planner Scott Kim – Program Analyst Terry Hill – Program Analyst Debra Chester – Program Analyst Tabia Norris – Administrative Assistant Sachelle Heavens – Administrative Assistant
P U B L I C P R O F I T E V A L U A T I O N T E A M
Corey Newhouse – Project Director Femi Vance – Senior Research Associate Julie Lo – Senior Research Assistant Amy Goldman – Research Assistant Saili Willis – Office Manager
This report evaluates the performance and quality of the Oakland Fund for Children and Youth grantees for the first half of the 2015-16 program year.
This report is prepared for the Planning and Oversight Committee of the
Oakland Fund for Children and Youth.

Prepared by Public Profit Page 3
Table of Contents
ACKNOWLEDGMENTS ....................................................................................... 1
OVERVIEW OF THE OFCY INTERIM GRANTEE EVALUATION REPORT ............................... 4 SCHOOL-BASED AFTER SCHOOL PROGRAMS ................................................................... 4 ABOUT THE INTERIM REPORT ................................................................................. 5
YOUTH SERVED .............................................................................................. 6 YOUTH SERVED BY HOME ZIP CODE ........................................................................... 6 GENDER AND RACE/ETHNICITY ............................................................................... 7
PROGRAM PERFORMANCE ................................................................................. 8
POINT-OF-SERVICE QUALITY ............................................................................ 12
APPENDIX A. PROGRAM QUALITY ASSESSMENT ...................................................... 20 SITE VISITS USING THE SAPQA & YPQA TOOLS ............................................................ 20 PROGRAM QUALITY ASSESSMENT (PQA) DOMAINS .......................................................... 20 PROGRAM QUALITY ASSESSMENT SCORING .................................................................. 21 POINT-OF-SERVICE QUALITY CATEGORIES ................................................................... 22
APPENDIX B. PARTICIPANTS’ HOME ZIP CODES ...................................................... 23

Prepared by Public Profit Page 4
OVERVIEW OF THE OFCY INTERIM GRANTEE EVALUATION REPORT
School-Based After School Programs
The Oakland Fund for Children and Youth (OFCY), through Strategy Area 2: Student Success in School, funds 62 school-based after school programs that collectively support children and youth in their development towards becoming healthy, happy, educated, engaged, powerful and loved community members. The after school programs funded through OFCY Strategy Area 2 are the focus of this Interim Report. . FIGURE 1: THE OFCY SCHOOL BASED AFTER SCHOOL STRATEGY
OFCY Strategy Area 2: Student Success in School
School-based after school programming for elementary & middle schools
Support for high-quality enrichment, academic, and family support programming through school-based after school programs at elementary and middle school sites receiving state After School Education and Safety (ASES) funding.
Image: Bay Area Community Resources at Howard Elementary TABLE 1: OFCY SCHOOL-BASED AFTER SCHOOL PROGRAMS BY GRADE LEVEL SERVED
Grade Level Number of Programs
Elementary Schools 44
Middle Schools 18
Total 62
Source: Program roster provided by OFCY.
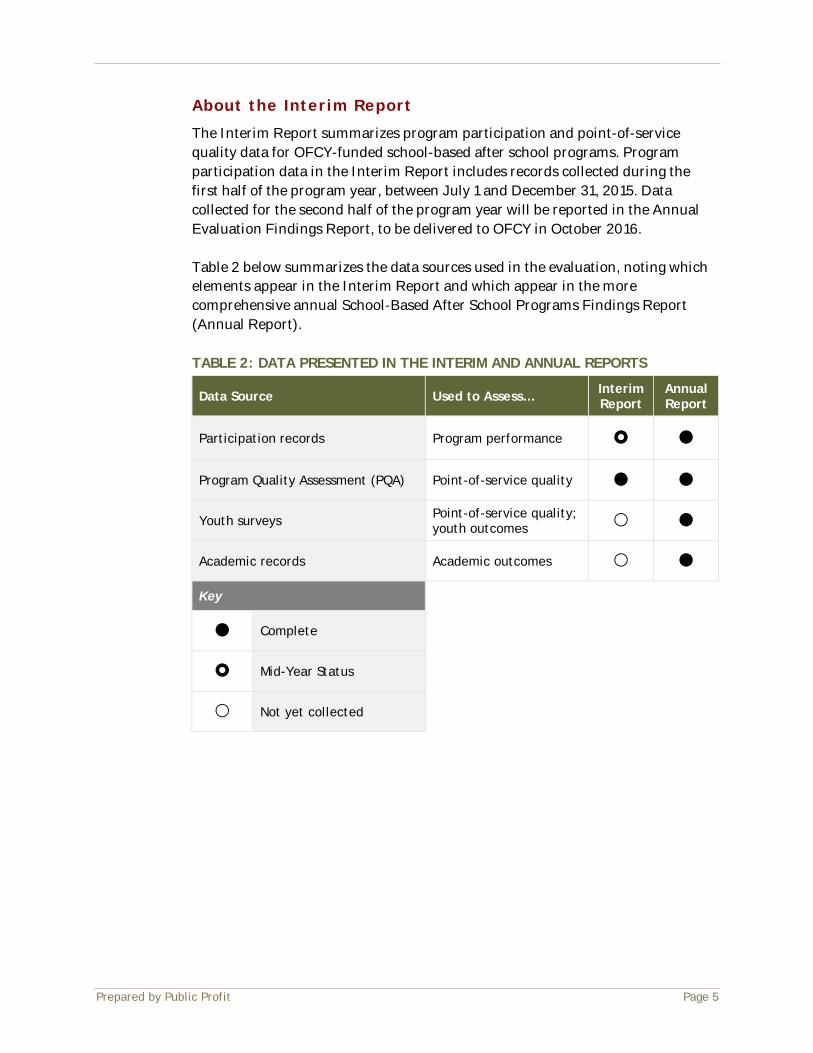
Prepared by Public Profit Page 5
About the Interim Report
The Interim Report summarizes program participation and point-of-service quality data for OFCY-funded school-based after school programs. Program participation data in the Interim Report includes records collected during the first half of the program year, between July 1 and December 31, 2015. Data collected for the second half of the program year will be reported in the Annual Evaluation Findings Report, to be delivered to OFCY in October 2016. Table 2 below summarizes the data sources used in the evaluation, noting which elements appear in the Interim Report and which appear in the more comprehensive annual School-Based After School Programs Findings Report (Annual Report). TABLE 2: DATA PRESENTED IN THE INTERIM AND ANNUAL REPORTS
Data Source Used to Assess… Interim Report
Annual Report
Participation records Program performance � �
Program Quality Assessment (PQA) Point-of-service quality � �
Youth surveys Point-of-service quality; youth outcomes � �
Academic records Academic outcomes � �
Key
� Complete
� Mid-Year Status
� Not yet collected

Prepared by Public Profit Page 6
YOUTH SERVED Youth Served by Home Zip Code
As shown in Figure 2, nearly three-quarters (71%) of participants reside in five Zip codes: 94601, 94621, 94603, 94605 and 94606. The remaining 29% of participants reside in all other zip codes served by OFCY school-based after school grantees. FIGURE 2: PROPORTION OF YOUTH SERVED BY ZIP CODE
Source: Cityspan records for 9,106 youth who attended an OFCY-funded school-based after school program between July and December 2015 and had a valid zip code available.
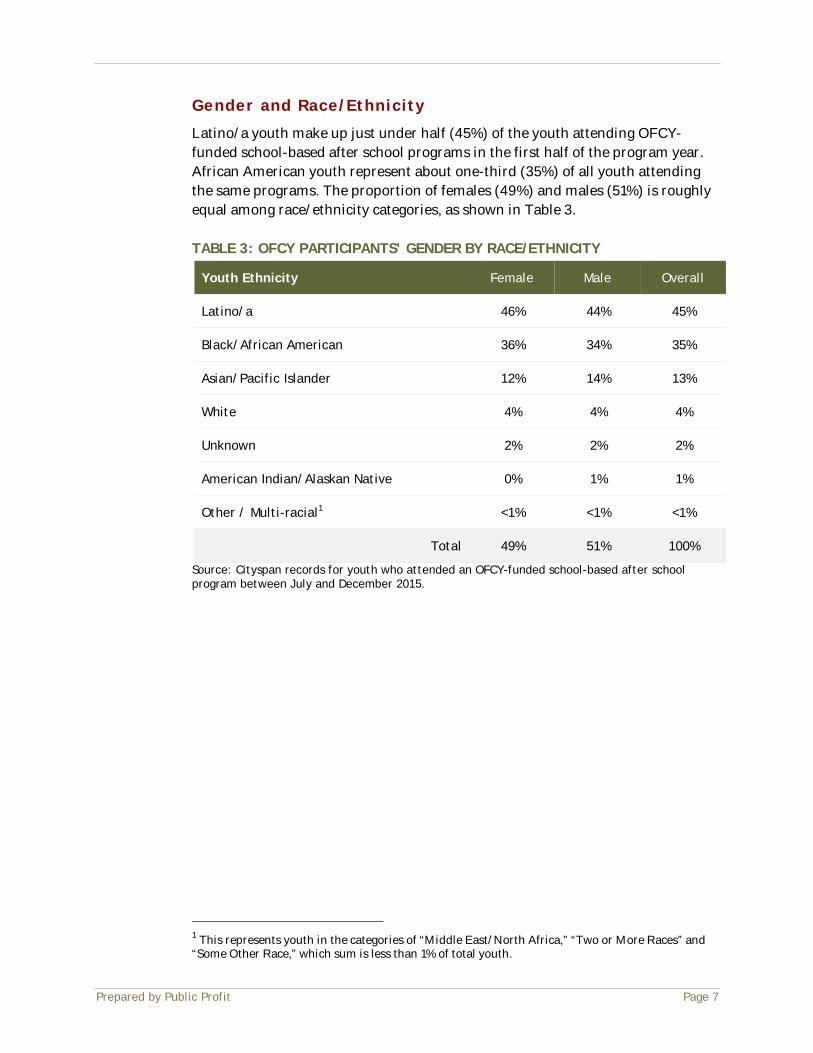
Prepared by Public Profit Page 7
Gender and Race/Ethnicity
Latino/a youth make up just under half (45%) of the youth attending OFCY-funded school-based after school programs in the first half of the program year. African American youth represent about one-third (35%) of all youth attending the same programs. The proportion of females (49%) and males (51%) is roughly equal among race/ethnicity categories, as shown in Table 3. TABLE 3: OFCY PARTICIPANTS’ GENDER BY RACE/ETHNICITY
Youth Ethnicity Female Male Overall
Latino/a 46% 44% 45%
Black/African American 36% 34% 35%
Asian/Pacific Islander 12% 14% 13%
White 4% 4% 4%
Unknown 2% 2% 2%
American Indian/Alaskan Native 0% 1% 1%
Other / Multi-racial1 <1% <1% <1%
Total 49% 51% 100%
Source: Cityspan records for youth who attended an OFCY-funded school-based after school program between July and December 2015.
1 This represents youth in the categories of “Middle East/North Africa,” “Two or More Races” and “Some Other Race,” which sum is less than 1% of total youth.

Prepared by Public Profit Page 8
PROGRAM PERFORMANCE School-based after school programs set goals for the number of youth they plan to serve each grant year as one measure of the programs’ reach in the community. As a whole, OFCY school-based after school grantees are exceeding their targeted number of youth. All (100%) of the 62 programs met or exceeded their minimum mid-year threshold for the number of enrolled youth. Similarly, nearly all (97%) programs met or exceeded mid-year target of their Units of Service goals. Table 4 on the following page provides an overview of program performance for the first half of the program year, between July 1 and December 31, 2015. Program performance is assessed by the following two measures:
• Enrollment - The number of children and youth served. In the course of
the program year, programs aim to reach their full target enrollment; 80% is the minimum performance threshold. At the mid-point in the school year, programs that reached a mid-year target of 35% of their total annual enrollment are considered to be on-track.
• Units of Service (UOS) - The number of service hours provided to
youth during the program year, a key indicator of program capacity. School-based programs should reach 100% of their mid-year UOS goal; 80% is the minimum performance threshold.
At the mid-point of the program year, all 62 programs have met or exceeded the minimum enrollment standard. Moreover, 60 of 62 programs have met or exceeded the mid-year target of their UOS goals.
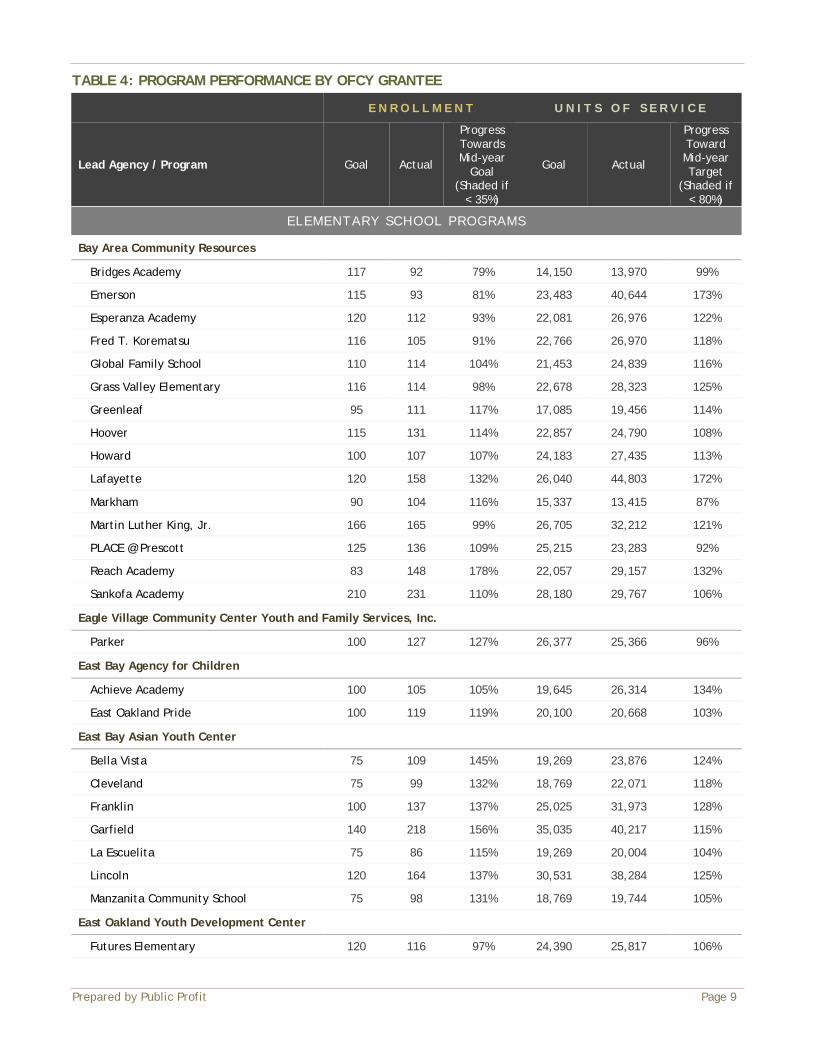
Prepared by Public Profit Page 9
TABLE 4: PROGRAM PERFORMANCE BY OFCY GRANTEE
E N R O L L M E N T U N I T S O F S E R V I C E
Lead Agency / Program Goal Actual
Progress Towards Mid-year
Goal (Shaded if
< 35%)
Goal Actual
Progress Toward Mid-year Target
(Shaded if < 80%)
ELEMENTARY SCHOOL PROGRAMS
Bay Area Community Resources
Bridges Academy 117 92 79% 14,150 13,970 99%
Emerson 115 93 81% 23,483 40,644 173%
Esperanza Academy 120 112 93% 22,081 26,976 122%
Fred T. Korematsu 116 105 91% 22,766 26,970 118%
Global Family School 110 114 104% 21,453 24,839 116%
Grass Valley Elementary 116 114 98% 22,678 28,323 125%
Greenleaf 95 111 117% 17,085 19,456 114%
Hoover 115 131 114% 22,857 24,790 108%
Howard 100 107 107% 24,183 27,435 113%
Lafayette 120 158 132% 26,040 44,803 172%
Markham 90 104 116% 15,337 13,415 87%
Martin Luther King, Jr. 166 165 99% 26,705 32,212 121%
PLACE @ Prescott 125 136 109% 25,215 23,283 92%
Reach Academy 83 148 178% 22,057 29,157 132%
Sankofa Academy 210 231 110% 28,180 29,767 106%
Eagle Village Community Center Youth and Family Services, Inc.
Parker 100 127 127% 26,377 25,366 96%
East Bay Agency for Children
Achieve Academy 100 105 105% 19,645 26,314 134%
East Oakland Pride 100 119 119% 20,100 20,668 103%
East Bay Asian Youth Center
Bella Vista 75 109 145% 19,269 23,876 124%
Cleveland 75 99 132% 18,769 22,071 118%
Franklin 100 137 137% 25,025 31,973 128%
Garfield 140 218 156% 35,035 40,217 115%
La Escuelita 75 86 115% 19,269 20,004 104%
Lincoln 120 164 137% 30,531 38,284 125%
Manzanita Community School 75 98 131% 18,769 19,744 105%
East Oakland Youth Development Center
Futures Elementary 120 116 97% 24,390 25,817 106%

Prepared by Public Profit Page 10
E N R O L L M E N T U N I T S O F S E R V I C E
Lead Agency / Program Goal Actual
Progress Towards Mid-year
Goal (Shaded if
< 35%)
Goal Actual
Progress Toward Mid-year Target
(Shaded if < 80%)
Girls Incorporated of Alameda County
Acorn Woodland 115 112 97% 21,420 22,118 103%
Horace Mann 120 128 107% 26,864 26,265 98%
Higher Ground Neighborhood Development Corp.
Allendale 100 95 95% 21,359 19,029 89%
Brookfield 100 90 90% 19,844 17,199 87%
New Highland Academy 100 87 87% 21,275 18,897 89%
Rise Community School 100 64 64% 20,875 13,405 64%
Sobrante Park 100 93 93% 21,275 22,144 104%
Oakland Leaf Foundation
EnCompass Academy 85 193 227% 17,655 28,908 164%
International Community School 85 85 100% 9,505 15,523 163%
Learning Without Limits (Jefferson) 85 70 82% 15,758 17,449 111%
Think College Now 120 97 81% 14,385 17,241 120%
Safe Passages
Community United 120 128 107% 24,780 29,703 120%
SFBAC, Learning for Life
Carl B. Munck 130 117 90% 25,620 21,633 84%
Fruitvale 100 148 148% 24,011 28,535 119%
Laurel 84 91 108% 23,756 21,867 92%
Manzanita Seed 120 179 149% 35,594 39,733 112%
Ujimaa Foundation
Burckhalter 100 128 128% 28,987 29,209 101%
YMCA of the East Bay
Piedmont 105 103 98% 23,188 19,454 84%
Elementary School Overall/Average 4,747 5,307 112% 987,595 1,108,681 112%
MIDDLE SCHOOL PROGRAMS
Bay Area Community Resources
Alliance Academy 110 149 135% 23,395 18,432 79%
Claremont 95 224 236% 23,549 19,677 84%
Elmhurst Community Prep 220 214 97% 20,913 21,947 105%
Madison 280 307 110% 26,474 28,092 106%
Melrose Community Bridges Program 120 130 108% 23,283 20,462 88%

Prepared by Public Profit Page 11
E N R O L L M E N T U N I T S O F S E R V I C E
Lead Agency / Program Goal Actual
Progress Towards Mid-year
Goal (Shaded if
< 35%)
Goal Actual
Progress Toward Mid-year Target
(Shaded if < 80%)
Urban Promise Academy 120 267 223% 20,334 20,859 103%
Eagle Village Community Center Youth and Family Services, Inc.
Westlake 120 146 122% 17,495 23,921 137%
East Bay Asian Youth Center
Roosevelt 160 307 192% 43,040 73,632 171%
East Oakland Youth Development Center
Roots International Academy 120 182 152% 17,878 17,428 97%
Lighthouse Community Charter School
Lighthouse Community Charter 200 201 101% 25,665 28,301 110%
Oakland Leaf Foundation
ASCEND 131 144 110% 16,219 21,076 130%
Bret Harte 112 220 196% 22,347 27,803 124%
Safe Passages
Coliseum College Prep Academy 179 211 118% 10,270 18,576 181%
Edna Brewer 171 176 103% 15,154 16,834 111%
Frick 95 133 140% 7,567 9,111 120%
United For Success 120 215 179% 20,819 29,522 142%
Spanish Speaking Citizens' Foundation
Lazear Charter Academy 160 160 100% 23,827 22,247 93%
YMCA of the East Bay
West Oakland Middle School 144 159 110% 15,190 15,587 103%
Middle School Overall/Average 2,657 3,545 133% 373,416 433,505 116%
Source: Cityspan records for OFCY-funded school-based after school programs between July and December 2015.
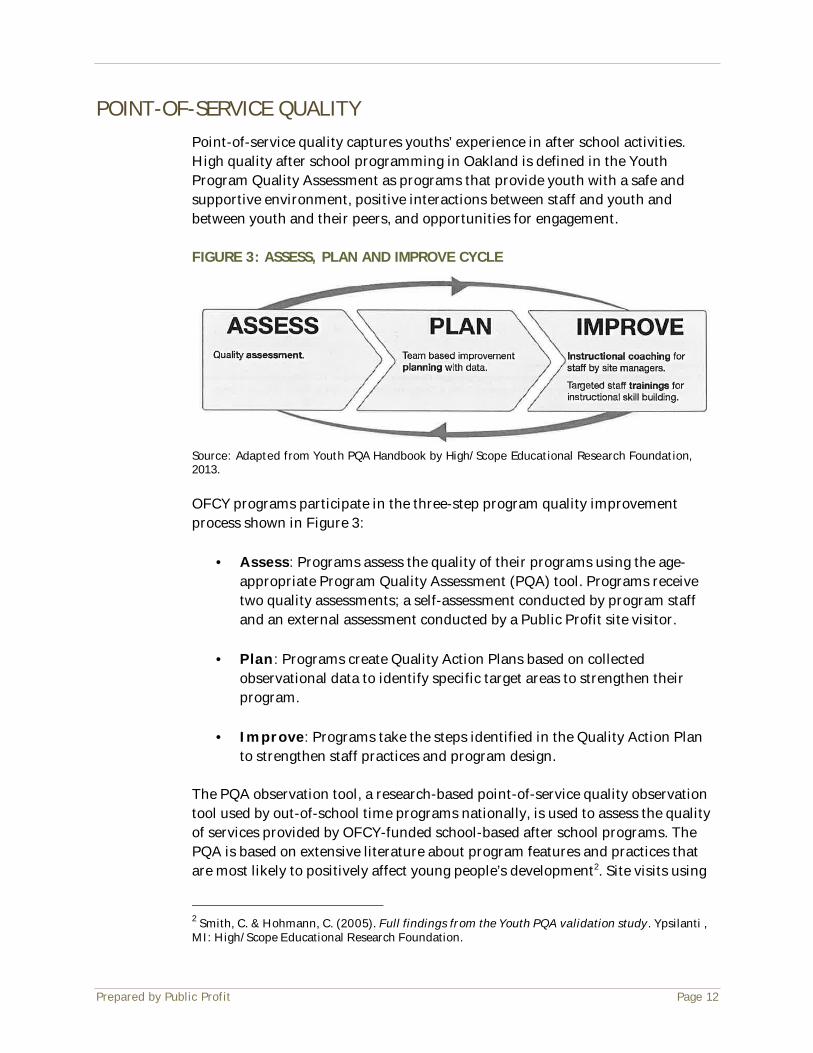
Prepared by Public Profit Page 12
POINT-OF-SERVICE QUALITY Point-of-service quality captures youths’ experience in after school activities. High quality after school programming in Oakland is defined in the Youth Program Quality Assessment as programs that provide youth with a safe and supportive environment, positive interactions between staff and youth and between youth and their peers, and opportunities for engagement.
FIGURE 3: ASSESS, PLAN AND IMPROVE CYCLE
Source: Adapted from Youth PQA Handbook by High/Scope Educational Research Foundation, 2013.
OFCY programs participate in the three-step program quality improvement process shown in Figure 3:
• Assess: Programs assess the quality of their programs using the age-
appropriate Program Quality Assessment (PQA) tool. Programs receive two quality assessments; a self-assessment conducted by program staff and an external assessment conducted by a Public Profit site visitor.
• Plan: Programs create Quality Action Plans based on collected observational data to identify specific target areas to strengthen their program.
• Improve: Programs take the steps identified in the Quality Action Plan
to strengthen staff practices and program design. The PQA observation tool, a research-based point-of-service quality observation tool used by out-of-school time programs nationally, is used to assess the quality of services provided by OFCY-funded school-based after school programs. The PQA is based on extensive literature about program features and practices that are most likely to positively affect young people’s development2. Site visits using
2 Smith, C. & Hohmann, C. (2005). Full findings from the Youth PQA validation study. Ypsilanti , MI: High/Scope Educational Research Foundation.

Prepared by Public Profit Page 13
the PQA focus on the observable behaviors of staff and youth. Public Profit site visitors are certified as statistically reliable raters by the Weikart Center for Youth Program Quality.
Public Profit conducted site visits to OFCY-funded school-based after school programs using the School-Age Program Quality Assessment (SAPQA) for programs serving elementary-age youth, and the Youth Program Quality Assessment (YPQA) for those programs serving middle school youth.3 School-based after school grantees receive one site visit during the 2015-16 cycle; at the time of this report Public Profit has conducted 62 PQA site visits between October 2015 and February 2016. Programs also conducted a self-assessment, using the SAPQA or the YPQA to supplement external site visit data. See Appendix A starting on page 20 for additional information about the PQA tools. PQA ratings of 1 (lowest rating), 3, or 5 (highest rating) are assigned based on the extent to which a particular practice is implemented. Available evidence suggests that overall school-based after school programs provide a safe environment for children and youth scoring an average of 4.86 for elementary programs and 4.73 for middle school programs. Additionally, 26 out of 62 observed programs had overall PQA scores of 4.5 or higher and are considered to be “Thriving,” indicating that they implemented research-based youth development practices consistently and well. Forty-two percent (42%) of after-school programs are in the Thriving category in 2015-16, compared to 34% the prior year. Thirty-five (35) programs had overall PQA scores between 3 and under 4.5 and are considered to be “Performing,” indicating that they are providing quality service overall and can continue to improve in specific areas. One program included in this year’s Interim Report is considered to be “Emerging” or received an overall PQA score of 3 or lower, while no programs were in the Emerging category in 2014-15. See Appendix A for additional information about the point-of-service quality categories.
3 Two programs, Parker and Sankofa, serve both elementary and middle school youth. Although they received funding as elementary-based programs, they elected to use the YPQA for their visit since they primarily serve students in 3rd grade and higher.
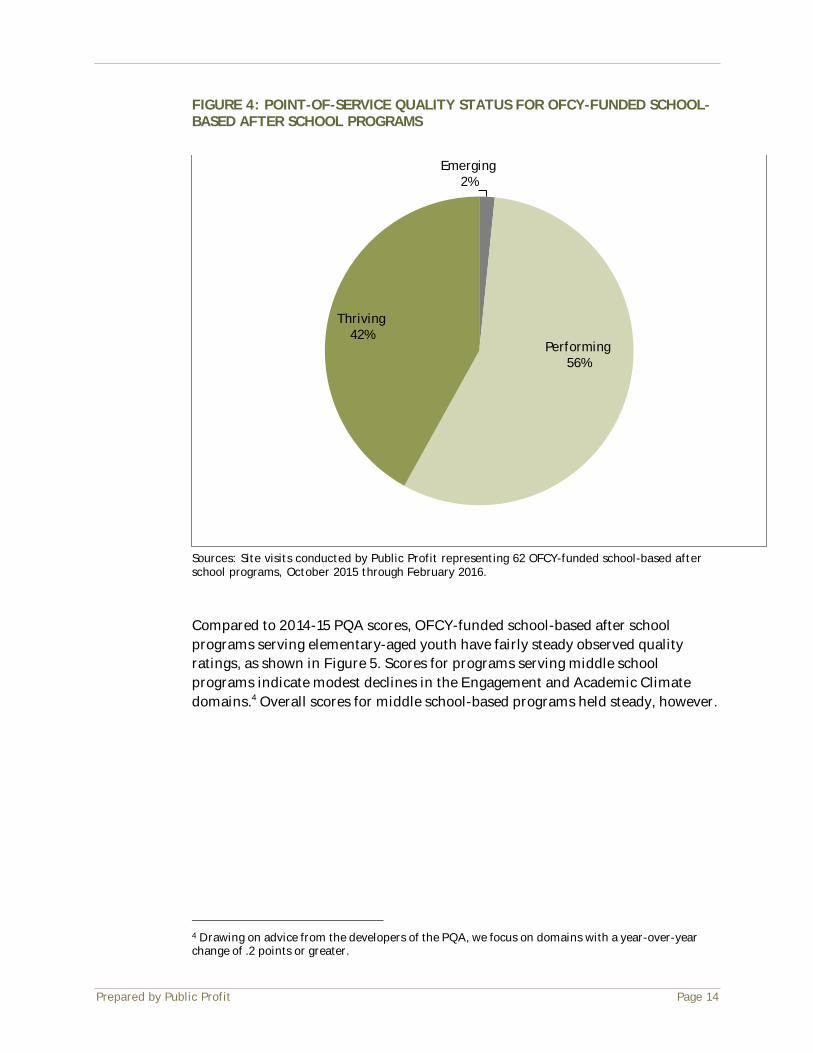
Prepared by Public Profit Page 14
FIGURE 4: POINT-OF-SERVICE QUALITY STATUS FOR OFCY-FUNDED SCHOOL-BASED AFTER SCHOOL PROGRAMS
Sources: Site visits conducted by Public Profit representing 62 OFCY-funded school-based after school programs, October 2015 through February 2016. Compared to 2014-15 PQA scores, OFCY-funded school-based after school programs serving elementary-aged youth have fairly steady observed quality ratings, as shown in Figure 5. Scores for programs serving middle school programs indicate modest declines in the Engagement and Academic Climate domains.4 Overall scores for middle school-based programs held steady, however.
4 Drawing on advice from the developers of the PQA, we focus on domains with a year-over-year change of .2 points or greater.
Emerging 2%
Performing 56%
Thriving 42%

Prepared by Public Profit Page 15
FIGURE 5: COMPARISON OF OFCY SCHOOL-BASED AFTER SCHOOL PROGRAMS BY YEAR – SAPQA
*Overall PQA scores exclude Academic Climate domain. Sources: Site visits conducted by Public Profit to OFCY-funded school-based after school programs, October 2015 through February 2016, n=42,for the 2015-2016 year and October 2014 through February 2015, n=47, for the 2014-2015 year.
2015-16 4.87
4.56
4.38
3.94
3.87
4.44
2014-15 4.84
4.38
4.14
3.87
3.71
4.31
1 2 3 4 5
I. Safe Environment
II. Supportive Environment
III. Interaction
IV. Engagement
V. Academic Climate
Overall
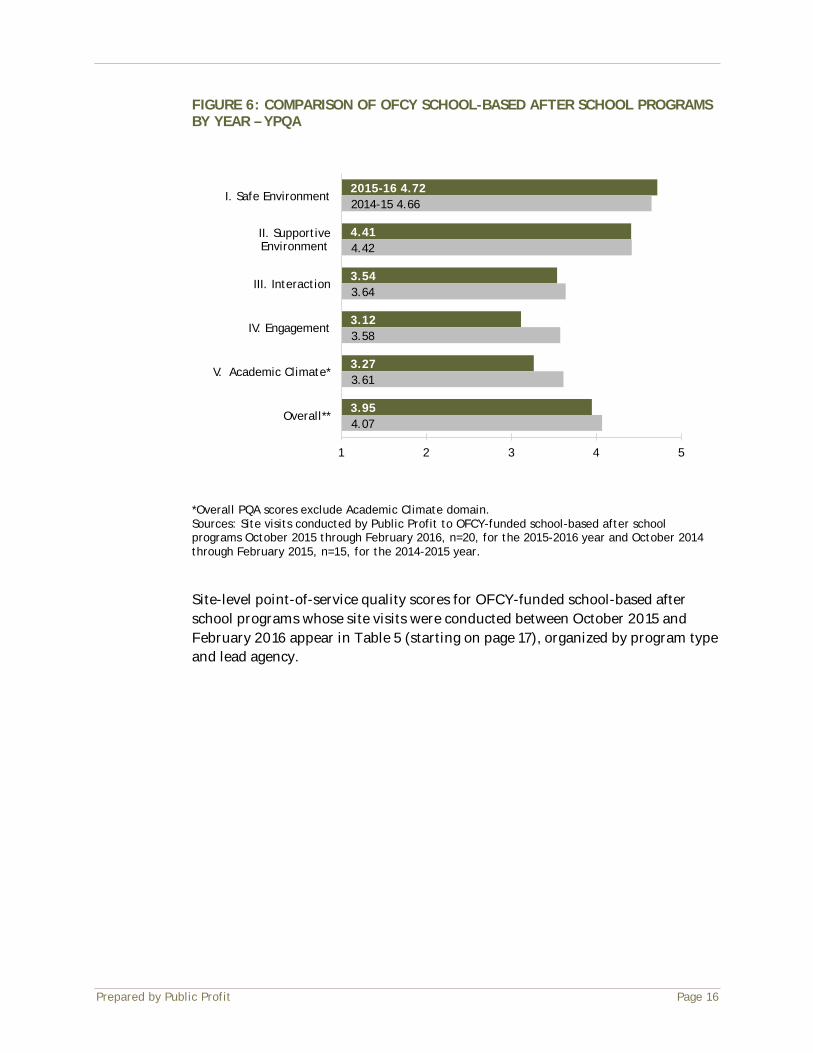
Prepared by Public Profit Page 16
FIGURE 6: COMPARISON OF OFCY SCHOOL-BASED AFTER SCHOOL PROGRAMS BY YEAR – YPQA
*Overall PQA scores exclude Academic Climate domain. Sources: Site visits conducted by Public Profit to OFCY-funded school-based after school programs October 2015 through February 2016, n=20, for the 2015-2016 year and October 2014 through February 2015, n=15, for the 2014-2015 year.
Site-level point-of-service quality scores for OFCY-funded school-based after school programs whose site visits were conducted between October 2015 and February 2016 appear in Table 5 (starting on page 17), organized by program type and lead agency.
2015-16 4.72
4.41
3.54
3.12
3.27
3.95
2014-15 4.66
4.42
3.64
3.58
3.61
4.07
1 2 3 4 5
I. Safe Environment
II. Supportive Environment
III. Interaction
IV. Engagement
V. Academic Climate*
Overall**
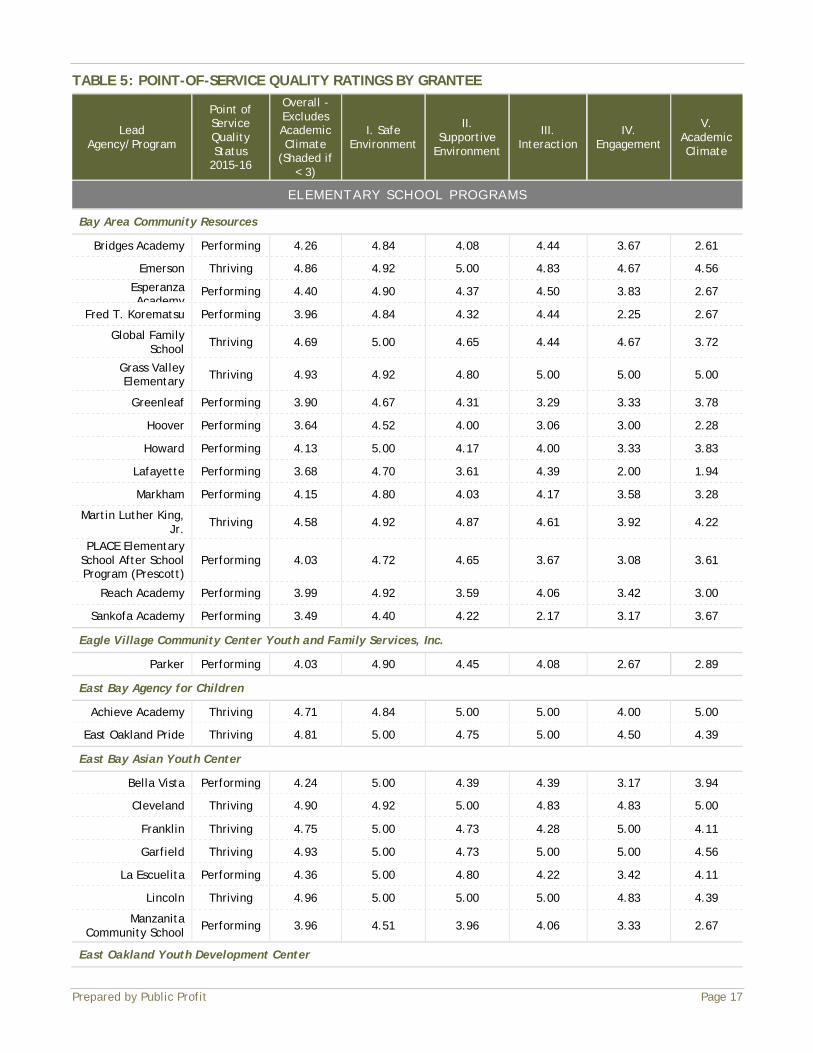
Prepared by Public Profit Page 17
TABLE 5: POINT-OF-SERVICE QUALITY RATINGS BY GRANTEE
Lead Agency/Program
Point of Service Quality Status
2015-16
Overall - Excludes Academic Climate
(Shaded if < 3)
I. Safe Environment
II. Supportive
Environment
III. Interaction
IV. Engagement
V. Academic Climate
ELEMENTARY SCHOOL PROGRAMS
Bay Area Community Resources
Bridges Academy Performing 4.26 4.84 4.08 4.44 3.67 2.61
Emerson Thriving 4.86 4.92 5.00 4.83 4.67 4.56
Esperanza Academy
Performing 4.40 4.90 4.37 4.50 3.83 2.67
Fred T. Korematsu Performing 3.96 4.84 4.32 4.44 2.25 2.67
Global Family School Thriving 4.69 5.00 4.65 4.44 4.67 3.72
Grass Valley Elementary Thriving 4.93 4.92 4.80 5.00 5.00 5.00
Greenleaf Performing 3.90 4.67 4.31 3.29 3.33 3.78
Hoover Performing 3.64 4.52 4.00 3.06 3.00 2.28
Howard Performing 4.13 5.00 4.17 4.00 3.33 3.83
Lafayette Performing 3.68 4.70 3.61 4.39 2.00 1.94
Markham Performing 4.15 4.80 4.03 4.17 3.58 3.28
Martin Luther King, Jr. Thriving 4.58 4.92 4.87 4.61 3.92 4.22
PLACE Elementary School After School Program (Prescott)
Performing 4.03 4.72 4.65 3.67 3.08 3.61
Reach Academy Performing 3.99 4.92 3.59 4.06 3.42 3.00
Sankofa Academy Performing 3.49 4.40 4.22 2.17 3.17 3.67
Eagle Village Community Center Youth and Family Services, Inc.
Parker Performing 4.03 4.90 4.45 4.08 2.67 2.89
East Bay Agency for Children
Achieve Academy Thriving 4.71 4.84 5.00 5.00 4.00 5.00
East Oakland Pride Thriving 4.81 5.00 4.75 5.00 4.50 4.39
East Bay Asian Youth Center
Bella Vista Performing 4.24 5.00 4.39 4.39 3.17 3.94
Cleveland Thriving 4.90 4.92 5.00 4.83 4.83 5.00
Franklin Thriving 4.75 5.00 4.73 4.28 5.00 4.11
Garfield Thriving 4.93 5.00 4.73 5.00 5.00 4.56
La Escuelita Performing 4.36 5.00 4.80 4.22 3.42 4.11
Lincoln Thriving 4.96 5.00 5.00 5.00 4.83 4.39
Manzanita Community School Performing 3.96 4.51 3.96 4.06 3.33 2.67
East Oakland Youth Development Center
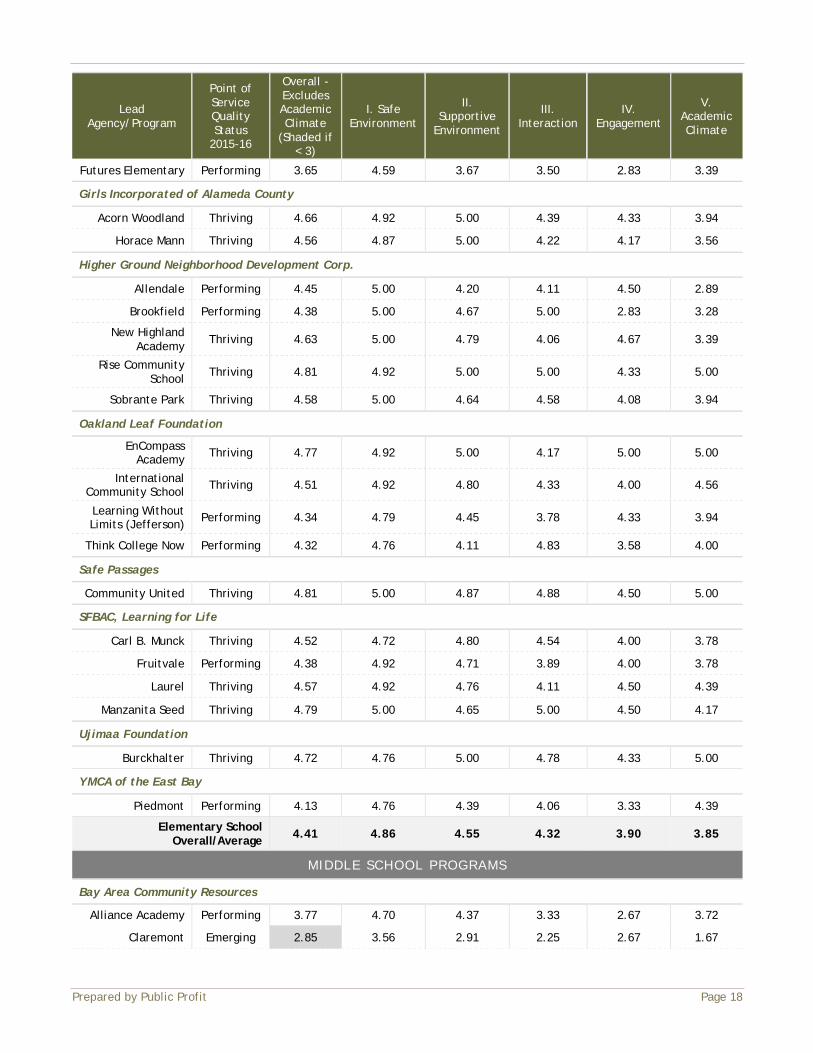
Prepared by Public Profit Page 18
Lead Agency/Program
Point of Service Quality Status
2015-16
Overall - Excludes Academic Climate
(Shaded if < 3)
I. Safe Environment
II. Supportive
Environment
III. Interaction
IV. Engagement
V. Academic Climate
Futures Elementary Performing 3.65 4.59 3.67 3.50 2.83 3.39
Girls Incorporated of Alameda County
Acorn Woodland Thriving 4.66 4.92 5.00 4.39 4.33 3.94
Horace Mann Thriving 4.56 4.87 5.00 4.22 4.17 3.56
Higher Ground Neighborhood Development Corp.
Allendale Performing 4.45 5.00 4.20 4.11 4.50 2.89
Brookfield Performing 4.38 5.00 4.67 5.00 2.83 3.28
New Highland Academy Thriving 4.63 5.00 4.79 4.06 4.67 3.39
Rise Community School Thriving 4.81 4.92 5.00 5.00 4.33 5.00
Sobrante Park Thriving 4.58 5.00 4.64 4.58 4.08 3.94
Oakland Leaf Foundation
EnCompass Academy Thriving 4.77 4.92 5.00 4.17 5.00 5.00
International Community School Thriving 4.51 4.92 4.80 4.33 4.00 4.56
Learning Without Limits (Jefferson) Performing 4.34 4.79 4.45 3.78 4.33 3.94
Think College Now Performing 4.32 4.76 4.11 4.83 3.58 4.00
Safe Passages
Community United Thriving 4.81 5.00 4.87 4.88 4.50 5.00
SFBAC, Learning for Life
Carl B. Munck Thriving 4.52 4.72 4.80 4.54 4.00 3.78
Fruitvale Performing 4.38 4.92 4.71 3.89 4.00 3.78
Laurel Thriving 4.57 4.92 4.76 4.11 4.50 4.39
Manzanita Seed Thriving 4.79 5.00 4.65 5.00 4.50 4.17
Ujimaa Foundation
Burckhalter Thriving 4.72 4.76 5.00 4.78 4.33 5.00
YMCA of the East Bay
Piedmont Performing 4.13 4.76 4.39 4.06 3.33 4.39
Elementary School Overall/Average 4.41 4.86 4.55 4.32 3.90 3.85
MIDDLE SCHOOL PROGRAMS
Bay Area Community Resources
Alliance Academy Performing 3.77 4.70 4.37 3.33 2.67 3.72
Claremont Emerging 2.85 3.56 2.91 2.25 2.67 1.67

Prepared by Public Profit Page 19
Lead Agency/Program
Point of Service Quality Status
2015-16
Overall - Excludes Academic Climate
(Shaded if < 3)
I. Safe Environment
II. Supportive
Environment
III. Interaction
IV. Engagement
V. Academic Climate
Elmhurst Community Prep Performing 3.56 4.33 3.71 3.54 2.67 2.11
Madison Performing 3.80 4.84 4.74 2.79 2.83 4.22
Melrose Community Bridges Program Thriving 4.59 5.00 4.69 4.50 4.17 3.72
Urban Promise Academy Performing 3.88 4.92 4.69 3.42 2.50 3.50
Eagle Village Community Center Youth and Family Services, Inc.
Westlake Performing 3.42 4.93 4.01 2.42 2.33 2.28
East Bay Asian Youth Center
Roosevelt Thriving 4.77 5.00 4.65 4.58 4.83 4.44
East Oakland Youth Development Center
Roots International Academy
Thriving 4.75 4.67 4.93 4.42 5.00 5.00
Lighthouse Community Charter School
Lighthouse Community Charter Performing 4.06 4.72 4.51 4.00 3.00 2.50
Oakland Leaf Foundation
ASCEND Performing 4.17 4.72 4.69 3.58 3.67 3.19
Bret Harte Thriving 4.66 4.92 4.90 4.83 4.00 3.89
Safe Passages
Coliseum College Prep Academy
(Middle School) Performing 4.37 4.92 4.71 3.33 4.50 3.72
Edna Brewer Performing 4.03 5.00 4.70 3.75 2.67 3.22
Frick Performing 4.17 4.70 4.77 4.38 2.83 4.56
United For Success Performing 3.78 4.59 4.60 3.58 2.33 3.56
Spanish Speaking Citizens' Foundation
Lazear Charter Academy Performing 3.07 4.70 3.54 2.54 1.50 1.83
YMCA of the East Bay
West Oakland Middle School Performing 3.73 4.90 4.34 3.33 2.33 1.61
Middle School Overall/Average 3.97 4.73 4.41 3.59 3.14 3.26
Source: Site visits conducted by Public Profit to OFCY-funded school-based after school programs, October 2015 through February 2016, n=62.

Prepared by Public Profit Page 20
APPENDIX A. PROGRAM QUALITY ASSESSMENT
Site Visits Using the SAPQA & YPQA Tools
Site visits provide observational data about key components of program quality, as research has demonstrated that higher quality programs are more likely to promote positive outcomes for youth.5 Public Profit conducted site visits using the School-Age Program Quality Assessment (SAPQA) for programs serving elementary-age youth or the Youth Program Quality Assessment (YPQA) for programs serving middle school-age youth. In K-8 school sites, Public Profit used the PQA tool that reflected the majority of program participants. The Program Quality Assessments are research-based point-of-service quality observation tools used by out-of-school time programs nationally. Site visitors are certified as statistically reliable raters by the Weikart Center for Youth Program Quality.
Program Quality Assessment (PQA) Domains
The PQA tools include five domains:
1) Safe Environment – Youth experience both physical and emotional safety. The program environment is safe and sanitary. The social environment is safe.
2) Supportive Environment – Adults support youth with opportunities
for active learning, for skill building, and to develop healthy relationships.
3) Interaction – Adults encourage and support a positive peer culture in the program. Youth support each other. Youth experience a sense of belonging. Youth participate in small groups as members and as leaders. Youth have opportunities to partner with adults.
4) Engagement – Youth experience positive challenges and pursue
learning. Youth have opportunities to plan, make choices, reflect, and learn from their experiences.
5) Academic Climate – Activities in the program intentionally promote
the development of key academic skills and content-area knowledge. This
5 Mahoney, J. L., Parente, M. E., & Zigler, E. F. (2010). After-school program participation and children’s development. In J. Meece & J. S. Eccles (Eds.), Handbook of research on schools, schooling, and human development (pp. 379-397). New York, NY: Routledge.

Prepared by Public Profit Page 21
domain was developed specifically for use in Oakland, and is not used nationally.
The quality domains are inter-related and build upon one another. Broadly speaking, programs need to assure that youth enjoy a Safe and Supportive environment before working to establish high quality Interaction and Engagement. For example, a program in which young people are afraid to try new things for fear of being ridiculed by others - an example of an unsupportive environment - is not likely to be an interactive, engaging place for young people. Figure 7 characterizes the relationship between the PQA quality domains and illustrates that physical and emotional safety (described in the Safe and the Supportive Environment domains) are foundational programmatic elements that support high quality practice in other domains. In general, programs’ ratings will be higher for the foundational domains than for Interaction or Engagement. FIGURE 7: PROGRAM QUALITY ASSESSMENT DOMAINS
Source: Adapted from Youth PQA Handbook by High/Scope Educational Research Foundation, 2013.
Program Quality Assessment Scoring
Program quality elements are rated according to visitors’ observations and staff responses to follow-up questions. Ratings of 1, 3, or 5 are assigned based on the extent to which a particular practice is implemented. The PQA is a rubric-based assessment, with brief paragraphs describing different levels of performance for each program quality area. Though the specific language varies by practice and version of the tool, the ratings indicate the following levels of performance: • A rating of one (1) indicates that the practice was not observed while the
visitor was on site, or that the practice is not a part of the program;
Academic Climate Target Specific Academic Skills Support Individual Learners Link to Prior Knowledge Connect to the School Day
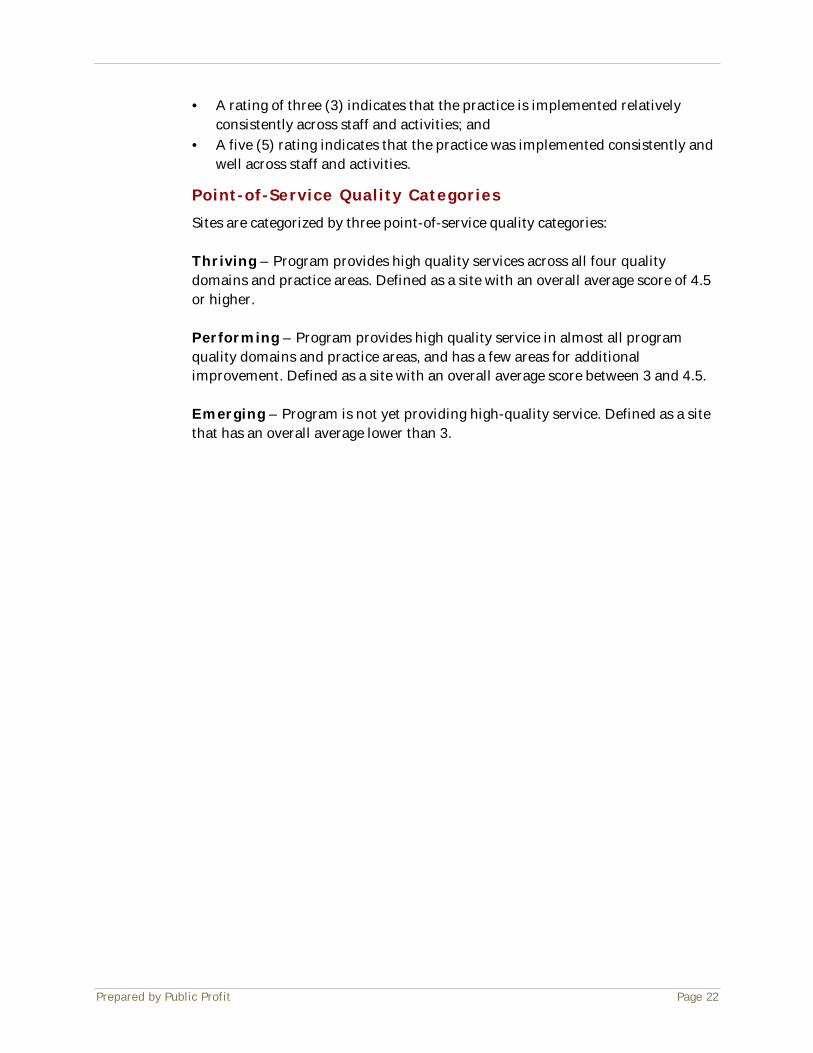
Prepared by Public Profit Page 22
• A rating of three (3) indicates that the practice is implemented relatively consistently across staff and activities; and
• A five (5) rating indicates that the practice was implemented consistently and well across staff and activities.
Point-of-Service Quality Categories
Sites are categorized by three point-of-service quality categories: Thriving – Program provides high quality services across all four quality domains and practice areas. Defined as a site with an overall average score of 4.5 or higher. Performing – Program provides high quality service in almost all program quality domains and practice areas, and has a few areas for additional improvement. Defined as a site with an overall average score between 3 and 4.5. Emerging – Program is not yet providing high-quality service. Defined as a site that has an overall average lower than 3.
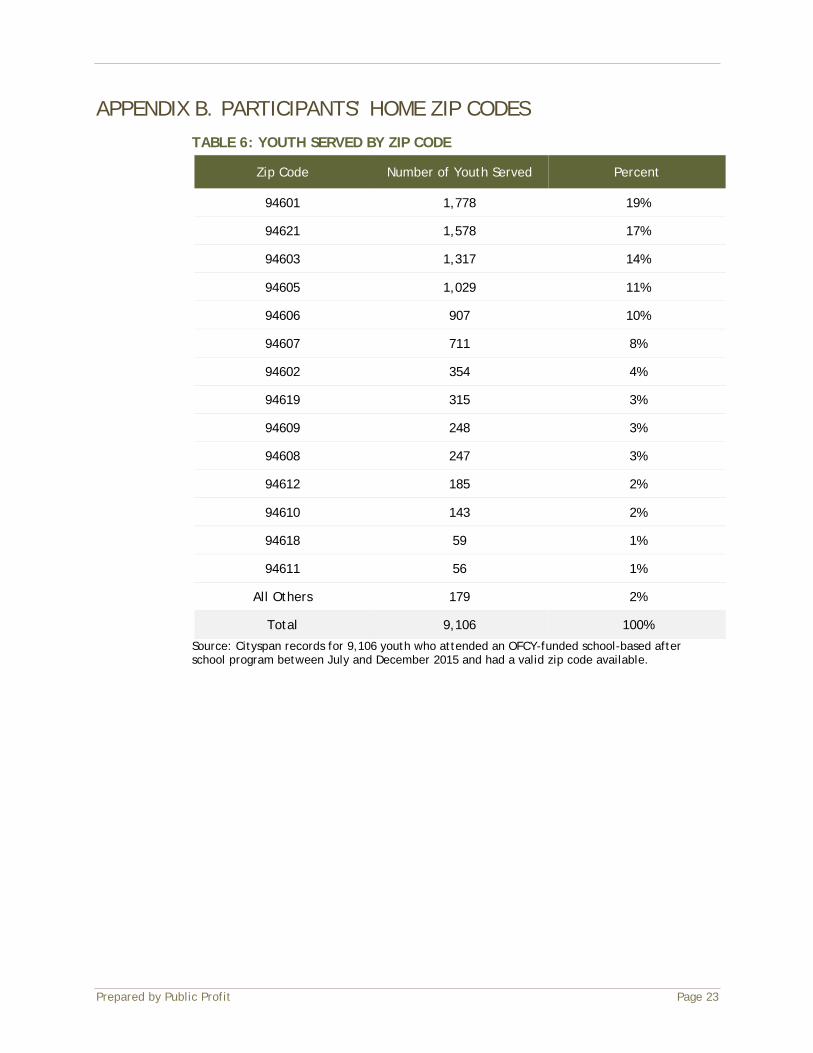
Prepared by Public Profit Page 23
APPENDIX B. PARTICIPANTS’ HOME ZIP CODES TABLE 6: YOUTH SERVED BY ZIP CODE
Zip Code Number of Youth Served Percent
94601 1,778 19%
94621 1,578 17%
94603 1,317 14%
94605 1,029 11%
94606 907 10%
94607 711 8%
94602 354 4%
94619 315 3%
94609 248 3%
94608 247 3%
94612 185 2%
94610 143 2%
94618 59 1%
94611 56 1%
All Others 179 2%
Total 9,106 100%
Source: Cityspan records for 9,106 youth who attended an OFCY-funded school-based after school program between July and December 2015 and had a valid zip code available.