agent banking in a highly under-developed financial...
TRANSCRIPT
Policy Research Working Paper 7984
Agent Banking in a Highly Under-Developed Financial Sector
Evidence from the Democratic Republic of Congo
Robert CullXavier GineSven Harten
Anca Bogdana Rusu
Development Research GroupFinance and Private Sector Development TeamFebruary 2017
WPS7984P
ublic
Dis
clos
ure
Aut
horiz
edP
ublic
Dis
clos
ure
Aut
horiz
edP
ublic
Dis
clos
ure
Aut
horiz
edP
ublic
Dis
clos
ure
Aut
horiz
ed

Produced by the Research Support Team
Abstract
The Policy Research Working Paper Series disseminates the findings of work in progress to encourage the exchange of ideas about development issues. An objective of the series is to get the findings out quickly, even if the presentations are less than fully polished. The papers carry the names of the authors and should be cited accordingly. The findings, interpretations, and conclusions expressed in this paper are entirely those of the authors. They do not necessarily represent the views of the International Bank for Reconstruction and Development/World Bank and its affiliated organizations, or those of the Executive Directors of the World Bank or the governments they represent.
Policy Research Working Paper 7984
This paper is a product of the Finance and Private Sector Development Team, Development Research Group. It is part of a larger effort by the World Bank to provide open access to its research and make a contribution to development policy discussions around the world. Policy Research Working Papers are also posted on the Web at http://econ.worldbank.org. The authors may be contacted at [email protected].
The paper provides evidence on the number and volume of financial transactions undertaken by agents (local businesses that double as more convenient, lower cost alternatives to formal branches) of the largest microfinance insti-tution operating in the Democratic Republic of Congo. More important than agents’ personal characteristics,
transactions are higher in low-income, densely popu-lated areas with high levels of commercial development. This finding suggests that the agent network has been best at supporting financial transactions among the urban poor. In addition, branding and effective liquid-ity management are strongly linked to agent activity.

Agent Banking in a Highly Under-Developed Financial Sector:
Evidence from the Democratic Republic of Congo
Robert Cull, Xavier Gine, Sven Harten, and Anca Bogdana Rusu1
Keywords: microfinance institutions, agent banking, financial inclusion
JEL Codes: G21, G23, G29
1 Robert Cull and Xavier Gine are with the World Bank. Sven Harten is with the German Institute for Development
Evaluation. Anca Bogdana Rusu is with the International Finance Corporation. This research was funded under the
Partnership for Financial Inclusion, a joint initiative of IFC and The MasterCard Foundation to expand microfinance
and advance digital financial services in Sub-Saharan Africa. It brings together the intellectual and financial support
of the Foundation with IFC's market knowledge, expertise and client base. The partnership is also supported by The
Development Bank of Austria, OeEB, and the Bill & Melinda Gates Foundation.
2
1. Introduction
A growing body of evidence indicates that financial services provide substantial benefits
to users in terms of managing risks, absorbing financial shocks, accumulating savings, and
investing in businesses, all of which can contribute to less volatile income and consumption
patterns.2 And as a result, promotion of broader financial inclusion has become an important
objective for policy makers across the globe.3 But transaction costs (e.g., time and expenses
associated with travel) and actual costs (e.g., fees for account opening and for conducting financial
transactions) associated with using financial services can be prohibitively high for many, and the
available financial products from formal providers such as banks are often poorly suited to the
needs of large segments of the population.4 Those financial institutions that do cater to the poor
are still mainly credit driven and do not offer a full set of financial products and services. This is
especially true in developing countries where nearly half (46%) of all adults lack a formal banking
account.5
We therefore study an alternative model for providing financial services to poorer clients,
agent banking. Agents, trusted local retailers selling everything from sundries to automotive parts,
can also double as less formal, lower-cost alternatives to bank branches that enable customers to
more conveniently make deposits, withdrawals, money transfers, and payments on loans (Lyman
et al., 2006; Siedek, 2008; Mas and Kumar, 2008; Flamming et al., 2011). Because of their lower
2 See e.g. World Bank (2014) for an overview of that literature. 3 Two-thirds of bank regulators surveyed in 143 jurisdictions report that they have a mandate to promote financial
inclusion (World Bank, 2014). And more than 50 countries have set formal goals and targets for financial inclusion
(Demirguc-Kunt, Klapper, Singer, and Oudheusden, 2015; Maya Declaration Commitments, Alliance for Financial
Inclusion, http://www.afi-global.org/maya-declaration-commitments). 4 See Collins et al. (2009) for detailed evidence from financial diaries on the vast array of financial arrangements
(both formal and informal) used by the poor in developing countries to manage their economic lives, and the lack of
fit between many formal products and their needs. 5 Demirguc-Kunt, Klapper, Singer, and Oudheusden (2015).
3
costs and closer proximity (both physical and social) to typically underserved market segments,
agents hold the promise of reaching poorer customers living further from formal bank branches,
and thus could more cost-effectively expand financial inclusion than traditional banking and
microfinance approaches.
We rely on data on the number and volume of transactions from the agents of FINCA DRC,
a microfinance institution that has achieved rapid growth in the number of clients that it serves
within a short time span despite facing a challenging context in which to deliver financial services.
In general, agents are small-scale business owners who offer FINCA banking services in addition
to operating an already established retail business.6 At an agent, a FINCA client can make transfers
to other FINCA accounts, receive a loan payout or do other withdrawals, repay loans or make
deposits into an account. While there is no fee for cash-in transactions, there is a fee for
withdrawals. Still, customers use the service for withdrawals since agents are often located closer
to their own businesses and queues are generally shorter than at bank branches.7 During the first 3
months of their activity as agents, FINCA agents receive a monthly subsistence stipend of $100.
From inception onwards, agents are compensated in relation to the number and value of
transactions they facilitate and receive coaching on how to increase foot traffic in their locations.
In total, it costs FINCA between $2,500 and $3,000 to set up an agent, of which the largest expense
($1,200) is for the Point of Sale (POS) device.
In our regressions, we assume that variables describing local market characteristics
(average income levels, level of commercial development) are exogenous in that they are not likely
to be affected by agent activities. There is, of course, some nonrandom selection into being an
6 FINCA agents cannot also be agents of banks or other microfinance institutions but can be agents for providers of
mobile money services such as Tigo, Airtel, and Orange. 7 Other financial services providers also charge fees on transactions.
4
agent, but because the agents had established businesses prior to the opportunity to become an
agent, their locations were pre-determined. In other words, none of the owners relocated their main
business to become agents. Moreover, in our analysis we compare agent transactions only with
those of other agents, so all of our data set is comprised of retailers that selected into this activity.8
At the time of data collection, FINCA’s was the largest agent banking network in DRC, which
makes our results, if not necessarily fully generalizable to other contexts, at least highly relevant
for the DRC banking sector.9
Specifically, we regress the number and volume of agents’ cash-in, cash-out transactions
on variables describing their personal and business characteristics that are taken from their
applications to become agents, and on variables describing income levels, population, population
density, commercial development, and financial development for the localized markets in which
these agents operate. These are taken from official sources or were created by a local economic
consulting firm that we retained. Our key market variables are aggregated at the level of 23
municipalities in and around Kinshasa. Our main findings are that market characteristics explain
substantially more variation in transaction activity than do characteristics of the agent or his/her
business. In addition, and perhaps more importantly, the number and volume of transactions is
highest in low income, densely populated markets with high levels of established commercial
development. This suggests to us that FINCA DRC’s agent network has been best at generating
financial transactions among the poor in the most densely populated areas.10 To our knowledge,
8 Agents were almost all existing clients, so data on account usage helped FINCA to identify business owners who
could be viable agents. 9 FINCA’s is largest agent network for a bank/microfinance institution in the DRC, but mobile money providers
have larger networks, mostly because the requirements for the two types of agents differ. Banking agents generally
have to meet higher standards, especially in terms of security and liquidity. 10 FINCA only operates in urban and peri-urban environments in our sample. It is conceivable that FINCA would
have greater impact on rural customers, but their expansion beyond urban areas is just beginning and thus the topic
is left for future research.

5
this is the first econometric study of the activities of agents of a microfinance institution in a
developing country, certainly the first in a country as poor and financially underdeveloped as the
DRC. Conducting such a study in a country that most often lacks reliable data and where local
research capacity is limited was challenging, but this also marks our study as an early contribution
to better understanding the economy in DRC.11
Our work is closely related to a recent literature that explores how lowering the transaction
costs of transferring funds within social networks improves household financial management. Jack
and Suri (2014) have shown how mobile telephony has reduced the costs of such within-network
transfers in Kenya and find that mobile money has helped households to smooth consumption in
the face of economic shocks. Specifically, they find that shocks reduce the consumption of non-
users of a widely adopted mobile money service called M-PESA by 7 percent, while shocks have
no significant effect on the consumption of households with an M-PESA user. Similarly, Yang
and Choi (2007) find that shocks to the incomes of Philippine households are associated with
significant increases in the international remittances that they receive, an indication that those
remittances could be used to smooth consumption.
Both the volume and diversity of remittance senders increase after a shock and the average
distance from senders to receivers of remittances also increases substantially (Jack and Suri, 2014),
suggesting that M-PESA has enabled households to expand or make fuller use of their social
networks at lower cost. Relatedly, Aycinena, Martinez, and Yang (2009) show that reductions in
remittance fees increase the frequency with which Salvadoran migrants receive them. Jack and
Suri (2013) also find that the purposes of remittances differ between users and non-users of M-
11 There are, however, less formal studies that describe the business model and provide information on the financial
viability of agents. See, for example, http://www.cgap.org/data/india-banking-agents-survey-2012 and
http://www.helix-institute.com/data-and-insights/agent-network-accelerator-survey-uganda-country-report-2015 for
evidence from India and Uganda, respectively.
6
PESA. Users are more likely to receive remittances via M-PESA for credit or in response to an
emergency, while the fraction of total M-PESA transactions for regular support declines. The
patterns suggest that M-PESA enables households to more easily draw on their social networks for
support in trying circumstances.12
Our work is also therefore related to a body of research showing that monetary transfers
within networks of family members and friends are pervasive and crucial for household risk
mitigation in developing countries. A number of papers have shown that informal financial
arrangements provide insurance for households that experience illness (Gertler and Gruber, 2002;
DeWeerdt and Dercon, 2006; Genoni, 2012). For example, Genoni (2012) shows that in Indonesia
household members who do not personally experience an illness increase their supply of labor,
and transfers increase from other households to the affected household. A related literature tries to
uncover the motives for participation in informal financial and insurance arrangements and finds
evidence consistent with the notion that reciprocity (rather than altruism) motivates most in-
network transfers (Fafchamps and Lund, 2003; Blumenstock, Eagle, and Fafchamps, 2011).13
The remainder of the paper is organized as follows. Section 2 describes FINCA DRC and
its place with the financial context of the DRC. Section 3 describes our data and our approach to
estimation. Section 4 lays out our econometric specification and provides hypotheses about how
our explanatory variables are expected to affect agent transactions. We present our main results in
Section 5. In Section 6, we perform a series of robustness checks. Section 7 offers conclusions.
12 Relatedly, Blumenstock, Eagle, and Fafchamps (2015) show that Rwandan households affected by earthquake
received increased amounts of cellular “airtime” (a simple precursor to mobile money) from members of their social
network, especially those with whom they had already established reciprocal relationships. 13 The reciprocity motive for participation in informal financial networks appears to be a pervasive one in the
developing world. For example, using historical loan contract data from low-income rural villages in China in the
1930s, Brandt and Hosios (2010) show that informal loans were predominantly used for consumption purposes and
that a large share of these loans carried no interest rate. They argue that these arrangements should be interpreted as
“long-term reciprocal insurance or patronage relationships between households.”
7
2. FINCA and the DRC Context
Even within Africa, which lags other developing regions in financial development (Allen
et al., 2014, 2015: Beck and Cull, 2014, 2015), the Democratic Republic of Congo (DRC) has
stood out as one of the least banked countries in the region. In 2014, 17% of adults in the DRC
had an account with a formal financial institution. In comparison, 34% of adults in Sub-Saharan
Africa, 54% of adults in developing economies, and 62% of adults worldwide had formal
accounts.14 Moreover, the 17% figure represents a substantial gain in financial inclusion in the
DRC, since the 2011 figure stood at less than 5% (Demirguc-Kunt and Klapper, 2012a,b).
The country’s long history of conflict has no doubt led to institutional and infrastructural
deficiencies that impede economic growth, and thus also impede demand for financial services.
However, evidence from financial diaries in other developing countries (Collins et al., 2009)
suggests strongly that poor clients have many financial needs and, because their incomes are often
irregular and emergencies arise, their financial lives are unpredictable. The low financial usage
ratios reported above therefore make it highly likely that demands for financial services for large
segments of the Congolese population go unmet by its formal financial services providers such as
commercial banks.
FINCA DRC is part of FINCA, an international microfinance institution present in 23
countries worldwide, focused on offering financial services and products to small scale businesses
and households. Founded in 1985 in Bolivia, FINCA opened its first program in Africa in 1992 in
Uganda. In 2009 FINCA introduced branchless banking – ATMs, computerized points-of-sale
transactions, and cellular banking – in an effort to expand its outreach while keeping associated
costs low. In late 2016, 2016 FINCA had over 643,000 savers in Africa, an average disbursed loan
14 The figures for account ownership are from Demirguc-Kunt, Klapper, Singer, and Van Oudheusden (2015).
8
size of $754 and a gross loan portfolio of $166 million. Of that, FINCA DRC accounted for
256,000 clients and $77 million of the loan portfolio.15
The products offered by FINCA vary to some extent by local context and are adapted to
local regulations. Scaling access to financial services for the majority of the population in the
uniquely challenging context of DRC required going beyond existing business models and branch-
based delivery channels. Branchless banking is a potentially powerful tool to increase outreach
given the even higher cost of establishing branch infrastructure in a post-conflict environment.
Since 2012, FINCA DRC has been rolling out an agent banking network that had grown swiftly to
more than 500 agents by the end of 2015. With agents facilitating transactions worth over
$115,000/month, roughly 65% of all FINCA’s transactions are now done with an agent.
As part of the application process the potential agents had to provide information regarding
the business owner (age, gender, education, nationality) and her/his business (industry, age,
location, inventory value, daily turnover, profits, hours of operation, number of employees). In
addition, a FINCA branch officer scored the business on a scale of 0-2 on 10 essential
characteristics, ranging from the establishment’s location in terms of potential customers, its
security and potential for branding, as well as the aforementioned business-related information
such as age, operating schedule, stock value and daily turnover. Both the agent application and the
score sheet were used to assess a business’s potential for becoming a FINCA agent.
For the period that we study, the selection of agents was done in an opportunistic manner.
The vast majority of agents as of 2015 were current clients of FINCA, whose businesses had
15 Globally, however, we acknowledge that FINCA faced financial difficulties dating from at least 2015 due to
several factors such as the weakening economic climate and increased competition in many of its key markets.
FINCA also had some in-house challenges involving its business model as it had a rather large headcount in the US
and a reliance on multiple donor funding sources that has not been conducive to a clear strategic focus. FINCA DRC
has been one of the more successful outlets, but here also the influence of multiple donors pulling the organization
and its overstretched staff into different directions was noticeable.
9
good track records, and who were therefore approached by branch officers about becoming an
agent. As such, less than 0.1% of applications to become an agent have been rejected to this
point. There were thus too few rejected applicants (less than ten) to permit meaningful analysis
differentiating the characteristics of those who became agents from those who did not.16
3. Data and the Estimation Approach
Our data come from 190 FINCA DRC agents who began operations at some point from
2012 to 2015. We rely on monthly transactions data for the dependent variables in the regressions
that follow. Although we have some data on other transfers to FINCA accounts, those transactions
occurred too infrequently to permit meaningful analysis. Similar to Jack and Suri (2013, 2014),
we therefore focus on cash-in, cash-out transactions in our analysis.
As explanatory variables, we rely on the personal/business characteristics of the agents and
the socio-economic characteristics of the agents’ locations. Personal and business characteristics
are taken from the applications that agents submitted to FINCA. Our data are from agents located
in and around Kinshasa since that was the focus of FINCA DRC in the initial phases of their agent
rollout. Agents are located in four major business districts– Funa, Lukunga, Tshangu and Mont
Amba –which are further subdivided into 24 so-called municipalities.17 In our regressions, we rely
on data from agents operating in 23 of those municipalities. These municipalities vary greatly in
16 In principle, it might be possible to distinguish the characteristics of agents who ceased operations from those that
continued throughout our period of study to assess the viability of the agent model in different contexts. But
according to FINCA agent network representatives, hardly any agents quit the business in the first few years of
developing the network, precisely because those agents were picked based on ongoing business relationships with
branch officers. We acknowledge, however, that 14% of our sample is comprised of agents that are missing
operational data for some or all of the last five months covered by our study. We cannot say with certainty whether
they quit or took a break from agent work, which sometimes happened due to liquidity issues, or whether data were
missing for some other reason. 17 About 10 percent of our transactions data come from agents located outside Kinshasa. We were unable to create
reliable measures of income and commercial/financial development for those locations, many of which were larger
than a municipality, and thus we have excluded them from the regressions that include municipal-level variables that
follow.
10
size, and population density, as well as a variety of other characteristics (Appendix A).
Municipality-level data therefore offer a relatively fine level of geographic aggregation. Data on
population and population density are taken from official sources. Since DRC lacks most common
socio-economic and demographic statistics, data on income, commercial development, and
financial development at the municipal level had to be created by a local consulting firm.
Specifically, in order to measure these municipality characteristics, we consulted Experts
SARL, a market research firm with over 15 years of experience working in the DRC. Given their
focus on the city of Kinshasa and their extensive experience with fieldwork across all
municipalities of the capital city, we asked them to indicate the level of urban, commercial and
financial development of each municipality, as well as their average income levels on a scale of
low-medium-high. We also asked them to identify the predominant type of financial services
provider in each municipality (banks, microfinance institutions, or providers of mobile banking
services).
While Experts SARL has an extensive network of enumerators, the core team in Kinshasa
is composed of 9-10 enumerators. Each person on the core team is assigned a subset of
municipalities, on which they have in depth knowledge and therefore have become the go-to
experts in the team. The input of the enumerators was taken into account when determining the
municipality characteristics used in our analysis. Their assessment was based on prior knowledge
accumulated during a variety of market research projects in Kinshasa, as well as direct observation
of area characteristics completed under the first phase of a scoping mission to identify potential
locations for future rollout of FINCA agents.
The ultimate questions that motivate our research are whether and why some clients would
prefer to do their banking transactions with an agent rather than at a formal branch, and what types

11
of agents are best able to attract those clients based on their own characteristics and the
characteristics of their locations such as population density. One possibility is that clients are more
comfortable with, and trusting of, agents than a branch. This could be especially true for poorer
clients who lack knowledge of financial products,18 but could also hold for wealthier clients in
DRC where trust in institutions is low and business transactions depend on personal relationships.
Indeed, at an agent outlet it may be easier to establish trust since it is usually the same person
dealing with clients, often an entrepreneur with a long track record in the community. At branches,
young professionals from outside the neighborhood deal with clients and are often rotated or
promoted from the entry-level client-facing positions to other jobs. The notion of trust, therefore,
may be more abstract with respect to branches and linked to an institution rather than to an
individual. We lack a survey that would enable us to track levels of income, financial education,
and usage of agents versus branches at the household level. We therefore provide indirect tests of
the comfort/trust hypothesis by examining whether proxies for an agent’s standing in the local
community such as his/her age and the age of his/her business are associated with more
transactions. Gender may also play a role in promoting comfort/trust as female clients may be
more comfortable doing banking transactions with a female agent.19
Convenience and a lack of alternative providers may also prompt some clients to rely more
heavily on agents. Since the agents that we study are located in and around Kinshasa, all of them
are situated reasonably close to a FINCA DRC branch. Thus, most (if not all) clients can choose
18 Equity Bank in Kenya, for example, has made a concerted effort to expand financial inclusion by establishing
branches beyond urban centers and having their staff speak to clients in their native languages (Allen et al., 2013). 19 About a quarter of our observations on monthly cash in/cash out come from female agents (see summary statistics
in Appendix B). We recognize that age and gender may proxy for factors beyond trust. However, we control for
additional characteristics of the agent and his/her business and of the market in which he/she operates, and thus the
age of the agent and his/her business (which provide information on how well established he/she is in the
community) and gender (which, for female agents, could indicate greater ease in serving female clients) are our best
proxies for testing hypotheses regarding trust between agents and their clients.

12
to do transactions with either a branch or an agent. In that sense, they have a choice between at
least two alternatives. Still, agents are likely to be physically closer to many potential clients, have
longer opening hours and transactions may take less time and be less formal than at a branch.
Lacking client survey data, however, we again rely on indirect tests of these hypotheses.
Controlling for population and population density (both of which should be positively associated
with the frequency and volumes of agent transactions), potential clients in less commercially
developed municipalities might benefit less from the convenience of, or have less need for, agents.
That is, clients in commercially active municipalities might have greater appreciation for the time-
saving convenience of an agent, and thus agent transactions might be more frequent in those
areas.20
While agent transactions are likely to be heavier in commercially developed municipalities,
how the general level of local financial development affects agent transactions is harder to predict.
On the one hand, the level of financial development may simply be an indication that the local
demand for financial services is high, and thus we would expect more transactions from both
agents and other providers in financially developed municipalities. But the demand for financial
services is likely to be strongly linked to the level of local commercial activity. Since we already
control for the level of local commercial development in our regressions, financial development
could be negatively related to agents’ transactions to the extent that the financial services provided
by agents are substitutes for those from other providers.
20 We are assuming that population density serves as a proxy for the number of potential clients that are near an
agent. In that sense, density provides information on the convenience associated with reduced travel time to agents
rather than branches. In a separate ongoing field experiment, we study how the density of the local FINCA agent
network (i.e., the number of agents in close proximity) affects the financial behavior of clients and the profitability
of the agents themselves.

13
4. Specification and Hypotheses
To identify the factors that drive agents’ transaction frequencies and volumes, we estimate the
following equation:
𝑌𝑖𝑚𝑡 = 𝛼 + 𝛽1𝐴𝑔𝑒𝑛𝑡𝑖𝑚 + 𝛽2𝐵𝑢𝑠𝑖𝑛𝑒𝑠𝑠𝑖𝑚 + 𝛽3𝑀𝑎𝑟𝑘𝑒𝑡𝑚 + 𝛽4𝐹𝑖𝑛𝑎𝑛𝑐𝑒𝑚 + 𝜀𝑖𝑚𝑡
Y is the number or the volume of cash-in or cash-out transactions for agent i in municipality m in
month t.21 Agent represents personal characteristics of the agent including his/her age, education
level, and gender. We estimate all models first using robust standard errors and then using standard
errors that allow for clustering at the municipality level. While clustering at the municipality level
is clearly a more conservative approach, comparing the significance levels across the two sets of
estimates provides a way to gauge the robustness and reliability of particular findings.
To the extent that older agents are better established and more trusted than younger ones,
we expect agent age to be positively linked to transactions. On the other hand, however, younger
agents may be more proficient with technology and therefore able to deliver better service,
especially when the need arises to troubleshoot problems with the POS device. If female clients
are more likely to use an agent if she is also a woman, we expect that the dummy variable for male
agent, which appears in the regressions, would be negatively linked to transactions. The
relationship between transactions and agent education is harder to predict. Better educated agents
may be more trusted or have business acumen that others lack, and thus we would expect the
dummy variable for having a primary education (or less) to be negatively related to the number
and volume of transactions. At the same time, highly educated agents might be more socially
distant from the bulk of their potential clients, and thus less trusted. In that case, the primary level
education variable could be positively linked to agent transactions.
21 We look at cash-in and cash-out transactions separately because the fee structure linked to each operation is
different. Similarly, the commissions paid to agents are different for the two types of transactions.

14
Business represents characteristics of the business that operates in tandem with FINCA
agent activities. Like agent age, we expect that the age of the agent’s business could be positively
linked to agent transactions to the extent that more firmly established businesses inspire trust
and/or already have experience with a wider number of potential clients. We also hoped to explore
how the nature of the business affects agent transactions. To proxy for interactions between an
agent’s established and banking businesses, we tried a number of variables including the number
of days per week (and hours per day) that the business is open, the number of employees of the
business, and the economic sector of the agent’s business.22 We were unable to derive robust
results for those variables, and thus rely on the value of stock (meaning inventory) in the retail
business as a simple summary indicator of how demanding are an agent’s duties to maintain that
business. To the extent that demands from the retail business on an agent’s time are high, it might
make it harder (and relatively less financially lucrative) for her/him to fully pursue banking, and
thus we would expect a negative relationship between retail stock value and agent transactions.
Market represents a set of variables that describe the demographic characteristics of the
municipality including population, population density, commercial development, and average
income level. Both population and population density are taken from official sources for the most
recent year for which data are available.23 We expect both to be positively linked to the number
and volume of agent transactions. Average income levels and the level of commercial development
were derived by Experts SARL Consulting, as described above. Lacking a census of businesses
and a representative survey of households, we asked Experts SARL to sort municipalities into one
of three categories for these variables – high, medium, and low. Our hope was to derive coarse,
22 Unfortunately, we were only able to categorize agents’ businesses as providing either services or manufactured
goods. A finer delineation of the types of goods and services that agents sell might have produced better insights
into the types of businesses that are best suited to accommodate and foster agent transactions. 23 Population figures are taken from the most recent census, which occurred in 2004.

15
but reliable indicators of the market characteristics that might affect agent transactions based on
the consulting firm’s long experience in Kinshasa.
We include a dummy variable for high income and another for low commercial density in
the regressions that follow. To the extent that agents are an effective way to reach low income
market segments that are typically financially excluded, we would expect a negative relationship
between the high income dummy and agent transactions.24 The level of commercial development
is an indicator of both demand for financial transactions and the ease with which many clients can
perform them, especially during the course of the business day. We therefore expect the low
commercial density dummy variable to be negatively linked to the number and volume of agent
transactions. Note that the market characteristics that we include in the regressions are time-
invariant because it was not possible to create reliable measures that varied over time. At the same
time, however, we argue that variables such as these are slow to change and thus they should do a
good job of accurately sorting municipalities into a few bins within the tight window for which we
have agent transactions data.
Finally, and as described above, Experts SARL created variables to describe the level of
financial development in each municipality, including an overall assessment of financial density
as being high, medium, or low, and an assessment of the predominant type of financial institution
(banks, microfinance institutions, providers of mobile banking services). To the extent that the
services provided by FINCA agents are effective in reaching market segments that are underserved
by other providers, we would expect agent transactions to be higher in locations where there are
fewer alternative service providers. Thus, we would expect a negative relationship between the
dummy variable for high financial density and our agent transactions variables.
24 Our assumption is that higher income clients are more likely to access financial services from providers other than
FINCA DRC agents.

16
Three dummy variables are used to indicate whether the predominant type of financial
services provider in a municipality is a bank, microfinance institution, or mobile financial services
provider, respectively. Since FINCA DRC is itself a microfinance institution, the dummy variable
for microfinance predominance could be positively linked to agent transactions because those are
municipalities in which microfinance products are in high demand. The dummy variables for
banking and mobile banking predominance could provide an indication of whether services from
those providers are complementary to (or substitutes for) those provided by FINCA DRC agents.
If their coefficients are positive, it would provide evidence consistent with complementarities.
5. Empirical Results
In models 1-4 of Table 1 we regress the number of monthly cash-in transactions for each
agent on his/her personal characteristics and the characteristics of his/her retail business. We find
that an agent’s age is positively linked to transactions, which supports the notion that older agents
may be more trusted or at least better known among potential clients. As agent age increases by a
year, the number of cash-in transactions increases by roughly four. The median (mean) number of
monthly cash-in transactions is 117 (202), with a standard deviation of 259. Our model thus
predicts that an agent ten years older than another would have a sizable advantage (almost 40) in
performing cash-in transactions. The age variable is significant both in the models that employ
robust standard errors and in model 4, which used standard errors clustered at the municipality
level. Similarly, and also as hypothesized, female agents perform about 30 more cash-in
transactions per month, although that coefficient is significant in only the models that use robust
standard errors. There is no significant relationship between the primary education variable and
the number of cash-in transactions in our base results in Table 1.

17
Business characteristics also explain variation in the number of cash-in transactions that
FINCA DRC agents perform in a month. For example, the coefficient for stock value, our proxy
for the demands on the agent’s time that are imposed by her/his business, is negative and
significant for models using either type of standard error. The coefficient for stock value is -0.287
in models 3 and 4. If stock value increases by one standard deviation ($64,190), the number of
cash-in transactions per month decreases by 18.25 We hypothesized that, like owner age, the age
of the retail business would also be positively associated with transactions. However, we find a
negative relationship in models 3 and 4. One interpretation is that retail business age is a better
proxy for the demands of running the business (or an indication of the interest that an agent has in
running his/her retail business relative to banking) rather than an indication of the degree of trust
that potential clients place in him/her. However, the coefficient is not significant when standard
errors are clustered at the municipality level in any of the models in Table 1.
In models 5-8 we begin to examine the effects of market characteristics on the number of
monthly cash-in transactions. We introduce fixed effects for each business district (models 5 and
6) and municipality (models 7 and 8) to get an initial indication of the variation in agent
transactions that local market conditions can potentially explain.26 The overall fit of the regressions
improves dramatically when we introduce these fixed effects, especially the municipality fixed
effects. The r-squared of the models with only agent and retail characteristics is .02-.03.; with
municipality fixed effects, the r-squared improves to .21. This suggests that substantial variation
in the number of agent transactions can potentially be explained by variables that describe the
characteristics of markets at the municipal level. Note also that the coefficients for owner age and
stock value of the established business remain significant when controlling for district or
25 The stock value variable is expressed in thousands of $US. 64.19*-0.287 = 18.42 fewer transactions. 26 Again, the 23 municipalities in our study fall within four business districts.

18
municipality fixed effects. Indeed, the coefficient for owner age becomes larger in magnitude,
increasing from 3.7 to 5.5.
In models 9 and 10, we replace the municipality fixed effects with variables designed to
capture salient characteristics of the local market. We include population (in 10,000s) and
population density (population/sq km), both measured at the municipality level. Coefficients for
both are positive and significant, as hypothesized, regardless of the type of standard errors that we
use. The mean number of residents in a municipality is 368,661, and the standard deviation is
241,783. Increasing population by 10,000 residents is associated with 3.2 more cash-in
transactions per month; increasing by one standard deviation yields 78 additional monthly cash-in
transactions.27 Similar, if somewhat less pronounced, relationships are found for population
density. Increasing that variable by one standard deviation is associated with 42 additional cash-
in transactions per month.28
The variables for municipality income levels and commercial density that were constructed
by Experts SARL also explain substantial variation in agents’ cash-in transactions, and they
provide indications of the markets where conducting banking transactions with an agent is most
desired. For example, the negative significant coefficient for the high income dummy variable
implies that agents in high income municipalities perform 97 fewer cash-in transactions per month
than those in medium- and low-income municipalities. The negative significant coefficient for
municipalities with low levels of commercial development implies that agents in less
commercially developed municipalities perform 77 fewer cash-in transactions per month than
those in municipalities that have medium or high levels of commercial development.
27 The population coefficient is 3.223. Increasing population by one standard deviation implies 3.223*24.1783 =
77.93 additional cash-in transactions per month. 28 2.232*18.91561 = 42.22 additional transactions.
19
In all, the municipality characteristics variables paint a vivid picture of the types of markets
where agent services seem to be flourishing. These are low income, highly and densely populated
areas with a relatively high level of commercial activity. These patterns suggest strongly that
FINCA DRC agents are targeting and effectively reaching the urban poor. Note also that the r-
squared of models 9 and 10 with municipality characteristics is 0.136, an indication that these
variables can account for a large share of the substantial gain in the overall fit of the regressions
when controlling for municipality-level fixed effects.
Finally, we include the variables describing financial development at the municipal level
in models 11-16. Agents perform 49 fewer cash-in transactions in municipalities with a dense
network of financial service providers, an indication that their services compete with, and thus are
substitutes for, those of other providers. In models 13-16, we include the dummy variables
describing the predominant type of financial services provider in each municipality. As
hypothesized, agent cash-in transactions are more prevalent where microfinance institutions are
identified as the dominant providers. This could be a reflection that clients have greater demand
for and familiarity with the services from that type of provider since FINCA DRC is itself a
microfinance institution. While the patterns for the financial development coefficients are
suggestive of where FINCA DRC agents are best fitting into the local financial sector, we put less
stock in those results since they are generally insignificant when we use standard errors clustered
at the municipality level.
In Table 2, the number of cash-out transactions replaces cash-in transactions as the
dependent variable and we rerun the same set of regressions. Results are very similar to those for
cash-in transactions. Two minor differences are that significance levels for some variables,
especially those describing agent and retail business characteristics, are lower and the magnitudes

20
of most coefficients are smaller (in absolute value) than they were for cash-in transactions.
However, smaller coefficients are to be expected in that the average number of cash-out
transactions is 131 per month, which is sixty-five percent of the average number of cash-in
transactions. This is, however, above that for the agent banking sector in other contexts, where
much larger gaps are the norm. Recall that there is a fee incurred for cash-out but not cash-in
transactions which is likely driving the disparity. Still, the results for cash-out transactions
reinforce those for cash-in transactions and indicate that market characteristics explain
substantially more variation in agent transactions than personal or business characteristics.
In Table 3, we rerun the same regressions using (log of) cash-in volumes as the dependent
variable. In general, we find the results to be similar to those for the number of cash-in transactions.
In models 1-4, focused on the agent’s personal characteristics and the characteristics of his/her
retail business, as well as in models 5-8 where fixed effects for business districts (models 5-6) or
municipality (7-8) are introduced, we find the sign and significance of the explanatory variables
to be very much in line with those observed in Table 1. Specifically, an agent’s age is significantly
positively linked to cash-in volumes, while the stock value of his/her retail business is associated
with lower cash-in volumes. We do note however that, while those patterns are similar, the r-
squared for the cash-in volume models is systematically lower than that of the cash-in transactions
models.
Results for models 9-10, in which we introduce variables designed to capture market
characteristics, are also similar to those observed for cash-in transactions. However, once we
account for financial development at the municipal level (models 11-16), we find that variables
such as municipal income level and commercial density lose significance. Population is the only
market characteristic that is consistently significant in explaining cash-in volumes, regardless of

21
the standard errors that we use. For an agent with the median level of cash-in volume ($14,927 per
month), an increase in municipal population of one standard deviation would be associated with a
$4,952 increase in cash-in volume. Finally, and similar to the results for the number of transactions,
cash-in volumes are 50-70% higher in areas where microfinance institutions are the dominant
financial alternative.
In Table 4, we use the monthly volume of cash-out transactions as the dependent variable.
In models 1-4 we find that, compared to the results for the number of cash-out transactions, or
even cash-in volumes, personal and business characteristics are less able to explain variation in
cash-out volumes. While introducing fixed effects for business districts does little to increase the
explanatory power of our models, including municipality level fixed effects increases r-squared
from .016 (models 5-6) to .161 (models 7-8), which is higher than the r-squared levels for the
comparable cash-in volumes models (Table 3, models 7-8). For the agent with the median level of
cash-out volume ($3,742), a one standard deviation increase in stock value is associated with a
$453 decline in monthly cash-out volume. However, all personal and business characteristics lose
significance in models 9-16 once we account for municipality characteristics.
Unlike for cash-in volumes, results for cash-out volumes show that, in addition to
population, municipality characteristics such as income and commercial density explain
substantial variation. Interestingly, the financial density level is not significantly associated with
cash-out volumes, regardless of the standard errors that we use. However, and similar to the results
for cash-in volumes, cash-out volumes are higher in areas where microfinance institutions are the
dominant providers of financial services. In contrast, in municipalities where mobile banking is
the dominant financial alternative, the volume of cash–out transactions is dramatically lower (67%
lower in model 13; 95% lower in models 15-16). We asked the consulting firm to construct the
22
variable to focus on “mobile banking” using a broad definition that captures mobile money
services provided by mobile network operators (MNOs) largely to send and receive remittances.
These services are much more common in Africa than mobile banking where the customer
connects to his bank account via a smartphone or computer.
We do not interpret this coefficient as indicating that competition from providers of mobile
banking services causes lower cash-out volumes for FINC DRC agents. It is more plausible that,
in the handful of municipalities where mobile money is dominant, FINCA DRC agents simply
have yet to establish sizable monthly cash-out volumes, likely due to market features that we are
unable to observe directly from our data. For example, the MNOs had pre-existing agent networks
and expertise in logistics that gave them advantages in providing cash in/cash out services in some
areas. Overall, however, the regression model does about as well in explaining cash-in and cash-
out volumes as reflected in the respective r-squared statistics.
6. Robustness Checks, Additional Tests
To this point, our results indicate that market characteristics explain more variation in agent
transactions than personal and business characteristics, and that agents perform more and larger
transactions in low income areas that are dense in terms of population and commercial
development. In this section, we create sub-samples based on municipal population density, and
we test how agents’ personal/business characteristics and market characteristics (other than
population density) affect transactions in densely versus sparsely populated areas. This enables us
to examine whether different characteristics drive agent transactions in different types of markets.
We also exploit data from regular visits by FINCA DRC headquarters staff that assess how well
an agent is following FINCA protocols to test whether such monitoring can help agents to adapt
to their markets and increase their transactions.

23
6a. High vs. Low Population Density
We rerun our base models after separating municipalities into “high” and “low” population
density groups to create sub-samples of roughly equal size.29 Agent age has a positive association
with the number of cash-in transactions that is of very similar magnitude in municipalities with
high or low population density, though that coefficient only achieves significance in models that
use robust standard errors (Table 5).30 However, an agent’s level of educational attainment appears
to play a different role in explaining the number of cash-in transactions in high and low density
environments. Agents with some high school or college-level education perform substantially
more cash-in transactions per month (75 more) in low density areas than those with a primary
school education (or less). In contrast, in high density areas, agents with a primary school education
perform substantially more transactions than those with more education. Although the coefficients
for the primary education variable are not significant in the models that use standard errors
clustered at the municipality level, the patterns suggest that trust in agents might work differently
in densely and sparsely populated areas. In low density areas, where there are likely fewer daily
interactions between agents and potential clients, advanced education might help agents signal that
they are competent and trustworthy. Also, within Kinshasa, relatively low density could signal
higher income residential neighborhoods. Hence, it could be that most agents are relatively well
educated in those neighborhoods, and perform more transactions than less educated agents in those
areas. In densely populated areas, where daily interactions are frequent, education seems to have
an adverse effect on an agent’s business. This could be because the vast majority of potential
29 Because the number of observations differs across municipalities, there was no possible breakdown by municipal
population density that would have resulted in sub-samples of equal size. 30 In part, the reduced number of observations in the sub-sample regressions likely contributes to reduced
significance for the models that use standard errors clustered at the municipality level.

24
clients in those areas also have low levels of education, and thus there is less social distance
between them and less-educated agents.
In terms of business characteristics, the negative relationship between the stock value of
an agent’s retail business and the number of cash-in transactions is more pronounced in areas with
high population density. This suggests that the demands imposed by his/her other business on an
agent’s time are likely to reduce the number of transactions performed in densely populated urban
areas. However, and perhaps surprisingly, the negative relationship between retail stock value and
cash-in volumes is significant only in low density areas (Table 6). Since the stock value coefficient
is small and not robustly significant in low density areas in the models that use the number of cash-
in transactions as the dependent variable, this suggests that those agents perform about same the
number of transactions but that the average value of those transactions is decreasing in retail stock
value. It is not clear to us why agents with high retail stock value would attract clienteles that
perform cash-in transactions of smaller average size in low density areas.31
Finally, market characteristics other than population density also appear to impact agents’
cash-in transactions differently in high and low density areas. The coefficients for low levels of
commercial development and high average income are negative, larger (in absolute value), and
more robustly significant in high density areas when we use either the number or volume of cash-
in transactions as the dependent variable. The patterns suggest that service provision is more
effectively targeted toward low income areas with relatively high levels of commercial
development in municipalities that are more densely populated. To date at least, the services
31 One potential explanation may be that these low density areas are in fact relatively high income areas (such as
residential or with governmental bureaucracy and embassies) as we noted above, where businesses have a high stock
value since they are selling more expensive goods. Wealthier clients may use agent banking services for small
convenient transactions while in an agent’s retail business, but they may also be more likely to go to formal financial
institutions for their major transactions.

25
provided by FINCA DRC agents could therefore be viewed as a better fit for the urban poor than
for other groups. We derive similar results when we replace the cash-in variables with the cash-
out variables on the left-hand-side of our sub-sample regressions, and so we do not report those
results in the paper.
6b. Monitoring of FINCA Agents
FINCA agents receive unannounced visits from agent network officers to assess how well
they are following FINCA protocols and to suggest areas for performance improvement. Agents
are supposed to be visited on a monthly basis, though the monitoring reports that we have indicate
that visits are less frequent than that for a large number of them. Agents are rated in four broad
categories: liquidity management, client service, transactions performance, and branding. Within
each category, agents receive scores in multiple sub-categories.32 For example, for liquidity
management agents receive a score for the management of “e-float,” that is, money in the agent’s
account that can be transferred to a client’s account in exchange for cash, and “cash float” (which
can be exchanged for e-float). For client service, agents receive scores for state of shop,
connectivity/service availability, and operator availability. For branding, scores are given for agent
visibility, posting of FINCA images, and the quality of FINCA signage outside the shop.
We sum the scores from the sub-categories to derive a score in each of the four broad
categories, which we include in Table 7 in the regressions that we presented earlier.33 Although
we lose a large number of observations because most agents did not receive visits in all months
for which we have transactions data, the total number of observations in the regressions still
32 It should be noted that this assessment of the agent is not in any way linked to the agent’s performance in terms of
number of transactions or volumes transacted. These assessments are carried out in the field by personnel that does
not have access to the headquarters database on transactions. 33 Because the transactions performance category and its sub-components were not significantly associated with
transaction numbers or volumes, we do not include it among the explanatory variables in the models presented in
Table 7.

26
approaches 900. Estimated coefficients and patterns of significance are also similar to those for
the base results, although we lose significance on a few coefficients in the models that use standard
errors clustered at the municipality level. We note that the market characteristic variables (income,
commercial density) lose significance when we include the monitoring variables in our
regressions. In part, this could merely reflect changes in sample composition due to the reduced
number of observations. Another interpretation, however, is that learning through the monitoring
process enables agents to adapt to their markets to increase their transactions, and thus the
characteristics of those markets matter less for predicting their transactions performance.
Indeed, the large and highly significant positive coefficients for the scores for liquidity
management, client services, and branding are striking. Those for liquidity management and
branding are especially robust across models. A one standard deviation increase in the liquidity
management variable is associated with 53-65 additional cash-in transactions per month,
depending on the specification; the same increase in the branding variable implies 40-48 more
transactions.34 Note also that the overall fit of the regressions (as reflected in the r-squared statistic)
increases to around 0.25 when monitoring variables are included, regardless of the dependent
variable or the standard errors that we use. Of course, we do not view the correlations in Table 7
as demonstrating a causal link from improved monitoring scores to more agent transactions.
Rather, it seems at least as likely that the monitoring scores could be summarizing characteristics
that are unobservable to us as researchers that lead to greater (or less) success of agents. We
therefore perform additional tests in which we explain variation in transactions using agent-
specific fixed effects and the monitoring variables. Agent fixed effects are included to summarize
the average transactions performance of each agent. These models are therefore designed to test
34 For example, the coefficient for the liquidity variable in models 3 and 4 is 20.69 and its standard deviation is 3.12
(the score can range from 0 to 10.5). 20.69*3.12 = 64.6 additional transactions.
27
whether improvements (declines) in an agent’s monitoring scores are associated with more (fewer)
transactions than his/her average.
Table 8 presents agent fixed effects models using the number of cash-in transactions as the
dependent variable; Table 9 uses the log of cash-in volume. Again, we find very similar results
when the number of cash-out transactions or their volumes is used as the dependent variable, and
so we do not present those results here. In Table 8, the total scores for liquidity management and
branding remain highly significant and economically meaningful. For example, models 1 and 2
imply that a one standard deviation increase in the liquidity variable is associated with 21 cash-in
transactions more than an agent’s typical monthly number.
When we de-compose the liquidity and branding variables into their sub-components in
models 3 and 4, it appears that most of the explanatory power is loading on cash-float management
for the liquidity variable and FINCA signage for the branding variable. The cash-float result points
to the importance of having sufficient cash on hand to operate effectively as an agent. Note that,
even though we present this result in the context of a cash-in regression, it also holds when we use
the number of cash-out transactions as the dependent variable (results not reported to conserve
space). Effective liquidity management, therefore, is an essential element of a successful agent’s
business strategy, since failure to perform transactions due to a lack of cash on hand undermines
clients’ faith in an agent’s reliability.
We do not take the result for FINCA signage too literally since it is correlated with agent
visibility, which also approaches significance. Our sense is that it is the overall effort to improve

28
branding, rather than improvement on one particular detail that is associated with increased agent
transactions.35
In Table 9, we present agent fixed effects models that use (log of) monthly cash-in volumes
as the dependent variable. The coefficient for branding is positive and highly significant, though
that for liquidity management is not significant (models 1 and 2). However, when the sub-
components of those variables enter the regressions (models 3 and 4), the cash float and the FINCA
signage variables are positive and highly significant, just as they were in the models that used the
number of cash-in transactions as the dependent variable. The coefficients imply sizable gains in
cash-in volumes associated with improvement on these dimensions. For example, for an agent with
the median cash-in volume ($14,297 per month), increasing the branding total score by one
standard deviation would be associated with a $12,072 gain in monthly cash-in volume. In all, the
agent fixed effects models suggest that monitoring the performance of agents and suggesting areas
for improvements can help them increase the number and volume of their cash-in/cash-out
transactions.
7. Conclusions
Does agent banking hold the potential for cost-effective provision of financial services to
clients that are typically excluded by the formal financial system? We provide evidence on the
transaction activities of the agents of a microfinance institution operating in and around Kinshasa,
DRC. To our knowledge, this is some of the first empirical research on agents, and certainly the
first evidence from a country as financially underdeveloped as the DRC.
35 That said, the FINCA sign is a distinctive and easily recognized trademark that can only be legally provided
through official FINCA channels. The sign may therefore provide an important indication to a client that an agent is
officially authorized.

29
We focus on explaining variation in the number and volume of agents’ monthly cash-
in/cash-out transactions, and find support for the notion that trust in an agent (because of his/her
age or the age of his/her retail business) is associated with more transactions. We also find some
evidence that the lack of available financial services in a local market and the suitability of
microfinance products for that market are associated with greater numbers and volumes of agent
transactions. But even after controlling for those factors, basic characteristics of the local market
and the agent’s potential clientele explain the lion’s share of variation in cash-in/cash-out
transactions. In this context, at least, agents appear to thrive in densely populated, low income
areas that have relatively high levels of commercial activity. We also provide evidence suggesting
that monitoring visits can help to improve agents’ numbers and volumes of transactions, regardless
of the profile of their local markets.
Our results suggest that agents can be effective providers of basic financial services among
the urban poor who lack suitable alternatives. But a key challenge is to spur financial inclusion
among those in more sparsely populated areas, and our results could be viewed as casting doubt
on the notion that agents would be feasible providers in those environments, since they rely so
heavily on foot traffic in commercially developed, densely populated areas to drive the number
and volume of transactions. To be fair, however, our analysis covers only municipalities in and
around Kinshasa and thus it is only our conjecture that the agent model might face additional
challenges outside those areas.36 Thus it remains to be seen how the agent banking model will play
out in less densely populated areas of the DRC.37
36 In addition, relatively low population density within our sample does not imply that these are geographically
remote or poor areas relative to the rest of the DRC. 37 In a country of the size of Western Europe, it may be unrealistic to expect agent banking to reach the most
scarcely populated areas.
30
However, the fact that demographic variables explain substantial variation in agent
transactions in a relatively homogenous set of urban and peri-urban municipalities suggests to us
that more sparsely populated settings will likely pose challenges for the agent banking model.
Cost-reducing adaptations of the model, incorporating perhaps mobile banking options, could be
required. Also important is the question about the external validity of a model calculated with
Kinshasa data. While it should be a good estimate of agent transactions in major cities, further
research is needed in smaller cities and towns. Here larger challenges in terms of liquidity
management and agent quality management may prove difficult obstacles for operators of agent
networks such as FINCA. Going forward, better data on agent profitability over time would help
in assessing the viability of this model in different types of markets and survey data from users
(and nonusers) of agent services would help to assess how the availability of those services affects
financial behavior.

31
References
Aker, Jenny C. and Isaac M. Mbiti. 2010. “Mobile Phones and Economic Development in Africa.”
Journal of Economic Perspectives 24(3): 207-232.
Allen, Franklin, Elena Carletti, Robert Cull, Jun Qian, Lemma Senbet, and Patricio Valenzuela.
2013. “Improving Access to Banking: Evidence from Kenya.” World Bank, Policy
Research Working Paper 6593.
Allen, Franklin, Elena Carletti, Robert Cull, Jun Qian, Lemma Senbet, and Patricio Valenzuela.
2014. “The African Financial Development and Financial Inclusion Gaps.” Journal of
African Economies 23(5): 614-642.
Allen, Franklin, Elena Carletti, Robert Cull, Jun Qian, Lemma Senbet, and Patricio Valenzuela.
2015. “Resolving the African Financial Development Gap: Cross-Country Comparisons
and a Within Country Study of Kenya.” In Sebastian Edwards, Simon Johnson, and David
N. Weil, Editors, African Successes, Volume 3: Modernization and Development, Chicago:
University of Chicago Press.
Alliance for Financial Inclusion, 2012. “Agent Banking in Latin America.” AFI discussion paper,
March.
Aycinena, Diego Martínez, and Dean Yang. 2010. “The Impact of Remittance Fees on Remittance
Flows: Evidence from a Field Experiment among Salvadorian Migrants.” University of
Michigan, mimeo.
Beck, Thorsten and Robert Cull. 2015. ““Banking in Africa,” In A.N. Berger, P. Molyneux, and
J.O.S. Wilson, Editors. Oxford Handbook of Banking, 2nd Edition, Oxford: Oxford
University Press. pp. 913-937.
Beck, Thorsten and Robert Cull. 2014. “Banking Systems in Sub-Saharan Africa: A Progress
Report.” Revue D’Economique Financiere 116(4): 43-56.
Blumenstock, Joshua, Nathan Eagle and Marcel Fafchamps, 2011, “Risk and Reciprocity Over the
Mobile Phone Network: Evidence from Rwanda,” CSAE Working Paper 2011-19; Oxford,
UK.
Brandt, Loren and Arthur J. Hosios, 2010. “Interest-free Loans between Villagers.” Economic
Development and Cultural Change 58(2): 345-372.
Collins, Daryl, Jonathan Morduch, Stuart Rutherford, and Orlanda Ruthven. 2009. Portfolios of
the Poor: How the World’s Poor Live on $2 a Day. Princeton, N.J.: Princeton University
Press.
De Weerdt, Joachim and Stefan Dercon. 2006. “Risk Sharing Networks and Insurance Against
Illness.” Journal of Development Economics 81(2): 337-356.
32
Demirgüç-Kunt, Aslı and Leora Klapper. 2012a. “Measuring Financial Inclusion: The Global
Findex Database.” World Bank Policy Research Working Paper 6025, Washington, DC:
World Bank.
Demirgüç-Kunt, Aslı and Leora Klapper. 2012b. “The Global Findex Database: Financial
Inclusion in Sub-Saharan Africa.” Findex Note 4. Washington, DC: World Bank.
Demirgüç-Kunt, Aslı, Leora Klapper, Dorothe Singer, and Peter Van Oudheusden. 2015. “The
Global Findex Database 2014: Measuring Financial Inclusion around the World.” World
Bank Policy Research Working Paper 7255, Washington, DC: World Bank.
Fafchamps, Marcel, and Susan Lund. 2013. “Risk Sharing Networks in Rural Philippines.” Journal
of Development Economics 71(2): 261-287.
Flamming, Mark, Claudia McKay, and Mark Pickens. 2011. Agent Management Toolkit: Building
a Viable Network of Branchless Banking Agents. Consultative Group to Assist the Poor
(CGAP) Technical Guide. CGAP: Washington, D.C.
Genoni, Maria Eugenia. 2012. “Health Shocks and Consumption Smoothing: Evidence from
Indoensia.” Economic Development and Cultural Change 60(3): 475-506.
Gertler, Paul, and Jonathan Gruber. 2002. “Insuring Consumption Against Illness.” American
Economic Review 92(1): 51-76.
Jack, William, Adam Ray, and Tavneet Suri. 2013. “Money Management by Households and
Firms in Kenya.” American Economic Review: Papers and Proceedings 103(3): 1-8.
Jack, William and Tavneet Suri. 2014. “Risk Sharing and Transactions costs: Evidence from
Kenya’s Mobile Money Revolution.” American Economic Review 104(1): 183-223.
Lyman, Timothy, Gautam Ivatury, and Stefan Staschen. 2006. “Use of Agents in Branchless for
the Poor: Rewards, Risks, and Regulation.” Consultative Group to Assist the Poor (CGAP),
Focus Note No.38.
Mas, Ignacio, and Kabir Kumar. 2008. “Banking on Mobiles: Why, How, for Whom?”
Consultative Group to Assist the Poor (CGAP), Focus Note No.48.
Mbiti, Isaac and David N. Weil. 2015. “Mobile Banking: The Impact of M-PESA in Kenya.” In
Sebastian Edwards, Simon Johnson, and David N. Weil, Editors, African Successes,
Volume 3: Modernization and Development, Chicago: University of Chicago Press.
Siedek, Hannah. 2008. “Extending Financial Services with Banking Agents.” Consultative Group
to Assist the Poor (CGAP) Brief. CGAP: Washington, D.C.

33
World Bank. 2014. Global Financial Development Report 2014: Financial Inclusion. Washingotn,
DC: World Bank.
Yang, Dean, and HwaJung Choi. 2007. “Are Remittances Insurance? Evidence from Rainfall
Shocks in the Philippines.” World Bank Economic Review 21(2): 219-248.

34
Table 1. Cash In Number of Transactions Regression P-values are in brackets. *, **, *** represent statistical significance at the 10%, 5%, and 1% level respectively. All models are estimated via two methods: robust standard errors OLS and clustering errors by municipality OLS
Robust SE Cluster(M) Robust SE Cluster(M) Robust SE Cluster(M) Robust SE Cluster(M) Robust SE Cluster(M) Robust SE Cluster(M) Robust SE Cluster(M) Robust SE Cluster(M)
(1) (2) (3) (4) (5) (6) (7) (8) (9) (10) (11) (12) (13) (14) (15) (16)
Ow
ner
ch
arac
teri
stic
s
Owner age
3.630*** 3.630 3.773*** 3.773* 3.747*** 3.747* 5.504*** 5.504** 5.271*** 5.271** 5.412*** 5.412** 5.298*** 5.298** 5.411*** 5.411**
(0.583) (2.146) (0.605) (2.167) (0.617) (2.185) (0.733) (2.381) (0.663) (2.534) (0.661) (2.521) (0.629) (2.300) (0.639) (2.311)
Owner Primary
Education
9.520 9.520 5.625 5.625 -11.81 -11.81 15.87 15.87 4.819 4.819 1.700 1.700 3.754 3.754 2.993 2.993
(11.59) (53.80) (12.05) (55.74) (14.08) (68.60) (15.16) (77.35) (13.13) (61.80) (13.74) (64.64) (13.83) (65.52) (13.96) (65.98)
Owner Gender (F=0, M=1)
-32.60*** -32.60 -31.10*** -31.10 -23.87* -23.87 -13.41 -13.41 -1.808 -1.808 0.223 0.223 -0.701 -0.701 0.298 0.298
(11.46) (35.06) (11.69) (34.81) (12.29) (38.07) (13.44) (42.56) (12.60) (40.51) (12.63) (40.53) (12.37) (40.20) (12.48) (40.49)
Bu
sin
ess
char
acte
rist
cs
Business Age
-2.040*** -2.040 -2.234*** -2.234 -1.774** -1.774 0.408 0.408 0.0731 0.0731 -0.566 -0.566 -0.366 -0.366
(0.704) (2.051) (0.671) (1.896) (0.748) (1.645) (0.689) (2.050) (0.709) (2.238) (0.705) (2.212) (0.701) (2.135)
Stock Value
-0.287*** -0.287** -0.246*** -0.246** -0.221*** -0.221*** -0.155*** -0.155 -0.153*** -0.153 -0.151*** -0.151 -0.150*** -0.150
(0.0344) (0.118) (0.0338) (0.0968) (0.0325) (0.0751) (0.0561) (0.116) (0.0515) (0.108) (0.0506) (0.0957) (0.0503) (0.0950)
Mu
nic
ipal
ity
char
acte
rist
ics
Commercial low density
-76.91*** -76.91* -96.68*** -96.68** -59.02*** -59.02 -79.90*** -79.90*
(11.75) (40.67) (12.22) (40.49) (11.41) (35.10) (15.94) (40.75)
Income high
-96.81*** -96.81** -63.97*** -63.97 -111.8*** -111.8 -102.1*** -102.1
(14.59) (34.99) (18.29) (56.37) (25.37) (82.12) (26.86) (87.97)
Population
3.223*** 3.223*** 2.997*** 2.997*** 3.033*** 3.033*** 3.030*** 3.030***
(0.377) (0.857) (0.355) (0.859) (0.360) (0.933) (0.359) (0.926)
Density
2.232*** 2.232** 2.262*** 2.262** 1.383*** 1.383 1.538*** 1.538*
(0.335) (1.020) (0.336) (0.957) (0.331) (0.863) (0.361) (0.847)
Financial density high
-48.52*** -48.52 -45.77** -45.77
(17.43) (63.62) (23.29) (62.02)
Banks
45.62* 45.62 46.26** 46.26
(23.48) (71.07) (23.44) (71.38)
Micro finance
89.64*** 89.64** 51.37** 51.37
(16.48) (41.09) (24.59) (61.76)
Mobile banking
23.45* 23.45 -8.875 -8.875
(14.09) (36.55) (17.42) (42.91)
Mean od cashintx
202.6 202.6 206.5 206.5 206.5 206.5 206.5 206.5 210.4 210.4 210.4 210.4 210.4 210.4 210.4 210.4
(259.7) (259.7) (264.1) (264.1) (264.1) (264.1) (264.1) (264.1) (272.3) (272.3) (272.3) (272.3) (272.3) (272.3) (272.3) (272.3)
Observations 2,296 2,296 2,202 2,202 2,202 2,202 2,202 2,202 1,921 1,921 1,921 1,921 1,921 1,921 1,921 1,921
R-squared 0.023 0.023 0.028 0.028 0.053 0.053 0.205 0.205 0.136 0.136 0.140 0.140 0.143 0.143 0.144 0.144
District fixed effects No No No No Yes Yes No No No No No No No No No No
Municipality fixed effects No No No No No No Yes Yes No No No No No No No No

35
Table 2. Cash Out Number of Transactions Regression P-values are in brackets. *, **, *** represent statistical significance at the 10%, 5%, and 1% level respectively. All models are estimated via two methods: robust standard errors OLS and clustering errors by municipality OLS
Robust SE Cluster(M) Robust SE Cluster(M) Robust SE Cluster(M) Robust SE Cluster(M) Robust SE Cluster(M) Robust SE Cluster(M) Robust SE Cluster(M) Robust SE Cluster(M)
(1) (2) (3) (4) (5) (6) (7) (8) (9) (10) (11) (12) (13) (14) (15) (16)
Ow
ner
ch
arac
teri
stic
s
Owner age
2.437*** 2.437 2.530*** 2.530 2.363*** 2.363 3.670*** 3.670 3.127*** 3.127 3.136*** 3.136 2.975*** 2.975 3.059*** 3.059
(0.506) (1.749) (0.526) (1.835) (0.540) (1.957) (0.639) (2.233) (0.581) (2.223) (0.577) (2.201) (0.528) (2.031) (0.539) (2.067)
Owner Primary Education
-9.384 -9.384 -11.89 -11.89 -18.72 -18.72 9.251 9.251 -6.437 -6.437 -6.639 -6.639 -4.453 -4.453 -5.012 -5.012
(9.692) (43.24) (10.10) (45.12) (11.89) (54.72) (12.95) (63.66) (11.34) (52.03) (11.84) (54.29) (11.84) (54.74) (11.98) (55.15)
Owner Gender (F=0, M=1)
-10.46 -10.46 -10.67 -10.67 -7.529 -7.529 -5.153 -5.153 18.33* 18.33 18.46* 18.46 17.39* 17.39 18.12* 18.12
(9.441) (31.52) (9.697) (32.40) (10.31) (36.15) (11.63) (40.35) (10.60) (35.96) (10.64) (36.19) (10.32) (35.79) (10.40) (36.22)
Bu
sin
ess
char
acte
rist
cs
Business Age
-1.041* -1.041 -1.576*** -1.576 -2.044*** -2.044 -0.750 -0.750 -0.772 -0.772 -1.238** -1.238 -1.091** -1.091
(0.577) (1.715) (0.549) (1.693) (0.620) (1.649) (0.511) (1.640) (0.534) (1.805) (0.535) (1.779) (0.537) (1.724)
Stock Value
-0.137*** -0.137 -0.113*** -0.113* -0.128*** -0.128** -0.0550* -0.0550 -0.0549* -0.0549 -0.0443 -0.0443 -0.0438 -0.0438
(0.0286) (0.0900) (0.0255) (0.0646) (0.0268) (0.0591) (0.0298) (0.0720) (0.0296) (0.0720) (0.0270) (0.0609) (0.0268) (0.0608)
Mu
nic
ipal
ity
char
acte
rist
ics
Commercial low density
-77.25*** -77.25* -78.53*** -78.53** -56.37*** -56.37* -71.70*** -71.70*
(9.351) (38.41) (9.352) (36.07) (8.195) (28.14) (13.07) (37.23)
Income high
-81.18*** -81.18** -79.06*** -79.06 -134.3*** -134.3** -127.2*** -127.2*
(13.61) (32.97) (15.25) (48.31) (21.19) (62.52) (21.99) (66.83)
Population
2.352*** 2.352*** 2.338*** 2.338*** 2.431*** 2.431** 2.429*** 2.429**
(0.376) (0.832) (0.355) (0.819) (0.359) (0.876) (0.359) (0.870)
Density
0.959*** 0.959 0.961*** 0.961 0.210 0.210 0.324 0.324
(0.230) (0.701) (0.229) (0.682) (0.220) (0.583) (0.245) (0.555)
Financial density high
-3.142 -3.142
-33.61* -33.61
(13.56) (50.54)
(19.65) (42.98)
Banks
68.87*** 68.87 69.34*** 69.34
(18.83) (52.95) (18.78) (53.13)
Micro finance
49.93*** 49.93* 21.82 21.82
(11.97) (24.47) (21.34) (44.04)
Mobile banking
-1.670 -1.670 -25.41* -25.41
(11.57) (29.11) (13.06) (32.94)
Mean of cashouttx
131.0 131.0 133.2 133.2 133.2 133.2 133.2 133.2 131.8 131.8 131.8 131.8 131.8 131.8 131.8 131.8
(215.9) (215.9) (219.9) (219.9) (219.9) (219.9) (219.9) (219.9) (223.0) (223.0) (223.0) (223.0) (223.0) (223.0) (223.0) (223.0)
Observations 2,296 2,296 2,202 2,202 2,202 2,202 2,202 2,202 1,921 1,921 1,921 1,921 1,921 1,921 1,921 1,921
R-squared 0.013 0.013 0.015 0.015 0.037 0.037 0.166 0.166 0.102 0.102 0.102 0.102 0.110 0.110 0.110 0.110
District fixed effects No No No No Yes Yes No No No No No No No No No No
Municipality fixed effects No No No No No No Yes Yes No No No No No No No No

36
Table 3. Cash In Volume (Log) Regression P-values are in brackets. *, **, *** represent statistical significance at the 10%, 5%, and 1% level respectively. All models are estimated via two methods: robust standard errors OLS and clustering errors by municipality OLS
Robust SE Cluster(M) Robust SE Cluster(M) Robust SE Cluster(M) Robust SE Cluster(M) Robust SE Cluster(M) Robust SE Cluster(M) Robust SE Cluster(M) Robust SE Cluster(M)
(1) (2) (3) (4) (5) (6) (7) (8) (9) (10) (11) (12) (13) (14) (15) (16)
Ow
ner
ch
arac
teri
stic
s
Owner age
0.0175*** 0.0175* 0.0194*** 0.0194* 0.0194*** 0.0194** 0.0272*** 0.0272*** 0.0232*** 0.0232** 0.0247*** 0.0247** 0.0256*** 0.0256** 0.0262*** 0.0262***
(0.00430) (0.00966) (0.00430) (0.00962) (0.00466) (0.00810) (0.00533) (0.00855) (0.00429) (0.0107) (0.00428) (0.0104) (0.00454) (0.00927) (0.00456) (0.00919)
Owner Primary
Education
0.0879 0.0879 0.0497 0.0497 0.0488 0.0488 0.224* 0.224 0.0633 0.0633 0.0309 0.0309 0.0398 0.0398 0.0355 0.0355
(0.0920) (0.219) (0.0964) (0.223) (0.102) (0.274) (0.121) (0.315) (0.102) (0.239) (0.103) (0.244) (0.104) (0.247) (0.104) (0.248)
Owner Gender (F=0, M=1)
-0.283*** -0.283 -0.294*** -0.294 -0.300*** -0.300 -0.259** -0.259 -0.148 -0.148 -0.127 -0.127 -0.124 -0.124 -0.118 -0.118
(0.0973) (0.193) (0.0981) (0.199) (0.0969) (0.200) (0.104) (0.214) (0.106) (0.180) (0.106) (0.185) (0.107) (0.183) (0.106) (0.182)
Bu
sin
ess
char
acte
rist
cs
Business Age
-0.0173* -0.0173 -0.0225** -0.0225 -0.0242** -0.0242 -0.00157 -0.00157 -0.00494 -0.00494 -0.00880 -0.00880 -0.00768 -0.00768
(0.00903) (0.0154) (0.00922) (0.0155) (0.0101) (0.0159) (0.00859) (0.0180) (0.00876) (0.0184) (0.00916) (0.0179) (0.00925) (0.0179)
Stock Value
-0.002*** -0.00201* -0.002*** -0.0021** -0.002*** -0.00202 -0.002*** -0.0020** -0.002*** -0.00203* -0.002*** -0.0021** -0.002*** -0.0021**
(0.000628) (0.00110) (0.000604) (0.000995) (0.000690) (0.00124) (0.000726) (0.000957) (0.000734) (0.00101) (0.000734) (0.000976) (0.000735) (0.000976)
Mu
nic
ipal
ity
char
acte
rist
ics
Commercial low density
-0.194 -0.194 -0.397*** -0.397 -0.140 -0.140 -0.256 -0.256
(0.132) (0.227) (0.138) (0.249) (0.143) (0.225) (0.180) (0.282)
Income high
-0.410*** -0.410* -0.0750 -0.0750 -0.238 -0.238 -0.184 -0.184
(0.115) (0.220) (0.150) (0.349) (0.205) (0.531) (0.217) (0.574)
Population
0.0123*** 0.0123*** 0.00992**
* 0.00992* 0.00975**
* 0.00975* 0.00973**
* 0.00973*
(0.00193) (0.00434) (0.00198) (0.00496) (0.00200) (0.00499) (0.00200) (0.00500)
Density
0.00610** 0.00610 0.00637** 0.00637 0.000494 0.000494 0.00135 0.00135
(0.00283) (0.00769) (0.00282) (0.00692) (0.00361) (0.00738) (0.00380) (0.00749)
Financial density high
-0.495*** -0.495
-0.255 -0.255
(0.138) (0.382)
(0.251) (0.368)
Banks
-0.000671 -0.000671 0.00317 0.00317
(0.221) (0.476) (0.221) (0.480)
Micro finance
0.700*** 0.700** 0.487* 0.487
(0.191) (0.308) (0.287) (0.436)
Mobile banking
0.129 0.129 -0.0502 -0.0502
(0.151) (0.287) (0.230) (0.346)
Mean of cashin_volume (ln)
9.274 9.274 9.285 9.285 9.285 9.285 9.285 9.285 9.263 9.263 9.263 9.263 9.263 9.263 9.263 9.263
(2.047) (2.047) (2.053) (2.053) (2.053) (2.053) (2.053) (2.053) (2.052) (2.052) (2.052) (2.052) (2.052) (2.052) (2.052) (2.052)
Observations 2,281 2,281 2,187 2,187 2,187 2,187 2,187 2,187 1,913 1,913 1,913 1,913 1,913 1,913 1,913 1,913
R-squared 0.012 0.012 0.019 0.019 0.028 0.028 0.116 0.116 0.042 0.042 0.049 0.049 0.054 0.054 0.054 0.054
District fixed effects No No No No Yes Yes No No No No No No No No No No
Municipality fixed effects No No No No No No Yes Yes No No No No No No No No
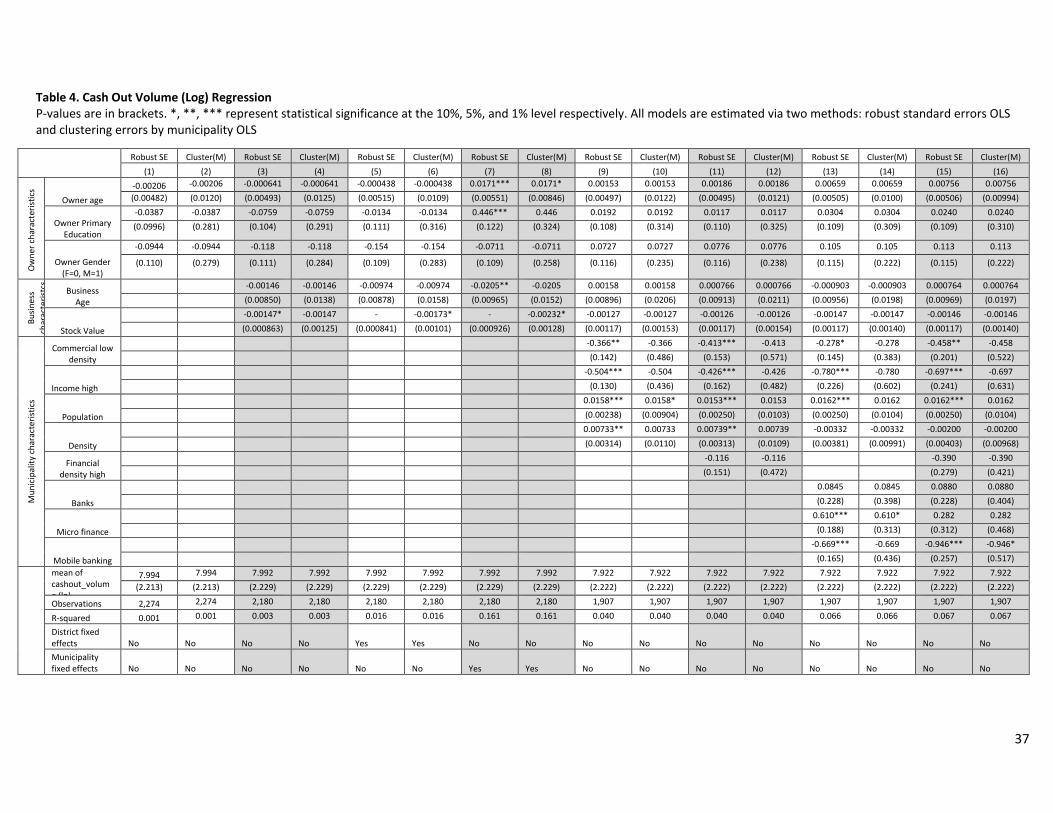
37
Table 4. Cash Out Volume (Log) Regression P-values are in brackets. *, **, *** represent statistical significance at the 10%, 5%, and 1% level respectively. All models are estimated via two methods: robust standard errors OLS and clustering errors by municipality OLS
Robust SE Cluster(M) Robust SE Cluster(M) Robust SE Cluster(M) Robust SE Cluster(M) Robust SE Cluster(M) Robust SE Cluster(M) Robust SE Cluster(M) Robust SE Cluster(M)
(1) (2) (3) (4) (5) (6) (7) (8) (9) (10) (11) (12) (13) (14) (15) (16)
Ow
ner
ch
arac
teri
stic
s
Owner age
-0.00206 -0.00206 -0.000641 -0.000641 -0.000438 -0.000438 0.0171*** 0.0171* 0.00153 0.00153 0.00186 0.00186 0.00659 0.00659 0.00756 0.00756
(0.00482) (0.0120) (0.00493) (0.0125) (0.00515) (0.0109) (0.00551) (0.00846) (0.00497) (0.0122) (0.00495) (0.0121) (0.00505) (0.0100) (0.00506) (0.00994)
Owner Primary Education
-0.0387 -0.0387 -0.0759 -0.0759 -0.0134 -0.0134 0.446*** 0.446 0.0192 0.0192 0.0117 0.0117 0.0304 0.0304 0.0240 0.0240
(0.0996) (0.281) (0.104) (0.291) (0.111) (0.316) (0.122) (0.324) (0.108) (0.314) (0.110) (0.325) (0.109) (0.309) (0.109) (0.310)
Owner Gender (F=0, M=1)
-0.0944 -0.0944 -0.118 -0.118 -0.154 -0.154 -0.0711 -0.0711 0.0727 0.0727 0.0776 0.0776 0.105 0.105 0.113 0.113
(0.110) (0.279) (0.111) (0.284) (0.109) (0.283) (0.109) (0.258) (0.116) (0.235) (0.116) (0.238) (0.115) (0.222) (0.115) (0.222)
Bu
sin
ess
char
acte
rist
cs
Business Age
-0.00146 -0.00146 -0.00974 -0.00974 -0.0205** -0.0205 0.00158 0.00158 0.000766 0.000766 -0.000903 -0.000903 0.000764 0.000764
(0.00850) (0.0138) (0.00878) (0.0158) (0.00965) (0.0152) (0.00896) (0.0206) (0.00913) (0.0211) (0.00956) (0.0198) (0.00969) (0.0197)
Stock Value
-0.00147* -0.00147 -0.00173**
-0.00173* -0.00232**
-0.00232* -0.00127 -0.00127 -0.00126 -0.00126 -0.00147 -0.00147 -0.00146 -0.00146
(0.000863) (0.00125) (0.000841) (0.00101) (0.000926) (0.00128) (0.00117) (0.00153) (0.00117) (0.00154) (0.00117) (0.00140) (0.00117) (0.00140)
Mu
nic
ipal
ity
char
acte
rist
ics
Commercial low density
-0.366** -0.366 -0.413*** -0.413 -0.278* -0.278 -0.458** -0.458
(0.142) (0.486) (0.153) (0.571) (0.145) (0.383) (0.201) (0.522)
Income high
-0.504*** -0.504 -0.426*** -0.426 -0.780*** -0.780 -0.697*** -0.697
(0.130) (0.436) (0.162) (0.482) (0.226) (0.602) (0.241) (0.631)
Population
0.0158*** 0.0158* 0.0153*** 0.0153 0.0162*** 0.0162 0.0162*** 0.0162
(0.00238) (0.00904) (0.00250) (0.0103) (0.00250) (0.0104) (0.00250) (0.0104)
Density
0.00733** 0.00733 0.00739** 0.00739 -0.00332 -0.00332 -0.00200 -0.00200
(0.00314) (0.0110) (0.00313) (0.0109) (0.00381) (0.00991) (0.00403) (0.00968)
Financial density high
-0.116 -0.116 -0.390 -0.390
(0.151) (0.472) (0.279) (0.421)
Banks
0.0845 0.0845 0.0880 0.0880
(0.228) (0.398) (0.228) (0.404)
Micro finance
0.610*** 0.610* 0.282 0.282
(0.188) (0.313) (0.312) (0.468)
Mobile banking
-0.669*** -0.669 -0.946*** -0.946*
(0.165) (0.436) (0.257) (0.517)
mean of cashout_volume (ln)
7.994 7.994 7.992 7.992 7.992 7.992 7.992 7.992 7.922 7.922 7.922 7.922 7.922 7.922 7.922 7.922
(2.213) (2.213) (2.229) (2.229) (2.229) (2.229) (2.229) (2.229) (2.222) (2.222) (2.222) (2.222) (2.222) (2.222) (2.222) (2.222)
Observations 2,274 2,274 2,180 2,180 2,180 2,180 2,180 2,180 1,907 1,907 1,907 1,907 1,907 1,907 1,907 1,907
R-squared 0.001 0.001 0.003 0.003 0.016 0.016 0.161 0.161 0.040 0.040 0.040 0.040 0.066 0.066 0.067 0.067
District fixed effects No No No No Yes Yes No No No No No No No No No No
Municipality fixed effects No No No No No No Yes Yes No No No No No No No No
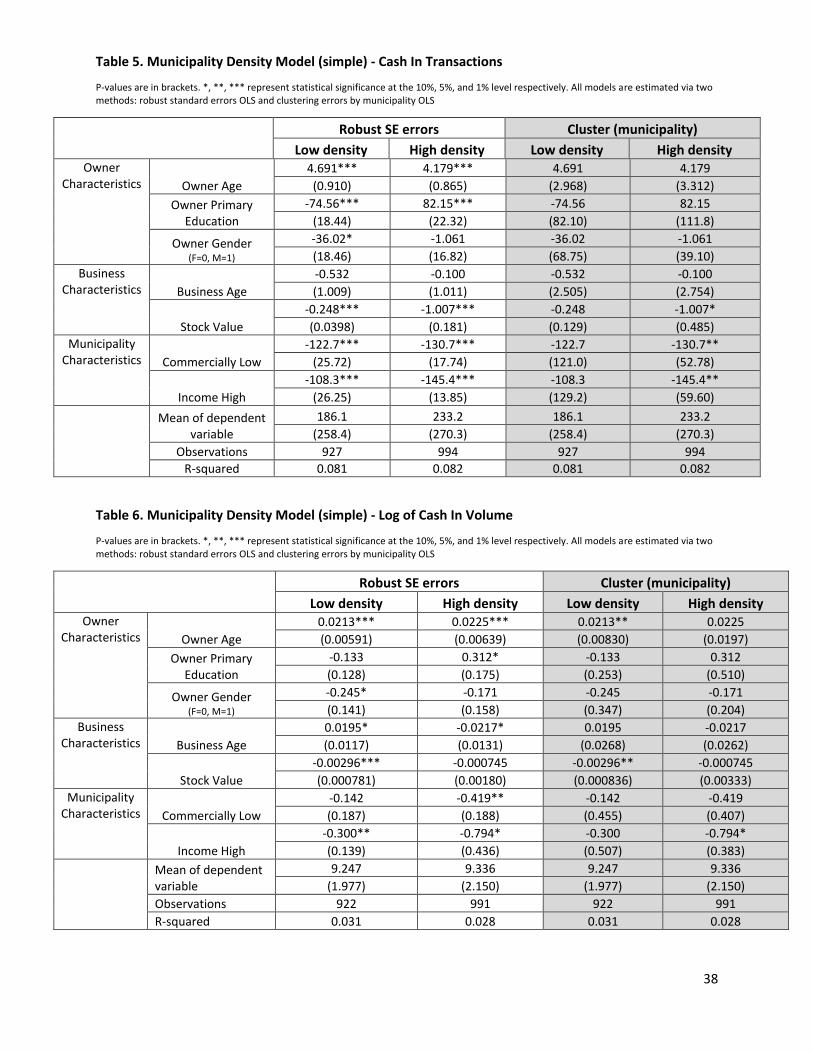
38
Table 5. Municipality Density Model (simple) - Cash In Transactions
P-values are in brackets. *, **, *** represent statistical significance at the 10%, 5%, and 1% level respectively. All models are estimated via two methods: robust standard errors OLS and clustering errors by municipality OLS
Robust SE errors Cluster (municipality)
Low density High density Low density High density Owner
Characteristics Owner Age
4.691*** 4.179*** 4.691 4.179
(0.910) (0.865) (2.968) (3.312)
Owner Primary Education
-74.56*** 82.15*** -74.56 82.15
(18.44) (22.32) (82.10) (111.8)
Owner Gender (F=0, M=1)
-36.02* -1.061 -36.02 -1.061
(18.46) (16.82) (68.75) (39.10)
Business Characteristics Business Age
-0.532 -0.100 -0.532 -0.100
(1.009) (1.011) (2.505) (2.754)
Stock Value
-0.248*** -1.007*** -0.248 -1.007*
(0.0398) (0.181) (0.129) (0.485)
Municipality Characteristics Commercially Low
-122.7*** -130.7*** -122.7 -130.7**
(25.72) (17.74) (121.0) (52.78)
Income High
-108.3*** -145.4*** -108.3 -145.4**
(26.25) (13.85) (129.2) (59.60)
Mean of dependent variable
186.1 233.2 186.1 233.2
(258.4) (270.3) (258.4) (270.3)
Observations 927 994 927 994
R-squared 0.081 0.082 0.081 0.082
Table 6. Municipality Density Model (simple) - Log of Cash In Volume
P-values are in brackets. *, **, *** represent statistical significance at the 10%, 5%, and 1% level respectively. All models are estimated via two methods: robust standard errors OLS and clustering errors by municipality OLS
Robust SE errors Cluster (municipality)
Low density High density Low density High density Owner
Characteristics Owner Age
0.0213*** 0.0225*** 0.0213** 0.0225
(0.00591) (0.00639) (0.00830) (0.0197)
Owner Primary Education
-0.133 0.312* -0.133 0.312
(0.128) (0.175) (0.253) (0.510)
Owner Gender (F=0, M=1)
-0.245* -0.171 -0.245 -0.171
(0.141) (0.158) (0.347) (0.204)
Business Characteristics Business Age
0.0195* -0.0217* 0.0195 -0.0217
(0.0117) (0.0131) (0.0268) (0.0262)
Stock Value
-0.00296*** -0.000745 -0.00296** -0.000745
(0.000781) (0.00180) (0.000836) (0.00333)
Municipality Characteristics Commercially Low
-0.142 -0.419** -0.142 -0.419
(0.187) (0.188) (0.455) (0.407)
Income High
-0.300** -0.794* -0.300 -0.794*
(0.139) (0.436) (0.507) (0.383)
Mean of dependent variable
9.247 9.336 9.247 9.336
(1.977) (2.150) (1.977) (2.150)
Observations 922 991 922 991
R-squared 0.031 0.028 0.031 0.028
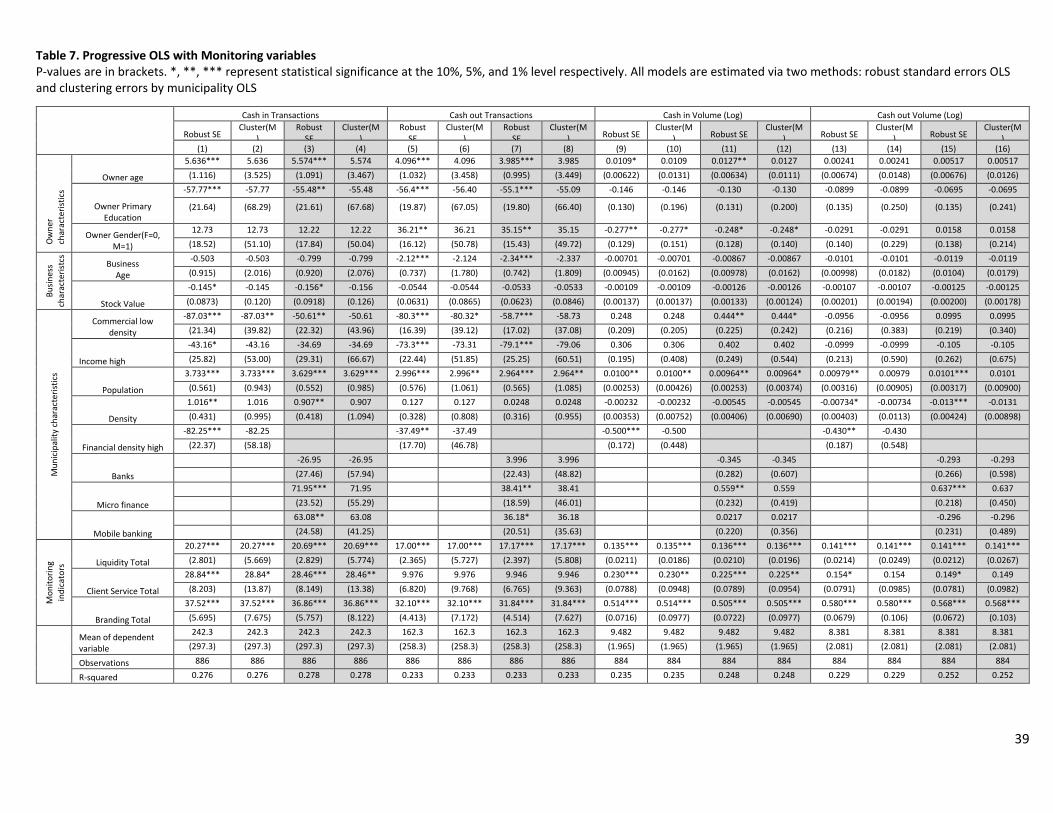
39
Table 7. Progressive OLS with Monitoring variables P-values are in brackets. *, **, *** represent statistical significance at the 10%, 5%, and 1% level respectively. All models are estimated via two methods: robust standard errors OLS and clustering errors by municipality OLS
Cash in Transactions Cash out Transactions Cash in Volume (Log) Cash out Volume (Log)
Robust SE Cluster(M
) Robust
SE Cluster(M
) Robust
SE Cluster(M
) Robust
SE Cluster(M
) Robust SE Cluster(M
) Robust SE Cluster(M
) Robust SE Cluster(M
) Robust SE Cluster(M
) (1) (2) (3) (4) (5) (6) (7) (8) (9) (10) (11) (12) (13) (14) (15) (16)
Ow
ner
ch
arac
teri
stic
s
Owner age
5.636*** 5.636 5.574*** 5.574 4.096*** 4.096 3.985*** 3.985 0.0109* 0.0109 0.0127** 0.0127 0.00241 0.00241 0.00517 0.00517
(1.116) (3.525) (1.091) (3.467) (1.032) (3.458) (0.995) (3.449) (0.00622) (0.0131) (0.00634) (0.0111) (0.00674) (0.0148) (0.00676) (0.0126)
Owner Primary Education
-57.77*** -57.77 -55.48** -55.48 -56.4*** -56.40 -55.1*** -55.09 -0.146 -0.146 -0.130 -0.130 -0.0899 -0.0899 -0.0695 -0.0695
(21.64) (68.29) (21.61) (67.68) (19.87) (67.05) (19.80) (66.40) (0.130) (0.196) (0.131) (0.200) (0.135) (0.250) (0.135) (0.241)
Owner Gender(F=0, M=1)
12.73 12.73 12.22 12.22 36.21** 36.21 35.15** 35.15 -0.277** -0.277* -0.248* -0.248* -0.0291 -0.0291 0.0158 0.0158
(18.52) (51.10) (17.84) (50.04) (16.12) (50.78) (15.43) (49.72) (0.129) (0.151) (0.128) (0.140) (0.140) (0.229) (0.138) (0.214)
Bu
sin
ess
char
acte
rist
cs
Business Age
-0.503 -0.503 -0.799 -0.799 -2.12*** -2.124 -2.34*** -2.337 -0.00701 -0.00701 -0.00867 -0.00867 -0.0101 -0.0101 -0.0119 -0.0119
(0.915) (2.016) (0.920) (2.076) (0.737) (1.780) (0.742) (1.809) (0.00945) (0.0162) (0.00978) (0.0162) (0.00998) (0.0182) (0.0104) (0.0179)
Stock Value
-0.145* -0.145 -0.156* -0.156 -0.0544 -0.0544 -0.0533 -0.0533 -0.00109 -0.00109 -0.00126 -0.00126 -0.00107 -0.00107 -0.00125 -0.00125
(0.0873) (0.120) (0.0918) (0.126) (0.0631) (0.0865) (0.0623) (0.0846) (0.00137) (0.00137) (0.00133) (0.00124) (0.00201) (0.00194) (0.00200) (0.00178)
Mu
nic
ipal
ity
char
acte
rist
ics
Commercial low density
-87.03*** -87.03** -50.61** -50.61 -80.3*** -80.32* -58.7*** -58.73 0.248 0.248 0.444** 0.444* -0.0956 -0.0956 0.0995 0.0995
(21.34) (39.82) (22.32) (43.96) (16.39) (39.12) (17.02) (37.08) (0.209) (0.205) (0.225) (0.242) (0.216) (0.383) (0.219) (0.340)
Income high
-43.16* -43.16 -34.69 -34.69 -73.3*** -73.31 -79.1*** -79.06 0.306 0.306 0.402 0.402 -0.0999 -0.0999 -0.105 -0.105
(25.82) (53.00) (29.31) (66.67) (22.44) (51.85) (25.25) (60.51) (0.195) (0.408) (0.249) (0.544) (0.213) (0.590) (0.262) (0.675)
Population
3.733*** 3.733*** 3.629*** 3.629*** 2.996*** 2.996** 2.964*** 2.964** 0.0100***
0.0100** 0.00964***
0.00964**
0.00979***
0.00979 0.0101*** 0.0101
(0.561) (0.943) (0.552) (0.985) (0.576) (1.061) (0.565) (1.085) (0.00253) (0.00426) (0.00253) (0.00374) (0.00316) (0.00905) (0.00317) (0.00900)
Density
1.016** 1.016 0.907** 0.907 0.127 0.127 0.0248 0.0248 -0.00232 -0.00232 -0.00545 -0.00545 -0.00734* -0.00734 -0.013*** -0.0131
(0.431) (0.995) (0.418) (1.094) (0.328) (0.808) (0.316) (0.955) (0.00353) (0.00752) (0.00406) (0.00690) (0.00403) (0.0113) (0.00424) (0.00898)
Financial density high
-82.25*** -82.25 -37.49** -37.49 -0.500*** -0.500 -0.430** -0.430
(22.37) (58.18) (17.70) (46.78) (0.172) (0.448) (0.187) (0.548)
Banks
-26.95 -26.95 3.996 3.996 -0.345 -0.345 -0.293 -0.293
(27.46) (57.94) (22.43) (48.82) (0.282) (0.607) (0.266) (0.598)
Micro finance
71.95*** 71.95 38.41** 38.41 0.559** 0.559 0.637*** 0.637
(23.52) (55.29) (18.59) (46.01) (0.232) (0.419) (0.218) (0.450)
Mobile banking
63.08** 63.08 36.18* 36.18 0.0217 0.0217 -0.296 -0.296
(24.58) (41.25) (20.51) (35.63) (0.220) (0.356) (0.231) (0.489)
Mo
nit
ori
ng
ind
icat
ors
Liquidity Total
20.27*** 20.27*** 20.69*** 20.69*** 17.00*** 17.00*** 17.17*** 17.17*** 0.135*** 0.135*** 0.136*** 0.136*** 0.141*** 0.141*** 0.141*** 0.141***
(2.801) (5.669) (2.829) (5.774) (2.365) (5.727) (2.397) (5.808) (0.0211) (0.0186) (0.0210) (0.0196) (0.0214) (0.0249) (0.0212) (0.0267)
Client Service Total
28.84*** 28.84* 28.46*** 28.46** 9.976 9.976 9.946 9.946 0.230*** 0.230** 0.225*** 0.225** 0.154* 0.154 0.149* 0.149
(8.203) (13.87) (8.149) (13.38) (6.820) (9.768) (6.765) (9.363) (0.0788) (0.0948) (0.0789) (0.0954) (0.0791) (0.0985) (0.0781) (0.0982)
Branding Total
37.52*** 37.52*** 36.86*** 36.86*** 32.10*** 32.10*** 31.84*** 31.84*** 0.514*** 0.514*** 0.505*** 0.505*** 0.580*** 0.580*** 0.568*** 0.568***
(5.695) (7.675) (5.757) (8.122) (4.413) (7.172) (4.514) (7.627) (0.0716) (0.0977) (0.0722) (0.0977) (0.0679) (0.106) (0.0672) (0.103)
Mean of dependent variable
242.3 242.3 242.3 242.3 162.3 162.3 162.3 162.3 9.482 9.482 9.482 9.482 8.381 8.381 8.381 8.381
(297.3) (297.3) (297.3) (297.3) (258.3) (258.3) (258.3) (258.3) (1.965) (1.965) (1.965) (1.965) (2.081) (2.081) (2.081) (2.081)
Observations 886 886 886 886 886 886 886 886 884 884 884 884 884 884 884 884
R-squared 0.276 0.276 0.278 0.278 0.233 0.233 0.233 0.233 0.235 0.235 0.248 0.248 0.229 0.229 0.252 0.252
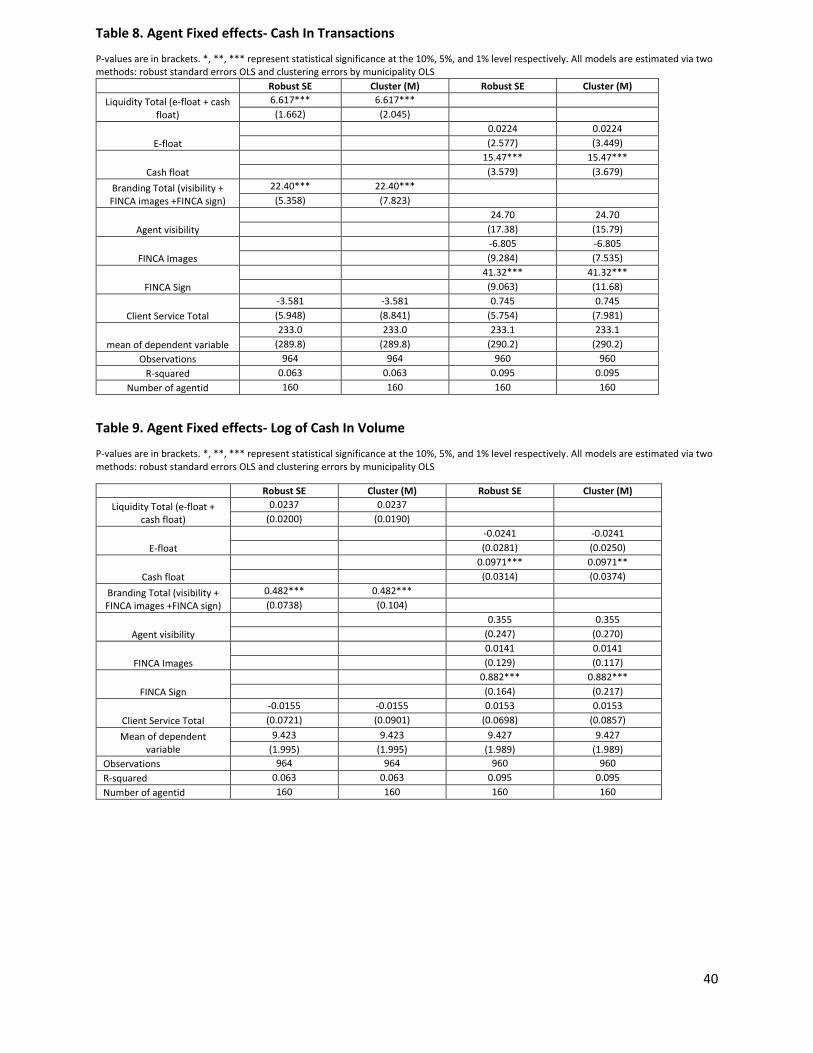
40
Table 8. Agent Fixed effects- Cash In Transactions
P-values are in brackets. *, **, *** represent statistical significance at the 10%, 5%, and 1% level respectively. All models are estimated via two methods: robust standard errors OLS and clustering errors by municipality OLS
Robust SE Cluster (M) Robust SE Cluster (M)
Liquidity Total (e-float + cash float)
6.617*** 6.617*** (1.662) (2.045)
E-float 0.0224 0.0224
(2.577) (3.449)
Cash float 15.47*** 15.47***
(3.579) (3.679)
Branding Total (visibility + FINCA images +FINCA sign)
22.40*** 22.40*** (5.358) (7.823)
Agent visibility 24.70 24.70
(17.38) (15.79)
FINCA Images -6.805 -6.805
(9.284) (7.535)
FINCA Sign 41.32*** 41.32***
(9.063) (11.68)
Client Service Total
-3.581 -3.581 0.745 0.745
(5.948) (8.841) (5.754) (7.981)
mean of dependent variable
233.0 233.0 233.1 233.1
(289.8) (289.8) (290.2) (290.2)
Observations 964 964 960 960
R-squared 0.063 0.063 0.095 0.095
Number of agentid 160 160 160 160
Table 9. Agent Fixed effects- Log of Cash In Volume
P-values are in brackets. *, **, *** represent statistical significance at the 10%, 5%, and 1% level respectively. All models are estimated via two methods: robust standard errors OLS and clustering errors by municipality OLS
Robust SE Cluster (M) Robust SE Cluster (M)
Liquidity Total (e-float + cash float)
0.0237 0.0237
(0.0200) (0.0190)
E-float
-0.0241 -0.0241 (0.0281) (0.0250)
Cash float
0.0971*** 0.0971** (0.0314) (0.0374)
Branding Total (visibility + FINCA images +FINCA sign)
0.482*** 0.482***
(0.0738) (0.104)
Agent visibility
0.355 0.355
(0.247) (0.270)
FINCA Images
0.0141 0.0141 (0.129) (0.117)
FINCA Sign
0.882*** 0.882*** (0.164) (0.217)
Client Service Total
-0.0155 -0.0155 0.0153 0.0153
(0.0721) (0.0901) (0.0698) (0.0857)
Mean of dependent variable
9.423 9.423 9.427 9.427
(1.995) (1.995) (1.989) (1.989)
Observations 964 964 960 960
R-squared 0.063 0.063 0.095 0.095
Number of agentid 160 160 160 160

41
Appendix A. Municipality level statistics
business municipality municipality surface (sq km)
municipality population (10,000s) number of agents
Bandalungwa 6.82 20.2341 4
Bumbu 5.5 32.9234 2
Kalamu 6.64 31.5342 5
Kasa-Vubu 5.04 15.732 8
Makala 5.6 25.3844 3
Ngiri Ngiri 3.4 17.4843 3
Selembao 23.18 33.5581 2
Barumbu 4.72 15.0319 3
Gombe 29.33 3.2373 8
Kintambo 2.72 10.6772 5
Lingwala 2.88 9.4635 4
Mont Ngafula 358.92 26.1004 8
Ngaliema 244.3 68.3135 20
Kisenso 16.6 38.6151 1
Lemba 23.7 34.9838 15
Limete 67.7 37.5726 14
Matete 4.88 26.8781 8
Ngaba 4 18.065 2
Kimbasenke 237.78 94.6372 13
Maluku 7948.8 6.745 4
Masina 69.73 48.5167 11
N'Djili 11.4 44.2138 12
N'Sele 898.79 14.0929 7
Lubumbashi 747 178.6397 15
Kolwezi 213 45.3147 4
Matadi 110 30.6053 7
Tshofa 1
Soyo 1
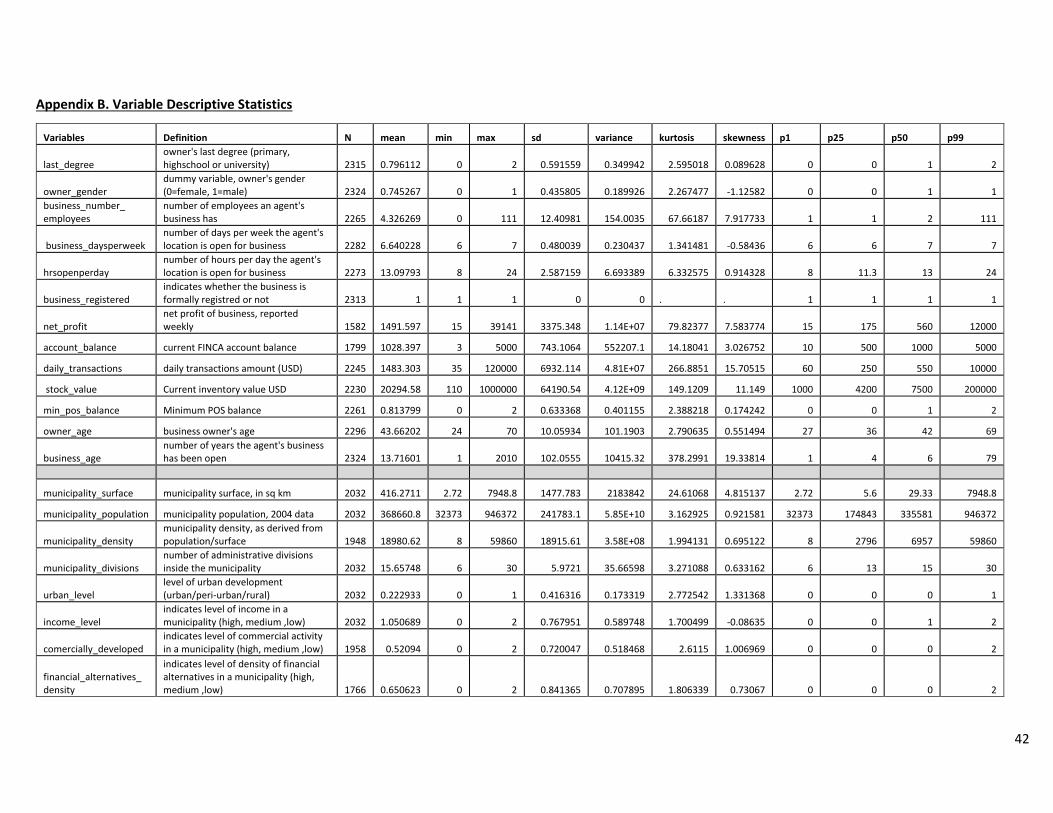
42
Appendix B. Variable Descriptive Statistics
Variables Definition N mean min max sd variance kurtosis skewness p1 p25 p50 p99
last_degree owner's last degree (primary, highschool or university) 2315 0.796112 0 2 0.591559 0.349942 2.595018 0.089628 0 0 1 2
owner_gender dummy variable, owner's gender (0=female, 1=male) 2324 0.745267 0 1 0.435805 0.189926 2.267477 -1.12582 0 0 1 1
business_number_ employees
number of employees an agent's business has 2265 4.326269 0 111 12.40981 154.0035 67.66187 7.917733 1 1 2 111
business_daysperweek number of days per week the agent's location is open for business 2282 6.640228 6 7 0.480039 0.230437 1.341481 -0.58436 6 6 7 7
hrsopenperday number of hours per day the agent's location is open for business 2273 13.09793 8 24 2.587159 6.693389 6.332575 0.914328 8 11.3 13 24
business_registered indicates whether the business is formally registred or not 2313 1 1 1 0 0 . . 1 1 1 1
net_profit net profit of business, reported weekly 1582 1491.597 15 39141 3375.348 1.14E+07 79.82377 7.583774 15 175 560 12000
account_balance current FINCA account balance 1799 1028.397 3 5000 743.1064 552207.1 14.18041 3.026752 10 500 1000 5000
daily_transactions daily transactions amount (USD) 2245 1483.303 35 120000 6932.114 4.81E+07 266.8851 15.70515 60 250 550 10000
stock_value Current inventory value USD 2230 20294.58 110 1000000 64190.54 4.12E+09 149.1209 11.149 1000 4200 7500 200000
min_pos_balance Minimum POS balance 2261 0.813799 0 2 0.633368 0.401155 2.388218 0.174242 0 0 1 2
owner_age business owner's age 2296 43.66202 24 70 10.05934 101.1903 2.790635 0.551494 27 36 42 69
business_age number of years the agent's business has been open 2324 13.71601 1 2010 102.0555 10415.32 378.2991 19.33814 1 4 6 79
municipality_surface municipality surface, in sq km 2032 416.2711 2.72 7948.8 1477.783 2183842 24.61068 4.815137 2.72 5.6 29.33 7948.8
municipality_population municipality population, 2004 data 2032 368660.8 32373 946372 241783.1 5.85E+10 3.162925 0.921581 32373 174843 335581 946372
municipality_density municipality density, as derived from population/surface 1948 18980.62 8 59860 18915.61 3.58E+08 1.994131 0.695122 8 2796 6957 59860
municipality_divisions number of administrative divisions inside the municipality 2032 15.65748 6 30 5.9721 35.66598 3.271088 0.633162 6 13 15 30
urban_level level of urban development (urban/peri-urban/rural) 2032 0.222933 0 1 0.416316 0.173319 2.772542 1.331368 0 0 0 1
income_level indicates level of income in a municipality (high, medium ,low) 2032 1.050689 0 2 0.767951 0.589748 1.700499 -0.08635 0 0 1 2
comercially_developed indicates level of commercial activity in a municipality (high, medium ,low) 1958 0.52094 0 2 0.720047 0.518468 2.6115 1.006969 0 0 0 2
financial_alternatives_ density
indicates level of density of financial alternatives in a municipality (high, medium ,low) 1766 0.650623 0 2 0.841365 0.707895 1.806339 0.73067 0 0 0 2

43
financial_alternatives_ types
indicates the form of financial services predominant in one municipality (banks, microfinance, mobile banking) 1676 0.738664 0 2 0.832021 0.69226 1.638885 0.519457 0 0 0 2
primary_educ
dummy variable, indicates is business owner is a graduate of primary education only 2324 0.296472 0 1 0.4568 0.208666 1.794411 0.891297 0 0 0 1
secondary_educ
dummy variable, indicates is business owner is a graduate of secondary education only 2324 0.606282 0 1 0.488679 0.238807 1.189287 -0.43507 0 0 1 1
tertiary_educ
dummy variable, indicates is business owner is a graduate of tertiary education 2324 0.093374 0 1 0.291018 0.084691 8.812667 2.795115 0 0 0 1
urban
indicates that a municipality's level of development can be qualified as urban, dummy variable 2324 0.679432 0 1 0.466795 0.217898 1.591281 -0.76895 0 0 1 1
peri_urban
indicates that a municipality's level of development can be qualified as peri-urban, dummy variable 2324 0.194923 0 1 0.396226 0.156995 3.372359 1.540247 0 0 0 1
income_high indicates high level of income in a municipality, dummy variable 2324 0.236661 0 1 0.425124 0.18073 2.535488 1.239148 0 0 0 1
income_med indicates medium level of income in a municipality, dummy variable 2324 0.356713 0 1 0.479132 0.229568 1.357893 0.598241 0 0 0 1
income_low indicates low level of income in a municipality, dummy variable 2324 0.280981 0 1 0.449575 0.202118 1.949743 0.974547 0 0 0 1
comercially_high
indicates high level of commercial activity in a municipality, dummy variable 2324 0.516781 0 1 0.499826 0.249826 1.004511 -0.06716 0 0 1 1
comercially_med
indicates medium level of commercial activity in a municipality, dummy variable 2324 0.212565 0 1 0.40921 0.167453 2.974399 1.405133 0 0 0 1
comercially_low
indicates low level of commercial activity in a municipality, dummy variable 2324 0.113167 0 1 0.316865 0.100403 6.96411 2.442153 0 0 0 1
financial_density_high
indicates high density of financial alternatives in a municipality, dummy variable 2324 0.447935 0 1 0.497389 0.247396 1.043848 0.2094 0 0 0 1
financial_density_med
indicates medium density of financial alternatives in a municipality, dummy variable 2324 0.129518 0 1 0.335845 0.112792 5.869719 2.206744 0 0 0 1
financial_density_low
indicates low density of financial alternatives in a municipality, dummy variable 2324 0.182444 0 1 0.386293 0.149222 3.70429 1.644473 0 0 0 1
banks
indicates banks as the form of financial services predominant in one municipality, dummy variable 2324 0.368331 0 1 0.482456 0.232763 1.29806 0.545948 0 0 0 1

44
microfinance
indicates microfinance as the form of financial services predominant in one muncipality, dummy variable 2324 0.172978 0 1 0.378309 0.143118 3.990252 1.729234 0 0 0 1
mobile_banking
indicates mobile banking as the form of financial services predominant in one muncipality, dummy variable 2324 0.179862 0 1 0.384155 0.147575 3.779116 1.667068 0 0 0 1
Funa dummy variable for the district of Funa 2324 0.16136 0 1 0.367942 0.135381 4.38974 1.841125 0 0 0 1
Lukunga dummy variable for the district of Lukunga 2324 0.259036 0 1 0.4382 0.192019 2.210059 1.100027 0 0 0 1
Mont_Amba dummy variable for the district of Mont 2324 0.222031 0 1 0.415701 0.172808 2.789274 1.337638 0 0 0 1
Tshangu dummy variable for the district of Tshangu 2324 0.233219 0 1 0.422971 0.178905 2.591976 1.261735 0 0 0 1
Other_Cities dummy variable for other cities 2324 0.124355 0 1 0.330057 0.108937 6.183537 2.276738 0 0 0 1
Commerce dummy variable, indicates whether an agent's registered business is in retail 2324 0.763769 0 1 0.424857 0.180503 2.542447 -1.24195 0 1 1 1
Services
dummy variable, indicates whether an agent's registered business is in serivices 2324 0.21988 0 1 0.414254 0.171606 2.829798 1.3527 0 0 0 1
cashintx number of cash in transactions, monthly 2324 201.7818 0 2468 258.6658 66907.98 19.14416 3.335248 1 51 117 1304
cashinvolume volume of cash in transactions, monthly 2324 38138.16 0 2432694 119137.8 1.42E+10 223.0474 13.3504 1 4882.5 14297 296294.7
cashouttx number of cash out transactions, monthly 2324 130.8451 0 2421 215.0843 46261.25 35.334 4.799897 0 23 65 1086
cashoutvolume volume of cash out transactions, monthly 2324 15070.5 0 1404392 52359.43 2.74E+09 367.0128 16.69034 0 965 3741.865 155904
transfertx number of transfer transactions, monthly 2324 1.468158 0 85 4.999554 24.99554 98.05663 8.430969 0 0 0 25
transfervolume volume of transfer transactions, monthly 2324 521.076 0 101225 3337.408 1.11E+07 396.6339 16.27127 0 0 0 13620
totaltx total number of transactions, monthly 2324 334.0951 1 4899 462.6272 214023.9 27.0213 4.062847 2 82 189 2346
totalvolume total volume of transactions, monthly 2324 53729.69 0 3837106 165359.5 2.73E+10 256.5746 14.0736 5 6851.5 18917.75 450320.1
E-float monitoring score, monthly average 964 3.004991 0 5.25 1.919025 3.682659 1.785648 -0.28777 0 1.4465 2.63 5.25
Cash float monitoring score, monthly average 964 3.101465 0 5.69 1.932798 3.735709 1.794103 -0.3257 0 1.753333 2.63 5.25
Liquidity Total monitoring score, monthly average 964 6.10159 0 10.5 3.123703 9.757518 2.219792 -0.31219 0 3.94 6.126667 10.5
Connectivity/Service Availability monitoring score, monthly average 964 1.840497 0 3 0.368283 0.135633 7.911087 -2.26064 0.5 2 2 2

45
State of shop monitoring score, monthly average 964 1.723811 0 2 0.45339 0.205563 3.491746 -1.29915 0.5 1.366667 2 2
Operator availability monitoring score, monthly average 960 1.66386 0 3.833333 0.50318 0.25319 3.751734 -1.09144 0 1 2 2
Client Service Total monitoring score, monthly average 964 5.220825 0 6 0.894344 0.799851 5.533716 -1.3346 2.75 5 5.333333 6
Tenue du Registre des transactions monitoring score, monthly average 964 2.244285 0 2.5 0.636023 0.404526 8.680481 -2.59047 0 2.5 2.5 2.5
Soins Terminal POS monitoring score, monthly average 964 2.346178 0 2.5 0.410989 0.168912 13.09179 -3.06288 0.625 2.5 2.5 2.5
Suivi du solde monitoring score, monthly average 964 2.062023 0 4.791667 0.724041 0.524236 4.494072 -1.46622 0 1.666667 2.5 2.5
Performance total monitoring score, monthly average 964 6.647085 0 7.5 1.238731 1.534456 8.037264 -1.96928 2.5 6.25 7.5 7.5
Agent Visibility monitoring score, monthly average 964 1.871963 0 2 0.413219 0.17075 14.53503 -3.47651 0 2 2 2
FINCA images monitoring score, monthly average 960 1.673878 0 2 0.550039 0.302543 4.929473 -1.65918 0 1.333333 2 2
FINCA sign monitoring score, monthly average 964 1.718525 0 4 0.631125 0.398319 5.740557 -1.98233 0 2 2 2
Branding total monitoring score, monthly average 964 5.267342 0 16.06417 1.275662 1.627313 12.22836 -1.3267 0 5 6 6
Total score monitoring score, monthly average 961 23.26204 0 30 4.288883 18.39452 4.308764 -0.88681 11 20.875 23.76 30
quart number of quarters in existence as FINCA agents 2324 4.267857 0.25 11 2.309173 5.332279 3.007149 0.829085 1 2.5 3.75 11