agent orange paternal epigenetics
DESCRIPTION
A study in mice linked nutritional deficiencies in paternal diet to a higher rate of birth defects compared with those whose fathers were fed a normal, well-rounded menu. The findings raise concerns about dads unknowingly passing on harmful traits through molecular markers on the DNA of their sperm.These epigenetic markers don’t change the genetic information, but rather switch parts of the genome on and off. They are susceptible to environment and diet throughout fetal development, but were thought to be wiped clean before birth. New studies, including the one published online Tuesday in Nature Communications, have revealed that some of them may survive all the way from sperm to baby.TRANSCRIPT

ARTICLE
Received 3 Apr 2013 | Accepted 7 Nov 2013 | Published 10 Dec 2013
Low paternal dietary folate alters the mousesperm epigenome and is associated withnegative pregnancy outcomesR. Lambrot1,*, C. Xu1,*, S. Saint-Phar1, G. Chountalos1, T. Cohen1, M. Paquet2, M. Suderman3, M. Hallett3 &
S Kimmins1,4
Epidemiological studies suggest that a father’s diet can influence offspring health. A proposed
mechanism for paternal transmission of environmental information is via the sperm
epigenome. The epigenome includes heritable information such as DNA methylation. We
hypothesize that the dietary supply of methyl donors will alter epigenetic reprogramming in
sperm. Here we feed male mice either a folate-deficient or folate-sufficient diet throughout
life. Paternal folate deficiency is associated with increased birth defects in the offspring, which
include craniofacial and musculoskeletal malformations. Genome-wide DNA methylation
analysis and the subsequent functional analysis identify differential methylation in sperm of
genes implicated in development, chronic diseases such as cancer, diabetes, autism and
schizophrenia. While 4300 genes are differentially expressed in offspring placenta, only two
correspond to genes with differential methylation in sperm. This model suggests epigenetic
transmission may involve sperm histone H3 methylation or DNA methylation and that
adequate paternal dietary folate is essential for offspring health.
DOI: 10.1038/ncomms3889 OPEN
1 Department of Animal Science, McGill University, Ste Anne-de-Bellevue, Quebec H9X3V9, Canada. 2 Comparative Pathology Services, ComparativeMedicine and Animal Resources Centre, McGill University, Montreal, Quebec H3G 1Y6, Canada. 3 McGill Center for Bioinformatics, School of ComputerScience, McGill University, Montreal, Quebec H3G 0B1, Canada. 4 Department of Pharmacology and Therapeutics, McGill University, Montreal, Quebec H3G1Y6, Canada. * These authors contributed equally to this work. Correspondence and requests for materials should be addressed to S.K.(email: [email protected].).
NATURE COMMUNICATIONS | 4:2889 | DOI: 10.1038/ncomms3889 | www.nature.com/naturecommunications 1
& 2013 Macmillan Publishers Limited. All rights reserved.

Epigenetic information encompasses DNA methylation, non-coding RNA and modifications to histones. It serves acritical function in the regulation of gene expression and
thus development and disease. From one generation to the next,the epigenome is reprogrammed in the gametes and the embryoto allow for totipotency and to prevent the transmission ofepigenetic errors. However, not all regions of the epigenome arereset, permitting the transmission of epigenetic information fromparents to offspring. It has been postulated that epigeneticinformation passed on by the gametes allows for the transmissionof information on parental environmental exposures. Theunderlying mechanisms implicated in epigenetic inheritance areunknown, and to date there is a lack of mechanistic evidence tosupport epigenomic transmission via the sperm.
DNA methylation is the most studied epigenetic modificationand takes place at the 5-position of cytosine residues within CpGdinucleotides and is essential for the heritable silencing andregulation of many types of DNA sequences; it occurs at about30 million sites throughout the mammalian genome1. DNAmethylation is involved in regulating genes that are subject toparent-of-origin imprinting. These patterns of genomicmethylation are acquired in the germline beginning in uteroand are completed during spermatogenesis and passed to theoffspring. DNA methylation is catalysed by a family of DNA(cytosine-5)-methyltransferases and cooperates with histonemodifications in the regulation of gene expression and silencing.
It has long been known that disease can be transmitted via thegenetic layer but new modes of inheritance via the epigenome arebeing discovered2. Whereas an organism’s genotype is relativelystatic throughout life, the epigenome is highly dynamic and canadapt, or be altered, in response to the internal or externalenvironment. Recent studies suggest that there are criticalwindows in development where the epigenome is susceptibleto the introduction of epimutations through exposure toenvironmental factors such as toxicants or diet3. Very recentstudies strongly suggest that paternal transmission of disease canoccur via the epigenetic layer in sperm. Chronic high-fat diets fedto Sprague–Dawley rat sires induced glucose intolerance andimpaired insulin secretion in their adult female offspring4. Inhumans, nutrition in males just before puberty can alterdescendents survival, and predisposition to diabetes andcardiovascular disease5. In these prior studies, the spermepigenome was not analysed.
Dietary components serve to modulate the availability ofmethyl donors for methylation reactions. The B vitamins serve ascoenzymes of one carbon (C1) metabolism, which is a network ofbiochemical reactions in which a C1 unit is received from methyldonor nutrients and used in the methylation of DNA, RNA andproteins. Thus, agents that modulate C1 metabolism directly orindirectly affect levels of S-adenosyl methionine, the principalmethyl donor for the methylation of DNA. Thus, dietary folatelevels can directly influence levels of cellular DNA methylationand consequently affect gene expression6.
Spermatogenesis consists of a carefully coordinated series ofevents beginning with division of spermatogonia, followed bymeiosis to produce haploid spermatids, and finally the differ-entiation of the spermatids into mature spermatozoa. Duringspermatogenesis, there are epigenetic processes unlike those inthe development of any other cell type, including a massive andactive demethylation of the genome to allow for its sex-specificresetting by a combination of DNA methylation and histonemodifications7. During mammalian gamete formation, somegenes acquire heritable molecular imprints through epigeneticdemarcation that act to either suppress or activate the expressionfrom one parental allele in the somatic cells of offspring. Theseimprints are established in a sex-specific manner in the forming
gametes so that the gene ‘remembers’, so to speak, its parent oforigin in the offspring. If imprinting of genes is disturbed duringgametogenesis, gene expression is compromised in the resultingoffspring8. The resultant hemizygosity imposed by imprinting isbelieved to confer genetic vulnerability, and errors in this processare associated with diseases such as cancer, Prader–Willisyndrome and behavioural disorders9. Examination of DNAmethylation in sperm reveals that there are unique distributionsin comparison with somatic cells10. Infertility as a chronic diseasefrequently coexists with obesity, metabolic syndrome andcardiovascular disease. Infertile men have been shown to havean altered sperm epigenome including altered levels of DNAmethylation, imprinted loci defects, lower pregnancy rates and ahigh frequency of abnormal embryos11. To date, there have beena handful of studies, indicating that there can be paternaltransmission of subtle effects such as metabolic state to offspring.Paternal diets high in fat or low in protein can alter themetabolism in offspring and pancreatic gene expression4,12.However, there is a paucity of evidence delineating themechanisms underlying epigenetic inheritance from a father tooffspring. In clinical studies, a positive association between folateand fertility has been observed13 and infertility is linked with amutation in a key enzyme in folate metabolism, 5,10-methylenetetrahydrofolate reductase (MTHFR)14. Althoughfolate supplementation is recommended to women beforepregnancy, and food in North America has been folate fortifiedsince 1998 (ref. 15), there are certain physiological states thatcoincide with low serum folate. Obesity and polymorphisms infolate metabolic enzymes reduce the availability of folate formethyl donation16,17.
Here we hypothesize that the availability of folate will alter thelevels of DNA methylation in spermatogenesis with consequencesfor the sperm epigenome and pregnancy outcomes. Using aninbred C57BL/6 mouse model that was exposed to low dietaryfolate beginning in utero and throughout life, we show thatpaternal diet alters sperm DNA methylation and is associatedwith negative reproductive outcomes including birth defects inoffspring. Remarkably, the sites of the sperm epigenome bearingchanges in DNA methylation are associated to genes implicatedin development and chronic disease. This study is the first toshow that the folate status of the father, not just the mother, maybe of equal importance in determining reproductive success interms of healthy pregnancy outcomes.
ResultsTransient effects of folate deficiency on meiosis. Male inbredC57BL/6 mice received throughout life either the control folate-sufficient (FS) diet (2 mg folic acid per kg) that contained therecommended amount of folate for rodents18, or a folate-deficient(FD) diet (0.3 mg folic acid per kg, 14.3% of the recommendedamount of folate; Fig. 1a). Dietary exposure began in utero whenepigenetic patterning in germ cells begins19. Testis and bodyweights and testis histology were examined from pups at postnataldays (PND) 6, 10, 12, 14 and 18 corresponding to the appearanceof spermatogenic cell types20. Histological examination of testis atPND 12, when meiotic cells at the leptotene stage first appear,revealed a delay in meiotic onset in FD pups (Fig. 1b,c,d). Therewere no apparent effects of diet on Sertoli (Supplementary Fig. S1)and Leydig cells (Supplementary Fig. S2). Body weight of maleoffspring was monitored as a general gauge of health and there wasno reduction of body weight in FD males compared with FS males.These findings are consistent with the C57BL/6 mice model, whichwas on the same FD diet for 12–14 months21. Histologicalexamination of adult testes revealed no detectable morphologicaldifferences between FS and FD mice (Fig. 1f,g). No effects of diet
ARTICLE NATURE COMMUNICATIONS | DOI: 10.1038/ncomms3889
2 NATURE COMMUNICATIONS | 4:2889 | DOI: 10.1038/ncomms3889 | www.nature.com/naturecommunications
& 2013 Macmillan Publishers Limited. All rights reserved.

were observed on spermatogenesis or sperm counts (Fig. 1e).Diet did not alter the weights of the body, testis or epididymides(Supplementary Table S1). Adult FS (n¼ 54) and FD (n¼ 49)
males remained on the diets for either 2 or 4 months and wereassessed for reproductive fitness by breeding trials andexamination of offspring.
M
SG
SC
SG
SC
05
1015202530354045
0
5
10
15
20
25
30
Mei
otic
-pos
itive
tubu
le (
%)
Num
ber
of s
perm
atoz
oa(×
104 )
Folate sufficient
Folate deficient*
on a folate-sufficient diet
2 weeks before breeding anduntil weaning of pups
Folate sufficientlifetime
Normal diet
on a folate-deficient diet
2 weeks before breedingand until weaning of pups
Folate deficientlifetime
Folate sufficient Folate deficient
Figure 1 | Meiotic onset is delayed in FD mice but adult spermatogenesis is normal. (a) C57BL/6 females were fed either a FS or a FD diet, (n¼64
for each) 2 weeks before breeding with a C57BL/6 male fed with control mouse chow. Females were maintained on the experimental diet through
pregnancy and lactation. From weaning until throughout life, male pups received the same experimental diet as their mother. PND12 testis cross-sections
from FS (b) and FD (c) testis cross-sections were stained using anti-histone H3 monomethylation at lysine 4 (H3K4-me1), a marker of early meiotic
spermatocytes46. Fewer meiotic cells (M, brown staining) were present in FD tubules (c) in comparison with FS mice (b), whereas spermatogonia (SG) and
sertoli cells (SC) were not affected. (d) The ratio of meiotic tubules (410 meiotic germ cells) to total number of tubules was quantitated. Means±s.e.m.
of three determinations are shown. *Po0.05 by the Mann–Whitney U-test. Sperm counts were performed in adult FS and FD mice (e). Means±s.e.m.
of five determinations are shown. *Po0.05 by Student’s t-test. Spermatogenesis was assessed in adult FS (f) and FD mice (g) by haematoxilin/eosin
staining. Scale bars, 10mm (b,c) and 100 mm (d,e).
NATURE COMMUNICATIONS | DOI: 10.1038/ncomms3889 ARTICLE
NATURE COMMUNICATIONS | 4:2889 | DOI: 10.1038/ncomms3889 | www.nature.com/naturecommunications 3
& 2013 Macmillan Publishers Limited. All rights reserved.

Folate deficiency increases DNA damage in spermatocytes.Folate deficiency has been linked to increased DNA breaks owingto excessive uracil incorporation22. The most damaging DNAbreaks in terms of genome integrity are DNA double-strandbreaks (DSBs)23. Terminal deoxynucleotidyl transferase-mediateddUTP nick-end labelling immunostaining was used to detectcellular DNA fragmentation and to assess apoptosis. Nospermatogenic stage-specific apoptosis was observed and theproportion of apoptotic tubules was not increased in FD males,in comparison with FS males (P40.05 by Student’s t-test;Supplementary Fig. S3). As a second assessment of DNAdamage, spermatocyte-enriched cell spreads were preparedfrom FS and FD mice. Chromosomes were co-immunolabelledwith the synaptonemal complex protein 3 (SYCP3) and thephosphorylated histone variant, g-H2AX (SupplementaryFig. S4). The g-H2AX variant is involved in DNA repairactivities and the targeting of DNA DSBs24. In meioticprophase I, g-H2AX foci are present as part of the molecularmechanisms mediating recombination. The number of g-H2AXpeaks in leptotene spermatocytes with 300 foci per celland gradually decreases to 120 foci per cell in early pachytene,and to 48 in late pachytene25. Consistent with previous studies,the sex body was intensely stained by g-H2AX (SupplementaryFig. S4a–d) and the number of foci observed was on average125.5±2.1 in early pachytene and 58.5±1.9 in late pachytene ofFS25. In early and late pachytene spermatocytes from FD mice, g-H2AX foci were significantly increased suggesting DNA damage.As meiotic prophase progressed, the difference in the foci numberbetween FS and FD cells increased from 5.9% in early pachyteneto 12.5% in late pachytene spermatocytes (SupplementaryFig. S4e). To determine whether DNA damage in spermatocytesof FD mice was sustained in the sperm or was repaired, a Cometassay was carried out on sperm from FS and FD mice to measureDNA single-strand and DSBs26. The Comet assay revealed nodifferences in the DNA fragment level as represented by tailDNA, tail length and tail extent moment (P40.05 by Student’s t-test; Table 1), indicating that DNA damage in FD spermatocyteswas repaired.
Somatic cells are not affected by folate deficiency. To determinewhether somatic cells in the testis were sensitive to folate defi-ciency, we examined Sertoli and Leydig cell development at cri-tical points following their proliferation and differentiation27,28. Itis believed that the total number of Sertoli cells determines theefficiency of spermatogenesis29. Thus, we examined the Sertolinumber at PND10 (FS, n¼ 3; FD, n¼ 3), since in mice Sertolicells proliferate only in fetal/neonatal period and become almostquiescent at PND12 (ref. 27). Sertoli cells were identified byimmunofluorescent labelling with anti-MIS (Mullerian-InhibitingSubstance) and counted in 10 round tubules per animal in FS andFD (Supplementary Fig. S1a,b). No difference occurred in Sertolicell numbers between FS and FD mice (P40.05 by the Mann–Whitney U-test; Supplementary Fig. S1c).
Leydig cells are prominent in the interstitial space and areresponsible for testosterone production30. In mice, the fetal
Leydig cells are present and observable as round to oval shapedand are found exclusively in clusters. Leydig cells start to regresspostnatally marked by the scattering of clusters and theirdecreasing number28,31. The histological examination of testiscross-sections stained by the Leydig cell marker, 3b-HSD (3-b-Hydroxysteroid Dehydrogenase/D-5-4 isomerase), revealed nodetectable size or quantitative differences of fetal Leydig cellclusters between FS and FD males at PND6 (Supplementary Fig.S2). Adult Leydig cells (ALD) first appear at PND10–13. Thefirst stage of ALDs, from the initiation to PND25, is theprogenitor Leydig cell (PLD) stage, which has a highproliferation rate. After this stage, ALDs only double once andthen become quiescent31. Thus, we assessed the postnatal ALDnumber to determine whether ALD proliferation was affected byfolate deficiency. In PND12 FS and FD mice testis, the numberof PLD was quantified. PLD were identified as 3b-HSD-positivecells with slender-shaped cytoplasm and an elongated nucleus,located singly around seminiferous epithelium (SupplementaryFig. S2a,b). The ratio of the total number of PLDs to the numberof tubules counted was calculated and compared between FS andFD mice (FS, n¼ 3; FD, n¼ 3; Supplementary Fig. S2c). Noobservable change in morphology or number of the PLDsbetween FD and FS testis occurred.
Folate deficiency leads to negative reproductive outcomes. Todetermine whether paternal FD diets affected fertility andpregnancy outcomes, FS and FD males were mated to repro-ductively robust outbred CD-1 females that received control diets.The fertility of FD males was compromised, as demonstrated bythe significantly reduced pregnancy rate of 52.38% comparedwith 85% for FS mice (Supplementary Fig. S5a). There was nodifference in mating behaviour as evidenced by plug-positivefemales but there was an increased breeding interval in femalesbred to FD males. We next assessed embryo loss anddevelopment at 18.5 days post conception (dpc). Litters weresired by FS (n¼ 32) or FD (n¼ 35) males. Embryo weight andcrown-rump length were not affected by paternal diet(Supplementary Table S2). Preimplantation loss was not affectedby diet but post-implantation loss increased in FD-siredpregnancies (Supplementary Table S3). This increased loss wasreflected in the twofold greater resorption rate in pregnanciessired by FD males in comparison with those sired by FS males(Supplementary Fig. S5b).
Developmental abnormalities were observed with a greaterfrequency in fetuses sired by FD males (Fig. 2; SupplementaryTable S2 and Supplementary Fig. S6). Of FD-sired fetuses, 27%had visible gross anatomical abnormalities versus 3% in litterssired by FS fathers (Supplementary Table S2). Malformationsobserved in FD-sired offspring included craniofacial abnormal-ities such as hydrocephalus (Fig. 2b). Limb defects includedunderdeveloped digits, or in some cases anonychia and/or hindlimb hyperextension (Fig. 2c). In several FD-sired fetuses,abnormalities included muscle and/or skeletal defects in theregion of the spine or scapula (Fig. 2d,e). These were confirmedby histopathological analysis that revealed muscular dysplasiaadjacent to the scapula (Fig. 2f,g). Given that the observed grossmalformations indicated probable skeletal malformations,selected FS and FD fetuses were processed for skeletal analysis(Fig. 2h–l). Skeletal analysis confirmed abnormalities such asreduced ossification of the skull as well as a delay in thedevelopment of the digits in FD-sired offspring (Fig. 2h,i). Inaddition, misalignment or even incomplete development of thesternebrae plates was often observed in FD-sired offspring(Fig. 2j–l). Abnormalities observed in FS-sired offspring wereminor and included a runt and skin discolouration.
Table 1 | Assessment of sperm chromatin integrity for thefolate-sufficient (FS) and deficient (FD) mice by Cometassay.
Diet Tail length Tail DNA Tail extent moment
FS 99.82±0.44 34.12±0.17 63.28±0.40FD 99.87±0.80 34.06±0.35 63.35±0.84
Means±s.e.m. of four determinations are shown for each group.
ARTICLE NATURE COMMUNICATIONS | DOI: 10.1038/ncomms3889
4 NATURE COMMUNICATIONS | 4:2889 | DOI: 10.1038/ncomms3889 | www.nature.com/naturecommunications
& 2013 Macmillan Publishers Limited. All rights reserved.
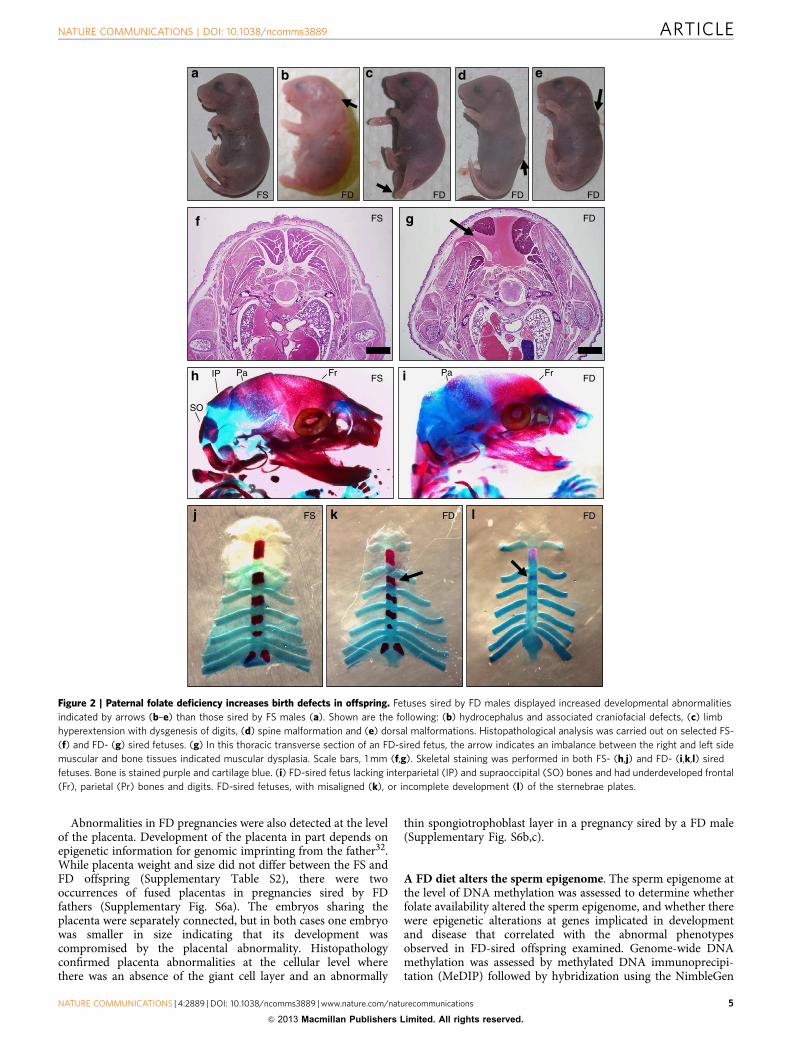
Abnormalities in FD pregnancies were also detected at the levelof the placenta. Development of the placenta in part depends onepigenetic information for genomic imprinting from the father32.While placenta weight and size did not differ between the FS andFD offspring (Supplementary Table S2), there were twooccurrences of fused placentas in pregnancies sired by FDfathers (Supplementary Fig. S6a). The embryos sharing theplacenta were separately connected, but in both cases one embryowas smaller in size indicating that its development wascompromised by the placental abnormality. Histopathologyconfirmed placenta abnormalities at the cellular level wherethere was an absence of the giant cell layer and an abnormally
thin spongiotrophoblast layer in a pregnancy sired by a FD male(Supplementary Fig. S6b,c).
A FD diet alters the sperm epigenome. The sperm epigenome atthe level of DNA methylation was assessed to determine whetherfolate availability altered the sperm epigenome, and whether therewere epigenetic alterations at genes implicated in developmentand disease that correlated with the abnormal phenotypesobserved in FD-sired offspring examined. Genome-wide DNAmethylation was assessed by methylated DNA immunoprecipi-tation (MeDIP) followed by hybridization using the NimbleGen
FS FD FD FD FD
FS
FS
FS
FD
FD
FDFD
IP
SO
FrPa Pa Fr
Figure 2 | Paternal folate deficiency increases birth defects in offspring. Fetuses sired by FD males displayed increased developmental abnormalities
indicated by arrows (b–e) than those sired by FS males (a). Shown are the following: (b) hydrocephalus and associated craniofacial defects, (c) limb
hyperextension with dysgenesis of digits, (d) spine malformation and (e) dorsal malformations. Histopathological analysis was carried out on selected FS-
(f) and FD- (g) sired fetuses. (g) In this thoracic transverse section of an FD-sired fetus, the arrow indicates an imbalance between the right and left side
muscular and bone tissues indicated muscular dysplasia. Scale bars, 1 mm (f,g). Skeletal staining was performed in both FS- (h,j) and FD- (i,k,l) sired
fetuses. Bone is stained purple and cartilage blue. (i) FD-sired fetus lacking interparietal (IP) and supraoccipital (SO) bones and had underdeveloped frontal
(Fr), parietal (Pr) bones and digits. FD-sired fetuses, with misaligned (k), or incomplete development (l) of the sternebrae plates.
NATURE COMMUNICATIONS | DOI: 10.1038/ncomms3889 ARTICLE
NATURE COMMUNICATIONS | 4:2889 | DOI: 10.1038/ncomms3889 | www.nature.com/naturecommunications 5
& 2013 Macmillan Publishers Limited. All rights reserved.

mouse 2.1 deluxe promoter array (MeDIP-chip). The sperm cellswere isolated using a swim up method, which prevents con-tamination by somatic cells. As further validation of the purity ofthe sperm population, and to validate the MeDIP procedure, weassessed enrichment following DNA methylation selection byMeDIP followed by real-time PCR. Regions selected for analysiswere known to be fully methylated, or not, in spermatozoa(Supplementary Fig. S7). Gene regions targeted included thefollowing: first, the imprinting control region of H19, the pater-nally imprinted gene that is hypermethylated in sperm33, second,the promoter region of Nanog34 also hypermethylated in spermand, third, the promoter regions of the testis-specific variants ofhistones H1 (H1t) and H2b (TsH2b), which are hypomethylatedin sperm and hypermethylated in somatic tissues35. We observed,before and after amplification with a WGA2 kit, a strongenrichment in the MeDIP fraction of H19ICR and Nanog,whereas H1t and tsH2b displayed very low signals. These resultsvalidate the purity of the sperm population and the specificity ofthe MeDIP before and after the amplification process.
By this MeDIP-chip analysis under highly stringent criteria(false discovery rate (FDR) threshold of 0.1), 57 genomic regionshad altered methylation profiles in sperm from FD males incomparison with sperm from FS (Supplementary Table S4).Within these regions, methylation differences ranged from� 1.33 to 2.76 (log2 fold-difference). Forty-six of these regionswere located within 10 kb of the transcription start site and 31within 5 kb. The regions beyond 10 kb were included in ouranalysis, as the existence of a long distance enhancer or silencerregulated by DNA methylation has been shown to influence geneexpression as far as 100 kb from the gene36. Indeed,the methylation level of the differentially methylated regionlocated in H19 promoter at more than 70 kb from Igf2 regulatesits expression37. Some gene promoter regions had multiple,dispersed sites of differential methylation such as the promoter ofthe microRNA Mir715 (Fig. 3a). Other promoter regions of genessuch as Ddx58 and Sfi1 had localized methylation changes close tothe transcription start site (Fig. 3b,c). Interestingly, themethylation levels were decreased in the FD fraction for certaingenes (Fig. 3a,c) but for others it was increased (Fig. 3b). Atan FDR threshold of 0.25, a further 200 additional differentiallymethylated regions were identified and these regions wereincluded in functional analysis using gene sets obtainedfrom GO (Gene Ontology project), KEGG (Kyoto Encyclopediaof Genes and Genomes) and mSigDB (Molecular SignatureDatabase), and the software DAVID (Database for AnnotationVisualization and Integrated discovery)38. Highlights of thisanalysis revealed methylation differences induced by the FD dietin promoter regions located in genes implicated in development
and with functions in the central nervous system, kidney, spleen,digestive tract and muscle tissue (Table 2). In addition, the low-folate diet also affected the methylation status of genes associatedwith chronic diseases such as diabetes, autoimmune diseases,neurological diseases, autism, schizophrenia and cancer (Table 3).
Less than 1% of the genome comprises imprinted genes thatare also subject to epigenetic reprogramming in spermatogenesisand required for normal development of the embryo39. Imprintedgenes have been suggested to be sensitive to environmentalprogramming; however, none of the 65 imprinted genes tiled onthe promoter array displayed any significant change in their DNAmethylation profile.
Selected targets were analysed by Sequenom MassARRAY, atechnique based on bisulfite conversion with a resolution atthe CpG level. Criteria for the selection of gene targets forvalidation were based on the following: first, on variation inmethylation profile to confirm sensitivity over a range ofmethylation states (low overall methylation, or intermediatemethylation or high overall methylation), which were detectedby the MeDIP-array as being differentially methylated at theFDRo0.25; second, the gene had a biological link withdevelopmental processes that corresponded to developmentalabnormalities observed in offspring sired by FD males(see Fig. 2); third, the gene had a suitable number of CpGsfor validation by the highly sensitive (single CpG resolution),and quantitative method, Sequenom MassARRAY. Thegenes selected for validation were the following: Rfwd2(a ubiquitin-protein ligase expressed in the heart, testis,stomach and muscle), Sfi1 (cell signalling, widespread tissuedistribution including the axial skeleton and muscle), Kdm3b(a chromatin modifier with widespread expressionduring embryo development), Gm52 (required for placentaldevelopment) and Rbks (metabolism and cell signalling withwidespread tissue distribution; Fig. 4). Sequenom MassArrayanalysis confirmed significantly altered DNA methylation atspecific CpG locations for selected genes, thereby validatinganalysis by MeDIP-Array.
Histone modifications such as histone H3 lysine 4 (H3K4) andlysine 9 (H3K9) methylation have been shown to differentiallymark genes in human and mouse sperm40,41,42. We investigatedwhether folate availability could alter the sperm histonemodification pattern by measuring global levels of methylationof histone H3 at K9 and K4 in epididymal sperm extracts. Spermfrom FD males had significantly reduced H3K4 and K9monomethylation compared with FS sperm, and reduced H3K9trimethylation compared with FS sperm (Po0.06 by Student’st-test; Supplementary Fig. S8). Thus, histone methylation levels insperm are sensitive to folate availability, and different histone
–2
0
2–2
0
2
Sfi1
0.5 kb
FS
FD
5mC
(lo
g2 r
atio
MeD
IP/in
put)
Ddx58
1 kb
–2
0
2–2
0
2
–2
0
2–2
0
2
Mir715
1 kb
Figure 3 | Folate deficiency alters sperm DNA methylation. Changes in DNA methylation are illustrated by smoothed MeDIP over input log2 ratios of
individual oligonucleotides for the folate-sufficient (FS) and the folate-deficient (FD) animals. The gene is indicated at the bottom of the graph and the
arrow represents the transcription start site (TSS).
ARTICLE NATURE COMMUNICATIONS | DOI: 10.1038/ncomms3889
6 NATURE COMMUNICATIONS | 4:2889 | DOI: 10.1038/ncomms3889 | www.nature.com/naturecommunications
& 2013 Macmillan Publishers Limited. All rights reserved.

methyltransferases may possess different sensitivities to an alteredmethyl donor pool.
Altered gene expression in placenta of FD-sired offspring. Todetermine whether there was transmission of epigenetic effectsfrom sires to offspring, global gene expression levels were assessedin placenta from 18.5 dpc fetuses sired by either a FS or FD male(Fig. 5). Analysis of array data revealed differential expression of380 genes placenta from FD-sired offspring versus FS-sired off-spring. The top 39 gene candidates selected based on their P-valueare shown in Fig. 5a. Functional analysis identified 21 of thosegenes as implicated in the regulation of gene transduction/cellsignalling. Of these differentially expressed genes, 10 were selec-ted for validation by real-time PCR in independent samples(FS¼ 8 placentas, FD¼ 8 placentas each from different litters;Fig. 5b,c). Notably, two validated genes with differential expres-sion (Cav1, a cell cycle regulator, and Txndc16, a gene highlyexpressed in placenta with a function in cell homoeostasis) werealso differentially methylated in sperm from FD males(Supplementary Table S4). To determine whether the differentialDNA methylation observed in FD sperm at regions near Cav1and Txndc16 were conserved in placenta, methylation levels weremeasured by pyrosequencing after bisulfite conversion (Fig. 6).No differences were observed between the FS- and FD-siredfetuses’ placentas at those regions.
DiscussionIn this study, we identify multiple regions of the spermepigenome that are environmentally programmed by factors inthe diet. There are three major epigenomic reprogrammingperiods in the lifetime of male mammals. This massive resetting is
essential to allow for the germ cell-specific epigenetic programmeto be established, which is required for embryo totipotency andfor the removal of epigenetic mutations to prevent thetransmission of disease. In the preimplantation embryo, theepigenome is reprogrammed when DNA methylation and histonemethylation are actively removed with the exception of imprintedgenes, repeat sequences and unidentified regions that are involvedin the epigenetic inheritance of disease43,44. Epigenetic marks arethen re-acquired in a sex-, cell- and tissue-specific manner in theperi-implantation period. The second period of reprogrammingalso takes place in utero and the target is the primordial germ cellswithin the developing embryo. As two major periods ofepigenomic programming occur in utero, this emphasizes thatthis is a critical window in life for the induction of epigeneticdefects. The results of this study highlight the importance of thein utero environment and show that dietary exposures in uteroaffected the health of two generations: the fathers’ reproductivehealth (F1) and the offspring (F2). The third period ofepigenomic reprogramming coincides with the onset ofspermatogenesis and spans from puberty to adulthood. It isestimated that 1,000 spermatozoa are produced with every heartbeat45, and beginning with the stem cell suppliers up to themature sperm there are ongoing epigenomic programmes thatcould be influenced by the environment. It remains to bedetermined how sensitive epigenome reprogramming is inspermatogenesis in the adults. The results of this study lendfurther support to the notion that epigenetic marks inspermatogenesis are dynamic and flexible; thus, they can bemodified by nutritional, hormonal and toxin exposures46.
In this study, we demonstrate that a father’s FD diet altered thesperm epigenome and that these changes were associated to genesimplicated in development and chronic disease. The functional
Table 2 | Genes implicated in development were differentially methylated in sperm of folate-deficient (FD) males compared withthe folate-sufficient (FS) males.
Biological process No. of genes differentially methylated Selected genes P-value
Central nervous system development 14 Arf4, Ets1, Foxp2, Hdac11, Helt, Lhx6, Nkx2-2 0.006Behaviour 12 C3ar1, Fpr3, Helt, Hrh3, Htt, Nr4a3, Park7 0.038Ureteric bud development 4 Cd44, Slit2, Tcf21 0.016Glomerulus development 2 Bcl2, Tcf21 0.005Renal system process 3 Edn1, Uts2 0.014Reproductive developmental process 7 Csf1, Srd5a1, Tcf21, Ube3a 0.037Spleen development 3 Tcf21, Tlx1 0.004Digestive tract morphogenesis 3 Tcf21, Trp73 0.021Regulation of muscle development 3 Edn1, Prox1 0.037
The MeDIP-ChIP assay was performed on sperm from FS males (n¼ 3) and FD males (n¼4 animals). The P-value was calculated by Fisher’s exact test.
Table 3 | Sperm from folate-deficient males had differential methylation in comparison with folate-sufficient males at sitesassociated with cancer and chronic human diseases.
Diseases No. of genesassociated
Genes
Cancers (breast, colorectal, pancreatic, kidney,leukaemia)
18 Abcg2, Bcl2, Tlx1, Ugt1a1, Ugt1a9, Arpc1a, Aff3, Cdc73,Cenpe, Ehmt1, Gstt2,Folh1, Mtus1, Nme1, Slit2, Tyms, Whsc1l1, Nr4a3
Diabetes type I 3 Aff3, Tnfsf8, Ets1Diabetes type II 3 Nkx2-2, Uts2, Cyp2e1Autoimmune diseases (multiple sclerosis, lupus,arthritis)
6 Bcl2, Cd44, Ebf1, Oaz1, Ets1, Gypa
Neurological disorders (neural tube defects, Alzheimer’sdisease, Huntington’s disease)
10 Cep290, Cckar, Clock, Csf1, Cyp2e1, Htt, Lrrk2, Zdhhc15, Ube3a, Tyms
Psychological disorders (autism, schizophrenia) 7 Cckar, Clock, Cyp2e1, Foxp2, Htt, Pnoc, Ube3a
NATURE COMMUNICATIONS | DOI: 10.1038/ncomms3889 ARTICLE
NATURE COMMUNICATIONS | 4:2889 | DOI: 10.1038/ncomms3889 | www.nature.com/naturecommunications 7
& 2013 Macmillan Publishers Limited. All rights reserved.

analysis of the altered sperm methylome suggests that theseoffspring may be at increased risk for later chronic diseases suchas diabetes and cancer. The FD model is relevant in today’ssociety despite folate supplementation of food. In humans, obesityand its metabolic sequelae are known to alter folate metabolism17.In overweight and obese individuals, homocysteine is consistentlyelevated47, whereas there are conflicting reports of effects onvitamin B12 and folate. In some studies, obesity has beenassociated with reduced B12 and folic acid and increased plasmahomocysteine48, whereas others have reported only increasedplasma homocysteine14,47. Differences may be due in part toethnicity and genetic variation in folate metabolism49. Folate andhomocysteine levels can modulate the availability of S-adenosylmethionine, the principal methyl donor. In cases of low folate orhigh homocysteine, methyl donor levels are reduced and candirectly influence methylation of DNA3. In line with our dietaryexposure beginning in utero is that obesity in pregnancy has beenassociated with lower serum folate50. However, it is not just thepoor diet, obese and overweight populations to which our modelapplies. Folate metabolism depends on gene variation, obesity anddiet. It is directly involved in immediate health effects such asreduced fertility and chronic disease51,52. MTHFR plays a central
role in folate metabolism irreversibly converting 5,10-methylenetetrahydrofolate to 5-methylenetetrahydrofolate, theprimary circulating form of folate that provides methyl groupsfor synthesis of methionine. A decreased pool of methyl groupswill affect DNA methylation. The gene encoding 5,10-MTHFR, islocated at 1p36.3 (refs 49,53). An estimated 5–20% of males areexpected to have the most common polymorphisms in MTHFRand folate status can be perturbed by polymorphisms in thesegenes. Importantly, MTHFR is most highly expressed in the testeswhere there are massive changes in the levels of DNAmethylation associated with sperm development and epigeneticreprogramming 54. Indeed, mice null for Mthfr are infertile55. TheMTHFR C677T variant has been implicated in increased risks fordisease and poor outcomes for chronic disease, reproductionand cancer. Deficiencies in folate metabolism or alteredhomocysteine status will cause changes in gene regulation viaalterations to the epigenome. Results presented here indicate thatin the male there are downstream consequences for reproductivesuccess and offspring health. Here we report that folate deficiencyis associated with altered sperm DNA methylation of genessuch as Aff3, Nkx2-2 and Uts2, which are implicated in diabetes.Our data suggest that the metabolic status of a father in terms
Rfwd2
Met
hyla
tion
(%)
Gm52
* *
Kdm3b
0
4,95
9
102030405060708090
0
7,67
68,
110
5
10
15
20
25
*
Sfi1
* * **
0
3,27
73,
511
2468
1012141618
a b
c
e
d
0
20
40
60
80
100
3,35
2
Folate sufficient
Folate deficient
Rbks
Met
hyla
tion
(%)
Met
hyla
tion
(%)
CpG location(Chromosome 1: 161163277-161163511)
CpG location(Chromosome 11: 3093352-3093487)
CpG location(Chromosome 18: 34937676-34938110)
CpG location(Chromosome 5: 135034959-135035282)
CpG location(Chromosome 5: 31999645-32000045)
0
10
20
30
40
* *
9,64
59,
646
9,76
39,
846
9,85
49,
864
9,86
99,
875
0003
7
0004
0
3,46
43,
378
3,48
73,
484
3,48
23,
477
3,47
53,
443
3,44
03,
432
3,35
9
5,28
25,
230
5,13
65,
131
5,12
24,
962
7,94
47,
849
7,75
57,
746
0004
59,
998
9,86
9
Figure 4 | Folate deficiency alters sperm DNA methylation at genes implicated in development and metabolic processes. Sequenom MassARRAY
methylation analysis was performed on selected targets of interest identified by MeDIP-chip as altered in FD versus FS sperm. FD sperm had significantly
reduced 5-methylcytosine at CpG locations of Rfwd2 (a), Sfi1 (b), Kdm3b (c), Gm52 (d) and Rbks (e). Means±s.e.m. of five determinations are shown.
*Po0.05 by Student’s t-test.
ARTICLE NATURE COMMUNICATIONS | DOI: 10.1038/ncomms3889
8 NATURE COMMUNICATIONS | 4:2889 | DOI: 10.1038/ncomms3889 | www.nature.com/naturecommunications
& 2013 Macmillan Publishers Limited. All rights reserved.

of folate availability differentially marks sperm for DNAmethylation. Does this then predispose his offspring tometabolic conditions? The increasing rates of diabetes in theUSA from 6 million in 1985 to more than 20 million in 2010indicate that the role of the sperm epigenome in this phenomenaand other chronic disease warrants deeper investigation.
Birth defects are the leading cause of infant mortality anddevelopmental disabilities in the United States. Current rates ofbirth defects in Western society are 3%; however, the causes of43% of those remain unknown56. It is well established thatexposure in utero to different lifestyle factors such as diet,drugs or alcohol can alter embryo development. For instance, therole of folate deficiency of the pregnant mother in neural tubedefects has long been known57. However, no studies haveinvestigated the role of paternal folate status and birth defectsin offspring. Here we demonstrate that defects in offspring areassociated with folate deficiency in the father. Previous studieshave linked sperm DNA damage to increased pregnancy loss andembryo malformations58,59. To determine whether increasedembryo loss in the FD-sired pregnancies could be attributable toincreased DNA damage, we assessed DNA breaks inspermatogenesis and sperm. Although there was an increasedincidence of DSBs as assess by g-H2AX foci, spermatocytes,sperm was found to be free of DNA damage as assessed by Cometassay. Thus, we suggest that the developmental abnormalities andincreased pregnancy loss in FD-sired pregnancies may beattributable to the altered sperm epigenome. The wide range ofabnormalities observed in offspring correlated with DNAmethylation changes in sperm at a significant number of genesimplicated in development. These included genes such as Lhx6and Ets1, which function in the development of the central
nervous system, Tcf21 in kidney development and Prox1, whichregulates muscle development.
There is a paucity of information showing epigenetictransmission through the germline. While our study indicatesthat epigenetic transmission is a possibility, overlap betweengenes that were identified as being differentially methylated insperm and differentially expressed in placenta was limited to twogenes. Moreover, these genes did not show methylationdifferences in the placenta. The development of the placentaand embryo is one of rapid cell division and differentiation. Thus,the changes in the sperm that might be reflected in the embryonictissues may only be present for a particular window ofdevelopment making them difficult to detect. Another possibilityis that mechanisms other than DNA methylation are involvedsuch as other chromatin modifiers. Notably, histone methylationin sperm was also altered by folate deficiency, and histonemethylation has been localized to genes implicated indevelopment42,60.
These observations indicate that the male preconception dietand overall health status may be of equal importance as themother’s and that the sperm epigenome plays a key role in thedevelopment of the embryo as has been suggested by recentstudies41,42.
Importantly, this study indicates that there are environmentsensitive regions of the sperm epigenome that respond to diet andtransfer a so-called epigenomic map that influences development,and perhaps in the long-term metabolism and disease inoffspring. This information opens new avenues of understandingand preventing paternal routes to developmental defects and thepotential mechanisms underlying inter-generational diseasetransmission.
0
20
40
60
80
100
120
140
160
Clec10a Fkrp
SufficientDeficientFolate
*
*
*
*
*
**
*
Pctp 1.5
0.5
–0.5
–1.5
–1
0
1FancgTmbim6Cspp1Tmem145Dram1Trib1Parp1PlatDdhd2Gm16894Irgm2Secisbp2St13Tpra16330578E17RikFkrpZdhhc6Mdn1PruneTxndc16Slc2a4Clec10aCav1Ppfia3Cd19Col6a36430548M08RikBicc1Cav2Olfr560Cxcr1Lrfn3Fut7PirtPlcl1Faim3Mtap1aIghv14–2
mR
NA
leve
ls/β
-act
in (
% o
f con
trol
)
Bicc1 Pirt Col6a3 Zbtb16 Plat Prune
0
20
40
60
80
100
120
140
Cav1
Folate-sufficient sired
Folate-deficient sired
**
**
mR
NA
leve
ls/β
-act
in (
% o
f con
trol
)
Txndc16
Figure 5 | Differential gene expression in placenta of offspring sired by FD versus FS males. (a) Heat-map showing the expression levels of 39 genes in
four placentas of 18.5 dpc fetuses sired by either an FS (n¼4) or FD (n¼4) male. Placentas analysed were from unique litters. (b) Validation of array
results by real-time PCR on an extended group of samples (n¼8, FS and n¼8, FD). (c) Selected array targets Cav1 and Txndc16 showed altered gene
expression and were differentially methylated in sperm of FD sires. Data are expressed as a percentage of the control b-actin, with the value of the FS at
100%. Means±s.e.m. of eight determinations are shown. For b and c, *Po0.05, **Po0.01 by Student’s t-test.
NATURE COMMUNICATIONS | DOI: 10.1038/ncomms3889 ARTICLE
NATURE COMMUNICATIONS | 4:2889 | DOI: 10.1038/ncomms3889 | www.nature.com/naturecommunications 9
& 2013 Macmillan Publishers Limited. All rights reserved.

MethodsAnimals and dietary treatments. To minimize genetic noise, the inbred C57BL/6strain was used for generation of experimental males and for analysis of the spermepigenome. Breeding assessment of experimental males was done with the outbredCD-1 strain (Charles River Laboratories, St-Constant, QC, Canada). Mice werehoused under a controlled light/dark cycle and were provided with food and waterad libitum. All animal procedures were approved by the Animal Care and UseCommittee of McGill University, Montreal. Dietary exposures began in utero. Togenerate experimental males, female C57BL/6 were fed either the FS (2 mg folicacid per kg, n¼ 69) diet (TD.01369, Harlan Laboratories, Madison, WI) or the FDdiet (0.3 mg folic acid per kg, n¼ 64; TD.01546), 2 weeks before breeding with non-experimental C57BL/6 males that were fed regular mouse chow (8640 Rodent diet;used only for breeding to generate experimental males; Fig. 1). The effects of thesediets on serum levels of folate and homocysteine have been fully described indifferent mouse strains21,61. To breed C57BL/6 females, C57BL/6 males werebrought to the females’ cages at night and removed in the morning to limitconsumption of the experimental diets by the males. Females were maintained onthe experimental diets through pregnancy and lactation. From weaning at PND21,male pups were given the same experimental diet as their in utero exposure untilkilling as adults.
Antibodies. Primary antibodies used in this study were anti-H3K4-me1 (ab8895,Abcam, 1:1000), anti-H3K9-me1 (ab8896, 1:1000), anti-H3K9me3 (07-442,Millipore, 1:1000), anti-b-actin (A-1978, Sigma), anti-SYCP3 (ab15093; 1:100),anti-gH2AX (05-636; 1:100), anti-MIS (sc-6886, Santa Cruz; 1:50), anti-mouseVASA homologue (in house, 1:200), anti-3bHSD (sc-30820, 1:100) and anti-5-methylcytidine (BI-MECY-0100, Eurogentec, 10 mg per immunoprecipitationtube). Secondary antibodies were horseradish peroxidase (HRP)-conjugated don-key-anti-rabbit and anti-mouse antibodies (711-035-152 and 715-035-150, JacksonImmunoresearch Laboratories, 1:500 for immunohistochemistry and 1:5000 forwestern blotting), Alexa Fluor 488 goat-anti-mouse (A11001, Invitrogen, 1:1000)and Alexa Fluor 594 goat-anti-rabbit (A11012, 1:1000).
Immunostaining. Tissues were fixed in Bouin’s or 4% buffered formaldehydesolution, processed for embedding in paraffin, and sectioned using standard his-tological protocols. Immunohistochemical staining was performed on 5-mm-thicksections. Tissues were then deparaffinized and rehydrated. After washing in PBSwith 0.05% Brij for immunohistochemistry or PBS with 0.03% TritonX forimmunofluorescence for 10 min, antigen retrieval was performed by incubatingtissue sections in sodium citrate buffer (pH 6.0), heating in the microwave untilboiling, followed by cooling for 30 min at room temperature. The slides were thenrinsed in PBS solution and endogenous peroxidase activity was blocked by incu-bation with 0.3% hydrogen peroxide in methanol for 30 min at room temperatureonly for immunohistochemistry. The sections were subsequently blocked in 5%BSA in PBS solution for 1 h, and then incubated with the corresponding primaryantibody with rocking overnight at 4 �C. After washing, the sections were incubatedwith secondary HRP-conjugated or fluorescence-conjugated antibody for 1 h atroom temperature, followed by washing. For immunohistochemistry, immunecomplexes were revealed by diaminobenzidine (Sigma) and sections were coun-terstained with haematoxylin. For immunofluorescence, sections were mounted inVectashield (H1200, Vector) containing 40,6-diamidino-2-phenylindole. Reactivitywas viewed using a Nikon eclipse 80i microscope (Nikon, Mississauga, Canada).
Homogenization-resistant sperm counts. The two caput epididymides were usedfor each animal at 15 weeks (FS, n¼ 5; FD, n¼ 5). Tissues were thawed on ice in asolution containing 0.5% Triton X-100 and then homogenized using a tissuehomogenizer. Finally, sperm heads were counted using a haemocytometer.
Cell preparation for analysis of DNA DSBs. DNA DSBs were assessed in enri-ched pachytene spermatocyte cell spreads. Cells were prepared according to thedrying-down technique described by Peters et al.62. Tubules were removed fromtestes and placed in hypotonic extraction buffer (30 mM Tris–HCl, 50 mM sucrose,17 mM trisodium citrate dihydrate, 5 mM EDTA, 0.5 mM dithiothreitol andproteinase inhibitor cocktail; pH 8.2) for 60 min. Subsequently, tubules wereminced into a cloudy suspension in a sucrose solution (100 mM; pH 8.2), whichwas then dispersed on slides pre-dipped in 1% paraformaldehyde. The slides werewashed in 0.4% Photoflo (Kodak) solution and dried. Co-immunofluorescentstaining of SYCP3 and g-H2AX was then performed. Reactivity was visualizedusing a confocal microscope Zeiss LSM 510–NLO.
Assessing DNA integrity in sperm using the COMET assay. DNA single- andDSBs in spermatozoa of adult male mice were evaluated by the alkaline COMETassay63. Briefly, epididymal sperms were collected from 18-week-old FS and FDmice (both n¼ 3). Fifty microlitres of sperm suspension was mixed with 500ml0.7% molten low-melting point agarose at 42 �C. Fifty microlitres was immediatelypipetted and evenly spread onto slides. Cells were then lysed in lysis buffer (2.5 molNaCl, 100 mmol EDTA, 10 mmol Tris–HCl, 10% dimethyl sulfoxide, 1% TritonX-100 and 40 mmol dithiothreitol; pH 10) for 1 h at 4 �C. After washing, slides wereincubated in an alkaline solution (1 mmol EDTA; pH 12.3) for 45 min at 4 �C.Slides were then washed in 1� TAE buffer for 5 min before electrophoresis at0.7 V cm� 1 for 10 min. Finally, the slides were dehydrated with 70% ethanol. DNAwas stained by 1:10,000 SYBR Green (Trevigen) and pictures were immediatelycaptured under microscope. For each animal, 100 cells were randomly selected andmeasured using the KOMET 5.0 image analysis system (Kinetic Imaging Ltd,Liverpool, UK).
Detection of apoptotic germ cells. Germ cell apoptosis was examined in testiscross-sections from 15-week-old mice using the terminal deoxynucleotidyl trans-ferase-mediated dUTP nick-end labelling detection protocol (Apoptag, ChemiconInternational). All the tubules in each testis section were counted and the ratio oftubules with a certain level of apoptotic cells (45, 410 or 415) to total number oftubules counted were calculated.
Breeding trial. The effect of folate deficiency on male fertility was examined bymating each experimental male (FS, n¼ 20; FD, n¼ 21; 8–10 weeks old) to a virginCD-1 female over a 5-day period. Females were examined daily for vaginal plugs.Pregnancy rate was determined as the percentage of plug-positive females thatbecame pregnant.
Txndc16
0
5
10
15
20
25
30
Met
hyla
tion
leve
l (%
)
CpG island Region differentiallymethylated in sperm
–4kb
Cav1
0
Met
hyla
tion
leve
l (%
)
CpG-rich region Region differentiallymethylated in sperm
+15kb
Folate-sufficient sired
Folate-deficient sired
10
20
30
40
50
60
70
80
CpG
CpG
Figure 6 | Genomic regions located near Txndc16 and Cav1 that are
differentially methylated in FD sperm are not differentially methylated in
18.5 dpc placentas. Pyrosequencing analysis after bisulfite conversion was
carried out on 18.5 dpc placentas sired by FS and FD males (FS sired, n¼4;
FD sired, n¼4). The values are means ±s.e.m.
ARTICLE NATURE COMMUNICATIONS | DOI: 10.1038/ncomms3889
10 NATURE COMMUNICATIONS | 4:2889 | DOI: 10.1038/ncomms3889 | www.nature.com/naturecommunications
& 2013 Macmillan Publishers Limited. All rights reserved.
Examination of fetuses and placentas. To determine whether the offspringhealth was sensitive to paternal diet, CD-1 mice were mated to males fed either theFS or FD diet throughout life (FS, n¼ 32; FD, n¼ 35; 2–3 months old) andpregnancy outcomes were determined at 18.5 dpc. Females were killed and thenumber of corpora lutea (CL) on the ovary was counted. The uteri were openedand the number of resorption sites, implantation sites and live fetuses wasdetermined. Preimplantation loss was calculated as (CL� number of implants)/CL� 100 (ref. 64). Post-implantation loss was calculated as (number ofimplants� viable fetuses)/number of implants� 100.
Skeletal preparation and histopathology. Alcian blue and Alizarin red stainingof cleared skeletal preparations was performed according to Hogan et al.65. Fetuses(18.5 dpc) were fixed in 80% ethanol for 48 h. The skin and viscera were thenremoved and the fetuses were further fixed in 95% ethanol overnight and stainedwith an alcian blue solution for 12 h. After washes in 95% ethanol for 5 h, thefetuses were transferred in a 2% KOH solution for 24 h after which the muscleswere removed. The remaining bones and cartilages were stained in a 1% KOH with0.015% alizarin red S solution for 12 h, washed for 2 days in a 1% KOH with 20%glycerol solution and finally stored in glycerol. For histopathology, specimens werefixed in Bouin’s fluid and embedded in paraffin. Deparaffinized sections werestained with haematoxylin and eosin and analysed by McGill UniversityComparative Pathology Services.
Methylation profiling by MeDIP-array. The MeDIP assay was performed asdescribed by Weber et al.66 on sperm from FS males (n¼ 3) and FD males (n¼ 4animals). Genomic DNA was extracted with a DNeasy Mini Kit (Qiagen,Mississauga, Canada). This DNA was then sonicated (Misonix) to obtain fragmentsbetween 300 and 500 bp. Then, 4 mg of this sonicated genomic DNA was denaturedfor 10 min at 95 �C and immunoprecipitated for 2 h at 4 �C with an anti5-methylcytidine. Then, dynabeads coupled with a sheep anti-mouse-IgG antibody(Dynal Biotech) for 2 h at 4 �C were added to the mixture. After washing,proteinase K was added to the beads–DNA complex for 3 h at 50 �C and themethylated DNA was isolated by phenolchloroform extraction followed by ethanolprecipitation. Input samples were processed in parallel. Immunoprecipitated DNAand input DNA from MeDIP were amplified with the GenomePlex CompleteWhole Genome Amplification Kit (Sigma, WGA2) according to the manufacturer’sinstructions. Array hybridization using the NimbleGen mouse 2.1 deluxe promoterarray was then carried out by Nimblegen.
Microarray analysis. Microarrays were processed and probe intensities wereextracted by Nimblegen. Extracted probe intensities were then analysed using the Rsoftware environment for statistical computing. Log ratios of the bound (Cy5) andinput (Cy3) microarray channel intensities were computed for each microarray,and then microarrays were normalized to one another using quantile normal-ization67 under the assumption that all samples have identical overall methylationlevels. The resulting values for each probe are called normalized intensities.Differential methylation between groups of samples was determined in two stagesto ensure both statistical significance and biological relevance. In the first stage,normalized probe intensity differences between FD and FS microarrays wereobtained for each probe (FD–FS). Given that the DNA samples were sonicatedbefore hybridization, we assumed that probes within 500 bp should approximatelyagree. Genomic regions tiled with probes were partitioned into 1,000 bp regions,each containing B10 probes. For each such 1,000 bp region, we calculated thesignificance of enrichment for high or low normalized probe differences of probeswithin its promoter. Significance was determined using the Wilcoxon rank-sumtest comparing differences of these probes against those of all the probes on themicroarray. The resulting P-values for each gene were then corrected for multipletesting by calculating their FDR using the Benjamini and Hochberg algorithm. Aprobe was then called differentially methylated if it satisfied each of the following:the region containing it had a FDR of at most 0.1 and the normalized intensitydifference between FD and FS for the probe was greater than 1 or less than � 1.The methylation level of a probe or site, when estimated from microarray data, wasobtained by applying a Bayesian deconvolution algorithm68 to normalized probeintensities and corresponding sequence information indicating the locations ofCpG dinucleotides.
All functional analysis was based on gene sets obtained from GO, KEGG andmSigDB. A gene was included in this analysis if at least one probe between� 8,000 bp and 2,000 bp of its transcription start was called differentiallymethylated. A small number of genes were initially included (Supplementary TableS4); consequently, we relaxed the requirements for calling a probe differentiallymethylated but increasing the FDR threshold from 0.1 to 0.25. Transcription startsites for the mouse gene were obtained from BiomaRt (http://www.biomart.org/).Functional significance was determined by applying the hypergeometric to theoverlap between gene sets and genes called differentially methylated. Geneexpression levels from mouse testes were obtained from published data69. Thesewere used to partition genes by expression percentiles (0–5, 5–10,..., 95–100).To obtain gene promoter methylation levels, we computed the average normalizedintensity of each probe across both microarrays and then applied the Bayesiandeconvolution algorithm mentioned above to the resulting averages.
Sequenom MassARRAY methylation analysis. One microgram of DNA from FS(n¼ 5) and FD (n¼ 5) sperm was bisulfite treated with EZ DNA Methylation GoldKit (Zymoresearch, D5007). Primers to amplify different amplicons in specificregions of Rfwd2 Sfi1 Kdm3b, Gm52 and Rbks were designed using the SequenomEpiDesigner application. Sequenom MassARRAY methylation analysis was thenperformed using the MassARRAY Compact System (Sequenom, Inc. San Diego,CA). This system is based on mass spectrometry analysis for qualitative andquantitative detection of DNA methylation using homogeneous MassCLEAVEbase-specific cleavage and matrix-assisted laser desorption/ionization time-of-flightmass spectrometry. Spectra were elaborated by the Epityper software v1.2.0(Sequenom, Inc.), which provides methylation values of each CpG unit expressedas percentage. Those values result from the calculation of the ratio mass signalsbetween the methylated and non-methylated DNA.
Gene expression array. Total RNA was extracted from the placenta from dif-ferent litters from 18.5 dpc fetuses sired by either a FS male (n¼ 4) or a FD male(n¼ 4), using the RNeasy Mini Kit (Qiagen, Mississauga, Canada) according to themanufacturer’s instructions. Cyanine 3-labelled CTP complementary RNA wasproduced using the Low Input Quick Amp Labeling Kit, according to manu-facturer’s instructions (Agilent Technologies, Mississauga, Canada). The labelledcomplementary RNA was then normalized, fragmented and hybridized onSurePrint G3 Mouse GE 8� 60 K arrays. The arrays were incubated in an AgilentHybridization oven at 65 �C for 17 h at 10 r.p.m. They were washed and scanned onan Agilent DNA Microarray Scanner C. Output from the Agilent FeatureExtraction software were read into R, preprocessed and tested for differentialexpression using functions from the Bioconductor package Limma. The normexpmethod with an offset value of 16 was used for global background adjustment,followed by quantile normalization and a log2 transformation. The annotation forprobes was retrieved from the Gene Expression Omnibus. Using the appropriateLimma functions, a linear model was fit to each gene separately. This linear modelincluded the paternal diet as a categorical variable. Moderated t-tests were per-formed on the difference between the FD and FS paternal diet groups. False dis-covery rate (FDR) estimation was carried out using the Benjamini–Hochbergmethod. Candidates for validation were selected from a list of relaxed statisticalsignificance, defined as genes with Po0.01 (determined by the aforementionedmoderated t-tests) and a minimal absolute fold-change value of 1.2.
Reverse transcription and real-time PCR. Total RNA was extracted using theRNeasy Mini Kit (Qiagen) according to the manufacturer’s instructions and 1 mg oftotal RNA was reverse transcribed using the High Capacity cDNA Reverse Tran-scription kit (Applied Biosystems, Foster City, CA, USA). Primers were designedusing Primer Express software (Applied Biosystems; Supplementary Table S2).PCR reactions were performed following the SYBR Green Universal PCR MasterMix protocol (Applied Biosystems) using an ABI Prism 7500 apparatus (AppliedBiosystems). Each sample was run in triplicate and negative controls (non-templatecontrol and minus reverse transcription samples) were run for each primer pair.The measured amount of each complementary DNA was normalized using thecontrol b-actin, a housekeeping gene with expression that was not altered bytreatment. The relative quantification was performed using the standard curvemethod. A list of the primers used is provided in Supplementary Table S5.
Western blotting. Western blots were performed to measure global levels ofhistone methylation in FS and FD sperm. Sperm extracts were prepared inLaemmli buffer (50 mM Tris–HCl (pH 7.5), 170 mM NaCl, 1% NP-40, 50 mMNAF, 1 mM phenylmethylsulfonyl fluoride, 100 mM NaVO3 and a proteinaseinhibitor cocktail). Equal amounts of protein were resolved by standard SDS–polyacrylamide gel electrophoresis and electroblotted onto nitrocellulose mem-branes. The membranes were incubated overnight at 4 �C in PBS that contained 5%low-fat milk, 0.05% Tween-20 and the corresponding first antibody. After washing,the membranes were incubated with a donkey-anti-rabbit or anti-mouse HRP-conjugated secondary antibody diluted in 5% milk in PBS with 0.05% Tween-20,and labelling was detected using enhanced chemiluminescence (Pierce). Mem-branes were exposed to Kodak autoradiography BioMax film. Films were scannedand the band intensity was quantified using AlphaDigiDocTM. Each experimentwas performed on six FD and six FS sperm samples and replicated a minimum ofthree times. Full-size blots are shown in Supplementary Fig. S9.
Pyrosequencing. DNA methylation levels in placenta were determined by pyr-osequencing using a PyroMark Q24 (Qiagen) after bisulfite conversion, which is areal-time sequencing-based DNA analysis that quantifies multiple and consecutiveCpG sites individually. Placental DNA was extracted using the DNeasy Mini Kit(Qiagen); 1 mg of DNA was then bisulfite-treated using the EpiTect Fast DNABisulfite Kit (Qiagen). Bisulfite-treated DNA was eluted in 15 ml volume, and 3 mlwas used for each PCR. PCR was performed using the HotStar DNA Polymerase(Qiagen). The PCR was performed with one of the PCR primers biotinylated toconvert the PCR product to single-stranded DNA templates. The PCR products(each 20 ml) were sequenced following the manufacturer’s instructions (Qiagen).The methylation status of each locus was analysed individually as a T/C single-
NATURE COMMUNICATIONS | DOI: 10.1038/ncomms3889 ARTICLE
NATURE COMMUNICATIONS | 4:2889 | DOI: 10.1038/ncomms3889 | www.nature.com/naturecommunications 11
& 2013 Macmillan Publishers Limited. All rights reserved.

nucleotide polymorphism using the PyroMark Q24 Advanced software (Qiagen).The list of primers used is listed in Supplementary Table S5.
Statistical analysis. In graphs or tables, numbers represent the mean±s.e.m. of atleast three independent experimental units. The level of significance for all thestatistical tests used in this study was set at Po0.05 and all the tests were two tailed.Statistical analysis of pregnancy rate and resorption rate used Fisher’s exact test andw2-test, respectively. The data assessing DNA methylation, mRNA levels, histonemethylation, weights, sperm counts and meiotic tubule counts were analysed fordifferences between the control and treated group by unpaired Student’s t-test or incase of failed normality by the Mann–Whitney U-test or Kolmogorov–Smirnovtest. For the fertility trial and pregnancy outcomes, all the calculation and analysiswere on a per male basis. For each litter, the average of embryo weights, crown-rump lengths and placenta widths and weights were calculated, then the collectionof averages for the litters sired by FS males was compared with the collection ofaverages for the litters sired by FD males by Student’s t-test. When analysing theCOMET scores, the collection averages were compared between FS and FD malesby Student’s t-test. The g-H2Ax foci were analysed by subsample model. Theanimals are random effects nested in the fixed effects of folate level. Each cellanalysed is a subsample unit, while the animal is the experimental unit. The dietarytreatments were randomized and samples were randomly selected from experi-mental groups for downstream analysis including for gene expression, pathologyand sperm epigenome analysis. No blinding was done. All the n indicated representbiological replicates. Data were analysed with the aid of SAS 9.2 and PASWStatistics Base 18.
References1. Singal, R. & Ginder, G. D. DNA methylation. Blood 93, 4059–4070
(1999).2. Bernal, A. J. & Jirtle, R. L. Epigenomic disruption: the effects of early
developmental exposures. Birth Defects Res. 88, 938–944 (2010).3. Jirtle, R. L. & Skinner, M. K. Environmental epigenomics and disease
susceptibility. Nat. Rev. Genet. 8, 253–262 (2007).4. Ng, S. F., Lin, R. C., Laybutt, D. R., Barres, R., Owens, J. A. & Morris, M. J.
Chronic high-fat diet in fathers programs beta-cell dysfunction in female ratoffspring. Nature 467, 963–966 (2010).
5. Kaati, G., Bygren, L. O. & Edvinsson, S. Cardiovascular and diabetes mortalitydetermined by nutrition during parents’ and grandparents’ slow growth period.Eur. J. Hum. Genet. 10, 682–688 (2002).
6. Waterland, R. A. & Jirtle, R. L. Early nutrition, epigenetic changes attransposons and imprinted genes, and enhanced susceptibility to adult chronicdiseases. Nutrition 20, 63–68 (2004).
7. Delaval, K. & Feil, R. Epigenetic regulation of mammalian genomic imprinting.Curr. Opin. Genet. Dev. 14, 188–195 (2004).
8. Li, E., Beard, C. & Jaenisch, R. Role for DNA methylation in genomicimprinting. Nature 366, 362–365 (1993).
9. Morison, I. M., Ramsay, J. P. & Spencer, H. G. A census of mammalianimprinting. Trends Genet. 21, 457–465 (2005).
10. Oakes, C. C., La Salle, S., Smiraglia, D. J., Robaire, B. & Trasler, J. M. A uniqueconfiguration of genome-wide DNA methylation patterns in the testis.Proc. Natl Acad. Sci. USA 104, 228–233 (2007).
11. Hammoud, S. S., Nix, D. A., Hammoud, A. O., Gibson, M., Cairns, B. R. &Carrell, D. T. Genome-wide analysis identifies changes in histone retention andepigenetic modifications at developmental and imprinted gene loci in the spermof infertile men. Hum. Reprod. 26, 2558–2569 (2011).
12. Carone, B. R. et al. Paternally induced transgenerational environmentalreprogramming of metabolic gene expression in mammals. Cell 143, 1084–1096(2010).
13. Bentivoglio, G., Melica, F. & Cristoforoni, P. Folinic acid in the treatment ofhuman male infertility. Fertil. Steril. 60, 698–701 (1993).
14. Forges, T. et al. Impact of folate and homocysteine metabolism on humanreproductive health. Hum. Reprod. Update 13, 225–238 (2007).
15. Ray, J. G. Efficacy of Canadian folic acid food fortification. Food Nutr. Bull. 29,S225–S230 (2008).
16. Gallistl, S., Sudi, K., Mangge, H., Erwa, W. & Borkenstein, M. Insulin is anindependent correlate of plasma homocysteine levels in obese children andadolescents. Diabetes Care 23, 1348–1352 (2000).
17. Mahabir, S. et al. Measures of adiposity and body fat distribution in relation toserum folate levels in postmenopausal women in a feeding study. Eur. J. Clin.Nutr. 62, 644–650 (2008).
18. Reeves, P. G., Nielsen, F. H. & Fahey, Jr G. C. AIN-93 purified diets forlaboratory rodents: final report of the American Institute of Nutrition ad hocwriting committee on the reformulation of the AIN-76 A rodent diet. J. Nutr.123, 1939–1951 (1993).
19. Davis, T. L., Trasler, J. M., Moss, S. B., Yang, G. J. & Bartolomei, M. S.Acquisition of the H19 methylation imprint occurs differentially on theparental alleles during spermatogenesis. Genomics 58, 18–28 (1999).
20. Bellve, A. R., Cavicchia, J. C., Millette, C. F., O’Brien, D. A., Bhatnagar, Y. M. &Dym, M. Spermatogenic cells of the prepuberal mouse. Isolation andmorphological characterization. J. Cell. Biol. 74, 68–85 (1977).
21. Knock, E. et al. Strain differences in mice highlight the role of DNAdamage in neoplasia induced by low dietary folate. J. Nutr. 138, 653–658(2008).
22. Blount, B. C. et al. Folate deficiency causes uracil misincorporation into humanDNA and chromosome breakage: implications for cancer and neuronaldamage. Proc. Natl Acad. Sci. USA 94, 3290–3295 (1997).
23. Ahmed, E. A. et al. Differences in DNA double strand breaks repair in malegerm cell types: lessons learned from a differential expression of Mdc1 and53BP1. DNA Repair. (Amst). 6, 1243–1254 (2007).
24. McManus, K. J., Hendzel, M. J. & ATM-dependent, D. N. A. damage-independent mitotic phosphorylation of H2AX in normally growingmammalian cells. Mol. Biol. Cell. 16, 5013–5025 (2005).
25. Chicheportiche, A., Bernardino-Sgherri, J., de Massy, B. & Dutrillaux, B.Characterization of Spo11-dependent and independent phospho-H2AX fociduring meiotic prophase I in the male mouse. J. Cell. Sci. 120, 1733–1742(2007).
26. Olive, P. L., Trotter, T., Banath, J. P., Jackson, S. M. & Le Riche, J. Heterogeneityin human tumour hypoxic fraction using the comet assay. Br. J. Cancer 27,S191–S195 (1996).
27. Kluin, P. M., Kramer, M. F. & de Rooij, D. G. Proliferation of spermatogoniaand Sertoli cells in maturing mice. Anat. Embryol. (Berl). 169, 73–78 (1984).
28. Payne, A. H. & Hardy, M. P. The Leydig Cell in Health and Disease (HumanaPress, 2007).
29. Brehm, R. & Steger, K. Regulation of Sertoli cell and germ cell differentation.Adv. Anat. Embryol. Cell Biol. 181, 1–93 (2005).
30. Holstein, A. F., Schulze, W. & Davidoff, M. Understanding spermatogenesis is aprerequisite for treatment. Reprod. Biol. Endocrinol. 1, 107 (2003).
31. Haider, S. G. Leydig cell steroidogenesis: unmasking the functional importanceof mitochondria. Endocrinology 148, 2581–2582 (2007).
32. Bressan, F. F. et al. Unearthing the roles of imprinted genes in the placenta.Placenta 30, 823–834 (2009).
33. Gebert, C., Kunkel, D., Grinberg, A. & Pfeifer, K. H19 imprinting control regionmethylation requires an imprinted environment only in the male germ line.Mol. Cell. Biol. 30, 1108–1115 (2010).
34. Farthing, C. R. et al. Global mapping of DNA methylation in mouse promotersreveals epigenetic reprogramming of pluripotency genes. PLoS Genet. 4,e1000116 (2008).
35. Weber, M. et al. Distribution, silencing potential and evolutionary impact ofpromoter DNA methylation in the human genome. Nat. Genet. 39, 457–466(2007).
36. Dean, A. In the loop: long range chromatin interactions and gene regulation.Brief. Funct. Genomics 10, 3–10 (2011).
37. Sasaki, H., Ishihara, K. & Kato, R. Mechanisms of Igf2/H19 imprinting: DNAmethylation, chromatin and long-distance gene regulation. J. Biochem. 127,711–715 (2000).
38. Huang da, W., Sherman, B. T. & Lempicki, R. A. Systematic and integrativeanalysis of large gene lists using DAVID bioinformatics resources. Nat. Protoc.4, 44–57 (2009).
39. Allegrucci, C., Thurston, A., Lucas, E. & Young, L. Epigenetics and thegermline. Reproduction 129, 137–149 (2005).
40. Delaval, K., Govin, J., Cerqueira, F., Rousseaux, S., Khochbin, S. & Feil, R.Differential histone modifications mark mouse imprinting control regionsduring spermatogenesis. EMBO J. 26, 720–729 (2007).
41. Hammoud, S. S., Nix, D. A., Zhang, H., Purwar, J., Carrell, D. T. & Cairns, B. R.Distinctive chromatin in human sperm packages genes for embryodevelopment. Nature 460, 473–478 (2009).
42. Brykczynska, U. et al. Repressive and active histone methylation mark distinctpromoters in human and mouse spermatozoa. Nat. Struct. Mol. Biol. 17,679–687 (2010).
43. Hackett, J. A. et al. Germline DNA demethylation dynamics and imprinterasure through 5-hydroxymethylcytosine. Science 339, 448–452 (2013).
44. Smith, Z. D. & Meissner, A. DNA methylation: roles in mammaliandevelopment. Nat. Rev. Genet. 14, 204–220 (2013).
45. Sharpe, R. M. & Skakkebaek, N. E. Are oestrogens involved in falling spermcounts and disorders of the male reproductive tract? Lancet 341, 1392–1395(1993).
46. Godmann, M. et al. Dynamic regulation of histone H3 methylation atlysine 4 in mammalian spermatogenesis. Biol. Reprod. 77, 754–764 (2007).
47. Sanchez-Margalet, V. et al. Elevated plasma total homocysteine levels inhyperinsulinemic obese subjects. J. Nutr. Biochem. 13, 75–79 (2002).
48. Karatela, R. A. & Sainani, G. S. Plasma homocysteine in obese, overweight andnormal weight hypertensives and normotensives. Indian Heart J. 61, 156–159(2009).
49. Sharp, L. & Little, J. Polymorphisms in genes involved in folate metabolism andcolorectal neoplasia: a HuGE review. Am. J. Epidemiol. 159, 423–443 (2004).
ARTICLE NATURE COMMUNICATIONS | DOI: 10.1038/ncomms3889
12 NATURE COMMUNICATIONS | 4:2889 | DOI: 10.1038/ncomms3889 | www.nature.com/naturecommunications
& 2013 Macmillan Publishers Limited. All rights reserved.

50. Tinker, S. C., Hamner, H. C., Berry, R. J., Bailey, L. B. & Pfeiffer, C. M. Doesobesity modify the association of supplemental folic acid with folate statusamong nonpregnant women of childbearing age in the United States? BirthDefects Res. 94, 749–755 (2012).
51. Smith, A. D. Prevention of dementia: a role for B vitamins? Nutr. Health 18,225–226 (2006).
52. Yajnik, C. S. et al. Vitamin B12 and folate concentrations during pregnancy andinsulin resistance in the offspring: the Pune Maternal Nutrition Study.Diabetologia 51, 29–38 (2008).
53. Pejchal, R. et al. Structural perturbations in the Ala --4 Val polymorphism ofmethylenetetrahydrofolate reductase: how binding of folates may protectagainst inactivation. Biochemistry 45, 4808–4818 (2006).
54. Gaughan, D. J., Barbaux, S., Kluijtmans, L. A. & Whitehead, A. S. The humanand mouse methylenetetrahydrofolate reductase (MTHFR) genes: genomicorganization, mRNA structure and linkage to the CLCN6 gene. Gene 257,279–289 (2000).
55. Kelly, T. L., Neaga, O. R., Schwahn, B. C., Rozen, R. & Trasler, J. M. Infertilityin 5,10-methylenetetrahydrofolate reductase (MTHFR)-deficient male mice ispartially alleviated by lifetime dietary betaine supplementation. Biol. Reprod.72, 667–677 (2005).
56. Nelson, K. & Holmes, L. B. Malformations due to presumed spontaneousmutations in newborn infants. N. Engl. J. Med. 320, 19–23 (1989).
57. Hibbard, B. M. The role of folic acid in pregnancy; with particular reference toanaemia, abruption and abortion. J. Obstet. Gynaecol. Br. Commonw. 71,529–542 (1964).
58. Chohan, K. R., Griffin, J. T., Lafromboise, M., De Jonge, C. J. & Carrell, D. T.Comparison of chromatin assays for DNA fragmentation evaluation in humansperm. J. Androl. 27, 53–59 (2006).
59. Hales, B. F. DNA repair disorders causing malformations. Curr. Opin. Genet.Dev. 15, 234–240 (2005).
60. Erkek, S. et al. Molecular determinants of nucleosome retention at CpG-richsequences in mouse spermatozoa. Nat. Struct. Mol. Biol. 20, 1236 (2013).
61. Li, D. & Rozen, R. Maternal folate deficiency affects proliferation, but notapoptosis, in embryonic mouse heart. J. Nutr. 136, 1774–1778 (2006).
62. Peters, A. H., Plug, A. W. & de Boer, P. Meiosis in carriers of heteromorphicbivalents: sex differences and implications for male fertility. Chromosome Res.5, 313–324 (1997).
63. Delbes, G., Hales, B. F. & Robaire, B. Effects of the chemotherapy cocktail usedto treat testicular cancer on sperm chromatin integrity. J. Androl. 28, 241–249discussion 250–241 (2007).
64. Toppings, M. et al. Profound phenotypic variation among mice deficient in themaintenance of genomic imprints. Hum. Reprod. 23, 807–818 (2008).
65. Hogan, B., Beddington, R., Costantini, F. & Lacy, E. Manipulating The MouseEmbryo: A Laboratory Manual 2nd edn (Cold Spring Harbor Laboratory Press,1994).
66. Weber, M. et al. Chromosome-wide and promoter-specific analyses identifysites of differential DNA methylation in normal and transformed human cells.Nat. Genet. 37, 853–862 (2005).
67. Bolstad, B. M., Irizarry, R. A., Astrand, M. & Speed, T. P. A comparison ofnormalization methods for high density oligonucleotide array data based onvariance and bias. Bioinformatics 19, 185–193 (2003).
68. Down, T. A. et al. A Bayesian deconvolution strategy for immunoprecipitation-based DNA methylome analysis. Nat. Biotechnol. 26, 779–785 (2008).
69. Su, A. I. et al. A gene atlas of the mouse and human protein-encodingtranscriptomes. Proc. Natl Acad. Sci. USA 101, 6062–6067 (2004).
AcknowledgementsWe thank Drs Jacquetta Trasler and Rima Rozen (McGill University) for their advice inthe establishment of the folate diet animal model. We also thank Dr Barbara Hales(McGill University) for her assistance in identification and classification of the fetalabnormalities, Drs Bernard Robaire (McGill University) and Geraldine Delbes (INRS) fortheir assistance in the running of the COMET assays, Dr Katja Teerds (University ofWageningen) for assistance with Leydig cell analysis and Francois Lefebvre (GenomeQuebec) for bioinformatic support. This research was funded by The Natural Sciencesand Research Council of Canada (grant S.K.), the Canadian Institute of Health Research(S.K.) and Genome Quebec(S.K.). R.L. held a fellowship from the Reseau Quebecois enReproduction (R.Q.R.) and George Chountalos from the McGill Center for the Study ofReproduction (C.S.R.).
Author contributionsR.L., C.X., S.S.-P., and S.K. conceived and designed the experiments. R.L., C.X., S.S-P,G.C., T.C., M.P. and M.S., performed the experiments and analysed the data. M.H.provided advice on the data analysis and the manuscript. R.L., C.X. and S.K. wrote themanuscript.
Additional informationAccession codes: The MeDIP-array data have been deposited in the Gene ExpressionOmnibus (GEO) repository under accession number GSE52017. The Gene expressionarray data have been deposited in the GEO repository under accession numberGSE51819.
Supplementary Information accompanies this paper at http://www.nature.com/naturecommunications
Competing financial interests: The authors declare no competing financial interests.
Reprints and permissions information is available online at http://npg.nature.com/reprintsandpermissions/
How to cite this article: Lambrot, R. et al. Low paternal dietary folate alters the mousesperm epigenome and is associated with negative pregnancy outcomes. Nat. Commun.4:2889 doi: 10.1038/ncomms3889 (2013).
This work is licensed under a Creative Commons Attribution-NonCommercial-NoDerivs 3.0 Unported License. To view a copy of
this license, visit http://creativecommons.org/licenses/by-nc-nd/3.0/
NATURE COMMUNICATIONS | DOI: 10.1038/ncomms3889 ARTICLE
NATURE COMMUNICATIONS | 4:2889 | DOI: 10.1038/ncomms3889 | www.nature.com/naturecommunications 13
& 2013 Macmillan Publishers Limited. All rights reserved.