aggregated electronegative low density lipoprotein in human
TRANSCRIPT

Aggregated Electronegative Low Density Lipoprotein inHuman Plasma Shows a High Tendency towardPhospholipolysis and Particle Fusion*□S
Received for publication, April 30, 2010, and in revised form, July 29, 2010 Published, JBC Papers in Press, July 29, 2010, DOI 10.1074/jbc.M110.139691
Cristina Bancells‡§1,2, Sandra Villegas§3, Francisco J. Blanco¶�, Sonia Benítez‡2,4, Isaac Gallego§, Lorea Beloki‡5,Montserrat Perez-Cuellar‡, Jordi Ordonez-Llanos‡§2, and Jose Luis Sanchez-Quesada‡2,4,6
From the ‡Departament de Bioquímica, Institut d’Investigacions Biomediques Sant Pau, Hospital de la Santa Creu i Sant Pau,08025 Barcelona, Spain, the §Departament de Bioquímica i Biologia Molecular, Universitat Autonoma de Barcelona,08193 Cerdanyola del Valles, Spain, ¶CIC BioGUNE, Parque Tecnologico de Bizkaia, Edificio 800, 48160 Derio, Spain, and�IKERBASQUE, Basque Foundation for Science, 48011 Bilbao, Spain
Aggregation and fusion of lipoproteins trigger subendothelialretention of cholesterol, promoting atherosclerosis. The tend-ency of a lipoprotein to form fused particles is considered to berelated to its atherogenic potential. We aimed to isolate andcharacterize aggregated andnonaggregated subfractions of LDLfrom human plasma, paying special attention to particle fusionmechanisms. Aggregated LDL was almost exclusively found inelectronegative LDL (LDL(�)), a minor modified LDL subfrac-tion, but not in native LDL (LDL(�)). The main differencebetween aggregated (agLDL(�)) and nonaggregated LDL(�)(nagLDL(�)) was a 6-fold increased phospholipase C-like activ-ity in agLDL(�). agLDL(�) promoted the aggregation ofLDL(�) and nagLDL(�). Lipoprotein fusion induced by �-chy-motrypsin proteolysis wasmonitored byNMR and visualized bytransmission electron microscopy. Particle fusion kinetics wasmuch faster in agLDL(�) than in nagLDL(�) or LDL(�). NMRand chromatographic analysis revealed a rapid and massivephospholipid degradation in agLDL(�) but not innagLDL(�) orLDL(�). Choline-containing phospholipids were extensivelydegraded, and ceramide, diacylglycerol, monoacylglycerol, andphosphorylcholine were the main products generated, suggest-ing the involvement of phospholipase C-like activity. The prop-erties of agLDL(�) suggest that this subfraction plays a majorrole in atherogenesis by triggering lipoprotein fusion and cho-lesterol accumulation in the arterial wall.
Atherosclerosis is a consequence of the excessive depositionof cholesterol in the intimal vessel wall, coming mainly from
plasma LDL. It is widely accepted that lipoprotein retentionmediated by the binding of LDL to proteoglycans is a key eventin atherogenesis (1). In this environment, chemical modifica-tion of trapped LDL triggers an inflammatory response thatpromotes localized leukocyte recruitment, cell proliferation,and apoptotic processes (2). Oxidation of LDL is the mostwidely studied mechanism of modification, and oxidized lipidsplay a central role in inflammation, proliferation, and apoptosis(3). However, other modifications, such as degradation byphospholipases, cholesteryl esterase, or proteases, also occur inthe intima of the arterial wall and have amore relevant role thanoxidation in lipoprotein trapping (4). Thesemodifications favorLDL aggregation and fusion in the arterial wall, precluding itsexit to the bloodstreamand accelerating the development of thedisease (5). Thus, the tendency of a lipoprotein to form fusedparticles is related to its atherogenic potential.In addition to the modified forms of LDL that occur in the
vessel wall, several minor forms have been detected in blood. Acommon characteristic is an increase of the electronegativecharge of the particle. This feature has been used to isolateelectronegative LDL (LDL(�)).7 It accounts for 5% of total LDLin healthy subjects (6). Growing evidence suggests a close rela-tionship between LDL(�) and atherosclerosis. The proportionof LDL(�) is increased in pathologies with a high incidence ofcardiovascular events, such as familial hypercholesterolemia(7), hypertriglyceridemia (8), diabetes (9), or severe renal dis-ease (10). In addition, drugs known to decrease cardiovascularrisk, such as statins or insulin, decrease LDL(�) proportionindependently of changes in total LDL cholesterol (7, 9). Studiesperformed in endothelial and mononuclear cells have shownthat LDL(�) induces inflammation and apoptosis and impairsangiogenesis (11–14). Regarding its physicochemical charac-teristics, apolipoprotein B-100 (apoB) in LDL(�) presentsstructural differences versus apoB in native LDL (15), binds
* This work was supported by Instituto de Salud Carlos III Grants PI060500and PI070148 and by an ETORTEK-2008 grant from Sociedad para la Pro-mocion y Reconversion Industrial.
□S The on-line version of this article (available at http://www.jbc.org) containssupplemental text, Table 1S, and Figs. 1S– 8S.
1 Recipient of Grant AP2004-1468 from the Ministerio de Educacion y Ciencia.2 Member of the 2009-SGR-1205 Research Group from the Generalitat de
Catalunya.3 Supported by Grant FMM-08 from Fundacion Mutua Madrilena. Member of
the 2009-SGR-00761 Research Group from the Generalitat de Catalunya.4 Recipient of Grants CP040110 and CP060220 from Instituto de Salud
Carlos III.5 Recipient of a personal grant from “La Caixa.”6 To whom correspondence should be addressed: Servei de Bioquímica, Hospital
de la Santa Creu i Sant Pau, C/Antoni Maria Claret 167, 08025 Barcelona, Spain.Tel.: 34-932919261; Fax: 34-932919196; E-mail: [email protected].
7 The abbreviations used are: LDL(�), electronegative LDL; agLDL(�), aggre-gated electronegative LDL; apo, apolipoprotein; BHT, butylated hydroxy-toluene; DAG, diacylglycerol; GGE, nondenaturing acrylamide gradient gelelectrophoresis; IDL, intermediate density lipoprotein; LDL(�), native elec-tropositive LDL; LPC, lysophosphatidylcholine; MAG, monoacylglycerol;nagLDL(�), nonaggregated electronegative LDL; NEFA, nonesterifiedfatty acid; oxLDL, oxidized LDL; PAF-AH, platelet-activating factor-acetyl-hydrolase; PC, phosphatidylcholine; PLC, phospholipase C; SM, sphingo-myelin; SMase, sphingomyelinase; TEM, transmission electron microscopy.
THE JOURNAL OF BIOLOGICAL CHEMISTRY VOL. 285, NO. 42, pp. 32425–32435, October 15, 2010© 2010 by The American Society for Biochemistry and Molecular Biology, Inc. Printed in the U.S.A.
OCTOBER 15, 2010 • VOLUME 285 • NUMBER 42 JOURNAL OF BIOLOGICAL CHEMISTRY 32425
by guest on April 5, 2019
http://ww
w.jbc.org/
Dow
nloaded from

poorly to the LDL receptor (16), is prone to aggregation (17),and presents amyloidogenic properties (18). Our grouprecently reported that LDL(�) has several populations withnormal or high binding affinity to proteoglycans comparedwith native LDL (1). LDL(�) fractions with increased affinity toproteoglycans presented a higher content of aggregated parti-cles. This finding suggests that an aggregated subfraction ofLDL(�) could be retained more strongly in the arterial wallthan the bulk of nonaggregated LDL(�). However, the specificcharacteristics of this aggregated subpopulation have not beenstudied to date.The aim of the current study was to isolate aggregated and
nonaggregated LDL(�) fractions from human plasma andstudy their physicochemical characteristics. Special attentionwas paid to the mechanism of particle fusion because this fea-ture plays a key role in subendothelial lipoprotein retention(20). Our results show that aggregated LDL(�) has high intrin-sic phospholipase (PLC)-like activity. This activity makes thissubfraction prone to particle fusion and promotes the aggre-gation of nonaggregated LDL subfractions. These propertiessuggest that the aggregated LDL(�) subfraction has a ma-jor atherogenic role, favoring subendothelial cholesterolaccumulation.
EXPERIMENTAL PROCEDURES
Materials—All of the reagents were purchased from Sigmaunless otherwise stated.Isolation of LDL Subfractions—The study was approved by
the institutional ethics committee, and all volunteers gaveinformed consent. Total LDL (density range, 1.019–1.050g/ml) was isolated from plasma of healthy volunteers bysequential ultracentrifugation using KBr gradients. VLDL andintermediate density lipoprotein (IDL) were isolated in 6 h at200,000 � g (50,000 rpm), and LDL was then obtained after afurther 14 h at the same centrifugal force. Total LDL was sub-fractionated in native LDL (LDL(�)) and LDL(�) by stepwiseanion exchange chromatography in an AKTA-FPLC systemwith a Hi-Load 26/10 Q-Sepharose column (GE Healthcare)using buffer A (10 mmol/liter Tris, 1 mmol/liter EDTA, 2�mol/liter butylated hydroxytoluene (BHT), pH 7.4) and bufferB (10mmol/liter Tris, 1 mmol/liter EDTA, 2 �mol/liter BHT, 1mol/liter NaCl, pH 7.4), as described (21). LDL(�) eluted at0.24 mol/liter NaCl, and LDL(�) eluted at 0.5 mol/liter NaCl.Both subfractions were concentrated by centrifugation withAmicon microconcentrators (10,000 molecular weight cut-off;Amicon Ultra-4, Millipore, Cork, Ireland) and submitted to gelfiltration chromatography to fractionate aggregated and non-aggregated fractions. Gel filtration chromatography was per-formed using two on-line connected Superose 6 columns in anAKTA-FPLC system (GE Healthcare). Two ml of LDL(�) orLDL(�) at 1 g of protein/liter were eluted with buffer 10mmol/liter Tris, 150 mmol/liter NaCl, 1 mmol/liter EDTA, 2 �mol/liter BHT, pH 7.4, at a flow of 1 ml/min, and fractions of 1 mlwere collected and concentrated with Amicon microconcen-trators. All of the isolation stepswere performed at 4 °C, and thebuffers and density solutions contained 1 mmol/liter EDTAand 2 �mol/liter BHT. All of the analyses were performedwithin 3 days of isolation except HPLC and TLC studies, in
which lipid extracts were made within 3 days and dry pelletswere frozen at �80 °C under nitrogen and analyzed within 1month.Composition of LDL Subfractions—Major components of
LDL subfractions, including apoB, total cholesterol, triglycer-ide, total phospholipids, nonesterified fatty acids (NEFA), andfree glycerol were measured by commercial methods adaptedto a Hitachi 917 autoanalyzer, as described (21, 22).ApoE, apoC-III, apoA-I, and apoA-II (Kamiya, Seattle, WA)
were quantified manually using commercial methods adaptedto measure low concentrations (19). Briefly, 100 �l of reagent 1(Tris buffer) were mixed with 100 �l of LDL at 0.4 g of protein/liter and incubated at 37 °C for 30 min. Afterward, 50 �l ofreagent 2 (antiserum) were added and incubated at 37 °C for 30min. Absorbance was measured in a microtiter plate reader atthewavelength recommended by themanufacturer. A standardcurve was performed with an apolipoprotein multi-calibrator(Wako Chemicals, Richmond, VA) diluted 1/5 to 1/100. Totalprotein content was determined by the bicinchoninic acidmethod (Pierce).Phosphatidylcholine (PC), sphingomyelin (SM), and lyso-
phosphatidylcholine (LPC) were quantified by normal phaseHPLC in a Gold System chromatograph equipped with a diodearray detector (Beckman, Palo Alto, CA), as described (23).Dipalmitoyl-glycero-phosphodimethyl ethanolamine was usedas an internal standard. Briefly, 25 �l of dipalmitoyl-glycero-phosphodimethyl ethanolamine at 20 g/liter in ethanol wereadded to 200 �l of LDL (0.5 g of protein/liter), and lipids wereextracted by the Bligh and Dyer method. The pellet was resus-pended with 80 �l of hexane/isopropanol/water (v/v/v 6:8:1),and 20 �l of this solution were injected into a normal phasecolumn (Luna 5-�m silica; Phenomenex, Torrance, CA) at aflow rate of 1 ml/min. Themobile phase was acetonitrile:meth-anol:ammonium sulfate 5mmol/liter (v/v/v 56:23:6). The peakswere detected at 205 nm using a photo diode array detector(model 168; Beckman). Lipoperoxidation was estimated bymeasuring the absorbance at 234 nm of the PC peak (that cor-responds to oxidized PC) and expressed as the 205/234-nmratio (17).
�-Tocopherol content in LDL subfractions was determinedby reverse phase HPLC in a Gold System chromatograph (24).Tocopherol acetate was used as an internal standard. Briefly,250 �l of tocopherol acetate at 10 mg/liter in ethanol wereadded to 250 �l of LDL (0.5 g of protein/liter), and lipids wereextractedwith 0.5ml of heptane and intense agitation for 1min.The organic phase was evaporated under nitrogen. The pelletswere resuspendedwith 80�l of ethanol, and 20�l were injectedinto a reverse phase column (Ultrasphere ODS; Beckman, PaloAlto, CA) at a flow rate of 1 ml/min. The mobile phase wasacetonitrile/isopropanol/water (v/v/v 85:13:2). The peaks weredetected at 290 nm using a photo diode array detector. Suscep-tibility to oxidation wasmeasured by continuousmonitoring ofconjugated diene formation at 234 nm at 37 °C, using 100 �l ofLDLs (0.05 g of protein/liter) dialyzed in PBS and 5 �mol/literCuSO4 in a UV microtiter plate.TLC to identifymajor lipidswas performed in silica gel plates
(Partisil LK5DF; Whatmann, Middlestone, UK). The lipidswere extracted according to Bligh andDyer using 100�l of LDL
Aggregated LDL, Phospholipolysis, and Particle Fusion
32426 JOURNAL OF BIOLOGICAL CHEMISTRY VOLUME 285 • NUMBER 42 • OCTOBER 15, 2010
by guest on April 5, 2019
http://ww
w.jbc.org/
Dow
nloaded from

at 0.5 g of protein/liter. The pellets were resuspendedwith 20�lof chloroform and applied to the plate. The plates were devel-oped using three sequential phases: chloroform/methanol/wa-ter (v/v/v 65:40:5) to 5 cm, toluene/diethyl ether/ethanol (v/v/v60:40:3) to 13 cm, and heptane to 17 cm.The lipidswere stainedby dipping the plates in phosphomolybdate solution (5%phosphomolybdate and 5% sulfuric acid in ethanol) at roomtemperature for 1 min and then incubated for 7 min at 100 °C.Electrophoretic Studies—LDL particle size was analyzed by
nondenaturing acrylamide gradient gel electrophoresis (GGE),in 2–16% gels, as described (8). Briefly, two solutions at 2 and16% were prepared using a stock solution of acrylamide andbisacrylamide (30% total, 5% cross-linker) andmixed using twoperistaltic pumps. Fifteen �l of each LDL subfraction at 0.3 g ofprotein/liter were preincubated for 15 min with 5 �l of SudanBlack (0.1% w/v in ethylene glycol), and 5 �l of sucrose (50%w/v). Fifteen �l of this mixture were electrophoresed at 4 °C for30 min at 20 V, 30 min at 70 V, and 8 h at 100 V.Phospholipolytic Activities—Platelet-activating factor acetyl-
hydrolase (PAF-AH) activity was measured using 2-thio PAF(Cayman Chemicals, Tallin, Estonia) as substrate (25). LDLfractions (10 �l of LDL at 0.25 g of protein/liter, in Tris 10 mM,EGTA 1mM, pH 7.2) were incubated with 2-thio-PAF and 5,5�-dithiobis(2-nitrobenzoic) acid as indicated by the manufac-turer. Absorbance was measured at 414 nm at increasing timesin a microtiter plate, and the slope was used to calculatePAF-AH activity (expressed as �mol/min�mg of protein).PLC-like activity was quantified by the Amplex Red method
(Cayman Chemicals) using LPC (lysophospholipase C activity)or SM (sphingomyelinase (SMase) activity) as substrate (17).LDL subfractions (100 �l at 0.3 g of protein/liter) were mixedwith 10 �l of substrate (LPC or SM at 5 mmol/liter in reactionbuffer containing ethanol 5% and Triton X-100 2%; final con-centration, 0.25 mmol/liter) and with the appropriate amountof Amplex Red, alkaline phosphatase, choline oxidase, peroxi-dase, and reaction buffer (100 mmol/liter Tris, 10 mmol/literMgCl2, pH 7.4), following the manufacturer’s instructions.Staphylococcus sp. SMase (100�l at 0, 0.1, 1, 10, 50, 100, and 200milliunits/ml, final concentration) was used as a standardcurve. Fluorescence production (� excitation, 530 nm; � emis-sion, 590 nm) was monitored for 3 h, and the results were cal-culated from the maximum curve slope.SMase activity was also determined by measuring the degra-
dation of fluorescently labeled SM (BODIPY-SM) and separa-tion of substrate (BODIPY-SM) and product (BODIPY-cera-mide) by TLC (17). Activity of LDL subfractions (0.3 g ofprotein/liter) was evaluated by incubation with BODIPY-FL-C12-SM at 0.025 mmol/liter, (Molecular Probes, Leiden, TheNetherlands) as substrate for 3 h at 37 °C in buffer 10 mmol/liter Tris, 10mmol/liter Cl2Mg, pH 7.4, and separation by TLC,as described (17). The TLC plate was developed with 1,2-dichloroethane/methanol/water (v/v/v 90:20:0.5) to sepa-rate BODIPY-ceramide from BODIPY-SM.
�-Chymotrypsin-induced Fusion of LDL Subfractions—LDLsubfractions at 1.33 g of protein/liter in PBS, containing 10�mol/liter EDTA, 1 �mol/liter BHT, and 1 �mol/liter sodiumazideweremixedwith�-chymotrypsin at 0.4 g/liter in the samebuffer to render a final concentration of 1.0 g of protein/liter of
LDL protein and 0.1 g/liter of protease, as previously described(26). Aggregation and fusion of LDL particles were analyzed byGGE, 1H NMR, and transmission electron microscopy (TEM),as follows.
1H NMR Spectroscopy of �-Chymotrypsin-treated Sub-fractions—Asealed coaxial insert (outer diameter, 1.7mm; sup-ported by a Teflon adapter) containing 10 mmol/liter 2,2-di-methyl-2-silapentane-5-sulfonic acid inH2Owas usedwith oneof the samples as an external reference for the 1Hchemical shift.This calibration was transferred to the other samples. 1H NMRspectrawere acquired every 30min for 48 h at 37 °C on a Bruker800 MHz spectrometer. A period of 25 min was necessary forsample insertion, experimental set-up, and thermal stabiliza-tion before the acquisition of the first NMR spectrum. For thisreason, the spectra at time 0 could not be acquired. The contentof choline-containing phospholipids (3.170–3.280 ppm) (27,28), ceramide (5.250–5.350 ppm) (28), and bisallylic com-pounds (2.650–5.850 ppm) (29) was measured by area integra-tion of the corresponding resonance signal.TEM of �-Chymotrypsin-treated Subfractions—LDL sub-
fractions treated with �-chymotrypsin for 0, 3, and 24 h wereabsorbed and processed for negative staining with 2% potas-sium phosphotungstate, pH 7.0, over carbon-coated grids (30).Micrographs were obtained using a Jeol 120-kV JEM-1400transmission electron microscope, with an ErlangshenES1000W CCD camera (Gatan, Abingdon, UK).Statistical Analysis—The results are expressed as the
means � SD. The SPSS 17 statistical package was used. Differ-ences between LDL subfractions were tested withWilcoxon’s ttest for paired data.
RESULTS
Separation of LDL Subfractions
Fig. 1 shows representative chromatograms performed toisolate, in a first step, LDL(�) and LDL(�) fractions by anionexchange chromatography (Fig. 1A) and, in a second step,aggregated (agLDL(�)) and nonaggregated (nagLDL(�)) sub-fractions by gel filtration chromatography (Fig. 1B). The totalLDL(�) proportion ranged from 3.5 to 7.0% (5.3 � 1.2%, n �15). Gel filtration chromatography showed that LDL(�) pre-sented a single peak corresponding to nonaggregated LDL,although traces of aggregated particles were detectable. In con-trast, LDL(�) had two well defined peaks of agLDL(�) andnagLDL(�) particles. In all of the plasma pools analyzed,agLDL(�) ranged from 5 to 20% of total LDL(�) (mean � S.D.14 � 8%, n � 15), measured by its cholesterol content. Thus,agLDL(�) represents�0.25–1% (mean� S.D. 0.74� 0.61%) oftotal LDL in human normolipemic plasma.The presence of aggregated and/or fused particles in
LDL(�) subfractions was confirmed by measuring theturbidity of samples and by performing GGE. Supplemen-tal Fig. 1S (panel A) shows the turbidity of LDL subfractionsmeasured at 450 nm, as an index of aggregation. TotalLDL(�) had a higher turbidity than LDL(�), whereasagLDL(�) presented higher turbidity than nagLDL(�).Supplemental Fig. 1S (panel B) shows a representative GGE
Aggregated LDL, Phospholipolysis, and Particle Fusion
OCTOBER 15, 2010 • VOLUME 285 • NUMBER 42 JOURNAL OF BIOLOGICAL CHEMISTRY 32427
by guest on April 5, 2019
http://ww
w.jbc.org/
Dow
nloaded from

of LDL(�) and LDL(�) fractions, where lipoproteins runaccording to their size.To demonstrate that aggregated LDL was not formed during
isolation, two strategies were used. First, a simplified protocolthat uses a smaller salt concentration and skips the anionexchange chromatography (see supplemental material fordetails) allowed the separation of a fraction with similar char-acteristics to agLDL(�) including high PLC-like activity(supplemental Fig. 2S). Second, LDL(�) isolated by the regular
method and depleted of aggregated particles by gel filtration(nagLDL(�)) was reisolated by ultracentrifugation (seesupplemental material for details). No evidence of aggregatedparticle formation was observed in reisolated nagLDL(�)(supplemental Fig. 3S). These observations indicate thatagLDL(�) is not an artifact of the isolation procedure and thatit is present in blood.
Lipid and Protein Composition
Differences betweenLDL(�) and total LDL(�) in the relativecontent of major components (Table 1) concurred with previ-ous data (21). The composition of LDL subfractions showeddramatic differences between agLDL(�) and nagLDL(�), withtotal LDL(�) presenting an intermediate composition betweenthe two subfractions. agLDL(�) had less cholesterol and phos-pholipid andmore triglyceride thannagLDL(�). These featuresare compatible with VLDL or IDL, the metabolic precursors ofLDL. Both lipoproteins have lower density, higher size, andhigher content of apoE and apoC-III than LDL. However, thecontent of total protein was similar in all LDL subfractions,indicating similar density (Table 1). To investigate the possibil-ity that VLDL or IDL could contaminate agLDL(�), we mea-sured the content of minor apolipoproteins. ApoC-III, apoE,apoA-I, and apoA-II were increased in LDL(�) subfractionscompared with LDL(�), in agreement with previous reports(21, 31). agLDL(�) had a lower content of apoE and apoC-IIIand higher content of apoA-I and apoA-II than nagLDL(�).The amount of apoE and apoC-III in agLDL(�) was muchlower than usually reported (32) in VLDL or IDL. Indeed,apoA-I and apoA-II also were increased in both LDL(�) sub-fractions, and their content was higher in agLDL(�) comparedwith nagLDL(�). Taken together, these data make it unlikelythat agLDL(�) could be remnant VLDL or IDL.
Oxidative Characteristics
We estimated the oxidative level of LDL subfractions bymeasuring the ratio of the PC peak areas at 234 nm (corre-sponding to conjugated diene) and 205 nm (corresponding tothe maximum of absorbance of PC) and by quantifying the�-tocopherol content. In contrast with in vitro oxidized LDL,which presented amuch lower 205/234 PC ratio and�-tocoph-erol content, no difference was observed among LDL subfrac-
FIGURE 1. Representative chromatograms of anion exchange (A) and gelfiltration (B) chromatography. A, 50 ml of total LDL were injected into aHiLoad Q-Sepharose 26/10 column using an AKTA-FPLC system and eluted at8 ml/min using a stepwise gradient method. After concentration of subfrac-tions, 2 ml of LDL(�) (dashed line) or LDL(�) (solid line) were injected in twoon-line connected Superose 6 columns in an AKTA-FPLC system and eluted at1 ml/min.
TABLE 1Composition of LDL subfractions (n � 9; except for apoE, apoC-III, apoA-I, and apoA-II, for which n � 4)
LDL(�) Total LDL(�) nagLDL(�) agLDL(�)
Major componentsaCholesterol (%) 42.5 � 1.9 41.4 � 2.2 42.2 � 2.0 38.3 � 3.3c,d,eTriglyceride (%) 6.5 � 1.0 10.0 � 2.5c 7.8 � 1.5c,d 15.0 � 3.8c,d,ePhospholipid (%) 29.6 � 1.2 27.4 � 1.9c 28.4 � 1.2 24.9 � 2.6c,d,eTotal protein (%) 21.4 � 1.8 21.2 � 2.1 21.6 � 1.7 21.8 � 1.8
Minor componentsbNEFA (mol/mol protein) 25.0 � 5.5 49.7 � 15,4c 43.9 � 13.4c 57.9 � 16.9c,d,eApoE (mmol/mol protein) 21.2 � 15.6 90.5 � 21.4 87.8 � 17.3 61.7 � 23.7ApoC-III (mmol/mol protein) 37.2 � 20.2 160.0 � 108.9 166.5 � 116.2 80.2 � 68.1ApoA-I (mmol/mol protein) 54.1 � 6.6 259.9 � 45.2 151.7 � 6.7 328.6 � 111.8ApoA-II (mmol/mol protein) 14.2 � 8.3 49.0 � 6.4 39.5 � 6.1 61.3 � 11.0
a Cholesterol, triglyceride, phospholipid, and protein are expressed as percentages of total mass.b NEFA, apoE, apoC-III, apoA-I, and apoA-II are expressed as mol/mol protein or as mmol/mol protein, considering the molecular mass of apoB (550 kDa).c p � 0.05 vs. LDL(�).dp � 0.05 vs. total LDL(�).e p � 0.05 vs. nagLDL(�).
Aggregated LDL, Phospholipolysis, and Particle Fusion
32428 JOURNAL OF BIOLOGICAL CHEMISTRY VOLUME 285 • NUMBER 42 • OCTOBER 15, 2010
by guest on April 5, 2019
http://ww
w.jbc.org/
Dow
nloaded from

tions (supplemental Table 1S). The evaluation of LDL suscep-tibility to CuSO4-induced oxidation showed that LDL(�) wasslightly more susceptible to oxidation than nagLDL(�),whereas agLDL(�) was much more resistant than LDL(�) andnagLDL(�). Representative conjugated diene kinetics is shownin supplemental Fig. 4S. The percentage of increase in lag phasetime is shown in supplemental Table 1S.
Phospholipolytic Activities
PAF-AH activity was increased in all LDL(�) subfractionscompared with LDL(�), but no difference was observedbetween agLDL(�) and nagLDL(�) subfractions (Fig. 2A). Incontrast, dramatic differences were observed in SMase andlysophospholipase C activities between agLDL(�) andnagLDL(�) (Fig. 2B). Both LDL(�) subfractions had higherPLC-like activities than LDL(�). However, agLDL(�) pre-sented an activity 4–6-fold higher than nagLDL(�). To con-firm differences among LDL subfractions in PLC-like activity,SMase activity was tested by evaluating the degradation ofexogenous SM labeled with the fluorescent probe BODIPY(BODIPY-SM); TLC was used to separate the product of thereaction (BODIPY-ceramide) from the substrate (BODIPY-SM). Fig. 2C shows the increased SMase activity in nagLDL(�)compared with LDL(�) and that of agLDL(�) compared withnagLDL(�). PLC-like activity in VLDL, IDL, and HDL, meas-ured by the Amplex Red method, was similar to LDL(�) (datanot shown).
Aggregation of Nonaggregated LDL Subfractions Inducedby agLDL(�)
agLDL(�) promoted the aggregation of LDL(�) andnagLDL(�) at 4 °C and 37 °C. The formation of agLDL(�) intotal LDL(�) and nagLDL(�) was determined by gel filtrationchromatography after 15 days of storage at 4 °C. The propor-tion of agLDL(�) increased progressively in total LDL(�) butnot in nagLDL(�) (Fig. 3A). In the experiments performed at37 °C, LDL(�) and nagLDL(�) (at 0.5 g/liter) were incubatedalone or with agLDL(�) (at 0.1 g/liter) up to 60 h, and aggrega-tion was monitored at 450 nm. LDL(�) and nagLDL(�) pro-gressively increased their absorbance when coincubated withagLDL(�) (Fig. 3C). At both 4 and 37 °C, evidence of increasedphospholipid degradation (decrease of PC and SM and increaseof diacylglycerol (DAG), NEFA, and ceramide spots in TLC)was observed in samples containing agLDL(�) (total LDL(�)stored at 4 °C for 15 days (Fig. 3B) and LDL(�) and nagLDL(�)incubated with agLDL(�) at 37 °C for 60 h (Fig. 3D)). The factthat DAGand ceramide are themain products generated by thePLC-like activity present in agLDL(�) supports the involve-ment of such activity in the degradation of phospholipids.
Susceptibility to Aggregation or Fusion Induced by Proteolysisof LDL Subfractions
This behavior is difficult to reproduce because the aggrega-tion of total LDL(�), LDL(�), and nagLDL(�) induced byagLDL(�) was highly variable. To standardize the experimentalconditions and accelerate the process, LDL subfractionswere pro-teolysed with �-chymotrypsin, one of the most commonly usedmethods to induce lipoprotein aggregation and fusion (20).
GGE—GGE showed that proteolytic degradation of apoB pro-moted the formation of aggregated and/or fused particles ofgreater size in both LDL(�) and nagLDL(�) (Fig. 4A). agLDL(�)
FIGURE 2. Phospholipolytic activities associated to LDL subfractions.A, PAF-AH activity was measured by monitoring the degradation of 2-thio-PAF. The data are the means � S.D. of four independent experiments. *, p �0.064 versus LDL(�). B, PLC-like activities were measured by the Amplex Redmethod that quantifies the formation of choline, using SM (SMase activity) orLPC (lysophospholipase C (LysoPLC) activity) as a substrate. The data are themeans � S.D. of five independent experiments. *, p � 0.05 versus LDL(�); $,p � 0.05 versus LDL(�); #, p � 0.05 versus nagLDL(�). C, representative TLC ofLDL subfractions after incubation with BODIPY-SM. Fluorescence of BODIPYwas detected in a Chemi-Doc densitometer. BODIPY-SM stands at the bottomof the plate, whereas BODIPY-ceramide runs to the top of the plate.
Aggregated LDL, Phospholipolysis, and Particle Fusion
OCTOBER 15, 2010 • VOLUME 285 • NUMBER 42 JOURNAL OF BIOLOGICAL CHEMISTRY 32429
by guest on April 5, 2019
http://ww
w.jbc.org/
Dow
nloaded from
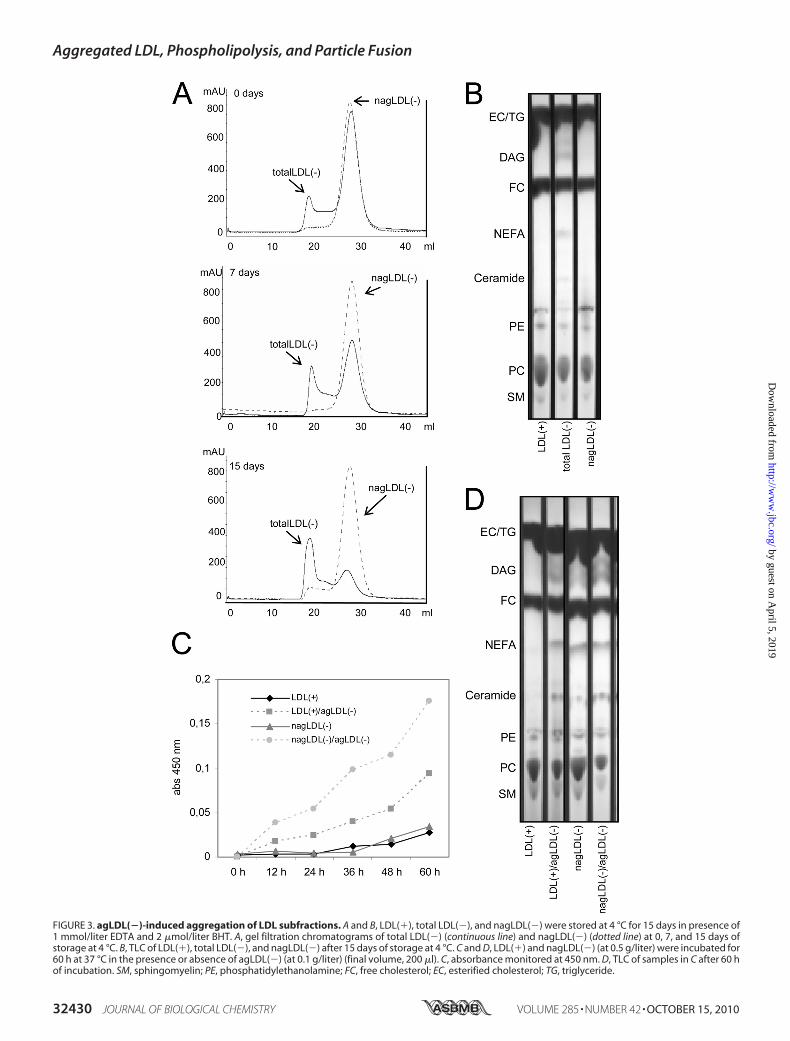
FIGURE 3. agLDL(�)-induced aggregation of LDL subfractions. A and B, LDL(�), total LDL(�), and nagLDL(�) were stored at 4 °C for 15 days in presence of1 mmol/liter EDTA and 2 �mol/liter BHT. A, gel filtration chromatograms of total LDL(�) (continuous line) and nagLDL(�) (dotted line) at 0, 7, and 15 days ofstorage at 4 °C. B, TLC of LDL(�), total LDL(�), and nagLDL(�) after 15 days of storage at 4 °C. C and D, LDL(�) and nagLDL(�) (at 0.5 g/liter) were incubated for60 h at 37 °C in the presence or absence of agLDL(�) (at 0.1 g/liter) (final volume, 200 �l). C, absorbance monitored at 450 nm. D, TLC of samples in C after 60 hof incubation. SM, sphingomyelin; PE, phosphatidylethanolamine; FC, free cholesterol; EC, esterified cholesterol; TG, triglyceride.
Aggregated LDL, Phospholipolysis, and Particle Fusion
32430 JOURNAL OF BIOLOGICAL CHEMISTRY VOLUME 285 • NUMBER 42 • OCTOBER 15, 2010
by guest on April 5, 2019
http://ww
w.jbc.org/
Dow
nloaded from

bands corresponding to aggregated/fused particles decreased insize at 3 h of �-chymotrypsin and almost disappeared at 24 h.TEM—GGE does not discriminate between aggregated or
fused particles. This difference is relevant because aggregationis a reversible process, whereas fusion is irreversible (20).Hence, to study whether LDL subfractions were fused or aggre-gated after proteolytic treatment, TEManalysis was performed.Fig. 4B shows TEM micrographs of LDL subfractions at 0(native samples), 3, and 24 h of �-chymotrypsin treatment. Theparticle size distribution is shown in supplemental Fig. 5S. At0 h, LDL(�) and nagLDL(�) presentedmainlymonomeric par-ticles, whereas agLDL(�) had evidence of aggregates, and somefused particles (30 nm) were detected. At 3 h of proteolysis,fusion of particles was evident in all LDL subfractions, althoughthis process was more intense in both LDL(�) subfractionsthan in LDL(�). Indeed, small 5–10-nm particles wereobserved in agLDL(�). After 24 h of proteolysis, LDL(�) andnagLDL(�) presented numerous fused particles and also small5–10-nm particles. These small 5–10-nm particles were theonly structures observed in agLDL(�) at 24 h. The appearanceof particles smaller than 5–10 nm suggests LDLdecomposition.NMR—1HNMR has been used to evaluate the fusion of LDL
particles by measuring the chemical shifts of fatty acid-CH3resonances (33). Resonance shifting to larger ppm values indi-cates an increase in particle size. Fig. 5 shows 1H NMR spectraof LDL subfractions proteolysed with �-chymotrypsin from 30min up to 24 h. At 30 min, LDL(�) and nagLDL(�) showed aresonance at 0.839 ppm, with a similar signal shape (Fig. 5, Aand B). After 24 h of proteolysis, the resonance of LDL(�) and
nagLDL(�) shifted up to 0.856 ppm.The only difference was slightlyslower kinetics for the LDL(�) sub-fraction than for the nagLDL(�)(Fig. 5, A and B). In contrast, thebehavior of agLDL(�) was dramati-cally different (Fig. 5C). The spec-trum of agLDL(�) was alreadyshifted up to 0.845 ppm at 30 min,and further shifts were progres-sively observed, reaching 0.861 ppmat 24 h. Thus, because agLDL(�) isaggregated at time 0 (as shown withGGE and TEM), what we observedat 30 min in the NMR spectra wasthe rapid fusion of the particles.These results are consistent withTEM data showing that agLDL(�)has a higher susceptibility to fusionthan LDL(�) and nagLDL(�). Thespectra of the three subfractionsremained almost unchanged after24 h (monitored for a total time of48 h; data not shown), except for thesignal of the fatty acid-CH3 inagLDL(�), which increased in in-tensity, probably because of particledecomposition, as was observed byTEM.
1HNMRspectra also provides information ondegradation ofphospholipids by monitoring the intensity of the resonancesignals corresponding to choline-containing phospholipids(3.170–3.280 ppm) and ceramide (5.250–5.350 ppm) (28). Inaddition, the progression of oxidation can be detected by mon-itoring the decrease of the signal corresponding to bisallylicgroups of fatty acids (CH-CH2-CH, 2.650–2.850 ppm) (27).These results are explained in detail in supplementalFigs. 6S–8S.Changes in phospholipid composition induced by proteoly-
sis, calculated from the corresponding NMR signal intensity,are summarized in Fig. 6. The phospholipid content of LDL(�)remained relatively constant, and the initial increase of PC anddecrease of SM could be better explained by fusion-inducedmicroenvironment changes than by degradation (26).nagLDL(�) presented low levels of degradation of SM and PCsimultaneously with the appearance of free choline (NMR sig-nal observed after 8 h of proteolysis). In contrast, agLDL(�)initially suffered a massive and rapid degradation of PC, SM,and LPC. Signals corresponding to SM and LPC disappeared at8 h of proteolysis. This promoted an immediate increase ofphosphorylcholine, an increase of ceramide after 3 h, and anincrease of free choline after 4 h.Phospholipid Degradation Quantified by HPLC—Analysis of
phospholipid signals monitored by NMR is a first approach toquantitative changes promoted by proteolysis. However, theintensity and position of these signals can be modified bychanges in the phospholipid environment (26). To confirm thechanges in phospholipid composition during proteolysis, PC,
FIGURE 4. Effect of �-chymotrypsin treatment on the formation of aggregated or fused particles in LDLsubfractions. A, GGE. Five �g of LDL (expressed as total protein) were run in each lane for 8 h at 100 V. LDLswere prestained with Sudan Black (lipid staining). B, electron micrographs of LDL subfractions. LDL(�) (panelsA–C), nagLDL(�) (panels D–F), and agLDL(�) (panels G–I) subfractions were proteolysed by incubation with�-chymotrypsin (�CT) for 0 (panels A, D, and G), 3 (panels B, E, and H), and 24 h (panels C, F, and I). Transmissionelectron microscopy was performed in a JEM-1400 microscope, using 2% potassium phosphotungstate, pH7.0, for negative staining. Bars, 200 nm.
Aggregated LDL, Phospholipolysis, and Particle Fusion
OCTOBER 15, 2010 • VOLUME 285 • NUMBER 42 JOURNAL OF BIOLOGICAL CHEMISTRY 32431
by guest on April 5, 2019
http://ww
w.jbc.org/
Dow
nloaded from

SM, and LPC levels were alsomeasured by normal phaseHPLC.HPLC analysis (Fig. 7A) was consistent with NMR data. Phos-pholipids in agLDL(�) were much more labile to degradationthan those in LDL(�) and nagLDL(�). LPC was only detectedin nagLDL(�) and agLDL(�) and only at 3 h of proteolysis.Weinvestigated the possibility that lipoperoxidative processescould occur during proteolysis by measuring the 205/234 ratioof the PC peak (indicative of the formation of conjugateddienes) and by quantifying the �-tocopherol content. No evi-
dence of extensive oxidation was observed because the �-to-copherol content and the ratio 205/234 nmof the PC peakwerenot modified during proteolysis in the analyzed subfractions(Fig. 7, B and C). The ratio 205/234 could not be calculated inagLDL(�) at 24 h because the area of the PCpeak at 234 nmwastoo low and could not be reliably integrated.Changes in Major Lipids during Proteolysis—Changes in
major lipidsweremeasured by commercialmethods in an auto-analyzer (Fig. 8A). Regarding neutral lipids, cholesterol andtriglyceride were not degraded during proteolysis. The triglyc-eride content appeared to increase, but this measurement waserroneous because the commercial enzymatic method mea-sures glycerol after the degradation of acylglycerols by triglyc-eride lipase. This increase was thus the consequence of DAGand/or monoacylglycerol (MAG) generated from the degrada-tion of PC and LPC, respectively. This can be deduced from theobservation that phospholipids decreased at the same rate asthe sum of DAG/MAG � triglyceride � glycerol increased.Hence, the sum of DAG/MAG � phospholipids � glycerolafter proteolysis was similar to that of initial phospholipids.TLC supported data obtained by NMR, HPLC, and autoana-
lyzer (Fig. 8B). Briefly, massive degradation of phospholipidswas observed in agLDL(�) after 24 h of proteolysis, and as aconsequence, bands corresponding to ceramide, MAG, NEFA,and DAG, which were apparent at 0 and 3 h of proteolysis,increased their intensity at 24 h. nagLDL(�) also presentedlight bands of ceramide, DAG, MAG, and NEFA after 24 h ofproteolysis.
DISCUSSION
The ability of LDL(�) to modulate the expression of mole-cules involved in inflammation (11, 12, 21), apoptosis (13), orangiogenesis (14) in endothelial cells and monocytes suggests astrong atherogenic role. However, there is some controversyregarding several properties of LDL(�), and a detailed knowl-edge of its physicochemical characteristics remains elusive.These discrepancies could be due to the fact that several inde-pendent mechanisms, such as oxidation (34), nonenzymaticglycosylation (9), hemoglobin derivatization (35), phospho-lipase A2 degradation (15, 23), or NEFA loading (36), could beinvolved in its generation. These observations strongly suggestthat LDL(�) is a heterogeneous group of distinctmodified LDLparticles that share increased electronegativity as a commonfeature. Based on this assumption, the current study focused onthe aggregated subfraction of LDL(�).We observed that PLC-like activity differed in the three LDL
subfractions. This activity, which degrades with increasing effi-ciency, PC � SM � LPC (17), was absent in LDL(�) and 5-foldhigher in agLDL(�) than in nagLDL(�). The origin of suchphospholipolytic activity is unknown. Studies using proteomicapproaches have reported the presence of more than 20 minorproteins in total LDL (37, 38), but none of these proteins have aknownPLC activity. The only proteins in LDLwith awell estab-lished phospholipolytic activity are PAF-AH and lecithin:cho-lesterol acyl transferase. However, we have previously demon-strated that SM and LPC are not hydrolyzed by purifiedPAF-AH (17). Rather, LPC is the product of the reactiondegrading PAF-like phospholipids. Indeed, no difference was
FIGURE 5. Overlay of the regions with the fatty acid-CH3 resonances in 1HNMR spectra of LDL at different times of particle fusion induced by�-chymotrypsin proteolysis. A, LDL(�). B, nagLDL(�). C, agLDL(�). LDLswere mixed with �-chymotrypsin inside the NMR tube, and spectra wererecorded at 37 °C at intervals of 30 min. The spectra shown correspond to 0.5,1, 1.5, 2, 2.5, 3, 4, 6, 8, 12, 16, 20, and 24 h after �-chymotrypsin addition.
Aggregated LDL, Phospholipolysis, and Particle Fusion
32432 JOURNAL OF BIOLOGICAL CHEMISTRY VOLUME 285 • NUMBER 42 • OCTOBER 15, 2010
by guest on April 5, 2019
http://ww
w.jbc.org/
Dow
nloaded from

observed between the two LDL(�)subfractions in PAF-AH activity.Regarding lecithin:cholesterol acyltransferase, this activity is notincreased in LDL(�) versus LDL(�)(25). Indeed, 5,5�-dithiobis(2-nitro-benzoic) acid, a known inhibitor oflecithin:cholesterol acyl transfer-ase, had no effect on LDL(�) PLC-like activity (data not shown). Ithas been suggested that PLC-likeactivity of LDL(�) could arisefrom conformation differencesof apoB between LDL(�) andLDL(�) (17, 39).The most striking property ob-
served in agLDL(�) in this studywas its ability to promote theaggregation of nonaggregated LDLsubfractions. This process wasparalleled by phospholipid degra-dation. These results concur withprevious studies reporting that inthe absence of physical or chemi-cal stimuli, total LDL(�) aggre-gates to form amyloid-like fibrils
FIGURE 6. Changes in phospholipid composition during �-chymotrypsin proteolysis of LDL particles quantified from NMR data. A, LDL(�).B, nagLDL(�). C, agLDL(�) (PC, SM, and LPC). D, agLDL(�) (phosphorylcholine (P-choline), free choline, and ceramide). LDLs were proteolysed by �-chymo-trypsin up to 24 h. The 1H NMR spectra were acquired at 37 °C on a Bruker 800 MHz spectrometer. The concentration was calculated by integration of the areaof the corresponding signals.
FIGURE 7. HPLC analysis of LDL subfractions during �-chymotrypsin proteolysis. A, PC, SM, and LPCcontent in LDL subfractions measured by normal phase HPLC. B, ratio 205/234 nm of the PC peak. ND, notdetermined. C, �-tocopherol content in LDL subfractions measured by reverse phase HPLC. LDLs wereproteolyzed by �-chymotrypsin up to 24 h. The data are the means � S.D. of three independentexperiments.
Aggregated LDL, Phospholipolysis, and Particle Fusion
OCTOBER 15, 2010 • VOLUME 285 • NUMBER 42 JOURNAL OF BIOLOGICAL CHEMISTRY 32433
by guest on April 5, 2019
http://ww
w.jbc.org/
Dow
nloaded from

in a period of one to several days and that it can promote thespontaneous aggregation of native LDL (18). Our results sug-gest that amyloidogenesis promoted by LDL(�) could bespecifically due to agLDL(�) in a process involving PLC-likeactivity.In addition to its aggregation induction ability, agLDL(�)
showedhigh lability to protease digestion, leading first to fusionand later to particle degradation. �-Chymotrypsin proteolysisis known to promote LDL fusion and destabilize particle integ-rity in advanced stages (20). However, we found that this pro-cess was much faster in agLDL(�) than in LDL(�) ornagLDL(�) because of the accelerated degradation of phospho-lipids during the early phases of proteolysis, mainly SM andLPC. In this context, it is well established that SM degradationby SMase also promotes lipoprotein fusion (40). The exactmechanism by which proteolysis of apoB leads to phospholipiddegradation is unknown; however, the observation that SM andLPC are rapid and almost totally degraded suggests the involve-ment of the PLC-like activity associated to LDL(�), at least in
the early phases of the process. This concurs with the observa-tion that products of such activity, such as phosphorylcholine,MAG, DAG, and ceramide, increased throughout the proteo-lytic digestion. Interestingly, cholesterol and triglyceride con-tent remained unchanged during proteolysis, indicating thatthis process had a strong effect on the molecules present onthe surface of the lipoprotein but little effect on the corecomponents.It could be argued that extensive lipoperoxidation could pro-
mote the changes observed in agLDL(�) after proteolysis,because oxidation induces aggregation and fusion of lipopro-teins. The appearance of LPC in nagLDL(�) and agLDL(�) at3 h of proteolysis is likely a consequence of PAF-AH activity,which is high in both LDL(�) subfractions. Because PAF-AHdoes not degrade intact PC but oxidation-fractionated PC (41),the increase of LPC could indicate mild oxidation. However,other observations rule out a major role for extensive oxidativeprocesses in the high lability to proteolysis of agLDL(�). First,proteolysis was performed in presence of EDTA and BHT,which respectively act as metal and free radical chelants. More-over, the relation between aggregation and oxidation is notreciprocal, because although oxidation promotes aggregation,the current study and previous (42) reports show that aggre-gated lipoproteins are more resistant to oxidation. In addition,although PC is a much better substrate for lipoperoxidationthan SM, we observed that SM was degraded faster than PC inagLDL(�). In addition,�-tocopherol was not consumed duringproteolysis, as occurs with oxidized LDL, and finally, the ratio205/234 nm of the PC peak decreased only slightly in all of theLDL subfractions during proteolysis. Taken together, theseresults indicate that although minor oxidation cannot be ruledout to occur in all subfractions, its specific involvement in themassive degradation of phospholipids in agLDL(�) is unlikely.It is well known that several proteases are up-regulated in the
atherosclerotic lesion (2). Thus, degradation of the apoB pro-tein in agLDL(�) would trigger its fusion and subsequently pro-mote LDL retention. In agreement with this observation, ourgroup previously reported that the subfraction of LDL(�) withthe highest affinity to proteoglycans also had the highest aggre-gation level (19). A very recent report has shown that proteol-ysis sensitizes LDL particles to phospholipolysis mediated byphospholipases (43). Our data indicate that phospholipid deg-radation and subsequent fusion of agLDL(�) after proteolysisoccurs in the absence of external phospholipases. The fact thatLDL(�) has amyloidogenic properties caused by �-helix to�-sheet transition in the secondary structure of apoB (18)would also contribute to lipoprotein aggregation and subse-quent cholesterol accumulation. Taken together, these obser-vations suggest a picture in which circulating agLDL(�), aggre-gated but not fused, could enter the arterial wall, and once inthis microenvironment, it could fuse itself and trigger thefusion of nonaggregated LDL, favoring the binding of LDL toproteoglycans and, subsequently, promoting subendothelialcholesterol accumulation and atherosclerosis progression.
Acknowledgments—We thank Carolyn Newey for editorial assistanceand Sara Gonzalez for technical assistance.
FIGURE 8. Changes in major lipids during proteolysis. A, total cholesterol,triglyceride (TG), total phospholipids (PL), glycerol, and NEFA were quan-tified by commercial methods in an autoanalyzer. DAG and MAG wereestimated from the difference between the initial content of triglycerideand the concentration obtained at every time point. The data are themeans of three independent experiments. B, representative TLC of lipidsfrom LDL subfractions. EC, esterified cholesterol; FC, free cholesterol; PE,phosphatidylethanolamine.
Aggregated LDL, Phospholipolysis, and Particle Fusion
32434 JOURNAL OF BIOLOGICAL CHEMISTRY VOLUME 285 • NUMBER 42 • OCTOBER 15, 2010
by guest on April 5, 2019
http://ww
w.jbc.org/
Dow
nloaded from
REFERENCES1. Camejo, G., Hurt-Camejo, E., Wiklund, O., and Bondjers, G. (1998) Ath-
erosclerosis 139, 205–2222. Ross, R. (1999) N. Engl. J. Med. 340, 115–1263. Navab,M., Berliner, J. A.,Watson, A. D., Hama, S. Y., Territo,M. C., Lusis,
A. J., Shih, D.M., Van Lenten, B. J., Frank, J. S., Demer, L. L., Edwards, P. A.,and Fogelman, A.M. (1996)Arterioscler. Thromb. Vasc. Biol. 16, 831–842
4. Bhakdi, S., Lackner, K. J., Han, S. R., Torzewski, M., and Husmann, M.(2004) Thromb. Haemost. 91, 639–645
5. Williams, K. J., and Tabas, I. (1998) Curr. Opin. Lipidol. 9, 471–4746. Sanchez-Quesada, J. L., Benítez, S., and Ordonez-Llanos, J. (2004) Curr.
Opin. Lipidol. 15, 329–3357. Benítez, S., Ordonez-Llanos, J., Franco, M., Marín, C., Paz, E., Lopez-
Miranda, J., Otal, C., Perez-Jimenez, F., and Sanchez-Quesada, J. L. (2004)Am. J. Cardiol. 93, 414–420
8. Sanchez-Quesada, J. L., Benítez, S., Otal, C., Franco, M., Blanco-Vaca, F.,and Ordonez-Llanos, J. (2002) J. Lipid. Res. 43, 699–705
9. Sanchez-Quesada, J. L., Perez, A., Caixas, A., Rigla, M., Payes, A., Benítez,S., and Ordonez-Llanos, J. (2001) J. Clin. Endocrinol. Metab. 86,3243–3249
10. Ziouzenkova, O., and Sevanian, A. (2000) Blood Purif. 18, 169–17611. Benítez, S., Camacho,M., Bancells, C., Vila, L., Sanchez-Quesada, J. L., and
Ordonez-Llanos, J. (2006) Biochim. Biophys. Acta 1761, 1014–102112. Benítez, S., Bancells, C., Ordonez-Llanos, J., and Sanchez-Quesada, J. L.
(2007) Biochim. Biophys. Acta 1771, 613–62213. Chen, H. H., Hosken, B. D., Huang, M., Gaubatz, J. W., Myers, C. L.,
Macfarlane, R. D., Pownall, H. J., and Yang, C. Y. (2007) J. Lipid Res. 48,177–184
14. Tai, M. H., Kuo, S. M., Liang, H. T., Chiou, K. R., Lam, H. C., Hsu, C. M.,Pownall, H. J., Chen, H. H., Huang, M. T., and Yang, C. Y. (2006) Athero-sclerosis 186, 448–457
15. Asatryan, L., Hamilton, R. T., Isas, J. M., Hwang, J., Kayed, R., andSevanian, A. (2005) J. Lipid Res. 46, 115–122
16. Benítez, S., Villegas, V., Bancells, C., Jorba, O., Gonzalez-Sastre, F., Or-donez-Llanos, J., and Sanchez-Quesada, J. L. (2004) Biochemistry 43,15863–15872
17. Bancells, C., Benítez, S., Villegas, S., Jorba, O., Ordonez-Llanos, J., andSanchez-Quesada, J. L. (2008) Biochemistry 47, 8186–8194
18. Parasassi, T., De Spirito, M., Mei, G., Brunelli, R., Greco, G., Lenzi, L.,Maulucci, G., Nicolai, E., Papi, M., Arcovito, G., Tosatto, S. C., and Ursini,F. (2008) FASEB J. 22, 2350–2356
19. Bancells, C., Benítez, S., Jauhiainen, M., Ordonez-Llanos, J., Kovanen,P. T., Villegas, S., Sanchez-Quesada, J. L., andOorni, K. (2009) J. Lipid Res.50, 446–455
20. Oorni, K., Pentikainen, M. O., Ala-Korpela, M., and Kovanen, P. T. (2000)J. Lipid Res. 41, 1703–1714
21. Sanchez-Quesada, J. L., Camacho, M., Anton, R., Benítez, S., Vila, L., andOrdonez-Llanos, J. (2003) Atherosclerosis 166, 261–270
22. De Castellarnau, C., Sanchez-Quesada, J. L., Benítez, S., Rosa, R., Caveda,
L., Vila, L., andOrdonez-Llanos, J. (2000)Arterioscler. Thromb. Vasc. Biol.20, 2281–2287
23. Benítez, S., Camacho, M., Arcelus, R., Vila, L., Bancells, C., Ordonez-Llanos, J., and Sanchez-Quesada, J. L. (2004)Atherosclerosis 177, 299–305
24. Sanchez-Quesada, J. L., Ortega, H., Payes-Romero, A., Serrat-Serrat, J.,Gonzalez-Sastre, F., Lasuncion,M. A., andOrdonez-Llanos, J. (1997)Ath-erosclerosis 132, 207–213
25. Benítez, S., Sanchez-Quesada, J. L., Ribas, V., Jorba, O., Blanco-Vaca, F.,Gonzalez-Sastre, F., and Ordonez-Llanos, J. (2003) Circulation 108,92–96
26. Pentikainen, M. O., Hyvonen, M. T., Oorni, K., Hevonoja, T., Korhonen,A., Lehtonen-Smeds, E. M., Ala-Korpela, M., and Kovanen, P. T. (2001) J.Lipid Res. 42, 916–922
27. Soininen, P., Oorni, K., Maaheimo, H., Laatikainen, R., Kovanen, P. T.,Kaski, K., and Ala-Korpela, M. (2007) Biochem. Biophys. Res. Commun.360, 290–294
28. Duarte, I. F., Marques, J., Ladeirinha, A. F., Rocha, C., Lamego, I., Calhei-ros, R., Silva, T. M., Marques, M. P., Melo, J. B., Carreira, I. M., and Gil,A. M. (2009) Anal Chem 81, 5023–5032
29. Lodge, J. K., Sadler, P. J., Kus, M. L., and Winyard, P. G. (1995) Biochim.Biophys. Acta 1256, 130–140
30. Forte, T., and Nichols, A. V. (1972) Adv. Lipid Res. 10, 1–4131. Gaubatz, J. W., Gillard, B. K., Massey, J. B., Hoogeveen, R. C., Huang, M.,
Lloyd, E. E., Raya, J. L., Yang, C. Y., and Pownall, H. J. (2007) J. Lipid Res. 48,348–357
32. Campos, H., Perlov, D., Khoo, C., and Sacks, F. M. (2001) J. Lipid Res. 42,1239–1249
33. Ala-Korpela,M., Pentikainen,M.O., Korhonen, A., Hevonoja, T., Lounila,J., and Kovanen, P. T. (1998) J. Lipid Res. 39, 1705–1712
34. Sevanian, A., Bittolo-Bon, G., Cazzolato, G., Hodis, H., Hwang, J., Zam-burlini, A., Maiorino, M., and Ursini, F. (1997) J. Lipid Res. 38, 419–428
35. Ziouzenkova, O., Asatryan, L., Akmal, M., Tetta, C., Wratten, M. L.,Loseto-Wich, G., Jurgens, G., Heinecke, J., and Sevanian, A. (1999) J. Biol.Chem. 274, 18916–18924
36. Ursini, F., and Sevanian, A. (2002) Biol. Chem. 383, 599–60537. Banfi, C., Brioschi, M., Barcella, S., Wait, R., Begum, S., Galli, S., Rizzi, A.,
and Tremoli, E. (2009) Proteomics 9, 1344–135238. Karlsson, H., Leanderson, P., Tagesson, C., and Lindahl, M. (2005) Pro-
teomics 5, 551–56539. Parasassi, T., Bittolo-Bon, G., Brunelli, R., Cazzolato, G., Krasnowska,
E. K., Mei, G., Sevanian, A., and Ursini, F. (2001) Free Radic. Biol. Med. 31,82–89
40. Oorni, K., Hakala, J. K., Annila, A., Ala-Korpela, M., and Kovanen, P. T.(1998) J. Biol. Chem. 273, 29127–29134
41. Stafforini, D. M. (2009) Cardiovasc. Drugs Ther. 23, 73–8342. Hermann, M., and Gmeiner, B. (1992) Arterioscler. Thromb. 12,
1503–150643. Plihtari, R., Hurt-Camejo, E., Oorni, K., and Kovanen, P. T. (2010) J. Lipid
Res. 51, 1801–1809
Aggregated LDL, Phospholipolysis, and Particle Fusion
OCTOBER 15, 2010 • VOLUME 285 • NUMBER 42 JOURNAL OF BIOLOGICAL CHEMISTRY 32435
by guest on April 5, 2019
http://ww
w.jbc.org/
Dow
nloaded from

Sánchez-QuesadaLorea Beloki, Montserrat Pérez-Cuellar, Jordi Ordóñez-Llanos and José Luis
Cristina Bancells, Sandra Villegas, Francisco J. Blanco, Sonia Benítez, Isaac Gállego,High Tendency toward Phospholipolysis and Particle Fusion
Aggregated Electronegative Low Density Lipoprotein in Human Plasma Shows a
doi: 10.1074/jbc.M110.139691 originally published online July 29, 20102010, 285:32425-32435.J. Biol. Chem.
10.1074/jbc.M110.139691Access the most updated version of this article at doi:
Alerts:
When a correction for this article is posted•
When this article is cited•
to choose from all of JBC's e-mail alertsClick here
Supplemental material:
http://www.jbc.org/content/suppl/2010/07/29/M110.139691.DC1
http://www.jbc.org/content/285/42/32425.full.html#ref-list-1
This article cites 43 references, 17 of which can be accessed free at
by guest on April 5, 2019
http://ww
w.jbc.org/
Dow
nloaded from