aggregating subjective & objective measures of web search
TRANSCRIPT

Aggregating Subjective & Objective Measures of Web Search Quality using Modified Shimura Technique
Rashid Ali
Department of Computer Engineering A. M. U. Aligarh
UP - 202002 India
M. M. Sufyan Beg Department of Computer Science University of California, Berkeley
CA 94720 USA
Abstract – Web Searching is perhaps the second most popular activity on Internet. Millions of users search the web daily for their purpose. But as there are a number of search engines available, there must be some procedure to evaluate them. In this paper, we try to present an effort in this regard. We are making an attempt to get a comprehensive evaluation system for web search results. We are taking into the consideration the “satisfaction “ a user gets when presented with search results The feedback of the user is inferred from watching the actions of the user on the search results presented before him in response to his query, rather than by form filling method. This gives an implicit ranking of documents by the user. Then, classical vector space model for information retrieval is used for computing the similarity of documents selected by the user to that of query. The documents from the search results presented in response to a query are represented by term vectors in vector space. The query is also represented by a term vector. The similarity of a document with the query is thus obtained by computing the dot (scalar) product. Sorting the documents in decreasing order of dot products of their term vectors with that of query, gives a new ranking of the documents on the basis of vector space model. Then, Boolean similarity measure is used to compute the similarity of the documents selected by the user to that of the query and thus another ranking of the documents based on the similarity measure is obtained. We propose a simplified version of a well known Boolean similarity measure and use it for our purpose. All the three rankings obtained in the process is then aggregated using Modified Shimura technique of Rank aggregation. The aggregated ranking is then compared with the original ranking given by the search engine. The correlation coefficient thus obtained is averaged for a set of queries. We show our experimental results pertaining to seven public search engines and fifteen queries. Keywords – web search evaluation, user feedback, vector space model, boolean similarity measure, rank aggregation 1. INTRODUCTION Internet has been very popular since its inception. Everyday, a number of Internet users search the web for some data and information using some query. A number of public search engines are available for this purpose. In an Internet search, the user writes some query to describe the nature of documents, and the search engine responds by returning a number of web pages that match the description. The results are ranked by the search engines and returned in the order of ranks. Since different search engines use different search algorithms and indexing techniques, they return different web pages in response to same query. Also, same web pages is ranked differently by
Proceedings of the 4th WSEAS Int. Conf. on Information Security, Communications and Computers, Tenerife, Spain, December 16-18, 2005 (pp429-452)

different search engines and returned at different positions in the list of search results. Then the question arises, which search engine one should use for web searching? A better search engine is one, which gives relevance results in response to a query and also returns them in proper order of relevance. For this, search results need to be evaluated
The evaluation procedure may be subjective or objective. In the present work, we propose a comprehensive web search evaluation system, which combines both the subjective as well as objective techniques. For subjective evaluation, the users' vote is to be counted. For objective evaluation, different similarity measures based approaches such as Boolean similarity measures based; vector space model based approaches are used.
How are the users rating the results of a search engine should be taken into account to evaluate that search engine subjectively. Thus, it becomes imperative to obtain the feedback from the users. This feedback may either be explicit or implicit. The explicit feedback is the one in which the user is asked to fill up a feedback form after he has finished searching. This form is easy to analyze as the user may be asked directly to rank the documents as per the relevance according to his evaluation. But the problem is to obtain a correct feedback. The problem with the form-based approach is that it is too demanding from the user. In this approach, there is a lot of work for a casual user who might either fill it carelessly or not fill it at all. We, therefore, felt a need to devise a method to obtain the implicit feedback from the users. We watch the actions of the user on the search results presented before him in response to his query, and infer the feedback of the user there from.
We augment the subjective evaluation technique based on implicit user feedback as mentioned in the preceding paragraph with objective evaluation based on Vector Space Model and Boolean similarity measures. For that, we need to do the text processing first, which includes removal of stop words and stemming operations.
1.1 Related Work In the past, some efforts have been made to evaluate search results from different search engines. In most of the cases, a uniform sample of the web pages is collected by carrying out random walks on the web. The size of indices, which indirectly estimates the performance of a search engine, is then measured using this uniform sample. A search engine having larger index size has higher probability to give good search results. In [1], [2] and [3], some attempts involving this is easily visible. In [4] also, the relative size and overlap of search engines is found but by using random queries, which are generated from a lexicon of about 400,000 words, built from a broad crawl of roughly 300,000 documents in the Yahoo hierarchy. In [5] and [6], the search engines are compared using a standard query log like that of NEC research institute. In [7], a frozen 18.5 million page snapshots of part of the web is created for proper evaluation of web search systems. In [8], for two different sets of ad-hoc queries, the results from AltaVista, Google and InfoSeek are obtained. These results are automatically evaluated for relevance on the basis of vector space model. These results are found to agree with the manual evaluation of relevance based on precision. Precision scores are given as 0, 1 or 2. But then this precision evaluation is similar to the form-filling exercise, already discussed for its demerits in section 1. Precision evaluation of search engines is reported in [9]. But then, "precision" being just the ratio of retrieved documents that are judged relevant, it doesn't say anything about the ranking of the relevant documents in the search results. Upon just the precision evaluation, other important aspects of web search evaluation such as recall, coverage, response time and web coverage etc. are also missed out.
Proceedings of the 4th WSEAS Int. Conf. on Information Security, Communications and Computers, Tenerife, Spain, December 16-18, 2005 (pp429-452)

With the present effort of combining the subjective and objective techniques of web search evaluation, we aspire to get a complete and comprehensive picture of web search evaluation. 1.2 Useful Definitions Here we have some definitions that are useful while evaluating search results. Definition 1. Given a universe U and S ⊆ U, an ordered list (or simply, a list) l with respect to U is given as l = [e1,e2,…..,e|s|], with each ei ∈ S, and e1 f e2 f….fe|s\, where “f” is some ordering relation on S. Also, for j ∈ U Λ j ∈ l , let l(j) denote the position or rank of j, with a higher rank having a lower numbered position in the list. We may assign a unique identifier to each element in U and thus, without loss of generality we may get U = {1,2 ,….,|U|}. Definition 2. Full List: If a list contains all the elements in U, then it is said to be a full list. Example 1. A full list lf given as [e,a,d,c,b] has the ordering relation e f a f d f c fb. The Universe U may be taken as {1,2,3,4,5} with say a ≡ 1, b ≡ 2, c ≡ 3, d ≡ 4, e ≡ 5. With such an assumption, we have lf = [5,1,4,3,2]. Here lf (5) ≡ l(e) = 1, lf (1) ≡ l(a) = 2, lf (4) ≡ lf (d) =3, lf (3) ≡ lf (c) = 4, lf (2) ≡ lf (b) = 5. Definition 3. Kendall Tau distance: The Kendall Tau distance between two full lists l1 and l2, each of cardinality |l|, is given as follows.
K (l1, l2)= ( )
)1()2/1()()(),()(,{ 2211
−
><∀
lljliljlilji
Definition 4. Spearman footrule distance: The Spearman footrule distance (SFD) between two full lists l1 and l2, eachof cardinality |l|, is given as follows.
F (l1, l2)= ( ) ⎥⎦
⎥⎢⎣⎢
∑∀
−
22/1
21 )()(
l
iilil
Definition 5. Given a set of k full lists as L={ l1, l2,,…, lk }, the normalized aggregated Kendall
distance of a full list l to the set of full lists L is given as K(l,L)= k
k
iillK∑
=1),(, while the normalized
aggregated footrule distance of l to L is given as F(l,L)= k
k
iillF∑
=1),(
Definition 6. Rank Aggregation: Given a set of lists L={ l1, l2,,…, lk }, Rank Aggregation is the task of coming up with a list l such that either K(l,L) or F(l,L) is minimized. Definition 7. Partial List: A list lp containing elements, which are a strict subset of universe U, is called a partial list. We have a strict inequality | lp| <|U|. Definition 8. Spearman Rank Order Correlation coefficient [10]: Let the full lists [u1,u2,…...un] and [v1,v2,……vn] be the two rankings for some query Q. Spearman rank-order correlation coefficient (rs) between these two rankings is defined as follows-
)12(
1
2)]()([61
−
=∑ −
−=nn
n
iifif
s
vlulr (1)
Proceedings of the 4th WSEAS Int. Conf. on Information Security, Communications and Computers, Tenerife, Spain, December 16-18, 2005 (pp429-452)

The Spearman rank-order correlation coefficient (rs) is a measure of closeness of two rankings. The coefficient rs ranges between –1 and 1. When the two rankings are identical rs = 1, and when one of the rankings is the inverse of the other then the rs = -1. Definition 9. Modified Spearman Rank Order Correlation coefficient: Without loss of generality, assume that full list be given as [1,2,……,n].Let the partial list be given as [v1,v2,……,vm]. Modified Spearman rank-order correlation coefficient (rs׳) between these two rankings is defined as follows-
{ } ⎟⎠⎞⎜
⎝⎛ −
∑ −−=
=
=
1]
)vi(1'r
2m1j
m
1i
2i
s
jv[maxm (2)
Example 2. For |U|=5, let the full list be lf = {1,2,3,4,5} and the partial list lp with |lp| = m =3 be lp ={40,35,100}.
( ) 401.01
)1003()352()401(1'r 2
222s
}]100,35,40[max{3=
−−+−+−
−=×
2 WEB SEARCH EVALUATION USING USER FEEDBACK VECTOR MODEL 2.1 User Feedback Vector The underlying principle of our approach [11] of subjective evaluation of search engines is to measure the "satisfaction" a user gets when presented with the search results. For this, we need to monitor the response of the user to the search results presented before him. We characterize the feedback of the user by a vector (V, T, P, S, B, E, C), which consists of the following. (a) The sequence V in which the user visits the documents, V =(v1, v2, …vN). If document i is the
kth document visited by the user, then we set vi = k. If a document i is not visited by the user at all before the next query is submitted, the corresponding value of vi is set to -1.
(b) The time ti that a user spends examining the document i. We denote the vector (t1, t2, …, tN) by .T. For a document that is not visited, the corresponding entry in the array T is 0.
(c) Whether or not the user prints the document i. This is denoted by the Boolean pi. We denote the vector (p1, p2, …, pN) by P.
(d) Whether or not the user saves the document i. This is denoted by the Boolean si. We denote the vector •(s1, s2, …, sN) by .S
(e) Whether or not the user book-marked the document i. This is denoted by the Boolean bi We denote the vector (b1, b2, …, bN) by B.
(f) Whether or not the user e-mailed the document v to someone. This is denoted by the Boolean ei. We denote the vector (e1, e2…, eN) by E.
(g) The number of words that the user copied and pasted elsewhere. We denote the vector (c1, c2, …, cN)by C.
Proceedings of the 4th WSEAS Int. Conf. on Information Security, Communications and Computers, Tenerife, Spain, December 16-18, 2005 (pp429-452)
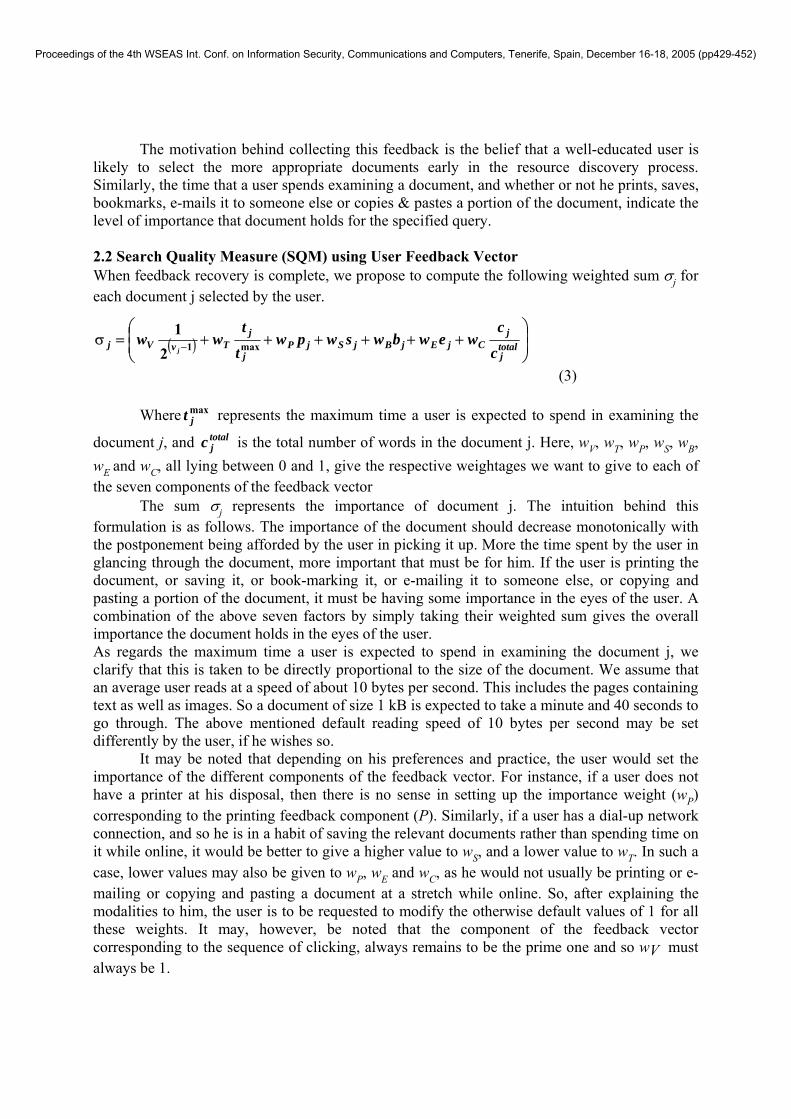
The motivation behind collecting this feedback is the belief that a well-educated user is likely to select the more appropriate documents early in the resource discovery process. Similarly, the time that a user spends examining a document, and whether or not he prints, saves, bookmarks, e-mails it to someone else or copies & pastes a portion of the document, indicate the level of importance that document holds for the specified query. 2.2 Search Quality Measure (SQM) using User Feedback Vector When feedback recovery is complete, we propose to compute the following weighted sum σj for each document j selected by the user.
(3)
Where maxjt represents the maximum time a user is expected to spend in examining the
document j, and totaljc is the total number of words in the document j. Here, wV, wT, wP, wS, wB,
wE and wC, all lying between 0 and 1, give the respective weightages we want to give to each of the seven components of the feedback vector
The sum σj represents the importance of document j. The intuition behind this formulation is as follows. The importance of the document should decrease monotonically with the postponement being afforded by the user in picking it up. More the time spent by the user in glancing through the document, more important that must be for him. If the user is printing the document, or saving it, or book-marking it, or e-mailing it to someone else, or copying and pasting a portion of the document, it must be having some importance in the eyes of the user. A combination of the above seven factors by simply taking their weighted sum gives the overall importance the document holds in the eyes of the user. As regards the maximum time a user is expected to spend in examining the document j, we clarify that this is taken to be directly proportional to the size of the document. We assume that an average user reads at a speed of about 10 bytes per second. This includes the pages containing text as well as images. So a document of size 1 kB is expected to take a minute and 40 seconds to go through. The above mentioned default reading speed of 10 bytes per second may be set differently by the user, if he wishes so.
It may be noted that depending on his preferences and practice, the user would set the importance of the different components of the feedback vector. For instance, if a user does not have a printer at his disposal, then there is no sense in setting up the importance weight (wP) corresponding to the printing feedback component (P). Similarly, if a user has a dial-up network connection, and so he is in a habit of saving the relevant documents rather than spending time on it while online, it would be better to give a higher value to wS, and a lower value to wT. In such a case, lower values may also be given to wP, wE and wC, as he would not usually be printing or e-mailing or copying and pasting a document at a stretch while online. So, after explaining the modalities to him, the user is to be requested to modify the otherwise default values of 1 for all these weights. It may, however, be noted that the component of the feedback vector corresponding to the sequence of clicking, always remains to be the prime one and so wV must always be 1.
( ) ⎟⎟⎠
⎞++⎜
⎜⎝
⎛++++=σ − c
cwewbwswpw
t
tww total
j
jCjEjBjSjP
j
jTvVj
j max121
Proceedings of the 4th WSEAS Int. Conf. on Information Security, Communications and Computers, Tenerife, Spain, December 16-18, 2005 (pp429-452)
Now, sorting the documents on the descending values of their weighted sum will yield a sequence ℜA, which is a ranking of documents based on user feedback. 3. WEB SEARCH EVALUATION USING VECTOR SPACE MODEL &BOOLEAN SIMILARITY MEASURES Before we proceed, we must have a look at the text pre-processing operations, which are a pre-requisite for the application of any objective evaluation procedure. 3.1 Text Pre-Processing First of all, we need to remove the stop-words, the words that have very little semantic meaning and are frequent homogeneously across the whole collection of documents. They are generally prepositions or articles like the, an, for etc. Over a period of time people have come up with a list of stop-words pertaining to a general domain. However, it may be argued that a stop-word is very much context dependant. A word like web may be treated as a stop-word in a collection of web-related articles, but not so in a set of literary documents.
The text pre-processing also includes an important step of word stemming, wherein all the words with same root are reduced to a single form. This is achieved by stripping each word of suffix, prefix or infix. This is to say that all words are reduced to their canonical form. For instance, the words like drive, driver and driving, all would be reduced to the stem word drive. This way the burden of being very specific while forming the query, is taken off from the shoulders of the user. A well- known algorithm for carrying out word stemming is Porter Stemmer algorithm [12].
It may be noted that the text pre-processing techniques are very much dependant on the language of the document. For instance, just the removal of suffixes may usually suffice as the stemming technique in the case of English language, but not necessarily so with other languages.
3.2 Vector Space Model
An n-dimensional vector space is taken with one dimension for each possible word or term. Thereore, n would be the number of words in a natural language. Each document or query is represented as a term vector in this vector space. Each component of term vector is either 0 or 1, depending on whether the term corresponding to that axis is absent or present in the text. Alternatively, each component of the term vector is taken as a function that increases with the frequency of the term (corresponding to that axis) with in the document and decreases with the number of documents in the collection that contain this term. This is to take into account the TF-IDF factor.
The frequency of a word in a given document is taken as a good measure of importance of that word in the given document [13]. This, of course, holds true only after the text pre-processing has been carried out.
An improved version of the term frequency is the term frequency-inverse document frequency (TF-IDF). In this, uniqueness of a keyword in a document, and hence the relevance, is measured by the fact that the word should be frequent in the current document but not so frequent in the rest of the documents of the given collection. The TF-IDF value for a given keyword w is given as
Proceedings of the 4th WSEAS Int. Conf. on Information Security, Communications and Computers, Tenerife, Spain, December 16-18, 2005 (pp429-452)

m a x
lo gwT F ID F
w w
fff
−ρ
=ρ (4)
where, wf is the frequency of the keyword w in the document, is wf max the maximum frequency of any word in the document , ρ w is the number of documents in which this keyword occurs and ρ is total number of documents in the collection. As web is very dynamic with respect to nature of its content , the vector space model can not be used directly in the performance evaluation of search engines[14].The value log( ρ / ρ w ) is not available because we don’t know the total number of documents ρ and documents containing the given keyword ρw .So, we use a simplified version of vector space model. Here,
we assume log( ρ / ρ w ) to be constant with the argument that all keywords in our queries are technical terms which appear approximately the same number of times. This simplified version may favor long documents and give documents with many appearances of same keywords a higher score. The term vectors of documents are normalized to one to compensate for different document lengths and a many occurrences of a keyword in a document indicates relevance of the document to the query. Once the term vectors are obtained the similarity between a document and a query is obtained by computing the dot product of their term vectors. Larger the dot product, the greater would be the similarity. The document with larger dot product is more relevant to query. Now, sorting the documents with the decreasing values of their respective dot products with that of the query, will yield a sequence ℜB, which is a ranking of documents based on vector space model 3.3 Boolean similarity measures There are a number of Boolean similarity measures[14] that can be used to compute the similarities of one document to another and documents to queries. Some of such well-known similarity measures are Dice’s Coefficient, Jaccard’s Coefficient, Cosine coefficient and overlap Coefficient. In order to use these measures, documents and queries are to be represented as sets of keywords
Radecki proposed two similarity measures, S and S*, based on Jaccard’s coefficient .We assume that each query is transformed to a Boolean expression and denote Đ (Q) and Đ (C) as sets of documents in the response to query Q and in the cluster of documents represented by C . The similarity value S between Q and C is defined as the ratio of common documents to total number of documents in Đ (Q) and Đ (C). .
S(Q,C)= )( ÐÐ)( ÐÐ
CQCQ
U
I
)( )( (5)
but since all the documents in response to query belong to the cluster represented by C (i.e Đ (Q) ⊆ Đ (C) ) we can have
S(Q,C)=)( Ð
ÐCQ)(
(6)
This measure requires the actual results to the query and is mainly useful as index of comparison
Proceedings of the 4th WSEAS Int. Conf. on Information Security, Communications and Computers, Tenerife, Spain, December 16-18, 2005 (pp429-452)
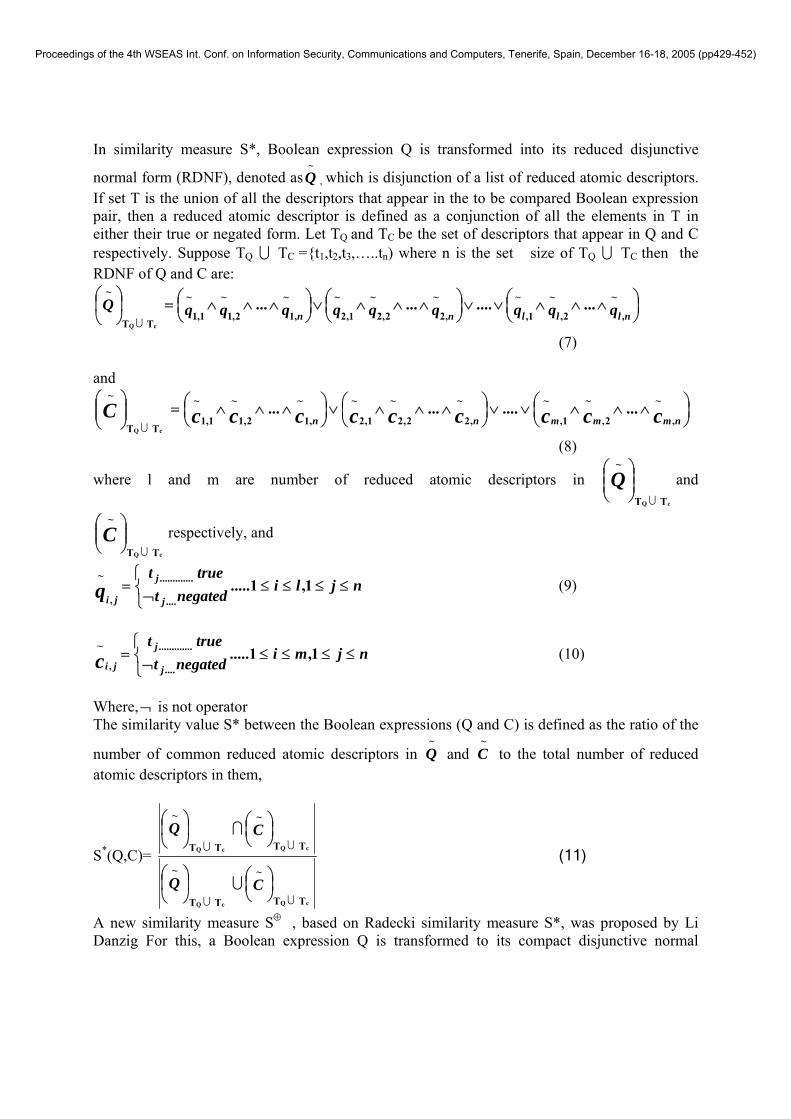
In similarity measure S*, Boolean expression Q is transformed into its reduced disjunctive
normal form (RDNF), denoted asQ~
, which is disjunction of a list of reduced atomic descriptors. If set T is the union of all the descriptors that appear in the to be compared Boolean expression pair, then a reduced atomic descriptor is defined as a conjunction of all the elements in T in either their true or negated form. Let TQ and TC be the set of descriptors that appear in Q and C respectively. Suppose TQ U TC ={t1,t2,t3,…..tn) where n is the set size of TQ U TC then the RDNF of Q and C are:
⎟⎠⎞⎜
⎝⎛ ∧∧∧∨∨⎟
⎠⎞⎜
⎝⎛ ∧∧∧∨⎟
⎠⎞⎜
⎝⎛ ∧∧∧=⎟
⎠⎞
⎜⎝⎛ ~
,
~
2,
~
1,
~
,2
~
2,2
~
1,2
~
,1
~
2,1
~
1,1 T T
~.............
cQ
qqqqqqqqqQnlllnn
U
(7) and
⎟⎠⎞
⎜⎝⎛ ∧∧∧∨∨⎟
⎠⎞
⎜⎝⎛ ∧∧∧∨⎟
⎠⎞
⎜⎝⎛ ∧∧∧=⎟⎟
⎠
⎞⎜⎜⎝
⎛ ~
,
~
2,
~
1,
~
,2
~
2,2
~
1,2
~
,1
~
2,1
~
1,1 T T
~.............
cQcccccccccC
nmmmnnU
(8)
where l and m are number of reduced atomic descriptors in T T
~
cQ U⎟⎟⎠
⎞⎜⎜⎝
⎛Q and
T T
~
cQ U⎟⎟⎠
⎞⎜⎜⎝
⎛C respectively, and
njlinegatedt
truet
j
j
jiq ≤≤≤≤⎩⎨⎧
¬= 1,1.....
....
.............~
, (9)
njminegatedt
truet
j
j
jic ≤≤≤≤⎩⎨⎧
¬= 1,1.....
....
.............~
, (10)
Where, ¬ is not operator The similarity value S* between the Boolean expressions (Q and C) is defined as the ratio of the
number of common reduced atomic descriptors in ~Q and
~C to the total number of reduced
atomic descriptors in them,
S*(Q,C)=
T T
~
T T
~
T T
~
T T
~
cQcQ
cQcQ
UU
UU
U
I
⎟⎠⎞
⎜⎝⎛⎟
⎠⎞
⎜⎝⎛
⎟⎠⎞
⎜⎝⎛⎟
⎠⎞
⎜⎝⎛
CQ
CQ
(11)
A new similarity measure S⊕ , based on Radecki similarity measure S*, was proposed by Li Danzig For this, a Boolean expression Q is transformed to its compact disjunctive normal
Proceedings of the 4th WSEAS Int. Conf. on Information Security, Communications and Computers, Tenerife, Spain, December 16-18, 2005 (pp429-452)
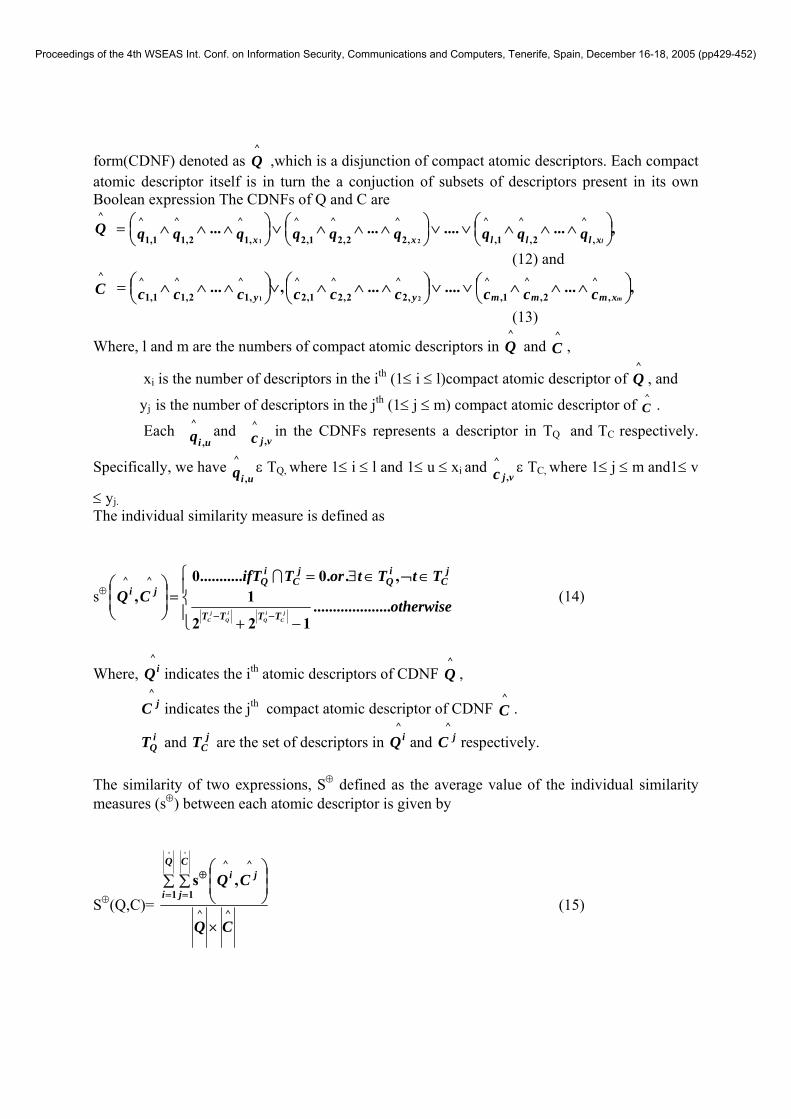
form(CDNF) denoted as Q^
,which is a disjunction of compact atomic descriptors. Each compact atomic descriptor itself is in turn the a conjuction of subsets of descriptors present in its own Boolean expression The CDNFs of Q and C are
,............. ^
,
^
2,
^
1,
^
,2
^
2,2
^
1,2
^
,1
^
2,1
^
1,1
^
21⎟⎠⎞⎜
⎝⎛ ∧∧∧∨∨⎟
⎠⎞⎜
⎝⎛ ∧∧∧∨⎟
⎠⎞⎜
⎝⎛ ∧∧∧= qqqqqqqqqQ
lxlllxx
(12) and
,..........,... ^,
^2,
^1,
^,2
^2,2
^1,2
^,1
^2,1
^1,1
^
21⎟⎠⎞⎜
⎝⎛ ∧∧∧∨∨⎟
⎠⎞⎜
⎝⎛ ∧∧∧∨⎟
⎠⎞⎜
⎝⎛ ∧∧∧= cccccccccC
mxmmmyy
(13)
Where, l and m are the numbers of compact atomic descriptors in Q^
and C^
,
xi is the number of descriptors in the ith (1≤ i ≤ l)compact atomic descriptor of Q^
, and
yj is the number of descriptors in the jth (1≤ j ≤ m) compact atomic descriptor of C^ .
Each ^
,q uiand ^
,c vjin the CDNFs represents a descriptor in TQ and TC respectively.
Specifically, we have ^
,q uiε TQ, where 1≤ i ≤ l and 1≤ u ≤ xi and ^
,c vjε TC, where 1≤ j ≤ m and1≤ v
≤ yj. The individual similarity measure is defined as
s⊕
⎪⎩
⎪⎨
⎧
−+
∈¬∈∃==⎟
⎟⎠
⎞⎜⎜⎝
⎛
−−otherwise
TtTtorTifTCQ
jC
iQ
iQ
jC TTTT
jC
iQ
jC
iQ
ji
....................122
1,..0...........0
,^^ I
(14)
Where, ^
iQ indicates the ith atomic descriptors of CDNF Q^
, ^
jC indicates the jth compact atomic descriptor of CDNF C^
.
iQT and j
CT are the set of descriptors in ^
iQ and ^
jC respectively. The similarity of two expressions, S⊕ defined as the average value of the individual similarity measures (s⊕) between each atomic descriptor is given by
S⊕(Q,C)= ^^
1 1
^^^ ^
,s
CQ
CQQ
i
C
j
ji
×
∑ ∑ ⎟⎟⎠
⎞⎜⎜⎝
⎛
= =
⊕
(15)
Proceedings of the 4th WSEAS Int. Conf. on Information Security, Communications and Computers, Tenerife, Spain, December 16-18, 2005 (pp429-452)
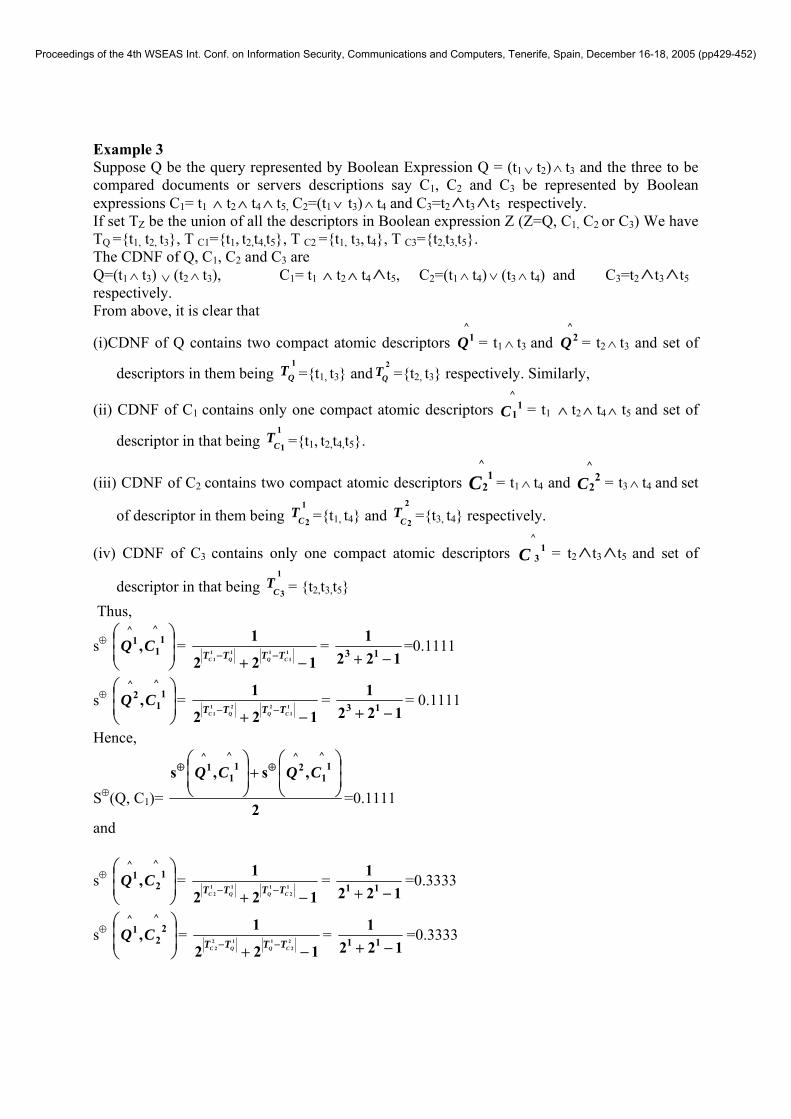
Example 3 Suppose Q be the query represented by Boolean Expression Q = (t1 ∨ t2) ∧ t3 and the three to be compared documents or servers descriptions say C1, C2 and C3 be represented by Boolean expressions C1= t1 ∧ t2 ∧ t4 ∧ t5, C2=(t1 ∨ t3) ∧ t4 and C3=t2 ∧t3 ∧t5 respectively. If set TZ be the union of all the descriptors in Boolean expression Z (Z=Q, C1, C2 or C3) We have TQ ={t1, t2, t3}, T C1={t1, t2,t4,t5}, T C2 ={t1, t3, t4}, T C3={t2,t3,t5}. The CDNF of Q, C1, C2 and C3 are Q=(t1 ∧ t3) ∨ (t2 ∧ t3), C1= t1 ∧ t2 ∧ t4 ∧t5, C2=(t1 ∧ t4) ∨ (t3 ∧ t4) and C3=t2 ∧t3 ∧t5 respectively. From above, it is clear that
(i)CDNF of Q contains two compact atomic descriptors ^
1Q = t1 ∧ t3 and ^
2Q = t2 ∧ t3 and set of
descriptors in them being 1
QT ={t1, t3} and2
QT ={t2, t3} respectively. Similarly,
(ii) CDNF of C1 contains only one compact atomic descriptors ^
11C = t1 ∧ t2 ∧ t4 ∧ t5 and set of
descriptor in that being 1
1CT ={t1, t2,t4,t5}.
(iii) CDNF of C2 contains two compact atomic descriptors ^
12C = t1 ∧ t4 and
^2
2C = t3 ∧ t4 and set
of descriptor in them being 1
2CT ={t1, t4} and
2
2CT ={t3, t4} respectively.
(iv) CDNF of C3 contains only one compact atomic descriptors ^
13C = t2 ∧t3 ∧t5 and set of
descriptor in that being 1
3CT = {t2,t3,t5}
Thus,
s⊕ ⎟⎟⎠
⎞⎜⎜⎝
⎛ ^1
1
^1,CQ =
122
111
1111 −+ −− CQQC TTTT
= 122
113 −+
=0.1111
s⊕ ⎟⎟⎠
⎞⎜⎜⎝
⎛ ^1
1
^2 ,CQ =
122
11
1221
1 −+ −− CQQC TTTT=
1221
13 −+= 0.1111
Hence,
S⊕(Q, C1)= 2
,s,s^
11
^2
^1
1
^1
⎟⎟⎠
⎞⎜⎜⎝
⎛+⎟
⎟⎠
⎞⎜⎜⎝
⎛⊕⊕ CQCQ
=0.1111
and
s⊕ ⎟⎟⎠
⎞⎜⎜⎝
⎛ ^1
2
^1,CQ =
122
11
2111
2 −+ −− CQQC TTTT=
1221
11 −+=0.3333
s⊕ ⎟⎟⎠
⎞⎜⎜⎝
⎛ ^2
2
^1,CQ =
122
122
1122 −+ −− CQQC TTTT
= 122
111 −+
=0.3333
Proceedings of the 4th WSEAS Int. Conf. on Information Security, Communications and Computers, Tenerife, Spain, December 16-18, 2005 (pp429-452)

s⊕ ⎟⎟⎠
⎞⎜⎜⎝
⎛ ^1
2
^2 ,CQ = 0 (because
2
QT ∩ 1
2CT = φ )
s⊕ ⎟⎟⎠
⎞⎜⎜⎝
⎛ ^2
2
^2 ,CQ =
122
12
2222
2 −+ −− CQQC TTTT=
1221
11 −+= 0.3333
Hence,
S⊕(Q, C2)= 4
,s,s,s,s^
22
^2
^1
2
^2
^2
2
^1
^1
2
^1
⎟⎟⎠
⎞⎜⎜⎝
⎛+⎟
⎟⎠
⎞⎜⎜⎝
⎛+⎟
⎟⎠
⎞⎜⎜⎝
⎛+⎟
⎟⎠
⎞⎜⎜⎝
⎛⊕⊕⊕⊕ CQCQCQCQ
= 0.2500
and
s⊕ ⎟⎟⎠
⎞⎜⎜⎝
⎛ ^1
3
^1,CQ =
122
11
3111
3 −+ −− CQQC TTTT=
1221
12 −+=0.2000
s⊕ ⎟⎟⎠
⎞⎜⎜⎝
⎛ ^1
3
^2 ,CQ =
122
11
3221
3 −+ −− CQQC TTTT=
1221
01 −+= 0.5000
Hence,
S⊕(Q, C3)= 2
,s,s^
13
^2
^1
3
^1
⎟⎟⎠
⎞⎜⎜⎝
⎛+⎟
⎟⎠
⎞⎜⎜⎝
⎛⊕⊕ CQCQ
= 0.350
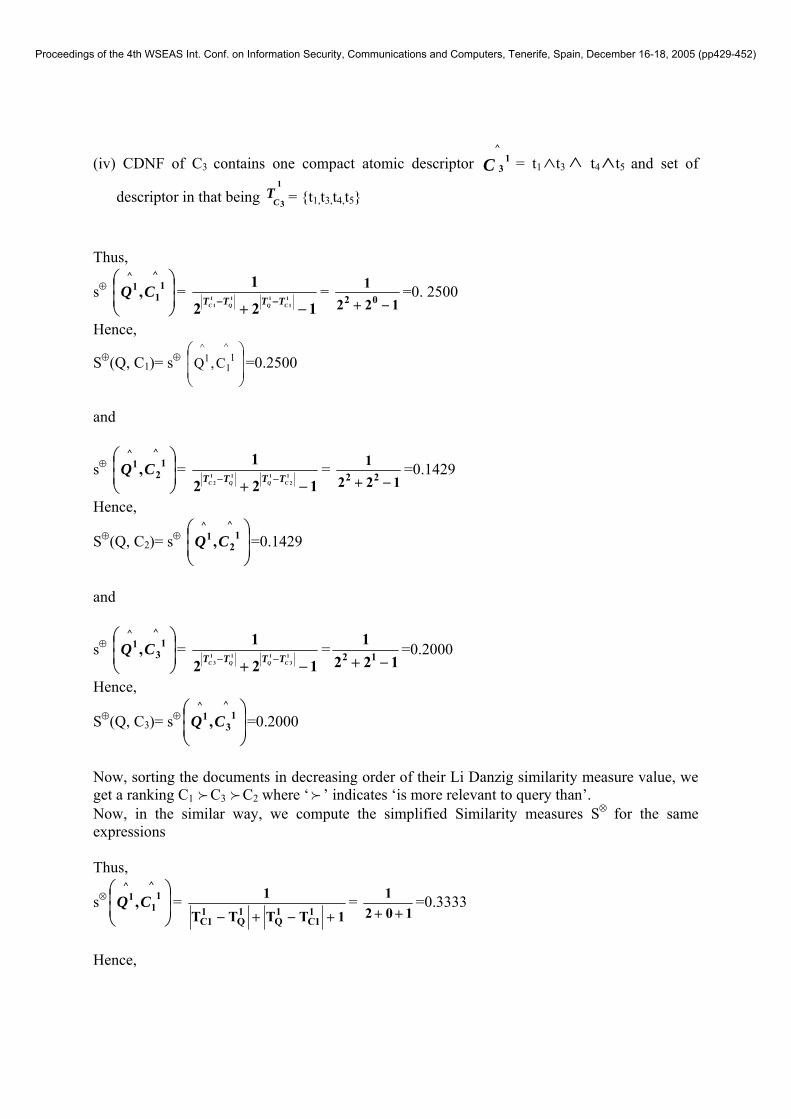
Now, sorting the documents in decreasing order of their Li Danzig similarity measure value, we get a ranking C3 fC2 fC1 where ‘f ’ indicates ‘is more relevant to query than’. 3.3.1 Simplified Boolean Similarity measure It is a proved [15] fact that the Li Danzig similarity measure S⊕, is equivalent to Radecki similarity measure S*, which is based on Jaccard’s Coefficient and at the same time, reduces time and space complexity from exponential to polynomial in the number of Boolean terms. But as we are interested in relevant ranking of the documents rather than their individual similarity measures with the query, we strongly feel that the Li Danzig measure S⊕ can be further simplified. We propose a simplified Boolean similarity measure S⊗ based on Li Danzig measure S⊕.
If Q^
and C^ be the CDNF of the Boolean expressions Q and C as described
above(eqns12 and13), the simplified individual similarity measure is defined as
Proceedings of the 4th WSEAS Int. Conf. on Information Security, Communications and Computers, Tenerife, Spain, December 16-18, 2005 (pp429-452)

s⊗
⎪⎩
⎪⎨
⎧
+−+−
∈¬∈∃==⎟
⎟⎠
⎞⎜⎜⎝
⎛otherwise
TTTT
TtTtorTifTCQ
jC
iQ
iQ
jC
jC
iQ
jC
iQ
ji...............
11
,..0...........0,
^^ I
(16)
Where ^
iQ indicates the ith atomic descriptors of CDNF Q^
, ^
jC indicates the jth compact atomic
descriptor of CDNF C^
. iQT and j
CT are the set of descriptors in ^
iQ and ^
jC respectively. The similarity of two expressions, S⊗ defined as the average value of the individual similarity measures (s⊗) between each atomic descriptor, is given by
S⊗(Q, C)= ^^
1 1
^^^ ^
,s
CQ
CQQ
i
C
j
ji
×
∑ ∑ ⎟⎟⎠
⎞⎜⎜⎝
⎛
= =
⊗
(17)
The proposed simplified version reduces the computational effort substantially. Moreover, if we assume that Boolean expressions of the query Q and documents to be compared (C1, C2, ….., Cn), just contain only AND terms i.e their CDNF contain only a single compact descriptor and for each pair of to be compared documents Ck and Cl one of the following holds true
iQ
jC
jC
iQ
jC
iQ
jC
iQ
jC
iQ
iQ
jC
iQ
jC
iQ
jC TTTTorTTTTorTTTTorTTTT
lklklklk−=−−=−−=−−=− then,
relative rankings of documents found using the simplified version, remains same with that found using Li Danzig measure S⊕ as it is illustrated in following example. Example 4 Suppose Q be the query represented by Boolean Expression Q = t1 ∧ t2 ∧ t3 and the three to be compared documents or servers descriptions say C1, C2 and C3 be represented by Boolean expressions C1= t1 ∧ t2 ∧ t3 ∧ t4 ∧ t5, C2=t1 ∧ t4 ∧ t5 and C3=t1 ∧t3 ∧ t4 ∧t5 respectively. The CDNF of Q, C1, C2 and C3 are Q= t1 ∧ t2 ∧ t3, C1= t1 ∧ t2 ∧ t3 ∧ t4 ∧ t5, C2= t1 ∧ t4 ∧ t5 and C3= t1 ∧t3 ∧ t4 ∧t5
respectively. From above, it is clear that
(i)CDNF of Q contains one compact atomic descriptor t2
^1Q = t1 ∧ t2 ∧ t3and set of descriptors in
that being 1
QT ={t1, t2, t3} Similarly,
(ii) CDNF of C1 contains one compact atomic descriptor ^
11C = t1 ∧ t2 ∧ t3 ∧ t4 ∧ t5 and set of
descriptor in that being 1
1CT ={t1, t2, t3, t4, t5}.
(iii) CDNF of C2 contains one compact atomic descriptor ^
12C = t1 ∧ t4 ∧ t5 and set of descriptor in
that being 1
2CT ={t1, t4, t5}.
Proceedings of the 4th WSEAS Int. Conf. on Information Security, Communications and Computers, Tenerife, Spain, December 16-18, 2005 (pp429-452)
(iv) CDNF of C3 contains one compact atomic descriptor ^
13C = t1 ∧t3 ∧ t4 ∧t5 and set of
descriptor in that being 1
3CT = {t1,t3,t4,t5}
Thus,
s⊕ ⎟⎟⎠
⎞⎜⎜⎝
⎛ ^1
1
^1,CQ =
122
111
1111 −+ −− CQQC TTTT
= 122
102 −+
=0. 2500
Hence,
S⊕(Q, C1)= s⊕ ⎟⎟
⎠
⎞
⎜⎜
⎝
⎛ ^1
1
^1 C,Q =0.2500
and
s⊕ ⎟⎟⎠
⎞⎜⎜⎝
⎛ ^1
2
^1,CQ =
122
11
2111
2 −+ −− CQQC TTTT=
1221
22 −+=0.1429
Hence,
S⊕(Q, C2)= s⊕ ⎟⎟⎠
⎞⎜⎜⎝
⎛ ^1
2
^1,CQ =0.1429
and
s⊕ ⎟⎟⎠
⎞⎜⎜⎝
⎛ ^1
3
^1,CQ =
122
11
3111
3 −+ −− CQQC TTTT=
1221
12 −+=0.2000
Hence,
S⊕(Q, C3)= s⊕⎟⎟⎠
⎞⎜⎜⎝
⎛ ^1
3
^1,CQ =0.2000
Now, sorting the documents in decreasing order of their Li Danzig similarity measure value, we get a ranking C1 fC3 fC2 where ‘f ’ indicates ‘is more relevant to query than’. Now, in the similar way, we compute the simplified Similarity measures S⊗
for the same expressions Thus,
s⊗⎟⎟⎠
⎞⎜⎜⎝
⎛ ^1
1
^1,CQ =
1TTTT
11
1C1Q
1Q
11C +−+−
= 102
1++
=0.3333
Hence,
Proceedings of the 4th WSEAS Int. Conf. on Information Security, Communications and Computers, Tenerife, Spain, December 16-18, 2005 (pp429-452)
S⊗(Q, C1)= s⊗
⎟⎟
⎠
⎞
⎜⎜
⎝
⎛ ^1
1
^1 C,Q =0.3333
and
s⊗
⎟⎟
⎠
⎞
⎜⎜
⎝
⎛ ^1
2
^1 C,Q =
11
12
1112 +−+− CQQC TTTT
= 122
1++
=0.2000
Hence,
S⊗ (Q, C2)= s⊗⎟⎟
⎠
⎞
⎜⎜
⎝
⎛ ^1
2
^1 C,Q =0.2000
and
s⊗ ⎟⎟⎠
⎞⎜⎜⎝
⎛ ^1
3
^1,CQ =
1TTTT
11
3C1Q
1Q
13C +−+−
=112
1++
=0.2500
Hence,
S⊗(Q, C3)= s⊗ ⎟⎟⎠
⎞⎜⎜⎝
⎛ ^1
3
^1,CQ = 0.2500
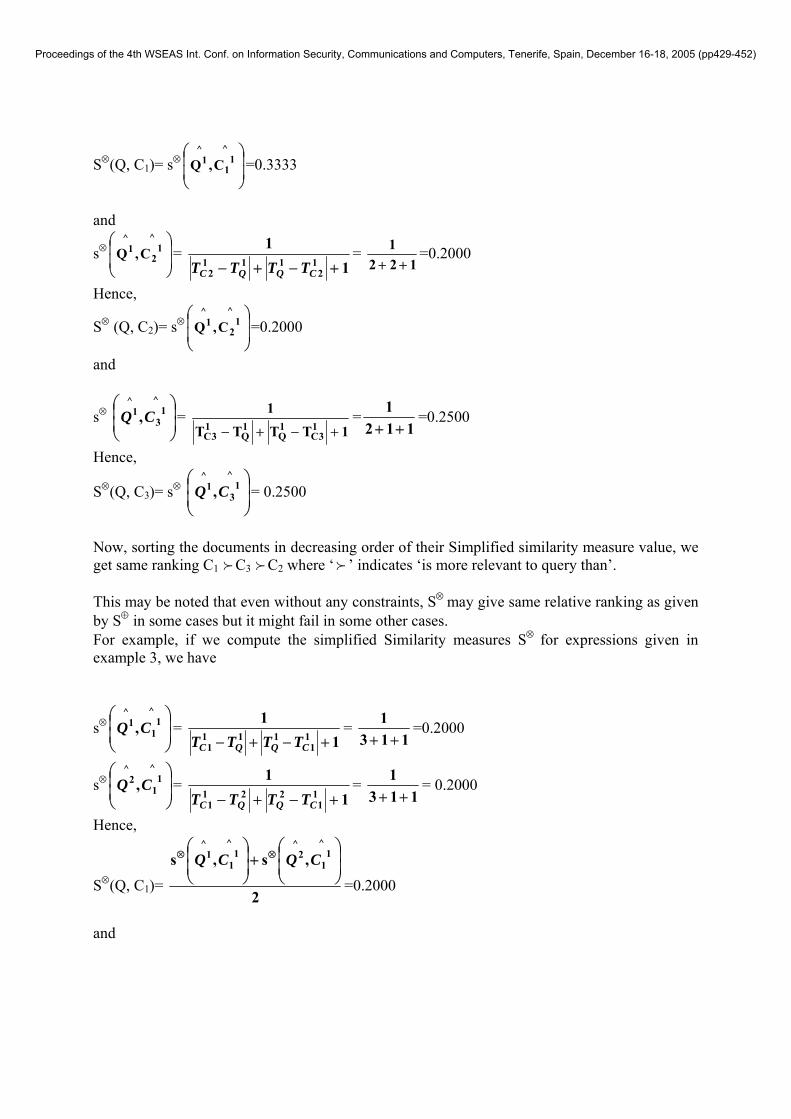
Now, sorting the documents in decreasing order of their Simplified similarity measure value, we get same ranking C1 fC3 fC2 where ‘f ’ indicates ‘is more relevant to query than’. This may be noted that even without any constraints, S⊗ may give same relative ranking as given by S⊕ in some cases but it might fail in some other cases. For example, if we compute the simplified Similarity measures S⊗
for expressions given in example 3, we have
s⊗⎟⎟⎠
⎞⎜⎜⎝
⎛ ^1
1
^1,CQ =
11
11
1111 +−+− CQQC TTTT
= 113
1++
=0.2000
s⊗⎟⎟⎠
⎞⎜⎜⎝
⎛ ^1
1
^2 ,CQ =
11
11
2211 +−+− CQQC TTTT
= 113
1++
= 0.2000
Hence,
S⊗(Q, C1)= 2
,s,s^
11
^2
^1
1
^1
⎟⎟⎠
⎞⎜⎜⎝
⎛+⎟
⎟⎠
⎞⎜⎜⎝
⎛⊗⊗ CQCQ
=0.2000
and
Proceedings of the 4th WSEAS Int. Conf. on Information Security, Communications and Computers, Tenerife, Spain, December 16-18, 2005 (pp429-452)
s⊗ ⎟⎟⎠
⎞⎜⎜⎝
⎛ ^1
2
^1,CQ =
11
12
1112 +−+− CQQC TTTT
= 111
1++
=0.333
s⊗ ⎟⎟⎠
⎞⎜⎜⎝
⎛ ^2
2
^1,CQ =
11
22
1122 +−+− CQQC TTTT
= 111
1++
=0.333
s⊗ ⎟⎟⎠
⎞⎜⎜⎝
⎛ ^1
2
^2 ,CQ = 0 (because
2
QT ∩ 1
2CT = φ )
s⊗ ⎟⎟⎠
⎞⎜⎜⎝
⎛ ^2
2
^2 ,CQ =
11
22
2222 +−+− CQQC TTTT
= 111
1++
= 0.333
Hence,
S⊗ (Q, C2)= 4
,s,s,s,s^
22
^2
^1
2
^2
^2
2
^1
^1
2
^1
⎟⎟⎠
⎞⎜⎜⎝
⎛+⎟
⎟⎠
⎞⎜⎜⎝
⎛+⎟
⎟⎠
⎞⎜⎜⎝
⎛+⎟
⎟⎠
⎞⎜⎜⎝
⎛⊕⊕⊕⊕ CQCQCQCQ
= 0.250
and
s⊗ ⎟⎟⎠
⎞⎜⎜⎝
⎛ ^1
3
^1,CQ =
11
13
1113 +−+− CQQC TTTT
=112
1++
=0.250
s⊗ ⎟⎟⎠
⎞⎜⎜⎝
⎛ ^1
3
^2 ,CQ =
11
13
2213 +−+− CQQC TTTT
= 101
1++
= 0.500
Hence,
S⊗(Q, C3)= 2
,s,s^
13
^2
^1
3
^1
⎟⎟⎠
⎞⎜⎜⎝
⎛+⎟⎟
⎠
⎞⎜⎜⎝
⎛ ⊕⊕ CQCQ= 0.375
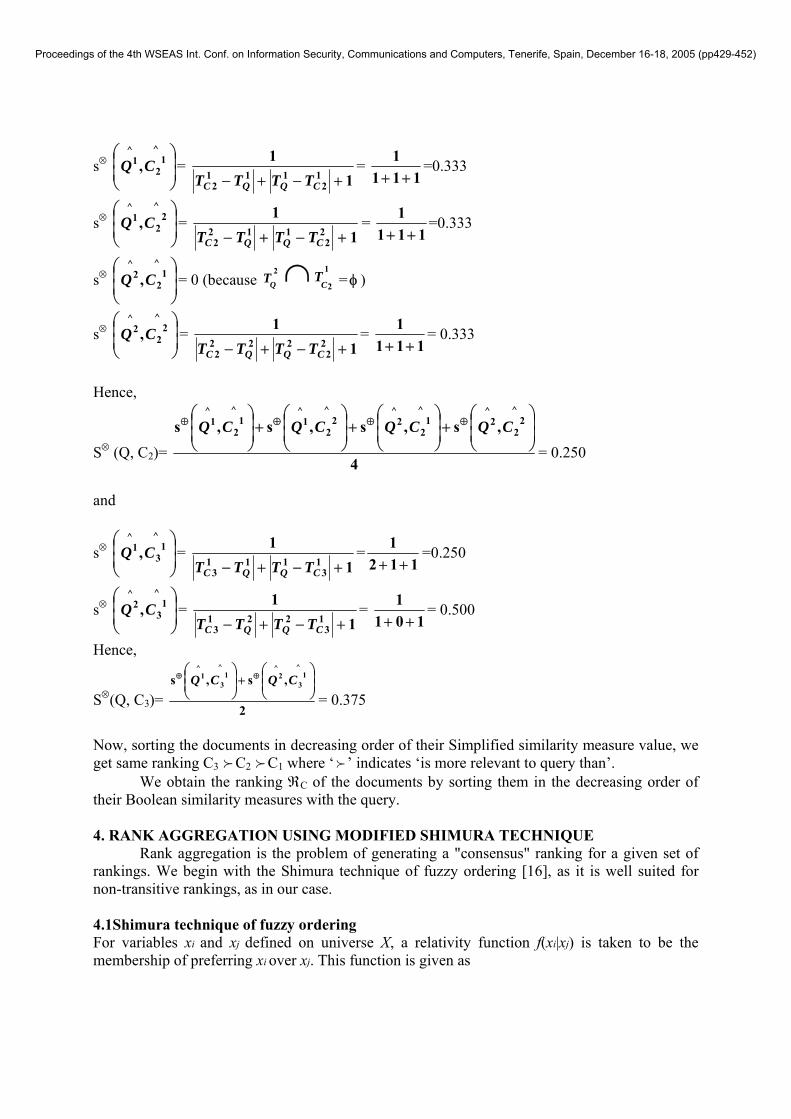
Now, sorting the documents in decreasing order of their Simplified similarity measure value, we get same ranking C3 fC2 fC1 where ‘f ’ indicates ‘is more relevant to query than’.
We obtain the ranking ℜC of the documents by sorting them in the decreasing order of their Boolean similarity measures with the query. 4. RANK AGGREGATION USING MODIFIED SHIMURA TECHNIQUE
Rank aggregation is the problem of generating a "consensus" ranking for a given set of rankings. We begin with the Shimura technique of fuzzy ordering [16], as it is well suited for non-transitive rankings, as in our case. 4.1Shimura technique of fuzzy ordering For variables xi and xj defined on universe X, a relativity function f(xi|xj) is taken to be the membership of preferring xi over xj. This function is given as
Proceedings of the 4th WSEAS Int. Conf. on Information Security, Communications and Computers, Tenerife, Spain, December 16-18, 2005 (pp429-452)
)( jxxf i =))(),(max(
)(jxix
ix
xfxfxf
ij
j
where, )( ix xf j is the membership function of xi with respect to xj and )( jx xf i is the membership function of xj with respect to xi .For X = [x1 , x2 ,….,xn ], )( ix xf i =1. Ci = minn
1=j )( jxxf i is the membership ranking value for the ith variable. Now if a descending sort on Ci (i=1 to n) is caried out, the sequence of i's thus obtained would constitute the aggregated rank. For the lists l1, l2,.. lN from the N participating evaluation techniques, we can have
)( ix xf j = NxlxlNk jkik ))()((],1[ <∧∈
In our case N=3. 4.2 Modified Shimura technique
It is observed that classical Shimura technique gives worse performance in comparison to other rank aggregation techniques. We feel that the poor performance coming from the Shimura technique, is primarily due to the employment of "min" function in finding Ci = minn
1=j )( jxxf i . The "min" function results in many ties, when a descending order sort is applied on Ci. There is no method suggested by Shimura to resolve these ties. So when resolved arbitrarily, these ties result in deterioration of the aggregated result. We, therefore replace this "min" function by an OWA operator [17]. The OWA operators, in fact, provide a parameterized family of aggregation operators, which include many of the wel-known operators such as the maximum, the minimum, the k-order statistics, the median and the arithmetic mean.
we will be using the relative fuzzy linguistic quantifier "at least half" with the pair (a = 0.0, b = 0.5) for the purpose of finding the vector Ci as folows.
Ci = ∑j
jj zw . ,
where zj is the jth largest element in the ith row of the matrix )( jxxf i . Now, as with the Shimura technique, if a descending sort on Ci (i=1 to m) is caried out, the sequence of i's thus obtained would constitute the aggregated rank.
We will be using the modified Shimura technique for aggregating the three rankings ℜA, ℜB and ℜC obtained from the three different evaluation procedures as described in preceding sections. Let us say the aggregated ranking as ℜComp Let the full list ℜSE be the sequence in which the documents were initially short-listed. Without loss of generality, it could be assumed that ℜSE = (1,2,3,...,NR), where NR is the total number of documents listed in the result. We compare the sequences and, and find Modified Spearman Rank Order Correlation Coefficient (rs’). We repeat this procedure for a representative set of queries and take the average of rs’. The resulting average value of rs’ is the required measure of the search quality (SQM). The overall procedure is illustrated in Figure 1.
It may be noted that it is very common practice that a user views only those documents whose snippet displayed before him by the search engine he finds to be worth viewing. Modified Spearman Rank Order Correlation Coefficient is a better choice than Spearman Rank Order Correlation Coefficient to measure the closeness of the two rankings. Since, it is capable of working on a full list and a partial list and the sequence ∑ of documents viewed by a user is almost always a partial list, which in turn is used in getting the rankings ℜA, ℜB and ℜC and
Proceedings of the 4th WSEAS Int. Conf. on Information Security, Communications and Computers, Tenerife, Spain, December 16-18, 2005 (pp429-452)
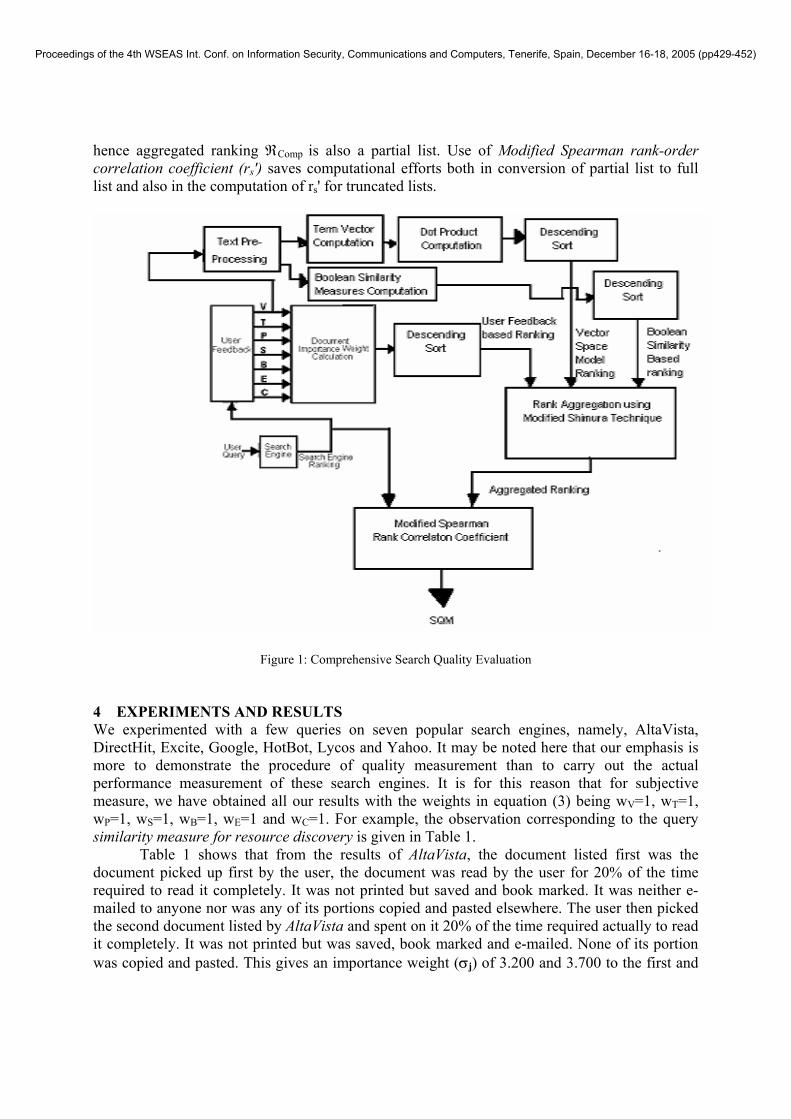
hence aggregated ranking ℜComp is also a partial list. Use of Modified Spearman rank-order correlation coefficient (rs') saves computational efforts both in conversion of partial list to full list and also in the computation of rs' for truncated lists.
Figure 1: Comprehensive Search Quality Evaluation
4 EXPERIMENTS AND RESULTS We experimented with a few queries on seven popular search engines, namely, AltaVista, DirectHit, Excite, Google, HotBot, Lycos and Yahoo. It may be noted here that our emphasis is more to demonstrate the procedure of quality measurement than to carry out the actual performance measurement of these search engines. It is for this reason that for subjective measure, we have obtained all our results with the weights in equation (3) being wV=1, wT=1, wP=1, wS=1, wB=1, wE=1 and wC=1. For example, the observation corresponding to the query similarity measure for resource discovery is given in Table 1.
Table 1 shows that from the results of AltaVista, the document listed first was the document picked up first by the user, the document was read by the user for 20% of the time required to read it completely. It was not printed but saved and book marked. It was neither e-mailed to anyone nor was any of its portions copied and pasted elsewhere. The user then picked the second document listed by AltaVista and spent on it 20% of the time required actually to read it completely. It was not printed but was saved, book marked and e-mailed. None of its portion was copied and pasted. This gives an importance weight (σj) of 3.200 and 3.700 to the first and
Proceedings of the 4th WSEAS Int. Conf. on Information Security, Communications and Computers, Tenerife, Spain, December 16-18, 2005 (pp429-452)
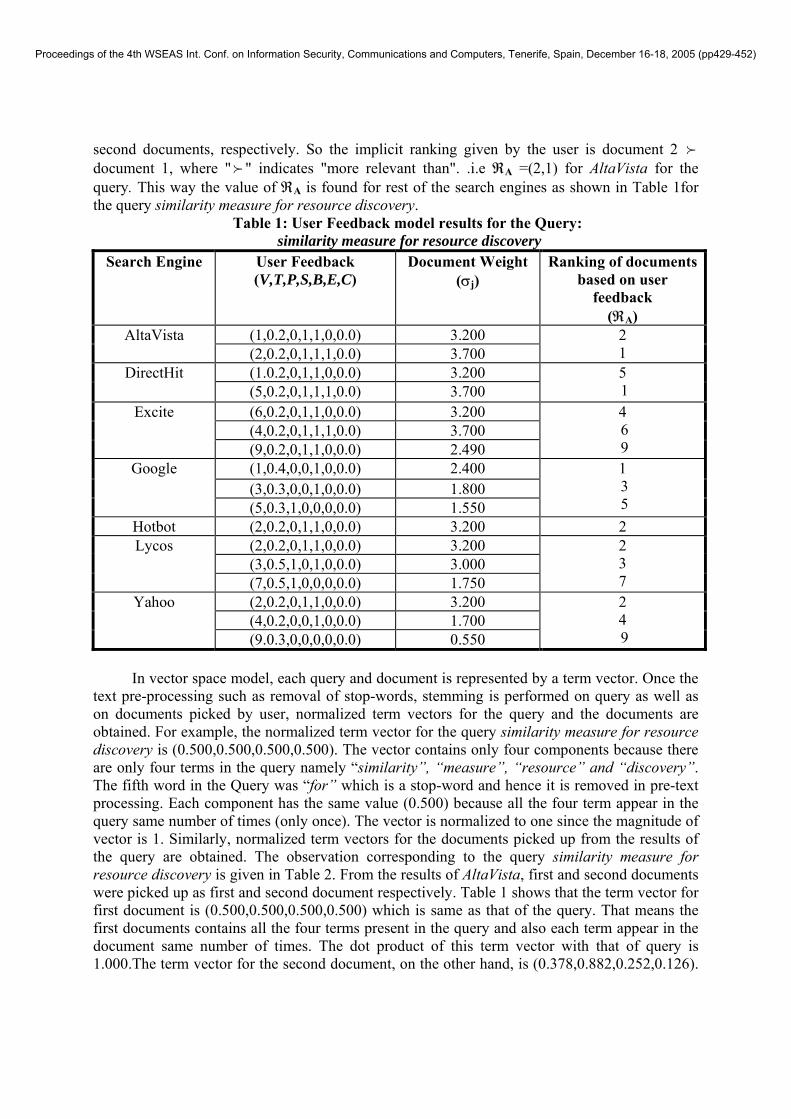
second documents, respectively. So the implicit ranking given by the user is document 2 f document 1, where "f " indicates "more relevant than". .i.e ℜA =(2,1) for AltaVista for the query. This way the value of ℜA is found for rest of the search engines as shown in Table 1for the query similarity measure for resource discovery.
Table 1: User Feedback model results for the Query: similarity measure for resource discovery
Search Engine User Feedback (V,T,P,S,B,E,C)
Document Weight (σj)
Ranking of documents based on user
feedback (ℜA)
(1,0.2,0,1,1,0,0.0) 3.200 AltaVista (2,0.2,0,1,1,1,0.0) 3.700
2 1
(1.0.2,0,1,1,0,0.0) 3.200 DirectHit (5,0.2,0,1,1,1,0.0) 3.700
5 1
(6,0.2,0,1,1,0,0.0) 3.200 (4,0.2,0,1,1,1,0.0) 3.700
Excite
(9,0.2,0,1,1,0,0.0) 2.490
4 6 9
(1,0.4,0,0,1,0,0.0) 2.400 (3,0.3,0,0,1,0,0.0) 1.800
(5,0.3,1,0,0,0,0.0) 1.550
1 3 5
Hotbot (2,0.2,0,1,1,0,0.0) 3.200 2 (2,0.2,0,1,1,0,0.0) 3.200 (3,0.5,1,0,1,0,0.0) 3.000
Lycos
(7,0.5,1,0,0,0,0.0) 1.750
2 3 7
(2,0.2,0,1,1,0,0.0) 3.200 (4,0.2,0,0,1,0,0.0) 1.700
Yahoo
(9.0.3,0,0,0,0,0.0) 0.550
2 4 9
In vector space model, each query and document is represented by a term vector. Once the text pre-processing such as removal of stop-words, stemming is performed on query as well as on documents picked by user, normalized term vectors for the query and the documents are obtained. For example, the normalized term vector for the query similarity measure for resource discovery is (0.500,0.500,0.500,0.500). The vector contains only four components because there are only four terms in the query namely “similarity”, “measure”, “resource” and “discovery”. The fifth word in the Query was “for” which is a stop-word and hence it is removed in pre-text processing. Each component has the same value (0.500) because all the four term appear in the query same number of times (only once). The vector is normalized to one since the magnitude of vector is 1. Similarly, normalized term vectors for the documents picked up from the results of the query are obtained. The observation corresponding to the query similarity measure for resource discovery is given in Table 2. From the results of AltaVista, first and second documents were picked up as first and second document respectively. Table 1 shows that the term vector for first document is (0.500,0.500,0.500,0.500) which is same as that of the query. That means the first documents contains all the four terms present in the query and also each term appear in the document same number of times. The dot product of this term vector with that of query is 1.000.The term vector for the second document, on the other hand, is (0.378,0.882,0.252,0.126).
Proceedings of the 4th WSEAS Int. Conf. on Information Security, Communications and Computers, Tenerife, Spain, December 16-18, 2005 (pp429-452)
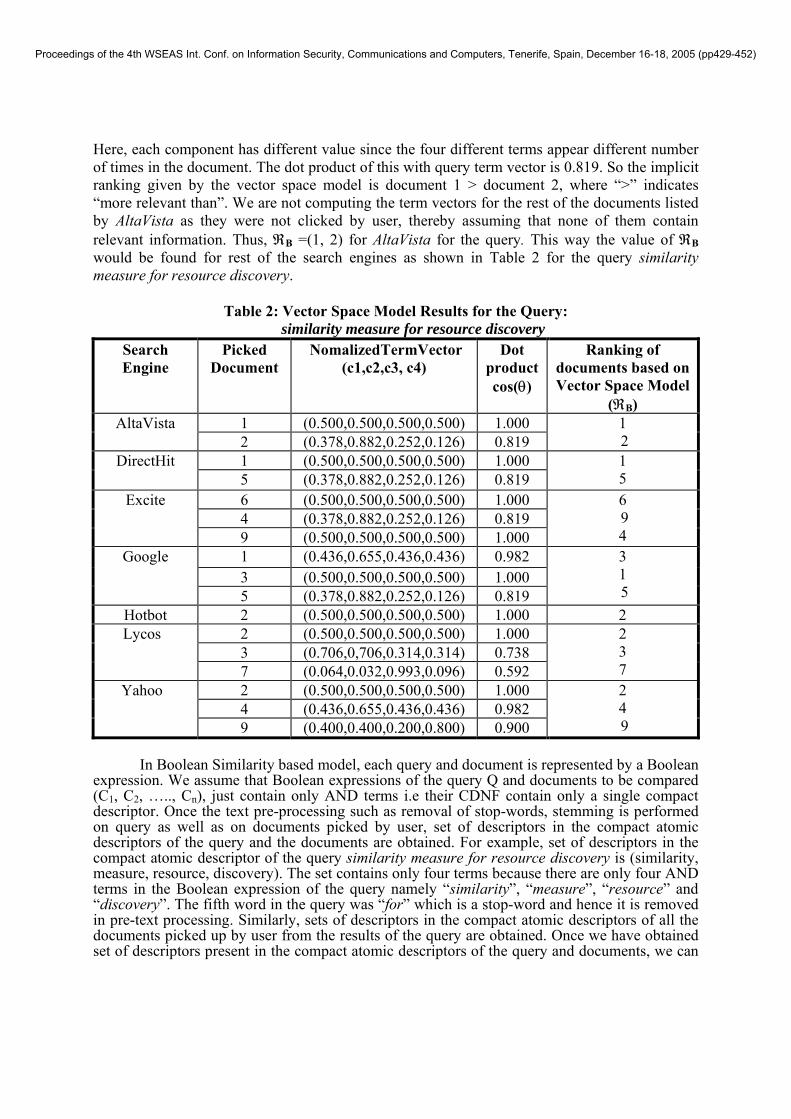
Here, each component has different value since the four different terms appear different number of times in the document. The dot product of this with query term vector is 0.819. So the implicit ranking given by the vector space model is document 1 > document 2, where “>” indicates “more relevant than”. We are not computing the term vectors for the rest of the documents listed by AltaVista as they were not clicked by user, thereby assuming that none of them contain relevant information. Thus, ℜB =(1, 2) for AltaVista for the query. This way the value of ℜB would be found for rest of the search engines as shown in Table 2 for the query similarity measure for resource discovery.
Table 2: Vector Space Model Results for the Query:
similarity measure for resource discovery Search Engine
Picked Document
NomalizedTermVector (c1,c2,c3, c4)
Dot productcos(θ)
Ranking of documents based on Vector Space Model
(ℜB) 1 (0.500,0.500,0.500,0.500) 1.000 AltaVista 2 (0.378,0.882,0.252,0.126) 0.819
1 2
1 (0.500,0.500,0.500,0.500) 1.000 DirectHit 5 (0.378,0.882,0.252,0.126) 0.819
1 5
6 (0.500,0.500,0.500,0.500) 1.000 4 (0.378,0.882,0.252,0.126) 0.819
Excite
9 (0.500,0.500,0.500,0.500) 1.000
6 9 4
1 (0.436,0.655,0.436,0.436) 0.982 3 (0.500,0.500,0.500,0.500) 1.000
5 (0.378,0.882,0.252,0.126) 0.819
3 1 5
Hotbot 2 (0.500,0.500,0.500,0.500) 1.000 2 2 (0.500,0.500,0.500,0.500) 1.000 3 (0.706,0,706,0.314,0.314) 0.738
Lycos
7 (0.064,0.032,0.993,0.096) 0.592
2 3 7
2 (0.500,0.500,0.500,0.500) 1.000 4 (0.436,0.655,0.436,0.436) 0.982
Yahoo
9 (0.400,0.400,0.200,0.800) 0.900
2 4 9
In Boolean Similarity based model, each query and document is represented by a Boolean
expression. We assume that Boolean expressions of the query Q and documents to be compared (C1, C2, ….., Cn), just contain only AND terms i.e their CDNF contain only a single compact descriptor. Once the text pre-processing such as removal of stop-words, stemming is performed on query as well as on documents picked by user, set of descriptors in the compact atomic descriptors of the query and the documents are obtained. For example, set of descriptors in the compact atomic descriptor of the query similarity measure for resource discovery is (similarity, measure, resource, discovery). The set contains only four terms because there are only four AND terms in the Boolean expression of the query namely “similarity”, “measure”, “resource” and “discovery”. The fifth word in the query was “for” which is a stop-word and hence it is removed in pre-text processing. Similarly, sets of descriptors in the compact atomic descriptors of all the documents picked up by user from the results of the query are obtained. Once we have obtained set of descriptors present in the compact atomic descriptors of the query and documents, we can
Proceedings of the 4th WSEAS Int. Conf. on Information Security, Communications and Computers, Tenerife, Spain, December 16-18, 2005 (pp429-452)
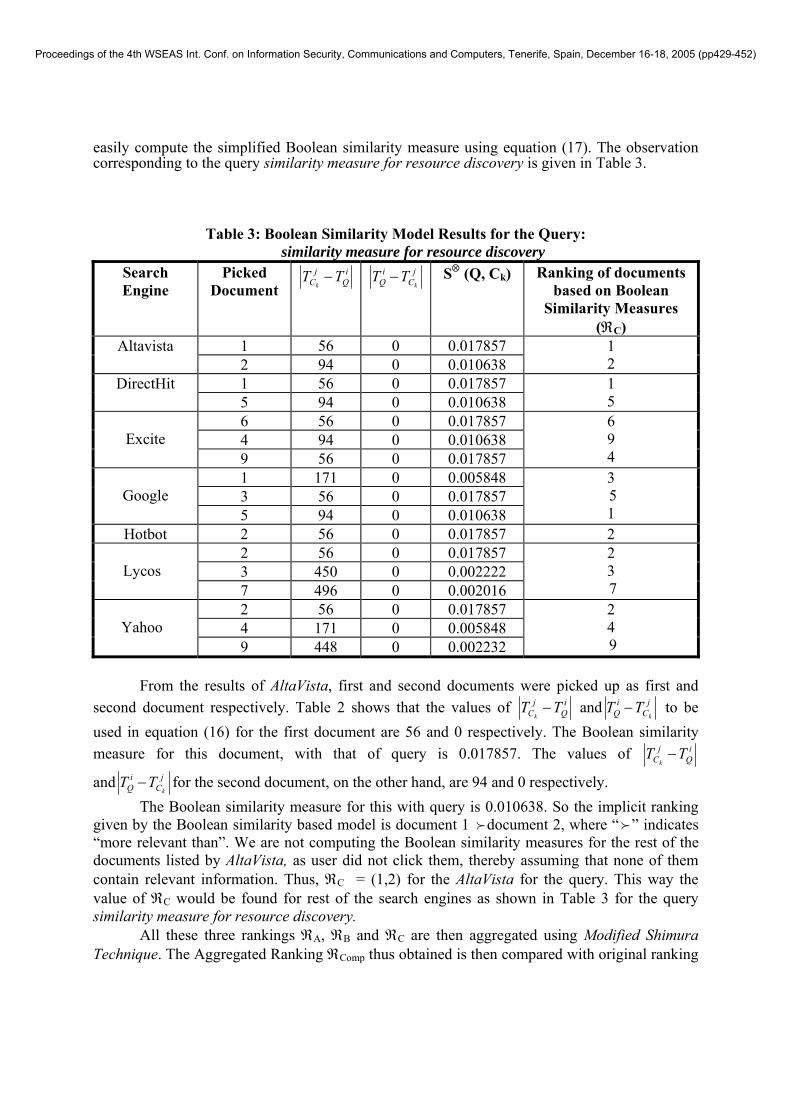
easily compute the simplified Boolean similarity measure using equation (17). The observation corresponding to the query similarity measure for resource discovery is given in Table 3.
Table 3: Boolean Similarity Model Results for the Query: similarity measure for resource discovery
Search Engine
Picked Document
iQ
jC TT
k−
jC
iQ k
TT −
S⊗ (Q, Ck) Ranking of documents based on Boolean
Similarity Measures (ℜC)
1 56 0 0.017857 Altavista 2 94 0 0.010638
1 2
1 56 0 0.017857 DirectHit 5 94 0 0.010638
1 5
6 56 0 0.017857 4 94 0 0.010638
Excite
9 56 0 0.017857
6 9 4
1 171 0 0.005848 3 56 0 0.017857
5 94 0 0.010638
3 5 1
Hotbot 2 56 0 0.017857 2 2 56 0 0.017857 3 450 0 0.002222
Lycos
7 496 0 0.002016
2 3 7
2 56 0 0.017857 4 171 0 0.005848
Yahoo
9 448 0 0.002232
2 4 9
From the results of AltaVista, first and second documents were picked up as first and
second document respectively. Table 2 shows that the values of iQ
jC TT
k− and j
Ci
Q kTT − to be
used in equation (16) for the first document are 56 and 0 respectively. The Boolean similarity measure for this document, with that of query is 0.017857. The values of i
Qj
C TTk
−
and jC
iQ k
TT − for the second document, on the other hand, are 94 and 0 respectively. The Boolean similarity measure for this with query is 0.010638. So the implicit ranking
given by the Boolean similarity based model is document 1 fdocument 2, where “f ” indicates “more relevant than”. We are not computing the Boolean similarity measures for the rest of the documents listed by AltaVista, as user did not click them, thereby assuming that none of them contain relevant information. Thus, ℜC = (1,2) for the AltaVista for the query. This way the value of ℜC would be found for rest of the search engines as shown in Table 3 for the query similarity measure for resource discovery.
All these three rankings ℜA, ℜB and ℜC are then aggregated using Modified Shimura Technique. The Aggregated Ranking ℜComp thus obtained is then compared with original ranking
Proceedings of the 4th WSEAS Int. Conf. on Information Security, Communications and Computers, Tenerife, Spain, December 16-18, 2005 (pp429-452)
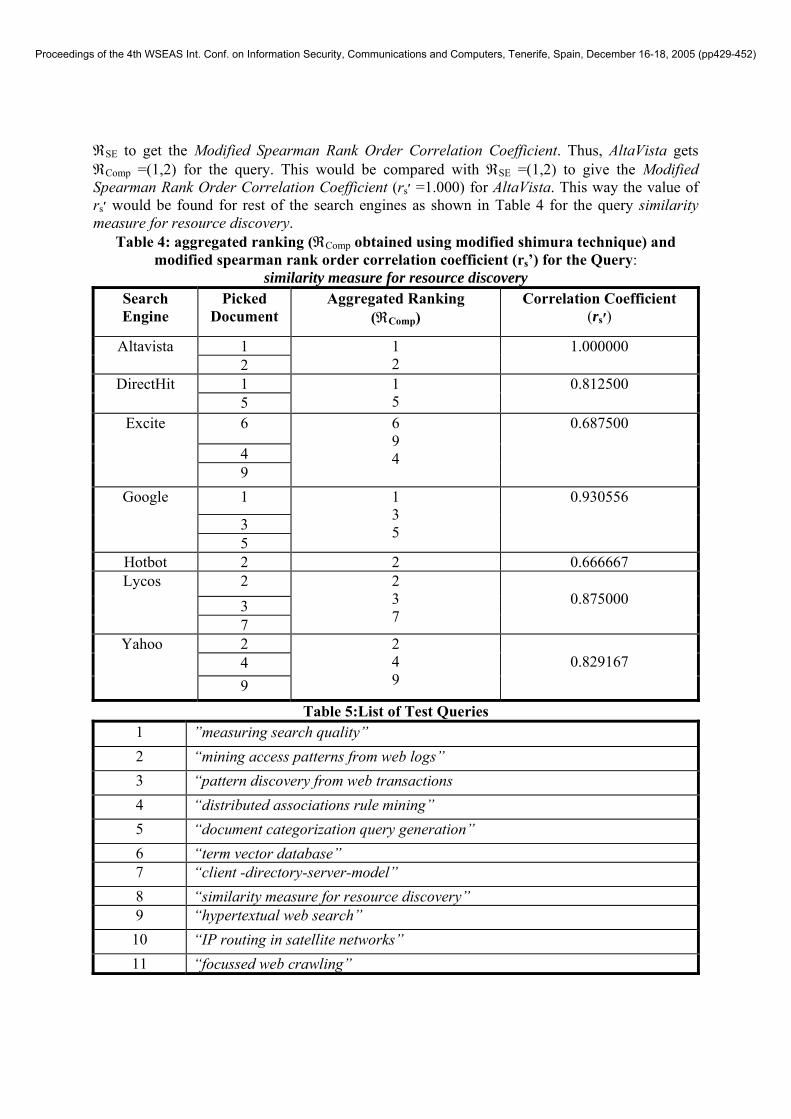
ℜSE to get the Modified Spearman Rank Order Correlation Coefficient. Thus, AltaVista gets ℜComp =(1,2) for the query. This would be compared with ℜSE =(1,2) to give the Modified Spearman Rank Order Correlation Coefficient (rs1.000= ׳) for AltaVista. This way the value of rs׳ would be found for rest of the search engines as shown in Table 4 for the query similarity measure for resource discovery.
Table 4: aggregated ranking (ℜComp obtained using modified shimura technique) and modified spearman rank order correlation coefficient (rs’) for the Query:
similarity measure for resource discovery Search Engine
Picked Document
Aggregated Ranking (ℜComp)
Correlation Coefficient (rs׳)
1 Altavista 2
1 2
1.000000
1 DirectHit 5
1 5
0.812500
6
4
Excite
9
6 9 4
0.687500
1
3
5
1 3 5
0.930556
Hotbot 2 2 0.666667 2 3
Lycos
7
2 3 7
0.875000
2 4
Yahoo
9
2 4 9
0.829167
Table 5:List of Test Queries 1 ”measuring search quality” 2 “mining access patterns from web logs” 3 “pattern discovery from web transactions 4 “distributed associations rule mining” 5 “document categorization query generation” 6 “term vector database” 7 “client -directory-server-model” 8 “similarity measure for resource discovery” 9 “hypertextual web search”
10 “IP routing in satellite networks” 11 “focussed web crawling”
Proceedings of the 4th WSEAS Int. Conf. on Information Security, Communications and Computers, Tenerife, Spain, December 16-18, 2005 (pp429-452)
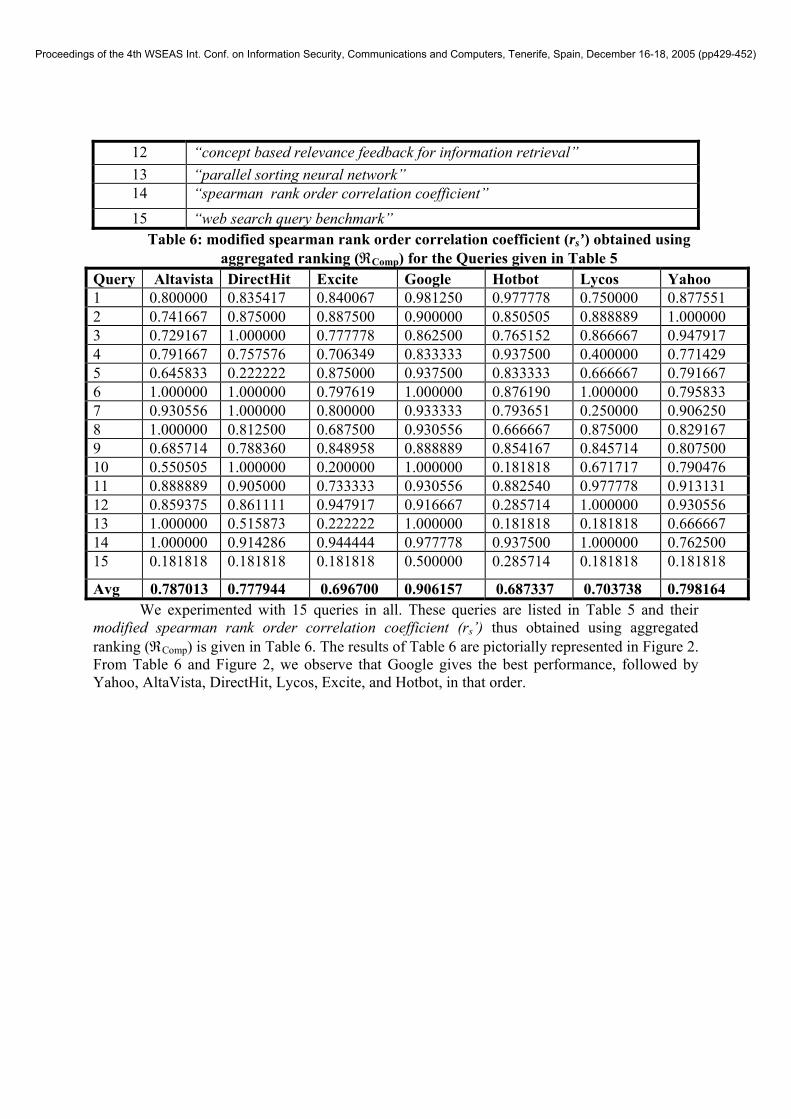
12 “concept based relevance feedback for information retrieval” 13 “parallel sorting neural network” 14 “spearman rank order correlation coefficient” 15 “web search query benchmark”
Table 6: modified spearman rank order correlation coefficient (rs’) obtained using aggregated ranking (ℜComp) for the Queries given in Table 5
Query Altavista DirectHit Excite Google Hotbot Lycos Yahoo 1 0.800000 0.835417 0.840067 0.981250 0.977778 0.750000 0.877551 2 0.741667 0.875000 0.887500 0.900000 0.850505 0.888889 1.000000 3 0.729167 1.000000 0.777778 0.862500 0.765152 0.866667 0.947917 4 0.791667 0.757576 0.706349 0.833333 0.937500 0.400000 0.771429 5 0.645833 0.222222 0.875000 0.937500 0.833333 0.666667 0.791667 6 1.000000 1.000000 0.797619 1.000000 0.876190 1.000000 0.795833 7 0.930556 1.000000 0.800000 0.933333 0.793651 0.250000 0.906250 8 1.000000 0.812500 0.687500 0.930556 0.666667 0.875000 0.829167 9 0.685714 0.788360 0.848958 0.888889 0.854167 0.845714 0.807500 10 0.550505 1.000000 0.200000 1.000000 0.181818 0.671717 0.790476 11 0.888889 0.905000 0.733333 0.930556 0.882540 0.977778 0.913131 12 0.859375 0.861111 0.947917 0.916667 0.285714 1.000000 0.930556 13 1.000000 0.515873 0.222222 1.000000 0.181818 0.181818 0.666667 14 1.000000 0.914286 0.944444 0.977778 0.937500 1.000000 0.762500 15 0.181818 0.181818 0.181818 0.500000 0.285714 0.181818 0.181818
Avg 0.787013 0.777944 0.696700 0.906157 0.687337 0.703738 0.798164 We experimented with 15 queries in all. These queries are listed in Table 5 and their
modified spearman rank order correlation coefficient (rs’) thus obtained using aggregated ranking (ℜComp) is given in Table 6. The results of Table 6 are pictorially represented in Figure 2. From Table 6 and Figure 2, we observe that Google gives the best performance, followed by Yahoo, AltaVista, DirectHit, Lycos, Excite, and Hotbot, in that order.
Proceedings of the 4th WSEAS Int. Conf. on Information Security, Communications and Computers, Tenerife, Spain, December 16-18, 2005 (pp429-452)

0 0.1 0.2 0.3 0.4 0.5 0.6 0.7 0.8 0.9
AltaVista
DirectHit
Excite
HotBot
Lycos
Yahoo
Modified Spearman Rank Correlation Coefficient
Figure 2: Performance of Search Engines based on Aggregated Ranking Model
5 CONCLUSION We have tried to combine the user feedback based subjective evaluation with Vector Space Model and Boolean similarity measure based objective evaluation for the public web search engines. For the subjective measure, we have devised a method that observes the actions of the users on the search results presented before him and then infer his preferences there from. For the objective measure, we have used Vector Space Model and Boolean similarity measures. we have proposed and used the simplified version of Li Danzig Boolean similarity measure for computing the similarity between the query and the documents returned by the search engines. We are aggregating the ranking of documents obtained from these three evaluation processes using Modified Shimura Technique. Our results for 15 queries and 7 public web search engines show that Google gives the best performance, followed by Yahoo, AltaVista, DirectHit, Lycos, Excite, and Hotbot, in that order. 6 REFERENCES [1] Henzinger M. R., Heydon A., Mitzenmacher M. and Najork M., "Measuring Index Quality
Using Random Walks on the Web," Computer Networks, 31, 1999, pp. 1291-1303. [2] Henzinger M. R., Heydon A., Mitzenmacher M. and Najork M., "On Near Uniform URL
Sampling," Proc. 9th International World Wide Web Conference (WWW9),May 2000, pp. 295-308.
[3] Bar-Yossef Z., Berg A., Chien S., Fakcharoenphol J. and Weitz D., "Approximating Aggregate Queries about Web Pages via Random Walks," Proc. 26th Very Large Data Bases (VLDB) Conference, Cairo, Egypt, September 10-14, 2000, pp. 535-544.
[4] Bharat K. and Broder A., "A Technique for Measuring the Relative Size and Overlap of Public Web Search Engines," Proc. 7th International World Wide Web Conference (WWW7), April 1998, pp. 379-388.
Proceedings of the 4th WSEAS Int. Conf. on Information Security, Communications and Computers, Tenerife, Spain, December 16-18, 2005 (pp429-452)

[5] Lawrence S. and Giles C. L., "Searching the World Wide Web," Science, 5360(280), 1998, pp. 98-100.
[6] Lawrence S. and Giles C. L., "Accessibility of Information on the Web," Nature, 400, 1999, pp. 107-109.
[7] Hawking D., Craswell N., Thistlewaite P. and Harman D., "Results and Challenges in Web Search Evaluation," Proc. 8th International World Wide Web Conference (WWW8), May 1999, Toronto, Canada, pp. 1321-1330.
[8] Li L. and Shang Y., "A New Method for Automatic Performance Comparison of Search Engines," World Wide Web: Internet and Web Information Systems, 3, 2000, pp. 241-247.
[9] Shang Y. and Li L., "Precision Evaluation of Search Engines," World Wide Web: Internet and Web Information Systems, 5, 2002, pp. 159-173.
[10] Weisstein E. W. "Spearman Rank Correlation Coefficient" From MathWorld – A Wolfram Web Resource, © 1999-2004 Wolfram Research, Inc. http://mathworld.wolfram.com/SpearmanRankCorrelationCoefficient.html
[11] Beg M. M. S., "On Measurement and Enhancement of Web Search Quality," Ph.D. thesis submitted to the Department of Electrical Engineering, I. I. T. Delhi, 2002.
[12] Porter M., "An Algorithm for Suffix Stripping," Program: Automated Library and Information Systems, 14(3), 1980, pp. 1980.
[13] Salton G. & McGill M. J., “Introduction to modern information retrieval,” McGraw Hill, 1983.
[14] Li S.H. and Danzig P.B., “Boolean similarity measures for resource discovery,” IEEE Trans. on Knowledge and Data Engineering, volume 9,No. 6, 1997, pp. 863-876
[15] Li S.H. and Danzig P.B., “Boolean similarity measures for resource discovery,” Technical Report, USC-CS-94-579 (Computer Science Department, University of South California, Los Angeles) 1994
[16] M. Shimura, "Fuzzy Sets Concept in Rank-Ordering Objects," J. Math. Anal. Appl., vol. 43 pp. 717-733, 1973.
[17] R. R. Yager, "On Ordered Weighted Averaging Aggregation Operators in Multicriteria Decision Making," IEEE Trans. Systems, Man and Cybernetics, vol. 18, no. 1,January/February 1988.
Proceedings of the 4th WSEAS Int. Conf. on Information Security, Communications and Computers, Tenerife, Spain, December 16-18, 2005 (pp429-452)