agile in practice, a systemic approach
TRANSCRIPT
Agile in practice, a systemic approach
Alvaro Ruiz de Mendarozqueta1, Fabio O. Bustos2 and Pedro E. Colla3
1 [email protected], [email protected], 3 [email protected]
Universidad Tecnológica Nacional – Regional Córdoba1
Córdoba – Córdoba - Argentina
Abstract. The relationship between software engineering practices and agile fundamentals are explored. The con-
tents of the Agile Manifesto state several principles such as a focus on working software, customer satisfaction, and
simplicity among others. This paper explores how agile creates value at a fundamental level by introducing the
capability for the organization to take continuously decisions, which are modelled as options. And how this addi-
tional value can be eroded by having deviation on classical software engineering parameters, such as Cost of Poor
Quality or Phase Containment of errors.
Additional focus on traditional software engineering best practices are proposed as the best way to achieve the
benefits of the Agile paradigm is by combining it with mature engineering practices. Those practices are well known
in the industry and academia. There are different sources that can be searched like SWEBOK and CMMI. As CMMI
is organized in maturity levels the model can guide the engineering practices adoption.
Keywords: Agile, System Modelling, Software Engineering, Real Option Value
1 Background
Given the known problems of traditional software development such as massive delays, products that
did not fulfill its purpose adequately after years of development and cost overruns, a group of pioneers
thought of a radical paradigm shift. The traditional paradigm tries to establish the requirements compre-
hensively at the beginning of the project, whose duration is fixed, and then to estimate, based on the devel-
opment plan, the effort, the necessary resources, and the schedule to be fulfilled.
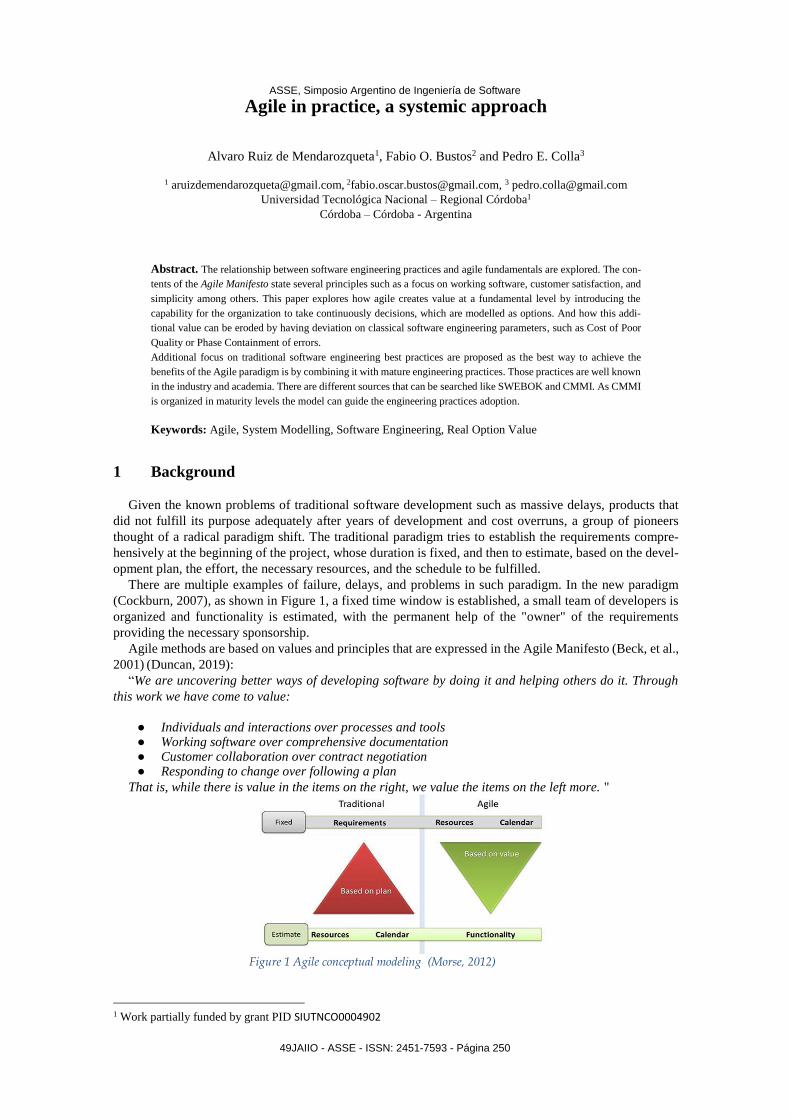
There are multiple examples of failure, delays, and problems in such paradigm. In the new paradigm
(Cockburn, 2007), as shown in Figure 1, a fixed time window is established, a small team of developers is
organized and functionality is estimated, with the permanent help of the "owner" of the requirements
providing the necessary sponsorship.
Agile methods are based on values and principles that are expressed in the Agile Manifesto (Beck, et al.,
2001) (Duncan, 2019):
“We are uncovering better ways of developing software by doing it and helping others do it. Through
this work we have come to value:
● Individuals and interactions over processes and tools ● Working software over comprehensive documentation ● Customer collaboration over contract negotiation ● Responding to change over following a plan
That is, while there is value in the items on the right, we value the items on the left more. "
Figure 1 Agile conceptual modeling (Morse, 2012)
1 Work partially funded by grant PID SIUTNCO0004902
ASSE, Simposio Argentino de Ingeniería de Software
49JAIIO - ASSE - ISSN: 2451-7593 - Página 250

2
The manifesto is complemented by 12 principles that highlight fundamentals such as customer integra-
tion in the development process, ownership by the entire team of everything that is produced, and a sus-
tainable pace of work.
Agile implementation landscape
Despite receiving XP most of the bibliographic attention, Organizations are increasingly focusing their
attention on the agile methodology called SCRUM (Schwaber, et al., 2013), which addresses the problem
of the evolutionary development of applications; this problem represents a significant part of the resources
of the software development industry, which explains much of the interest in this methodological approach.
The SCRUM methodology is shown schematically by Figure 2.
Figure 2 Agile (SCRUM) typical cycle (Schwaber, et al., 2013)
The requirements to be developed, called "user stories", are divided into groups according to their rela-
tive priority and then implemented in cycles of relatively short duration with fixed allocation of effort (from
two weeks up to two months but with preference to the shortest, using teams from four to eight members
approximately) called "sprints". The tasks are organized in the team in such a way that the assignments and
priorities are reviewed daily in a brief meeting called "daily scrum". In this approach, the main Manifesto
criteria are followed by obtaining incremental partial releases of the product under development. Teams are
encouraged to embrace a reduced set of metrics such as the velocity, amount of work the team can tackle at
the end of the sprint, and some measure of the remaining backlog but little encouraging is made to collect,
analyze and manage other metrics related to the process performance (Kunz, et al., 2008) and/or product
quality.
The evidence generated by industrial experience is consistent in showing that, by embracing the roadmap
and committing the necessary investments to formally deploy the SCRUM methodology, key aspects of
the deployment of mature process practices are addressed at the same time.
In this sense, SCRUM has been successfully compared against the requirements to be met in order to
achieve an evaluation under levels 2 and 3 of the reference model SEI-CMMI ™ (Alegrìa, et al., 2007)
(Fritzche & Keil, 2007) (Shuterland, et al., 2008) (Turner, et al., 2002) (Glazer, et al., 2008) (Fritzche, et al.,
2007) demonstrating that rigorous execution satisfies most of the objectives necessary to obtain these lev-
els; the few process areas not directly covered, by not being required by SCRUM, are in practice a require-
ment for the correct performance of an organization dedicated to the construction of software, such as
configuration management practices (Appleton, et al., 2005), which should be adopted anyway. Maller
ASSE, Simposio Argentino de Ingeniería de Software
49JAIIO - ASSE - ISSN: 2451-7593 - Página 251
3
(Maller, et al., 2004) discussed a map where the requirements for an organization to operate at SEI-
CMMITM Level 5 can be achieved by using Agile in general and SCRUM in particular. Other authors high-
light the adaptations needed to perform SCRUM with geographically dispersed off-shore teams (Vishal, et
al., 2007) (Banerjee, et al., 2011) (Sauer, 2005). Since then, practical experience in Argentina on several
organizations achieving SEI-CMMI Level 5 using agile development as the main methodology has been
fulfilled (Mendarozqueta, et al., 2014), all authors has been academically and professionally involved in
such endeavor at different organizations.
For the purposes of this paper, this experience provides the conceptual framework to assume that an
organization that deploys SCRUM embraces most of the generic and specific practices required by levels
2 and 3 of SEI-CMMI ™ (Marcal, et al., 2008), and therefore can aspire to its benefits. This factor is
particularly attractive given the relatively low organizational effort and investment needed to deploy and
institutionalize SCRUM compared with other methodological alternatives.
Organizations are then naturally willing to grasp the perceived value of performing software projects
using agile methods in general and SCRUM in particular (Schwaber, et al., 2013). Mukker discussed some
typical metrics obtained on evaluated projects (Mukker, et al., 2014) demonstrating ways to deploy excel-
lence and improvement paths into an existing SCRUM practice. However, the value might be elusive to
obtain. The media reports a survey where an estimation that 12% of the projects fail completely and as
much as 1/3 of them are unable to fulfill all the project expectations (Ismail, 2016) (Bhasin, 2012). Among
the reasons geographical dispersion, culture issues, CIO’s ability to bring up the change into the organiza-
tion, lack of planning and architecture issues. About 2/3 of the project failures can be accounted to technical
reasons and architecture mismatches. Miller (Miller, 2013),on a PMI sponsored conference, identifies as
reasons for failure the lack of application of well-known disciplines, usually associated with Software En-
gineering best practices, driving projects into failure patterns usually associated with more traditional meth-
odologies; in particular, lack of backlog management, improper defect management, configuration man-
agement issues, and team skill deficiencies. It’s a matter of interest to preliminary explore strategies to
avoid such project failures or to mitigate them into a healthier balance between available resources, calen-
dar, functionality delivered and projected value of the project.
Although the bibliography shows consistent reports of success in the application of agile methodologies
in general, and SCRUM in particular, to the solution of projects of different sizes and complexities, there
are very few research efforts into addressing the evaluation of the value contributed by the methodology,
being its application based primarily on intuition and obtained empirical results reported by the same or-
ganizations, especially in small and medium enterprises (Caballero, et al., 2011).
Missing the value perspective into the management of a SCRUM effort might lead for causes of value
destruction to creep excessively into the project, up and beyond the point where the value lost outweighs
the value gained by the methodology.
The contribution of this article is to explore factors contributing to value creation and destruction asso-
ciated with SCRUM, and proposing some necessary instruments to begin to address the research question
on whether the use of SCRUM derives in greater value for the organization, as well as to explore the con-
ceptual reasons for what happens and some sensible ways to protect it.
By validating the proposal through simulation it is also possible to suggest tentative values for the main
parameters involved and to obtain the preliminary magnitude of the expected results.
2 Systemic modeling of the Agile methodologies value
In his landmark book (Weinberg, 1992), Gerald Weinberg states that a systemic view and system mod-
elling for software management and steering patterns, is needed for coping the traditional software devel-
opment problems.
A previously developed model to explore the value of SCRUM (Colla, 2012) (Colla, 2016) will be
adapted and used to preliminary assess the impact from the performance of process parameters usually
ASSE, Simposio Argentino de Ingeniería de Software
49JAIIO - ASSE - ISSN: 2451-7593 - Página 252

4
recommended by Software Engineering best practices such as the productivity, cost of poor quality, avoid-
ance of injecting value into defects and phase containment of errors. The assumption using to model this
scenario is that the usage of SCRUM creates value thru two different, albeit complementary, mechanisms.
The adoption of mature practices preserves the value of the project by minimizing deviation with the
business scenarios in terms of cost and calendar. This aims to achieve the overall balance of income and
expenditure as well as optimizing other organizational and intangible factors typically factored into the
opportunity cost used to discount cash flows, in this way the value can be measured by using the Net Present
Value (NPV) of the project flows. The analysis tries to grasp the value for the organization from an invest-
ment standpoint as it considers the cash flow and the risk to materialize them from an a-priori point of view.
Simultaneously, the possibility to prioritize requirements over time in a way that enhances almost con-
tinuously the value proposition of the organization configures options, which can be valued using the Real
Option Valuation methods (Brealey, et al., 2016) (Mun, 2002).
Figure 3 Systemic cause-effect model diagram
A systemic model has been adapted to study the problem discussed in this article (see Figure 3) from
previous efforts (Colla, 2012) (Colla, 2016) to focus on system dependent variables of interest of the scope
of this article and avoid the complexities of the full model.
The overall relationship among systemic variables can be expressed as a cause-effect model such as the
one seen in the Figure 3 where the two main contributors to the overall value, the Net Present Value (NPV)
and the Option Price Value (OPV) are established as dependent variables of several independent variables
defined by the industry and organizational context as well as the decisions taken and results obtained during
the project execution. The cause-effect model used represent independent variables defined by the organi-
zation outside the scope of the model as hexagons, with circles organizational factors represented by some
assumed distribution and with boxes intermediate variables with some systemic relation with the rest. Fi-
nally, the target utility result is represented as a diamond.
ASSE, Simposio Argentino de Ingeniería de Software
49JAIIO - ASSE - ISSN: 2451-7593 - Página 253
5
The factors used and the relations assumed on the model will be explained with further detail in the
following sections.
2.1 Net present value of the project
The requirements flow (Rt), assumed as independent from the project and defined by the organization
context, operational definitions and strategical plans, are subject to a size (Size) evaluation; a suitable
method can be used in this evaluation to capture both extension and complexity (Matson, et al., 1994)
(Hummel, et al., 2013). SCRUM teams usually use story points with similar purposes (Mahnic, 2012).
Typically, the technology used, the business complexity, the tools involved and the detailed technical meth-
odologies used configures an organizational productivity () which can then be used to estimate the overall
project effort (E) needed to satisfy all requirements of a given scope. The productivity is strongly related to
the level of performance maturity exhibited by the organization, which is measured by using the SEI-
CMMITM reference model (Clark, 2000). The organization decides then on the staff (Staff) which would
allocate to address the requirements and the typically fixed extension of the sprints (ts). With this infor-
mation, the number of sprints (N) and the maximum effort (Ei) of each one can be planned.
A suitable correlation between story points, the standard size and complexity measurement used in
SCRUM planning, and size is assumed to be computed by statistical methods. The CMMI level (CMMI) is
factored then as an organizational decision on the level of maturity to operate which will influence most of
the process performance factors. For the purposes of this work, it’s assumed that the proper usage of the
SCRUM methodology levels the organization with a maturity equivalent to SEI-CMMITM level 3.
Once a given sprint is started as much technical effort (Et) as possible is allocated to transform require-
ments into actual code. This amount is limited by several factors though, for a given technical context, the
organization would generate errors as the code is written which will be identified as defects when the code
is tested, a proportion of the effort needed to rework can be given by the organizational cost of poor quality
(CoPQ), which is a factor capturing which proportion of the technical effort is actually applied rework effort
(Ecopq), Knox (Knox, 1993) discussed a strong correlation between the increase in the maturity level as
measured by the SEI-CMM TM model (Humphrey, 1989), (Team, 2010) and the reduction of this factor.
Variations between planned and actuals can be evaluated using the ratio between both for schedule and
cost, named schedule performance index (SPI) and cost performance index (CPI), which are typical project
management measurements. Both values go below one when actuals are smaller than the plan (usually a
good condition) and above one when otherwise (usually a condition to avoid). Lawlis (Lawlis, et al., 1995)
studied the correlation between the maturity level of an organization, also measured using the SEI-CMM
level, and the distribution of both the SPI and CPI. The distribution goes closer to the unity and less disperse
as the organization maturity goes higher meaning that, as the organization operates on a more mature way,
it’s less likely to miss the project planning parameters.
The usage of SEI-CMMI (TM) is used with the purpose of seizing the results of applying sound Software
Engineering practices, the SEI-CMMI (TM) model can be used by an organization as a roadmap to implement
them and grasping the benefits in terms of maturity, without necessarily embrace a formal assessment
roadmap.
Therefore, as estimated and actual technical effort vary, additional effort variations (Ecpi) needs to be
accounted for. As the team size is fixed, the amount of effort available (Ei) on a given sprint is fixed and
quite inflexible, so essentially, all unexpected factors erode from the team capacity to deliver actual tech-
nical work. Therefore, as the sprint is finished, the planned scope of technical work might not be completed
and pending rework is left to be satisfied at some future sprint. All effort estimated to complete the planned
scope and execute the identified rework and other activities carried over future sprints is called the technical
debt (Etd) of the process; and it is assumed that it represents prioritized business requirements that need to
be added to the backlog and addressed at the earliest opportunity. Two additional factors need to be ac-
counted for. In one hand, the capability of the team to spot all defects is limited by the methodologies used;
the maturity level of the organization as measured by the SEI-CMMITM (Team, 2010) model is reported to
significantly improve this capability (Goldenson, et al., 2006) (Hallowell, D.L., 2003)but it never achieves
100% of all defects A factor named phase containment of errors (PCE) can help to identify the proportions
of defects which can be identified as part of the normal verification and validation activities of a given
ASSE, Simposio Argentino de Ingeniería de Software
49JAIIO - ASSE - ISSN: 2451-7593 - Página 254

6
cycle. This concept, which is part of the management of life cycle models in classical Software Engineering,
is also applicable to SCRUM. Although the notion of a phase might seem strange in the context of an agile,
continuous, lifecycle, a factor equivalent to PCE is introduced, which is sometimes called iteration con-
tainment effectiveness (ICE) as identified by Sandu and Salceanu (Sandu, et al., 2018). This factor reflects
the fact that, in any given sprint, in addition to the faults detected and solved within the sprint, there are
defects that were introduced in previous sprints and remain undetected till a future sprint. For the remaining
of this paper, we will keep the classical PCE denomination for the sake of clarity. Therefore, the defects
that are passed undetected from one sprint to the following ones would eventually need to be addressed at
a greater cost, modelled as a cost increase factor (K), that if were detected in the same cycle where they
were introduced, following a classical value model, would have added to the defect waste (Vijay, et al.,
2014), the effort required is considered in the model as the effort to address escaped defects (Epce). Lee &
Xia investigated (Lee, et al., 2010) some of the relationships among different factors which are used to
perform an initial calibration of the model. Finally, the extra effort introduced by different venues would
require the organization to either cut the original scope or to extend the project. Assuming the latter, addi-
tional planning effort (Ep) will be needed to perform additional ceremonies related to the prioritization of
the backlog for the additional sprints introduced to complete the scope originally planned with the planned
level of defects. For any given sprint, the total fixed sprint effort would then represent the equilibrium of
all factors with any excess effort to be added at the next sprint as technical debt to be addressed as given
by Ec. 1 which represents the sum of all aspects requiring effort application during a given SCRUM cycle.
𝐸𝑖 = 𝐸𝑡 + 𝐸𝑐𝑜𝑝𝑞 + 𝐸𝑐𝑝𝑖 + 𝐸𝑝 + 𝐸𝑝𝑐𝑒 + 𝐸𝑡𝑑
Ec. 1
In general terms, only the technical effort adds value to the business, as it transforms requirements into
code, delivering value for the organization when executed. Therefore, the rest of the terms, no matter how
necessary they are, can be assumed as destroying value and a good management practice would be to elim-
inate them, and if not possible, to substantially reduce its amount to the minimum. The overall cost of the
project would be the aggregation of the costs of each sprint at its finalization calendar (ti), typically meas-
ured from the start of the project to help account for financial evaluations. As the value fades away when
pushed into the future, because of financial considerations it can be transferred to the start of the project as
the present value of the cost (CPV) which is obtained by discounting the resulting cash flows involved at
each sprint by the opportunity cost (r) which represent both the time premium and the risk premium in
equilibrium for the nature of the organization’s operating context at as given by Ec. 2 which is just the cash
flow produced by the effort expended on a given SCRUM cycle discounted at the opportunity cost used by
the organization (Brealey, et al., 2016):
𝐶𝑃𝑉 = ∑𝐶𝑃𝐸 × 𝐸𝑖
(1 + 𝑟)𝑡𝑖
𝑛
𝑖=1
Ec. 2
The average cost per engineer (CPE) is assumed constant for an organization and used as a suitable
conversion factor between effort and cash flows, assuming the majority of the costs are directly driven by
the manpower, which usually is the case.
To factor the project results, the expected business return after the implementation is also needed. This
value is very hard to model because it might contain both tangible and non-tangible factors, however the
organization should be assumed to be using a rational decision process, and, as such, it would expect a
present value of the business results to equal or exceed those of the costs, perhaps with some investment
premium (G%), so referring all values to the start of the project using the present values the net present
value (NPV) is obtained as Ec. 3 which is a resort to express the net present value of the project without
discussing the complexities of the different business models from the income perspective retaining the
perspective of the cost expenditure perspective only.
ASSE, Simposio Argentino de Ingeniería de Software
49JAIIO - ASSE - ISSN: 2451-7593 - Página 255

7
𝑁𝑃𝑉 = (1 + 𝐺%)𝐶𝑃𝑉 − 𝐶𝑃𝑉 = 𝐺%𝐶𝑃𝑉 Ec. 3
In the extreme, which is the present value of expenditures and income to be equal, the condition NPV=0
is obtained and can be considered as the equilibrium for the project to be financially viable and therefore
interesting for the organization.
2.2 Real Option Value of the project
Options are financial instruments which attempts to capture the value obtained from retaining the right
to defer decisions for a later moment; those decisions might be to continue, alter, or abandon a given in-
vestment; the value of the options is increased when the project is performed under uncertainty of the out-
come of one or more factors driving the results; the options then model the inherent value of retaining the
possibility to alter the project outcome by managing the factors and taking decisions while the associated
activities evolve. Options are typically defined by the initial value (spot price), the exercise value (strike
price), the option class (European or American styles), and their finalization schedule. The pure financial
instrument can be associated to actual projects applied outside a financial context, in this case are called
real options and allow to defer decisions on a project, implying to abandon, grow, reduce, contract or per-
form management decisions in general. Either class options are valuable when uncertainty exists and, as a
result of it, the outcome of the project might vary.
The option value differs from the inherent risk associated with an operation, which is best captured by
the opportunity cost at which the organization discount their cash flows (Hung, et al., 2010), therefore,
when the uncertainty is eliminated, the value of the option converges to zero, and the global value of the
project becomes the one predicted by the net present value.
Black & Scholes (Black, et al., 1973) proposed a model to evaluate the value yield of an option; this
method is best used on financial applications but can be extended to any kind of project. The model as-
sumptions derive on it to be best suited to evaluate a continuous decision process where actions can be
taken at any arbitrary continuous timeframe. When the decisions can be taken at discrete intervals, such at
the end of each sprint in the case of SCRUM, the Lattice method (Mun, 2002) is preferred; the analysis
performed can be seen at Figure 4
Figure 4 Binary decision tree (Lattice frame)
The option pricing value (OPV), which is the value of the option, is computed recursively and represents
the total value added to the project by the management performed during the execution. To compute it, a
binary tree is created starting from an initial stage (S0), and branching as each decision can be taken, the
overall project then can be visualized as a given trajectory within the tree. In the case of SCRUM, each
node can be assimilated as the planning ceremonies at the start of each sprint where the priorities of the
activities to be made are based on the updated business context. At each node a decision might push an
“ascendant” (u) trajectory or a “descendent” (d) one, representing the values associated with success or
failure. At each node the ascendant or descendent values can be obtained by Ec. 4,Ec. 5,Ec. 6,Ec. 7 and Ec.
8.
0S
uS1
dS1
uS2
u
nS 1
u
nS
1nV0V
ASSE, Simposio Argentino de Ingeniería de Software
49JAIIO - ASSE - ISSN: 2451-7593 - Página 256
8
𝑆𝑖+1𝑢 = 𝑢. 𝑆𝑖
Ec. 4
𝑆𝑖+1𝑑 = 𝑑. 𝑆𝑖
Ec. 5
𝑢 = 𝑒𝜎√𝛿𝑡 Ec. 6
𝑑 = 𝑒−𝜎√𝛿𝑡 =1
𝑢
Ec. 7
𝑝 =𝑒𝑟𝑓𝛿𝑡 − 𝑑
𝑢 − 𝑑
Ec. 8
The Lattice methodology to evaluate the price of a Real Option Value is standard, due to space re-
strictions it will not be reproduced here, and can be reviewed at the bibliography (Mun, 2002).
The discrete time interval (δt) is the time between successive opportunities to exercise the option or in
general to define a course of action. The risk free discount rate (rf) is the time premium component of the
opportunity cost and the process volatility (σ) is a non-dimensional magnitude representing the uncertainty
surrounding the project outcome, a previous research effort suggested a preliminary value for this magni-
tude at typical software development projects which will be used in this model effort (Colla, 2012).
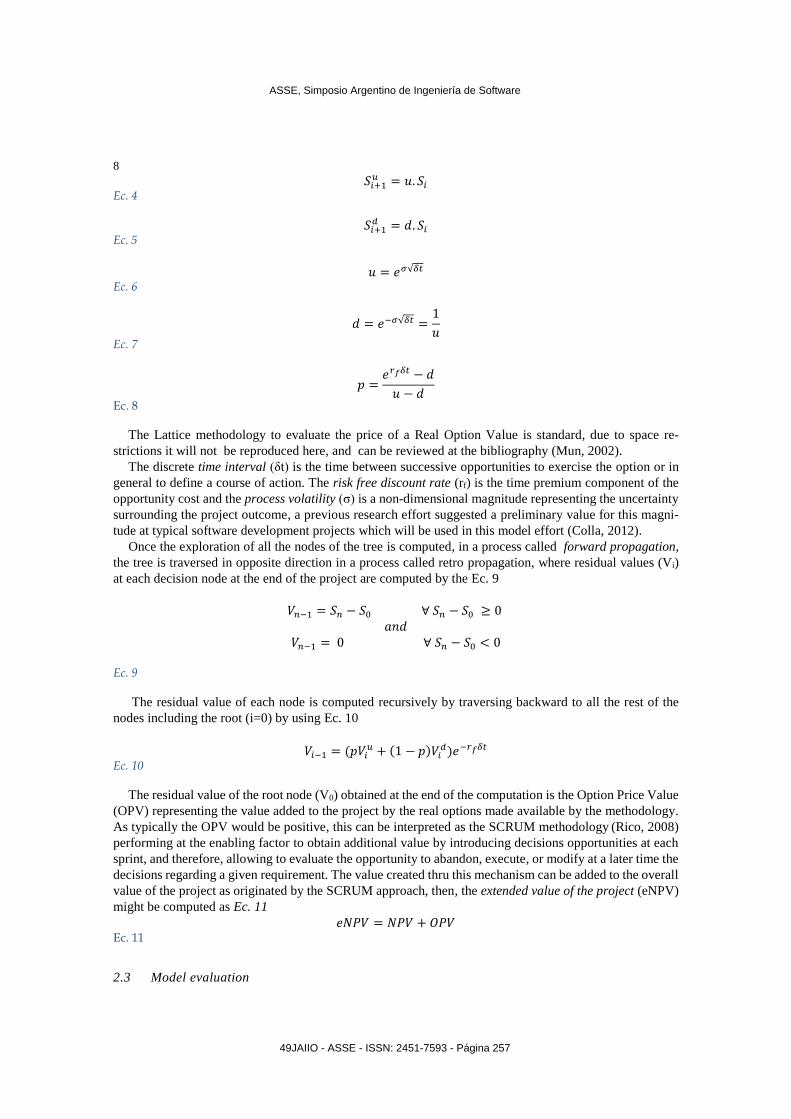
Once the exploration of all the nodes of the tree is computed, in a process called forward propagation,
the tree is traversed in opposite direction in a process called retro propagation, where residual values (Vi)
at each decision node at the end of the project are computed by the Ec. 9
𝑉𝑛−1 = 𝑆𝑛 − 𝑆0 ∀ 𝑆𝑛 − 𝑆0 ≥ 0 𝑎𝑛𝑑
𝑉𝑛−1 = 0 ∀ 𝑆𝑛 − 𝑆0 < 0
Ec. 9
The residual value of each node is computed recursively by traversing backward to all the rest of the
nodes including the root (i=0) by using Ec. 10
𝑉𝑖−1 = (𝑝𝑉𝑖𝑢 + (1 − 𝑝)𝑉𝑖
𝑑)𝑒−𝑟𝑓𝛿𝑡 Ec. 10
The residual value of the root node (V0) obtained at the end of the computation is the Option Price Value
(OPV) representing the value added to the project by the real options made available by the methodology.
As typically the OPV would be positive, this can be interpreted as the SCRUM methodology (Rico, 2008)
performing at the enabling factor to obtain additional value by introducing decisions opportunities at each
sprint, and therefore, allowing to evaluate the opportunity to abandon, execute, or modify at a later time the
decisions regarding a given requirement. The value created thru this mechanism can be added to the overall
value of the project as originated by the SCRUM approach, then, the extended value of the project (eNPV)
might be computed as Ec. 11
𝑒𝑁𝑃𝑉 = 𝑁𝑃𝑉 + 𝑂𝑃𝑉 Ec. 11
2.3 Model evaluation
ASSE, Simposio Argentino de Ingeniería de Software
49JAIIO - ASSE - ISSN: 2451-7593 - Página 257
9
In order to take into account the complex factor interaction on a given sprint and the value coupling of
different sprints, the results of the model at Figure 3 can be approximated by using Monte-Carlo based
discrete simulation techniques. The strategy to implement the model would consider the external and pro-
cess-dependent factors as random variables obeying an assumed distribution. The results distribution of the
target variables can be observed, a qualitative behavior inferred and relations between factors observed and
interpreted. The utility function used is the extended value of the project (eNPV). Then, the dependency of
the outcome with factors which the bibliography considers as subjects to be managed by the application of
Software Engineering best practices is of particular interest of this work, and therefore the correlation
among them is inspected with further detail. As such, the influence of the cost of poor quality, phase con-
tainment of errors, the additional effort needed to fix escaped defects, the productivity and the planning
efficiency are evaluation targets. Other external factors that influence the outcome of the target variables
such as Cost per Engineer, opportunity cost or risk-free discount values are assumed as some fair average
value to avoid interferences from factors outside the scope of the development project management and
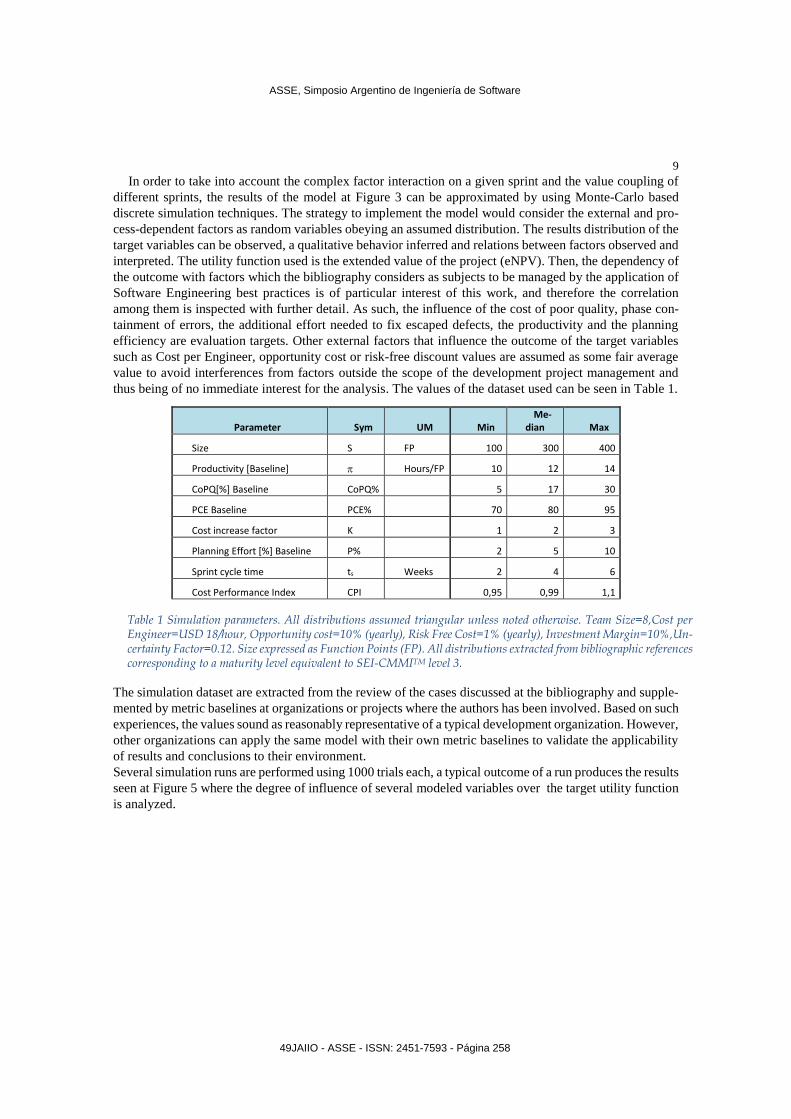
thus being of no immediate interest for the analysis. The values of the dataset used can be seen in Table 1.
The simulation dataset are extracted from the review of the cases discussed at the bibliography and supple-
mented by metric baselines at organizations or projects where the authors has been involved. Based on such
experiences, the values sound as reasonably representative of a typical development organization. However,
other organizations can apply the same model with their own metric baselines to validate the applicability
of results and conclusions to their environment.
Several simulation runs are performed using 1000 trials each, a typical outcome of a run produces the results
seen at Figure 5 where the degree of influence of several modeled variables over the target utility function
is analyzed.
Parameter Sym UM Min Me-
dian Max
Size S FP 100 300 400
Productivity [Baseline] Hours/FP 10 12 14
CoPQ[%] Baseline CoPQ% 5 17 30
PCE Baseline PCE% 70 80 95
Cost increase factor K 1 2 3
Planning Effort [%] Baseline P% 2 5 10
Sprint cycle time ts Weeks 2 4 6
Cost Performance Index CPI 0,95 0,99 1,1
Table 1 Simulation parameters. All distributions assumed triangular unless noted otherwise. Team Size=8,Cost per Engineer=USD 18/hour, Opportunity cost=10% (yearly), Risk Free Cost=1% (yearly), Investment Margin=10%,Un-certainty Factor=0.12. Size expressed as Function Points (FP). All distributions extracted from bibliographic references corresponding to a maturity level equivalent to SEI-CMMITM level 3.
ASSE, Simposio Argentino de Ingeniería de Software
49JAIIO - ASSE - ISSN: 2451-7593 - Página 258

10
Figure 5 Sensitivity of total value with manageable factors and influence of main contributors
The main contributor to explain the variation of the project extended value is the cost of poor quality mag-
nitude (lower better), followed by the phase containment of errors (higher better). The cost increase factor
(K) experienced by repairing defects outside of the sprint (lower better), and the size/complexity of the
project (lower better), are listed as relevant contributors. Other variables are observed as well with a lesser
contribution to the project performance. From the two main contributors, a variation sensitivity analysis
can also be seen at Figure 5. The higher the value of the cost of poor quality proportion within the evaluated
range, the bigger the outcome is eroded. Conversely, the lower the value of the phase containment of errors
within the evaluated range, the higher is the impact into the value delivered.
2.4 Results interpretation
The identified contributors to the project extended value can be interpreted, if being on the zone of lower
contribution, as net value destruction factors; the most relevant being the Cost of Poor Quality followed by
the PCE and the cost increase factor K.
The SCRUM value model used as a reference from previous work is by itself an original piece of work
in the exploration of possible sources of value from the usage of agile methodologies at large; therefore the
adaptation to study the value eroded under the common configuration of technical debts is preliminary
assessed by the authors as sound. Furthermore, the conclusions obtained in this work are both consistent
with previous usages of the model, and with the practical experience of the authors on a wide variety of
projects of different size, industries, technologies involved and complexities.
The additional value provided by the agile methodology, as compared with more classical life cycle
methodologies, protects the value of the project to be positive to the organization by providing a larger
buffer for value erosion.
This can be seen as a qualitative confirmation on the reason why organizations prefer agile over other
methods.
However, if no attention is paid to structural process variables, eventually, the value is eroded to a point
that, even with the added value of agile methodologies, the results turn against the organization. The simu-
lation suggests the CoPQ can be in the neighbor of 18% as the upper acceptable limit, and 80% as the lower
limit for PCE. Those values are very closer to figures reported by the bibliography (Sandu, et al., 2018) as
obtained on successful typical agile projects; therefore, even minimal deviations might push the project
beyond profitability.
-2,5
-2
-1,5
-1
-0,5
0
0,5
1
0,1 0,2 0,3 0,4 0,5 0,6 0,7 0,8 0,9 1
eNP
V[%
]Factor within range for dependent variable outcome
eNPV=f(CoPQ,PCE)
PCE
CoPQ
ASSE, Simposio Argentino de Ingeniería de Software
49JAIIO - ASSE - ISSN: 2451-7593 - Página 259

11
2.5 Model threats to validity
Effort has been made to verify and validate the model implementation and execution along with the
recommendations made by Sargent (Sargent, 2009). Despite the foundation of the modeling effort being
based on previous work, the results need to be considered as preliminary and just with the purpose of gain
some initial understanding of the dynamic behavior of the variables involved. Little assumptions have been
made over the possible values and distributions of the different variables, those selected are either gathered
from the available bibliography, previous modeling efforts, baselines obtained from projects where the
authors were involved, and professional judgment about typical values present at projects found in the
industry. Further refinement of the relations and values used, needs to be pursued as part of future activities.
The base model can be executed with other organizational metric baselines to explore possible outcomes
for a different context.
3 Best practices and lessons learned
The results shown by the simulation, although preliminary, seem to be pretty consistent with the practical
experience of the authors in real-world projects of different sizes and complexities where, more often than
not, the technical debt increases with the successive sprints eroding customer trust in the new features
incrementally delivered, generating schedule overruns at product level, and forcing to add extra effort, and
hence cost, in the form of additional sprints whose backlog is mainly composed of defect-correction stories.
This kind of situation is against some of the Agile principles, first and foremost the one that states that “Our
highest priority is to satisfy the customer through early and continuous delivery of valuable software”. The
value of the software is put in question and could actually be destroyed if defects at product-level increase
beyond acceptable thresholds. In addition to that, the effort consumed by sprints devoted to defect correc-
tion stories are essentially waste, contradicting therefore the Agile principle that states that “Simplicity –
the art of maximizing the amount of work not done, is essential”. Author´s experience shows that, in order
to fulfill at product level the Agile principle that “working software is the primary measure of progress”,
certain practices and metrics borrowed from the plan-driven software engineering processes may be rele-
vant.
In terms of instruments, ways and means to protect value, what the experience shows and the results of the
simulation preliminary confirm is that, by large, the Cost of Poor Quality is the main driver in terms of
value erosion all along the development cycle of actual software products, especially considering that a
typical development cycle normally takes a significant number of sprints. This result is aligned with the
classical principle that states, that the cost of fixing a bug increases exponentially trough the development
process (Software Defect Reduction Top 10 List, 2001). The second driver in importance is the capability
to detect and correct errors in the sprint where they were introduced, which is measured by the PCE metric.
Having identified these two factors empirically through extensive industrial experience, and having seen
the consistency with the preliminary results generated by the proposed model, the recommendation at this
point could be to plan for acceptable ranges for CoPQ and PCE at product level, in the same manner as the
backlog is planned, and distribute these figures as partial budgets assigned to successive sprints. At the time
of executing the planned sprints, as part of the retrospective, the actual values shall be compared with the
planned ones to grasp early enough if the scrum team is in the right track to deliver “working software” or
if corrective measures shall be taken, as part of the planning of the forthcoming sprint, before value is
destroyed at the product level by the same process that is supposed to create it. The authors believe that the
definition and collection of such metrics shall be as agile as the rest of the process, for example identifying
the stories where defects from previous sprints need to be corrected and deriving PCE from them, and
considering the story points of the backlog devoted to defect correction stories as a measure of CoPQ. In
the same manner, as a burndown chart is kept and used as a measure of progress, curves of planned vs
actuals of PCE and CoPQ could be kept and used as key elements for product release decisions and for
appropriate planning of successive sprints.
ASSE, Simposio Argentino de Ingeniería de Software
49JAIIO - ASSE - ISSN: 2451-7593 - Página 260

12
4 Future work
Further work is needed to validate the model and the proposed practices using data from actual projects. A
possible line of work could be to take a small to medium-size project, implement the definition, collection
and analysis of the CoPQ and PCE metrics as part of the sprint ceremonies, trying to identify, by means of
the model, when value is being created and when is being destroyed, establishing early warning thresholds
for the scrum team to take actions. The results, in terms of product defects and development costs, could
then be compared with those of similar projects that have not introduced these practices
5 Bibliography
Alegrìa, J. Hurtado and Bastarrica, M. 2007. Implementing CMMI using combination of Agile
methods. s.l. : V9(N1), 2007.
Appleton, B., Berczuk, S. and Cowham, R. 2005. The Agile Difference for SCM. CrsossRoads.
[Online] 2005. https://www.cmcrossroads.com/article/agile-difference-scm.
Banerjee, A., Narasimhan, B. and Kanakalata, C. 2011. Experience of Executing Fixed Price Off-
shored Agile Projects. s.l. : Proceedings of the 4th India Software Engineering Conference. ACM, 2011.
Beck, K., et al. 2001. Principles behind the Agile Manifesto. [Online] 2001.
http://agilemanifesto.org/principles.html.
Bhasin, S. 2012. Quality Assurance in Agile –A study towards achieving excellence. 2012, pp. pp 64-
67.
Black, F. and Scholes, M. 1973. The Pricing of Options and Corporate Liabilities. The Journal of
Political Economy. 1973, Vol. V81, N3, pp. pp 637-654.
Brealey, R. and Myers, S. 2016. Principles of Corporate Finance 12th Edition. s.l. : McGraw-Hill, 6th
Edition, 2016.
Caballero, E., Calvo-Manzano, J.A. and Feliu, T. San. 2011. Introducing Scrum in a Very Small
Enterprise: A Productivity and Quality Analysis. 2011, pp. pp. 215-224.
Clark, B. 2000. Quantifying the effects of Process Improvement on Effort. IEEE Software. Nov 2000.
2000.
Cockburn, A. 2007. Agile Software Development. s.l. : , Addison-Wesley, 2007.
Colla, P. 2012. Marco para evaluar el valor en metodología SCRUM. La Plata-Argentina. : 13th
Argentine Symposium on Software Engineering, 2012.
Colla, P.E. 2016. Uso de opciones reales para evaluar la contribución de metodologías KANBAN en
desarrollo de software. Tres de febrero : SADIO ISSN: 2451-7593, 2016. pp. p. 159-168.
Duncan, S. 2019. Understanding Agile Values & Principles. s.l. : C4Media, InfoQ.com., 2019.
Fritzche, M. and P.Keil. 2007. Agile Methods and CMMI: Compatibility or Conflict ? 2007.
Glazer, H., et al. 2008. CMMI or agile: why not embrace both! s.l. : SEI TECHNICAL NOTE, 2008.
CMU/SEI-2008-TN-003.
Goldenson, D.R., A.Liu and Jianping, Q. 2006. CMMI-Based Process Improvement: How and When
Does Success Happen? CMMI Technology Conference : Software Engineering Institute, 2006.
Good, J. M. 2003. A Pragmatic Approach to the Implementation of Agile Software Development
Methodologies in Plan-Driven Organisations (MSc Thesis). s.l. : Lincoln University, 2003.
Hallowell, D.L. 2003. Six Sigma Software Metrics Maturity. iSixSigma. [Online] 2003.
https://www.isixsigma.com/industries/software-it/exploring-defect-containment-metrics-agile/.
Hummel, O. and Burger, S. 2013. A pragmatic means of measuring the complexity of source code
ensembles. IEEE WETSoM 2013, pp. 76-79., 2013.
Humphrey, W. S. 1989. Managing the Software Process. s.l. : Addison-Wesley, 1989.
Hung, M. and So, L. 2010. The Role of Uncertainty in Real Option Analysis. 2010.
Ismail, N. 2016. UK wasting 37 billion a year on failed agile IT projects. [Online] 2016.
https://www.information-age.com/uk-wasting-37-billion-year-failed-agile-it-projects-123466089/.
Knox, S.T. 1993. Modeling the Cost of Software Quality. 1993, pp. pp 9-16.
ASSE, Simposio Argentino de Ingeniería de Software
49JAIIO - ASSE - ISSN: 2451-7593 - Página 261

13
Kunz, M., Dumke, R. R. and Zenker, N. 2008. Software Metrics for Agile Software Development.
2008, pp. pp. 673-678 .
Lawlis, P. K., M., Flowe R. and B., Thordahl J. 1995. A Correlational Study of the CMM and Software
Development Performance. 1995, pp. pp. 21-25.
Lee, G. and Xia, W. 2010. TOWARD AGILE: AN INTEGRATED ANALYSIS OF QUANTITATIVE
AND QUALITATIVE FIELD DATA ON SOFTWARE DEVELOPMENT AGILITY. 2010, pp. pp 87-
114.
Mahnic, V. 2012. A Capstone Course on Agile Software Development using SCRUM. IEEE
TRANSACTIONS ON EDUCATION, VOL. 55, NO. 1, FEBRUARY 2012. 2012.
Maller, P., C.Ochoa and Silva, J. 2004. Lightening the software production process in a CMM level 5
framework. IEEE Latin American Transactions. 2004, Vol. V3(N1), pp 15-22.
Marcal, A., et al. 2008. Blending SCRUM practices and CMMI Project Management Process Areas.
Innovation System Software. 2008, pp 18-29.
Matson, J., Barrett, B. and Mellichamp, J. 1994. Software development cost estimation using function
points. Software Engineering, IEEE Transactions, 1994, Vols. 20.4, pp. 275-287.
Mendarozqueta, A. Ruiz de and Andriano, N. 2014. Un enfoque para la mejora continua basado en
los principios ágiles. 2014.
Miller, G.J. 2013. Agile problems, challenges, & failures. PMI® Global Congress 2013. 2013, pp. pp.1-
8.
Morse, L. 2012. 3 Paradigm Shifts of Agile. Solutions IQ. [Online] 2012. [Cited: 05 04, 2019.]
https://www.solutionsiq.com/resource/blog-post/3-paradigm-shifts-of-agile/.
Mukker, A.R., Mishra, A. K. and Singh, L. 2014. Enhancing Quality in Scrum Software Projects.
2014, pp. pp 682-688.
Mun, J. 2002. Real Options Analysis, Tools and Techniques for Valuing Strategic Investment and
Decisions. Hoboken, New Jersey : John Wiley & Sons, 2002.
Rico, D. F. 2008. What is the ROI of Agile vs. Traditional Methods? 2008, pp. pp. 9–18.
Sandu, I.A. and Salceanu, A.l. 2018. New approach to agile cycles containment effectiveness metrics
in automotive software development. 2018, pp. pp. 3-8.
Sargent, R.G. 2009. Verification and validation of simulation models. Proceedings of the 2009 Winter
Simulation Conference, ed. M. D. Rossetti, R. R. Hill, B. Johansson, A. Dunkin, and R. G. Ingalls,. 124-
137. Piscata-way, New Jersey: IEEE., 2009.
Sauer, J. 2005. Agile Practices in Offshore outsourcing- An analysis of published experiences. s.l. :
ECSCW 2005, 2005.
Schwaber, K. and Sutherland, J. 2013. The Scrum Guide. [Online] 2013. Scrum.org.
Shuterland, J., Jakobsen, C. and K.Johnson. 2008. Scrum and CMMI L5 The magic potion for the
code warriors. 2008, Vol. V, N.
Software Defect Reduction Top 10 List. Boehm, B. and Basili, V. R. 2001. s.l. : IEEE Software, 2001,
IEEE Computer, January 2001.
Team, CMMI Product. 2010. CMMI for Development, version 1.3. Pittsburgh, Pennsylvania, USA :
Software Engineering Institute (SEI), November 2010.CMU/SEI-2010-TR-033, 2010.
Turner, R. and Jain, A. 2002. Agile meets CMMI: Culture clash or common cause. 2002, Vol.
XP/Agile Universe LNCS 2418.
Vijay, D. and Ganapathy, G. 2014. Guidelines to minimize the cost of software quality in agile
SCRUM process. International Journal of Software Engineering & Applications (IJSEA), 2014, Vols.
Vol.5, No.3, pp. pp 61-69.
Vishal, S. and Kishen, I. 2007. Will Agile Methodologies work in offshore outsourcing? San Diego,
USA : SWDSI07, 2007.
Weinberg, G. 1992. Quality Software Management (Vol 1 Systems Thinking). s.l. : Dorset House, 1992.
ASSE, Simposio Argentino de Ingeniería de Software
49JAIIO - ASSE - ISSN: 2451-7593 - Página 262