agilent 6300 series ion trap software - home-cigs · agilent 6300 series ion trap software...
TRANSCRIPT

Agilent 6300 SeriesIon Trap Software
Familiarization Guide
Agilent Technologies

Agilent 6300 Series Ion Trap System Familiarization Guide
Notices© Agilent Technologies, Inc. 2006
No part of this manual may be reproduced in any form or by any means (including elec-tronic storage and retrieval or translation into a foreign language) without prior agree-ment and written consent from Agilent Technologies, Inc. as governed by United States and international copyright laws.
Manual Part NumberG2440-90095
EditionThird Edition, May 2006
Printed in USA
Agilent Technologies, Inc.5301 Stevens Creek Blvd. Santa Clara, CA USA 95052
WarrantyThe material contained in this docu-ment is provided “as is,” and is sub-ject to being changed, without notice, in future editions. Further, to the max-imum extent permitted by applicable law, Agilent disclaims all warranties, either express or implied, with regard to this manual and any information contained herein, including but not limited to the implied warranties of merchantability and fitness for a par-ticular purpose. Agilent shall not be liable for errors or for incidental or consequential damages in connec-tion with the furnishing, use, or per-formance of this document or of any information contained herein. Should Agilent and the user have a separate written agreement with warranty terms covering the material in this document that conflict with these terms, the warranty terms in the sep-arate agreement shall control.
Technology Licenses The hardware and/or software described in this document are furnished under a license and may be used or copied only in accor-dance with the terms of such license.
Restricted Rights LegendIf software is for use in the performance of a U.S. Government prime contract or subcon-tract, Software is delivered and licensed as “Commercial computer software” as defined in DFAR 252.227-7014 (June 1995), or as a “commercial item” as defined in FAR 2.101(a) or as “Restricted computer soft-ware” as defined in FAR 52.227-19 (June 1987) or any equivalent agency regulation or contract clause. Use, duplication or disclo-sure of Software is subject to Agilent Tech-nologies’ standard commercial license terms, and non-DOD Departments and Agencies of the U.S. Government will receive no greater than Restricted Rights as
defined in FAR 52.227-19(c)(1-2) (June 1987). U.S. Government users will receive no greater than Limited Rights as defined in FAR 52.227-14 (June 1987) or DFAR 252.227-7015 (b)(2) (November 1995), as applicable in any technical data.
Safety Notices
CAUTION
A CAUTION notice denotes a haz-ard. It calls attention to an operat-ing procedure, practice, or the like that, if not correctly performed or adhered to, could result in damage to the product or loss of important data. Do not proceed beyond a CAUTION notice until the indicated conditions are fully understood and met.
WARNING
A WARNING notice denotes a hazard. It calls attention to an operating procedure, practice, or the like that, if not correctly per-formed or adhered to, could result in personal injury or death. Do not proceed beyond a WARNING notice until the indicated condi-tions are fully understood and met.

In this Guide...This guide presents a series of exercises to help you learn how to use the software.
1 Prepare for the analysis
Use these exercises to prepare the sample and tune and calibrate the instrument.
2 Set up and run acquisition methods
Learn how to set up methods and acquire data with these exercises.
3 Review data and identify compounds
With these exercises learn how to interactively process data and set up an LC/MS method to automate analysis and reporting.
4 Deconvolute and search protein spectra
Use these exercises to learn how to run deconvolution on protein and peptide spectra and search the processed spectral data with MASCOT.
5 Quantify compounds
Learn how to set up to quantify compounds within batches of samples.
Agilent 6300 Series Ion Trap System Familiarization Guide iii

iv Agilent 6300 Series Ion Trap System Familiarization Guide
Contents
Content
1 Prepare for the analysis 1
Exercise 1. Prepare the LC to run the sample 2
Task 1. Purge the pump 2Task 2. Prepare the column and sample for analysis 3
Exercise 2. Calibrate the Ion Trap 6
Task 1. Infuse the ESI Tune Solution 6Task 2. Check mass assignment for standard/normal mode 9Task 3. (optional) Check mass assignment for other modes 16Task 4. Do a scan calibration 18Task 5. Check detector gain 20Task 6. Do an isolation calibration 21Task 7. Do a fragmentation calibration 23
Exercise 3. Tune the Ion Trap 26
Task 1. Optimize signal intensity (MS) 26Task 2. Optimize fragmentation (MS/MS) 30
2 Set up and run acquisition methods 33
Exercise 1. Set up a full-scan acquisition method 34
Task 1. Enter LC acquisition parameters 34Task 2. Enter MS Acquisition Parameters 40
Exercise 2. Acquire data with the full-scan method 43
Task 1. Enter sample information 43Task 2. Acquire the data 44
Exercise 3. Change and run method to optimize peak height 45
Task 1. Set up first segment and time interval 45Task 2. Set up additional segments 47Task 3. Set up display and acquire data 48
Exercise 4. Set up and run an AutoMS(n) acquisition method 49
Agilent 6300 Series Ion Trap System Familiarization Guide v

Contents
Task 1. Enter the threshold 49Task 2. Enter more parameters 50Task 3. Set up display and acquire data 51Task 4. Modify and run the method with selected masses 52
3 Review data and identify compounds 55
Exercise 1. Review data from a full-scan method 56
Task 1. Change the chromatographic display 56Task 2. Examine the mass spectra 60Task 3. Find compound spectra 64Task 4. Generate a results report 65
Exercise 2. Review data from method to optimize peak height 71
Exercise 3. Review data from the AutoMS(n) method 74
Task 1. Find compound spectra with all masses 74Task 2. Find compound spectra with selected masses 80
Exercise 4. Create and use a library to identify unknowns 85
Task 1. Open and process the data file for the library 85Task 2. Create the library 89Task 3. Identify Unknown Compounds in a Mixture 93Task 4. Print a Library Report 98
Exercise 5. Create or edit a report layout 101
Exercise 6. Create a method to automate analysis and reporting 104
Task 1. Modify and run a DataAnalysis method 104Task 2. Set up to run an LC/MS method containing the DA
method 109
4 Deconvolute and search protein spectra 111
Exercise 1. Deconvolute an intact protein spectrum 112
Task 1. Deconvolute to view the major component 112Task 2. Deconvolute to view minor components 118
vi Agilent 6300 Series Ion Trap System Familiarization Guide

Contents
Task 3. Use the Charge State Ruler to deconvolute a protein mass spectrum 122
Exercise 2. Deconvolute spectra from a protein digest 126
Task 1. Extract spectra for deconvolution manually 126Task 2. Extract spectra for deconvolution automatically 135Task 3. Deconvolute the spectra 140
Exercise 3. Search for a protein with MASCOT 145
Task 1. Search the MASCOT database 145
5 Quantify compounds 155
Exercise 1. Prepare for quantitation 158
Task 1. Find the retention time of the internal standard (ISTD) 158
Task 2. Modify the sequence for quantitation 160
Exercise 2. Create a quantitation method 164
Exercise 3. Quantify the unknown 169
Task 1. Process data and examine the quantitative results 169Task 2. Examine the graphic and calibration results 171
Exercise 4. Print a quantitation report 175
Agilent 6300 Series Ion Trap System Familiarization Guide vii

Contents
viii Agilent 6300 Series Ion Trap System Familiarization Guide

Agilent 6300 Series Ion Trap SoftwareFamiliarization Guide
1Prepare for the analysis
Exercise 1. Prepare the LC to run the sample 2
Exercise 2. Calibrate the Ion Trap 6
Exercise 3. Tune the Ion Trap 26
This chapter presents exercises to help you learn how to:
• Check mass assignment, resolution and sensitivity to evaluate the need to calibrate or tune
• Perform mass scan, isolation, and fragmentation calibrations in positive ESI mode
• Set the electron multiplier voltage
• Tune the ion optics to optimize sensitivity for the ESI tuning mix
• Equilibrate and connect the LC to the Ion Trap
• Prepare the sample for the analyses in these exercises
Before you start
• Make sure that the electrospray source is installed.
• Make sure that you read the Quick Start Guide and that the programs are running.
For the tasks on the following pages, try the steps on the left without the detailed instructions. If you need more help, follow the detailed instructions on the right.
1Agilent Technologies

1 Prepare for the analysis
Exercise 1. Prepare the LC to run the sample
See the ChemStation manual set or ChemStation Online Help to learn more about how to prepare the LC.
Before you start
• Make sure that the LC tubing is connected to the UV detector and disconnected from the MS.
• Make sure that the ChemStation plot is ready to monitor the signal from the detector.
Task 1. Purge the pump
Use these instructions with the binary and quaternary pumps, and modify them for the isocratic pump. See the ChemStation help for instructions for the capillary and nano pumps.
Steps Detailed Instructions Comments
1 Open the ChemStation main window.
• Click the ChemStation window, or click its button on the bottom toolbar.
2 Place the pump in standby and disconnect the flow to the other modules and column.
a Click the pump icon.b Select Standby.c Turn the black valve on the front of the
pump counter-clockwise two turns.
3 Enter a flow of 5 mL/min and 50% B, using water in channel A and methanol in channel B.
a Click the pump icon.b Select Set up pump.c Enter the parameters in Step 3 and
click OK.
4 Turn the pump on and monitor the tubing for bubbles.
a Click the pump icon.b Select On.
• Purge for about 9 minutes to pass 3X the volume for the binary pump.
5 After the bubbles are gone and the purge complete, enter a flow of 1mL/min and 100%B.
a Click the pump icon.b Select Set up pump.c Enter the new parameters in Step 5,
and click OK.
6 Purge a short while longer, and reconnect the flow to the other modules.
• Close the black valve.
2 Agilent 6300 Series Ion Trap System Familiarization Guide

Prepare for the analysis 1
Task 2. Prepare the column and sample for analysis
In the exercises in the next chapters, you analyze a mixture of four sulfonamide compounds. The Electrospray LC Demo Sample (P/N 59987-20033), included in your installation kit, contains five ampoules with 100 ng/μL each of these compounds:
• sulfamethizole (M+H)+ = 271,
• sulfamethazine (M+H)+ = 279,
• sulfachloropyridazine (M+H)+ = 285
• sulfadimethoxine (M+H)+ = 311.
To perform the analyses in the following chapters, you must first flush, condition and equilibrate your column and then prepare the sample for the analysis.
Sulfamethizole Sulfamethazine Sulfachloropyridazine Sulfadimethoxine
N
SO
OH
N 2H
S
N
N
N
NN
SO
OH
N 2H
N
N
N
SO
OH
N 2H
C l
N
N
O
O
N
SO
OH
N 2H
Agilent 6300 Series Ion Trap System Familiarization Guide 3

1 Prepare for the analysis
Prepare the column and sample to run the ESI sulfa mix sample (Chapter 2 exercises)
Steps Detailed Instructions Comments
1 Flush the column with 100% MeOH at 1 mL/min (5-10 min).• Zorbax, SB-C18, 2.1 mm × 30
mm, 3.5 μm, 100 Å, PN 873700-902
• Continue flowing methanol through the column under the conditions used in Task 1, Step 5.
• The data sheet shipped with the column cartridge recommends flushing with 20–30 column volumes of 100% methanol (approximately 5 to 7.5 mL).
2 Prepare solvents for the analysis.• A–5 mM ammonium formate in
water• B–5 mM ammonium formate in
methanol
• In two 1 liter reservoirs, one containing HPLC grade H2O and the other containing methanol (MeOH), add 1 mL of 5 M ammonium formate to each.
• Each ampoule contains 2.2 mL.• Part # for ammonium formate is
G1946-85021.
3 Condition the column as follows:• Flow rate – 0.4 mL/min• 100%B for 1/2 hour• 50%B for 1/2 hour
a Click the pump icon.b Select Set up Pump.c Enter the parameters in Step 2 and
click OK.
• At a flow rate of 0.4 mL/min, the checkout column should produce about 70–80 bar pressure (measured without any fittings at the column’s exit).
• If, after you perform these flushing steps, the pump pressure through the column is too high, order a replacement SB-C18 column (873700-902).
4 Equilibrate the column with the analysis conditions: • 15%B for 1/2 hour/40 °C
a Click the pump icon.b Select Set up Pump.c Enter the parameter and click OK.d Repeat steps a-c with temperature.
5 Prepare the sample in an autosampler vial with a 300 μL conical insert so that: • Final concentration is 50 ng/μL • Solvent mix is 77.5:7.5:15
water/methanol/ACN.
a Transfer 100 μL of the sulfa mixture into the ALS vial.
b Add 100 μL of 85:15 H2O/MeOH containing 5 mM NH4HCO2.
• The original sulfa mixture is dissolved in a solvent mixture of 70% water and 30% acetonitrile (ACN).
4 Agilent 6300 Series Ion Trap System Familiarization Guide

Prepare for the analysis 1
Prepare the column and sample to create a library (Chapter 3, Exercise 4)
Steps Detailed Instructions Comments
1 Prepare solvents for the analysis.• Column:
Zorbax, RX-Sil, 2.1 mm × 50 mm, 5 μm, 100 Å, PN 860975-902
• Solvents: A–0.05% TFA in waterB–0.045% TFA in acetonitrile (ACN)
• To a 1 liter reservoir of water, add .5 mL of TFA, and to a 1 liter reservoir of acetonitrile, add .45 mL of TFA.
• TFA permeates all the Teflon parts of the solvent delivery system to the pump and is difficult to remove completely. Therefore, use solvents with TFA in specific channels only (e.g., only channels A2 and B2 of a binary pump) to avoid persistent TFA background ions in all analyses.
2 Condition the column as follows:• Flow rate–.5 mL/min• 100%B for 1/2 hour• 50%B for 1/2 hour
a Click the pump icon.b Select Set up Pump.c Enter the parameters in Step 2 and
click OK.
• If, after you perform these flushing steps, the pump pressure through the column is too high, order a replacement RX-Sil column (860975-902).
3 Equilibrate the column with the analysis conditions: • 15%B for 1/2 hour/40 °C
a Click the pump icon.b Select Set up Pump.c Enter the parameter and click OK.d Repeat steps a-c with temperature.
4 Prepare the sample in an autosampler vial with a 300 μL conical insert so that: • Final concentration is 50 ng/μL • Solvent mix is 85:15:0.05
water/ACN/TFA.
a Transfer 100 μL of the sulfa mixture into the ALS vial.
b Add 100 μL of 0.1% TFA in water.
• The original sulfa mixture is dissolved in a solvent mixture of 70% water and 30% acetonitrile (ACN).
Agilent 6300 Series Ion Trap System Familiarization Guide 5

1 Prepare for the analysis
Exercise 2. Calibrate the Ion Trap
Three calibrations are necessary for proper calibration of the Ion Trap:
Scan calibration A calibration to ensure correct mass assignment and resolution
Isolationcalibration
A calibration to ensure that the trap isolates only the mass ion of interest
Fragmentationcalibration
A calibration to optimize the fragmentation amplitude
Calibrations must be checked in the proper order: mass > isolation > fragmentation. To get a good fragmentation calibration, you must have a good isolation calibration. To get a good isolation calibration, you must have a good mass scan calibration.
Task 1. Infuse the ESI Tune Solution
Steps Detailed Instructions Comments
1 Switch to the Ion Trap Control main window.
• Click on the Trap Control window or on its button in the bottom toolbar.
2 Check the vacuum status. • Click Options > Vacuum system. You should see the vacuum status window (6320 system):
• For 6310 and 6320 systems:• Fore: 3.8 to 5.8 mbar (2.9 to 4.4
Torr)• High: 1.2 to 2.0 x 10⁻⁵ mbar (9.0 to
15 x 10-6 Torr)
6 Agilent 6300 Series Ion Trap System Familiarization Guide

Prepare for the analysis 1
Steps Detailed Instructions Comments
3 Verify that the differential pressure due to helium is 6 x 10⁻⁶.
a Clear the Helium check box in the Vacuum System dialog box to stop the Helium flow.
b Calculate the change in the High pressure reading.
c If the difference is not correct, adjust the helium valve by turning the valve clockwise to increase the pressure or counterclockwise to decrease it.
d Mark the Helium check box in the Vacuum System dialog box.
e Click Close.
• Do step 3 only if you suspect a change in helium flow or pressure. You must wait ten minutes after stopping the helium flow for pressures to stabilize.
• A value +/- 15% for this differential pressure value is OK.
4 Check to see that the current scan calibration is selected.
• In the Trap Control window, click Options > Scan calibration.
• The program automatically loads a set of parameters for scan calibration.
5 Set the following Trap parameters:• ICC = On• Averages = 5• Rolling Averaging = On• No. = 2
a Mark the ICC check box.b In the Averages text box at the lower
right corner of the Trap Control window, enter 5.
c Under Rolling Averaging, mark the On check box and enter 2 in the No. text field.
• The mass spectra displayed in the Control window result from two types of averages. See the Concepts Guide for more information on averages.
6 Enter appropriate flow and temperatures settings:For syringe pump only (5 µL/min. flow rate) use:• Nebulizer = 15 psi• Dry gas = 5 L/min• Dry Temp = 325 °C
a Click the Tune tab.b Enter the values found in the Steps
column and in the figure below.
• Refer to the G2440-90092 Ion Trap System Quick Reference Guide for appropriate values for other flow rates.
Agilent 6300 Series Ion Trap System Familiarization Guide 7

1 Prepare for the analysis
7 Activate the “Smart” mode and start the operation.
a In the Tune property sheet, click the Smart radio button.
b In the Status area, click Operate.
8 Remove the spacer under the nebulizer mount.
• The Ion trap comes with a spacer under the nebulizer mount to improve sensitivity at flow rates of 200 μL/min or higher. This exercise introduces sample at 5 μL/min; so the spacer is not needed.
9 Infuse G2431A Tuning Mix for ESI. at 5 µL/min (300 µL/h).
a Fill the 1 mLsyringe with the tuning mix.
b Infuse the mix into the ESI source.
• See figure below to view a full scan MS of the ESI tuning mix.
Steps Detailed Instructions Comments
NOTE The expected accumulation time for infused ESI Tuning Mix (5 µL/min) in positive ion mode, scanning from 100–2200, with ICC Target = 30,000 and SPS Target = 922, is approximately
• 0.5 msec for 6310 systems• 0.5 msec for 6320 systems with Smart Target set to 200,000.
A shorter time may indicate an unusually high background or multiplier voltage.
8 Agilent 6300 Series Ion Trap System Familiarization Guide

Prepare for the analysis 1
Task 2. Check mass assignment for standard/normal mode
The installed system must pass three verification tests:
• Mass Axis Assignment must be correct in all scan modes.
• Expected Resolution for each must be demonstrated.
• Sensitivity Test using the compound reserpine must pass.
To demonstrate good mass assignment and resolution, you acquire calibration mass spectra in each scan mode that you use for your samples. This exercise uses the standard/normal mode (positive ion) for the 6310 model and Ultra Scan mode (positive ion) for the 6320 model.
Because a single set of instrument parameters does not give optimum response across the entire mass range, you cannot see all of the calibrant peaks in one scan. Therefore, the method used in this exercise changes the instrument parameters during acquisition using “time segments”. Averaging the data in Data Analysis then produces a composite spectrum with all calibrant peaks present.
Steps Detailed Instructions Comments
1 Load the ULT_SCN.M method for the 6320 system, and load STD_NOR.M for other systems into the TrapControl program.
• In the TrapControl program, select Method > Load - 6300 Series TrapControl Part.
• Select one of the two data files in Step 1.
• Click Open.
• These methods were copied to the D:\Methods directory during installation:• STD_NOR.M (ULT_SCN.M for
6320 only)• STD_MAX.M• NEGATIVE.M• APCI.M• APPI.M
Agilent 6300 Series Ion Trap System Familiarization Guide 9

1 Prepare for the analysis
Steps Detailed Instructions Comments
2 Make sure that these sample parameters are set:• Data File = Manual• Filename = POS_ESI• Subdirectory = Example Data• Samp Name = ES Tuning Mix
Pos• Comment = Std/Nor method,
100-2200
a Click the Sample Info tab.b Enter the values as they appear below.c Click Apply.
3 Set these mode parameters:• Save the spectra, but do not
include the profile spectra.• Standard scan range.• Normal scan resolution.• Divert to the source.
a Click the Mode tab.b Mark the check box and radio buttons
as they appear below.c Click Apply.
• You do not need to save the profile spectra for mass assignment confirmation.
10 Agilent 6300 Series Ion Trap System Familiarization Guide
Prepare for the analysis 1
Steps Detailed Instructions Comments
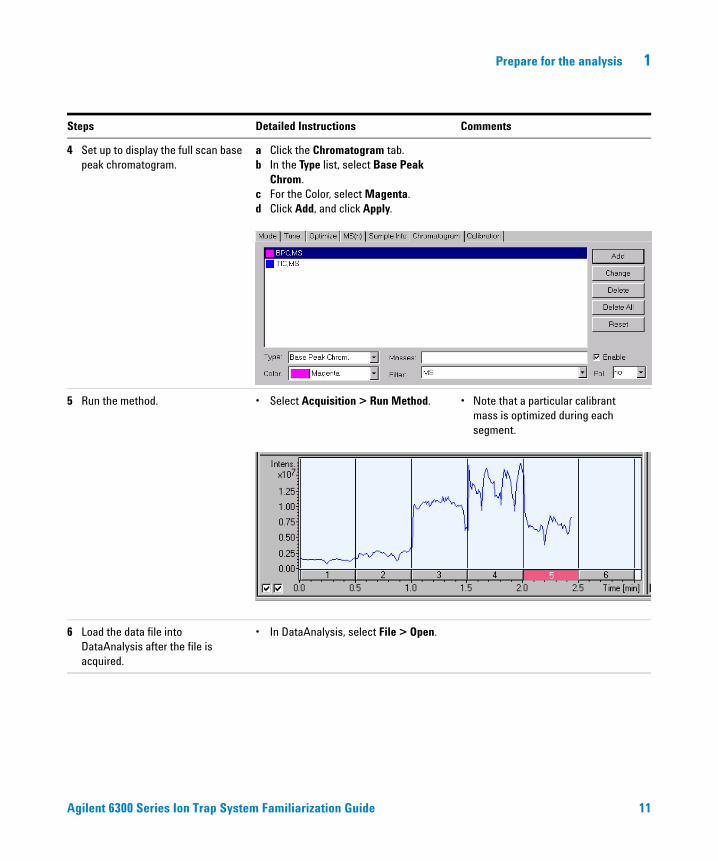
4 Set up to display the full scan base peak chromatogram.
a Click the Chromatogram tab.b In the Type list, select Base Peak
Chrom.c For the Color, select Magenta.d Click Add, and click Apply.
5 Run the method. • Select Acquisition > Run Method. • Note that a particular calibrant mass is optimized during each segment.
6 Load the data file into DataAnalysis after the file is acquired.
• In DataAnalysis, select File > Open.
Agilent 6300 Series Ion Trap System Familiarization Guide 11

1 Prepare for the analysis
7 Average the spectra. a Check that the Select Range / View Spectra tool bar button is not selected.
b Click and drag across the entire chromatogram to highlight all the data.
c Click the Average tool bar button to get an average of the spectra.
• Note that the spectra in the figure below are line spectra. To see only the line spectra, click Tools >Options… > Mass Spectrum View and choose Line Spectra only in the Spectrum pull-down menu.
8 Close the Chromatogram panel to show only the Mass Spectrum View panel.
• Click the X in the upper corner of the Chromatogram panel.
Steps Detailed Instructions Comments
12 Agilent 6300 Series Ion Trap System Familiarization Guide
Prepare for the analysis 1
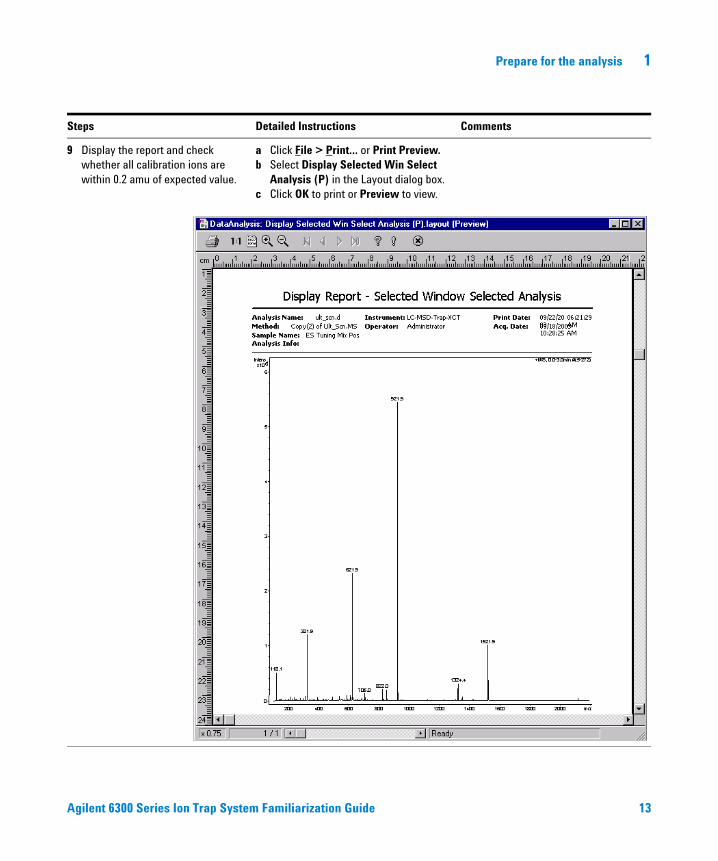
9 Display the report and check whether all calibration ions are within 0.2 amu of expected value.
a Click File > Print… or Print Preview.b Select Display Selected Win Select
Analysis (P) in the Layout dialog box. c Click OK to print or Preview to view.
Steps Detailed Instructions Comments
Agilent 6300 Series Ion Trap System Familiarization Guide 13

1 Prepare for the analysis
10 Examine the 622 ion peak to check the resolution.
a In the the TrapControl program, zoom the peak at 622.
b Select the Peak Width tool bar button shown to the right.
c Move the arrow across the peak at 622 until the red peak width measurement appears.
d Check the FWHM of m/z 622.
Steps Detailed Instructions Comments
14 Agilent 6300 Series Ion Trap System Familiarization Guide

Prepare for the analysis 1
11 Preview the result for the 622 ion. • In the TrapControl program, click File > Print. Preview.
• Click Close to return to the the Trap Control window.
• Note that m/z 622 ion should be adequate to benchmark the resolution of the Ion Trap LC/MS. For acquisition in standard/normal or Ultra scan modes, the peakwidth should be 0.60 amu or less.
Steps Detailed Instructions Comments
Agilent 6300 Series Ion Trap System Familiarization Guide 15

1 Prepare for the analysis
Task 3. (optional) Check mass assignment for other modes
Table 1 summarizes the methods used with the different scan modes.:
Table 1 Scan modes
Mode Comment Filename Method
Standard /Normal(Ultra Scan – 6320 )
std/normal, 50-2200(ultra scan, 50-2200)
STD_NOR.D (ULT_SCN.D)
STD_NOR.M (ULT_SCN.M)
Standard/Normal (negative)
std/normal, 50-2200, negative
NEGATIVE.D NEGATIVE.M
Standard/Enhanced std/enhanced, 50-2200 STD_ENH.D STD_ENH.M
Standard/Maximum std/maximum, 50-2200 STD_MAX.D STD_MAX.M
Extended/Normal ext/normal, 200-4000 EXT_NOR.D EXT_NOR.M
Steps Detailed Instructions Comments
1 For each of the other positive ESI modes:• Check the scan calibration.• Acquire profile spectra with the
related segment methods.• Print the results.
• Repeat Steps 2 through 11 in Task 2 for the other methods.
• The FWHMs for Enhanced should be no more than 0.4 and for Maximum, no more than 0.25
• When in Extended/Normal mode , set the maximum mass of the actual scan to 3000.
16 Agilent 6300 Series Ion Trap System Familiarization Guide

Prepare for the analysis 1
Steps Detailed Instructions Comments
2 Check the mass assignments (calibration) for negative polarity.
a Load the method Negative.M, b In the Polarity field, check that the
Negative radio button is marked.c Click on each segment to check its
mass assignment.d Check the masses against those listed
on the tuning solution label.
• Recommendation: Perform the scan calibration in positive-ion mode and simply switch the polarity to analyze negative ions. The calibration program uses the Smart Parameter Settings (SPS) that were created for the very stable Tuning Mix ions in positive-ion mode.
3 Set these sample parameters:• Data File = Manual• Filename = NEGATIVE• Subdirectory = Example Data• Sample Name - ESI Tuning Mix
Neg• Comment = STD/NOR, 50-2200,
negative
a Click the Sample Info tab.b Enter the values as they appear under
the Steps column.c Click Apply.
• New entries into this dialog box appear green until you click Apply.
4 Run the acquisition. In the the TrapControl program, click Acquisition > Run Method.
Agilent 6300 Series Ion Trap System Familiarization Guide 17

1 Prepare for the analysis
Task 4. Do a scan calibration
Re-calibrate the scan calibration if one these conditions holds:
You usually do not have to calibrate the 6300 Series Ion Trap LC/MS more than once per month because of the low risk of contamination.
• Mass assignment in the Standard Mass Range differs by more than 0.2 amu (fastest scan mode).
• You replace the trap or electronics, or change He pressure.
Steps Detailed Instructions Comments
1 Set up an automatic scan calibration.
a Click the Calibration tab.b Select Auto on the left of the tab.c Mark the Scan Calibration check box.
2 Display the m/z list used for calibration.
a Click the Mass List file open icon.b In the Sample Name list box, click
ESI Tuning Mix Pos, and click OK.
• See the Online Help for more information on editing the calibration mass list.
3 Prepare the syringe pump.• 200 µL ESI calibrant• Flow rate – 5 uL/min
a Check the volume of ESI calibrant.b Turn on the syringe pump.
18 Agilent 6300 Series Ion Trap System Familiarization Guide

Prepare for the analysis 1
4 Run the calibration. a Switch the instrument to Operate.b Verify that mass peaks are present
(profile spectrum window) and the response is stable (chromatogram window).
c In the Calibration property sheet, click Start.At the end of the procedure, the Auto Calibration Results dialog box appears.
• If the response is not stable, refill the syringe and remove any bubbles to obtain stable calibrant flow.
• The calibration takes about 10 minutes to complete.
• When you use “Presearch,” time is added to the auto-calibration.
• You must find at least four mass points for Auto Calibration to work.
5 Update and save the mass assignments.
a In the Auto Calibration Results dialog box, mark the Scan Calibration check box.
b Click Save.
• The mass assignments are updated and stored in the Current scan calibration.
• The previous calibration is moved to Backup. The Default is never overwritten.
Steps Detailed Instructions Comments
NOTE If you get an “unstable” signal error for the calibration results, or the calibrant ion intensities are too low, see the Troubleshooting section of the Online Help.
If autocalibration does not give the correct mass assignments, even when you use “Presearch,” see “Do a manual scan calibration” in the Online Help.
Agilent 6300 Series Ion Trap System Familiarization Guide 19

1 Prepare for the analysis
Task 5. Check detector gain
Before you do an isolation calibration, check the gain on the electron multiplier and adjust the multiplier voltage. If the voltage is too low, the trap takes longer to fill to compensate for the low signal. This may cause an accumulation of excess ion charges and create an effect known as “space charging.” Poor resolution, mass shifting, and signal loss are symptoms of space charging.
Steps Detailed Instructions Comments
1 Verify the following settings:• Mass = 922.01• Dynode = 7 kV
a In the the Trap Control window, click the Calibration tab.
b Click Detector.c Check that the settings are correct for
the Mass and Dynode.
2 See if detector calibration is needed.
Perform a simple check:a Click Check, and follow instructions.b If calibration is not required, click
Close, ORIf calibration is required, follow the these steps:• Click Calibrate.• Click Close when calibration is
complete.• Save the new settings when
prompted.
• If calibration is needed, a message appears. If no calibration is needed, the check completes with no message.
20 Agilent 6300 Series Ion Trap System Familiarization Guide

Prepare for the analysis 1
Task 6. Do an isolation calibration
Steps Detailed Instructions Comments
1 Do an isolation tune on m/z 622 of the ESI Tuning Mix.• This tune uses Smart Parameter
Settings (SPS) to make a correction for the presence of ions not of interest and optimizes the intensity of the ion of interest.
a Click the Mouse Cursor tool bar button.
b Click just to the right of the 622 peak in the line spectra window so that a white arrow appears above the m/z 622 peak.
c Right-click the Line Spectrum panel to get the short-cut menu.
d Click Run SPS.
• The intensity for 622 should improve.
2 Choose Manual MSn mode. a Click the MSn tab.b Mark the Manual MSn check box.
Agilent 6300 Series Ion Trap System Familiarization Guide 21

1 Prepare for the analysis
3 Isolate the ion, then reduce the isolation width to 0.6.
a Right click the Line Spectrum panel to get the short-cut menu.
b Click Isolate.c In the MSn property sheet, type 0.6 as
the Width for MS/MS and click Apply.
• If the ion disappears when you click Apply, you should do an isolation calibration with steps 4 and 5. Otherwise, the calibration is good, and you may skip steps 4 and 5.
4 Run the isolation calibration. a Click the Calibration tab.b Clear the Scan Calibration check box.c Mark the Isolation Calibration check
box.d Click Start to perform the calibration.
• Make sure that the syringe contains at least 50 µL of the ESI Tuning mix.
5 Update and save the calibration results.
• Click Save in the Auto Calibration Results dialog box.
• When the calibration successfully finishes, the Auto Calibration Results dialog box appears.
• The Current entry for the isolation calibration is updated when you click Save.
Steps Detailed Instructions Comments
22 Agilent 6300 Series Ion Trap System Familiarization Guide
Prepare for the analysis 1
Task 7. Do a fragmentation calibration
In a fragmentation calibration the system changes fragmentation settings to optimize the intensity of the 540 product ion. The highest level of product ion 540 generated should be at least 15% of the intensity level of the isolated 622 without fragmentation.
In this exercise you learn these tasks:
• Optimize and measure the intensity of the 622 ion without fragmentation
• Change fragmentation settings to produce the 540 ion
• Monitor the intensity of the 540 ion
• Do a fragmentation calibration to optimize the intensity of the 540 ion
Steps Detailed Instructions Comments
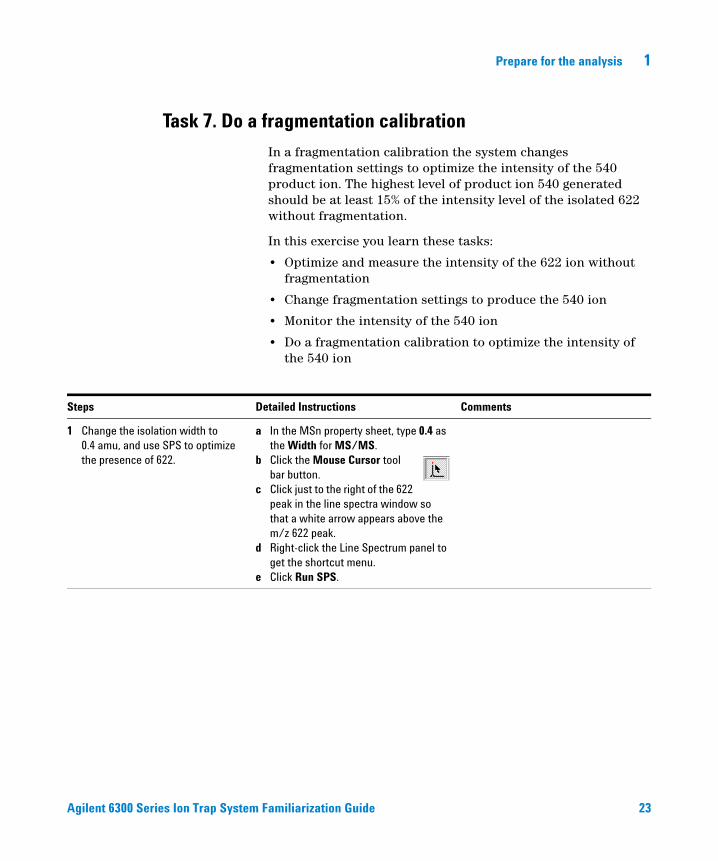
1 Change the isolation width to 0.4 amu, and use SPS to optimize the presence of 622.
a In the MSn property sheet, type 0.4 as the Width for MS/MS.
b Click the Mouse Cursor tool bar button.
c Click just to the right of the 622 peak in the line spectra window so that a white arrow appears above the m/z 622 peak.
d Right-click the Line Spectrum panel to get the shortcut menu.
e Click Run SPS.
Agilent 6300 Series Ion Trap System Familiarization Guide 23

1 Prepare for the analysis
Steps Detailed Instructions Comments
2 Measure the signal of the isolated 622.
• Clear the Auto Vertical Scale check box in the Line Spectrum window to put the display into a “creep” mode as opposed to a continuous normalization with respect to the base peak.
• In the figure below, the m/z ion has an intensity of approximately 1.4 x 10⁷
3 Verify these fragmentation parameters:• Cut-Off = Default.• SmartFrag is On.• Delay = 0 ms.• Time = 40 ms.• Width = 10.0 m/z.
a Click the Fragmentation button.b In the Fragmentation Options dialog
box, check that the values match those in the figure below.
c Click Apply, and click Close.
24 Agilent 6300 Series Ion Trap System Familiarization Guide

Prepare for the analysis 1
4 Monitor the 540 ion to check calibration.
• Measure the intensity of the 540 ion relative to that of the 622 ion without fragmentation (15% or more).
• The 540 ion should have an intensity of 2.0 x 10⁶ or about 15% of the intensity of the 622 peak that you measured in Step 2.
• If 540 m/z has 15% or greater intensity than the original intensity of 622 m/z from step 2, skip the fragmentation calibration in step 5.
5 Run the fragmentation calibration, and save results.• Assume that the intensity of the
540 ion is lower than 15% of the 622 ion without fragmentation.
• Make sure that the syringe contains at least 50 µL of the ESI Tuning mix.
a Click the Calibration tab.b Clear the Isolation Calibration check
box.c Mark the Fragmentation Calibration
check box.d Click Start.e Click Save.
• Monitor the calibration in the main window of the TrapControl program.
• When the calibration successfully finishes, the Auto Calibration Results dialog box appears.
• The Current entry for the fragmentation calibration is updated when you click Save.
Steps Detailed Instructions Comments
Agilent 6300 Series Ion Trap System Familiarization Guide 25

1 Prepare for the analysis
Exercise 3. Tune the Ion Trap
The tasks in this exercise show you how to optimize the signal sensitivity (MS mode) or the fragmentation amplitude (MS/MS mode) using the ESI tuning mix. You can use the tuning procedure described here as a model for determining the optimal instrument conditions for the acquisition of most samples.
As an alternative, you can use reserpine for these exercises by infusing the stock reserpine concentration (5 ng/µl) into the solvent flow. However, if you later infuse your own compound for instrument sensitivity, your results may contain unwanted background and high noise from residual reserpine.
To do an actual tune with your system, it is best to use your own sample or compound.
Task 1. Optimize signal intensity (MS)
Steps Detailed Instructions Comments
1 Load the default LCMS method, DEF_LCMS.M.
• In ChemStation, select Method > Load Method... and choose DEF_LCMS.M.
• The generic parameter values contained in the DEF_LCMS.M method produce a signal for most compounds but not an optimal one. You must optimize (tune) these values any time you increase the flow rate, change the solvent composition or analyze a new compound.
2 Make sure that these are the trap (6320) settings:• ICC is On• Smart Target = 200,000• Max Acc Time = 300 msec• Number of Averages = 5• Rolling Averaging = 2• Scan range is 100 to 2200
• Enter or change the Trap settings in the main window of the the TrapControl program.
• See the Quick Reference Guide for the settings for the 6310 model.
26 Agilent 6300 Series Ion Trap System Familiarization Guide

Prepare for the analysis 1
3 Prepare the LC and solvent.• 6300 LC: 400 µL/min flow rate• Cap LC: 20 µL/min flow rate• Solvent: 75/25 MeOH/water
with 5 mM ammonium formate
a In the ChemStation window, set the flow rates to those described in Step 3.
b Prepare the solvent with the composition of Step 3.
4 Modify the Source and Tune settings in the the Trap Control main window for the set flow rate:• Source (6300 LC at 400 µL/min):
Dry Gas Flow–9 L/minTemperature–350 °CNebulizer Pressure–40 psi
• Source (Cap LC at 20 µL/min):Keep settings loaded with DEF_LCMS.M
• Tune settings:Use recommended settings listed in the Ion Trap Quick Reference Guide.
a Enter or change the Source settings in the main window of the the TrapControl program.
b Click the Tune tab.c Enter or change the Tune settings.
• If you are using the 6300LC at a flow rate of 400 µL/min, installing a nebulizer spacer may possibly increase the signal.
5 Save any changes to TUNE_TEST.M. • In ChemStation, select Method > Save.
6 Disconnect the LC output from the UV detector and connect it to the ESI source on the Ion Trap LC/MS.
• Use a T-connection into the 5 µL/min flow of the ESI Tuning Mix delivered by the syringe pump.
• This technique is a practical way to optimize signal response in the Ion Trap LC/MS. The sample of interest (in this case the ESI Tuning Mix) is monitored continuously as the settings are optimized for LC conditions reflecting those that will exist when the actual unknown sample concentrations are introduced.
7 Deconfigure the UV detector since you do not use it for the test.
a In ChemStation, select Instrument > Configure 6300 Access.
b Remove the UV module, and click OK.
c Restart the ChemStation program.d Disconnect the network cable at the
back of the detector.
• If you want to use the UV detector in tandem with the Trap, make sure to reconfigure and reconnect the detector.
Steps Detailed Instructions Comments
Agilent 6300 Series Ion Trap System Familiarization Guide 27

1 Prepare for the analysis
8 Tune the system in preparation for testing sensitivity.
a Using the Mouse Maximum Cursor, click to the right of the m/z 622 peak in the Line Spectrum window.
b Select Run SPS.
• This procedures uses a calibrant mass close to the m/z value of reserpine ((M+H)+ = 609.3).
• The corresponding mass is 622.03.
9 Optimize Oct 1 (6310, 6320) or Octopole Delta.
a Click the Optimize tab.b Select the appropriate parameter
from the pull-down list for Smart Ramp.
c Enter a Target Mass of 622 and click Start (Figure 1).
• See also, the Quick Reference Guide. • The optimization process is shown in
Figure 2.• A new parameter value appears, and
is added automatically to the setting for Octopole Delta (Figure 3).
• If you do not want to implement the change, click Undo to retain the original setting.
Figure 1 Before optimization
Steps Detailed Instructions Comments
28 Agilent 6300 Series Ion Trap System Familiarization Guide

Prepare for the analysis 1
Figure 2 During optimization
Figure 3 After optimization
Steps Detailed Instructions Comments
Agilent 6300 Series Ion Trap System Familiarization Guide 29

1 Prepare for the analysis
Task 2. Optimize fragmentation (MS/MS)
Two procedures are available to optimize the fragmentation of a compound of interest. Both procedures require that you implement isolation and fragmentation of the precursor ion of interest in the MS(n) tab-view of the Manual MS(n) display.
Automatic Use the optimization procedure in the Optimize tab-view of the TrapControl program for optimizing the Fragmentation Amplitude of an MS/MS transition that involves a precursor ion of interest and up to two product or Target ions. In the case of the ESI tuning mix, the precursor ion is 622, and the two Target ions are 540 and 478. Most users choose the automatic procedure because of its simplicity.
Manual The manual procedure involves performing a series of injections at various fragmentation amplitudes to determine the optimum amplitude that produces the maximum number of product ions. You can program the series of injections as shown in the sensitivity test for reserpine in the Installation Guide.
10 Optimize Trap Drive, then Cap Exit keeping the 622 Target Mass.
a Repeat Step 10 with corresponding parameters accessed in the Smart Ramp box.
b Click Start each time.
11 Save the LC/MS method again. • Return to ChemStation and select Method > Save to overwrite TUNE_TEST.M with the optimized MS settings for the 622 ESI Tuning Mix ion.
• This completes the MS portion of method development.
Steps Detailed Instructions Comments
30 Agilent 6300 Series Ion Trap System Familiarization Guide

Prepare for the analysis 1
You learn the automatic procedure in this exercise using the 622 ESI tuning ion.
Steps Detailed Instructions Comments
1 Turn off SmartFrag. a Click the MSn tab.b Make sure that the Manual MS(n)
check box is marked.c In the MSn tab-view, right-click the
view, and select Fragmentation...d Clear the On check box under
SmartFrag.e Click Apply, then Close.
• SmartFrag is useful for qualitative work where an abundance of fragment ions is desirable, but for sensitive measurements in quantitation, turn off SmartFrag to maximize the intensity of just a few product ions versus an entire mass range.
2 Verify settings.• Isolation = On• Mass = 622.1• Width = 4• Fragmentation = On• Amplitude (Ampl) = a value,
usually 1.00 as a starting point.
a In MSn tab view, verify that settings match those shown to the left under the Steps column.
b Click Apply.
• You can view the settings and fragmentation pattern in the figure below.
Agilent 6300 Series Ion Trap System Familiarization Guide 31

1 Prepare for the analysis
Steps Detailed Instructions Comments
3 Optimize the intensity of the 540 ion. a Click the Optimize tab.b In Optimize tab view, select 540 as
the Target Mass, and optimize over the Frag Ampl, as shown below.
• You can also monitor the precursor ion intensity (622) by entering its value as the Add Monitor Mass value in the view shown below.
32 Agilent 6300 Series Ion Trap System Familiarization Guide
Agilent 6300 Series Ion Trap SoftwareFamiliarization Guide
2Set up and run acquisition methods
Exercise 1. Set up a full-scan acquisition method 34
Exercise 2. Acquire data with the full-scan method 43
Exercise 3. Change and run method to optimize peak height 45
Exercise 4. Set up and run an AutoMS(n) acquisition method 49
To view and work with the results of these exercises, see Chapter 3, “Review data and identify compounds”.
These exercises help you become familiar with how to set up acquisition methods for the demonstration sample (sulfa mix) and acquire data with these methods.
The LC parameters that you enter in these exercises are appropriate for the standard Agilent 6300LC. You must enter LC parameters appropriate for your model LC.
Before you start
• Make sure that you read the Quick Start Guide.
• Make sure that you prepare the LC, column and sample as described in Chapter 1, “Prepare the column and sample to run the ESI sulfa mix sample (Chapter 2 exercises).
For the tasks on the following pages, try the steps on the left without the detailed instructions. If you need more help, follow the detailed instructions on the right.
33Agilent Technologies

2 Set up and run acquisition methods
Exercise 1. Set up a full-scan acquisition method
Agilent recommends that you edit the MS or LC parameters from an existing LC/MS method.
Task 1. Enter LC acquisition parameters
Steps Detailed Instructions Comments
1 Open the DEF_LCMS.M method from the ChemStation main window.
a Click the ChemStation window or click its button on the bottom toolbar.
b Select File > Open.c Select DEF_LCMS.M and click
Open.
2 Enter a volume of 1 μl for the injection.
a Click the Injector icon to bring up the Autosampler menu.
b Select Set up injector.c Select Standard Injection, and type
1 μl in the Injection Volume text box.
34 Agilent 6300 Series Ion Trap System Familiarization Guide

Set up and run acquisition methods 2
Steps Detailed Instructions Comments
3 Enter a needle offset of 3mm if the vials have conical inserts.
a Click More >>.b Type 3.0 in the Draw Position text
box.
• The offset prevents the needle from damaging vials with conical inserts.
4 Accept the Autosampler parameters.
• Click OK.
5 Enter pump parameters as they appear in the figure on the next page.
• Click the pump icon and select Set up Pump....
Agilent 6300 Series Ion Trap System Familiarization Guide 35

2 Set up and run acquisition methods
6 Set up the timetable as it appears in the figure below.
a Select Timetable from the Display List.
b Click Insert, and enter the first line.c Click Append, and enter the second
line.d Repeat c for lines 3 and 4.e Click OK.
Steps Detailed Instructions Comments
36 Agilent 6300 Series Ion Trap System Familiarization Guide

Set up and run acquisition methods 2
7 Enter a column compartment temperature of 40oC.
a Click the Column Compartment icon and select Set up Column Thermostat...
b Select oC.c Enter 40.0.d Click OK.
• The C18 column operates best at 40 °C.
Steps Detailed Instructions Comments
Agilent 6300 Series Ion Trap System Familiarization Guide 37

2 Set up and run acquisition methods
8 Enter the DAD Detector parameters:• Store Signal A: 254 nm, 4 nmBw• Reference: 360 nm, 100 nm Bw• Peakwidth = > 0.1 min
a Click the UV Detector GUI and select Set up DAD Signals... from the menu.
b Enter the parameters described in Step 8 and in the figure below.
• DAD is used in this sample, but the VWD may be used analogously.
Steps Detailed Instructions Comments
38 Agilent 6300 Series Ion Trap System Familiarization Guide

Set up and run acquisition methods 2
9 Select options for the Run Time Checklist:• Data Acquisition• Data Analysis
a Click the GLP icon and select Run Time Checklist...
b Mark the Data Acquisition and Standard Data Analysis check boxes.
c Click OK.
• The Run Time Checklist is used for GLP acquisition and data processing specifications.
10 Save the new parameters to the LC/MS method file, SULFMS1.M.
• In the ChemStation window, select Method > Save Method As, and enter SULFMS1.M as the Name.
Steps Detailed Instructions Comments
Agilent 6300 Series Ion Trap System Familiarization Guide 39

2 Set up and run acquisition methods
Task 2. Enter MS Acquisition Parameters
Steps Detailed Instructions Comments
1 Switch to the TrapControl program. You can do this in any of three ways:• Click the ChemStation main window,
and select Settings from the menu, or• Select the the TrapControl program
icon from the bottom task bar, or• Click the Trap icon at the top
left of the screen.
2 Enter the following Mode parameters (6320).• To enter parameters for other
models, see the Quick Reference Guide.
a Click the Mode tab.b Enter the Mode parameters as
shown in the figure.c Click Apply.
• Values for the 6320 model are shown.
40 Agilent 6300 Series Ion Trap System Familiarization Guide

Set up and run acquisition methods 2
3 Enter theTune parameters shown in the figure below.• For an explanation of the SPS
parameters, see Concepts Guide and the Online Help.
• To enter parameters for other models, see the Quick Reference Guide.
• As additional practice at a later time, change the Compound Stability parameter to 50%, save the method, and acquire the data to observe the difference in the mass spectra.
a Click the Tune tab. b Enter the Tune parameters into the
Tune tab view. c Click Apply.
• Note the parameters for Smart Parameter Settings (SPS). The target m/z should reflect the analyte ion mass, which is a good starting point for the optimal transfer and accumulation of the sample ions for the sulfa mixture.
4 Set up to monitor the total ion chromatogram (TIC).
a Click the Chromatogram tab.b Select TIC,All MS/MS, if not
selected.c Click Apply.
Steps Detailed Instructions Comments
Agilent 6300 Series Ion Trap System Familiarization Guide 41

2 Set up and run acquisition methods
5 Specify the acquisition of Profile mass spectra.
a Click the Mode tab.b Mark the Save Spectra check box.c Select On to include profile spectra.d Click Apply.
• To save disk space you usually set up to acquire line spectra (Include Profile Spectra Off). However, if you intend to search the MASCOT database with spectra from intact proteins or protein digest/peptides, you must acquire and deconvolute profile spectra. In this exercise, you practice acquiring profile spectra.
6 Monitor the signal to ensure a stable baseline, using:• Scanning range of 50 to 400 m/z• Flow rate of .4 ml/min
a Make sure that all modules are turned on.
b Monitor the signal from the Ion Trap Control main window.
• If the baseline fluctuation is greater than 10%, consider carrying out maintenance procedures on the Nebulizer and Source Chamber.
7 Leave the TrapControl program and return to ChemStation to save the method.
a Click on the ChemStation window.b Select Method > Save Method to
overwrite the method SulfMS1.M
Steps Detailed Instructions Comments
42 Agilent 6300 Series Ion Trap System Familiarization Guide

Set up and run acquisition methods 2
Exercise 2. Acquire data with the full-scan method
Now you are ready to acquire data for the sulfa mix with the method you just created.
Task 1. Enter sample information
Steps Detailed Instructions Comments
1 Bring up the Sample Information dialog box in the ChemStation window.
a Click the sample vial icon. b Select Sample Info.
2 Enter the sample information:• Prefix/Counter• Prefix–ACQ• Counter–00000• Subdirectory–D:\Data\Yourname• Vial location–1
a Select Prefix/Counter.b Enter a Prefix of ACQ, and a Counter
of 00000.c Enter the name of the Subdirectory
as in Step 2.d Click OK.
• If you select Prefix/Counter, names increment automatically from one run to the next.
Agilent 6300 Series Ion Trap System Familiarization Guide 43
2 Set up and run acquisition methods
Task 2. Acquire the data
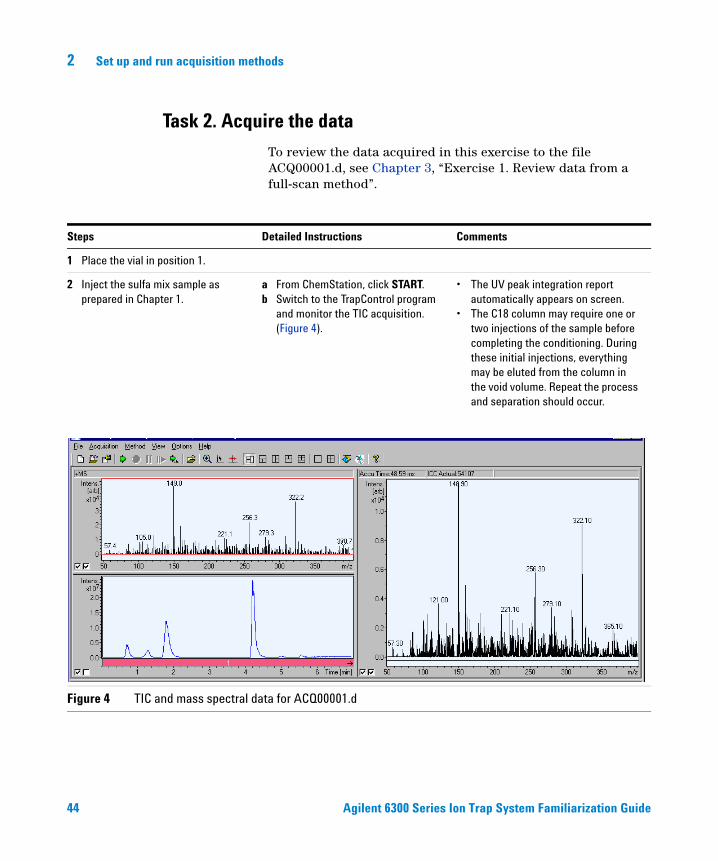
To review the data acquired in this exercise to the file ACQ00001.d, see Chapter 3, “Exercise 1. Review data from a full-scan method”.
Steps Detailed Instructions Comments
1 Place the vial in position 1.
2 Inject the sulfa mix sample as prepared in Chapter 1.
a From ChemStation, click START.b Switch to the TrapControl program
and monitor the TIC acquisition. (Figure 4).
• The UV peak integration report automatically appears on screen.
• The C18 column may require one or two injections of the sample before completing the conditioning. During these initial injections, everything may be eluted from the column in the void volume. Repeat the process and separation should occur.
Figure 4 TIC and mass spectral data for ACQ00001.d
44 Agilent 6300 Series Ion Trap System Familiarization Guide

Set up and run acquisition methods 2
Exercise 3. Change and run method to optimize peak height
In this exercise you learn to set up a method for the sulfa mix with parameter-dependent time intervals called segments. You create segments to optimize the signal for each peak. To do this, you interactively define the time intervals on the TIC plot in the Ion Trap Control main window and set up to fragment the molecular ion for each peak.
To review the data acquired in this exercise to the file ACQ00003.d, see Chapter 3, “Exercise 2. Review data from method to optimize peak height”.
Task 1. Set up first segment and time interval
Steps Detailed Instructions Comments
1 Open the data file ACQ00002.d in the the Trap Control main window, or open SULFMS01.d from the Example Data directory.
a Select File > Open Analysis File...b Select ACQ00002.d, and click Open.
• With ACQ00002.d opened in the TrapControl program, your TIC plot should resemble the figure below.
2 Set up the manual mode for fragmentation.
a Click the MS(n) tab.b Select the ManualMS(n) radio
button.c Mark the ManualMS(n) check box.
• Setting up time intervals allows you to isolate each corresponding molecular ion to see the fragmentation spectra.
• In order to enter the molecular ion to optimize the signal for a peak, you must be in manual mode.
Agilent 6300 Series Ion Trap System Familiarization Guide 45

2 Set up and run acquisition methods
3 Add a segment to create two segments.
a Right-click the chromatogram display to access the shortcut menu.
b Select Insert New Segment Limit.
• Notice the addition to the display.• You must add a second segment to
adjust the time interval of the first.
4 Adjust the time interval for the first segment.
a Select the number 1 time segment.b Click on the segment end line.c Adjust the time range by sliding the
end line.
• Because you know the ion masses eluting during a given time interval, you can set up a time interval around each eluting peak.
• For a more specific adjustment, return to the shortcut menu and make the appropriate selection.
5 Make sure that: • Both MS/MS isolation and
fragmentation are on • 271 is the MS/MS mass.
a Mark the On check boxes for MS/MS Isolation and Framentation .
b Enter 271 as the MS/MS mass if not entered.
c Click Apply.
Steps Detailed Instructions Comments
46 Agilent 6300 Series Ion Trap System Familiarization Guide

Set up and run acquisition methods 2
Task 2. Set up additional segments
Steps Detailed Instructions Comments
1 Add the third segment, and set (M+H)+ = 285 for the second segment.
• Follow Steps 3-5 in Task 1, but select the number 2 time segment, and enter 285 as the MS/MS mass.
2 Add a fourth segment, and set (M+H)+ = 279 for the third segment.
• Follow Steps 3-5 in Task 1, but select the number 3 time segment, and enter 279 as the MS/MS mass.
3 Set the molecular ion for the fourth segment as 311, and apply the settings.
a Select the number 4 time segment.b Mark the On check boxes for
Isolation and Fragmentation if not on.
c Enter 311 as the MS/MS mass if not entered.
d Mark the ManualMS(n) check box.e Click Apply.
Agilent 6300 Series Ion Trap System Familiarization Guide 47

2 Set up and run acquisition methods
Task 3. Set up display and acquire data
Steps Detailed Instructions Comments
1 Monitor both the MS and the MS/MS scans.
a Click the Chromatogram tab.b If the dialog box does not include the
MS/MS plot, do the following:• Select Total Ion Chrom. from the
Type list.• Select Red from the Color list.• Select All MS/MS from the
Filter list and click Apply.
• If, for some reason, BPC,MS is not listed, do the following:• Select Base Peak Chrom. from
the Type list.• Select Blue from the Color list.• Select MS from the Filter list and
click Apply.
2 Close the Analysis file before saving the method.
• Select File > Close Analysis File.
3 Save the new LC/MS method as SULFMS3.M.
a Click the ChemStation main window.b Select Method > Save Method As.c Enter the Name as SULFMS3.M.d Click SAVE AS.
4 Acquire the data to data file, ACQ00003.d, and compare the chromatographic display for this run with that of the run in “Exercise 2. Acquire data with the full-scan method" on page 43.
a From ChemStation, click START.b Switch to the TrapControl program.c Compare the displays.
• The first two peaks of this trace should be higher than those in Exercise 2.
48 Agilent 6300 Series Ion Trap System Familiarization Guide

Set up and run acquisition methods 2
Exercise 4. Set up and run an AutoMS(n) acquisition method
The AutoMS(n) capability of the Ion Trap allows you to collect MS/MS data on ions without using a preset mass list. The instrument scans in MS mode, and ions that exceed a preset ion current threshold are automatically isolated and fragmented.
This exercise shows you how to set up an AutoMS(n) method to analyze an unknown mixture. Because you have already performed a full-scan MS run, you know the times that the four peaks elute from the column. Assume the masses are unknown.
Task 1. Enter the threshold
Steps Detailed Instructions Comments
1 Open the data file ACQ00002.d in the the Trap Control main window.
a Select File > Open Analysis File...b Select ACQ00002.d, and click Open.
2 Activate the AutoMS(n) function. a Click the MS(n) tab.b Select AutoMS(n) in the MS(n) tab
view.
• Do not mark the Auto MS(2) check box yet. If the AutoMS(2) box is clear, you can graphically manipulate the Threshold and Include and Exclude masses.
Agilent 6300 Series Ion Trap System Familiarization Guide 49

2 Set up and run acquisition methods
Task 2. Enter more parameters
Steps Detailed Instructions Comments
3 Change the threshold line graphically from 100,000 to 30,000.
a Click and drag the line to a position above the background in the upper left-hand line spectrum window.
b To change the level, type 30,000 in the Threshold Abs box.
• Before any ions are isolated and fragmented, their intensities must exceed the pre-set threshold value.
Steps Detailed Instructions Comments
1 Enter Trap parameters.• Leave the scan range set to
50–400.• Set the number of scans
averaged to 5.
• Enter 5 as the Averages. • For more information on the Trap parameters, including ICC, Target, Max. Acc Time, Averages, and Rolling Averaging, see the Concepts Guide.
2 View or change the Advanced parameters as in the figure below.
a Click Advanced on the MS(n) tab.b View or enter the parameters below. c If you entered values, click Apply,
then click Close. If not, click Close.
• Fragmentation amplitude, MS/MS Frag Ampl, is fixed for all MS/MS transitions.
50 Agilent 6300 Series Ion Trap System Familiarization Guide

Set up and run acquisition methods 2
Task 3. Set up display and acquire data
To review the data acquired in this exercise to the file ACQ00004.d, see Chapter 3, “Exercise 3. Review data from the AutoMS(n) method”.
Steps Detailed Instructions Comments
1 Monitor both the MS and the MS/MS scans.
• Follow the instructions for Exercise 4, “Task 3. Set up display and acquire data" on page 48, Step 1.
2 Make sure that the AutoMS(2) check box is marked in MS(n) view.
a Mark the Auto MS(n) check box.b Click Apply.
• Marking the AutoMS(2) box enables data-dependent acquisition. Place a check in this box before saving or running the method.
3 Save the MS changes in a new LC/MS method, S_AUTO1.M.
a Click on the ChemStation main window.
b Select Method > Save Method As.c Enter the Name, S_AUTO1.M, and
click SAVE AS.
4 Inject the sulfa mix sample as prepared in Chapter 1. ACQ00004.d is acquired.
a From ChemStation, click START.b Switch to the TrapControl program
and monitor the TIC acquisition.
• The chromatogram shows the superimposition of MS and MS/MS production currents.
Agilent 6300 Series Ion Trap System Familiarization Guide 51

2 Set up and run acquisition methods
Task 4. Modify and run the method with selected masses
In this method you select only the sulfa mixture molecular ions for MS/MS fragmentation. This selection avoids the fragmentation of any contaminant ions that have intensities close to, or greater than, the sulfa mixture molecular ions.
To review the data acquired in this exercise to the file ACQ00005.d, see “Task 2. Find compound spectra with selected masses" on page 80” in Chapter 3, “Exercise 3. Review data from the AutoMS(n) method”.
Steps Detailed Instructions Comments
1 Enter the ion masses below to do a selective MS/MS fragmentation:271279285311
a Click the MS(n) tab.b Select the Include radio button.c Type the ion mass in the text box
below the button, and click the Ins (Insert) button.
d Repeat the procedure until all four ion masses are listed.
• Fragmentation amplitude and isolation width are constant for all four ions.
52 Agilent 6300 Series Ion Trap System Familiarization Guide

Set up and run acquisition methods 2
2 Return to ChemStation and save these changes to a new method, S_AUTO2.M.
a Click on the ChemStation main window.
b Select Method > Save Method As.c Enter the Name, S_AUTO2.M, and
click SAVE AS.
3 Inject the sulfa mix sample as prepared in Chapter 1. ACQ00005.d is acquired.
a From ChemStation, click START.b Switch to the TrapControl program
and monitor the TIC acquisition.
• One of the four designated ion masses is isolated and fragmented only when its abundance rises above the threshold.
Steps Detailed Instructions Comments
Agilent 6300 Series Ion Trap System Familiarization Guide 53

2 Set up and run acquisition methods
54 Agilent 6300 Series Ion Trap System Familiarization Guide

Agilent 6300 Series Ion Trap SystemConcepts Guide
3Review data and identify compounds
Exercise 1. Review data from a full-scan method 56
Exercise 2. Review data from method to optimize peak height 71
Exercise 3. Review data from the AutoMS(n) method 74
Exercise 4. Create and use a library to identify unknowns 85
Exercise 5. Create or edit a report layout 101
Exercise 6. Create a method to automate analysis and reporting 104
This chapter shows you how to analyze data and create custom libraries to search for unknown compounds:
These exercises use the data files generated in the exercises of Chapter 2, “Set up and run acquisition methods”. For Exercises 1 and 3, you can use demo data files in the Example Data directory.
• Change the chromatographic display
• Find compounds
• Generate reports with existing formats
• Create a mass spectral library
• Use the library to identify unknown compounds
• Set up report layouts
• Automate analysis and reporting
Before you start
• Make sure that you read the Quick Start Guide.
• Make sure that you set up and run the acquisition methods in Chapter 2, “Set up and run acquisition methods” or that you install the Example Data directory onto your system.
For the tasks on the following pages, try the steps on the left without the detailed instructions. If you need more help, follow the detailed instructions on the right.
55Agilent Technologies

3 Review data and identify compounds
Exercise 1. Review data from a full-scan method
In this exercise you review data from the acquisition in “Exercise 2. Acquire data with the full-scan method" on page 43”.
Task 1. Change the chromatographic display
Steps Detailed Instructions Comments
1 Open the data file, ACQ00001.d, which was acquired in Chapter 2, OR open the data file, SULFMS01.d, located in the Example Data directory.
a Click the DataAnalysis icon in ChemStation.
b Select File > Open, and choose the data file.
c Click Open.
• The layout of the default view includes the Chromatogram and the Analysis List panes. The Analysis List pane shows what file is open and displays information.
56 Agilent 6300 Series Ion Trap Systems Concepts Guide

Review data and identify compounds 3
Steps Detailed Instructions Comments
2 Change the Chromatogram view so that the MS and UV chromatograms and the Accumulation Time signal are overlaid in the display.
a Right-click the chromatogram pane to bring up a shortcut menu.
b Select Edit Chromatograms.
• The selection of the three traces is to demonstrate that the data file contains acquisition parameters such as Accumulation Time.
Agilent 6300 Series Ion Trap Systems Concepts Guide 57

3 Review data and identify compounds
c Select the Type as Chromatogram and the Parameter as UV.
d Click Add.e Select the Type as Acquisition
Parameter Trace and the Parameter as Accumulation Time (Trap).
f Click Add, and click OK.
Steps Detailed Instructions Comments
58 Agilent 6300 Series Ion Trap Systems Concepts Guide

Review data and identify compounds 3
3 View all three traces without having to scroll.
a Click the List tab at the bottom of the pane.
b Right-click the List pane.c Select List Windows > 3 windows.
• When the separate traces first appear, you scroll to see all three.
• When you select 3 windows, you do not have to scroll to see all three.
Steps Detailed Instructions Comments
Agilent 6300 Series Ion Trap Systems Concepts Guide 59
3 Review data and identify compounds
Task 2. Examine the mass spectra
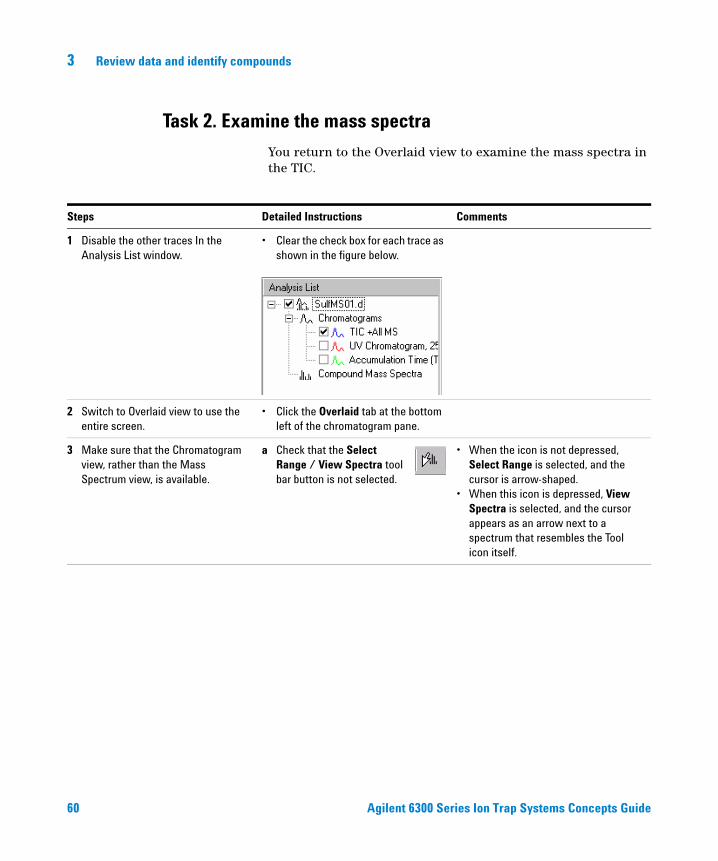
You return to the Overlaid view to examine the mass spectra in the TIC.
Steps Detailed Instructions Comments
1 Disable the other traces In the Analysis List window.
• Clear the check box for each trace as shown in the figure below.
2 Switch to Overlaid view to use the entire screen.
• Click the Overlaid tab at the bottom left of the chromatogram pane.
3 Make sure that the Chromatogram view, rather than the Mass Spectrum view, is available.
a Check that the Select Range / View Spectra tool bar button is not selected.
• When the icon is not depressed, Select Range is selected, and the cursor is arrow-shaped.
• When this icon is depressed, View Spectra is selected, and the cursor appears as an arrow next to a spectrum that resembles the Tool icon itself.
60 Agilent 6300 Series Ion Trap Systems Concepts Guide

Review data and identify compounds 3
4 Highlight the third peak in the chromatogram.
• Click on the third peak and drag the cursor over it as shown in the figure below.
Steps Detailed Instructions Comments
Agilent 6300 Series Ion Trap Systems Concepts Guide 61
3 Review data and identify compounds
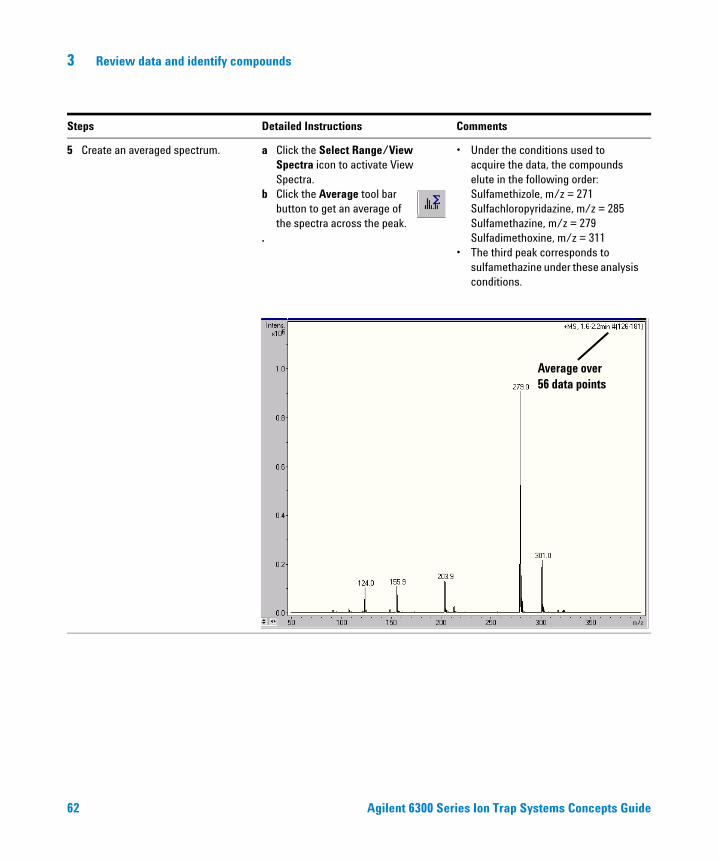
5 Create an averaged spectrum. a Click the Select Range/View Spectra icon to activate View Spectra.
b Click the Average tool bar button to get an average of the spectra across the peak.
.
• Under the conditions used to acquire the data, the compounds elute in the following order:Sulfamethizole, m/z = 271Sulfachloropyridazine, m/z = 285Sulfamethazine, m/z = 279Sulfadimethoxine, m/z = 311
• The third peak corresponds to sulfamethazine under these analysis conditions.
Steps Detailed Instructions Comments
Average over 56 data points
62 Agilent 6300 Series Ion Trap Systems Concepts Guide

Review data and identify compounds 3
6 Check for possible changes in the Line and Profile displays of the Mass Spectrum view.
a Select Tools > Options > Mass Spectrum View > Spectrum Type.
b Select Line or Profile.
• You can view both Centroid (Line) and Profile spectra because you specified Profile data acquisition.
7 Produce a single point mass spectrum in the Mass Spectrum view.
• Click anywhere on the chromatogram.
Steps Detailed Instructions Comments
Single data point #147
Agilent 6300 Series Ion Trap Systems Concepts Guide 63

3 Review data and identify compounds
Task 3. Find compound spectra
In this exercise you use software algorithms to search chromatographic data for compound-specific spectra. The system presents the results in an easily viewable format.
Steps Detailed Instructions Comments
1 Select the time range of the chromatogram.
• To select the range, click and drag the cursor over the desired area.
64 Agilent 6300 Series Ion Trap Systems Concepts Guide
Review data and identify compounds 3
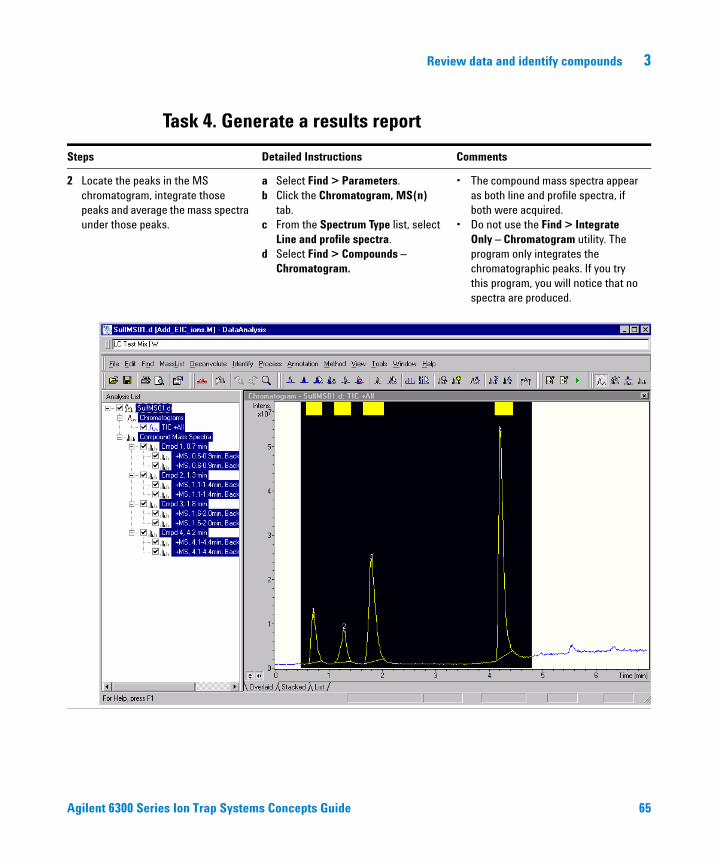
Task 4. Generate a results report
Steps Detailed Instructions Comments
2 Locate the peaks in the MS chromatogram, integrate those peaks and average the mass spectra under those peaks.
a Select Find > Parameters.b Click the Chromatogram, MS(n)
tab.c From the Spectrum Type list, select
Line and profile spectra.d Select Find > Compounds –
Chromatogram.
• The compound mass spectra appear as both line and profile spectra, if both were acquired.
• Do not use the Find > Integrate Only – Chromatogram utility. The program only integrates the chromatographic peaks. If you try this program, you will notice that no spectra are produced.
Agilent 6300 Series Ion Trap Systems Concepts Guide 65

3 Review data and identify compounds
3 Open the Compound Mass Spectra window to see the averaged spectra.
• Select Window > Compound Mass Spectra.
• According to the Analysis List results, there are two spectra for each compound.
Steps Detailed Instructions Comments
66 Agilent 6300 Series Ion Trap Systems Concepts Guide

Review data and identify compounds 3
4 View both spectra in the same window.
a Right-click the Compound Mass Spectra window.
b Select List windows > 2 windows.
Steps Detailed Instructions Comments
Agilent 6300 Series Ion Trap Systems Concepts Guide 67
3 Review data and identify compounds
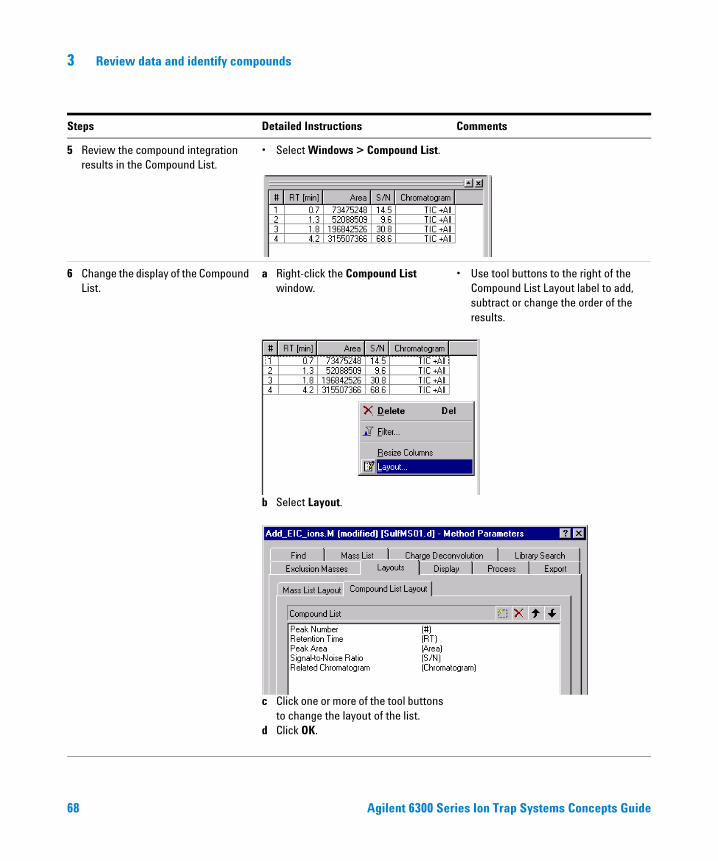
5 Review the compound integration results in the Compound List.
• Select Windows > Compound List.
6 Change the display of the Compound List.
a Right-click the Compound List window.
b Select Layout.
c Click one or more of the tool buttons to change the layout of the list.
d Click OK.
• Use tool buttons to the right of the Compound List Layout label to add, subtract or change the order of the results.
Steps Detailed Instructions Comments
68 Agilent 6300 Series Ion Trap Systems Concepts Guide

Review data and identify compounds 3
Steps Detailed Instructions Comments
1 Select a Compound Mass Spectrum Report from the list of available reports.
a Select File > Print...b For this example, select Cmpd Mass
Spec Report – MS (P) from the list of Layouts.
2 Accept your selection and exit. a Click OK. b When prompted to save your
processed results, always click Yes.
• A Compound Mass Spectrum List report is generated (Figure 5 on page 70).
• For more information on the creation and modification of layouts, see “Exercise 5. Create or edit a report layout" on page 101.
Agilent 6300 Series Ion Trap Systems Concepts Guide 69

3 Review data and identify compounds
Figure 5 Printout of SULFMS01.d (ACQ00001.d) with the Compound Mass Spectrum List layout (p. 1/4)
70 Agilent 6300 Series Ion Trap Systems Concepts Guide

Review data and identify compounds 3
Exercise 2. Review data from method to optimize peak height
In Chapter 2, “Exercise 3. Change and run method to optimize peak height”, you set up segments in the Trap Control program to optimize the height of each peak. In this exercise you open the resulting data analysis file in the TrapControl program to modify parameters and resave the method. You would do this with your own methods and data and run the acquisition again to make sure the heights are optimized.
Agilent 6300 Series Ion Trap Systems Concepts Guide 71

3 Review data and identify compounds
Steps Detailed Instructions Comments
1 Open the ACQ00003.d file in the TrapControl program.
a Click the the TrapControl program icon in ChemStation.
b Select File > Open Analysis File, and choose the data file.
c Click Open.
• This data file does not reside in the Example Data directory. You must acquire the data in Exercise 3 of Chapter 2.
72 Agilent 6300 Series Ion Trap Systems Concepts Guide
Review data and identify compounds 3
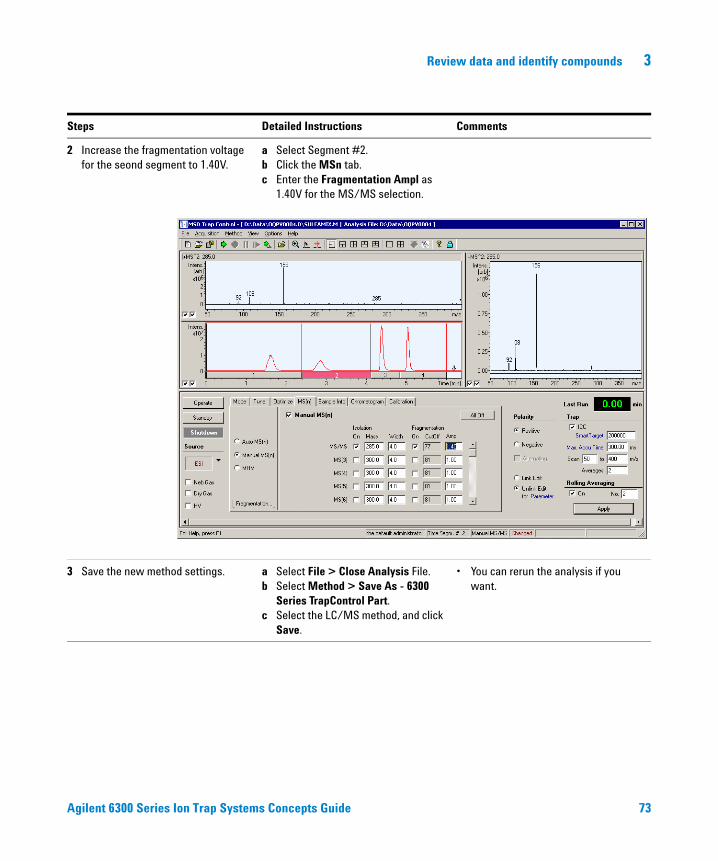
Steps Detailed Instructions Comments
2 Increase the fragmentation voltage for the seond segment to 1.40V.
a Select Segment #2.b Click the MSn tab.c Enter the Fragmentation Ampl as
1.40V for the MS/MS selection.
3 Save the new method settings. a Select File > Close Analysis File.b Select Method > Save As - 6300
Series TrapControl Part.c Select the LC/MS method, and click
Save.
• You can rerun the analysis if you want.
Agilent 6300 Series Ion Trap Systems Concepts Guide 73
3 Review data and identify compounds
Exercise 3. Review data from the AutoMS(n) method
In this exercise you review data from the acquisition in “Task 3. Set up display and acquire data in Chapter 2, “Exercise 4. Set up and run an AutoMS(n) acquisition method”.
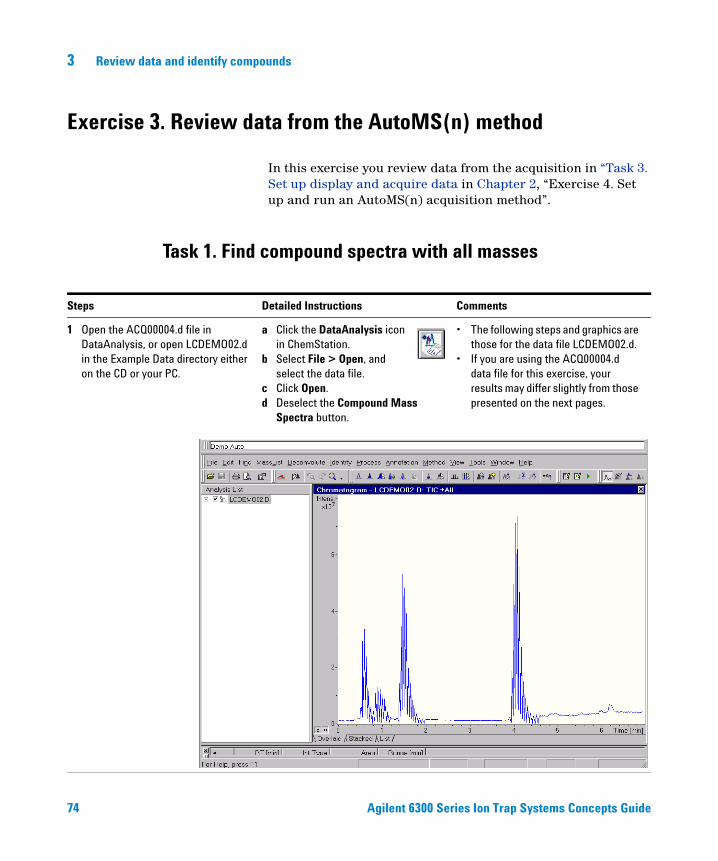
Task 1. Find compound spectra with all masses
Steps Detailed Instructions Comments
1 Open the ACQ00004.d file in DataAnalysis, or open LCDEMO02.d in the Example Data directory either on the CD or your PC.
a Click the DataAnalysis icon in ChemStation.
b Select File > Open, and select the data file.
c Click Open.d Deselect the Compound Mass
Spectra button.
• The following steps and graphics are those for the data file LCDEMO02.d.
• If you are using the ACQ00004.d data file for this exercise, your results may differ slightly from those presented on the next pages.
74 Agilent 6300 Series Ion Trap Systems Concepts Guide

Review data and identify compounds 3
Steps Detailed Instructions Comments
2 Change parameters for the AutoMS(n) process so that the dialog box looks like the figure below.
a Select Find > Parameters... > AutoMS(n).
b Clear the Fragments qualified by check box.
c Click OK.
Agilent 6300 Series Ion Trap Systems Concepts Guide 75

3 Review data and identify compounds
3 Automatically generate extracted ion chromatograms and mass spectral results.
• Select Find > Compounds – AutoMS(n).
• This performs the following analytical steps:• Finds the MS2 experiments.• Generates EICs with MSn filters.• Averages all MS2 spectra from
the same parent.• Averages all preceding MS
spectra.• Transfers all spectra to compound
mass spectral results.• The results of the Find operation are
listed in the Analysis List window. Note that five compounds are found instead of the four sulfa drugs.
Steps Detailed Instructions Comments
76 Agilent 6300 Series Ion Trap Systems Concepts Guide

Review data and identify compounds 3
4 Expand the third peak in the chromatogram.
a Click the Zoom In button.b Click and drag the cursor over the
third peak.
• The program identified two compounds within this peak.
5 View the mass spectrum of the first data point.
a Deselect the Compound Mass Spectra button.
b Click Select Range/View Spectra to view spectra.
c Click on the first subpeak in the expanded third peak.
• Note the corresponding mass spectrum in the Mass Spectrum view. The most intense ion is 279.0.
• You must have a chromatographic trace selected in the Analysis List for this function to work.
Steps Detailed Instructions Comments
Agilent 6300 Series Ion Trap Systems Concepts Guide 77

3 Review data and identify compounds
6 Click the next data point in the chromatogram.
• Place the cursor on the valley between peaks and click the mouse button.
• The criteria have been met. The next scan should be an MS/MS scan of precursor ion 271.
Steps Detailed Instructions Comments
78 Agilent 6300 Series Ion Trap Systems Concepts Guide

Review data and identify compounds 3
7 Find compounds again after you change the integration threshold to eliminate the identification of the extra compound(s).• Use 200,000.
a Select Find > Parameters...b Click the AutoMS(n) tab.c Enter 200,000 for the Intensity
Threshold.
d Click OK.e Select Find > Compounds –
AutoMS(n).
• You can estimate the threshold by looking at the abundance of the unwanted precursor ions. The threshold must be above this abundance.
• You now see only the four sulfa compounds.
8 Select a Compound Mass Spectrum Report from the list of available reports.
a Select File > Print...b For this example, select Cmpd Mass
Spec Report – AutoMSn (P) from the list of Layouts.
c Click OK. d When prompted to save your
processed results, always click Yes.
• For more information on the creation and modification of layouts, see “Exercise 5. Create or edit a report layout" on page 101.
Steps Detailed Instructions Comments
Agilent 6300 Series Ion Trap Systems Concepts Guide 79

3 Review data and identify compounds
Task 2. Find compound spectra with selected masses
In this exercise you review data from the acquisition in “Task 4. Modify and run the method with selected masses in Chapter 2, “Exercise 4. Set up and run an AutoMS(n) acquisition method”.
In the acquisition method used to acquire this data file, you included only the molecular ions of the four sulfa drugs as precursor ions.
Steps Detailed Instructions Comments
1 Open the ACQ00005.d file in DataAnalysis, or open LCDEMO02.d in the Example Data directory either on the CD or your PC.
a Click the DataAnalysis icon in ChemStation.
b Select File > Open, and select the data file.
c Click Open.d Deselect the Compound Mass
Spectra button.
• The following steps and graphics are those for the data file LCDEMO02.d.
• If you are using the ACQ00005.d data file for this exercise, your results may differ slightly from those presented on the next pages.
80 Agilent 6300 Series Ion Trap Systems Concepts Guide

Review data and identify compounds 3
Steps Detailed Instructions Comments
2 Change parameters for the AutoMS(n) process so that the dialog box looks like the figure below.
a Select Find > Parameters... > AutoMS(n).
b Clear the Fragments qualified by check box.
c Click OK.
Agilent 6300 Series Ion Trap Systems Concepts Guide 81

3 Review data and identify compounds
3 Automatically generate extracted ion chromatograms and mass spectral results.
• If you are using the ACQ00005.d file, you see only four compounds because you specified the molecular ions of the sulfa compounds as the precursor ions. Continue with Step 5.
• If you are using the LCDEMO02.d file, you see five compounds. Continue with Step 4.
• Select Find > Compounds – AutoMS(n).
• This performs the following analytical steps:• Finds the MS2 experiments.• Generates EICs with MSn filters.• Averages all MS2 spectra from
the same parent.• Averages all preceding MS
spectra.• Transfers all spectra to compound
mass spectral results.• The results of the Find operation are
listed in the Analysis List window.
Steps Detailed Instructions Comments
82 Agilent 6300 Series Ion Trap Systems Concepts Guide

Review data and identify compounds 3
4 Find compounds again after you change the maximum number of compounds to 4. (LCDEMO02.d only)
a Select Find > Parameters...b Click the AutoMS(n) tab.c Enter 4 for the Maximum number of
compounds.
d Click OK.
• You now see only the four sulfa compounds.
Steps Detailed Instructions Comments
Agilent 6300 Series Ion Trap Systems Concepts Guide 83

3 Review data and identify compounds
e Select Find > Compounds – AutoMS(n).
• You should see only the four sulfa compounds.
5 Select a Compound Mass Spectrum Report from the list of available reports.
a Select File > Print...b For this example, select Cmpd Mass
Spec Report – AutoMSn (P) from the list of Layouts.
c Click OK. d When prompted to save your
processed results, always click Yes.
• For more information on the creation and modification of layouts, see “Exercise 5. Create or edit a report layout" on page 101.
Steps Detailed Instructions Comments
84 Agilent 6300 Series Ion Trap Systems Concepts Guide

Review data and identify compounds 3
Exercise 4. Create and use a library to identify unknowns
This exercise describes how to create custom MS and MS/MS libraries with the Ion Trap DataAnalysis program and search unknown components with the libraries.
The same procedure is used to create both MS and MS/MS libraries, and you can save both types of spectra in the same library. Because mass spectra obtained using API techniques typically produce only molecular or pseudo-molecular ions, Agilent recommends that you build and search MS/MS libraries.
This exercise uses the MS/MS spectra obtained from the Auto-MS/MS analysis of the sample mixture containing four sulfa drugs.
Task 1. Open and process the data file for the library
Steps Detailed Instructions Comments
1 In Data Analysis open the data file, SulfMSMS.d, acquired in AutoMS(2) mode using these conditions: Flow rate–500 μl/min.Solvent A–0.05% TFA in waterSolvent B–0.045% TFA in ACNGradient (min.–%B)0–15/4–65/5–100/6–15Stop Time–5.00 min.Post Time–1.00 min.Injection Volume–1 μlInjection–StandardTemperature–40 °C suggested
a Click the DataAnalysis icon in ChemStation.
b Select File > Open, and choose the data file.
c Click Open.d Deselect the Compound Mass
Spectra button if this view is present.
• Under the conditions of acquisition, the compounds eluted in this order:Sulfamethazine, m/z = 279Sulfamethizole, m/z = 271Sulfachloropyridazine, m/z = 285Sulfadimethoxine, m/z = 311
• This elution order is different from that in the Chapter 2 exercises. See “Create an averaged spectrum." on page 62.
Agilent 6300 Series Ion Trap Systems Concepts Guide 85

3 Review data and identify compounds
Steps Detailed Instructions Comments
86 Agilent 6300 Series Ion Trap Systems Concepts Guide

Review data and identify compounds 3
Steps Detailed Instructions Comments
2 Because this data was acquired in AutoMS(n) mode, set the parameters for automatic peak detection and spectrum averaging.
a In DataAnalysis, select Find > Parameters.
b Click the AutoMS(n) tab. c Enter a value of 10,000 for the
Intensity Threshold.d Since library searching is based on
centroid (or line) data, make sure that Line Spectra Only is selected.
e Mark the Create AutoMS(n) chromatogram traces check box to see what MS(n) traces are found.
f Click OK.
• Enter different values for the Intensity Threshold to see how it works.
• If the intensity of the base peak in the line mass spectrum surpasses the threshold, the consecutive MS/MS scan is recorded.
Agilent 6300 Series Ion Trap Systems Concepts Guide 87

3 Review data and identify compounds
3 Find the compound mass spectra. • Select Find > Compounds - AutoMS(n).The Analysis List contains a listing of MS(n) traces, MS spectra and MS/MS spectra. To view each, select each check box. To remove each from view, deselect the check box.
• The following steps occur:• Find MS(2) experiments.• Generate EICs using MS(n) filters,• Average MS(2) spectra from same
parent.• Average preceding MS spectra.• Transfer averaged spectra to
Compound Mass Spectra results.
Steps Detailed Instructions Comments
88 Agilent 6300 Series Ion Trap Systems Concepts Guide

Review data and identify compounds 3
Task 2. Create the library
Steps Detailed Instructions Comments
1 Create the library database. a Create the directory D:\Data\Library\SulfaMix to hold the library database.
b From DataAnalysis, click the Library Editor icon, or select Tools > LibraryEditor.The Library Editor program opens.
c Click File > New.
d Click Save, then minimize the LibraryEditor window.
• Each library database created must reside in a different directory.
• In this example, the database sulfamix.mlb is created.
2 Add the MS and MS/MS spectra of compound 1to the library.
a Select Cmpd 1 in the Analysis List.b Select Identify > Add to Library.
Agilent 6300 Series Ion Trap Systems Concepts Guide 89

3 Review data and identify compounds
Steps Detailed Instructions Comments
c Make the entries shown in the figure.
d Click OK to enter the MS and MS/MS spectra for sulfamethazine.
3 Add the MS and MS(2) spectra of the other three sulfa compounds to the library.
• Repeat the Detailed Instructions for Step 2 for sulfamethizole (Cmpd 2), sulfachloropyridazine (Cmpd 3) and sulfamethoxine (Cmpd 4).
• By the time Compound 4 is entered, the window below should be displayed.
90 Agilent 6300 Series Ion Trap Systems Concepts Guide

Review data and identify compounds 3
Steps Detailed Instructions Comments
4 Examine the new library database, and find all four compounds.
a Maximize the Library Editor.b Click the > arrow to see all the
compounds in the library.
• The sulfamix.mlb library database should contain all four compounds, each containing an MS and an MS/MS spectrum.
5 Enter any parameters to reduce the likelihood of random matches.
a Make sure the Acquisition Parameter tab is selected.
b Enter those parameters that distinguish one compound from another.
Agilent 6300 Series Ion Trap Systems Concepts Guide 91

3 Review data and identify compounds
6 Reduce the number of entries to only those that are significant.• Assume the abundance scale is
100; remove those masses whose abundance is below 5.
a Click the Mass List tab.b Select the masses whose
abundance is below 5, and click Remove.
7 Save the changes to the library and exit both the library and the data file.
a To save changes, select File > Save.b To close the Library Editor, select
File > Exit.c To close the data file, select File >
Close.
92 Agilent 6300 Series Ion Trap Systems Concepts Guide

Review data and identify compounds 3
Task 3. Identify Unknown Compounds in a Mixture
You can use the compounds in the library that you created to identify compounds found in a data file acquired by running the sulfa mixture under different chromatographic conditions.
Steps Detailed Instructions Comments
1 In DataAnalysis, close the data file, SulfMSMS.D.
• Highlight the file name in the Analysis List and select File > Close.
2 Open the data file, LCDemo02.d.The data file was acquired under the LC conditions (Chap. 2 exercises) below.
Flow rate–400 μl/minSolvent A–5 mM ammonium formate in waterSolvent B–5 mM ammonium formate in MeOHGradient (min. - %B)0–15/1–15/3–100/6–100/7–15Stop Time–7.00 min.Post Time–3.00 min.Injection Volume–1 μlInjection–StandardDraw Position–3.0 mmTemperature–40 °C
a Select File > Open.b Select LCDemo02.d, and click Open.
See the figure below.
• The data file LCDemo02.d contains both line and profile data.
Agilent 6300 Series Ion Trap Systems Concepts Guide 93

3 Review data and identify compounds
3 For simplicity, only look for the line spectra corresponding to the four compounds of the chromatogram.
a Select Find > Parameters... > AutoMS(n).
b Enter 150,000 as the Intensity threshold.
c In the Mass spectrum calculation box, select Line spectra only.
d Clear the Fragments qualified by check box.
e Click OK.
4 Derive MS and MS/MS spectra from the chromatogram.
• Select the file name in the Analysis List and select Find > Compounds – AutoMS(n).
• The results should resemble those in the figure below.
Steps Detailed Instructions Comments
94 Agilent 6300 Series Ion Trap Systems Concepts Guide

Review data and identify compounds 3
5 Select the library database you created earlier to search against.• Remove any other libraries that
you do not want to use or may not exist.
a Select Identify > Parameters....b Click the Library Search tab.c Click the New (Insert)
icon in the Libraries tab.d Click the Browse button
(...). e Select SulfaMix.mlb, and click Open. f Select the library to remove, and
click the Delete button.g Click OK.
• The library will search every highlighted spectrum in the Analysis List of a single data file. To limit the identification of spectra using a library database, select only the spectra that are of interest.
Steps Detailed Instructions Comments
Agilent 6300 Series Ion Trap Systems Concepts Guide 95

3 Review data and identify compounds
6 Specify additional search parameter weighing factors, as in the figure below.
a Click the Parameter Matching tab.b Mark the appropriate check boxes
and click OK.
• You must specify these parameters in the library database to be able to use them.
Steps Detailed Instructions Comments
96 Agilent 6300 Series Ion Trap Systems Concepts Guide

Review data and identify compounds 3
7 Identify the unknown compounds in the LCdemo02.d file, and display the mass spectra without the chromatogram.
a Select Cmpd 1in the Analysis List.b Select Identify > Mass Spectra.c Deselect the Chromatogram button.d Repeat steps a and b for the other
compounds.The results for Cmpd 2 are shown in the figure.
• New entries are listed under the compound mass spectra of the Analysis List as well as in the Compound Mass Spectra view.
• Use the Tools > Options dialog to view two windows.
Steps Detailed Instructions Comments
Agilent 6300 Series Ion Trap Systems Concepts Guide 97

3 Review data and identify compounds
Task 4. Print a Library Report
Steps Detailed Instructions Comments
1 Show the Chromatogram view and open the Compound List in DataAnalysis.
a Click the Chromatogram icon in the toolbar.
b Select Window > Compound List.
98 Agilent 6300 Series Ion Trap Systems Concepts Guide

Review data and identify compounds 3
Steps Detailed Instructions Comments
2 Review the results of the Library search in the Compound List.
a Right-click on the Compound List window and select Layout... from the menu.
b Click the New button.c Select Compound Name, and click
Add.d Do the same for Effective Purity
Score and Fit Score.e Click OK.
f Click OK.• The Compound List window
resembles the figure on the left.
Agilent 6300 Series Ion Trap Systems Concepts Guide 99

3 Review data and identify compounds
Figure 6 Page of Library Search Report containing Compound List results and mass spectra
3 Print the results from the Compound List window to the Library Search Report, and close the data file.
a In DataAnalysis, select File > Print....
b Select Library Search Report – AutoMS(n) from the pull-down list.
c Click Print Preview.d Select File > Close, and select File
> Exit to close the data file.
• See Figure 6 for the page of Library Search results with compound list.
• The pages following show the spectra for LCDemo02.D and those they match.
Steps Detailed Instructions Comments
100 Agilent 6300 Series Ion Trap Systems Concepts Guide

Review data and identify compounds 3
Exercise 5. Create or edit a report layout
The Quick Start Guide shows you how to access ReportDesigner. The Concepts Guide provides a comprehensive list of the layouts that accompany the software.
A set of report layouts is provided as a part of the software installation procedure. This exercise shows you how to use the ReportDesigner application to create or modify the layouts of the various reports.
Steps Detailed Instructions Comments
1 Use the SulfMSMS.d data file and the Cmpd Mass Spec Report AutoMSn (P) layout to access ReportDesigner from within DataAnalysis.
a Select File > Open.b Move to the Example Data directory.c Select the file, SulfMSMS.D, and
click Open.d Select Find > Compounds -
AutoMS(n).e Select File > Print or Print Preview.
f Select Cmpd Mass Spec Report AutoMSn (P) from the Layout pull-down menu.
• Make sure that you set parameters to find four compounds. See “Exercise 3. Review data from the AutoMS(n) method" on page 74.
• This report is formatted for Portrait (P) printing.
Agilent 6300 Series Ion Trap Systems Concepts Guide 101

3 Review data and identify compounds
Steps Detailed Instructions Comments
g Click ReportDesigner.
2 Experiment with the report components and their properties.
a Right-click various report components.
b When a context menu appears, select Properties to see the parameters you can modify.
• If the component selected is a table or graphic (spectrum, chromatogram, or calibration curve), you are prompted to open a data file.
102 Agilent 6300 Series Ion Trap Systems Concepts Guide

Review data and identify compounds 3
3 View the acquisition parameters available for reporting in the data file, SulfMSMS.d in the Example Data directory.
a Right-click one of the Acquisition Parameter tables.
b Select Properties.c When prompted for a data file,
select SulfMSMS.D from the Example Data directory.
d Click the Selection tab from the Component Properties dialog box that opens.
e Click the boxes marked with a plus-sign in the tree structure and view all of the parameters that are available for this table.
f Click OK or Cancel.
4 Return to DataAnalysis. a Select File > Exit to exit ReportDesigner and return to the Print Preview dialog box.
b Click Cancel to return to DataAnalysis.
• If you changed any values in Report Designer, click Preview to view the new report.
Steps Detailed Instructions Comments
Agilent 6300 Series Ion Trap Systems Concepts Guide 103

3 Review data and identify compounds
Exercise 6. Create a method to automate analysis and reporting
This exercise presents a simple step-by-step procedure to show how to implement automated processing and reporting of results using the Ion Trap software. You modify one of several DataAnalysis methods provided with the software. These methods include parameters and VB Scripts. The scripts include Visual Basic Script commands, which perform the tasks needed for processing and reporting results to a report layout.
Task 1. Modify and run a DataAnalysis method
Steps Detailed Instructions Comments
1 Open the SulfMSMS.d data file if not already open.
a Select File > Open.b Move to the Example Data directory.c Select the file, SulfMSMS.D, and
click Open.
104 Agilent 6300 Series Ion Trap Systems Concepts Guide

Review data and identify compounds 3
Steps Detailed Instructions Comments
2 Open the VB script associated with the Auto_MIS.m DataAnalysis method.
a Select Method > Open.b Select Auto_MIS.m, and click Open.c Select Method > Script to see the
VB script within Auto_MIS.m.
Agilent 6300 Series Ion Trap Systems Concepts Guide 105

3 Review data and identify compounds
3 Comment out the lines related to protein analysis.
a Type an apostrophe and a space in front of “Analysis.Compounds.Deconvolute”.
b Repeat step a for “Analysis.Compounds.Export ““, damgf”.
• SulfMSMS.d contains no proteins nor multiply charged ions.
• This modified script performs the following operations:• Clears previous results• Generates 3 traces• Uses same command as Find >
Compounds – AutoMS(n).• Saves result.• Prints report.
Steps Detailed Instructions Comments
106 Agilent 6300 Series Ion Trap Systems Concepts Guide
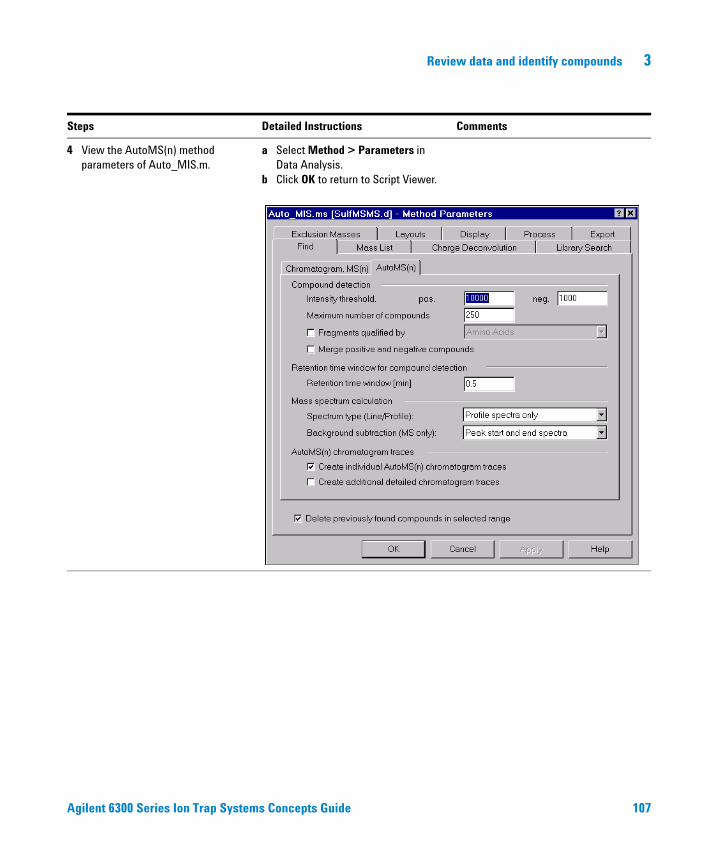
Review data and identify compounds 3
4 View the AutoMS(n) method parameters of Auto_MIS.m.
a Select Method > Parameters in Data Analysis.
b Click OK to return to Script Viewer.
Steps Detailed Instructions Comments
Agilent 6300 Series Ion Trap Systems Concepts Guide 107
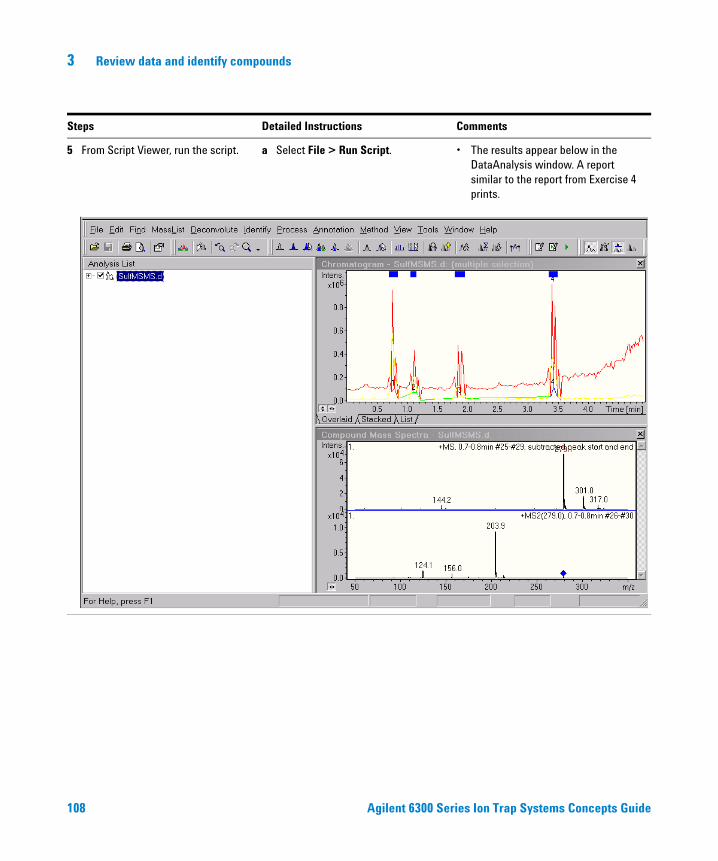
3 Review data and identify compounds
5 From Script Viewer, run the script. a Select File > Run Script. • The results appear below in the DataAnalysis window. A report similar to the report from Exercise 4 prints.
Steps Detailed Instructions Comments
108 Agilent 6300 Series Ion Trap Systems Concepts Guide

Review data and identify compounds 3
Task 2. Set up to run an LC/MS method containing the DA method
You can save the DA method that you just ran to an LC/MS method of your choice.
Steps Detailed Instructions Comments
1 Save SulfMSMS.m as an LC/MS method named “yourname.m”. Then save the DA method from Task 1 to yourname.m.
a In ChemStation, select File > Open.b Select the file, SulfMSMS.m, and
click Open.c Select File > Save As.d Enter yourname, and click Save.e In DataAnalysis, select File > Save
As.f Select yourname.m, and click Save.
• You can save SulfMSMS.m as any new LC/MS method with a unique name.
2 Load yourname.m into ChemStation and the TrapControl program.
a In ChemStation, select Method > Load Method.
b Select yourname.m, and click Open.
3 Set up to run the DA method automatically after data acquisition.
a In ChemStation select Method > Do MS Post-Run Processing.
4 Save the new “combined” method. • In ChemStation, select Method > Save Method.
• You are now ready to start the method to automatically acquire and process data.
Agilent 6300 Series Ion Trap Systems Concepts Guide 109

3 Review data and identify compounds
110 Agilent 6300 Series Ion Trap Systems Concepts Guide
Agilent 6300 Series Ion Trap SoftwareFamiliarization Guide
4Deconvolute and search protein spectra
Exercise 1. Deconvolute an intact protein spectrum 112
Exercise 2. Deconvolute spectra from a protein digest 126
Exercise 3. Search for a protein with MASCOT 145
You can search databases with MASCOT or Spectrum Mill to identify proteins and peptide mixtures whose molecular weights are known.
Deconvolution is the calculation ofprotein or peptide molecular
weights from fragment ions thatexist in multiple charge states.
To search with MASCOT you acquire, process (including deconvolution) and export profile spectral data. To search with Spectrum Mill, on the other hand, you need only export line spectral data without processing in Data Analysis.
The exercises in this chapter show you how to:
To learn more about deconvolution, see the Concepts Guide. To activate deconvolution you must purchase the Deconvolution and Bioanalysis Software.
To learn more about Spectrum Mill, see the Spectrum Mill Quick Start Guides.
• Perform charge-state deconvolution on profile spectra of an intact protein
• Do the same for a peptide mixture from a protein digest
• Search for a protein with MASCOT
Before you start
• Transfer the data files in the subdirectory Guides\ Familiarization\Example Data\from the CD-ROM to your own directory on your hard drive.
• Read the Data Copy to Hard Drive Readme.doc for important information.
For the tasks on the following pages, try the steps on the left without the detailed instructions. If you need more help, follow the detailed instructions on the right.
111Agilent Technologies

4 Deconvolute and search protein spectra
Exercise 1. Deconvolute an intact protein spectrum
Task 1. Deconvolute to view the major component
Steps Detailed Instructions Comments
1 Open the data file, cytc_000.d. a In DataAnalysis, select File > Open.b Select cytc_000.d, and click Open.
• The distribution of peaks in the 500 to 1000 m/z range represents the charge-state envelope of cytochrome c.
• Note that this data file opens into the Mass Spectrum window of DataAnalysis because it has no chromatogram. It was acquired in the TrapControl program by selecting Acquisition > Save Profile Now.
112 Agilent 6300 Series Ion Trap System Familiarization Guide

Deconvolute and search protein spectra 4
Steps Detailed Instructions Comments
• Cytochrome C has an average molecular weight of 12360.2. Based on this, the m/z value of 773.6 is probably a molecular ion with a charge state calculated from 773.6 = (12360.2 + nH)/n, where n is the number of protons added to the protein so that m/z = 773.6 is observed. Therefore, n = 12,360.2/772.6 = 16, or a charge-state of +16.
• You can control the peaks used in deconvolution if you limit the number of peaks in the Mass List. Right-click on the spectrum to access the Mass List.
Charge-state envelope
Charge state of 773.6 m/z = +16
Agilent 6300 Series Ion Trap System Familiarization Guide 113

4 Deconvolute and search protein spectra
2 Enter the parameters for the automatic deconvolution process.• High mass of 20000 and the
maximum charge of 20 is more than adequate for cytochrome c.
• Protonation is the most likely form of ionization and the Adduct ion = +H.
• Select Deconvolute > Parameters... > Charge Deconvolution.
• The values shown are default settings for applying deconvolution to large molecules such as proteins that require several charge states to fall within the analytical mass range of the ion trap.
Steps Detailed Instructions Comments
114 Agilent 6300 Series Ion Trap System Familiarization Guide

Deconvolute and search protein spectra 4
3 Deconvolute the spectrum. • Select Deconvolute > Mass Spectra.
• The mass spectrum peaks are labeled with the charge states that the deconvolution algorithm found.
• Note that the peak at m/z 773.6 has been assigned a charge state of +16 as discussed above.
Steps Detailed Instructions Comments
Agilent 6300 Series Ion Trap System Familiarization Guide 115

4 Deconvolute and search protein spectra
4 Zoom out to see the 1+ mass for component A.
• Click the Undo Zooming icon twice. • You could expect to see a resolved peak at (M + H)+ = 12,360.2 + 1 = 12,361.2. The accuracy of your result is (12362.4 - 12,361.2)/12361.2 = 9.7e-5, or .0097%.
Steps Detailed Instructions Comments
116 Agilent 6300 Series Ion Trap System Familiarization Guide

Deconvolute and search protein spectra 4
5 Examine the labeled peaks. • Select Deconvolute > View Detailed Results.
• With the existing parameter settings, four deconvoluted compounds are derived from this analysis.
• You will be able to see the spectral details of all four components when you perform the next deconvolution.
Steps Detailed Instructions Comments
Agilent 6300 Series Ion Trap System Familiarization Guide 117

4 Deconvolute and search protein spectra
Task 2. Deconvolute to view minor components
Although the labeled peaks in the mass spectrum belong to component A, you can find more component matches if you consider the remaining peaks in the spectrum. For example, if you lower the Abundance Cutoff in the Charge Deconvolution method parameters from 30% (the default) to 10%, you find four components, or molecular weights, with deconvolution.
Steps Detailed Instructions Comments
1 Prepare the program for the next deconvolution procedure.• Abundance Cutoff–10%• Include shifted spectrum and
component details.
a Select Deconvolute > Parameters...b Enter a cutoff of 10%.c Click General.d Mark the Include shifted spectrum
and Include component details check boxes.
e Click OK.
•
118 Agilent 6300 Series Ion Trap System Familiarization Guide

Deconvolute and search protein spectra 4
Steps Detailed Instructions Comments
2 Perform deconvolution again with the new settings, and overlay the deconvoluted components
a Select Deconvolute > Mass Spectra
b Click the + sign in the Analysis List tree until you see the four deconvoluted components.
c Mark the check box next to each component.
• In the figure below, component spectra (A – D) overlap one another in the Overlaid view and are not distinguishable. The "+1" peaks skew the axis to the high mass end.
Agilent 6300 Series Ion Trap System Familiarization Guide 119
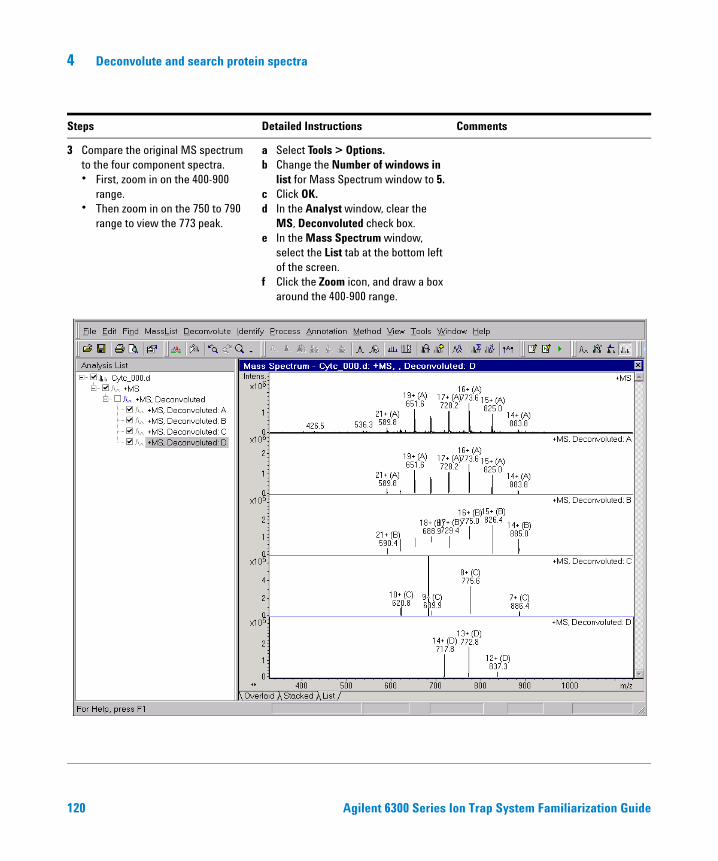
4 Deconvolute and search protein spectra
Steps Detailed Instructions Comments
3 Compare the original MS spectrum to the four component spectra.• First, zoom in on the 400-900
range.• Then zoom in on the 750 to 790
range to view the 773 peak.
a Select Tools > Options.b Change the Number of windows in
list for Mass Spectrum window to 5.c Click OK.d In the Analyst window, clear the
MS, Deconvoluted check box.e In the Mass Spectrum window,
select the List tab at the bottom left of the screen.
f Click the Zoom icon, and draw a box around the 400-900 range.
120 Agilent 6300 Series Ion Trap System Familiarization Guide
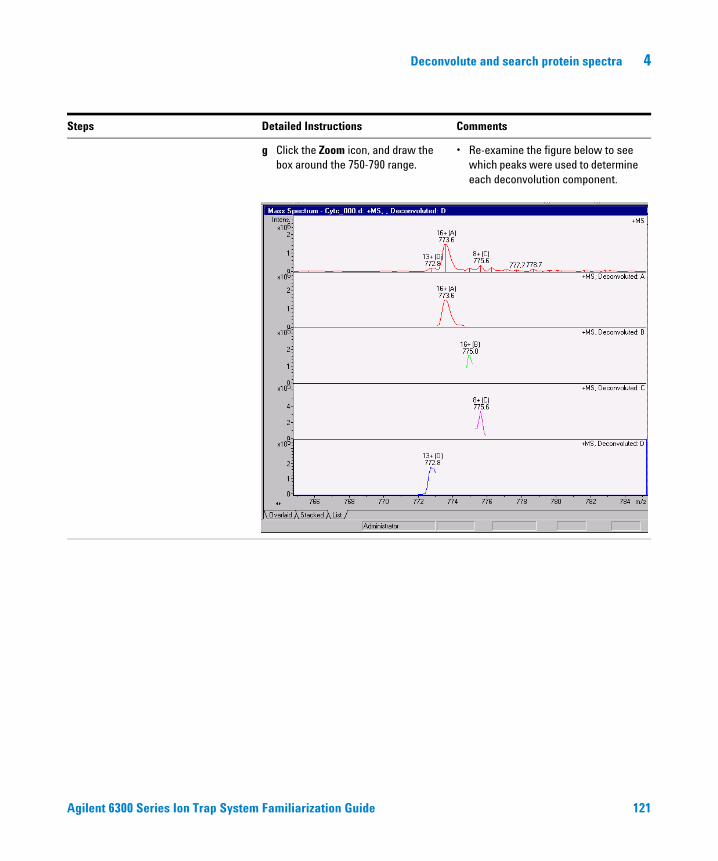
Deconvolute and search protein spectra 4
g Click the Zoom icon, and draw the box around the 750-790 range.
• Re-examine the figure below to see which peaks were used to determine each deconvolution component.
Steps Detailed Instructions Comments
Agilent 6300 Series Ion Trap System Familiarization Guide 121

4 Deconvolute and search protein spectra
Task 3. Use the Charge State Ruler to deconvolute a protein mass spectrum
DataAnalysis provides a special tool for deconvolution—the Charge State Ruler. You can use this tool to determine which mass spectrum peaks correspond to charge-state distributions, or envelopes, and to perform deconvolutions.
Step Detailed Instructions Comments
1 Display the m/z 500-1000 region of the cytochrome c protein mass spectrum in DataAnalysis.
a Select Deconvolute > Clear Results.
b Click the Overlaid tab.c Click the Zoom icon and draw the
box around the 500–1,000 region.
122 Agilent 6300 Series Ion Trap System Familiarization Guide

Deconvolute and search protein spectra 4
Step Detailed Instructions Comments
2 Activate the Charge State Ruler. • Select Deconvolute > Charge State Ruler.
• The Charge State Ruler tool box opens with the default setting.
• The “snap to peak” tool next to the charge state entry field is selected by default.
3 Assign one of the mass peaks a specific charge state.
a Select a charge state of 16 by protonation or H+.
b Move the cursor near the m/z 651.6 peak, and click the mouse. (Snap-to-peak is selected by default.)
• The black charge state lines correspond to where peaks were found in the spectrum, and the light blue charge state lines correspond to where peaks were absent.
• Labeling the m/z 651.6 peak, which has a protein MW of 10409.2, does not appear to be a good choice.
Agilent 6300 Series Ion Trap System Familiarization Guide 123

4 Deconvolute and search protein spectra
Step Detailed Instructions Comments
4 Select another target peak (still using a charge state of 16).
• Click the m/z 773.6 peak. You may have to zoom in more to be able to tag this peak properly as the 16 charge state.
• Several major peaks are aligned correctly indicating that this is a correct charge state assignment.
• The molecular weight of this molecule is about 12361.0.
124 Agilent 6300 Series Ion Trap System Familiarization Guide

Deconvolute and search protein spectra 4
5 Show the results of deconvolution. • Select Deconvolute > Deconvolute with Charge State Ruler, or Click the Charge State Ruler button.
Step Detailed Instructions Comments
Agilent 6300 Series Ion Trap System Familiarization Guide 125

4 Deconvolute and search protein spectra
Exercise 2. Deconvolute spectra from a protein digest
Task 1. Extract spectra for deconvolution manually
In this task, you extract spectra manually. You select certain data points, or ranges of data points, from the chromatogram to view the spectra that underlie the trace.
Extract spectra from single data points
Steps Detailed Instructions Comments
1 Open the data file, Mb-78.d. • This data file was acquired using
AutoMS2 mode and 1 precursor with active exclusion.
• See Chapter 2, “Set up and run acquisition methods” for more details.
a Select File > Open in DataAnalysis.b Select the data file Mb-78 -
AutoMS(n).d from the list, and click OK.
• The eluted peaks are protein digest fragments, and the file size for this 90-minute run is 134 Mb.
• The starting view of this data file in DataAnalysis should resemble the figure below.
126 Agilent 6300 Series Ion Trap System Familiarization Guide

Deconvolute and search protein spectra 4
Steps Detailed Instructions Comments
2 Zoom In on a part of the chromatogram for a closer look at the underlying mass spectra.• First zoom in between 18 and 28
minutes.• Then zoom in between 19 and 23
minutes.• Bring up the mass spectrum at
20.8 minutes.
a Click the Zoom In icon, and select Zoom In Continuously.
b Depress the left mouse button and drag a box around the area between 18 and 28 minutes, then release it.
c Repeat for the range 19 to 23 min.d Click the Select Range/View
Spectra icon to bring up the Mass Spectrum View.
e Click the peak at 20.8 min.
• The saw-tooth appearance of the chromatogram usually results from superimposing two or more MSn experiments.
• Note that the selected #347 data point in the Chromatogram has a retention time of 20.8 minutes and is an MS acquisition.
• Note that two spectral peaks are labeled with red diamonds: m/z 424.8 and 636.6.
• Use Steps 1 and 2 of “Task 3. Deconvolute the spectra" on page 140 to deconvolute this spectrum and the ones that follow.
Agilent 6300 Series Ion Trap System Familiarization Guide 127

4 Deconvolute and search protein spectra
Steps Detailed Instructions Comments
3 Move to the next data point, #348. • Press the right arrow key on your keyboard to step to the data point.
• The next data point, #348, corresponds to an MS/MS of 425.0, the lower of the two m/z values shown in the previous full-scan MS spectrum, or #347.
• Note that the product ion spectra of m/z 425.0 contain ions at higher m/z values.
128 Agilent 6300 Series Ion Trap System Familiarization Guide

Deconvolute and search protein spectra 4
Steps Detailed Instructions Comments
4 Move to the next data point, #349. • Click the right arrow key on your keyboard to place data point #349 in the Mass Spectrum view.
• Data point #349 is the MS/MS of the 637 spectrum.
Agilent 6300 Series Ion Trap System Familiarization Guide 129

4 Deconvolute and search protein spectra
5 Move to the next data point, #350. • Right-arrow click once more to view data point #350.
• Data point #350 is the return to MS to find other ions on which to perform MS/MS.
Steps Detailed Instructions Comments
130 Agilent 6300 Series Ion Trap System Familiarization Guide

Deconvolute and search protein spectra 4
Extract spectra over a data range
Steps Detailed Instructions Comments
1 Overlay the full TIC +All trace with the full TIC +-All MS trace.
a Click the Edit Chromatograms tool bar button.
b Implement the settings shown in the figure below.
c Click OK.
Agilent 6300 Series Ion Trap System Familiarization Guide 131
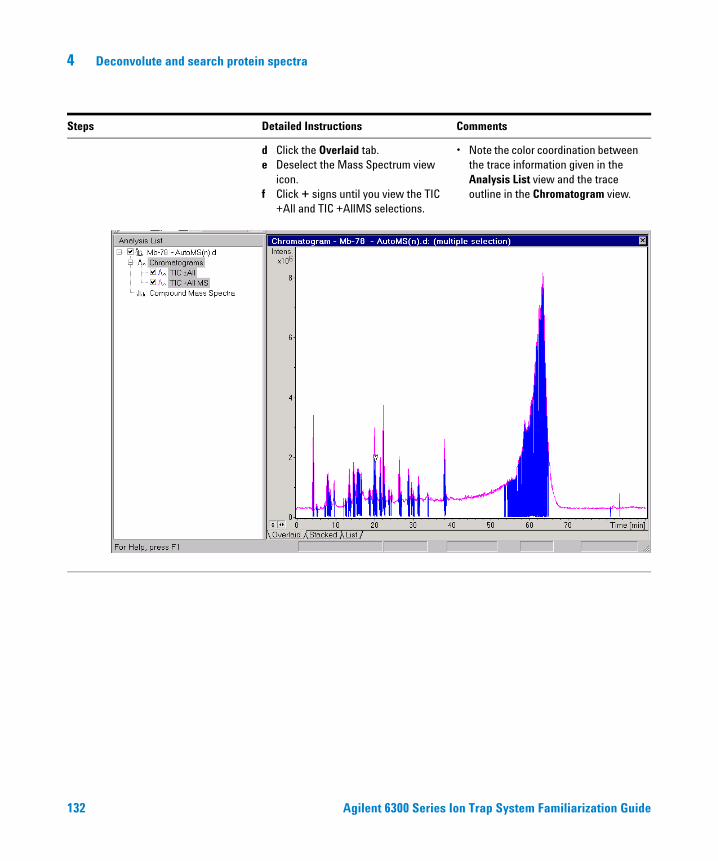
4 Deconvolute and search protein spectra
Steps Detailed Instructions Comments
d Click the Overlaid tab.e Deselect the Mass Spectrum view
icon.f Click + signs until you view the TIC
+All and TIC +AllMS selections.
• Note the color coordination between the trace information given in the Analysis List view and the trace outline in the Chromatogram view.
132 Agilent 6300 Series Ion Trap System Familiarization Guide

Deconvolute and search protein spectra 4
2 Separate the traces. a Click on the List tab of the Chromatogram view.
b Select Tools > Options.c Enter 2 as the Number of windows
in list for the Chromatogram window.
d Click OK.
• The Chromatogram view changes and shows only two traces.
Steps Detailed Instructions Comments
Agilent 6300 Series Ion Trap System Familiarization Guide 133
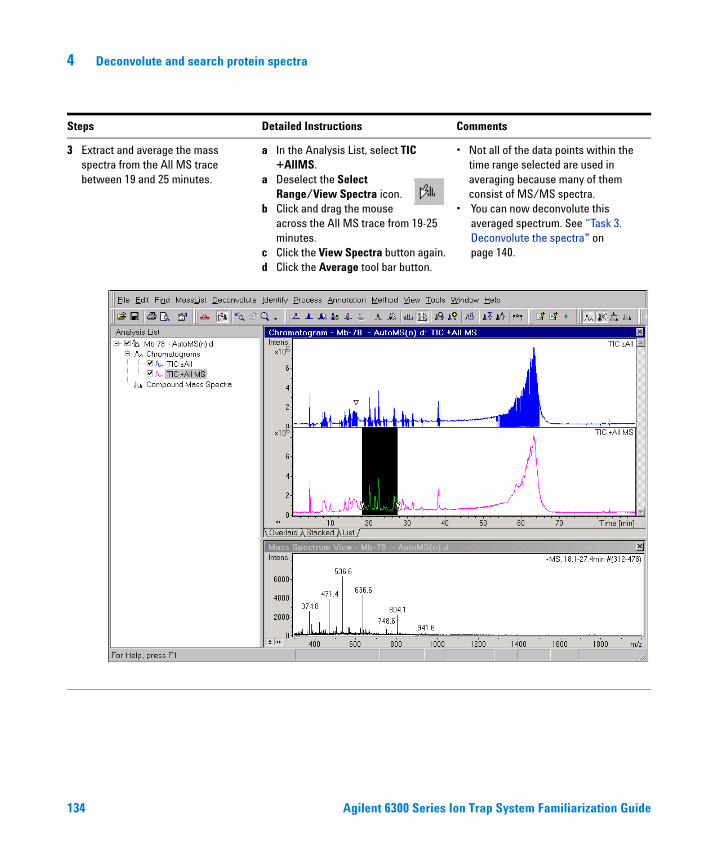
4 Deconvolute and search protein spectra
3 Extract and average the mass spectra from the All MS trace between 19 and 25 minutes.
a In the Analysis List, select TIC +AllMS.
a Deselect the Select Range/View Spectra icon.
b Click and drag the mouse across the All MS trace from 19-25 minutes.
c Click the View Spectra button again.d Click the Average tool bar button.
• Not all of the data points within the time range selected are used in averaging because many of them consist of MS/MS spectra.
• You can now deconvolute this averaged spectrum. See “Task 3. Deconvolute the spectra" on page 140.
Steps Detailed Instructions Comments
134 Agilent 6300 Series Ion Trap System Familiarization Guide
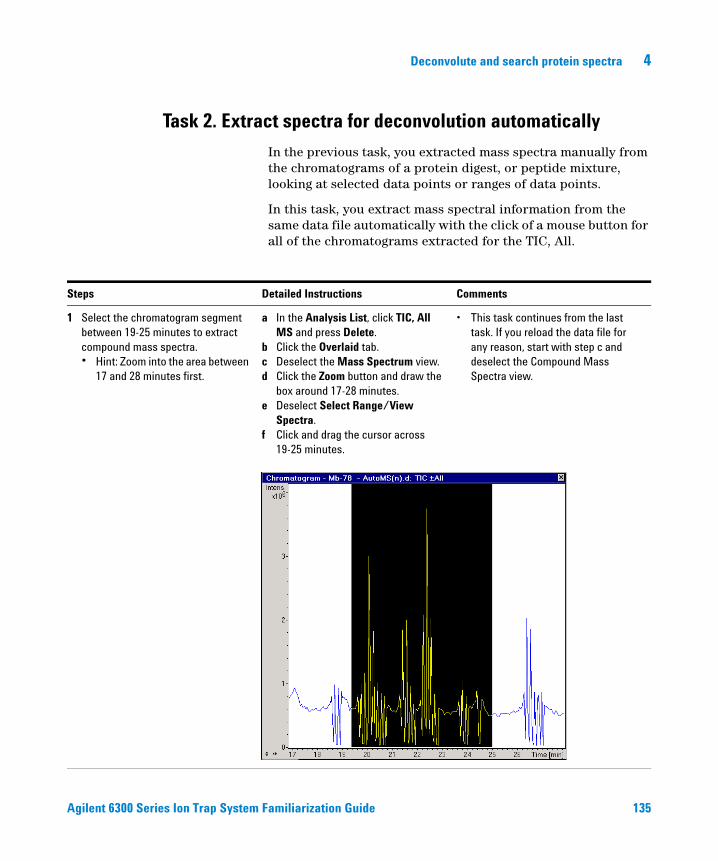
Deconvolute and search protein spectra 4
Task 2. Extract spectra for deconvolution automatically
In the previous task, you extracted mass spectra manually from the chromatograms of a protein digest, or peptide mixture, looking at selected data points or ranges of data points.
In this task, you extract mass spectral information from the same data file automatically with the click of a mouse button for all of the chromatograms extracted for the TIC, All.
Steps Detailed Instructions Comments
1 Select the chromatogram segment between 19-25 minutes to extract compound mass spectra.• Hint: Zoom into the area between
17 and 28 minutes first.
a In the Analysis List, click TIC, All MS and press Delete.
b Click the Overlaid tab.c Deselect the Mass Spectrum view.d Click the Zoom button and draw the
box around 17-28 minutes.e Deselect Select Range/View
Spectra.f Click and drag the cursor across
19-25 minutes.
• This task continues from the last task. If you reload the data file for any reason, start with step c and deselect the Compound Mass Spectra view.
Agilent 6300 Series Ion Trap System Familiarization Guide 135

4 Deconvolute and search protein spectra
Steps Detailed Instructions Comments
2 Change analysis parameters as in the figures below.
a Select Find > Parameters.b Change parameters so that the
dialog boxes look like the figures below.
c Click OK.
• Online Help explains each parameter in detail. The Area and Intensity threshold settings require some knowledge of the peak integration and are usually adjusted for the second pass over the data.
136 Agilent 6300 Series Ion Trap System Familiarization Guide
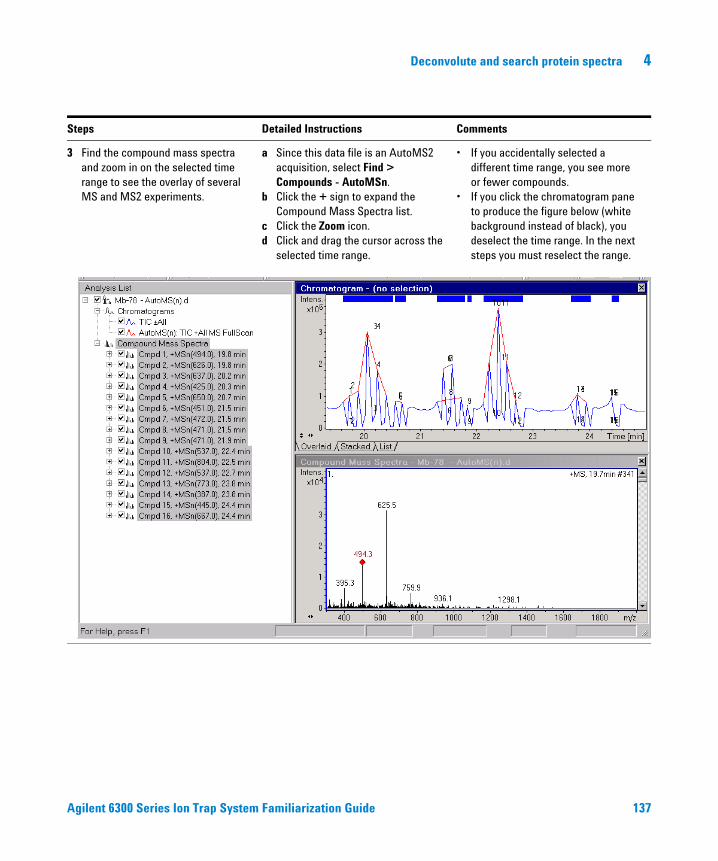
Deconvolute and search protein spectra 4
Steps Detailed Instructions Comments
3 Find the compound mass spectra and zoom in on the selected time range to see the overlay of several MS and MS2 experiments.
a Since this data file is an AutoMS2 acquisition, select Find > Compounds - AutoMSn.
b Click the + sign to expand the Compound Mass Spectra list.
c Click the Zoom icon.d Click and drag the cursor across the
selected time range.
• If you accidentally selected a different time range, you see more or fewer compounds.
• If you click the chromatogram pane to produce the figure below (white background instead of black), you deselect the time range. In the next steps you must reselect the range.
Agilent 6300 Series Ion Trap System Familiarization Guide 137

4 Deconvolute and search protein spectra
Steps Detailed Instructions Comments
4 Adjust the threshold to 100,000 to discriminate MS/MS spectra.
a Select Find > Parameters.b Click the AutoMSn tab.c Enter 100,000 for the Intensity
threshold, and click OK.d Reselect the time range, 19-25 min.,
if necessary.e Select Find > Compounds -
AutoMS(n).f Expand the Compound Mass
Spectra list.
• The peak find can be limited by the intensity of the product ions (Intensity threshold).
• With this threshold, the number of derived compounds decreases.
• If you do not see a decrease in the number of compounds, you may have forgotten to reselect the time range.
138 Agilent 6300 Series Ion Trap System Familiarization Guide
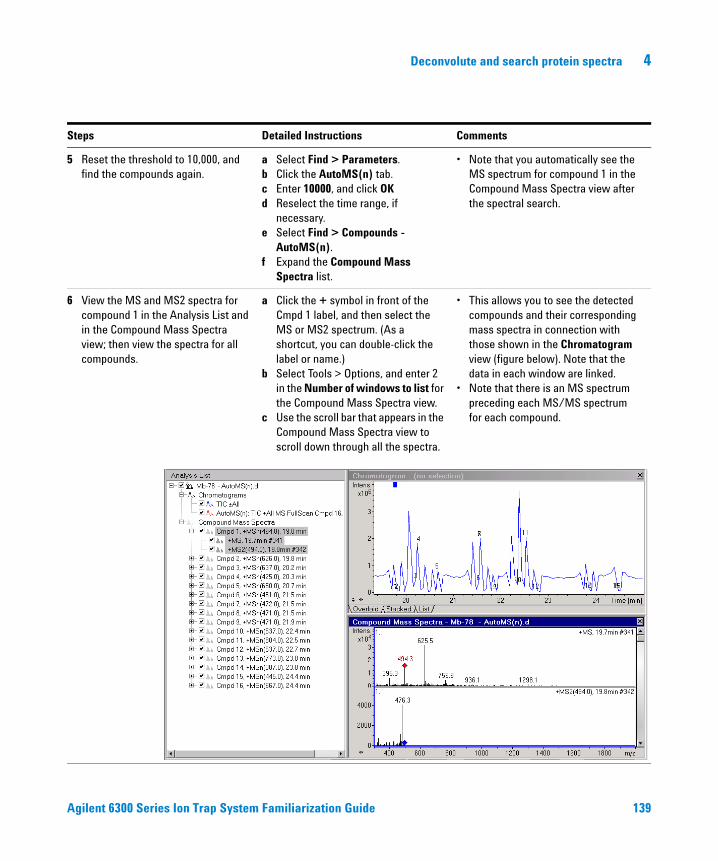
Deconvolute and search protein spectra 4
Steps Detailed Instructions Comments
5 Reset the threshold to 10,000, and find the compounds again.
a Select Find > Parameters.b Click the AutoMS(n) tab.c Enter 10000, and click OKd Reselect the time range, if
necessary.e Select Find > Compounds -
AutoMS(n).f Expand the Compound Mass
Spectra list.
• Note that you automatically see the MS spectrum for compound 1 in the Compound Mass Spectra view after the spectral search.
6 View the MS and MS2 spectra for compound 1 in the Analysis List and in the Compound Mass Spectra view; then view the spectra for all compounds.
a Click the + symbol in front of the Cmpd 1 label, and then select the MS or MS2 spectrum. (As a shortcut, you can double-click the label or name.)
b Select Tools > Options, and enter 2 in the Number of windows to list for the Compound Mass Spectra view.
c Use the scroll bar that appears in the Compound Mass Spectra view to scroll down through all the spectra.
• This allows you to see the detected compounds and their corresponding mass spectra in connection with those shown in the Chromatogram view (figure below). Note that the data in each window are linked.
• Note that there is an MS spectrum preceding each MS/MS spectrum for each compound.
Agilent 6300 Series Ion Trap System Familiarization Guide 139

4 Deconvolute and search protein spectra
Task 3. Deconvolute the spectra
Steps Detailed Instructions Comments
1 Enter the parameters for the automatic deconvolution process.
• Select Deconvolute > Parameters... > Charge Deconvolution.
• You can perform a deconvolution at this point to determine molecular weights because you have derived the compound mass spectra and the data contains multiply-charged peptide fragments.
140 Agilent 6300 Series Ion Trap System Familiarization Guide

Deconvolute and search protein spectra 4
Steps Detailed Instructions Comments
2 Deconvolute the MS spectrum of compound 13.
a In DataAnalysis, click the spectrum or, alternatively, highlight the spectrum in the Analysis List.
b Select Deconvolute > Mass Spectra.
• The mass spectrum peaks are labeled with the charge states that the deconvolution algorithm found.
Agilent 6300 Series Ion Trap System Familiarization Guide 141

4 Deconvolute and search protein spectra
Steps Detailed Instructions Comments
3 Deconvolute all spectra. a Highlight the Compound Mass Spectra in the Analysis List window.
b Select Deconvolute > Mass Spectra.
• Note the change in the Compound Mass Spectra after deconvolution.
• Some of the peaks are labeled by the resolved charge state. For example, the MS spectrum of Compound 1 has two peaks labeled as +1 charge state.
142 Agilent 6300 Series Ion Trap System Familiarization Guide

Deconvolute and search protein spectra 4
4 Examine Compound 7.• To follow the rest of the steps
more easily, reduce the Compound Mass Spectra view to one window.
• Show that the two main spectral peaks may represent the same compound.
a Select Tools > Options.b Enter 1 for the Number of windows
to list for the Compound Mass Spectra view.
c Move down the Analysis List to Compound 7.
d Select the MS spectrum of Compound 7 to produce a display resembling that in the figure below.
e Calculate the m values for the peaks at 471.4 and 941.6.
• Both the single- and double-charged ions are labeled in this spectrum.
• +2 ion > (m + 2H)/2 = 471.4, so m = 940.8+1 ion > m + H = 941.6, so m = 940.6
• The calculated m values differ by only 0.2 amu, or .02% relative accuracy. You could argue, with a high degree of confidence, that both m/z peaks represent the same molecule.
Steps Detailed Instructions Comments
Agilent 6300 Series Ion Trap System Familiarization Guide 143
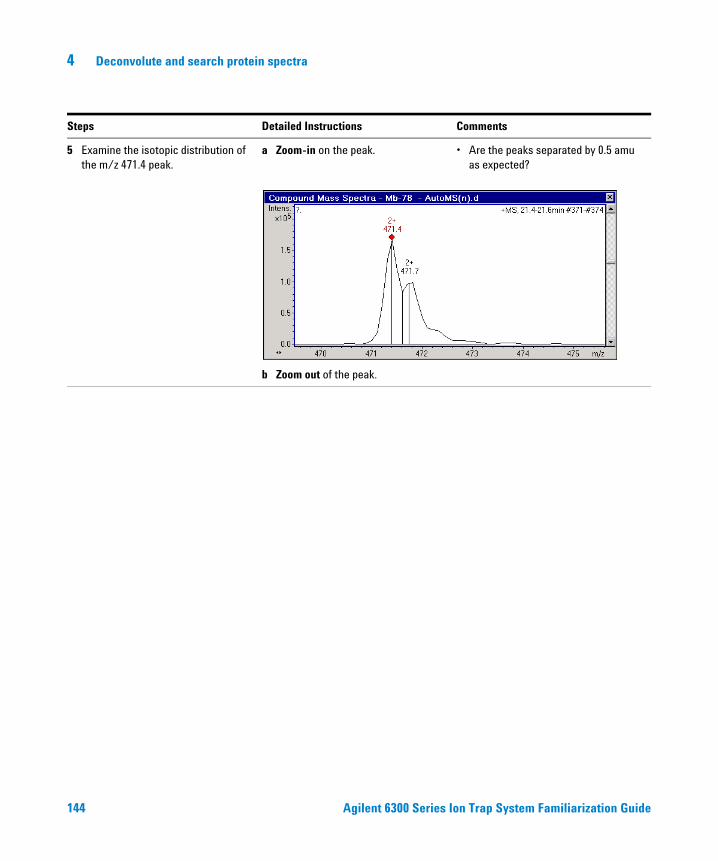
4 Deconvolute and search protein spectra
5 Examine the isotopic distribution of the m/z 471.4 peak.
a Zoom-in on the peak.
b Zoom out of the peak.
• Are the peaks separated by 0.5 amu as expected?
Steps Detailed Instructions Comments
144 Agilent 6300 Series Ion Trap System Familiarization Guide

Deconvolute and search protein spectra 4
Exercise 3. Search for a protein with MASCOT
To search protein or peptide mass spectra with Spectrum Mill, see the Spectrum Mill Quick Start Guide.
You learn how to conduct a protein database search, called an MS/MS ion search, using Matrix Science MASCOT with this exercise. The protein database search in this exercise is based on the MS/MS data obtained from peptide fragments formed from a tryptic digest of horse heart myoglobin.
This exercise uses the deconvoluted spectra from the previous exercises in this chapter.
Although this exercise demonstrates the steps required to search against a database, it does not provide strategic approaches to setting the relevant search parameters.
Task 1. Search the MASCOT database
For database searching on Spectrum Mill, you must transfer the data files to the Spectrum Mill server before searching.
Matrix Science maintains a free Web site for performing database sequence searches on mass spectra data results. You can maintain the data files for searching on the client PC.
Steps Detailed Instructions Comments
1 Select to search all the compound mass spectra and save the file for export as yourinitials.mgf.
a In Analysis List, select Compound Mass Spectra.
b Select File > Export>Compounds...c Enter your initials and click Save.
• This step starts with the Analysis List that you produced in the previous exercise.
Agilent 6300 Series Ion Trap System Familiarization Guide 145

4 Deconvolute and search protein spectra
Steps Detailed Instructions Comments
2 Review the file contents. a Open the file with Notepad.b Review the file, then select File >
Exit.
146 Agilent 6300 Series Ion Trap System Familiarization Guide

Deconvolute and search protein spectra 4
Agilent 6300 Series Ion Trap System Familiarization Guide 147

4 Deconvolute and search protein spectra
Steps Detailed Instructions Comments
3 Enter MASCOT parameters. a Access the Matrix Science Web site:http://www.matrixscience.com
b In the first sentence, click Mascot (in blue).
c Click MS/MS Ion Search.d Enter information as it appears in
the figure below, except:• Enter your initials.• Enter your data file• Enter your email.
148 Agilent 6300 Series Ion Trap System Familiarization Guide

Deconvolute and search protein spectra 4
Steps Detailed Instructions Comments
4 Start the search. • Click the Start Search... button. • Compare your results to those shown in the figures below.
• See the rest of the search results on the next page.
Agilent 6300 Series Ion Trap System Familiarization Guide 149

4 Deconvolute and search protein spectra
Steps Detailed Instructions Comments
• The three queries listed in red produced identifications for three unique peptides in myoglobin.
150 Agilent 6300 Series Ion Trap System Familiarization Guide

Deconvolute and search protein spectra 4
Steps Detailed Instructions Comments
5 Check the amount of actual protein covered.
• Click MYG_HORSE in the view of the figure on the previous page to see the actual protein coverage (22%).
• See the continuation of the Protein View on the next page.
Agilent 6300 Series Ion Trap System Familiarization Guide 151

4 Deconvolute and search protein spectra
Steps Detailed Instructions Comments
• This is a listing of the matched peptides.
152 Agilent 6300 Series Ion Trap System Familiarization Guide

Deconvolute and search protein spectra 4
Steps Detailed Instructions Comments
6 Check the predicted peptides to display all predicted peptides from a MASCOT database search.
• Click the Show predicted peptides also button.
• Note that the doubly charged ion at m/z 636.7 was identified as residues 32–42 of myoglobin with a residue mass of 1270.66.
• The theoretical peptides that satisfy the digestion criteria in the MS/MS Ion Search panel are displayed in black, and the peptides identified from the data are displayed in red.
Agilent 6300 Series Ion Trap System Familiarization Guide 153

4 Deconvolute and search protein spectra
154 Agilent 6300 Series Ion Trap System Familiarization Guide

Agilent 6300 Series Ion Trap SoftwareFamiliarization Guide
5Quantify compounds
Exercise 1. Prepare for quantitation 158
Exercise 2. Create a quantitation method 164
Exercise 3. Quantify the unknown 169
Exercise 4. Print a quantitation report 175
This chapter presents exercises to help you learn to perform single- and multi-component quantitative analyses on data files containing calibration standards, quality controls (QCs), and unknown samples. These data files were acquired within a sequence set up in the Agilent ChemStation program.
The exercises in this chapter show you how to:
• Import and modify the sequence
• Build calibration curves and quantitate the unknown sample and blank samples against the calibration (regression) curve
• Print a quantitation report.
Before you start
• Transfer the data files in the subdirectory Guides\Example Data\Quantitation from the CD to your own directory on your hard drive.
• Read the Data Copy to Hard Drive Readme.pdf for important information.
For the tasks on the following pages, try the steps on the left without the detailed instructions. If you need more help, follow the detailed instructions on the right.
155Agilent Technologies

5 Quantify compounds
The exercises in this chapter use previously acquired data files to quantitate the target compound Alprazolam d0, a chlorinated benzodiazepine with a molecular weight of 308.
Figure 7 Alprazolam
Additional quantitation data is available to familiarize yourself with more complete analyses with multiple targets and multiple internal standards. You can find this data in the MCQ_ESTD AND MCQ_ISTD directories.
• The compound used as the ISTD was the penta-deuterated analog Alprazolam d5 (MW 313).
• The sequence in the data files consisted of 12 runs: one double-blank, one blank (ISTD only), eight calibration standards, a re-injection of the double-blank, and one unknown.
• The eight standard solutions contained the target compound d0 at concentrations of 2, 4, 20, 40, 200, 400, 2000, and 4000 pg/µl.
• Each also contained a standard concentration of 100 pg/µl ISTD (d5).
• A solution containing 100 pg/µl d0 and 100 pg/µl d5 functioned as the unknown.
The sequence table used for these exercises is shown in Figure 8 and Figure 9. These parameters were applied using an Agilent 6300LC with an Ion Trap “Classic” instrument.
N
N
NN
CH 3
C l
156 Agilent 6300 Series Ion Trap System Familiarization Guide

Quantify compounds 5
Figure 8 Sequence table used for exercises–scroll bar shifted to left
Figure 9 Sequence table used for exercises–scroll bar shifted to right
Agilent 6300 Series Ion Trap System Familiarization Guide 157

5 Quantify compounds
Exercise 1. Prepare for quantitation
Task 1. Find the retention time of the internal standard (ISTD)
Step Detailed Instructions Comments
1 Open data file 400pg.D. a In DataAnalysis, select File > Open.b Double-click the data file 400pg.D.c Deselect the Compound Mass
Spectra view.
• The saw-tooth wave results from superimposing two MS2 chromatograms: the MS/MS of Alprazolam d0 and the MS/MS of Alprazolam d5.
158 Agilent 6300 Series Ion Trap System Familiarization Guide

Quantify compounds 5
Step Detailed Instructions Comments
2 Find compounds and their associated MS spectra.• If the layout in DataAnalysis does
not look like that shown in the figure below, change the number of windows for both the chromatogram and the Compound Mass Spectra.
• Determine the retention time of the ISTD. (Needed for the quantitation method. See “Exercise 2. Create a quantitation method" on page 164.)
a Highlight the 400pg.D file in the Analysis List window.
b Click the List tab.c Select Find > Compounds – MSn.d To change the number of windows:
• Select Tools > Options... and the corresponding Tab view.
or• Select Tools > Options... > Basic
Layout.e Expand the Compound Mass
Spectra list to see the RT of Compound 1 and 2.
• Compound peaks are labeled in the order of their retention time. MS2 (309.1) is listed in the window before MS2 (314.1) because the MS/MS of 309.1 was performed first in the acquisition method.
• For the isolation/fragmentation of Alprazolam d0, (M+H)+ = 309.1, two product ions, m/z = 274 and m/z = 281, are the most prominent. Analogously, the two most prominent product ions for Alprazolam d5 (M+H)+ = 314.1 are m/z = 279 and m/z = 286. These product ions will be used in the quantitation.
• The retention time is 1.3 minutes.
Agilent 6300 Series Ion Trap System Familiarization Guide 159

5 Quantify compounds
Task 2. Modify the sequence for quantitation
Steps Detailed Instructions Comments
1 Open the work table in QuantAnalysis.
• From the Windows desktop, select Start > Programs > 6300 Series Ion Trap LCMS > QuantAnalysis.
• The Nested view appears as the default view. (See tab at bottom of window.)
160 Agilent 6300 Series Ion Trap System Familiarization Guide
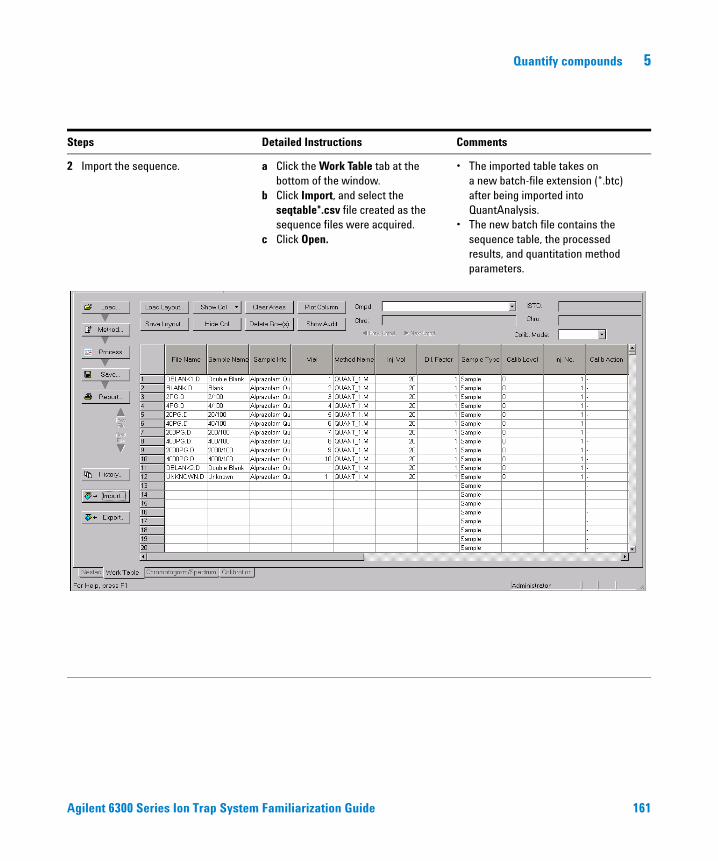
Quantify compounds 5
Steps Detailed Instructions Comments
2 Import the sequence. a Click the Work Table tab at the bottom of the window.
b Click Import, and select the seqtable*.csv file created as the sequence files were acquired.
c Click Open.
• The imported table takes on a new batch-file extension (*.btc) after being imported into QuantAnalysis.
• The new batch file contains the sequence table, the processed results, and quantitation method parameters.
Agilent 6300 Series Ion Trap System Familiarization Guide 161

5 Quantify compounds
Steps Detailed Instructions Comments
3 Modify the sequence table.• Change the Calib Level and Calib
Action columns to the values displayed in the figure below.
a For lines 3-10, enter the Calib Level as 1-8.
b For lines 3-10, enter the Calib Action as New.
• The QuantAnalysis program does not allow for "bracketed" sample lists. That is, if the calibration calculation is based on an interrupted sequence of calibration samples interspersed with actual unknown samples or quality control samples, more than one calibration curve will be generated.
162 Agilent 6300 Series Ion Trap System Familiarization Guide

Quantify compounds 5
Steps Detailed Instructions Comments
4 Modify the Sample Type column entries.• Lines 1, 2 and 11 should be
blanks.• Lines 3-10 should be calibration
samples.• Line 12 should be a sample.
• Click on the appropriate cell and select from the pull-down menu as shown for Sample Type in the figure below.
• The unknowns and QC samples are quantitated against the preceding set of calibration standards. Therefore, either all of the calibration samples should be run before the samples to be quantitated are run, or the sample list must be modified to reflect such a sequence.
Agilent 6300 Series Ion Trap System Familiarization Guide 163

5 Quantify compounds
Exercise 2. Create a quantitation method
Steps Detailed Instructions Comments
1 Open the quantitation method wizard.
a Select Method > Edit... to open the first quantitation window.
b Click Next >.
164 Agilent 6300 Series Ion Trap System Familiarization Guide

Quantify compounds 5
Steps Detailed Instructions Comments
2 Define compound chromatograms for quantitation.• Be sure to enter the values
exactly as shown in the figure below.
a Define each compound trace, then click Add.
b Click Next >.
• To sum the product ion masses on what the quantitation will be based, separate the corresponding product ion masses by a comma or semicolon.
Agilent 6300 Series Ion Trap System Familiarization Guide 165
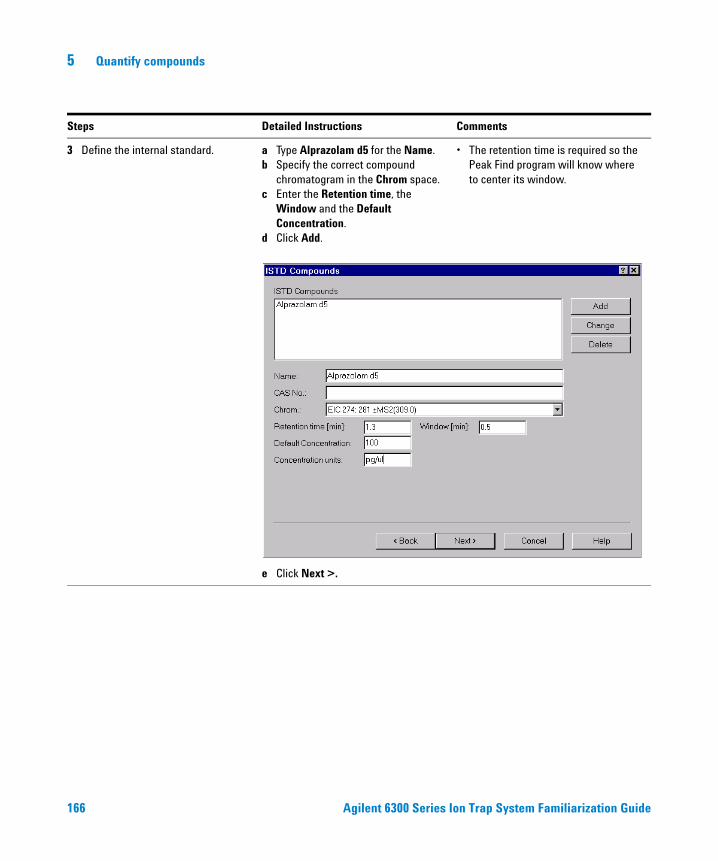
5 Quantify compounds
3 Define the internal standard. a Type Alprazolam d5 for the Name. b Specify the correct compound
chromatogram in the Chrom space.c Enter the Retention time, the
Window and the Default Concentration.
d Click Add.
e Click Next >.
• The retention time is required so the Peak Find program will know where to center its window.
Steps Detailed Instructions Comments
166 Agilent 6300 Series Ion Trap System Familiarization Guide

Quantify compounds 5
4 Define the analyte compound. a Define the analyte as shown in the figure below.
b Select Alprazolam d5 as the ISTD.c Enter the appropriate calibration
levels under Standard conc.• Click the Insert button.• Enter the calib. level, a
semicolon, and the concentration. (You must press Enter.)
• Repeat steps for all levels.d Click Add.
e Click Next >.
Steps Detailed Instructions Comments
Agilent 6300 Series Ion Trap System Familiarization Guide 167
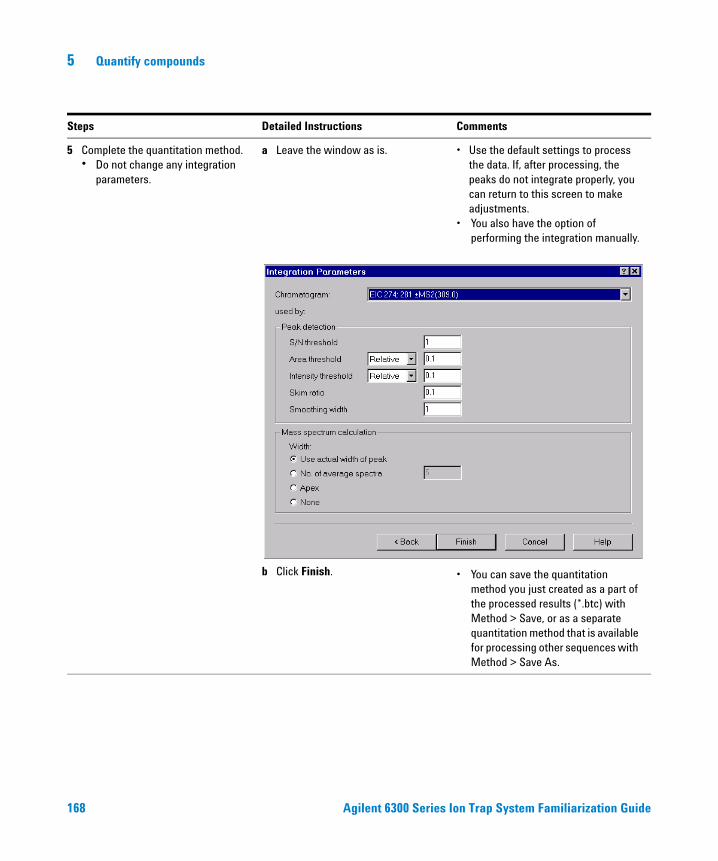
5 Quantify compounds
5 Complete the quantitation method.• Do not change any integration
parameters.
a Leave the window as is.
b Click Finish.
• Use the default settings to process the data. If, after processing, the peaks do not integrate properly, you can return to this screen to make adjustments.
• You also have the option of performing the integration manually.
•••••••••••••••
• You can save the quantitation method you just created as a part of the processed results (*.btc) with Method > Save, or as a separate quantitation method that is available for processing other sequences with Method > Save As.
Steps Detailed Instructions Comments
168 Agilent 6300 Series Ion Trap System Familiarization Guide

Quantify compounds 5
Exercise 3. Quantify the unknown
Task 1. Process data and examine the quantitative results
Steps Detailed Instructions Comments
1 Process the data. • Click the Process button.
2 Check the quantitation results.• Select a layout for the results
based on monitor resolution and the calibration type, in this case, 1024x768 and ISTD.
• Scroll to the right to check the results. or
a Click Load Layout... .
b Select ISTDQuant_1024x768.qal.c Click Open.
• You can change the appearance of the Work Table layout by adjusting or hiding the column widths.
Agilent 6300 Series Ion Trap System Familiarization Guide 169

5 Quantify compounds
Steps Detailed Instructions Comments
3 Examine the consistency of the integration areas.
a In the Area ISTD column, click the header cell.
b Click the Plot Column button to access the Plot Column window.
170 Agilent 6300 Series Ion Trap System Familiarization Guide

Quantify compounds 5
Task 2. Examine the graphic and calibration results
Steps Detailed Instructions Comments
1 Examine the chromatogram and spectrum.
• Click the Chromatogram/Spectrum tab.
• Move through the integrated peaks for each data file by clicking on Previous File and Next File (up and down arrow) buttons.
• Use the scale normalization buttons to view all data.
Agilent 6300 Series Ion Trap System Familiarization Guide 171
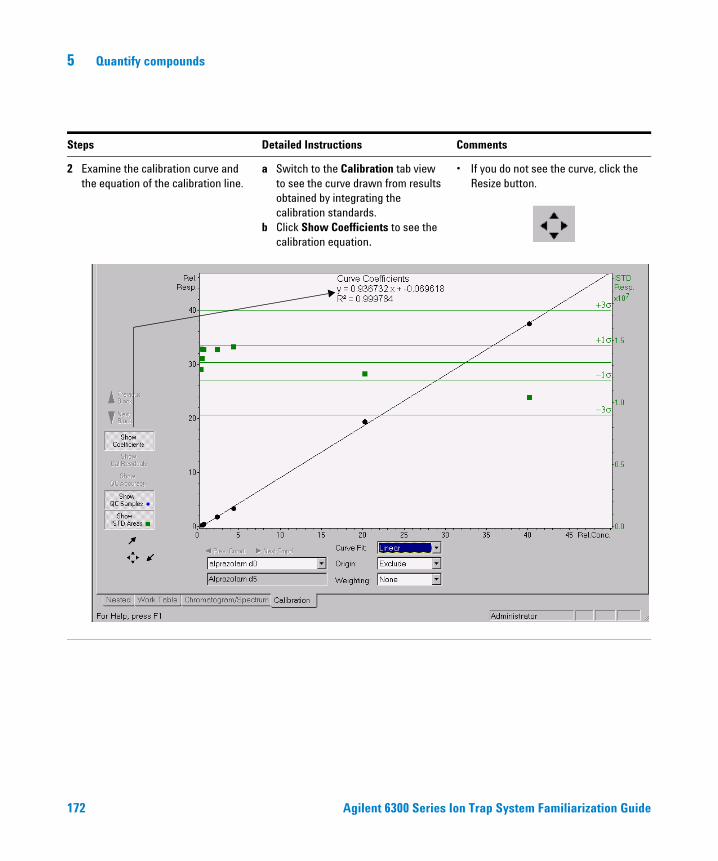
5 Quantify compounds
Steps Detailed Instructions Comments
2 Examine the calibration curve and the equation of the calibration line.
a Switch to the Calibration tab view to see the curve drawn from results obtained by integrating the calibration standards.
b Click Show Coefficients to see the calibration equation.
• If you do not see the curve, click the Resize button.
172 Agilent 6300 Series Ion Trap System Familiarization Guide

Quantify compounds 5
Steps Detailed Instructions Comments
3 Change the curve fit to quadratic. • From the Curve Fit list, select Quadratic.
• Although the calibration was not bad using a Linear Curve Fit (R2 = 0.999777), changing to a Quadratic Curve Fit can result in an even higher R2 = 0.999863.
Agilent 6300 Series Ion Trap System Familiarization Guide 173

5 Quantify compounds
Steps Detailed Instructions Comments
4 Save the method. a Using the same quantitation method, save the method by selecting Method > Save As... as shown in the figure below.
• If you save the method by clicking Save, the quantitation method parameters are saved with the batch, and the prompt shown in the figure below appears after you try to close the batch or QuantAnalysis application.
• Note that the filter type (Filter) determines what methods appear.
• In MRM mode, under MS/MS acquisition, the instrument “hops” back and forth between the two precursor masses while both compounds are eluting.
174 Agilent 6300 Series Ion Trap System Familiarization Guide

Quantify compounds 5
Exercise 4. Print a quantitation report
Steps Detailed Instructions Comments
1 Select a Quant Summary ISTD report to preview.
a In the Work Table window of the QuantAnalysis interface, click Report...
b Select Quant Summary Report ISTD (P) from the list of Layouts.
c Mark the Preview check box.
Agilent 6300 Series Ion Trap System Familiarization Guide 175

5 Quantify compounds
Steps Detailed Instructions Comments
2 View the report. • Click OK. • See the report preview below and on the next two pages.
176 Agilent 6300 Series Ion Trap System Familiarization Guide
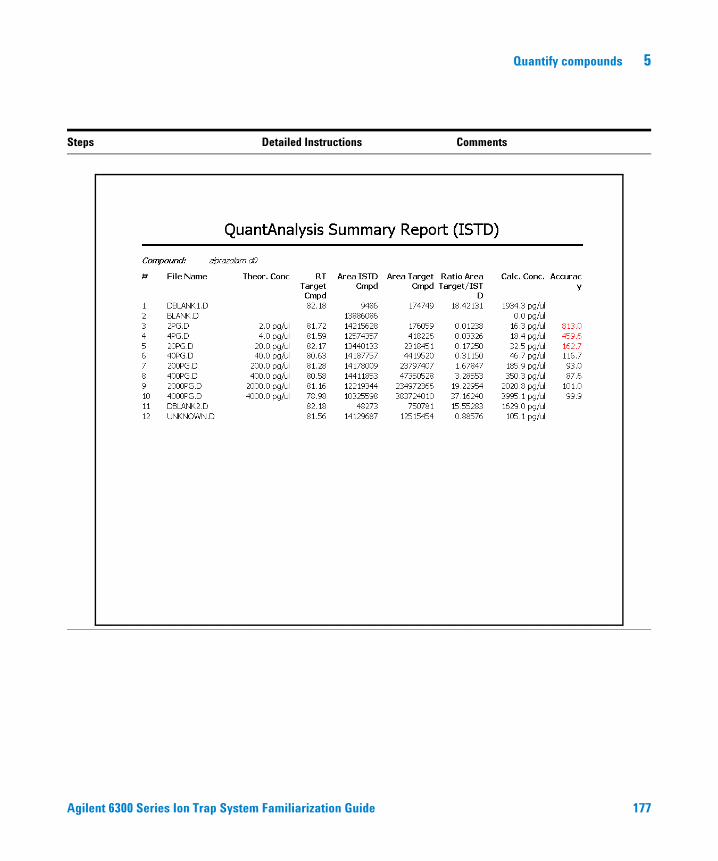
Quantify compounds 5
Steps Detailed Instructions Comments
Agilent 6300 Series Ion Trap System Familiarization Guide 177

5 Quantify compounds
Steps Detailed Instructions Comments
178 Agilent 6300 Series Ion Trap System Familiarization Guide


© Agilent Technologies, Inc. 2006
Third Edition, May 2006
*G2440-90095*G2440-90095
www.agilent.com
Agilent Technologies
In This Book
If you do the exercises in this book, you learn how to set up methods, acquire and process data, identify compounds, search protein spectra and quantify compounds.