agilent technologies e5500a/b phase noise … e5500 users manual.pdf · agilent technologies...
TRANSCRIPT

m
Agilent Technologies E5500A/BPhase Noise Measurement SysteUser’s Guide
Part number: E5500-90004Printed in USAJune 2000Supersedes September 1999
Revision A.01.05
s
or
f
r
e -
Notice
The information contained in this document is subject to change withoutnotice.
Agilent Technologies makes no warranty of any kind with regard to thismaterial, including, but not limited to, the implied warranties ofmerchantability and fitness for a particular purpose. Agilent Technologieshall not be liable for errors contained herein or for incidental orconsequential damages in connection with the furnishing, performance,use of this material.
Agilent Technologies assumes no responsibility for the use or reliability oits software on equipment that is not furnished by Agilent Technologies.
This document contains proprietary information which is protected bycopyright. All rights are reserved. No part of this document may bephotocopied, reproduced, or translated to another language without priowritten consent of Agilent Technologies Company.
U.S. Government Restricted Rights
The Software and documentation are provided with "Restricted Rights".Use,duplication or disclosure by the U.S. Government is subject to therestrictions set forth in subparagraph (c)(1)(ii) of the Rights in TechnicalData and Computer Software clauses in DFARS 252.227-7013 or as setforth in subparagraph (c)(1) and (2) of the Commercial Computer SoftwarRestricted Rights clauses at 48 CFR 52.227-19, as applicable. TheContractor for the Software is Agilent Technologies Company, 3000Hanover Street, Palo Alto, California 94304.
Trademarks
Windows NT 4.0 is a U.S trademarks of Microsoft Corp.
Pentium is a U.S. trademark of Intel Corporation
© Copyright Agilent Technologies Company 1997, 1998, 1999, 2000
Agilent Technologies CompanySanta Rosa Systems Division1400 Fountaingrove ParkwaySanta Rosa, CA 95403-1799, U.S.A.
ii Agilent Technologies E5500 Phase Noise Measurement System

of"ouofle
ird
lent
rized
any
lent
re.
nse
Software LicenseTerms
The following terms govern your use of the enclosed software programs("Software") unless you have a separate written agreement with AgilentTechnologies.
License Grant
Agilent Technologies grants you a license to Use one copy of the versionthe Software identified in your documentation on any one product. "Usemeans storing, loading, installing,executing or displaying the Software. Ymay not modify the Software or disable any licensing or control featuresthe Software. Additional coppies of the software may be used for the sopurpose of viewing previously measured data.
Ownership
The Software is owned and copyrighted by Agilent Technologies or its thparty licensors. Your license confers no title or ownership in the Softwareand should not be construed as a sale of any rights in the Software. AgiTechnologies' third party licensors may protect their rights in the event ofany violation of these terms.
Copies and Adaptations
You may only make copies or adaptations of the Software for archivalpurposes or when copying or adaptation is an essential step in the autho
Use of the Software
You must reproduce all copyright notices in the original Software on allauthorized copies or adaptations. You may not copy the Software ontobulletin board or similar system.
No Disassembly or Decryption
You may not disassemble, decompile or decrypt the Software unless AgiTechnologies' prior written consent is obtained. In some jurisdictions,Agilent Technologies' consent may not be required for disassembly ordecompilation. Upon request, you will provide Agilent Technologies withreasonably detailed information regarding any disassembly ordecompilation.
Transfer
Your license will automatically terminate upon any transfer of the SoftwaUpon transfer, you must deliver all copies of the Software and relateddocumentation to the transferee. The transferee must accept these LiceTerms as a condition to the transfer.
Agilent Technologies E5500 Phase Noise Measurement System iii

ct
nd
n
Third Party Software
Software may include third party software. Those third parties may protetheir rights in the event of any violation of these License Terms.
Termination
Agilent Technologies may terminate your license upon notice forfailure tocomply with any of these License Terms. Upon termination, you mustimmediately destroy the Software, together with all copies, adaptations amerged portions in any form.
Export Requirements
You may not export or re-export the Software or any copy or adaptation iviolation of any applicable laws or regulations.
iv Agilent Technologies E5500 Phase Noise Measurement System

se
What You’ll Find in This Manual…
• Chapter 1, “Getting Started with the Agilent Technologies E5500 PhaNoise Measurement System”
• Chapter 2, “Welcome to the HP E5500 Phase Noise MeasurementSystem Series of Solutions”
• Chapter 3, “Your First Measurement”
• Chapter 4, “Phase Noise Basics”
• Chapter 5, “Expanding Your Measurement Experience”
• Chapter 6, “Absolute Measurement Fundamentals”
• Chapter 7, “Absolute Measurement Examples”
• Chapter 8, “Residual Measurement Fundamentals”
• Chapter 9, “Residual Measurement Examples”
• Chapter 10, “FM Discriminator Fundamentals”
• Chapter 11, “FM Discriminator Measurement Examples”
• Chapter 12, “AM Noise Measurement Fundamentals”
• Chapter 13, “AM Noise Measurement Examples”
• Chapter 14, “Baseband Noise Measurement Examples”
• Chapter 15, “Evaluating Your Measurement Results”
• Chapter 16, “Advanced Software Features”
• Chapter 17, “Error Messages and System Troubleshooting”
• Chapter 18, “Reference Graphs and Tables”
• Chapter 19, “Connect Diagrams”
• Chapter 20, “System Specifications”
• Chapter 21, “Phase Noise Customer Support”
• Appendix A, “Connector Care and Preventive Maintenance”
Agilent Technologies E5500 Phase Noise Measurement System v
yhe
illto
oriae a
malnyedyuld
or
r
hts
ies.
her
Limited Warranty
Software Agilent Technologies warrants that the software will perform substantiallin accordance with the written materials for a period of one (1) year from tdate of receipt.
Agilent Technologies does not warrant that the operation of the software wbe uninterrupted or error free. In the event that this software product failsexecute its programming instructions during the warranty period, thecustomer’s remedy shall be to return the media to Agilent Technologies freplacement. Should Agilent Technologies be unable to replace the medwithin a reasonable amount of time, Customer’s alternate remedy shall brefund of the purchase price upon return of all copies of the software.
Media Agilent Technologies warrants the media upon which this product isrecorded to be free from defects in materials and workmanship under noruse for a period of one (1) year from the date of purchase. In the event amedia prove to be defective during the warranty period, Customer’s remshall be to return the media to Agilent Technologies for replacement. ShoAgilent Technologies be unable to replace the media within a reasonableamount of time, Customer’s alternate remedy shall be a refund of thepurchase price upon return of the product and all copies.
Notice of WarrantyClaims
Customer shall notify Agilent Technologies in writing of any warranty claimnot later than thirty (30) days after the expiration of the warranty period.
Limitation ofWarranty
Agilent Technologies makes no other express warranty, whether writtenoral, with respect to this product.
Any implied warranty of merchantability or fitness is limited to one (1) yeaduration of this written warranty.
This warranty gives specific legal rights, and Customer may also have rigwhich vary which vary from state to state, or province to province.
Exclusive Remedies The remedies provided above are Customer’s sole and exclusive remedIn no event shall Agilent Technologies be liable for any direct, indirect,special, incidental, or consequential damages (including lost profit) whetbased on warranty, contract, tort, or any other legal theory.
Assistance For assistance, call your local Agilent Technologies Sales and ServiceOffice (refer to“Service and Support” on page -vii).
vi Agilent Technologies E5500 Phase Noise Measurement System
dal
iesve:
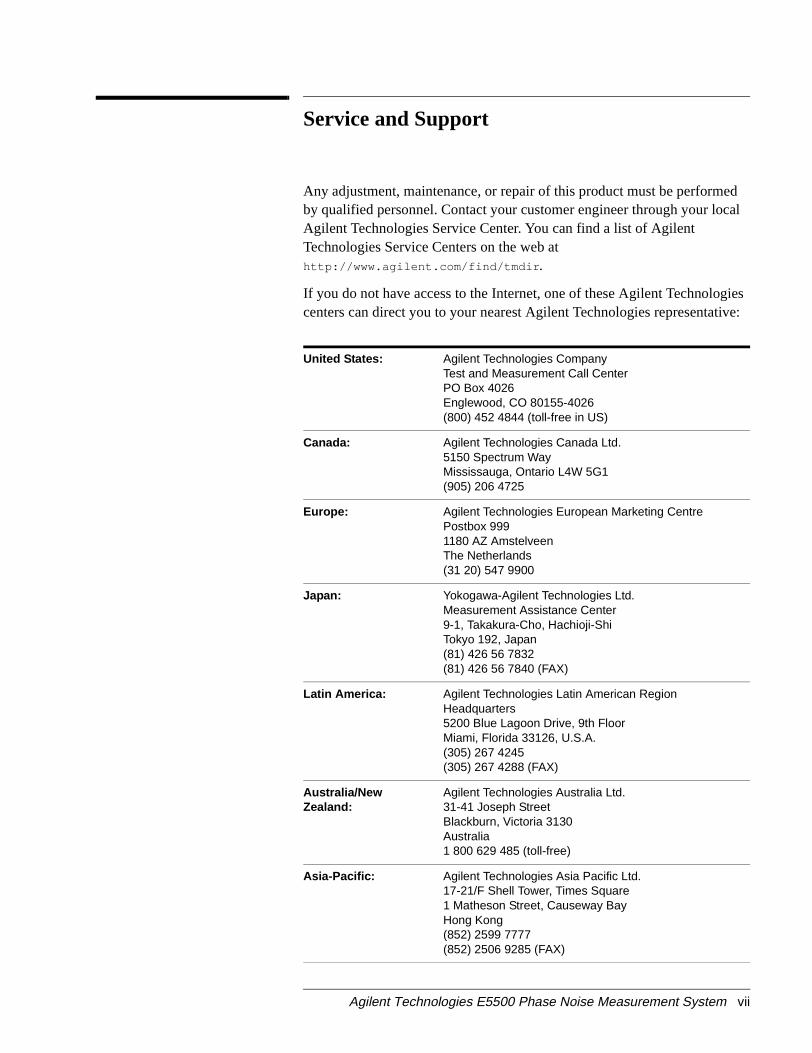
Service and Support
Any adjustment, maintenance, or repair of this product must be performeby qualified personnel. Contact your customer engineer through your locAgilent Technologies Service Center. You can find a list of AgilentTechnologies Service Centers on the web athttp://www.agilent.com/find/tmdir .
If you do not have access to the Internet, one of these Agilent Technologcenters can direct you to your nearest Agilent Technologies representati
United States: Agilent Technologies CompanyTest and Measurement Call CenterPO Box 4026Englewood, CO 80155-4026(800) 452 4844 (toll-free in US)
Canada: Agilent Technologies Canada Ltd.5150 Spectrum WayMississauga, Ontario L4W 5G1(905) 206 4725
Europe: Agilent Technologies European Marketing CentrePostbox 9991180 AZ AmstelveenThe Netherlands(31 20) 547 9900
Japan: Yokogawa-Agilent Technologies Ltd.Measurement Assistance Center9-1, Takakura-Cho, Hachioji-ShiTokyo 192, Japan(81) 426 56 7832(81) 426 56 7840 (FAX)
Latin America: Agilent Technologies Latin American RegionHeadquarters5200 Blue Lagoon Drive, 9th FloorMiami, Florida 33126, U.S.A.(305) 267 4245(305) 267 4288 (FAX)
Australia/NewZealand:
Agilent Technologies Australia Ltd.31-41 Joseph StreetBlackburn, Victoria 3130Australia1 800 629 485 (toll-free)
Asia-Pacific: Agilent Technologies Asia Pacific Ltd.17-21/F Shell Tower, Times Square1 Matheson Street, Causeway BayHong Kong(852) 2599 7777(852) 2506 9285 (FAX)
Agilent Technologies E5500 Phase Noise Measurement System vii
iiiii
ivii
viivivi
1-2-3
t
1-2-4
1-22-2-3-333-4-5-7-8-8-9
-99
1-2
15-25-3
Notice . . . . . . . . . . . . . . . . . . . . . . . . . . . . . . . . . . . . . . . . . . . . . . . . . . . . .Software License Terms . . . . . . . . . . . . . . . . . . . . . . . . . . . . . . . . . . . .
What You’ll Find in This Manual… . . . . . . . . . . . . . . . . . . . . . . . . . . . . . . vLimited Warranty . . . . . . . . . . . . . . . . . . . . . . . . . . . . . . . . . . . . . . . . . . . . v
Software . . . . . . . . . . . . . . . . . . . . . . . . . . . . . . . . . . . . . . . . . . . . . . . .Media . . . . . . . . . . . . . . . . . . . . . . . . . . . . . . . . . . . . . . . . . . . . . . . . . . vNotice of Warranty Claims . . . . . . . . . . . . . . . . . . . . . . . . . . . . . . . . . .Limitation of Warranty . . . . . . . . . . . . . . . . . . . . . . . . . . . . . . . . . . . . . vExclusive Remedies . . . . . . . . . . . . . . . . . . . . . . . . . . . . . . . . . . . . . . .Assistance . . . . . . . . . . . . . . . . . . . . . . . . . . . . . . . . . . . . . . . . . . . . . . .
Service and Support .. . . . . . . . . . . . . . . . . . . . . . . . . . . . . . . . . . . . . . . . vii
1. Getting Started with the Agilent Technologies E5500 Phase NoiseMeasurement System
What You’ll Find in This Chapter… . . . . . . . . . . . . . . . . . . . . . . . . . . . . 1-Introduction . . . . . . . . . . . . . . . . . . . . . . . . . . . . . . . . . . . . . . . . . . . . . . . . 1Training Guidelines . . . . . . . . . . . . . . . . . . . . . . . . . . . . . . . . . . . . . . . . . 1
2. Welcome to the Agilent Technologies E5500 Phase Noise MeasuremenSystem Series of Solutions
What You’ll Find in This Chapter… . . . . . . . . . . . . . . . . . . . . . . . . . . . . 2-Introducing the Graphical User Interface . . . . . . . . . . . . . . . . . . . . . . . . . 2System Requirements . . . . . . . . . . . . . . . . . . . . . . . . . . . . . . . . . . . . . . . . 2
3. Your First Measurement
What You’ll Find in This Chapter… . . . . . . . . . . . . . . . . . . . . . . . . . . . . 3-Designed to Meet Your Needs . . . . . . . . . . . . . . . . . . . . . . . . . . . . . . . . . 3
As You Begin . . . . . . . . . . . . . . . . . . . . . . . . . . . . . . . . . . . . . . . . . . . 3-As You Progress . . . . . . . . . . . . . . . . . . . . . . . . . . . . . . . . . . . . . . . . . 3
E5500 Operation; A Guided Tour . . . . . . . . . . . . . . . . . . . . . . . . . . . . . . 3Required Equipment . . . . . . . . . . . . . . . . . . . . . . . . . . . . . . . . . . . . . . 3How to Begin . . . . . . . . . . . . . . . . . . . . . . . . . . . . . . . . . . . . . . . . . . . 3-
Starting the Measurement Software . . . . . . . . . . . . . . . . . . . . . . . . . . . . .Making a Measurement . . . . . . . . . . . . . . . . . . . . . . . . . . . . . . . . . . . . . . 3
Beginning the Measurement . . . . . . . . . . . . . . . . . . . . . . . . . . . . . . . . 3Connect Diagram Example . . . . . . . . . . . . . . . . . . . . . . . . . . . . . . . . 3Making the Measurement . . . . . . . . . . . . . . . . . . . . . . . . . . . . . . . . . . 3Sweep-Segments . . . . . . . . . . . . . . . . . . . . . . . . . . . . . . . . . . . . . . . . 3Congratulations . . . . . . . . . . . . . . . . . . . . . . . . . . . . . . . . . . . . . . . . . 3To Learn More . . . . . . . . . . . . . . . . . . . . . . . . . . . . . . . . . . . . . . . . . . 3-
4. Phase Noise Basics
What You’ll Find in This Chapter . . . . . . . . . . . . . . . . . . . . . . . . . . . . . . 4-What is Phase Noise? . . . . . . . . . . . . . . . . . . . . . . . . . . . . . . . . . . . . . . . . 4
5. Expanding Your Measurement Experience
What You’ll Find in This Chapter . . . . . . . . . . . . . . . . . . . . . . . . . . . . . . 5-Starting the Measurement Software . . . . . . . . . . . . . . . . . . . . . . . . . . . . .Using the Asset Manager to Add a Source . . . . . . . . . . . . . . . . . . . . . . . .
Agilent Technologies E5500 Phase Noise Measurement System -i
5-8
11-1314
416282829
34-3637
73951515267
-59-6012
3
1-2
6-3-36-6-66-7
-88-9-91122
144
Using the Server Hardware Connections to Specify the Source . . . . . . .Testing the Agilent/HP 8663A Internal/External 10 MHz . . .. . . . . . . 5-10
Defining the Measurement . . . . . . . . . . . . . . . . . . . . . . . . . . . . . . . 5-Selecting a Reference Source . . . . . . . . . . . . . . . . . . . . . . . . . . . . . 5Selecting Loop Suppression Verification . . . . . . . . . . . . . . . . . . . . 5-Setup Considerations for the Agilent/HP 8663A
10 MHz Measurement . . . . . . . . . . . . . . . . . . . . . . . . . . . . . . . 5-1Beginning the Measurement . . . . . . . . . . . . . . . . . . . . . . . . . . . . . . 5-Sweep-Segments . . . . . . . . . . . . . . . . . . . . . . . . . . . . . . . . . . . . . . . 5-Checking the Beatnote . . . . . . . . . . . . . . . . . . . . . . . . . . . . . . . . . . 5-Making the Measurement . . . . . . . . . . . . . . . . . . . . . . . . . . . . . . . . 5-
Testing the Agilent/HP 8644B Internal/External 10 MHz . . .. . . . . . . 5-33Defining the Measurement . . . . . . . . . . . . . . . . . . . . . . . . . . . . . . . 5-Selecting a Reference Source . . . . . . . . . . . . . . . . . . . . . . . . . . . . . 5Selecting Loop Suppression Verification . . . . . . . . . . . . . . . . . . . . 5-Setup Considerations for the Agilent/HP 8663A
10 MHz Measurement . . . . . . . . . . . . . . . . . . . . . . . . . . . . . . . 5-3Beginning the Measurement . . . . . . . . . . . . . . . . . . . . . . . . . . . . . . 5-Sweep-Segments . . . . . . . . . . . . . . . . . . . . . . . . . . . . . . . . . . . . . . . 5-Checking the Beatnote . . . . . . . . . . . . . . . . . . . . . . . . . . . . . . . . . . 5-Making the Measurement . . . . . . . . . . . . . . . . . . . . . . . . . . . . . . . . 5-
Viewing Markers . . . . . . . . . . . . . . . . . . . . . . . . . . . . . . . . . . . . . . . . . . 5-5Omitting Spurs . . . . . . . . . . . . . . . . . . . . . . . . . . . . . . . . . . . . . . . . . . . . 5-5Displaying the Parameter Summary . . . . . . . . . . . . . . . . . . . . . . . . . . . 5Exporting Measurement Results . . . . . . . . . . . . . . . . . . . . . . . . . . . . . . 5
Exporting Trace Data . . . . . . . . . . . . . . . . . . . . . . . . . . . . . . . . . . . 5-6Exporting Spur Data . . . . . . . . . . . . . . . . . . . . . . . . . . . . . . . . . . . . 5-6Exporting X-Y Data . . . . . . . . . . . . . . . . . . . . . . . . . . . . . . . . . . . . 5-6
6. Absolute Measurement Fundamentals
What You’ll Find in This Chapter . . . . . . . . . . . . . . . . . . . . . . . . . . . . . . 6-The Phase Lock Loop Technique . . . . . . . . . . . . . . . . . . . . . . . . . . . . . . 6
Understanding the Phase-Lock Loop Technique . . . . . . . . . . . . . . .The Phase Lock Loop Circuit . . . . . . . . . . . . . . . . . . . . . . . . . . . . . . 6
What Sets the Measurement Noise Floor? . . . . . . . . . . . . . . . . . . . . . . .The System Noise Floor . . . . . . . . . . . . . . . . . . . . . . . . . . . . . . . . . . 6The Noise Level of the Reference Source . . . . . . . . . . . . . . . . . . . .
Selecting a Reference . . . . . . . . . . . . . . . . . . . . . . . . . . . . . . . . . . . . . . . 6Using a Similar Device . . . . . . . . . . . . . . . . . . . . . . . . . . . . . . . . . . . 6-Using a Signal Generator . . . . . . . . . . . . . . . . . . . . . . . . . . . . . . . . . 6Tuning Requirements . . . . . . . . . . . . . . . . . . . . . . . . . . . . . . . . . . . . 6
Estimating the Tuning Constant . . . . . . . . . . . . . . . . . . . . . . . . . . . . . . 6-Tracking Frequency Drift . . . . . . . . . . . . . . . . . . . . . . . . . . . . . . . . . . . 6-1
Evaluating Beatnote Drift . . . . . . . . . . . . . . . . . . . . . . . . . . . . . . . . 6-1Changing the PTR . . . . . . . . . . . . . . . . . . . . . . . . . . . . . . . . . . . . . . . . . 6-
The Tuning Qualifications . . . . . . . . . . . . . . . . . . . . . . . . . . . . . . . 6-1Minimizing Injection Locking . . . . . . . . . . . . . . . . . . . . . . . . . . . . . . . . 6-16
-ii Agilent Technologies E5500 Phase Noise Measurement System

668
8
020
1-2-2-37-5-67-6-8
1920242425-2728
8314244484849-5152
2556668727273-7576-77
77
Adding Isolation . . . . . . . . . . . . . . . . . . . . . . . . . . . . . . . . . . . . . . . . 6-1Increasing the PLL Bandwidth . . . . . . . . . . . . . . . . . . . . . . . . . . . . . 6-1
Inserting a Device . . . . . . . . . . . . . . . . . . . . . . . . . . . . . . . . . . . . . . . . . . 6-1An Attenuator . . . . . . . . . . . . . . . . . . . . . . . . . . . . . . . . . . . . . . . . . . 6-1An Amplifier . . . . . . . . . . . . . . . . . . . . . . . . . . . . . . . . . . . . . . . . . . 6-18
Evaluating Noise Above the Small Angle Line . . . . . . . . . . . . . . . . . . . 6-2Determining the Phase Lock Loop Bandwidth . . . . . . . . . . . . . . . . 6-
7. Absolute Measurement Examples
What You’ll Find in This Chapter . . . . . . . . . . . . . . . . . . . . . . . . . . . . . . 7-Stable RF Oscillator . . . . . . . . . . . . . . . . . . . . . . . . . . . . . . . . . . . . . . . . . 7
Required Equipment . . . . . . . . . . . . . . . . . . . . . . . . . . . . . . . . . . . . . . 7Defining the Measurement . . . . . . . . . . . . . . . . . . . . . . . . . . . . . . . . . 7Selecting a Reference Source . . . . . . . . . . . . . . . . . . . . . . . . . . . . . . .Selecting Loop Suppression Verification . . . . . . . . . . . . . . . . . . . . . . 7Setup Considerations for the Stable RF Oscillator Measurement . . .Beginning the Measurement . . . . . . . . . . . . . . . . . . . . . . . . . . . . . . . . 7Checking the Beatnote . . . . . . . . . . . . . . . . . . . . . . . . . . . . . . . . . . . 7-Making the Measurement . . . . . . . . . . . . . . . . . . . . . . . . . . . . . . . . . 7-
Free-Running RF Oscillator . . . . . . . . . . . . . . . . . . . . . . . . . . . . . . . . . . 7-Required Equipment . . . . . . . . . . . . . . . . . . . . . . . . . . . . . . . . . . . . . 7-Defining the Measurement . . . . . . . . . . . . . . . . . . . . . . . . . . . . . . . . 7-Selecting a Reference Source . . . . . . . . . . . . . . . . . . . . . . . . . . . . . . 7Selecting Loop Suppression Verification . . . . . . . . . . . . . . . . . . . . . 7-Setup Considerations for the Free-Running RF
Oscillator Measurement . . . . . . . . . . . . . . . . . . . . . . . . . . . . . . . 7-2Beginning the Measurement . . . . . . . . . . . . . . . . . . . . . . . . . . . . . . . 7-Checking the Beatnote . . . . . . . . . . . . . . . . . . . . . . . . . . . . . . . . . . . 7-Making the Measurement . . . . . . . . . . . . . . . . . . . . . . . . . . . . . . . . . 7-
RF Synthesizer using DCFM . . . . . . . . . . . . . . . . . . . . . . . . . . . . . . . . . 7-Required Equipment . . . . . . . . . . . . . . . . . . . . . . . . . . . . . . . . . . . . . 7-Defining the Measurement . . . . . . . . . . . . . . . . . . . . . . . . . . . . . . . . 7-Selecting a Reference Source . . . . . . . . . . . . . . . . . . . . . . . . . . . . . . 7Selecting Loop Suppression Verification . . . . . . . . . . . . . . . . . . . . . 7-Setup Considerations for the RF Synthesizer using
DCFM Measurement . . . . . . . . . . . . . . . . . . . . . . . . . . . . . . . . . 7-5Beginning the Measurement . . . . . . . . . . . . . . . . . . . . . . . . . . . . . . . 7-Checking the Beatnote . . . . . . . . . . . . . . . . . . . . . . . . . . . . . . . . . . . 7-Making the Measurement . . . . . . . . . . . . . . . . . . . . . . . . . . . . . . . . . 7-
RF Synthesizer using EFC . . . . . . . . . . . . . . . . . . . . . . . . . . . . . . . . . . . 7-Required Equipment . . . . . . . . . . . . . . . . . . . . . . . . . . . . . . . . . . . . . 7-Defining the Measurement . . . . . . . . . . . . . . . . . . . . . . . . . . . . . . . . 7-Selecting a Reference Source . . . . . . . . . . . . . . . . . . . . . . . . . . . . . . 7Selecting Loop Suppression Verification . . . . . . . . . . . . . . . . . . . . . 7-Selecting a Reference Source . . . . . . . . . . . . . . . . . . . . . . . . . . . . . . 7Setup Considerations for the RF Synthesizer using
EFC Measurement . . . . . . . . . . . . . . . . . . . . . . . . . . . . . . . . . . . 7-
Agilent Technologies E5500 Phase Noise Measurement System -iii
80919377
9800
01101031012
1-2-2. 8-4-4-6-6
-98-913167-199148
1-2-2-3-7-7
10-13
1-2
-2-3
Beginning the Measurement . . . . . . . . . . . . . . . . . . . . . . . . . . . . . . 7-Checking the Beatnote . . . . . . . . . . . . . . . . . . . . . . . . . . . . . . . . . . 7-Making the Measurement . . . . . . . . . . . . . . . . . . . . . . . . . . . . . . . . 7-
Microwave Source . . . . . . . . . . . . . . . . . . . . . . . . . . . . . . . . . . . . . . . . . 7-9Required Equipment . . . . . . . . . . . . . . . . . . . . . . . . . . . . . . . . . . . . 7-9Defining the Measurement . . . . . . . . . . . . . . . . . . . . . . . . . . . . . . . 7-Selecting a Reference Source . . . . . . . . . . . . . . . . . . . . . . . . . . . . 7-1Selecting Loop Suppression Verification . . . . . . . . . . . . . . . . . . . 7-1Setup Considerations for the Microwave Source Measurement . . 7-Beginning the Measurement . . . . . . . . . . . . . . . . . . . . . . . . . . . . . 7-1Checking the Beatnote . . . . . . . . . . . . . . . . . . . . . . . . . . . . . . . . . 7-1Making the Measurement . . . . . . . . . . . . . . . . . . . . . . . . . . . . . . . 7-1
8. Residual Measurement Fundamentals
What You’ll Find in This Chapter . . . . . . . . . . . . . . . . . . . . . . . . . . . . . . 8-What is Residual Noise? . . . . . . . . . . . . . . . . . . . . . . . . . . . . . . . . . . . . . 8
The Noise Mechanisms . . . . . . . . . . . . . . . . . . . . . . . . . . . . . . . . . . . 8Basic Assumptions Regarding Residual Phase Noise Measurements . .
Frequency Translation Devices . . . . . . . . . . . . . . . . . . . . . . . . . . . . . 8Calibrating the Measurement . . . . . . . . . . . . . . . . . . . . . . . . . . . . . . . . . . 8
Calibration and Measurement Guidelines . . . . . . . . . . . . . . . . . . . . . 8The Calibration Options . . . . . . . . . . . . . . . . . . . . . . . . . . . . . . . . . . . . . 8
User Entry of Phase Detector Constant . . . . . . . . . . . . . . . . . . . . . . .Measured +/- DC Peak Voltage . . . . . . . . . . . . . . . . . . . . . . . . . . . . 8-Measured Beatnote . . . . . . . . . . . . . . . . . . . . . . . . . . . . . . . . . . . . . 8-Procedure . . . . . . . . . . . . . . . . . . . . . . . . . . . . . . . . . . . . . . . . . . . . 8-1Synthesized Residual Measurement using Beatnote Cal . . . . . . . . 8Procedure . . . . . . . . . . . . . . . . . . . . . . . . . . . . . . . . . . . . . . . . . . . . 8-1Double-Sided Spur . . . . . . . . . . . . . . . . . . . . . . . . . . . . . . . . . . . . . 8-2Single-Sided Spur . . . . . . . . . . . . . . . . . . . . . . . . . . . . . . . . . . . . . . 8-2
Measurement Difficulties . . . . . . . . . . . . . . . . . . . . . . . . . . . . . . . . . . . 8-2System Connections . .. . . . . . . . . . . . . . . . . . . . . . . . . . . . . . . . . . 8-28
9. Residual Measurement Examples
What You’ll Find in This Chapter . . . . . . . . . . . . . . . . . . . . . . . . . . . . . . 9-Amplifier Measurement Example . . . . . . . . . . . . . . . . . . . . . . . . . . . . . . 9
Required Equipment . . . . . . . . . . . . . . . . . . . . . . . . . . . . . . . . . . . . . 9Defining the Measurement . . . . . . . . . . . . . . . . . . . . . . . . . . . . . . . . 9Setup Considerations . . . . . . . . . . . . . . . . . . . . . . . . . . . . . . . . . . . . . 9Beginning the Measurement . . . . . . . . . . . . . . . . . . . . . . . . . . . . . . . 9Making the Measurement . . . . . . . . . . . . . . . . . . . . . . . . . . . . . . . . 9-When the Measurement is Complete . . . . . . . . . . . . . . . . . . . . . . . 9
10. FM Discriminator Fundamentals
What You’ll Find in This Chapter . . . . . . . . . . . . . . . . . . . . . . . . . . . . . 10-The Frequency Discriminator Method . . . . . . . . . . . . . . . . . . . . . . . . . 10
Basic Theory . . . . . . . . . . . . . . . . . . . . . . . . . . . . . . . . . . . . . . . . . . 10The Discriminator Transfer Response . . . . . . . . . . . . . . . . . . . . . . 10
-iv Agilent Technologies E5500 Phase Noise Measurement System
1-21-3-3
4-5-91013-15
818920242528-30
1-2-2
2-2-3-342-6
2-8-80
1224
17
1
-3-7-9
3-9
11. FM Discriminator Measurement Examples
What You’ll Find in This Chapter . . . . . . . . . . . . . . . . . . . . . . . . . . . . . 11-Introduction . . . . . . . . . . . . . . . . . . . . . . . . . . . . . . . . . . . . . . . . . . . . . . . 11FM Discriminator Measurement using Double-Sided Spur Calibration 1
Required Equipment . . . . . . . . . . . . . . . . . . . . . . . . . . . . . . . . . . . . . 11Determining the Discriminator
(Delay Line) Length . . . . . . . . . . . . . . . . . . . . . . . . . . . . . . . . . . 11-Defining the Measurement . . . . . . . . . . . . . . . . . . . . . . . . . . . . . . . . 11Setup Considerations . . . . . . . . . . . . . . . . . . . . . . . . . . . . . . . . . . . . 11Beginning the Measurement . . . . . . . . . . . . . . . . . . . . . . . . . . . . . . 11-Making the Measurement . . . . . . . . . . . . . . . . . . . . . . . . . . . . . . . . 11-When the Measurement is Complete . . . . . . . . . . . . . . . . . . . . . . . 11
Discriminator Measurement using FM Rateand Deviation Calibration . . . . . . . . . . . . . . . . . . . . . . . . . . . . . . . 11-1Required Equipment . . . . . . . . . . . . . . . . . . . . . . . . . . . . . . . . . . . . 11-Determining the Discriminator (Delay Line) Length . . . . . . . . . . . 11-1Defining the Measurement . . . . . . . . . . . . . . . . . . . . . . . . . . . . . . . 11-Setup Considerations . . . . . . . . . . . . . . . . . . . . . . . . . . . . . . . . . . . 11-Beginning the Measurement . . . . . . . . . . . . . . . . . . . . . . . . . . . . . . 11-Making the Measurement . . . . . . . . . . . . . . . . . . . . . . . . . . . . . . . . 11-When the Measurement is Complete . . . . . . . . . . . . . . . . . . . . . . . 11
12. AM Noise Measurement Fundamentals
What You’ll Find in This Chapter . . . . . . . . . . . . . . . . . . . . . . . . . . . . . 12-AM-Noise Measurement Theory of Operation . . . . . . . . . . . . . . . . . . . . 12
Basic Noise Measurement . . . . . . . . . . . . . . . . . . . . . . . . . . . . . . . . 12Phase Noise Measurement . . . . . . . . . . . . . . . . . . . . . . . . . . . . . . . . 1
Amplitude Noise Measurement . . . . . . . . . . . . . . . . . . . . . . . . . . . . . . . 12AM Noise Measurement Block Diagrams . . . . . . . . . . . . . . . . . . . . 12AM Detector . . . . . . . . . . . . . . . . . . . . . . . . . . . . . . . . . . . . . . . . . . . 12-
Calibration and Measurement General Guidelines . . . . . . . . . . . . . . . . . 1Method 1:
User Entry of Phase Detector Constant . . . . . . . . . . . . . . . . . . . . . . 1Method 1, example 1 . . . . . . . . . . . . . . . . . . . . . . . . . . . . . . . . . . . . 12Method 1, Example 2 . . . . . . . . . . . . . . . . . . . . . . . . . . . . . . . . . . . 12-1
Method 2: Double-Sided Spur . . . . . . . . . . . . . . . . . . . . . . . . . . . . . . . 12-Method 2, Example 1 . . . . . . . . . . . . . . . . . . . . . . . . . . . . . . . . . . . 12-1Method 2, Example 2 . . . . . . . . . . . . . . . . . . . . . . . . . . . . . . . . . . . 12-1
Method 3: Single-Sided-Spur . . . . . . . . . . . . . . . . . . . . . . . . . . . . . . . . 12-
13. AM Noise Measurement Examples
What You’ll Find in This Chapter . . . . . . . . . . . . . . . . . . . . . . . . . . . . . 13-AM Noise using an Agilent/HP 70420A Option 001 . . .. . . . . . . . . . . . 13-2
Defining the Measurement . . . . . . . . . . . . . . . . . . . . . . . . . . . . . . . . 13Beginning the Measurement . . . . . . . . . . . . . . . . . . . . . . . . . . . . . . . 13Making the Measurement . . . . . . . . . . . . . . . . . . . . . . . . . . . . . . . . . 13When the Measurement is Complete . . . . . . . . . . . . . . . . . . . . . . . . 1
Agilent Technologies E5500 Phase Noise Measurement System -v
114-2-2-3-414-6-6-7-7
1-2
-2-3-65-6-6-7
-7-89012345202
1-2
221212ph
13
14. Baseband Noise Measurement Examples
What You’ll Find in This Chapter . . . . . . . . . . . . . . . . . . . . . . . . . . . . . 14-Baseband Noise using a Test Set Measurement Example . . . . . . . . . . .
Defining the Measurement . . . . . . . . . . . . . . . . . . . . . . . . . . . . . . . 14Beginning the Measurement . . . . . . . . . . . . . . . . . . . . . . . . . . . . . . 14Making the Measurement . . . . . . . . . . . . . . . . . . . . . . . . . . . . . . . . 14
Baseband Noise without using a Test Set Measurement Example . . . .Defining the Measurement . . . . . . . . . . . . . . . . . . . . . . . . . . . . . . . 14Beginning the Measurement . . . . . . . . . . . . . . . . . . . . . . . . . . . . . . 14Making the Measurement . . . . . . . . . . . . . . . . . . . . . . . . . . . . . . . . 14
15. Evaluating Your Measurement Results
What You’ll Find in This Chapter . . . . . . . . . . . . . . . . . . . . . . . . . . . . . 15-Evaluating the Results . . . . . . . . . . . . . . . . . . . . . . . . . . . . . . . . . . . . . . 15
Looking For Obvious Problems . . . . . . . . . . . . . . . . . . . . . . . . . . . 15Comparing Against Expected Data . . . . . . . . . . . . . . . . . . . . . . . . . 15
Gathering More Data . . . . . . . . . . . . . . . . . . . . . . . . . . . . . . . . . . . . . . . 15Repeating the Measurement . . . . . . . . . . . . . . . . . . . . . . . . . . . . . . 1Doing More Research . . . . . . . . . . . . . . . . . . . . . . . . . . . . . . . . . . . 15
Outputting the Results . . . . . . . . . . . . . . . . . . . . . . . . . . . . . . . . . . . . . . 15Using a Printer . . . . . . . . . . . . . . . . . . . . . . . . . . . . . . . . . . . . . . . . 15
Graph of Results . . . . . . . . . . . . . . . . . . . . . . . . . . . . . . . . . . . . . . . . . . 15Marker . . . . . . . . . . . . . . . . . . . . . . . . . . . . . . . . . . . . . . . . . . . . . . . 15-Omit Spurs . . . . . . . . . . . . . . . . . . . . . . . . . . . . . . . . . . . . . . . . . . 15-1Parameter Summary . . . . . . . . . . . . . . . . . . . . . . . . . . . . . . . . . . . 15-
Problem Solving . . . . . . . . . . . . . . . . . . . . . . . . . . . . . . . . . . . . . . . . . 15-1Discontinuity in the Graph . . . . . . . . . . . . . . . . . . . . . . . . . . . . . . 15-1Higher Noise Level . . . . . . . . . . . . . . . . . . . . . . . . . . . . . . . . . . . . 15-1Spurs on the Graph . . . . . . . . . . . . . . . . . . . . . . . . . . . . . . . . . . . . 15-Small Angle Line . . . . . . . . . . . . . . . . . . . . . . . . . . . . . . . . . . . . . 15-2
16. Advanced Software Features
What You’ll Find in This Chapter… . . . . . . . . . . . . . . . . . . . . . . . . . . . 16-Introduction . . . . . . . . . . . . . . . . . . . . . . . . . . . . . . . . . . . . . . . . . . . . . . 16Phase Lock Loop Suppression . . .. . . . . . . . . . . . . . . . . . . . . . . . . . . . . 16-3PLL Suppression Parameters. . . . . . . . . . . . . . . . . . . . . . . . . . . . . . . . . 16-3Ignore Out Of Lock Mode .. . . . . . . . . . . . . . . . . . . . . . . . . . . . . . . . . . 16-6PLL Suppression Verification Process. . . . . . . . . . . . . . . . . . . . . . . . . 16-7
PLL Suppression Information. . . . . . . . . . . . . . . . . . . . . . . . . . . . . 16-8PLL Gain Change . . . . . . . . . . . . . . . . . . . . . . . . . . . . . . . . . . . . . .16-1Maximum Error . . . . . . . . . . . . . . . . . . . . . . . . . . . . . . . . . . . . . . . 16-1Accuracy Degradation . . . . . . . . . . . . . . . . . . . . . . . . . . . . . . . . . . 16-Supporting an Embedded VXI PC: . . . . . . . . . . . . . . . . . . . . . . . . 16-
Blanking Frequency and Amplitude Information on the Phase Noise Gra16-13Security Level Procedure . . . . . . . . . . . . . . . . . . . . . . . . . . . . . . . 16-
-vi Agilent Technologies E5500 Phase Noise Measurement System

1
-1-1-18-2-3
8-418-5678-8-9-10-1112-134415-156617178819190021-212223-23
-1
9-4
17. Error Messages and System Troubleshooting
What You’ll Find in This Chapter . . . . . . . . . . . . . . . . . . . . . . . . . . . . . 17-
18. Reference Graphs and Tables
Graphs and Tables You’ll Find in This Chapter . . . . . . . . . . . . . . . . . . . 18Graphs . . . . . . . . . . . . . . . . . . . . . . . . . . . . . . . . . . . . . . . . . . . . . . . 18Tables . . . . . . . . . . . . . . . . . . . . . . . . . . . . . . . . . . . . . . . . . . . . . . . . 18
Approximate System Phase Noise Floor vs. R Port Signal Level . . . . . 1Phase Noise Floor and Region of Validity . . . . . . . . . . . . . . . . . . . . . . . 18Phase Noise Level of Various Agilent/HP Sources . . . . . . . . . . . . . . . . 1Increase in Measured Noise as Ref Source Approaches UUT Noise . . .Approximate Sensitivity of Delay Line Discriminator . . . . . . . . . . . . . . 18-AM Calibration . . . . . . . . . . . . . . . . . . . . . . . . . . . . . . . . . . . . . . . . . . . . 18-Voltage Controlled Source Tuning Requirements . . . . . . . . . . . . . . . . . 1Tune Range of VCO vs. Center Voltage . . . . . . . . . . . . . . . . . . . . . . . . 18Peak Tuning Range Required Due to Noise Level . . . . . . . . . . . . . . . . 18Phase Lock Loop Bandwidth vs. Peak Tuning Range . . . . . . . . . . . . . 18Noise Floor Limits Due to Peak Tuning Range . . . . . . . . . . . . . . . . . . 18-Tuning Characteristics of Various VCO Source Options . . . . . . . . . . . 18Agilent/HP 8643A Frequency Limits . . . . . . . . . . . . . . . . . . . . . . . . . . 18-1
Agilent/HP 8643A Mode Keys . . . . . . . . . . . . . . . . . . . . . . . . . . . 18-1How to Access Special Functions . . . . . . . . . . . . . . . . . . . . . . . . . 18-Description of Special Functions 120 and 125 . . . . . . . . . . . . . . . . 18
Agilent/HP 8644B Frequency Limits . . . . . . . . . . . . . . . . . . . . . . . . . . 18-1Agilent/HP 8644B Mode Keys . . . . . . . . . . . . . . . . . . . . . . . . . . . 18-1How to Access Special Functions . . . . . . . . . . . . . . . . . . . . . . . . . 18-Description of Special Function 120 . . . . . . . . . . . . . . . . . . . . . . . 18-
Agilent/HP 8664A Frequency Limits . . . . . . . . . . . . . . . . . . . . . . . . . . 18-1Agilent/HP 8664A Mode Keys . . . . . . . . . . . . . . . . . . . . . . . . . . . 18-1How to Access Special Functions . . . . . . . . . . . . . . . . . . . . . . . . . 18-Description of Special Functions 120 . . . . . . . . . . . . . . . . . . . . . . 18-
Agilent/HP 8665A Frequency Limits . . . . . . . . . . . . . . . . . . . . . . . . . . 18-2Agilent/HP 8665A Mode Keys . . . . . . . . . . . . . . . . . . . . . . . . . . . 18-2How to Access Special Functions . . . . . . . . . . . . . . . . . . . . . . . . . 18-Description of Special Functions 120 and 124 . . . . . . . . . . . . . . . . 18
Agilent/HP 8665B Frequency Limits . . . . . . . . . . . . . . . . . . . . . . . . . . 18-2Agilent/HP 8665B Mode Keys . . . . . . . . . . . . . . . . . . . . . . . . . . . 18-2How to Access Special Functions . . . . . . . . . . . . . . . . . . . . . . . . . 18-Description of Special Functions 120 and 124 . . . . . . . . . . . . . . . . 18
19. Connect Diagrams
Connect Diagrams You’ll Find in This Chapter . . . . . . . . . . . . . . . . . . . 19E5501A Standard Connect Diagram . . .. . . . . . . . . . . . . . . . . . . . . . . . . 19-2E5501A Opt. 001 Connect Diagram . . .. . . . . . . . . . . . . . . . . . . . . . . . . 19-3E5501A Opt. 201, 430, 440 Connect Diagram . . . . . . . . . . . . . . . . . . . . 1E5501A Opt. 201 Connect Diagram . . .. . . . . . . . . . . . . . . . . . . . . . . . . 19-5E5502A Standard Connect Diagram . . .. . . . . . . . . . . . . . . . . . . . . . . . . 19-6
Agilent Technologies E5500 Phase Noise Measurement System -vii
1-2-2-22
11-2
-22
-3-4
-4-6A-6
-8-9
E5502A Opt. 001 Connect Diagram . .. . . . . . . . . . . . . . . . . . . . . . . . . 19-7E5502A Opt. 201 Connect Diagram . .. . . . . . . . . . . . . . . . . . . . . . . . . 19-8E5503A Standard Connect Diagram . .. . . . . . . . . . . . . . . . . . . . . . . . . 19-9E5503A Opt. 001 Connect Diagram . .. . . . . . . . . . . . . . . . . . . . . . . . 19-10E5503A Opt. 201 Connect Diagram . .. . . . . . . . . . . . . . . . . . . . . . . . 19-11E5504A Standard Connect Diagram . .. . . . . . . . . . . . . . . . . . . . . . . . 19-12E5504A Opt. 001 Connect Diagram . .. . . . . . . . . . . . . . . . . . . . . . . . 19-13E5504A Opt. 201 Connect Diagram . .. . . . . . . . . . . . . . . . . . . . . . . . 19-14E5501B Standard Connect Diagram . .. . . . . . . . . . . . . . . . . . . . . . . . 19-15E5501B Opt. 001 Connect Diagram . .. . . . . . . . . . . . . . . . . . . . . . . . 19-16E5501B Opt. 201 Connect Diagram . .. . . . . . . . . . . . . . . . . . . . . . . . 19-17E5502B Standard Connect Diagram . .. . . . . . . . . . . . . . . . . . . . . . . . 19-18E5502B Opt. 001 Connect Diagram . .. . . . . . . . . . . . . . . . . . . . . . . . 19-19E5502B Opt. 201 Connect Diagram . .. . . . . . . . . . . . . . . . . . . . . . . . 19-20E5503B Standard Connect Diagram . .. . . . . . . . . . . . . . . . . . . . . . . . 19-21E5503B Opt. 001 Connect Diagram . .. . . . . . . . . . . . . . . . . . . . . . . . 19-22E5503B Opt. 201 Connect Diagram . .. . . . . . . . . . . . . . . . . . . . . . . . 19-23E5504B Standard Connect Diagram . .. . . . . . . . . . . . . . . . . . . . . . . . 19-24E5504B Opt. 001 Connect Diagram . .. . . . . . . . . . . . . . . . . . . . . . . . 19-25E5504B Opt. 201 Connect Diagram . .. . . . . . . . . . . . . . . . . . . . . . . . 19-26
20. System Specifications
What You’ll Find in This Chapter… . . . . . . . . . . . . . . . . . . . . . . . . . . . 20-Specifications . . . . . . . . . . . . . . . . . . . . . . . . . . . . . . . . . . . . . . . . . . . . . 20
Reliable Accuracy . . . . . . . . . . . . . . . . . . . . . . . . . . . . . . . . . . . . . . 20Measurement Qualifications . . . . . . . . . . . . . . . . . . . . . . . . . . . . . . 20Tuning . . . . . . . . . . . . . . . . . . . . . . . . . . . . . . . . . . . . . . . . . . . . . . . 20-
21. Phase Noise Customer Support
What You’ll Find in This Chapter . . . . . . . . . . . . . . . . . . . . . . . . . . . . . 21-Software and Documentation Updates . . . . . . . . . . . . . . . . . . . . . . . . . 2Contacting Customer Support . . .. . . . . . . . . . . . . . . . . . . . . . . . . . . . . 21-3
22. Connector Care andPreventive Maintenance
What You’ll Find in This Appendix… . . . . . . . . . . . . . . . . . . . . . . . . . . A-1Using, Inspecting, and Cleaning RF Connectors . . . . . . . . . . . . . . . . . . . A
Repeatability . . . . . . . . . . . . . . . . . . . . . . . . . . . . . . . . . . . . . . . . . . . A-RF Cable and Connector Care . . .. . . . . . . . . . . . . . . . . . . . . . . . . . A-3Proper Connector Torque . . . . . . . . . . . . . . . . . . . . . . . . . . . . . . . . . AConnector Wear and Damage . . . . . . . . . . . . . . . . . . . . . . . . . . . . . . ASMA Connector Precautions .. . . . . . . . . . . . . . . . . . . . . . . . . . . . . . A-4Cleaning Procedure . . . . . . . . . . . . . . . . . . . . . . . . . . . . . . . . . . . . . . A
Removing and Reinstalling Instruments . . . . . . . . . . . . . . . . . . . . . . . . . AGeneral Procedures and Techniques . . . . . . . . . . . . . . . . . . . . . . . . .GPIB Connectors. . . . . . . . . . . . . . . . . . . . . . . . . . . . . . . . . . . . . . . A-8Precision 2.4 mm and 3.5 mm Connectors . . . . . . . . . . . . . . . . . . . . ABent Semirigid Cables . . . . . . . . . . . . . . . . . . . . . . . . . . . . . . . . . . . A
-viii Agilent Technologies E5500 Phase Noise Measurement System
912
Other Multipin Connectors . . . . . . . . . . . . . . . . . . . . . . . . . . . . . . . . A-MMS Module Removal and Reinstallation . . . . . . . . . . . . . . . . . . A-1
Touch-Up Paint . . . . . . . . . . . . . . . . . . . . . . . . . . . . . . . . . . . . . . . . . . . A-1
Agilent Technologies E5500 Phase Noise Measurement System -ix
1 Getting Started with the AgilentTechnologies E5500 Phase NoiseMeasurement System
What You’ll Find in This Chapter…
• Introduction , page 1-2
• Training Guidelines, page 1-3
Agilent Technologies E5500 Phase Noise Measurement System 1-1

Getting Started with the Agilent Technologies E5500 Phase NoiseMeasurement System
tem.
.
noise
Introduction
The table on the right-hand page (Training Guidelines, page 1-3) will helpyou first learn about, then use the E5500 phase noise measurement sysThe following three areas are covered in this manual:
• Leaning about the E5500 phase noise measurement system
• Learning about phase noise basics and measurement fundamentals
• Using the phase noise measurement system to make specific phasemeasurements.
NOTE Installation information for your system is provided in the E5500Installation Guide.
NOTE For application assistance, contact you local Agilent Technologies salesrepresentative.
1-2 Agilent Technologies E5500 Phase Noise Measurement System

Getting Started with the Agilent Technologies E5500 Phase NoiseMeasurement System
Training Guidelines
Table 1-1 Training Guidelines
Learning about the E5500 PhaseNoise System
Learning about Phase NoiseBasics and Measurement
Fundamentals
Using the E5500 to Make SpecificPhase Noise Measurements
Chapter 2, “Welcome to theE5500 Phase Noise MeasurementSystem Series of Solutions”
Chapter 3, “Your First Measurement”
Chapter 4, “Phase Noise Basics”
Chapter 5, “Expanding YourMeasurement Experience”
Chapter 6, “Absolute MeasurementFundamentals”
Chapter 7, “Absolute MeasurementExamples”
Chapter 8, “Residual MeasurementFundamentals”
Chapter 9, “Residual MeasurementExamples”
Chapter 10, “FM DiscriminatorFundamentals”
Chapter 11, “FM DiscriminatorMeasurement Examples”
Chapter 12, “AM Noise MeasurementFundamentals”
Chapter 13, “AM Noise MeasurementExamples”
Chapter 14, “Baseband NoiseMeasurement Examples”
Chapter 15, “Evaluating YourMeasurement Results”
Chapter 16, “Advanced SoftwareFeatures”
Chapter 17, “Error Messages andSystem Troubleshooting”
Chapter 18, “Reference Graphs andTables”
Agilent Technologies E5500 Phase Noise Measurement System 1-3
f
2 Welcome to the Agilent Technologies E5500Phase Noise Measurement System Series oSolutions
What You’ll Find in This Chapter…
• Introducing the Graphical User Interface, page 2-2
• System Requirements, page 2-4
Agilent Technologies E5500 Phase Noise Measurement System 2-1
Welcome to the Agilent Technologies E5500 Phase Noise MeasurementSystem Series of Solutions
ment
s onn.
ntou
rte
eeeds
ith
Introducing the Graphical User Interface
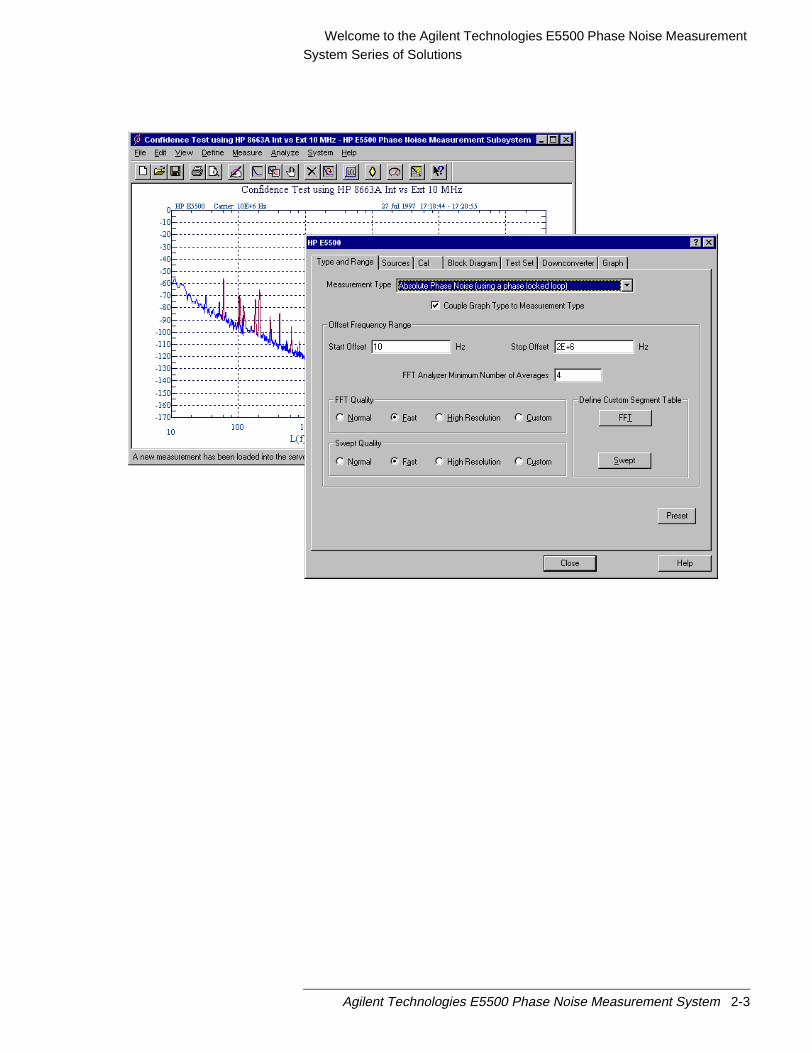
The graphical user interface gives the user instant access to all measurefunctions making it easy to configure a system and define or initiatemeasurements. The most frequently used functions are displayed as icona toolbar, allowing quick and easy access to the measurement informatio
The forms-based graphical interaction helps you define your measuremequickly and easily. Each form tab is labeled with its content, preventing yfrom getting lost in the define process.
Three default segment tables are provided. To obtain a quick look at youdata, select the “fast” quality level. If more frequency resolution to separaspurious signals is important, the ‘normal’ and “high resolution” qualitylevels are available. If you need to customize the offset range beyond thdefaults provided, tailor the measurement segment tables to meet your nand save them as a “custom” selection.
You can place up to nine markers on the data trace, that can be plotted wthe measured data.
Other features include:
• Plotting data without spurs
• Tabular listing of spurs
• Plotting in alternate bandwidths
• Parameter summary
• Color printouts to any supported color printer
2-2 Agilent Technologies E5500 Phase Noise Measurement System
Welcome to the Agilent Technologies E5500 Phase Noise MeasurementSystem Series of Solutions
Agilent Technologies E5500 Phase Noise Measurement System 2-3

Welcome to the Agilent Technologies E5500 Phase Noise MeasurementSystem Series of Solutions
ted
System Requirements
In case you want a quick review of the system requirements, we have listhem here.
The minimum system requirements for the phase noise measurementsoftware are:
• Pentium microprocessor (100 MHz or higher recommended)
• 32 megabytes (MB) of memory (RAM)
• 1 gigabyte (GB) hard disk
• Super Video Graphics Array (SVGA)
• 2 additional 16-bit ISA slots available for the phase noise systemhardware.
1 for PC-Digitizer or VXI/MXI Interface
1 for GPIB Interface Card
• Windows NT 4.0
• Windows NT 4.0 Service Pack 3
• Agilent/HP 82341C GPIB Interface Card
2-4 Agilent Technologies E5500 Phase Noise Measurement System

3 Your First Measurement
What You’ll Find in This Chapter…
• E5500 Operation; A Guided Tour, page 3-3
• Starting the Measurement Software, page 3-4
• Making a Measurement, page 3-5
Agilent Technologies E5500 Phase Noise Measurement System 3-1
Your First MeasurementDesigned to Meet Your Needs
ncesticsd
hisresse
de,
re
ype
y
nt
u
myou
Designed to Meet Your Needs
The Agilent E5500 phase noise measurement system is a high performameasurement tool that enables you to fully evaluate the noise characteriof your electronic instruments and components with unprecedented speeand ease. The phase noise measurement system provides you with theflexibility needed to meet today’s broad range of noise measurementrequirements.
In order to use the phase noise system effectively, it is important that youhave a good understanding of the noise measurement you are making. Tmanual is designed to help you gain that understanding and quickly progfrom a beginning user of the phase noise system to a proficient user of thsystem’s basic measurement capabilities.
NOTE If you have just received your system, or need help with connecting thehardware or loading software, refer to Installation Guide now. Once youhave completed the installation procedures presented in Installation Guireturn to the following page to begin learning how to make noisemeasurements with the system.
As You Begin The “E5500 Operation; A Guided Tour” contains a step-by-step procedufor completing a phase noise measurement. This measurementdemonstration introduces system operating fundamentals for whatever tof device you plan to measure.
Once you are familiar with the information in this chapter, you will be readto startChapter 5, “Expanding Your Measurement Experience”. After youhave completed “Expanding Your Measurement Experience”, you will wato refer toChapter 15, “Evaluating Your Measurement Results”for help inanalyzing and verifying your test results.
As You Progress As you become familiar with the operation of the phase noise system yowill need to refer to this guide less often. There may, however, be timeswhen you encounter problems while running your measurements. Problesolving suggestions have been provided at the back of chapter 3 to helpdeal with conditions that can prevent the system from completing itsmeasurement.
3-2 Agilent Technologies E5500 Phase Noise Measurement System

Your First MeasurementE5500 Operation; A Guided Tour
’sthe
r
e
iserrect
E5500 Operation; A Guided Tour
This measurement demonstration will introduce you to the system’soperation by guiding you through an actual phase noise measurement.
You will be measuring the phase noise of the Agilent/HP 70420A test setinternal noise source. (The measurement made in this demonstration issame measurement that is made to verify the system’s operation.)
As you step through the measurement procedures, you will soon discovethat the phase noise measurement system offers enormous flexibility formeasuring the noise characteristics of your signal sources and two-portdevices.
Required Equipment The equipment shipped with this system is all that is required to completthis demonstration. (Refer to the E5500 Installation Guide if you needinformation about setting up the hardware or installing the software.)
How to Begin Follow the set up procedures beginning on the next page. The phase nomeasurement system will display a setup diagram that shows you the cofront panel cable connections to make for this measurement.
Agilent Technologies E5500 Phase Noise Measurement System 3-3

Your First MeasurementStarting the Measurement Software
ars.
Starting the Measurement Software
1. Place the E5500 phase noise measurement software disk in the discholder and insert in the CD-ROM drive.
2. Click theStart button, point toPrograms, point toAgilentMeasurement Systems, point toE5500 Phase Noise, and then clickMeasurement Client.
3. The following phase noise measurement subsystem dialog box appeYour dialog box may look slightly different.
3-4 Agilent Technologies E5500 Phase Noise Measurement System
Your First MeasurementMaking a Measurement
st
Making a Measurement
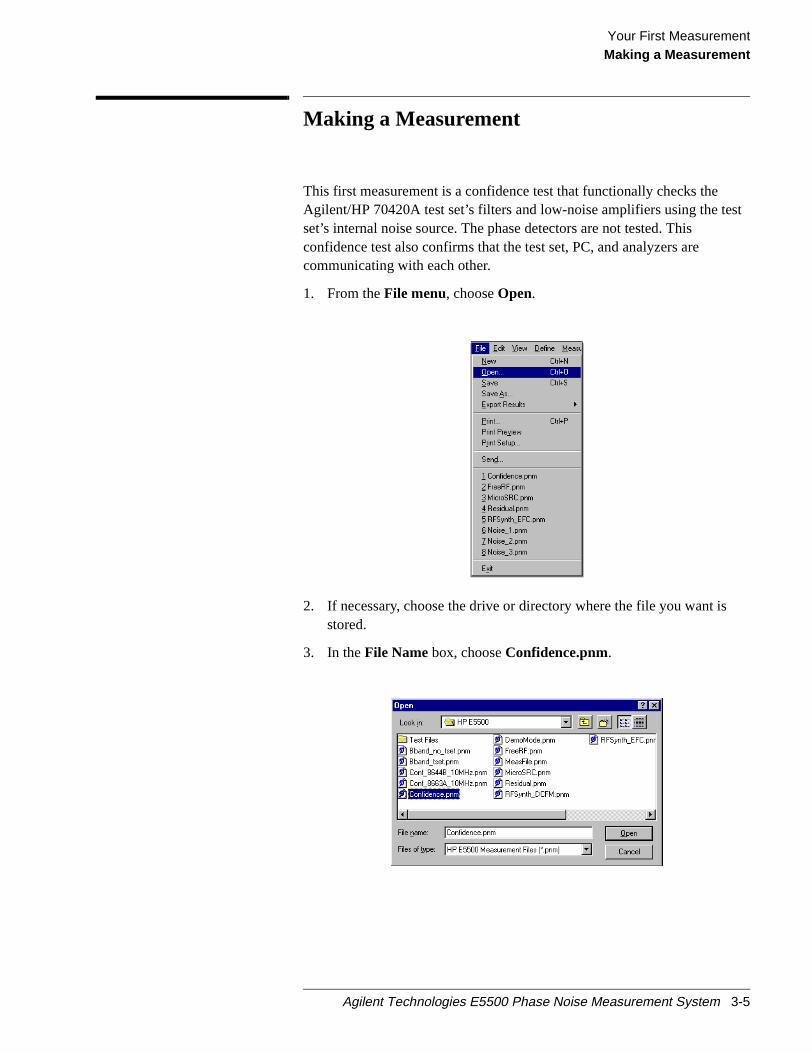
This first measurement is a confidence test that functionally checks theAgilent/HP 70420A test set’s filters and low-noise amplifiers using the teset’s internal noise source. The phase detectors are not tested. Thisconfidence test also confirms that the test set, PC, and analyzers arecommunicating with each other.
1. From theFile menu, chooseOpen.
2. If necessary, choose the drive or directory where the file you want isstored.
3. In theFile Namebox, chooseConfidence.pnm.
Agilent Technologies E5500 Phase Noise Measurement System 3-5
Your First MeasurementMaking a Measurement
ersee
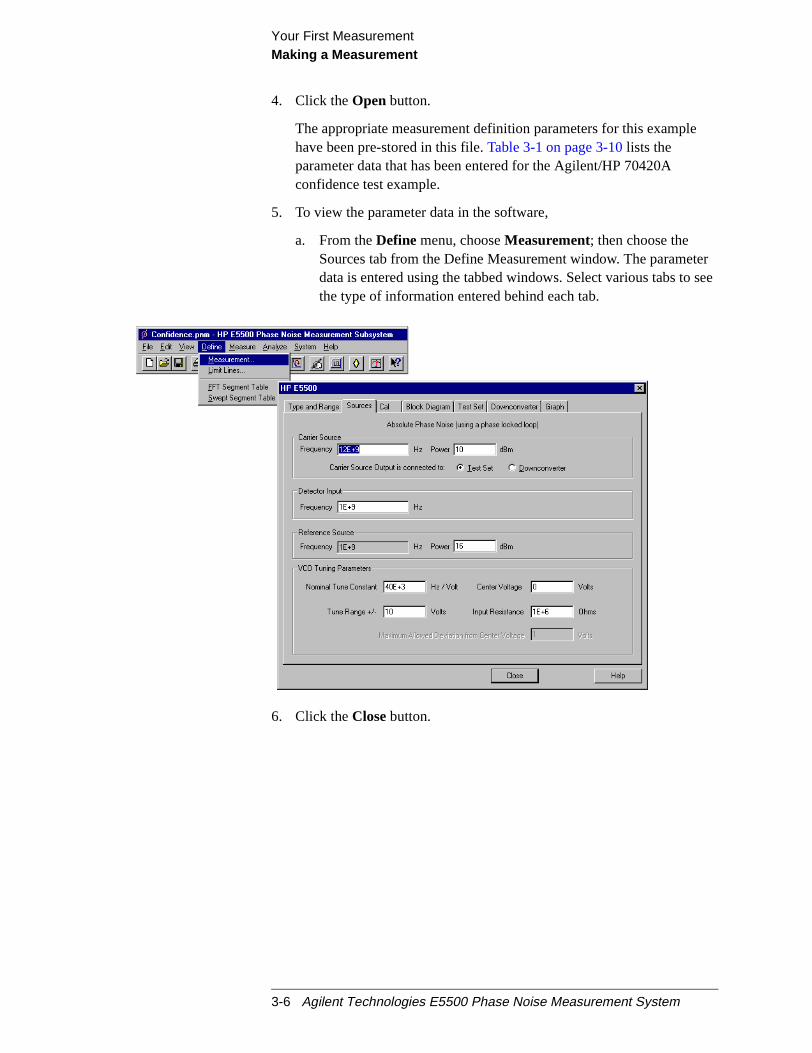
4. Click theOpen button.
The appropriate measurement definition parameters for this examplehave been pre-stored in this file.Table 3-1 on page 3-10lists theparameter data that has been entered for the Agilent/HP 70420Aconfidence test example.
5. To view the parameter data in the software,
a. From theDefine menu, chooseMeasurement; then choose theSources tab from the Define Measurement window. The parametdata is entered using the tabbed windows. Select various tabs tothe type of information entered behind each tab.
6. Click theClosebutton.
3-6 Agilent Technologies E5500 Phase Noise Measurement System

Your First MeasurementMaking a Measurement
t
Beginning theMeasurement
1. From theMeasurementmenu, chooseNew Measurement.
2. When theDo you want to Perform a New Calibration andMeasurementdialog box appears, clickYes.
3. When theConnect Diagramdialog box appears, connect the 50Ωtermination, provided with your system, to the Agilent/HP 70420A tesset’s noise input connector. Refer to“Connect Diagram Example” onpage 3-8for more information about the correct placement of the 50Ωtermination.
Figure 3-1 Setup Diagram Displayed During the Confidence Test.
50 Ωterminationgoes here.
Agilent Technologies E5500 Phase Noise Measurement System 3-7

Your First MeasurementMaking a Measurement
Connect DiagramExample
Making theMeasurement
1. Press theContinue key. Because you selected New Measurement tobegin this measurement, the system starts by running the routinesrequired to calibrate the current measurement setup.
Figure 3-2shows a typical baseband phase noise plot for anAgilent/HP 70420A phase noise test set.
3-8 Agilent Technologies E5500 Phase Noise Measurement System

Your First MeasurementMaking a Measurement
ts
y
with
reoks
e
Figure 3-2 Typical Phase Noise Curve for an Agilent/HP 70420A Confidence Test
Sweep-Segments When the system begins measuring noise, it places the noise graph on idisplay. As you watch the graph, you will see the system plot itsmeasurement results in frequency segments.
The system measures the noise level across its frequency offset range baveraging the noise within smaller frequency segments. This techniqueenables the system to optimize measurement speed while providing youthe measurement resolution needed for most test applications.
Congratulations You have completed a phase noise measurement. You will find that thismeasurement of the Agilent/HP 70420A test set’s internal noise sourceprovides a convenient way to verify that the system hardware and softwaare properly configured for making noise measurements. If your graph lolike that inFigure 3-2, you now have confidence that your system isoperating normally.
To Learn More Now continue with this demonstration by turning toChapter 5, “ExpandingYour Measurement Experience”to learn more about performing phase noismeasurements.
Agilent Technologies E5500 Phase Noise Measurement System 3-9
Your First MeasurementMaking a Measurement
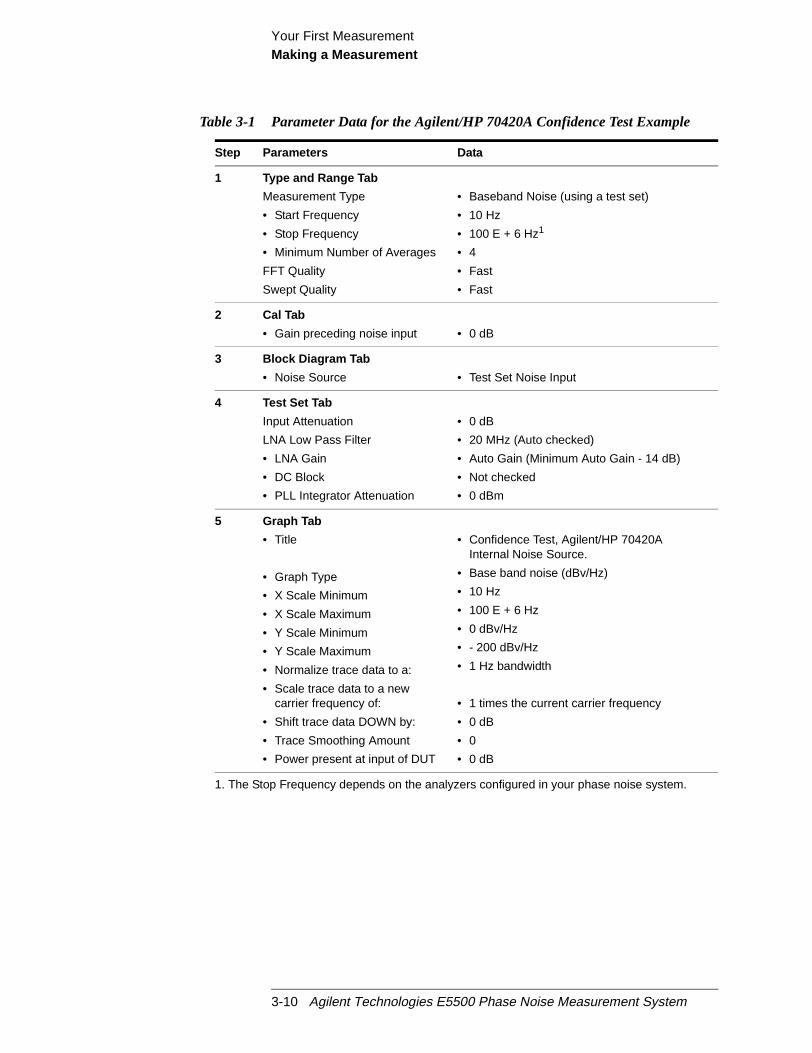
Table 3-1 Parameter Data for the Agilent/HP 70420A Confidence Test Example
Step Parameters Data
1 Type and Range Tab
Measurement Type
• Start Frequency
• Stop Frequency
• Minimum Number of Averages
FFT Quality
Swept Quality
• Baseband Noise (using a test set)
• 10 Hz
• 100 E + 6 Hz1
• 4
• Fast
• Fast
2 Cal Tab
• Gain preceding noise input • 0 dB
3 Block Diagram Tab
• Noise Source • Test Set Noise Input
4 Test Set Tab
Input Attenuation
LNA Low Pass Filter
• LNA Gain
• DC Block
• PLL Integrator Attenuation
• 0 dB
• 20 MHz (Auto checked)
• Auto Gain (Minimum Auto Gain - 14 dB)
• Not checked
• 0 dBm
5 Graph Tab
• Title
• Graph Type
• X Scale Minimum
• X Scale Maximum
• Y Scale Minimum
• Y Scale Maximum
• Normalize trace data to a:
• Scale trace data to a newcarrier frequency of:
• Shift trace data DOWN by:
• Trace Smoothing Amount
• Power present at input of DUT
• Confidence Test, Agilent/HP 70420AInternal Noise Source.
• Base band noise (dBv/Hz)
• 10 Hz
• 100 E + 6 Hz
• 0 dBv/Hz
• - 200 dBv/Hz
• 1 Hz bandwidth
• 1 times the current carrier frequency
• 0 dB
• 0
• 0 dB
1. The Stop Frequency depends on the analyzers configured in your phase noise system.
3-10 Agilent Technologies E5500 Phase Noise Measurement System
4 Phase Noise Basics
What You’ll Find in This Chapter
• What is Phase Noise?, page 4-2
Agilent Technologies E5500 Phase Noise Measurement System 4-1
Phase Noise BasicsWhat is Phase Noise?
e.
gr.
outeals
What is Phase Noise?
Frequency stability can be defined as the degree to which an oscillatingsource produces the same frequency throughout a specified period of timEvery RF and microwave source exhibits some amount of frequencyinstability. This stability can be broken down into two components:
• long-term stability• short-term stability.
Long term stability describes the frequency variations that occur over lontime periods, expressed in parts per million per hour, day, month, or yea
Short term stability contains all elements causing frequency changes abthe nominal frequency of less than a few seconds duration. The chapter dwith short-term stability.
Mathematically, an ideal sinewave can be described by
Where = nominal amplitude,
= linearly growing phase component,
and = nominal frequency
But an actual signal is better modeled by
Where = amplitude fluctuations,
and = randomly fluctuating phase term or phase noise.
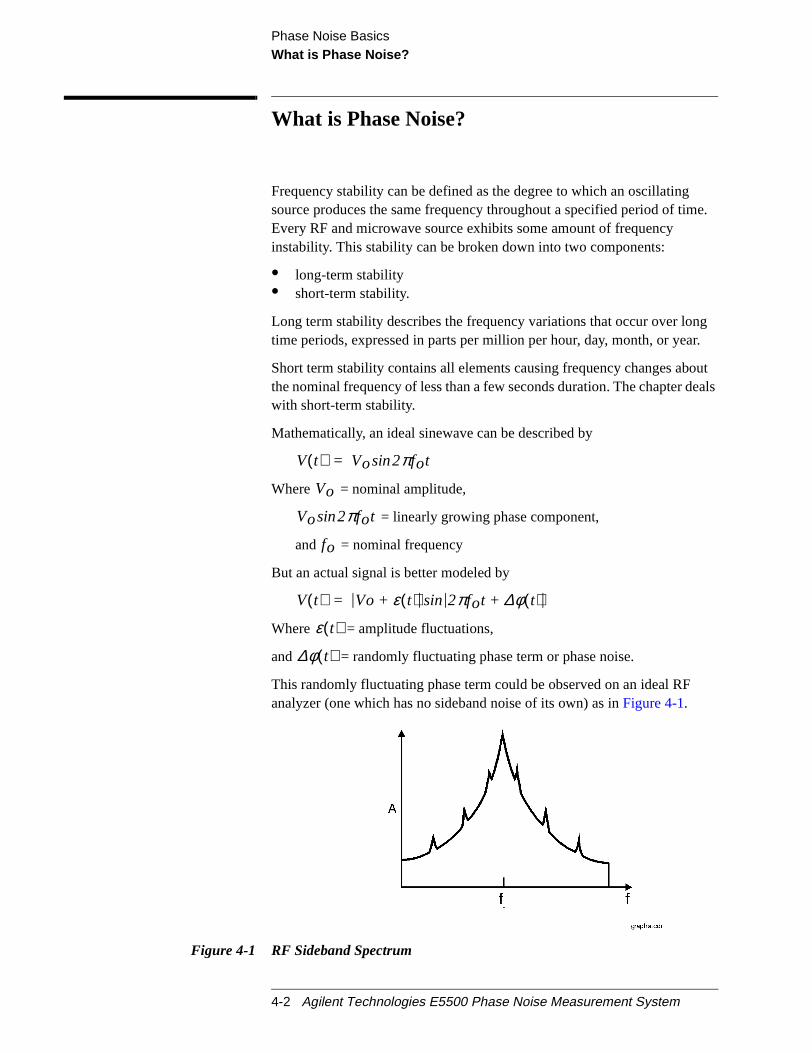
This randomly fluctuating phase term could be observed on an ideal RFanalyzer (one which has no sideband noise of its own) as inFigure 4-1.
Figure 4-1 RF Sideband Spectrum
V t( ) Vo 2πfotsin=
Vo
Vo 2πfotsin
fo
V t( ) Vo ε t( )+ 2πfot ∆φ t( )+sin=
ε t( )
∆φ t( )
4-2 Agilent Technologies E5500 Phase Noise Measurement System
Phase Noise BasicsWhat is Phase Noise?
replot.
lyor
se.
ralsitynits
tedifch
There are two types of fluctuating phase terms. The first, deterministic, adiscrete signals appearing as distinct components in the spectral densityThese signals, commonly called spurious, can be related to knownphenomena in the signal source such as power line frequency, vibrationfrequencies, or mixer products.
The second type of phase instability is random in nature, and is commoncalled phase noise. The sources of random sideband noise in an oscillatinclude thermal noise, shot noise, and flicker noise.
Many terms exist to quantify the characteristic randomness of phase noiEssentially, all methods measure the frequency or phase deviation of thesource under test in the frequency or time domain. Since frequency andphase are related to each other, all of these terms are also related.
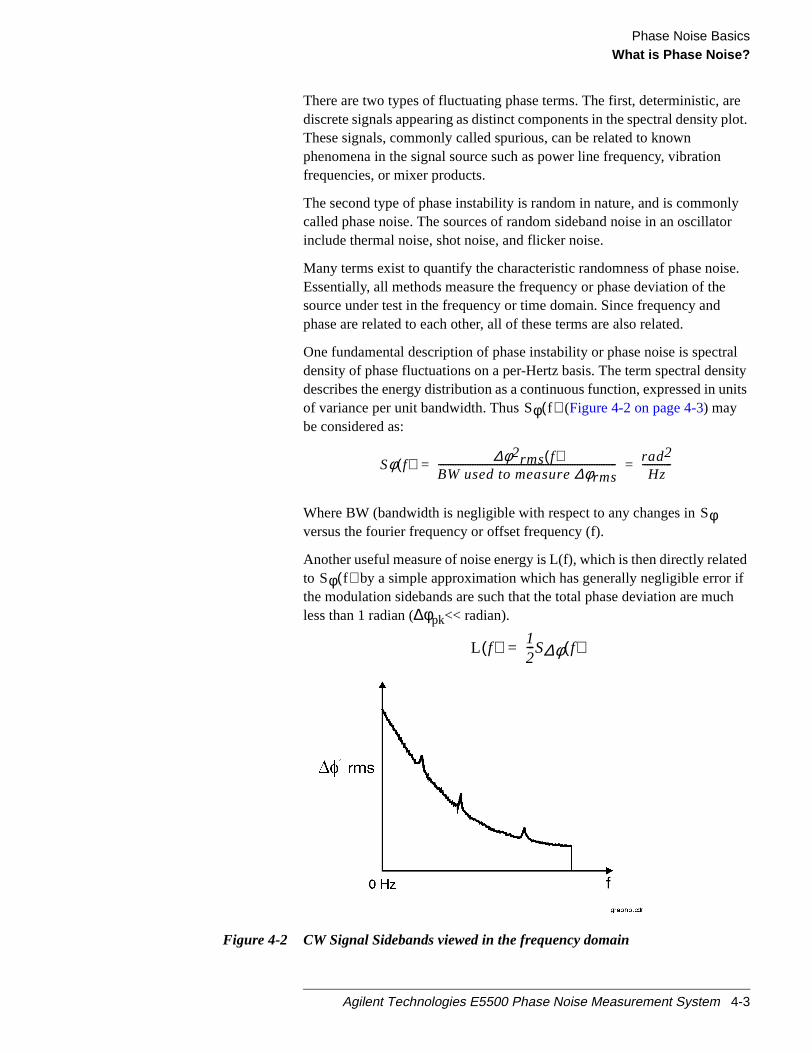
One fundamental description of phase instability or phase noise is spectdensity of phase fluctuations on a per-Hertz basis. The term spectral dendescribes the energy distribution as a continuous function, expressed in uof variance per unit bandwidth. Thus (Figure 4-2 on page 4-3) maybe considered as:
Where BW (bandwidth is negligible with respect to any changes inversus the fourier frequency or offset frequency (f).
Another useful measure of noise energy is L(f), which is then directly relato by a simple approximation which has generally negligible errorthe modulation sidebands are such that the total phase deviation are muless than 1 radian (∆φpk<< radian).
Figure 4-2 CW Signal Sidebands viewed in the frequency domain
Sφ f( )
Sφ f( ) ∆φ2rms f( )BW used to measure∆φrms------------------------------------------------------------------------- rad2
Hz------------= =
Sφ
Sφ f( )
L f( ) 12---S∆φ f( )=
Agilent Technologies E5500 Phase Noise Measurement System 4-3
Phase Noise BasicsWhat is Phase Noise?
o
itytz of
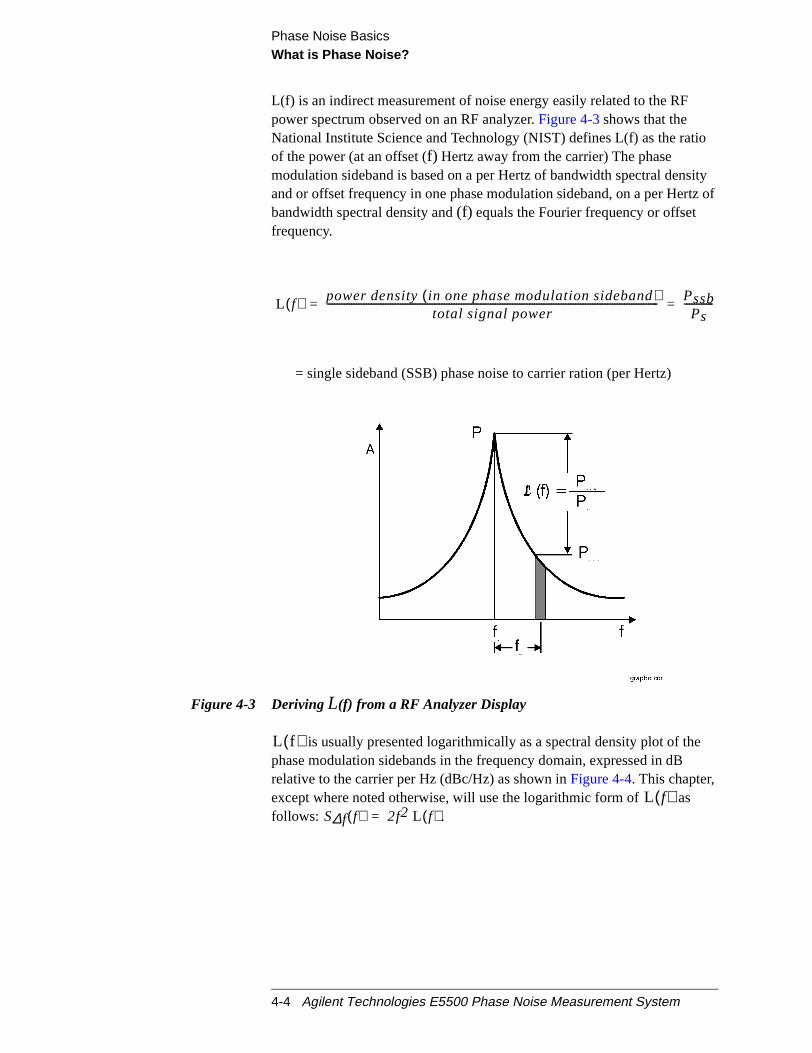
L(f) is an indirect measurement of noise energy easily related to the RFpower spectrum observed on an RF analyzer.Figure 4-3shows that theNational Institute Science and Technology (NIST) defines L(f) as the ratiof the power (at an offset (f) Hertz away from the carrier) The phasemodulation sideband is based on a per Hertz of bandwidth spectral densand or offset frequency in one phase modulation sideband, on a per Herbandwidth spectral density and(f) equals the Fourier frequency or offsetfrequency.
= single sideband (SSB) phase noise to carrier ration (per Hertz)
Figure 4-3 DerivingL(f) from a RF Analyzer Display
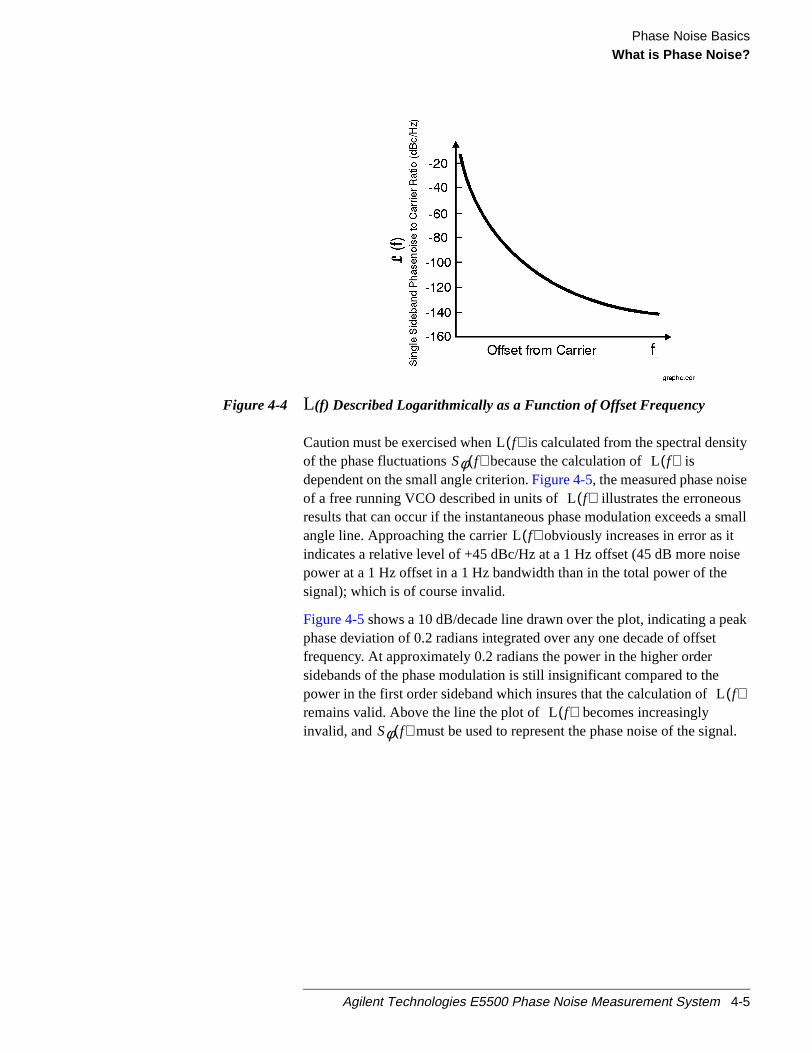
is usually presented logarithmically as a spectral density plot of thephase modulation sidebands in the frequency domain, expressed in dBrelative to the carrier per Hz (dBc/Hz) as shown inFigure 4-4. This chapter,except where noted otherwise, will use the logarithmic form of asfollows: .
L f( ) power density in one phase modulation sideband( )total signal power
---------------------------------------------------------------------------------------------------------------------------------------- PssbPs
------------= =
L f( )
L f( )S∆f f( ) 2f2 L f( )=
4-4 Agilent Technologies E5500 Phase Noise Measurement System
Phase Noise BasicsWhat is Phase Noise?
sity
small
te
ak
al.
Figure 4-4 L(f) Described Logarithmically as a Function of Offset Frequency
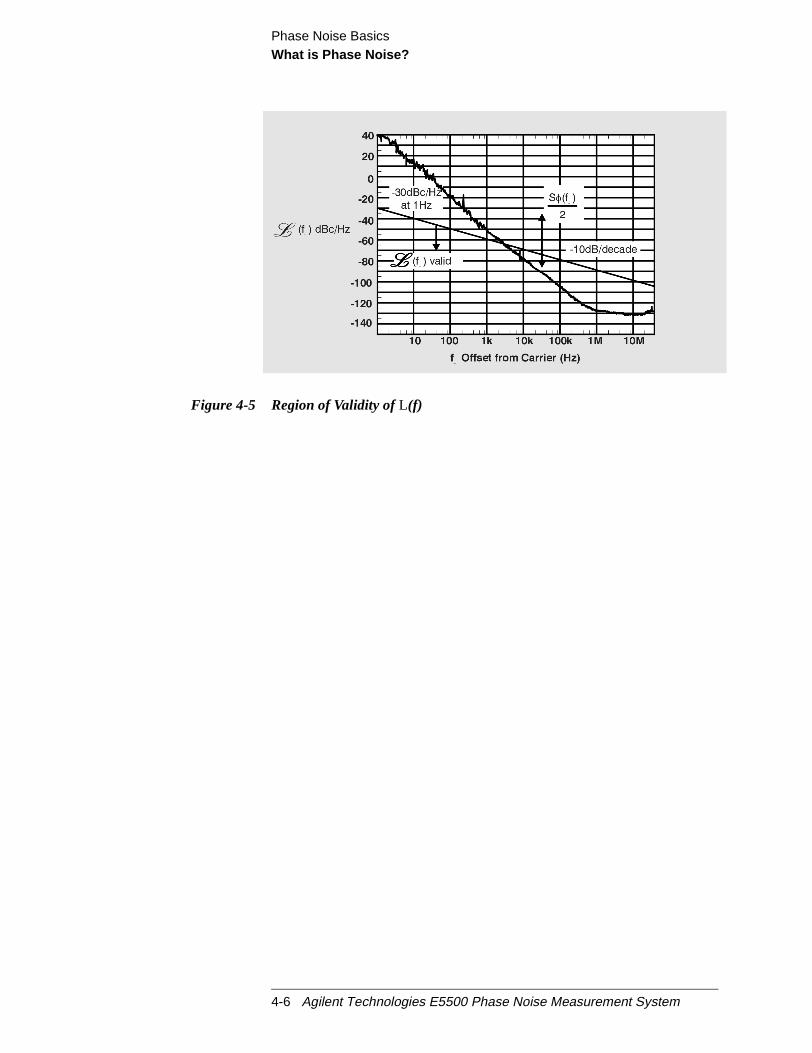
Caution must be exercised when is calculated from the spectral denof the phase fluctuations because the calculation of isdependent on the small angle criterion.Figure 4-5, the measured phase noiseof a free running VCO described in units of illustrates the erroneouresults that can occur if the instantaneous phase modulation exceeds a sangle line. Approaching the carrier obviously increases in error as iindicates a relative level of +45 dBc/Hz at a 1 Hz offset (45 dB more noispower at a 1 Hz offset in a 1 Hz bandwidth than in the total power of thesignal); which is of course invalid.
Figure 4-5shows a 10 dB/decade line drawn over the plot, indicating a pephase deviation of 0.2 radians integrated over any one decade of offsetfrequency. At approximately 0.2 radians the power in the higher ordersidebands of the phase modulation is still insignificant compared to thepower in the first order sideband which insures that the calculation ofremains valid. Above the line the plot of becomes increasinglyinvalid, and must be used to represent the phase noise of the sign
L f( )Sφ f( ) L f( )
L f( )
L f( )
L f( )L f( )
Sφ f( )
Agilent Technologies E5500 Phase Noise Measurement System 4-5
Phase Noise BasicsWhat is Phase Noise?
Figure 4-5 Region of Validity ofL(f)
4-6 Agilent Technologies E5500 Phase Noise Measurement System

5 Expanding Your Measurement Experience
What You’ll Find in This Chapter
• Testing the Agilent/HP 8663A Internal/External 10 MHz, page 5-10(Conf_8663A_10MHz.pnm)
• Testing the Agilent/HP 8644B Internal/External 10 MHz, page 5-33(Conf_8644B_10MHz.pnm)
• Manual Measurement
• Viewing Markers , page 5-56
• Omitting Spurs, page 5-57
• Displaying the Parameter Summary, page 5-59
CAUTION To prevent damage to the Agilent/HP 70420A test set’s hardwarecomponents, the input signalmust notbe applied to the signal inputconnector until the input attenuator has been correctly set for the desiredconfiguration, as show inTable 5-3 on page 5-17. Apply the input signalwhen theconnection diagramappears.
Agilent Technologies E5500 Phase Noise Measurement System 5-1

Expanding Your Measurement ExperienceStarting the Measurement Software
the
Starting the Measurement Software
1. Make sure your computer and monitor are turned on.
2. Place the Agilent E5500 phase noise measurement software disk indisc holder and insert in the CD-ROM drive.
3. Click theStart button, point toPrograms, point toAgilentMeasurement Subsystems, point toE5500 Phase Noise, and then clickMeasurement Client.
5-2 Agilent Technologies E5500 Phase Noise Measurement System

Expanding Your Measurement ExperienceUsing the Asset Manager to Add a Source
ese
Using the Asset Manager to Add a Source
The following procedure will configure both the Agilent/HP 70420A phasnoise test set and PC-digitizer so they can be used with the E5500A phanoise measurement software to make measurements.
NOTE If you have ordered a preconfigured phase noise system from AgilentTechnologies, skip this step and proceed to“Testing the Agilent/HP 8663AInternal/External 10 MHz” on page 5-10.
4. Click theSystemmenu, then clickAsset Manager.
Agilent Technologies E5500 Phase Noise Measurement System 5-3

Expanding Your Measurement ExperienceUsing the Asset Manager to Add a Source
in
Configuring a Source
For this example we will use invoke the Asset Manager Wizard from withthe Asset Manager. This is the most common way to add assets.
5. Click Asset,and then clickAdd.
6. From theAsset Typepull-down list, selectSource,then click theNextbutton.
5-4 Agilent Technologies E5500 Phase Noise Measurement System

Expanding Your Measurement ExperienceUsing the Asset Manager to Add a Source
7. Click on the source to be added (for example, the Agilent/HP 8663sources), then click theNext button.
8. From theInterface pull-down list, selectGPIB0.
9. In theAddressbox, type19.19 is the default address for theAgilent/HP 8663A sources, including the Agilent/HP 8662A, 8663A,and 8644B.
10. In theLibrary pull-down list, select theHewlett-Packard VISA.
11. Click theNext button.
12. In theModel Number box,Agilent/HP 8663A (Agilent/HP-8663 willappear as the default).
Agilent Technologies E5500 Phase Noise Measurement System 5-5
Expanding Your Measurement ExperienceUsing the Asset Manager to Add a Source
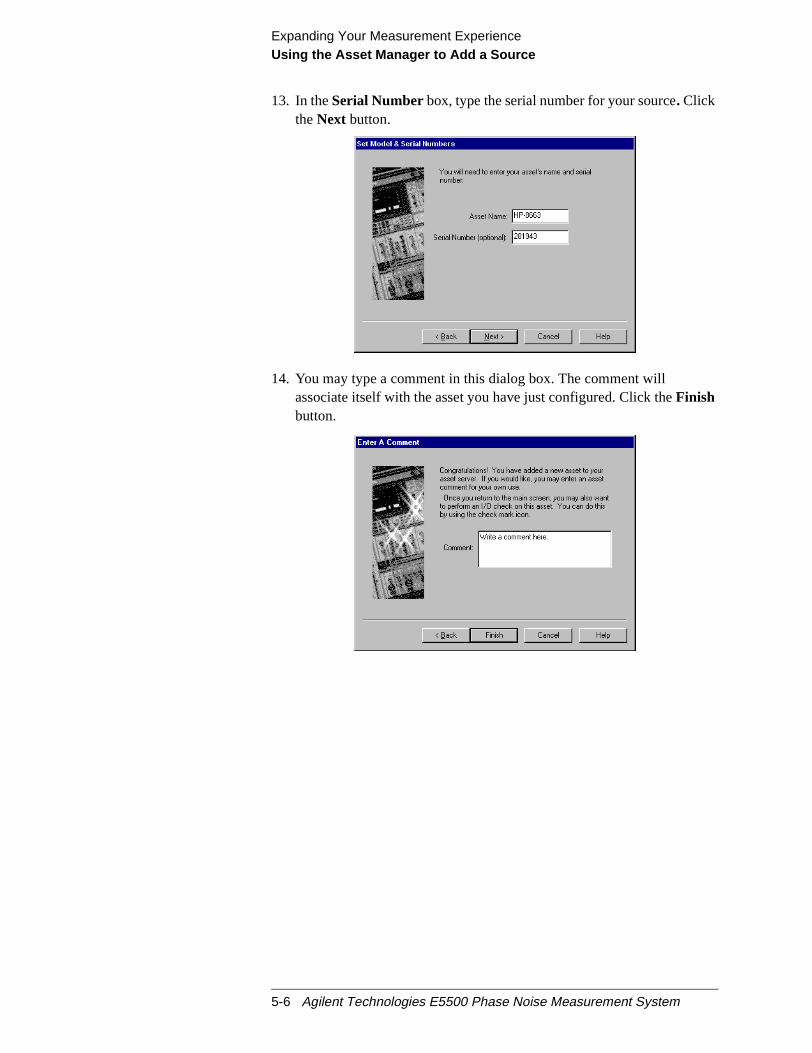
13. In theSerial Number box, type the serial number for your source. ClicktheNext button.
14. You may type a comment in this dialog box. The comment willassociate itself with the asset you have just configured. Click theFinishbutton.
5-6 Agilent Technologies E5500 Phase Noise Measurement System
Expanding Your Measurement ExperienceUsing the Asset Manager to Add a Source
llhase
an
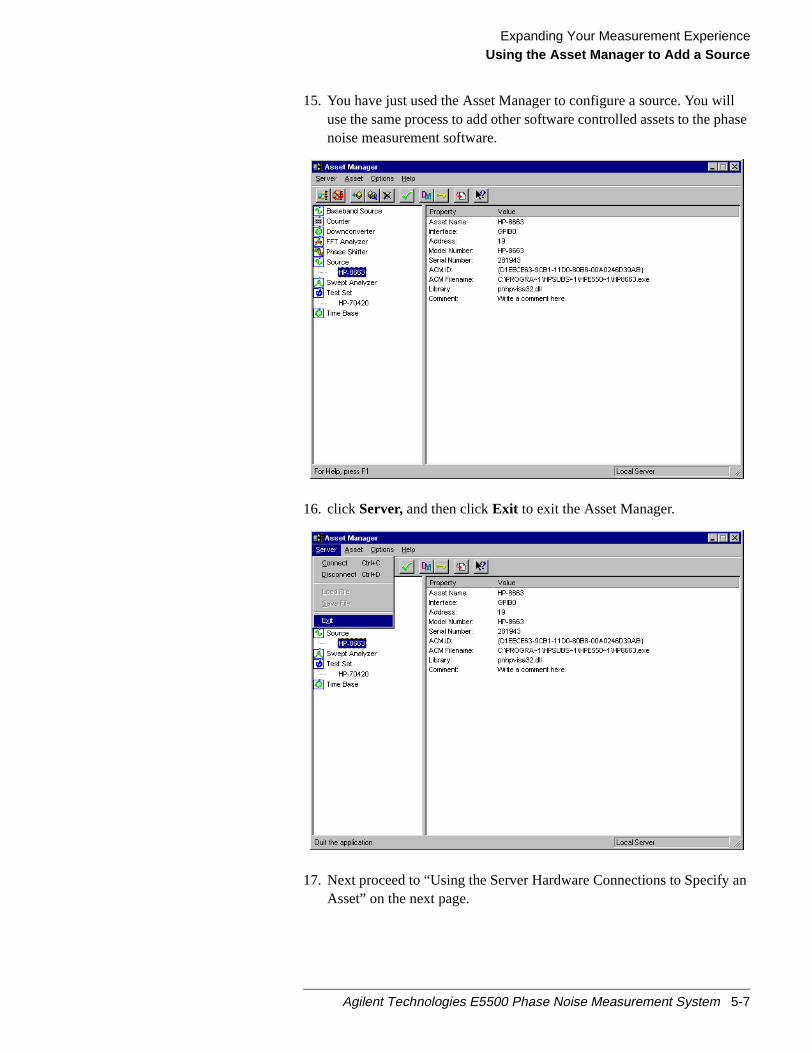
15. You have just used the Asset Manager to configure a source. You wiuse the same process to add other software controlled assets to the pnoise measurement software.
16. clickServer,and then clickExit to exit the Asset Manager.
17. Next proceed to “Using the Server Hardware Connections to SpecifyAsset” on the next page.
Agilent Technologies E5500 Phase Noise Measurement System 5-7

Expanding Your Measurement ExperienceUsing the Server Hardware Connections to Specify the Source
ed
Using the Server Hardware Connections toSpecify the Source
1. From theSystemmenu, chooseServer Hardware Connections.
2. From theTest Setpull-down list, selectAgilent/HP 8663.
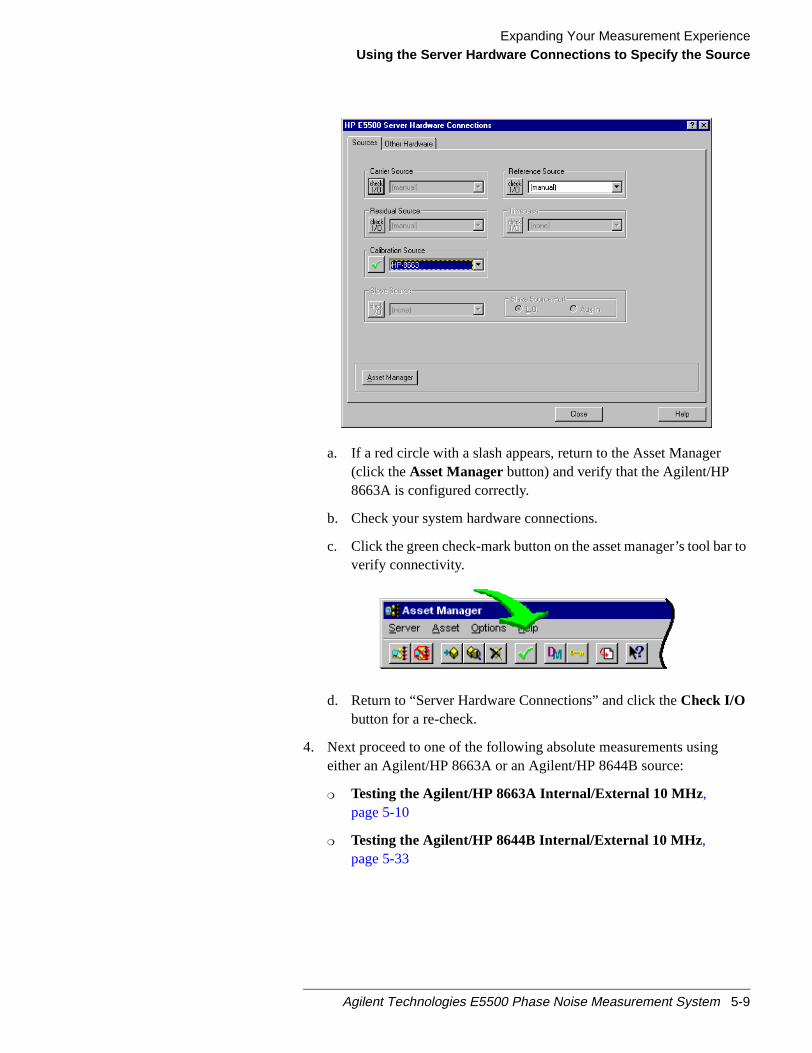
3. A green check-mark will appear after the I/O check has been performby the software. If a green check-mark does not appear, click theCheckI/O button.
5-8 Agilent Technologies E5500 Phase Noise Measurement System
Expanding Your Measurement ExperienceUsing the Server Hardware Connections to Specify the Source
r to
a. If a red circle with a slash appears, return to the Asset Manager(click theAsset Managerbutton) and verify that the Agilent/HP8663A is configured correctly.
b. Check your system hardware connections.
c. Click the green check-mark button on the asset manager’s tool baverify connectivity.
d. Return to “Server Hardware Connections” and click theCheck I/Obutton for a re-check.
4. Next proceed to one of the following absolute measurements usingeither an Agilent/HP 8663A or an Agilent/HP 8644B source:
Testing the Agilent/HP 8663A Internal/External 10 MHz,page 5-10
Testing the Agilent/HP 8644B Internal/External 10 MHz,page 5-33
Agilent Technologies E5500 Phase Noise Measurement System 5-9

Expanding Your Measurement ExperienceTesting the Agilent/HP 8663A Internal/External 10 MHz
oise
e
Testing the Agilent/HP 8663A Internal/External10 MHz
This measurement example will help you measure the absolute phase nof an RF synthesizer.
CAUTION To prevent damage to the Agilent/HP 70420A test set’s hardwarecomponents, the input signalmust notbe applied to the signal inputconnector until the input attenuator has been correctly set for the desiredconfiguration, as show inTable 5-3 on page 5-17. Apply the input signalwhen the Connection Diagram appears.
The following equipment is required for this example in addition to thephase noise test system and your unit-under-test (UUT).
NOTE To ensure accurate measurements, you should allow the UUT andmeasurement equipment to warm up at least one hour before making thnoise measurement.
Table 5-1 Required Equipment for theAgilent/HP 8663A 10 MHzMeasurement
Equipment Quantity Comments
Agilent/HP 8663A 1 Refer to the “Selecting aReference” section of this chapterfor more information aboutreference source requirements
Coax Cables And adequate adapters to connectthe UUT and reference source tothe test set.
5-10 Agilent Technologies E5500 Phase Noise Measurement System

Expanding Your Measurement ExperienceTesting the Agilent/HP 8663A Internal/External 10 MHz
.)
es,
Defining theMeasurement
1. From theFile menu, chooseOpen.
2. If necessary, choose the drive or directory where the file you want isstored.
3. In theFile Namebox, choose “Conf_8663A_10MHz.pnm”.
4. Click theOpen button.
The appropriate measurement definition parameters for this examplehave been pre-stored in this file.Table 5-4, “Parameter Data for theAgilent/HP 8663A 10 MHz Measurement,” on page 5-31lists theparameter data that has been entered for this measurement example
NOTE Note that the source parameters entered for step 2 inTable 5-4may not beappropriate for the reference source you are using. To change these valurefer toTable 5-2 on page 5-12, then continue with step “a”. Otherwise, goto “Beginning the Measurement” on page 5-16:
Agilent Technologies E5500 Phase Noise Measurement System 5-11

Expanding Your Measurement ExperienceTesting the Agilent/HP 8663A Internal/External 10 MHz
a. From theDefine menu, chooseMeasurement;then choose theSourcestab from theDefine Measurementwindow.
b. Enter the carrier (center) frequency of your UUT (5 MHz to 1.6GHz). Enter the same frequency for the detector input frequency.
c. Enter the VCO (Nominal) Tuning Constant (seeTable 5-2).
d. Enter the Tune Range of VCO (seeTable 5-2).
e. Enter the Center Voltage of VCO (seeTable 5-2).
f. Enter the Input Resistance of VCO (seeTable 5-2).
Table 5-2 Tuning Characteristics for Various Sources
VCO SourceCarrierFreq.
Tuning Constant(Hz/V)
CenterVoltage
(V)
Voltage TuningRange (± V)
InputResistance
(Ω)
TuningCalibration
Method
Agilent/HP 8662/3AEFCDCFM
υ0 5 E – 9 xυ0FM Deviation
00
1010
1E + 61 K (8662)600 (8663)
MeasureComputeCompute
Agilent/HP 8642A/B FM Deviation 0 10 600 Compute
5-12 Agilent Technologies E5500 Phase Noise Measurement System
Expanding Your Measurement ExperienceTesting the Agilent/HP 8663A Internal/External 10 MHz
Selecting a ReferenceSource
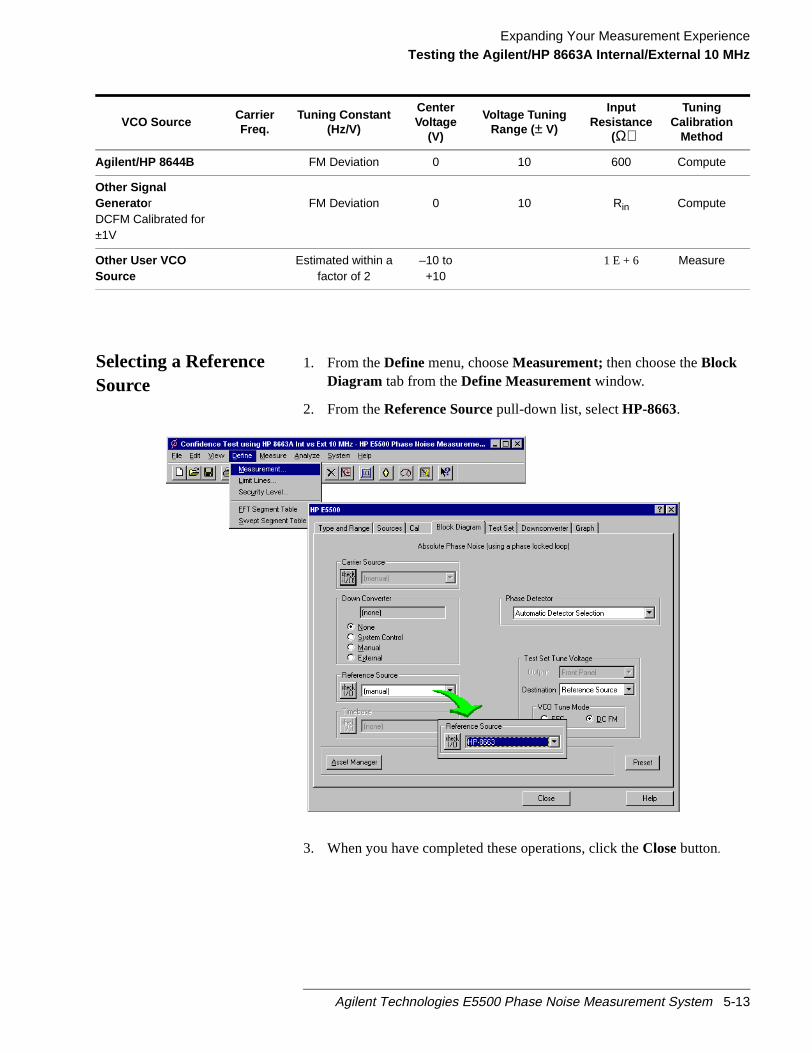
1. From theDefine menu, chooseMeasurement;then choose theBlockDiagram tab from theDefine Measurementwindow.
2. From theReference Sourcepull-down list, selectHP-8663.
3. When you have completed these operations, click theClosebutton.
Agilent/HP 8644B FM Deviation 0 10 600 Compute
Other SignalGenerato rDCFM Calibrated for±1V
FM Deviation 0 10 Rin Compute
Other User VCOSource
Estimated within afactor of 2
–10 to+10
1 E + 6 Measure
VCO SourceCarrierFreq.
Tuning Constant(Hz/V)
CenterVoltage
(V)
Voltage TuningRange (± V)
InputResistance
(Ω)
TuningCalibration
Method
Agilent Technologies E5500 Phase Noise Measurement System 5-13

Expanding Your Measurement ExperienceTesting the Agilent/HP 8663A Internal/External 10 MHz
or
Selecting LoopSuppressionVerification
1. From theDefine menu, chooseMeasurement;then choose theCal tabfrom theDefine Measurementwindow.
2. In theCal dialog box, checkVerify calculated phase locked loopsupressionandAlways Show Suppression Graph. SelectIf limit isexceeded: Show Loop Suppression Graph.
3. When you have completed these operations, click theClosebutton.
Setup Considerationsfor theAgilent/HP 8663A10 MHz Measurement
Measurement Noise Floor
The signal amplitude at the R input (Signal Input) port on theAgilent/HP 70420A sets the measurement noise floor level. Use thefollowing graph to determine the amplitude required to provide a noise flolevel that is below the expected noise floor of your UUT. For moreinformation about this graph, refer toChapter 18, “Reference Graphs andTables”.
5-14 Agilent Technologies E5500 Phase Noise Measurement System

Expanding Your Measurement ExperienceTesting the Agilent/HP 8663A Internal/External 10 MHz
Figure 5-1 Noise Floor for the Agilent/HP 8663 10 MHz Measurement
Figure 5-2 Noise Floor Example
Agilent Technologies E5500 Phase Noise Measurement System 5-15

Expanding Your Measurement ExperienceTesting the Agilent/HP 8663A Internal/External 10 MHz
tefier
ise
ren
utd
If the output amplitude of your UUT is not sufficient to provide an adequameasurement noise floor, it will be necessary to insert a low-noise amplibetween the UUT and the test set. Refer to “Inserting an Device” inChapter 6, “Absolute Measurement Fundamentals”for details ondetermining the effect the amplifiers noise will have on the measured nofloor.
Beginning theMeasurement
CAUTION To prevent damage to the Agilent/HP 70420A test set’s hardwarecomponents, the input signalmust notbe applied to the signal inputconnector until the input attenuator has been correctly set for the desiredconfiguration, as show inTable 5-3 on page 5-17. Apply the input signalswhen the connection diagram appears, as shown below in step 3.
1. From theMeasurementmenu, chooseNew Measurement.
2. appears, clickOK .
3. When the Connect Diagram dialog box appears, click on the hardwadown arrow and select your hardware configuration from the pull-dowlist.
Confirm your connections as shown in the Connect Diagram. At thistime connect your UUT and reference sources to the test set. The inpattenuator (Option 001 only) has now been correctly configured baseon your measurement definition.
5-16 Agilent Technologies E5500 Phase Noise Measurement System
Expanding Your Measurement ExperienceTesting the Agilent/HP 8663A Internal/External 10 MHz
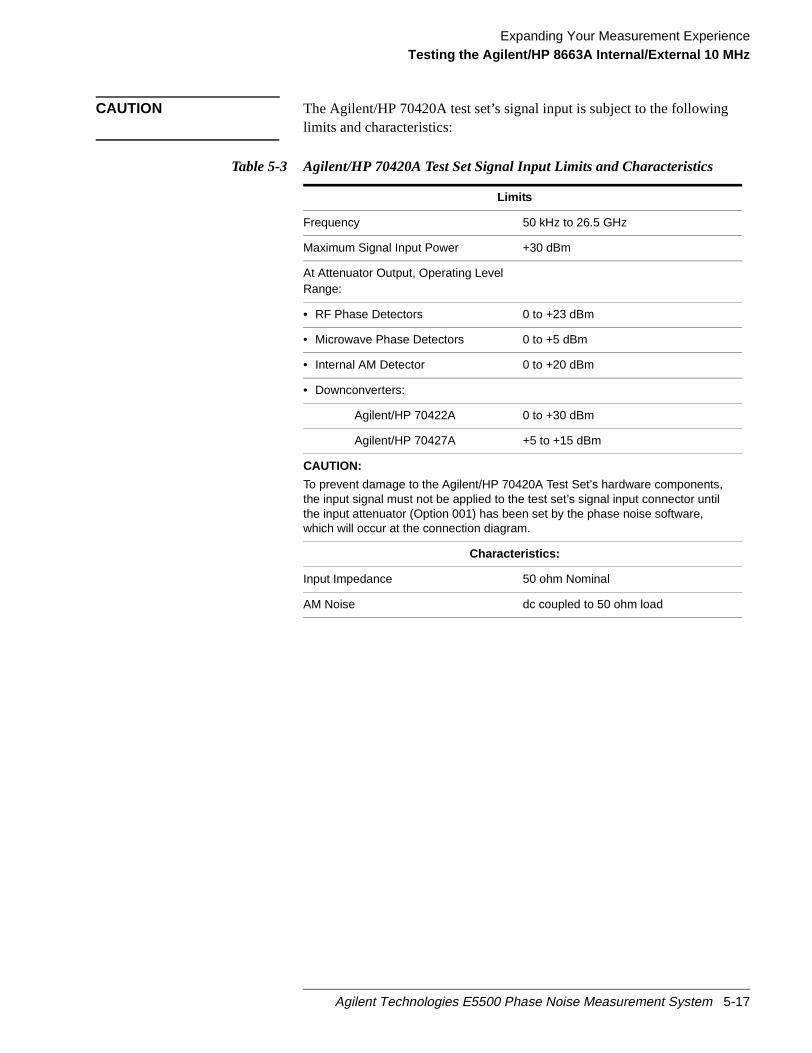
CAUTION The Agilent/HP 70420A test set’s signal input is subject to the followinglimits and characteristics:
Table 5-3 Agilent/HP 70420A Test Set Signal Input Limits and Characteristics
Limits
Frequency 50 kHz to 26.5 GHz
Maximum Signal Input Power +30 dBm
At Attenuator Output, Operating LevelRange:
• RF Phase Detectors 0 to +23 dBm
• Microwave Phase Detectors 0 to +5 dBm
• Internal AM Detector 0 to +20 dBm
• Downconverters:
Agilent/HP 70422A 0 to +30 dBm
Agilent/HP 70427A +5 to +15 dBm
CAUTION:
To prevent damage to the Agilent/HP 70420A Test Set’s hardware components,the input signal must not be applied to the test set’s signal input connector untilthe input attenuator (Option 001) has been set by the phase noise software,which will occur at the connection diagram.
Characteristics:
Input Impedance 50 ohm Nominal
AM Noise dc coupled to 50 ohm load
Agilent Technologies E5500 Phase Noise Measurement System 5-17

Expanding Your Measurement ExperienceTesting the Agilent/HP 8663A Internal/External 10 MHz
Figure 5-3 Connect Diagram for the Agilent/HP 8663A 10 MHz Measurement
4. Refer to the following system connect diagram examples for moreinformation about system interconnections :
“E5501A Standard Connect Diagram Example” on page 5-19
“E5501B Standard Connect Diagram Example” on page 5-20
“E5502A Opt. 001 Connect Diagram Example” on page 5-21
“E5502A Opt. 001 Connect Diagram Example” on page 5-21
“E5503A Option 001 Connect Diagram Example” on page 5-23
“E5503B Option 001 Connect Diagram Example” on page 5-24
“E5504A Option 201 Connect Diagram Example” on page 5-25
“E5504A Option 201 Connect Diagram Example” on page 5-25
NOTE For additional examples, refer toChapter 19, “Connect Diagrams”
5-18 Agilent Technologies E5500 Phase Noise Measurement System

Expanding Your Measurement ExperienceTesting the Agilent/HP 8663A Internal/External 10 MHz
E5501A Standard Connect Diagram Example
Agilent Technologies E5500 Phase Noise Measurement System 5-19

Expanding Your Measurement ExperienceTesting the Agilent/HP 8663A Internal/External 10 MHz
E5501B Standard Connect Diagram Example
5-20 Agilent Technologies E5500 Phase Noise Measurement System

Expanding Your Measurement ExperienceTesting the Agilent/HP 8663A Internal/External 10 MHz
E5502A Opt. 001 Connect Diagram Example
Agilent Technologies E5500 Phase Noise Measurement System 5-21
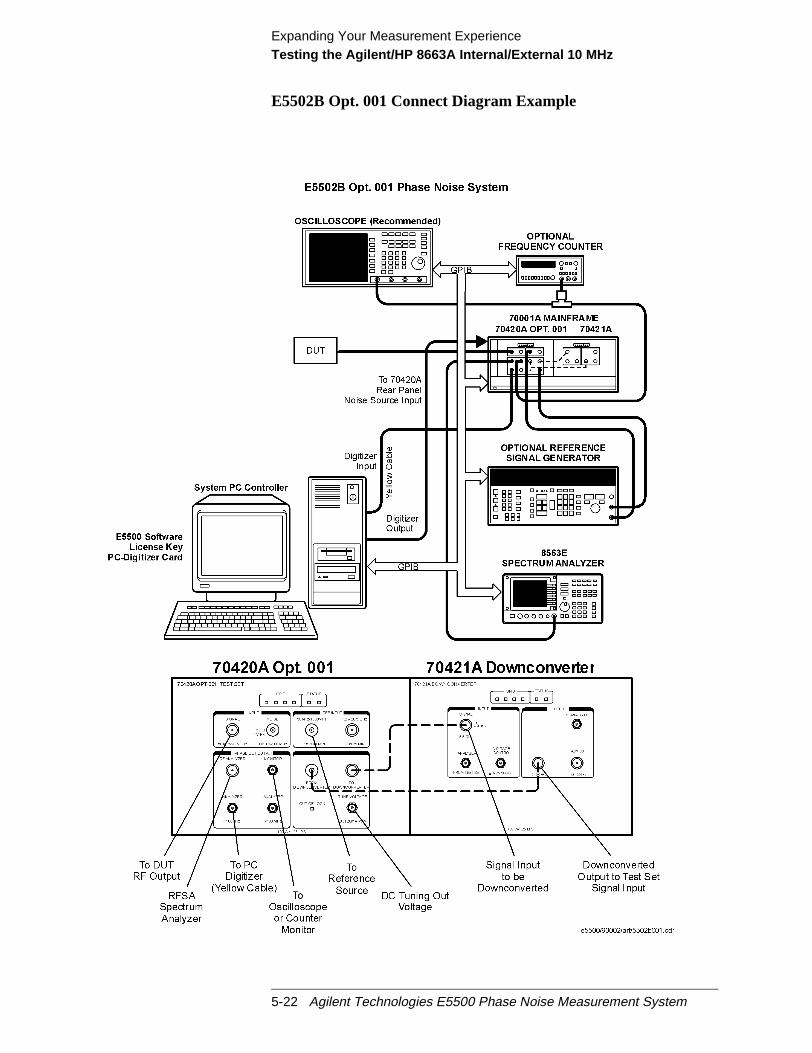
Expanding Your Measurement ExperienceTesting the Agilent/HP 8663A Internal/External 10 MHz
E5502B Opt. 001 Connect Diagram Example
5-22 Agilent Technologies E5500 Phase Noise Measurement System

Expanding Your Measurement ExperienceTesting the Agilent/HP 8663A Internal/External 10 MHz
E5503A Option 001 Connect Diagram Example
Agilent Technologies E5500 Phase Noise Measurement System 5-23

Expanding Your Measurement ExperienceTesting the Agilent/HP 8663A Internal/External 10 MHz
E5503B Option 001 Connect Diagram Example
5-24 Agilent Technologies E5500 Phase Noise Measurement System
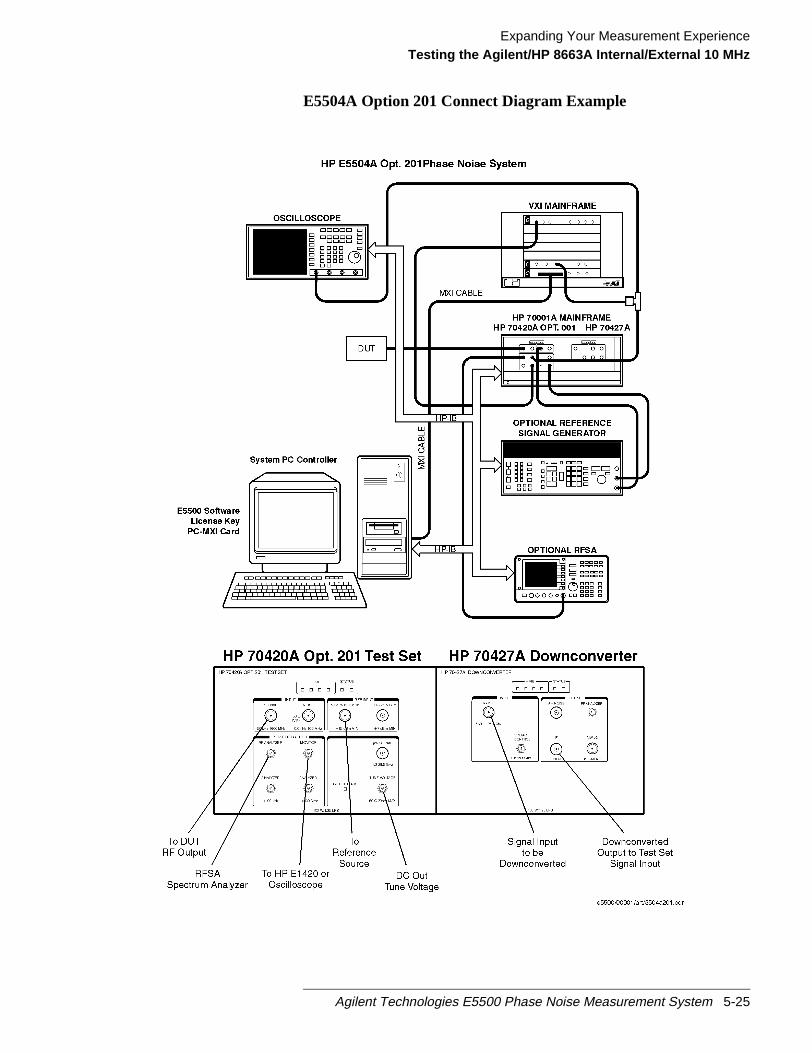
Expanding Your Measurement ExperienceTesting the Agilent/HP 8663A Internal/External 10 MHz
E5504A Option 201 Connect Diagram Example
Agilent Technologies E5500 Phase Noise Measurement System 5-25
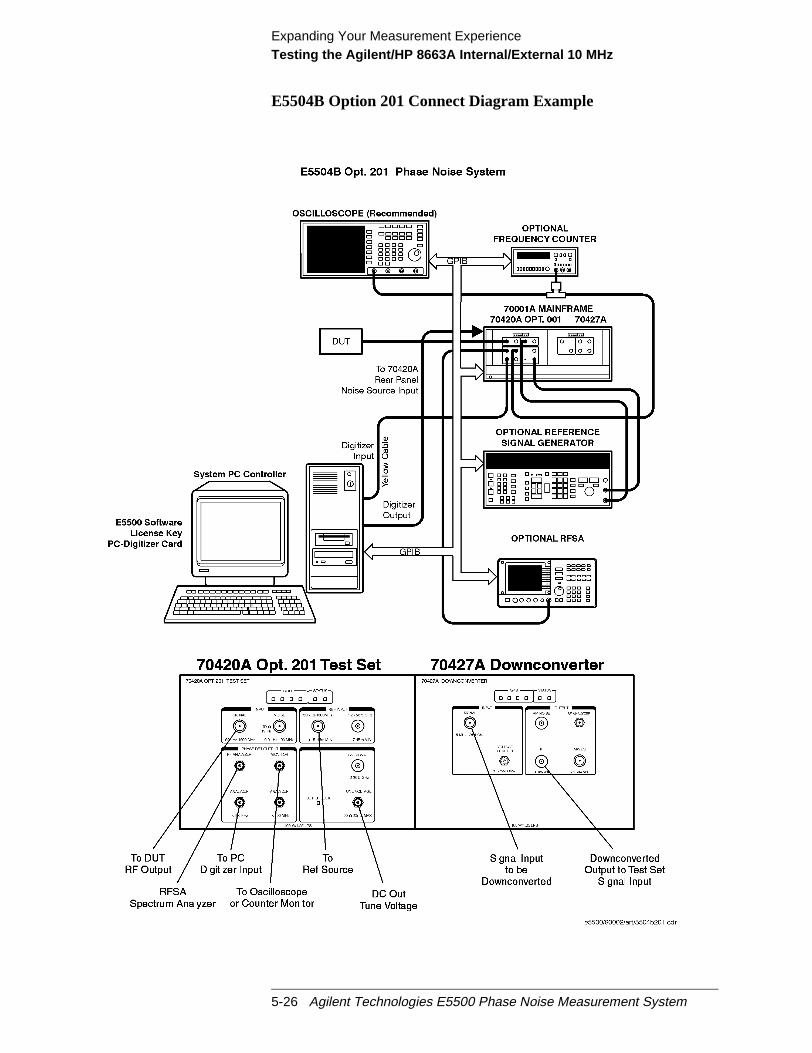
Expanding Your Measurement ExperienceTesting the Agilent/HP 8663A Internal/External 10 MHz
E5504B Option 201 Connect Diagram Example
5-26 Agilent Technologies E5500 Phase Noise Measurement System

Expanding Your Measurement ExperienceTesting the Agilent/HP 8663A Internal/External 10 MHz
.)
itwillge
theion.
owces
se
5. The following messages will appear on the display as the systemperforms the calibration routines. (You will have time to read throughthese message descriptions while the system completes the routines
Determining Presence of Beat Note...
An initial check is made to verify that a beatnote is present within thesystem’s detection range.
Verifying zero-beat...
The frequency of the beatnote is measured to see if it is within 5% of theestimated Peak Tuning Range of the system. The system’s Peak TuningRange is the portion of the voltage-controlled-oscillator (VCO) source’stuning range being used for the measurement.
When the system measures the phase noise of a signal source using thePhase Lock Loop technique (the technique being used in this example)requires that one of the two sources used in the setup is a VCO. As yousee later in this demonstration, you will be required to estimate the tuninrange of the VCO source you are using when you set up your own PhasLock Loop measurements.
Zero beating sources...
The center frequencies of the sources are now adjusted, if necessary, toposition the beatnote within the 5% range. The adjustment is made withtune voltage applied to the VCO source set at its nominal or center posit
Measuring the VCO Tuning Constant...
The tuning sensitivity (Hz/V) of the VCO source is now preciselydetermined by measuring the beatnote frequency at four tune voltagesettings across the tuning range of the VCO source. Linearity across thetuning range is also verified
Measuring the Phase Detector Constant...
The transfer characteristics (V/rad) of the test set’s phase detector are ndetermined for the specific center frequency and power level of the sourbeing measured.
Measuring PLL suppression...
The required correction data is created to compensate for the phase noisuppression which occurs within the bandwidth of the phase lock loopcreated for this measurement.
6. The computer displays the PLL suppression curve and associatedmeasurement values. PressContinue using Adjusted Loop
Agilent Technologies E5500 Phase Noise Measurement System 5-27

Expanding Your Measurement ExperienceTesting the Agilent/HP 8663A Internal/External 10 MHz
ts
y
with
you
nr ace
in
e ofbe
the
its
en
cyuntil
ch
Suppressionto continue making the noise measurement. Themeasurement can be stopped by pressing theAbort key.
Sweep-Segments When the system begins measuring noise, it places the noise graph on idisplay. As you watch the graph, you will see the system plot itsmeasurement results in frequency segments.
The system measures the noise level across its frequency offset range baveraging the noise within smaller frequency segments. This techniqueenables the system to optimize measurement speed while providing youthe measurement resolution needed for most test applications.
When the measurement is complete, refer toChapter 15, “Evaluating YourMeasurement Results”for help in evaluating your measurement results. (Ifthe test system has problems completing the measurement, it will informby placing a message on the computer display.
Checking the Beatnote While the Connect Diagram is still displayed, recommend that you use aoscilloscope (connected to the Monitor port on the Agilent/HP 70420A) ocounter to check the beatnote being created between the reference sourand your device-under-test. The objective of checking the beatnote is toensure that the center frequencies of the two sources are close enoughfrequency to create a beatnote that is within the Capture Range of thesystem.
The phase lock loop (PLL) Capture Range is 5% of the peak tuning rangthe VCO source you are using. (The peak tuning range for your VCO canestimated by multiplying the VCO tuning constant by the tune range ofVCO. Refer toChapter 15, “Evaluating Your Measurement Results”if youare not familiar with the relationship between the PLL capture range andpeak tuning range of the VCO.)
NOTE If the center frequencies of the sources are not close enough to create abeatnote within the capture range, the system will not be able to completemeasurement.
The beatnote frequency is set by the relative frequency difference betwethe two sources. If you have two very accurate sources set at the samefrequency, the resulting beatnote will be very close to 0 Hz.
Searching for the beatnote will require that you adjust the center frequenof one of the sources above and below the frequency of the other sourcethe beatnote appears on the oscilloscope’s display.
If incrementing the frequency of one of the sources does not produce abeatnote, you will need to verify the presence of an output signal from easource before proceeding.
5-28 Agilent Technologies E5500 Phase Noise Measurement System

Expanding Your Measurement ExperienceTesting the Agilent/HP 8663A Internal/External 10 MHz
r
ck
Figure 5-4 Oscilloscope Display of a Beatnote out of the Agilent/HP 70420A MonitoPort
Making theMeasurement
1. Click theContinue button when you have completed the beatnote cheand are ready to make the measurement.
2. When the PLL Suppression Curve dialog box appears, selectViewMeasured Loop Suppression, View Smoothed Loop Suppression,andView Adjusted Loop Suppression.
Agilent Technologies E5500 Phase Noise Measurement System 5-29
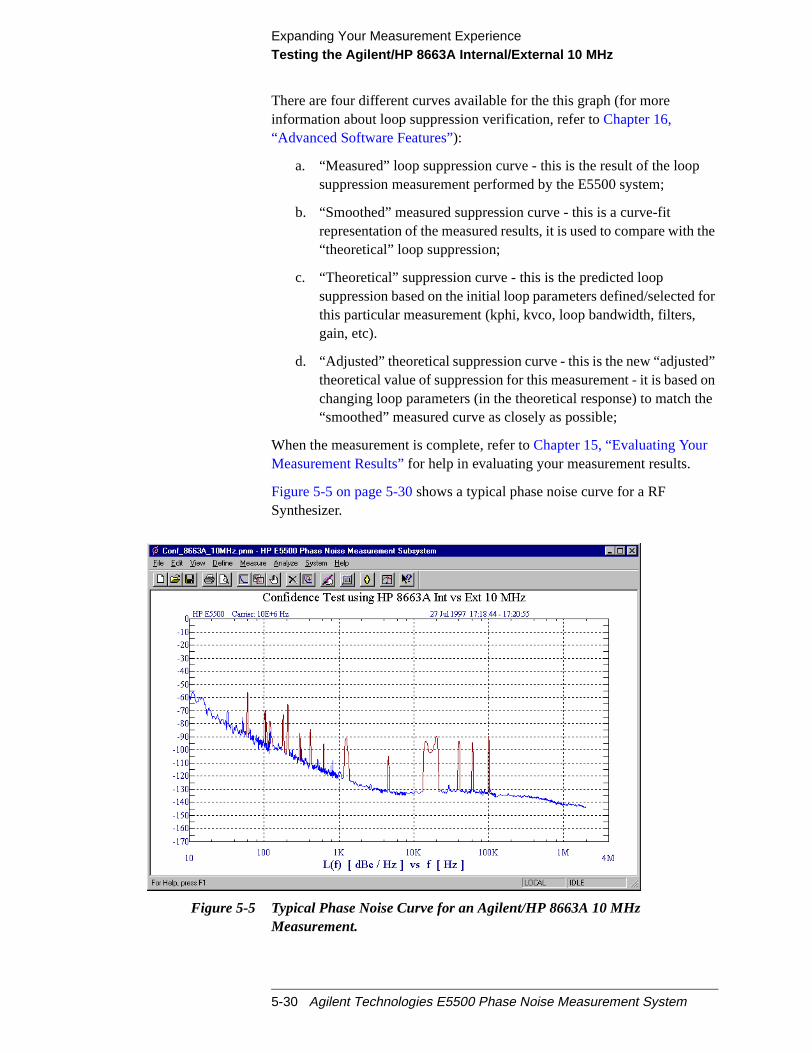
Expanding Your Measurement ExperienceTesting the Agilent/HP 8663A Internal/External 10 MHz
the
for
d”on
the
There are four different curves available for the this graph (for moreinformation about loop suppression verification, refer toChapter 16,“Advanced Software Features”):
a. “Measured” loop suppression curve - this is the result of the loopsuppression measurement performed by the E5500 system;
b. “Smoothed” measured suppression curve - this is a curve-fitrepresentation of the measured results, it is used to compare with“theoretical” loop suppression;
c. “Theoretical” suppression curve - this is the predicted loopsuppression based on the initial loop parameters defined/selectedthis particular measurement (kphi, kvco, loop bandwidth, filters,gain, etc).
d. “Adjusted” theoretical suppression curve - this is the new “adjustetheoretical value of suppression for this measurement - it is basedchanging loop parameters (in the theoretical response) to match“smoothed” measured curve as closely as possible;
When the measurement is complete, refer toChapter 15, “Evaluating YourMeasurement Results”for help in evaluating your measurement results.
Figure 5-5 on page 5-30shows a typical phase noise curve for a RFSynthesizer.
Figure 5-5 Typical Phase Noise Curve for an Agilent/HP 8663A 10 MHzMeasurement.
5-30 Agilent Technologies E5500 Phase Noise Measurement System

Expanding Your Measurement ExperienceTesting the Agilent/HP 8663A Internal/External 10 MHz
Table 5-4 Parameter Data for the Agilent/HP 8663A 10 MHz Measurement
Step Parameters Data
1 Type and Range Tab
Measurement Type
• Start Frequency
• Stop Frequency
• Minimum Number of Averages
FFT Quality
• Absolute Phase Noise (using a phase locked loop)
• 10 Hz
• 2 E + 6 Hz1
• 4
• Fast
2 Sources Tab
Carrier Source
• Frequency
• Power
• Carrier Source Output isconnected to:
Detector Input
• Frequency
Reference Source
• Frequency
• Reference Source Power
VCO Tuning Parameters
• Nominal Tune Constant
• Tune Range +/-
• Center Voltage
• Input Resistance
• 10 E + 6 Hz
• 7 dBm
• Test Set
• 10 E +6 Hz
• 10 E +6 Hz (same as Carrier Source Frequency)
• 16 dBm
• 1 E +3 Hz/V
• +/- 10 Volts
• 0 Volts
• 600 ohms
3 Cal Tab
• Phase Detector Constant
• VCO Tune Constant
• Phase Lock Loop Suppression
• If Limit is exceeded
• Measure Phase Detector Constant
• Calculate from expected VCO Tune Constant
• Verify calculated phase locked loop suppression
• Show Suppression Graph
4 Block Diagram Tab
• Carrier Source
• Downconverter
• Reference Source
• Timebase
• Phase Detector
• Test Set Tune VoltageDestination
• VCO Tune Mode
• Manual
• None
• Agilent/HP 8663A
• None
• Automatic Detector Selection
• Reference Source
• DCFM
Agilent Technologies E5500 Phase Noise Measurement System 5-31

Expanding Your Measurement ExperienceTesting the Agilent/HP 8663A Internal/External 10 MHz
5 Test Set Tab
Input Attenuation
LNA Low Pass Filter
• LNA Gain
• DC Block
• PLL Integrator Attenuation
• 0 dB
• 20 MHz (Auto checked)
• Auto Gain (Minimum Auto Gain - 14 dB)
• Not checked
• 0 dBm
6 Dowconverter Tab • The downconverter parameters do not apply to thismeasurement example.
7 Graph Tab
• Title
• Graph Type
• X Scale Minimum
• X Scale Maximum
• Y Scale Minimum
• Y Scale Maximum
• Normalize trace data to a:
• Scale trace data to a newcarrier frequency of:
• Shift trace data DOWN by:
• Trace Smoothing Amount
• Power present at input of DUT
• Confidence Test using Agilent/HP 8663A Int vs Ext 10MHz
• Single-sideband Noise (dBc/Hz)
• 10 Hz
• 4 E + 6 Hz
• 0 dBc/Hz
• - 170 dBc/Hz
• 1 Hz bandwidth
• 1 times the current carrier frequency
• 0 dB
• 0
• 0 dB
1. The Stop Frequency depends on the analyzers configured in your phase noise system.
Table 5-4 Parameter Data for the Agilent/HP 8663A 10 MHz Measurement
Step Parameters Data
5-32 Agilent Technologies E5500 Phase Noise Measurement System
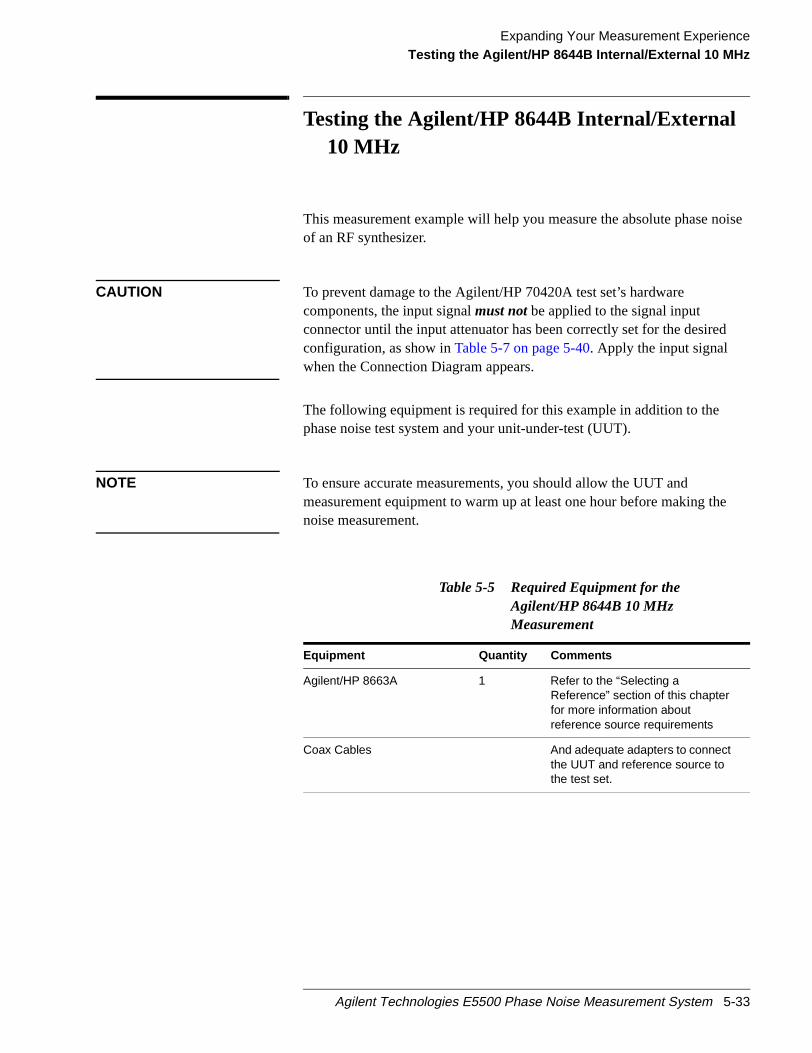
Expanding Your Measurement ExperienceTesting the Agilent/HP 8644B Internal/External 10 MHz
oise
e
Testing the Agilent/HP 8644B Internal/External10 MHz
This measurement example will help you measure the absolute phase nof an RF synthesizer.
CAUTION To prevent damage to the Agilent/HP 70420A test set’s hardwarecomponents, the input signalmust notbe applied to the signal inputconnector until the input attenuator has been correctly set for the desiredconfiguration, as show inTable 5-7 on page 5-40. Apply the input signalwhen the Connection Diagram appears.
The following equipment is required for this example in addition to thephase noise test system and your unit-under-test (UUT).
NOTE To ensure accurate measurements, you should allow the UUT andmeasurement equipment to warm up at least one hour before making thnoise measurement.
Table 5-5 Required Equipment for theAgilent/HP 8644B 10 MHzMeasurement
Equipment Quantity Comments
Agilent/HP 8663A 1 Refer to the “Selecting aReference” section of this chapterfor more information aboutreference source requirements
Coax Cables And adequate adapters to connectthe UUT and reference source tothe test set.
Agilent Technologies E5500 Phase Noise Measurement System 5-33
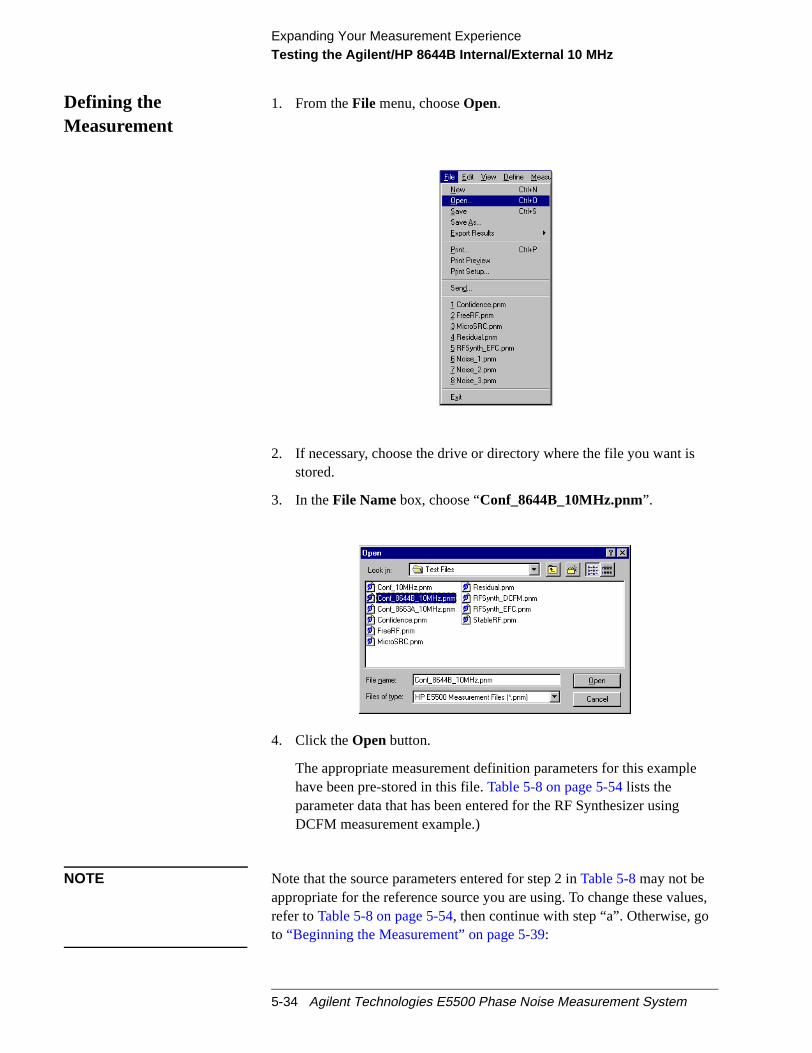
Expanding Your Measurement ExperienceTesting the Agilent/HP 8644B Internal/External 10 MHz
es,
Defining theMeasurement
1. From theFile menu, chooseOpen.
2. If necessary, choose the drive or directory where the file you want isstored.
3. In theFile Namebox, choose “Conf_8644B_10MHz.pnm”.
4. Click theOpen button.
The appropriate measurement definition parameters for this examplehave been pre-stored in this file.Table 5-8 on page 5-54lists theparameter data that has been entered for the RF Synthesizer usingDCFM measurement example.)
NOTE Note that the source parameters entered for step 2 inTable 5-8may not beappropriate for the reference source you are using. To change these valurefer toTable 5-8 on page 5-54, then continue with step “a”. Otherwise, goto “Beginning the Measurement” on page 5-39:
5-34 Agilent Technologies E5500 Phase Noise Measurement System

Expanding Your Measurement ExperienceTesting the Agilent/HP 8644B Internal/External 10 MHz
a. From theDefine menu, chooseMeasurement;then choose theSourcestab from theDefine Measurementwindow.
b. Enter the carrier (center) frequency of your UUT (5 MHz to 1.6GHz). Enter the same frequency for the detector input frequency.
c. Enter the VCO (Nominal) Tuning Constant (seeTable 5-6).
d. Enter the Tune Range of VCO (seeTable 5-6).
e. Enter the Center Voltage of VCO (seeTable 5-6).
f. Enter the Input Resistance of VCO (seeTable 5-6).
Table 5-6 Tuning Characteristics for Various Sources
VCO SourceCarrierFreq.
Tuning Constant(Hz/V)
CenterVoltage
(V)
Voltage TuningRange (± V)
InputResistance
(Ω)
TuningCalibration
Method
Agilent/HP 8662/3AEFCDCFM
υ0 5 E – 9 xυ0FM Deviation
00
1010
1E + 61 K (8662)600 (8663)
MeasureComputeCompute
Agilent/HP 8642A/B FM Deviation 0 10 600 Compute
Agilent Technologies E5500 Phase Noise Measurement System 5-35

Expanding Your Measurement ExperienceTesting the Agilent/HP 8644B Internal/External 10 MHz
Selecting a ReferenceSource
1. From theDefine menu, chooseMeasurement;then choose theBlockDiagram tab from theDefine Measurementwindow.
2. From theReference Sourcepull-down list, selectHP-8644.
3. When you have completed these operations, click theClosebutton.
Agilent/HP 8644B FM Deviation 0 10 600 Compute
Other SignalGenerato rDCFM Calibrated for±1V
FM Deviation 0 10 Rin Compute
Other User VCOSource
Estimated within afactor of 2
–10 to+10
1 E + 6 Measure
VCO SourceCarrierFreq.
Tuning Constant(Hz/V)
CenterVoltage
(V)
Voltage TuningRange (± V)
InputResistance
(Ω)
TuningCalibration
Method
5-36 Agilent Technologies E5500 Phase Noise Measurement System
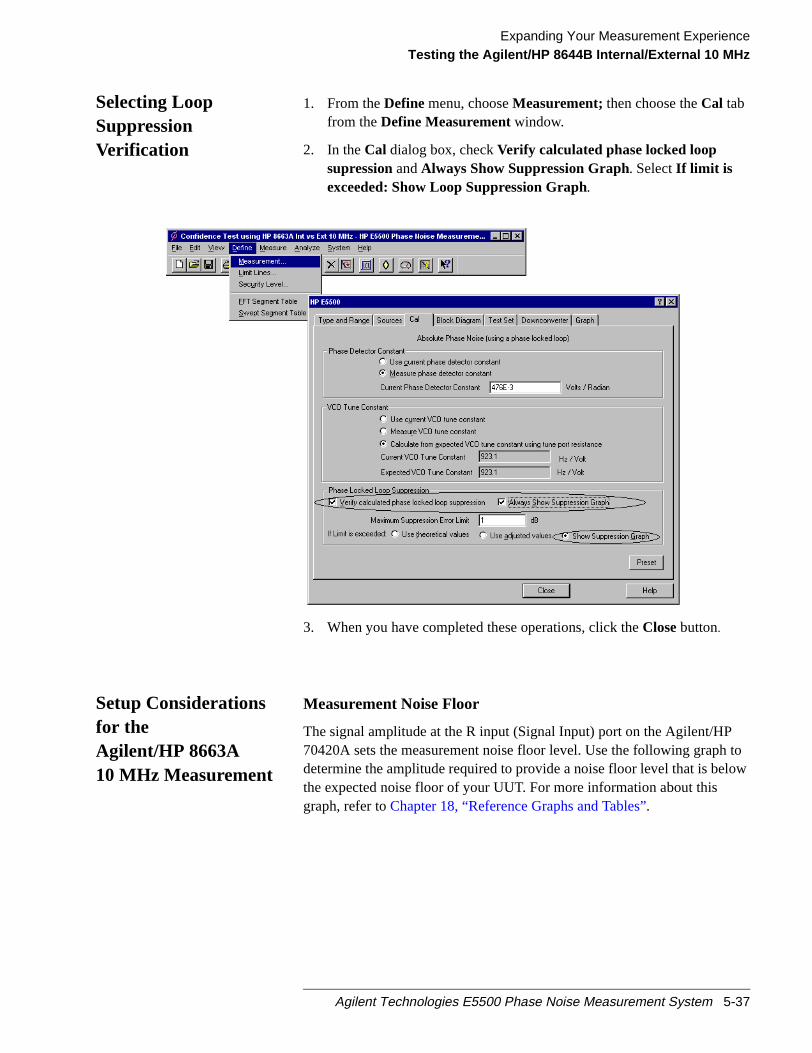
Expanding Your Measurement ExperienceTesting the Agilent/HP 8644B Internal/External 10 MHz
toow
Selecting LoopSuppressionVerification
1. From theDefine menu, chooseMeasurement;then choose theCal tabfrom theDefine Measurementwindow.
2. In theCal dialog box, checkVerify calculated phase locked loopsupressionandAlways Show Suppression Graph. SelectIf limit isexceeded: Show Loop Suppression Graph.
3. When you have completed these operations, click theClosebutton.
Setup Considerationsfor theAgilent/HP 8663A10 MHz Measurement
Measurement Noise Floor
The signal amplitude at the R input (Signal Input) port on the Agilent/HP70420A sets the measurement noise floor level. Use the following graphdetermine the amplitude required to provide a noise floor level that is belthe expected noise floor of your UUT. For more information about thisgraph, refer toChapter 18, “Reference Graphs and Tables”.
Agilent Technologies E5500 Phase Noise Measurement System 5-37

Expanding Your Measurement ExperienceTesting the Agilent/HP 8644B Internal/External 10 MHz
tefier
Figure 5-6 Noise Floor for the Agilent/HP 8644B 10 MHz Measurement
Figure 5-7 Noise Floor Example
If the output amplitude of your UUT is not sufficient to provide an adequameasurement noise floor, it will be necessary to insert a low-noise amplibetween the UUT and the test set. Refer to “Inserting an Device” in
5-38 Agilent Technologies E5500 Phase Noise Measurement System
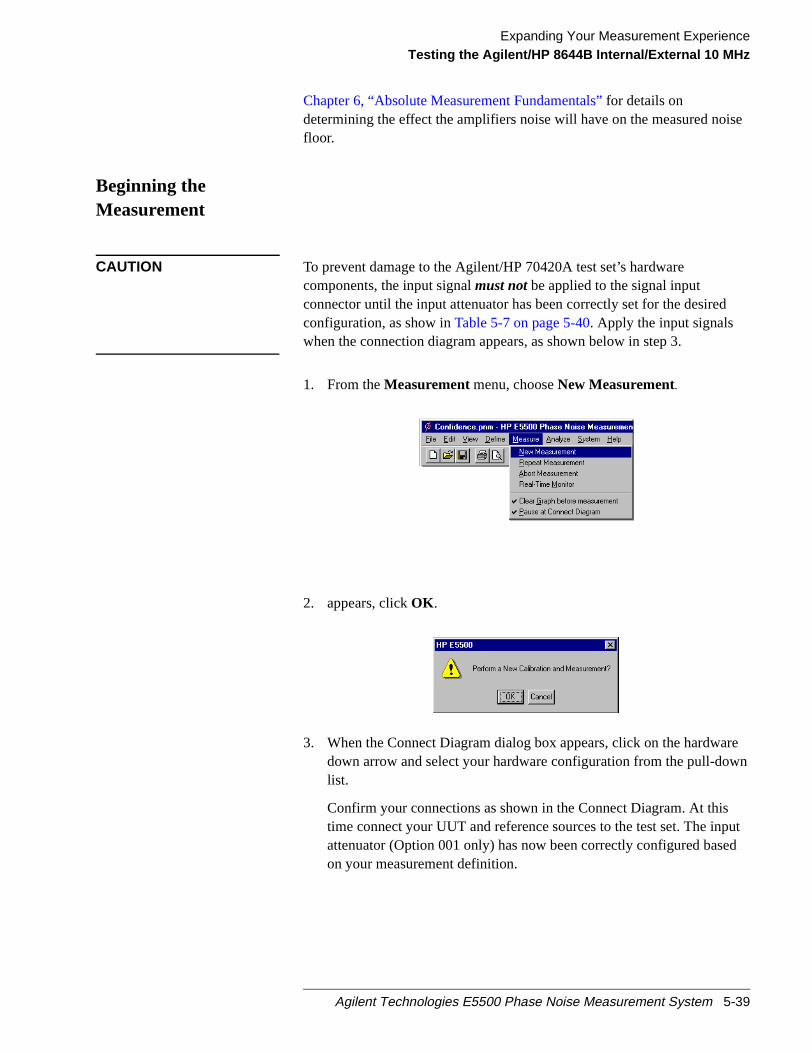
Expanding Your Measurement ExperienceTesting the Agilent/HP 8644B Internal/External 10 MHz
ise
ren
utd
Chapter 6, “Absolute Measurement Fundamentals”for details ondetermining the effect the amplifiers noise will have on the measured nofloor.
Beginning theMeasurement
CAUTION To prevent damage to the Agilent/HP 70420A test set’s hardwarecomponents, the input signalmust notbe applied to the signal inputconnector until the input attenuator has been correctly set for the desiredconfiguration, as show inTable 5-7 on page 5-40. Apply the input signalswhen the connection diagram appears, as shown below in step 3.
1. From theMeasurementmenu, chooseNew Measurement.
2. appears, clickOK .
3. When the Connect Diagram dialog box appears, click on the hardwadown arrow and select your hardware configuration from the pull-dowlist.
Confirm your connections as shown in the Connect Diagram. At thistime connect your UUT and reference sources to the test set. The inpattenuator (Option 001 only) has now been correctly configured baseon your measurement definition.
Agilent Technologies E5500 Phase Noise Measurement System 5-39
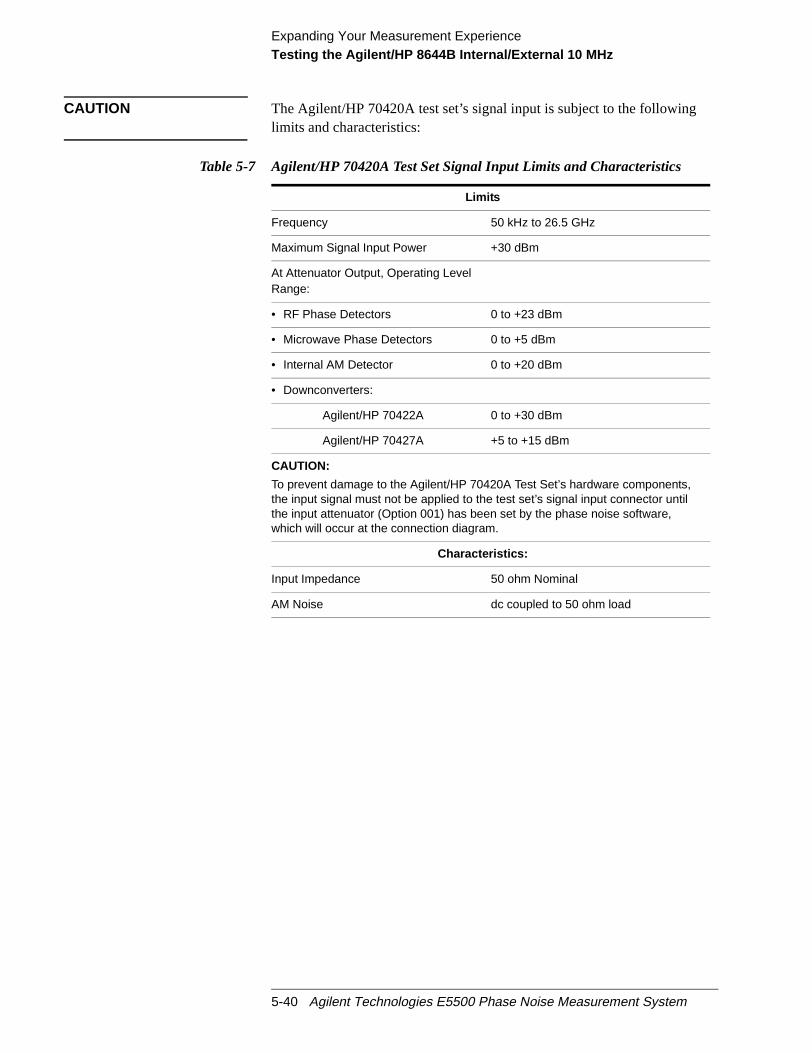
Expanding Your Measurement ExperienceTesting the Agilent/HP 8644B Internal/External 10 MHz
CAUTION The Agilent/HP 70420A test set’s signal input is subject to the followinglimits and characteristics:
Table 5-7 Agilent/HP 70420A Test Set Signal Input Limits and Characteristics
Limits
Frequency 50 kHz to 26.5 GHz
Maximum Signal Input Power +30 dBm
At Attenuator Output, Operating LevelRange:
• RF Phase Detectors 0 to +23 dBm
• Microwave Phase Detectors 0 to +5 dBm
• Internal AM Detector 0 to +20 dBm
• Downconverters:
Agilent/HP 70422A 0 to +30 dBm
Agilent/HP 70427A +5 to +15 dBm
CAUTION:
To prevent damage to the Agilent/HP 70420A Test Set’s hardware components,the input signal must not be applied to the test set’s signal input connector untilthe input attenuator (Option 001) has been set by the phase noise software,which will occur at the connection diagram.
Characteristics:
Input Impedance 50 ohm Nominal
AM Noise dc coupled to 50 ohm load
5-40 Agilent Technologies E5500 Phase Noise Measurement System
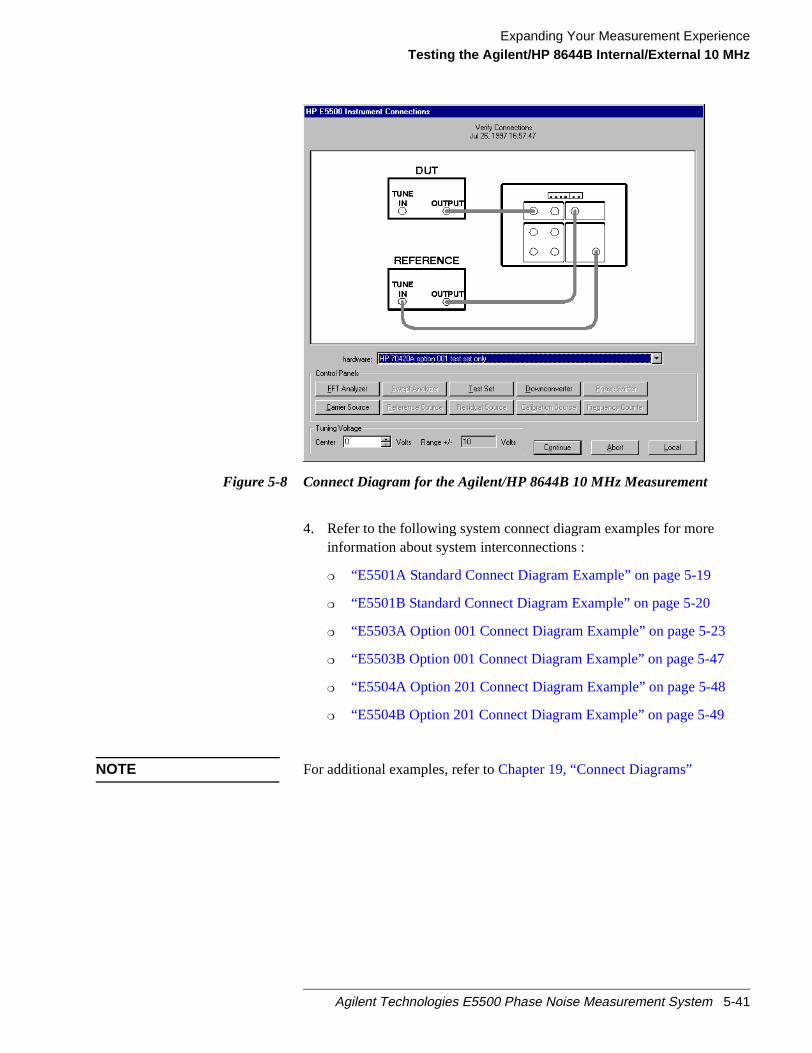
Expanding Your Measurement ExperienceTesting the Agilent/HP 8644B Internal/External 10 MHz
Figure 5-8 Connect Diagram for the Agilent/HP 8644B 10 MHz Measurement
4. Refer to the following system connect diagram examples for moreinformation about system interconnections :
“E5501A Standard Connect Diagram Example” on page 5-19
“E5501B Standard Connect Diagram Example” on page 5-20
“E5503A Option 001 Connect Diagram Example” on page 5-23
“E5503B Option 001 Connect Diagram Example” on page 5-47
“E5504A Option 201 Connect Diagram Example” on page 5-48
“E5504B Option 201 Connect Diagram Example” on page 5-49
NOTE For additional examples, refer toChapter 19, “Connect Diagrams”
Agilent Technologies E5500 Phase Noise Measurement System 5-41
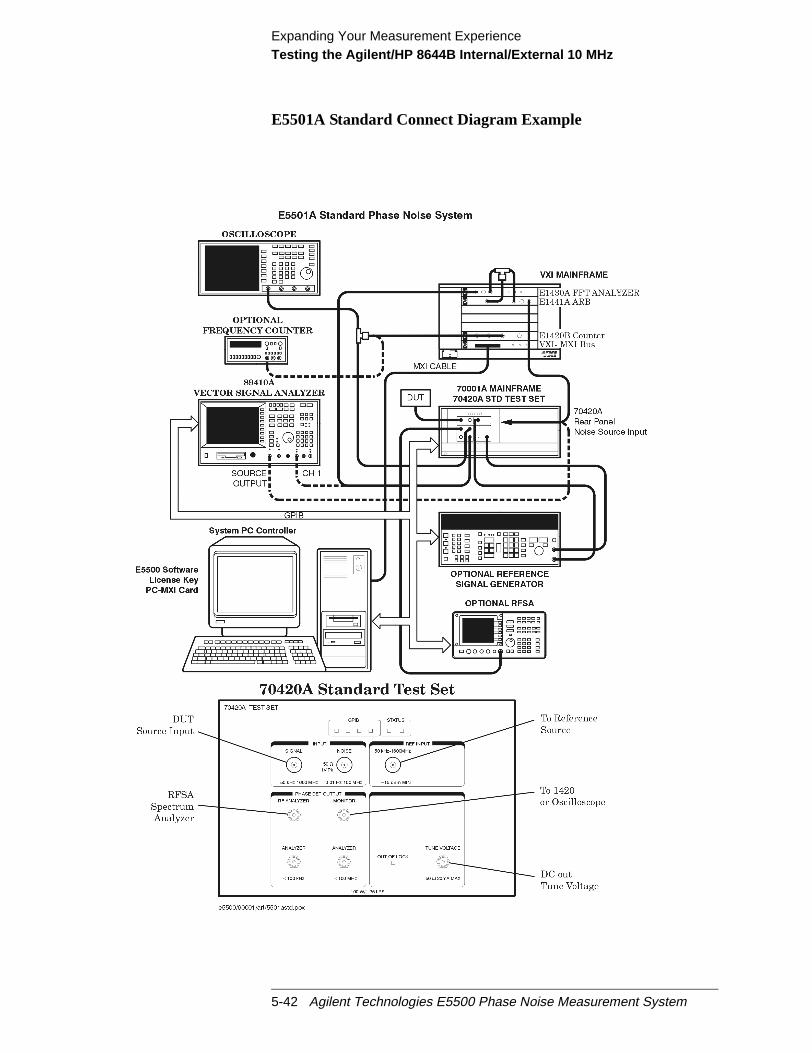
Expanding Your Measurement ExperienceTesting the Agilent/HP 8644B Internal/External 10 MHz
E5501A Standard Connect Diagram Example
5-42 Agilent Technologies E5500 Phase Noise Measurement System
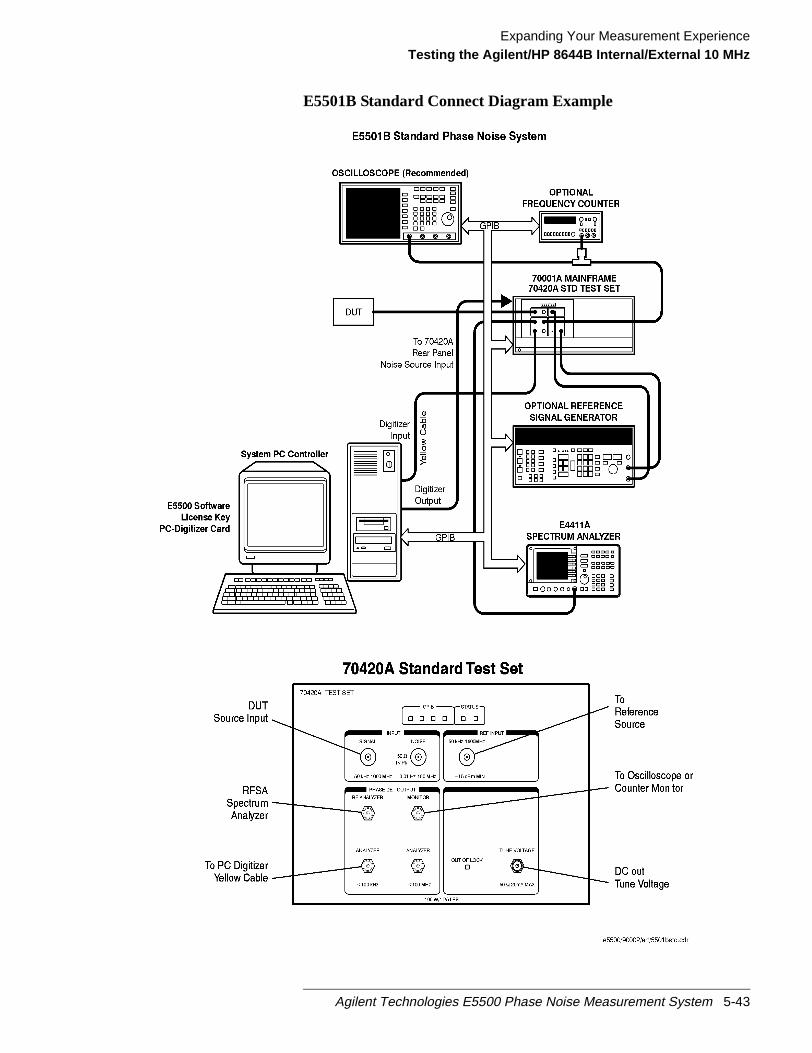
Expanding Your Measurement ExperienceTesting the Agilent/HP 8644B Internal/External 10 MHz
E5501B Standard Connect Diagram Example
Agilent Technologies E5500 Phase Noise Measurement System 5-43
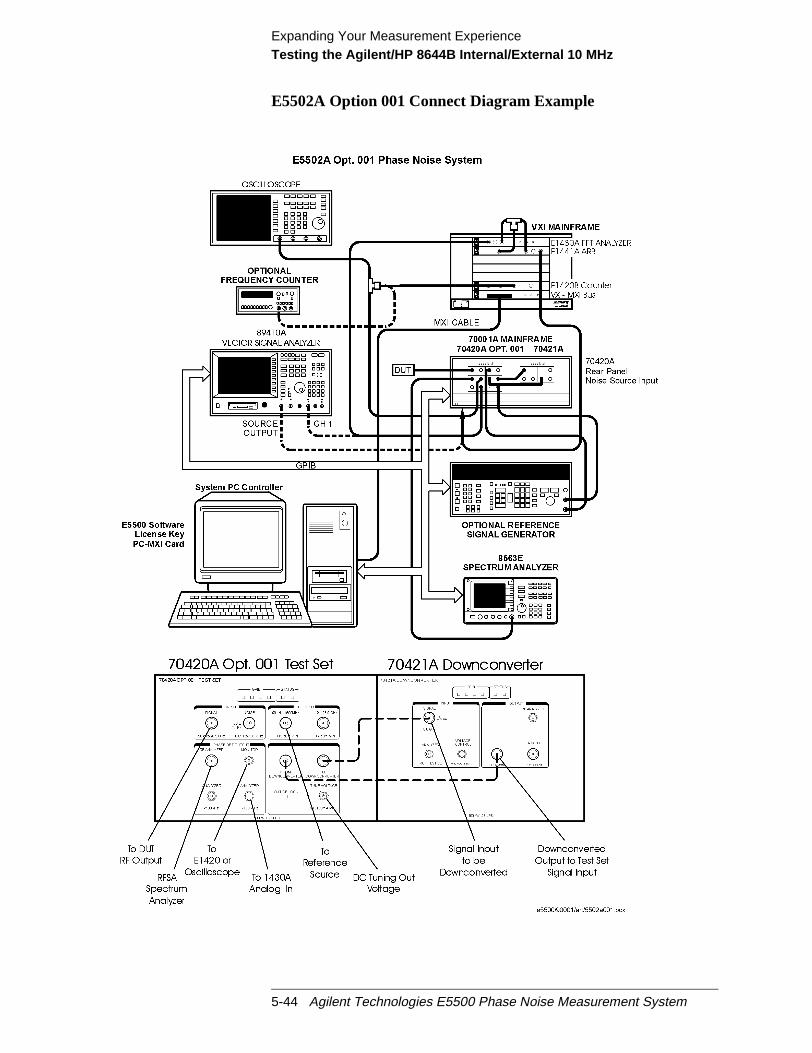
Expanding Your Measurement ExperienceTesting the Agilent/HP 8644B Internal/External 10 MHz
E5502A Option 001 Connect Diagram Example
5-44 Agilent Technologies E5500 Phase Noise Measurement System
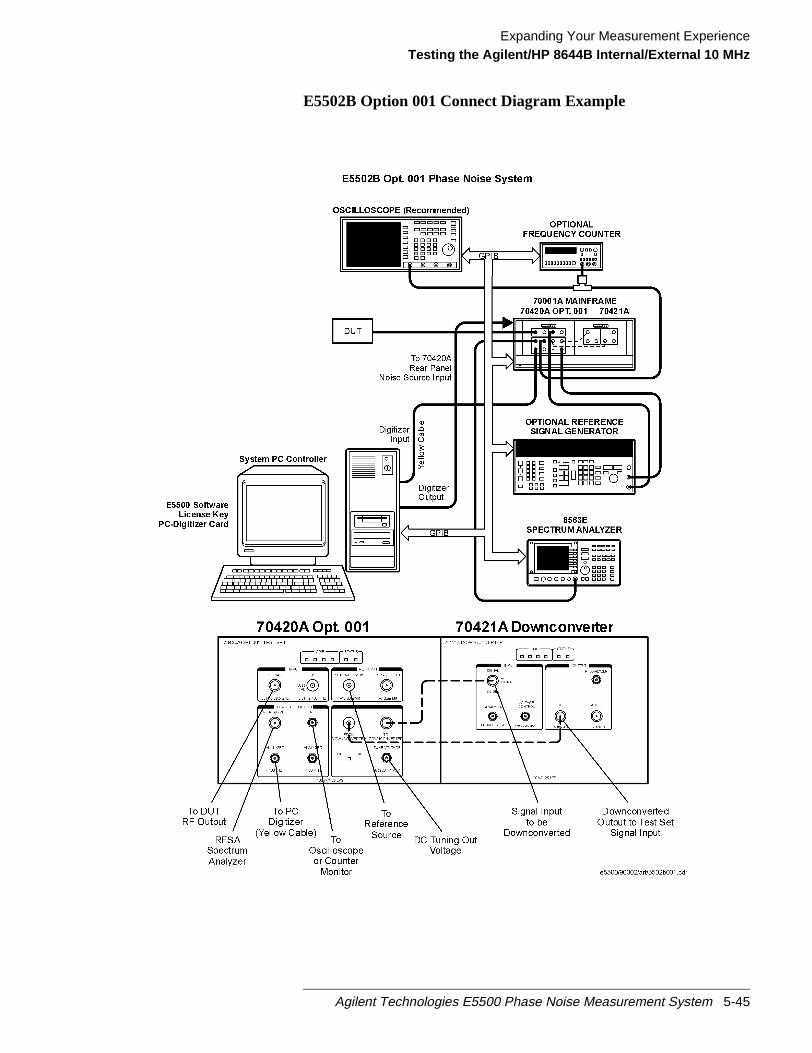
Expanding Your Measurement ExperienceTesting the Agilent/HP 8644B Internal/External 10 MHz
E5502B Option 001 Connect Diagram Example
Agilent Technologies E5500 Phase Noise Measurement System 5-45

Expanding Your Measurement ExperienceTesting the Agilent/HP 8644B Internal/External 10 MHz
E5503A Option 001 Connect Diagram Example
5-46 Agilent Technologies E5500 Phase Noise Measurement System
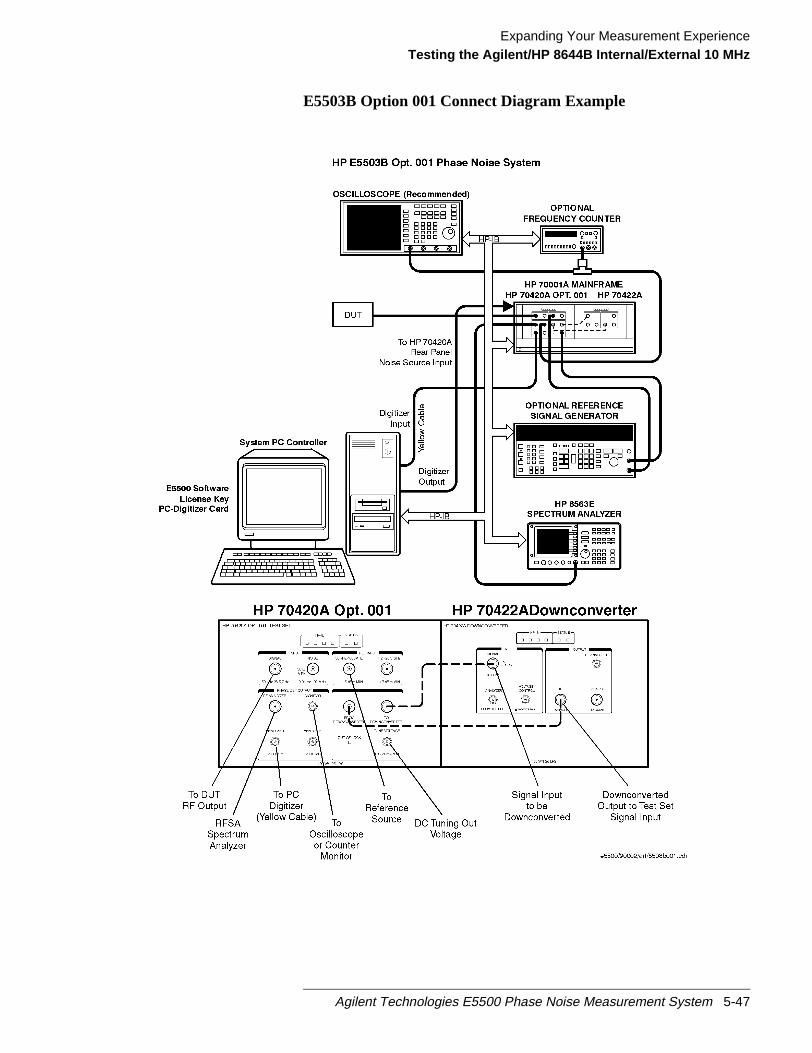
Expanding Your Measurement ExperienceTesting the Agilent/HP 8644B Internal/External 10 MHz
E5503B Option 001 Connect Diagram Example
Agilent Technologies E5500 Phase Noise Measurement System 5-47

Expanding Your Measurement ExperienceTesting the Agilent/HP 8644B Internal/External 10 MHz
E5504A Option 201 Connect Diagram Example
5-48 Agilent Technologies E5500 Phase Noise Measurement System
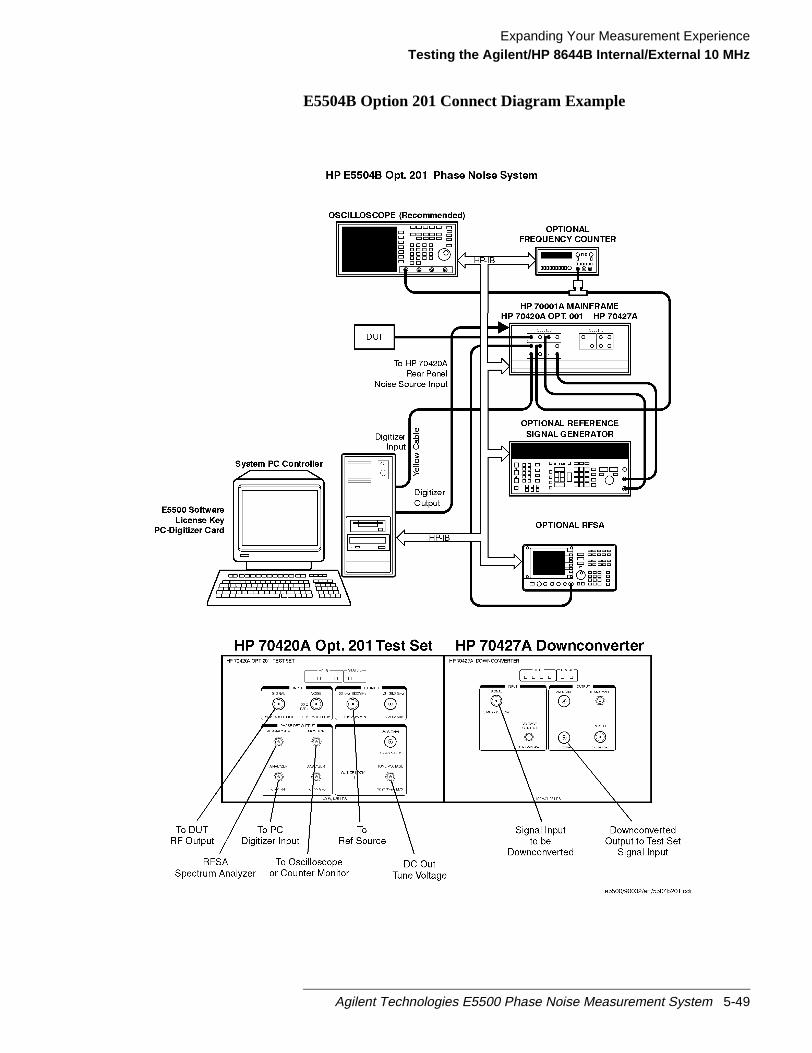
Expanding Your Measurement ExperienceTesting the Agilent/HP 8644B Internal/External 10 MHz
E5504B Option 201 Connect Diagram Example
Agilent Technologies E5500 Phase Noise Measurement System 5-49

Expanding Your Measurement ExperienceTesting the Agilent/HP 8644B Internal/External 10 MHz
.)
itwillge
theion.
owces
se
5. The following messages will appear on the display as the systemperforms the calibration routines. (You will have time to read throughthese message descriptions while the system completes the routines
Determining Presence of Beat Note...
An initial check is made to verify that a beatnote is present within thesystem’s detection range.
Verifying zero-beat...
The frequency of the beatnote is measured to see if it is within 5% of theestimated Peak Tuning Range of the system. The system’s Peak TuningRange is the portion of the voltage-controlled-oscillator (VCO) source’stuning range being used for the measurement.
When the system measures the phase noise of a signal source using thePhase Lock Loop technique (the technique being used in this example)requires that one of the two sources used in the setup is a VCO. As yousee later in this demonstration, you will be required to estimate the tuninrange of the VCO source you are using when you set up your own PhasLock Loop measurements.
Zero beating sources...
The center frequencies of the sources are now adjusted, if necessary, toposition the beatnote within the 5% range. The adjustment is made withtune voltage applied to the VCO source set at its nominal or center posit
Measuring the VCO Tuning Constant...
The tuning sensitivity (Hz/V) of the VCO source is now preciselydetermined by measuring the beatnote frequency at four tune voltagesettings across the tuning range of the VCO source. Linearity across thetuning range is also verified
Measuring the Phase Detector Constant...
The transfer characteristics (V/rad) of the test set’s phase detector are ndetermined for the specific center frequency and power level of the sourbeing measured.
Measuring PLL suppression...
The required correction data is created to compensate for the phase noisuppression which occurs within the bandwidth of the phase lock loopcreated for this measurement.
6. The computer displays the PLL suppression curve and associatedmeasurement values. PressContinue using Adjusted Loop
5-50 Agilent Technologies E5500 Phase Noise Measurement System

Expanding Your Measurement ExperienceTesting the Agilent/HP 8644B Internal/External 10 MHz
ts
y
with
you
nr ace
in
e ofbe
the
its
en
cyuntil
ch
Suppressionto continue making the noise measurement. Themeasurement can be stopped by pressing theAbort key.
Sweep-Segments When the system begins measuring noise, it places the noise graph on idisplay. As you watch the graph, you will see the system plot itsmeasurement results in frequency segments.
The system measures the noise level across its frequency offset range baveraging the noise within smaller frequency segments. This techniqueenables the system to optimize measurement speed while providing youthe measurement resolution needed for most test applications.
When the measurement is complete, refer toChapter 15, “Evaluating YourMeasurement Results”for help in evaluating your measurement results. (Ifthe test system has problems completing the measurement, it will informby placing a message on the computer display.
Checking the Beatnote While the Connect Diagram is still displayed, recommend that you use aoscilloscope (connected to the Monitor port on the Agilent/HP 70420A) ocounter to check the beatnote being created between the reference sourand your device-under-test. The objective of checking the beatnote is toensure that the center frequencies of the two sources are close enoughfrequency to create a beatnote that is within the Capture Range of thesystem.
The phase lock loop (PLL) Capture Range is 5% of the peak tuning rangthe VCO source you are using. (The peak tuning range for your VCO canestimated by multiplying the VCO tuning constant by the tune range ofVCO. Refer toChapter 15, “Evaluating Your Measurement Results”if youare not familiar with the relationship between the PLL capture range andpeak tuning range of the VCO.)
NOTE If the center frequencies of the sources are not close enough to create abeatnote within the capture range, the system will not be able to completemeasurement.
The beatnote frequency is set by the relative frequency difference betwethe two sources. If you have two very accurate sources set at the samefrequency, the resulting beatnote will be very close to 0 Hz.
Searching for the beatnote will require that you adjust the center frequenof one of the sources above and below the frequency of the other sourcethe beatnote appears on the oscilloscope’s display.
If incrementing the frequency of one of the sources does not produce abeatnote, you will need to verify the presence of an output signal from easource before proceeding.
Agilent Technologies E5500 Phase Noise Measurement System 5-51
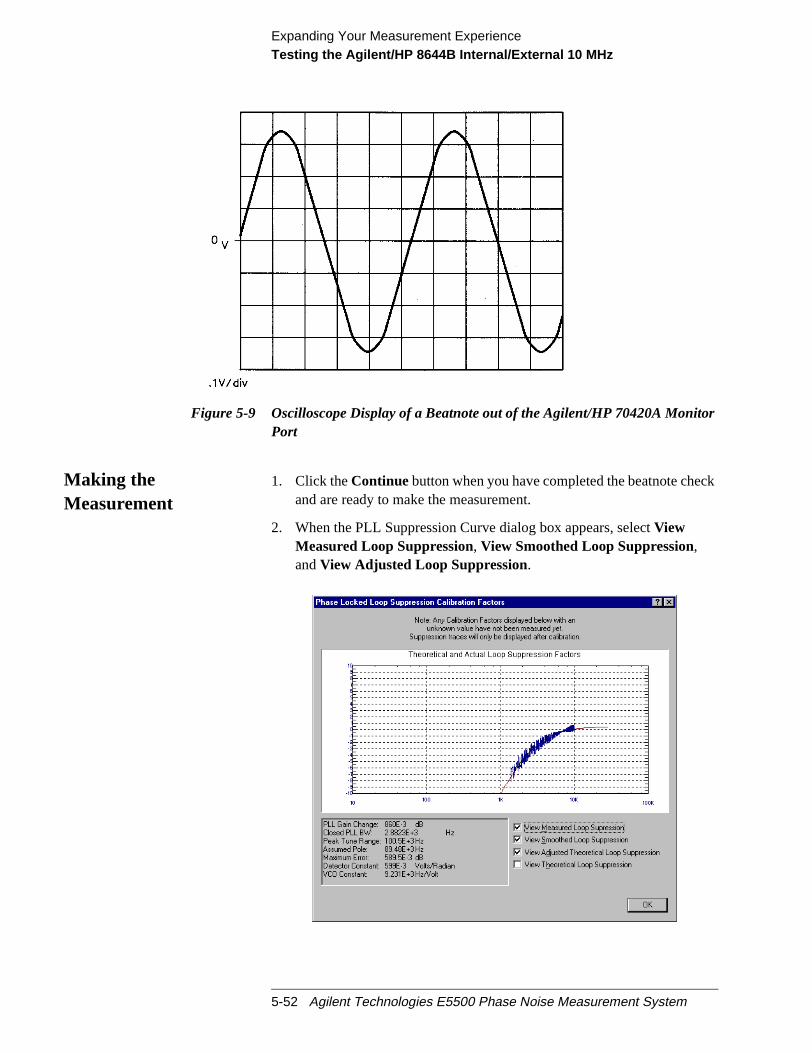
Expanding Your Measurement ExperienceTesting the Agilent/HP 8644B Internal/External 10 MHz
r
ck
Figure 5-9 Oscilloscope Display of a Beatnote out of the Agilent/HP 70420A MonitoPort
Making theMeasurement
1. Click theContinue button when you have completed the beatnote cheand are ready to make the measurement.
2. When the PLL Suppression Curve dialog box appears, selectViewMeasured Loop Suppression, View Smoothed Loop Suppression,andView Adjusted Loop Suppression.
5-52 Agilent Technologies E5500 Phase Noise Measurement System

Expanding Your Measurement ExperienceTesting the Agilent/HP 8644B Internal/External 10 MHz
the
for
d”on
the
There are four different curves available for the this graph (for moreinformation about loop suppression verification, refer toChapter 16,“Advanced Software Features”):
a. “Measured” loop suppression curve - this is the result of the loopsuppression measurement performed by the E5500 system;
b. “Smoothed” measured suppression curve - this is a curve-fitrepresentation of the measured results, it is used to compare with“theoretical” loop suppression;
c. “Theoretical” suppression curve - this is the predicted loopsuppression based on the initial loop parameters defined/selectedthis particular measurement (kphi, kvco, loop bandwidth, filters,gain, etc).
d. “Adjusted” theoretical suppression curve - this is the new “adjustetheoretical value of suppression for this measurement - it is basedchanging loop parameters (in the theoretical response) to match“smoothed” measured curve as closely as possible;
When the measurement is complete, refer toChapter 15, “Evaluating YourMeasurement Results”for help in evaluating your measurement results.
Figure 5-5 on page 5-30shows a typical phase noise curve for a RFSynthesizer.
Figure 5-10 Typical Phase Noise Curve for an Agilent/HP 8644B 10 MHzMeasurement.
Agilent Technologies E5500 Phase Noise Measurement System 5-53
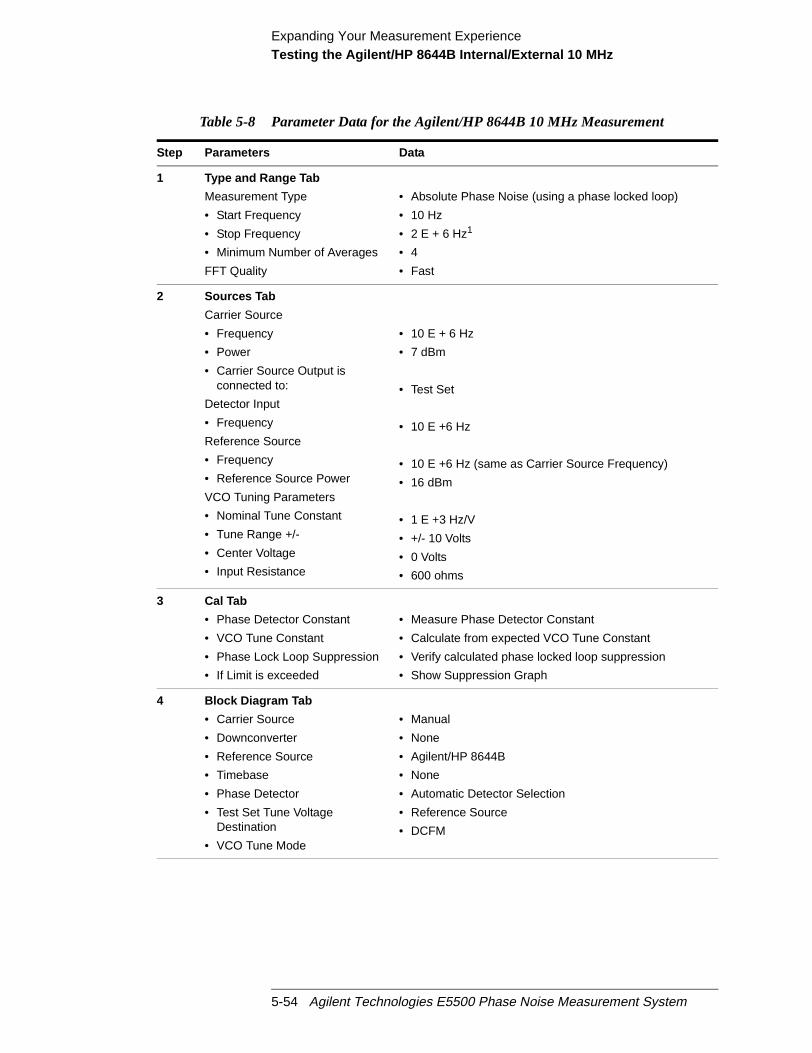
Expanding Your Measurement ExperienceTesting the Agilent/HP 8644B Internal/External 10 MHz
Table 5-8 Parameter Data for the Agilent/HP 8644B 10 MHz Measurement
Step Parameters Data
1 Type and Range Tab
Measurement Type
• Start Frequency
• Stop Frequency
• Minimum Number of Averages
FFT Quality
• Absolute Phase Noise (using a phase locked loop)
• 10 Hz
• 2 E + 6 Hz1
• 4
• Fast
2 Sources Tab
Carrier Source
• Frequency
• Power
• Carrier Source Output isconnected to:
Detector Input
• Frequency
Reference Source
• Frequency
• Reference Source Power
VCO Tuning Parameters
• Nominal Tune Constant
• Tune Range +/-
• Center Voltage
• Input Resistance
• 10 E + 6 Hz
• 7 dBm
• Test Set
• 10 E +6 Hz
• 10 E +6 Hz (same as Carrier Source Frequency)
• 16 dBm
• 1 E +3 Hz/V
• +/- 10 Volts
• 0 Volts
• 600 ohms
3 Cal Tab
• Phase Detector Constant
• VCO Tune Constant
• Phase Lock Loop Suppression
• If Limit is exceeded
• Measure Phase Detector Constant
• Calculate from expected VCO Tune Constant
• Verify calculated phase locked loop suppression
• Show Suppression Graph
4 Block Diagram Tab
• Carrier Source
• Downconverter
• Reference Source
• Timebase
• Phase Detector
• Test Set Tune VoltageDestination
• VCO Tune Mode
• Manual
• None
• Agilent/HP 8644B
• None
• Automatic Detector Selection
• Reference Source
• DCFM
5-54 Agilent Technologies E5500 Phase Noise Measurement System

Expanding Your Measurement ExperienceTesting the Agilent/HP 8644B Internal/External 10 MHz
5 Test Set Tab
Input Attenuation
LNA Low Pass Filter
• LNA Gain
• DC Block
• PLL Integrator Attenuation
• 0 dB
• 20 MHz (Auto checked)
• Auto Gain (Minimum Auto Gain - 14 dB)
• Not checked
• 0 dBm
6 Dowconverter Tab • The downconverter parameters do not apply to thismeasurement example.
7 Graph Tab
• Title
• Graph Type
• X Scale Minimum
• X Scale Maximum
• Y Scale Minimum
• Y Scale Maximum
• Normalize trace data to a:
• Scale trace data to a newcarrier frequency of:
• Shift trace data DOWN by:
• Trace Smoothing Amount
• Power present at input of DUT
• Confidence Test using Agilent/HP 8644B Int vs Ext 10MHz
• Single-sideband Noise (dBc/Hz)
• 10 Hz
• 4 E + 6 Hz
• 0 dBc/Hz
• - 170 dBc/Hz
• 1 Hz bandwidth
• 1 times the current carrier frequency
• 0 dB
• 0
• 0 dB
1. The Stop Frequency depends on the analyzers configured in your phase noise system.
Table 5-8 Parameter Data for the Agilent/HP 8644B 10 MHz Measurement
Step Parameters Data
Agilent Technologies E5500 Phase Noise Measurement System 5-55

Expanding Your Measurement ExperienceViewing Markers
n:
ck
Viewing Markers
The marker function allows you to display the exact frequency andamplitude of any point on the results graph. To access the marker functio
On theView menu, clickMarkers.
Up to nine markers may be added. To remove the highlighted marker, clitheDeletebutton.
5-56 Agilent Technologies E5500 Phase Noise Measurement System

Expanding Your Measurement ExperienceOmitting Spurs
Omitting Spurs
The Omit Spurs function plots the currently loaded results withoutdisplaying any spurs that may be present.
1. On theView menu, clickDisplay Preferences.
2. In theDisplay Preferencesdialog box, uncheckSpurs. Click OK
Agilent Technologies E5500 Phase Noise Measurement System 5-57

Expanding Your Measurement ExperienceOmitting Spurs
3. The Graph will be displayed without spurs. To re-display the spurs,checkSpurs in theDisplay Preferencesdialog box.
5-58 Agilent Technologies E5500 Phase Noise Measurement System

Expanding Your Measurement ExperienceDisplaying the Parameter Summary
he
Displaying the Parameter Summary
The Parameter Summary function allows you to quickly review themeasurement parameter entries that were used for this measurement. Tparameter summary data is included when you print the graph.
1. On theView menu, clickParameter Summay.
2. TheParameter Summary Notepaddialog box appears. The data canbe printed or changed using standard Notepad functionality.
Agilent Technologies E5500 Phase Noise Measurement System 5-59

Expanding Your Measurement ExperienceExporting Measurement Results
pes:
Exporting Measurement Results
The Export Measurement Results function exports data in one of three ty
• “Exporting Trace Data” on page 5-61
• “Exporting Spur Data” on page 5-62
• “Exporting X-Y Data” on page 5-63
1. On theFile menu, point toExport Results, then click on eitherTraceData, Spur Data, or X-Y Data.
5-60 Agilent Technologies E5500 Phase Noise Measurement System
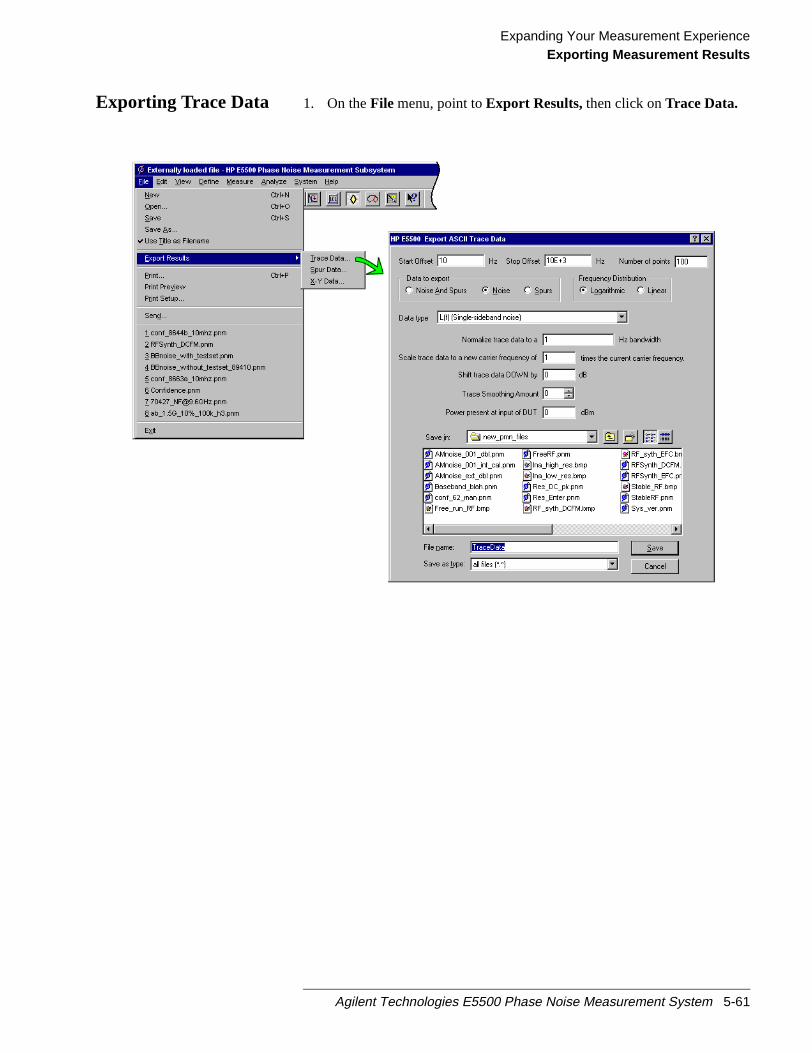
Expanding Your Measurement ExperienceExporting Measurement Results
Exporting Trace Data 1. On theFile menu, point toExport Results, then click onTrace Data.
Agilent Technologies E5500 Phase Noise Measurement System 5-61

Expanding Your Measurement ExperienceExporting Measurement Results
Exporting Spur Data 1. On theFile menu, point toExport Results, then click onSpur Data.
5-62 Agilent Technologies E5500 Phase Noise Measurement System

Expanding Your Measurement ExperienceExporting Measurement Results
Exporting X-Y Data 1. On theFile menu, point toExport Results, then click onX-Y Data.
Agilent Technologies E5500 Phase Noise Measurement System 5-63

gyoutem
6 Absolute Measurement Fundamentals
What You’ll Find in This Chapter
This chapter contains information about making absolute phase noisemeasurements of signal sources. This information is fundamental to usinthe Agilent E5500 phase noise measurement system. It is important thatunderstand the concepts contained in this chapter in order to use the syseffectively.
The topics covered in this chapter include:
• The Phase Lock Loop Technique, page 6-2
• What Sets the Measurement Noise Floor?, page 6-6
• Selecting a Reference, page 6-8
• Estimating the Tuning Constant, page 6-11
• Tracking Frequency Drift , page 6-12
• Changing the PTR, page 6-14
• Minimizing Injection Locking , page 6-16
• Inserting a Device, page 6-18
• Evaluating Noise Above the Small Angle Line, page 6-20
Agilent Technologies E5500 Phase Noise Measurement System 6-1

Absolute Measurement FundamentalsThe Phase Lock Loop Technique
; theires
e
The Phase Lock Loop Technique
The phase lock loop measurement technique requires two signal sourcessource-under-test and a reference source. This measurement type requthat one of the two sources is a voltage-controlled-oscillator (VCO).
You will most likely use the phase lock loop technique since it is themeasurement type most commonly used for measuring signal sourcedevices. This chapter focuses on this measurement type for signal sourcmeasurements.
6-2 Agilent Technologies E5500 Phase Noise Measurement System

Absolute Measurement FundamentalsThe Phase Lock Loop Technique
setT ising
hasl tol to
s of
Understanding thePhase-Lock LoopTechnique
This measurement technique requires two signal sources set up in a phalocked loop (PLL) configuration. One of the sources is the unit-under-tes(UUT). The second source serves as the reference against which the UUmeasured. (One of the two sources must be a VCO source capable of befrequency tuned by the System.)Figure 6-1 on page 6-3shows a simplifieddiagram of the PLL configuration used for the measurement.
Figure 6-1 Simplified Block Diagram of the Phase Lock Loop Configuration
The Phase Lock LoopCircuit
The Capture and Drift Tracking Ranges
Like other PLL circuits, the phase lock loop created for the measurementa Capture Range and a drift tracking range. The Capture Range is equa5% of the system’s peak tuning range, and the drift tracking range is equa24% of the system’s peak tuning range.
The system’s peak tuning range is derived from the tuning characteristicthe VCO source you are using for the measurement.Figure 6-2 on page 6-4illustrates the relationship that typically exists between the VCO’speak-to-peak tuning range and the tuning range of the system.
The system’s drift tracking range is limited to a small portion of the peaktuning range to minimize the possibility of measurement accuracydegradation caused by non-linearity across the VCO’s tuning range.
Peak Tune Range (PTR)
PTR is determined using two parameters:
• VCO tuning sensitivity (Hz/Volt)
• Total voltage tuning range (Volts)
PTR = (VCO Tuning Sensitivity) X (Total Voltage Tuning Range)
PTR = (100 Hz/V) X (10 V) = 1000 Hz
Agilent Technologies E5500 Phase Noise Measurement System 6-3

Absolute Measurement FundamentalsThe Phase Lock Loop Technique
e
te. Inust
ustt.re
Figure 6-2 Typical Relationship of Capture Range and Drift Tracking Range to Tuning Range ofVCO
As an Example:
A Peak Tuning Range of 1000 Hz will provide the following ranges:
Capture Range =0.05 X 1000 Hz = 50 Hz
Drift Tracking Range =0.24 X 1000 Hz = 240 Hz
Tuning Requirements
The peak tuning range required for your measurement will depend on thfrequency stability of the two sources you are using. The signals from thetwo sources are mixed in the system’s phase detector to create a beatnoorder for the loop to acquire lock, the center frequencies of the sources mbe close enough together to create a beatnote that is within the system’sCapture Range. Once the loop is locked, the frequency of the beatnote mremain within the drift tracking range for the duration of the measuremenIn Figure 6-3 on page 6-5, the ranges calculated in the previous example amarked to show their relationship to the beatnote frequency.
6-4 Agilent Technologies E5500 Phase Noise Measurement System

Absolute Measurement FundamentalsThe Phase Lock Loop Technique
p
genal.e,ct of
gs
ur
ific
Figure 6-3 Relationship of Capture and Drift Tracking Ranges to Beatnote Frequency
If the beatnote does not remain within the drift tracking range during themeasurement, the out of lock detector will be set and the System will stothe measurement. If this happens, you will need to increase the system’sdrift tracking range by increasing the system’s peak tuning range (ifpossible) or by selecting a VCO source with a greater tuning range.
Selecting the VCO Source
Although you must select a VCO source that will provide a sufficient tuninrange to permit the system to track the beatnote, keep in mind that a widtuning range typically means a higher noise level on the VCO source sigWhen the VCO source for your measurement is also the reference sourcthis trade-off can make reference source selection the most critical aspeyour measurement setup.
Specifying Your VCO Source
When you set up your PLL measurement, you will need to know four thinabout the tuning characteristics of the VCO source you are using. TheSystem will determine the VCO source’s peak tuning range from these foparameters.
• Tuning Constant, estimated tuning sensitivity (Hz/V)• Center Voltage of Tuning Range, (V)• Tune Range of VCO, (±V)• Input Resistance of Tuning Port, (ohms) if the tuning constant is not
to be measured.
The measurement examples in the next chapter that recommend a specVCO source will provide you with the tuning parameters for the specifiedsource.
Agilent Technologies E5500 Phase Noise Measurement System 6-5

Absolute Measurement FundamentalsWhat Sets the Measurement Noise Floor?
ut
inoise
What Sets the Measurement Noise Floor?
The noise floor for your measurement will be set by two things:
• The noise floor of the phase detector and low-noise amplifier (LNA)• The noise level of the reference source you are using
The System NoiseFloor
The noise floor of the system is directly related to the amplitude of the inpsignal at the R input port of the system’s phase detector.
The following table shows the amplitude ranges for the L and R ports.
If the L port (reference input) signal is within the amplitude range shownthe preceding table, the signal level at the R (signal ) input port sets the nfloor for the system.
The following graph shows the relationship between the R (signal) inputlevel and the system noise floor.
Phase Detector
50 kHz to 1.6 GHz 1.2 to 26.5 GHz 1 50 kHz to 26.5 GHz 2
Ref Input (L Port) Signal Input (RPort)
Ref Input (L Port) Signal Input (RPort)
AM Noise
+ 15 dBmto
+ 23 dBM
0 dBmto
+ 23 dBM
+ 7 dBmto
+ 10 dBM
0 dBmto
+ 5 dBM
0 dBmto
20 dBM
1. Agilent/HP 70420A phase noise test set Options 001 and 201with no attenuation
2. Agilent/HP 70420A phase noise test set Option 001 with no attenuation
6-6 Agilent Technologies E5500 Phase Noise Measurement System

Absolute Measurement FundamentalsWhat Sets the Measurement Noise Floor?
ou
arce
e
Figure 6-4 Relationship Between the R Input Level and System Noise Floor
The Noise Level of theReference Source
Unless it is below the system’s noise floor, the noise level of the source yare using as the reference source will set the noise floor for themeasurement. When you set up your measurement, you will want to usereference source with a noise level that is at or below the level of the souyou are going to measure.
The following graph demonstrates that as the noise level of the referencsource approaches the noise level of the UUT, the level measured by theSystem (which is the sum of all noise sources affecting the system) isincreased above the actual noise level of the UUT.
Figure 6-5 Increase in Measured Noise as Reference Source Noise Approaches UUT Noise
Agilent Technologies E5500 Phase Noise Measurement System 6-7

Absolute Measurement FundamentalsSelecting a Reference
g atoe
l ofout
e
e
tooneo
blishre
ssum
Selecting a Reference
Selecting an appropriate reference source is critical when you are makinphase noise measurement using the phase lock loop technique. The keyselecting a reference source is to compare the noise level of the referencwith the expected noise level of the unit-under-test (UUT). In general, thelower the reference source’s noise level is below the expected noise levethe UUT the better. (Keep in mind that you only need to be concerned abthe reference source’s noise level within the frequency offset range overwhich you plan to measure the UUT.)
As shown by the graph inFigure 6-6, the further the reference source’s noislevel is below the noise level of the UUT, the less the reference source’snoise will contribute to the measurement results.
Figure 6-6 Increase in Measured Noise As UUT Noise Approaches Reference Nois
Using a Similar Device The test system performs best when you are able to use a device similarthe UUT as the reference source for your PLL measurement. Of courseof the devices must be capable of being voltage tuned by the system to dthis.
To select a similar device for use as the reference source, you must estathat the noise level of the reference source device is adequate to measuyour UUT. The Three Source Comparison technique enables you toestablish the actual noise levels of three comparable devices when twodevices are available in addition to the UUT.
If only one device is available in addition to the UUT, you can perform thePhase Noise Using a Phase Locked Loop Measurement using these twodevices and know that the noise level of each of the devices is at least agood as the measured results. (The measured results will represent theof the noise of both devices.)
6-8 Agilent Technologies E5500 Phase Noise Measurement System

Absolute Measurement FundamentalsSelecting a Reference
thee.
forstill
ur
rift
re
Using a SignalGenerator
When using a signal generator as a reference source, it is important thatgenerator’s noise characteristics are adequate for measuring your devic
Tuning Requirements Often the reference source you select will also serve as the VCO sourcethe PLL measurement. (The VCO source can be either the unit-under-te(UUT) or the reference source.) To configure a PLL measurement, you wneed to know the following tuning information about the VCO source youare using:
• Tuning Constant (Hz/V) (within a factor of 2)• Tuning Voltage Range (V)• Center Voltage of Tuning Range (V)• Input Resistance of Tuning Port (ohms)
The primary consideration when evaluating a potential VCO source for yomeasurement is whether it will provide the test system with sufficientcapture and drift tracking ranges to maintain lock throughout themeasurement. To make this determination, you must estimate what the drange of the sources you are using will be over the measurement period(thirty minutes maximum). (Details on the relationship between the captuand drift tracking ranges and the tuning range of the VCO source areprovided inTable 6-1. This information will help you evaluate your VCOsource based on the estimated drift of your sources.)
Table 6-1lists the tuning parameters for several VCO options.
Table 6-1 Tuning Characteristics of Various VCO Source Options
VCO SourceCarrierFreq.
Tuning Constant(Hz/V)
CenterVoltage
(V)
Voltage TuningRange (± V)
InputResistance
(Ω)
TuningCalibration
Method
Agilent/HP 8662/3AEFCDCFM
υ0 5 E – 9 xυ0FM Deviation
00
1010
1E + 61 k (8662)600 (8663)
MeasureCalculateCalculate
Agilent/HP 8642A/B FM Deviation 0 10 600 Calculate
Agilent/HP 8644B FM Deviation 0 10 600 Calculate
Other SignalGenerato rDCFM Calibrated for±1V
FM Deviation 0 10 Rin Calculate
Other User VCOSource
Estimated within afactor of 2
–10 to+10
See Figure 6-7 onpage 6-10
1 E + 6 Measure
Agilent Technologies E5500 Phase Noise Measurement System 6-9

Absolute Measurement FundamentalsSelecting a Reference
Figure 6-7 Agilent/HP 70420A Voltage Tuning Range Limits Relative to CenterVoltage of the VCO Tuning Curve.
6-10 Agilent Technologies E5500 Phase Noise Measurement System

Absolute Measurement FundamentalsEstimating the Tuning Constant
ds
enu.
Estimating the Tuning Constant
The VCO tuning constant is the tuning sensitivity of the VCO source inHz/V. The required accuracy of the entered tuning constant value depenon the VCO tuning constant calibration method specified for themeasurement. The calibration method is selected in the Calibr Process mThe following chart lists the calibration method choices and the tuningconstant accuracy required for each.
Table 6-2 VCO Tuning Constant Calibration Method
VCO Tuning Constant CalibrationMethod (selected in calibrationscreen)
Required Tuning ConstantAccuracy (entered in parameterscreen)
Use the current tuning constant(must be accurate from a previousmeasurement of the same source).
Within a factor of 2 of actual value.(Enter 1 E + 6 for InputResistance.)
Measure the VCO tuning constant Within a factor of 2 of actual value.(Enter 1 E + 6 for InputResistance.)
Calculate from expected T. Constant Exact, within 5% of actual.(Also requires that entered InputResistance value is accurate.)
Agilent Technologies E5500 Phase Noise Measurement System 6-11

Absolute Measurement FundamentalsTracking Frequency Drift
ing
he
thetem
ugh
e
thevethe
ee
set
Tracking Frequency Drift
The system’s frequency drift tracking capability for the phase lock loopmeasurement is directly related to the tuning range of the VCO source beused. The system’s drift tracking range is approximately 24% of the peaktuning range (PTR) of the VCO.
PTR= VCO Tuning Constant X Voltage Tuning Range
This is the frequency range within which the beatnote signal created by tAgilent/HP 70420A phase detector must remain throughout themeasurement period. In addition, the beatnote signal must remain withinsystem’s Capture Range (5% of the PTR) during the time it takes the systo calibrate and lock the phase lock loop.
The stability of the beatnote is a function of the combined frequencystability of the sources being used for the measurement. If beatnote driftprevents the beatnote from remaining within the Capture Range long enofor the system to attain phase lock, the computer will inform you bydisplaying a message. If the beatnote drifts beyond the drift tracking rangduring the measurement, the computer will stop the measurement andinform you that the system has lost lock.
Evaluating BeatnoteDrift
The Checking the Beatnote section included in each phase lock loopmeasurement example in this chapter provides a procedure for adjustingbeatnote to within the Capture Range set for the measurement. If you hanot done so already, verify that the beatnote signal can be tuned to withinCapture Range and that it will remain within the range.
Continue to observe the beatnote and verify that it will not drift beyond thdrift tracking range (24% of the PTR) during the measurement period. Thlength of the measurement period is primarily a function of the frequencyoffset range specified for the measurement (Start to Stop Frequency).
Action
If beatnote drift exceeds the limits of the Capture or drift tracking rangesfor your measurement, the system will not be able to complete themeasurement. You have two possible alternatives.
1. Minimize beatnote drift.
• By Allowing sources to warm-up sufficiently.• By Selecting a different reference source with less drift.
2. Increase the capture and drift tracking Ranges.
6-12 Agilent Technologies E5500 Phase Noise Measurement System
Absolute Measurement FundamentalsTracking Frequency Drift
drift
• By Selecting a measurement example in this chapter that specifies arate compatible with the beatnote drift rate you have observed.By Increasing the peak tuning range for the measurement. (Furtherinformation about increasing the PTR is provided in Changing the PTR.)
Agilent Technologies E5500 Phase Noise Measurement System 6-13

Absolute Measurement FundamentalsChanging the PTR
t bye
this
t
nic.g
Changing the PTR
The peak tuning range (PTR) for the phase lock loop measurement is sethe tune range entered for the VCO and the VCO’s tuning constant. (If thcalibration technique is set to measure the VCO tuning constant, themeasured value will be used to determine the system’s PTR.)
PTR= VCO Tuning Constant X Voltage Tuning Range
From the PTR, the phase noise software derives the capture and drifttracking Ranges for the measurement. These ranges set the frequencystability requirements for the sources being used.
The PTR also determines the phase lock loop (PLL) bandwidth for themeasurement. An important attribute of the PLL bandwidth is that itsuppresses the close-in noise which would otherwise prevent the systemfrom locking the loop.
The TuningQualifications
Changing the PTR is accomplished by changing the tune range of VCOvalue or the VCO tuning constant value or both. There are several wayscan be done. However, when considering these or any other options forchanging the PTR, it is important to remember that the VCO source musalways meet the following tuning qualifications.
• The tuning response of the VCO source must always remain monoto• The VCO source’s output level must remain constant across its tunin
range.
6-14 Agilent Technologies E5500 Phase Noise Measurement System

Absolute Measurement FundamentalsChanging the PTR
tell
he
for
the
ut
t
ly
e
n
C)
s anthe
As long as these qualifications are met, and the software does not indicaany difficulty in establishing its calibration criteria, an increase in PTR winot degrade the system’s measurement accuracy.
The following methods may be considered for increasing or decreasing tPTR.
Voltage-Controlled-Oscillators
1. Select a different VCO source that has the tuning capabilities neededthe measurement.
2. Increase the tune range of the VCO source.
CAUTION Be careful not to exceed the input voltage limitations of the Tune Port onVCO source.
NOTE Increasing the tune range of the VCO is only valid as long as the VCOsource is able to continuously meet the previously mentioned tuningqualifications.
Signal Generators
1. If you are using a signal generator with a calibrated 1 Vpk DC FM Inp(such as the Agilent/HP 8640B, 8642A/B, 8656B, or 8662/3), theVoltage tuning Range can be increased to 10 V as long as you selecComputed from the expected T. Constant in the Calibration Processdisplay. These signal generators continue to meet all of the previousmentioned tuning qualifications across a 10V tuning range.
2. Increase the signal generator’s frequency deviation setting and set thsoftware to measure the new tuning constant or enter the increaseddeviation if it is known. (Note that increasing the deviation setting ofteincreases the source’s noise level as well.)
3. If you are using a synthesizer with Electronic-Frequency-Control (EFcapability such as the Agilent/HP 8662A or Agilent/HP 8663A, it ispossible to increase the tuning range of these sources using a VCO aexternal time base. When a compatible VCO source is connected toEXT INPUT on the Agilent/HP 8662/3, the tuning capability of theVCO source is transferred to the synthesizer.
Agilent Technologies E5500 Phase Noise Measurement System 6-15

Absolute Measurement FundamentalsMinimizing Injection Locking
ghted
se
ise
ent
the
CO
re
e
0ionthe
Minimizing Injection Locking
Injection locking occurs when a signal feeds back into an oscillator throuits output path. This can cause the oscillator to become locked to the injecsignal rather than to the reference signal for the phase locked loop.
Injection locking is possible whenever the buffering at the output of anoscillator is not sufficient to prevent a signal from entering. If the injectionlocking occurs at an offset frequency that is not well within the PLLbandwidth set for the measurement, it can cause the system to lose phalock.
Adding Isolation The best way to prevent injection locking is to isolate the output of thesource being injection locked (typically the unit-under-test) by increasingthe buffering at its output. This can be accomplished by inserting a low noamplifier and/or an attenuator between the output of the source beinginjection locked and the Agilent/HP 70420A. (For information ondetermining the effect that the amplifier noise will have on the measuremnoise floor, refer to Inserting a Device in this section.)
Increasing the PLLBandwidth
If the injection locking bandwidth is less or equal to the PLL bandwidth, imay be possible to increase the PLL bandwidth sufficiently to complete tmeasurement. The PLL bandwidth is increased by increasing the peaktuning range (PTR) for the measurement.
NOTE The PTR for the measurement is set by the tuning characteristics of the Vsource you are using. Notice inFigure 6-8 on page 6-17that increasing thePLL bandwidth can require a substantially larger increase in the PTR. Foinformation on the limitations of increasing the PTR, refer to Changing thPTR in this section.
To estimate the PTR needed to prevent injection locking from causing thsystem to lose lock:
1. Determine the injection locking bandwidth. Tune the beatnote towardHz using the procedure described in the Checking the Beatnote sectof each phase lock loop measurement example in this chapter. Wheninjection locking occurs, the beatnote will disappear. The injectionlocking bandwidth is the frequency of the beatnote just prior to wherethe injection locking occurs as the beatnote is tuned toward 0 Hz.
6-16 Agilent Technologies E5500 Phase Noise Measurement System
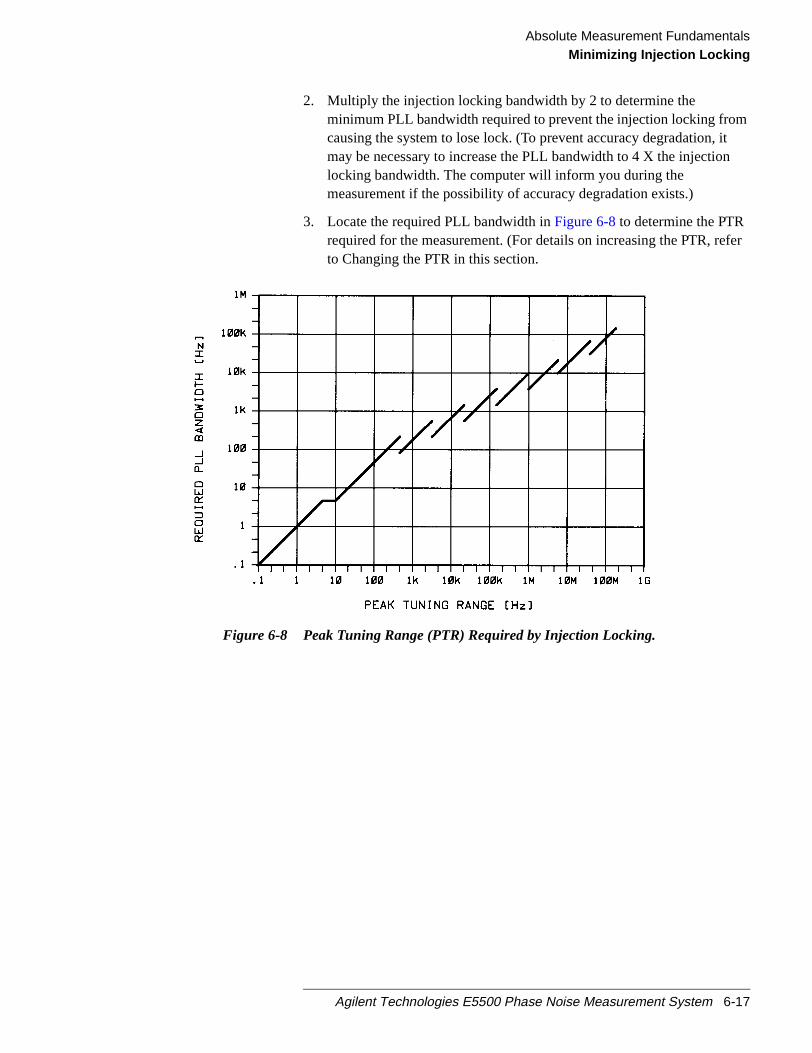
Absolute Measurement FundamentalsMinimizing Injection Locking
fer
2. Multiply the injection locking bandwidth by 2 to determine theminimum PLL bandwidth required to prevent the injection locking fromcausing the system to lose lock. (To prevent accuracy degradation, itmay be necessary to increase the PLL bandwidth to 4 X the injectionlocking bandwidth. The computer will inform you during themeasurement if the possibility of accuracy degradation exists.)
3. Locate the required PLL bandwidth inFigure 6-8to determine the PTRrequired for the measurement. (For details on increasing the PTR, reto Changing the PTR in this section.
Figure 6-8 Peak Tuning Range (PTR) Required by Injection Locking.
Agilent Technologies E5500 Phase Noise Measurement System 6-17

Absolute Measurement FundamentalsInserting a Device
ple,
or is
t
nd
ed
oise
Inserting a Device
An Attenuator You may find that some of your measurement setups require an in-linedevice such as an attenuator in one of the signal source paths. (For examyou may find it necessary to insert an attenuator at the output of aunit-under-test (UUT) to prevent it from being injection locked to thereference source.) The primary consideration when inserting an attenuatthat the signal source has sufficient output amplitude to maintain therequired signal level at the Agilent/HP 70420A’s phase detector input por(as shown inFigure 6-9). The signal level required for the measurementdepends on the noise floor level needed to measure the UUT.
Figure 6-9shows the relationship between the signal level at the R port athe measurement noise floor.
Figure 6-9 Measurement Noise Floor Relative to R Port Signal Level.
An Amplifier If a source is not able to provide a sufficient output level, or if additionalisolation is needed at the output, it may be necessary to insert a lowphase-noise RF amplifier at the output of the source.
Note, however, that the noise of the inserted amplifier will also be summinto the measured noise level along with the noise of the source.
The Agilent/HP 70427A Option K22 dual RF amplifier was designedspecifically for this purpose. This instrument is the preferred solution fortests requiring an external amplifier.
The following equation can be used to estimate what the measurement nfloor is as a result of the added noise of an inserted amplifier:
6-18 Agilent Technologies E5500 Phase Noise Measurement System

Absolute Measurement FundamentalsInserting a Device
L(f) out = -174 dB + Amplifier Noise Figure - Power into Amplifier - 3dB
For Example,
Figure 6-10 Measurement Noise Floor as a Result of an added Attenuator
Agilent Technologies E5500 Phase Noise Measurement System 6-19
Absolute Measurement FundamentalsEvaluating Noise Above the Small Angle Line
, it
LLsing
dyed
(Ifse
t
ndn the
ut
Evaluating Noise Above the Small Angle Line
If the average noise level on the input signals exceeds approximately 0.1radians RMS integrated outside of the Phase Lock Loop (PLL) bandwidthcan prevent the system from attaining phase lock.
The following procedure allows you to evaluate the beatnote createdbetween the two sources being measured. The intent is to verify that the Pbandwidth is adequate to prevent the noise on the two sources from cauthe system to lose lock.
If the computer is displaying the hardware Connect Diagram you are reato begin this procedure. (If it is not, begin a New Measurement and proceuntil the hardware Connect Diagram appears on the display.)
Determining the PhaseLock Loop Bandwidth
1. Determine the Peak Tuning Range (PTR) of your VCO by multiplyingthe VCO Tuning Constant by the Tune Range of VCO value entered.the phase noise software has measured the VCO Tuning Constant, uthe measured value.)
For Example,
2. Estimate the Phase Lock Loop (PLL) bandwidth for the measuremenusing the PTR of your VCO and the graph inFigure 6-11 on page 6-21.
Observing the Beatnote
If the beatnote frequency is below XXX kHz it will appear on theAgilent/HP E4411A RF analyzer’s display in both the frequency domain athe time domain. If the beatnote does not appear on the RF analyzer, thebeatnote is either greater than XXX kHz or it does not exist.
If incrementing the frequency of one of the sources does not produce abeatnote within XXX kHz, you will need to verify the presence of an outpsignal from each source before proceeding.
TuningVoltageXConstantTuningVCOPTR ====
kHzVXVHz
PTR 110100 ========
6-20 Agilent Technologies E5500 Phase Noise Measurement System
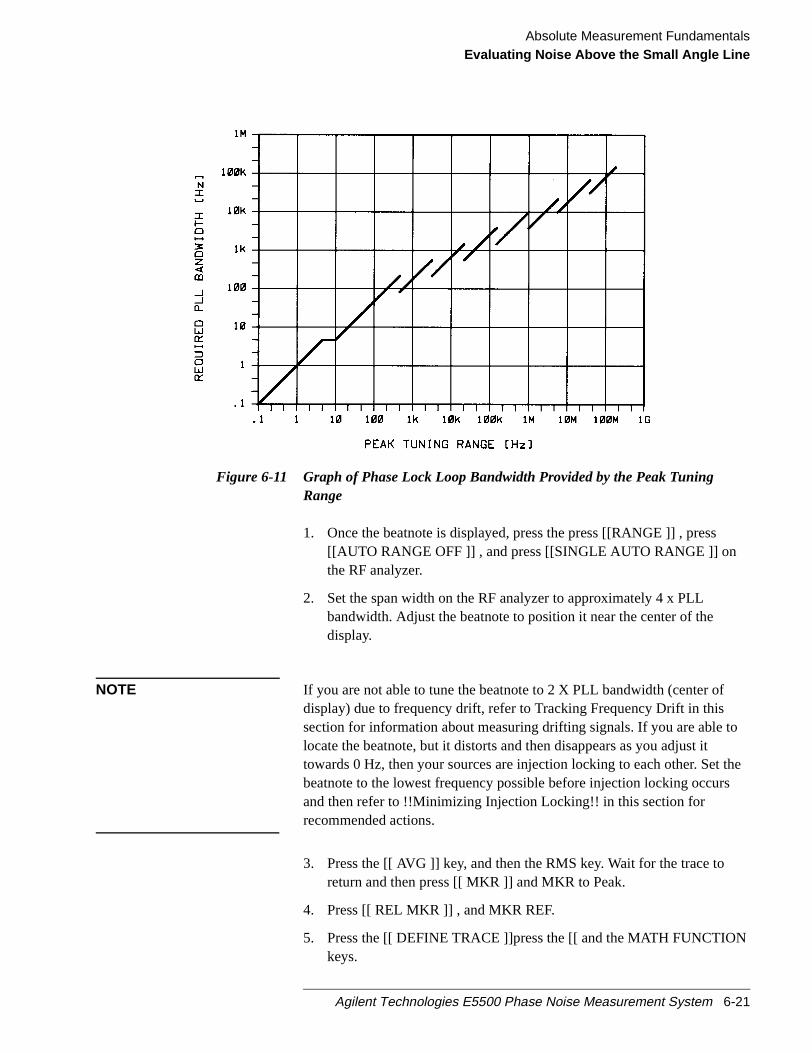
Absolute Measurement FundamentalsEvaluating Noise Above the Small Angle Line
the
Figure 6-11 Graph of Phase Lock Loop Bandwidth Provided by the Peak TuningRange
1. Once the beatnote is displayed, press the press [[RANGE ]] , press[[AUTO RANGE OFF ]] , and press [[SINGLE AUTO RANGE ]] onthe RF analyzer.
2. Set the span width on the RF analyzer to approximately 4 x PLLbandwidth. Adjust the beatnote to position it near the center of thedisplay.
NOTE If you are not able to tune the beatnote to 2 X PLL bandwidth (center ofdisplay) due to frequency drift, refer to Tracking Frequency Drift in thissection for information about measuring drifting signals. If you are able tolocate the beatnote, but it distorts and then disappears as you adjust ittowards 0 Hz, then your sources are injection locking to each other. Setbeatnote to the lowest frequency possible before injection locking occursand then refer to !!Minimizing Injection Locking!! in this section forrecommended actions.
3. Press the [[ AVG ]] key, and then the RMS key. Wait for the trace toreturn and then press [[ MKR ]] and MKR to Peak.
4. Press [[ REL MKR ]] , and MKR REF.
5. Press the [[ DEFINE TRACE ]]press the [[ and the MATH FUNCTIONkeys.
Agilent Technologies E5500 Phase Noise Measurement System 6-21
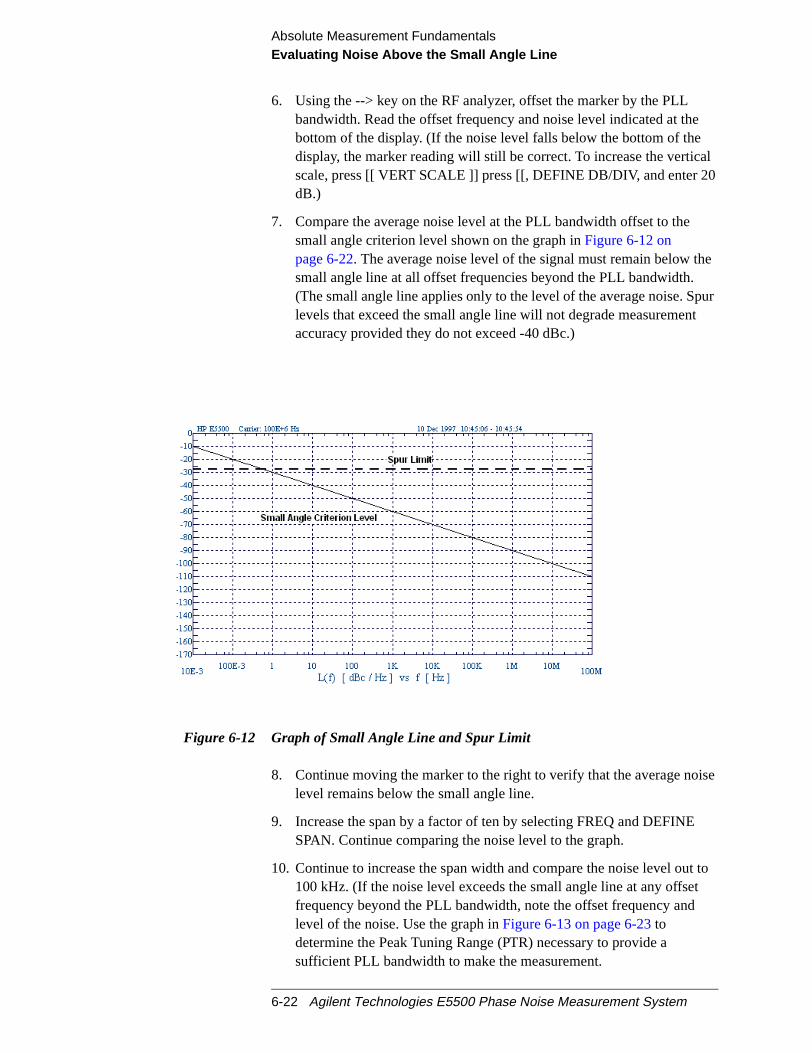
Absolute Measurement FundamentalsEvaluating Noise Above the Small Angle Line
al0
e
purt
ise
t to
6. Using the --> key on the RF analyzer, offset the marker by the PLLbandwidth. Read the offset frequency and noise level indicated at thebottom of the display. (If the noise level falls below the bottom of thedisplay, the marker reading will still be correct. To increase the verticscale, press [[ VERT SCALE ]] press [[, DEFINE DB/DIV, and enter 2dB.)
7. Compare the average noise level at the PLL bandwidth offset to thesmall angle criterion level shown on the graph inFigure 6-12 onpage 6-22. The average noise level of the signal must remain below thsmall angle line at all offset frequencies beyond the PLL bandwidth.(The small angle line applies only to the level of the average noise. Slevels that exceed the small angle line will not degrade measuremenaccuracy provided they do not exceed -40 dBc.)
Figure 6-12 Graph of Small Angle Line and Spur Limit
8. Continue moving the marker to the right to verify that the average nolevel remains below the small angle line.
9. Increase the span by a factor of ten by selecting FREQ and DEFINESPAN. Continue comparing the noise level to the graph.
10. Continue to increase the span width and compare the noise level ou100 kHz. (If the noise level exceeds the small angle line at any offsetfrequency beyond the PLL bandwidth, note the offset frequency andlevel of the noise. Use the graph inFigure 6-13 on page 6-23todetermine the Peak Tuning Range (PTR) necessary to provide asufficient PLL bandwidth to make the measurement.
6-22 Agilent Technologies E5500 Phase Noise Measurement System
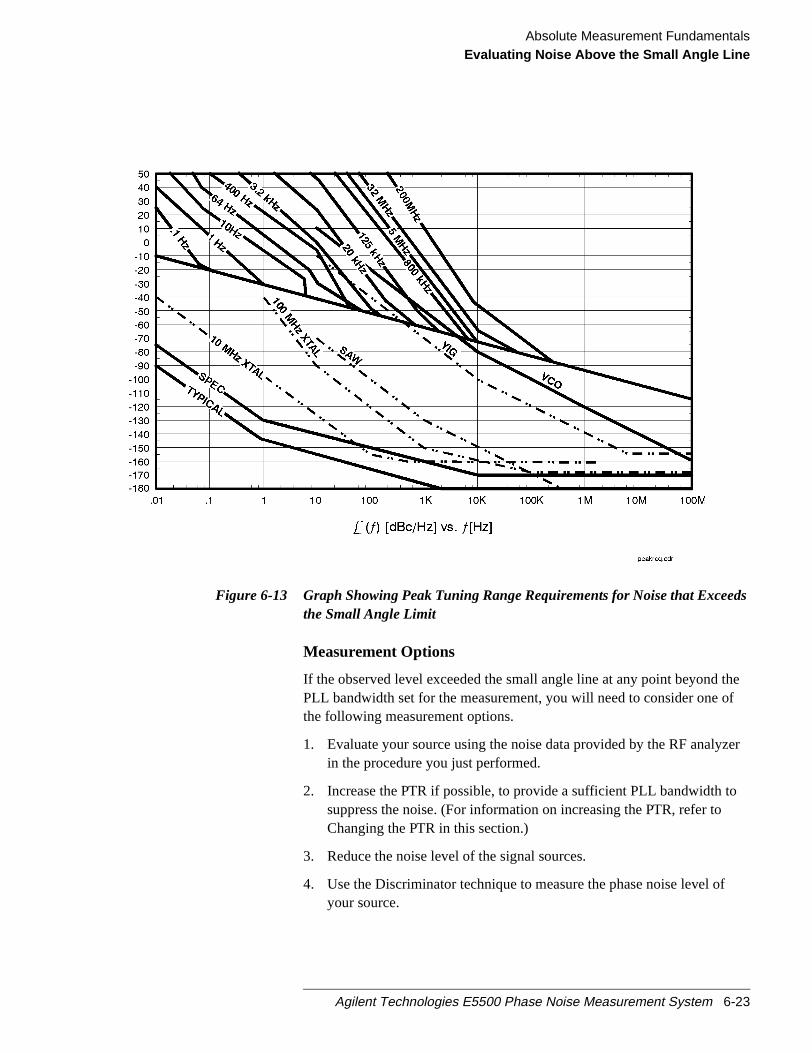
Absolute Measurement FundamentalsEvaluating Noise Above the Small Angle Line
ds
hef
zer
Figure 6-13 Graph Showing Peak Tuning Range Requirements for Noise that Exceethe Small Angle Limit
Measurement Options
If the observed level exceeded the small angle line at any point beyond tPLL bandwidth set for the measurement, you will need to consider one othe following measurement options.
1. Evaluate your source using the noise data provided by the RF analyin the procedure you just performed.
2. Increase the PTR if possible, to provide a sufficient PLL bandwidth tosuppress the noise. (For information on increasing the PTR, refer toChanging the PTR in this section.)
3. Reduce the noise level of the signal sources.
4. Use the Discriminator technique to measure the phase noise level ofyour source.
Agilent Technologies E5500 Phase Noise Measurement System 6-23
7 Absolute Measurement Examples
What You’ll Find in This Chapter
• Measurement Examples
Stable RF Oscillator, page 7-2 (StableRF.pnm)
Free-Running RF Oscillator, page 7-24 (FreeRF.pnm)
RF Synthesizer using DCFM, page 7-48 (RFSynth_DCFM.pnm)
RF Synthesizer using EFC, page 7-72 (RFSynth_EFC.pnm)
Microwave Source, page 7-97 (MicroSRC.pnm)
CAUTION To prevent damage to the Agilent/HP 70420A test set’s hardwarecomponents, the input signalmust notbe applied to the signal inputconnector until the input attenuator has been correctly set for the desiredconfiguration, as show inTable 7-3 on page 7-9. Apply the input signalwhen theConnection Diagramappears.
Agilent Technologies E5500 Phase Noise Measurement System 7-1
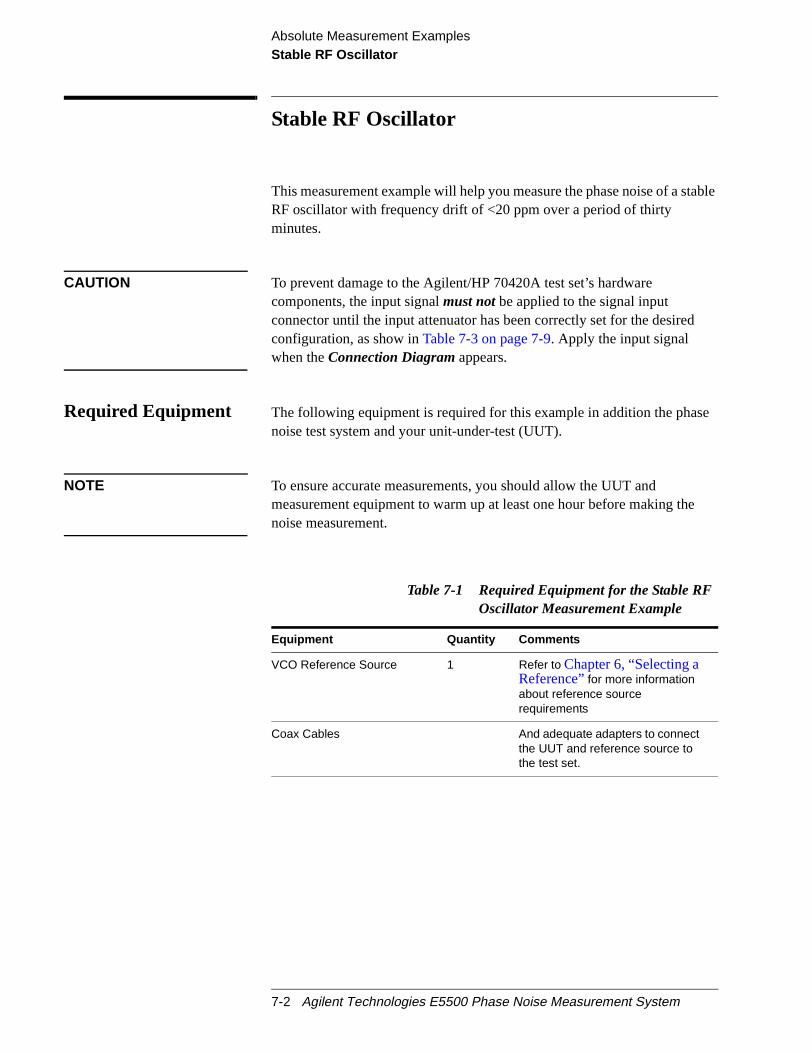
Absolute Measurement ExamplesStable RF Oscillator
table
e
e
Stable RF Oscillator
This measurement example will help you measure the phase noise of a sRF oscillator with frequency drift of <20 ppm over a period of thirtyminutes.
CAUTION To prevent damage to the Agilent/HP 70420A test set’s hardwarecomponents, the input signalmust notbe applied to the signal inputconnector until the input attenuator has been correctly set for the desiredconfiguration, as show inTable 7-3 on page 7-9. Apply the input signalwhen theConnection Diagramappears.
Required Equipment The following equipment is required for this example in addition the phasnoise test system and your unit-under-test (UUT).
NOTE To ensure accurate measurements, you should allow the UUT andmeasurement equipment to warm up at least one hour before making thnoise measurement.
Table 7-1 Required Equipment for the Stable RFOscillator Measurement Example
Equipment Quantity Comments
VCO Reference Source 1 Refer to Chapter 6, “Selecting aReference”for more informationabout reference sourcerequirements
Coax Cables And adequate adapters to connectthe UUT and reference source tothe test set.
7-2 Agilent Technologies E5500 Phase Noise Measurement System
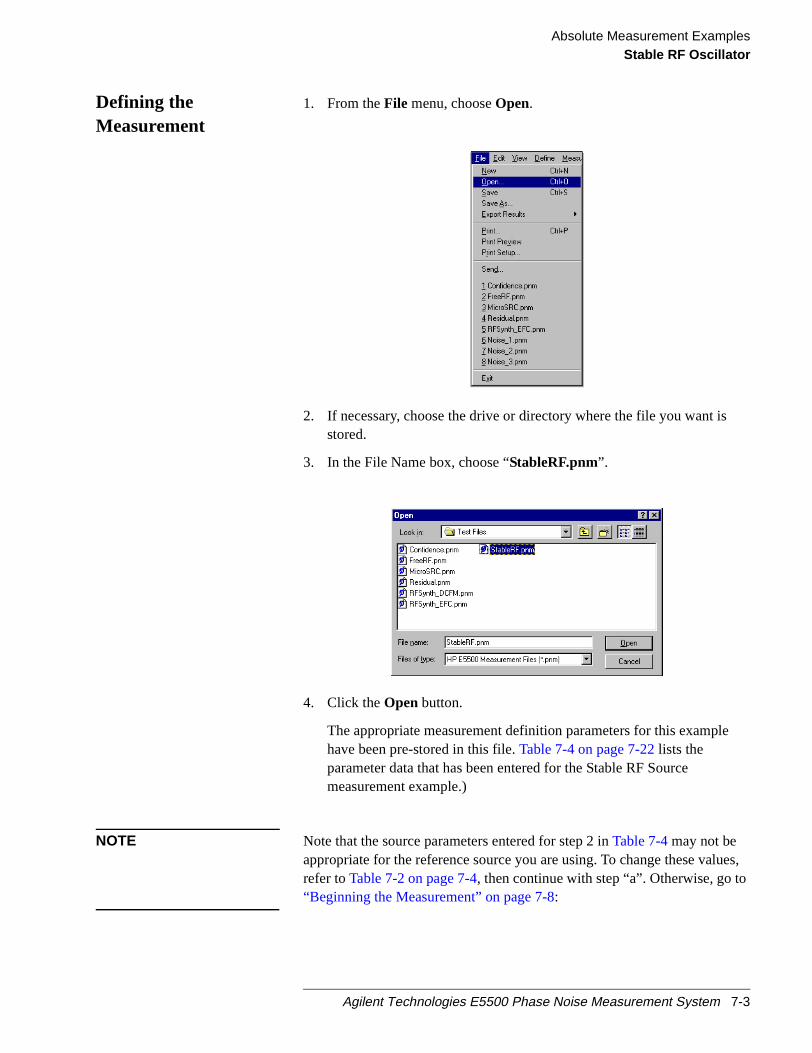
Absolute Measurement ExamplesStable RF Oscillator
es,
Defining theMeasurement
1. From theFile menu, chooseOpen.
2. If necessary, choose the drive or directory where the file you want isstored.
3. In the File Name box, choose “StableRF.pnm”.
4. Click theOpen button.
The appropriate measurement definition parameters for this examplehave been pre-stored in this file.Table 7-4 on page 7-22lists theparameter data that has been entered for the Stable RF Sourcemeasurement example.)
NOTE Note that the source parameters entered for step 2 inTable 7-4may not beappropriate for the reference source you are using. To change these valurefer toTable 7-2 on page 7-4, then continue with step “a”. Otherwise, go to“Beginning the Measurement” on page 7-8:
Agilent Technologies E5500 Phase Noise Measurement System 7-3

Absolute Measurement ExamplesStable RF Oscillator
a. From theDefine menu, chooseMeasurement;then choose theSourcestab from theDefine Measurementwindow.
b. Enter the carrier (center) frequency of your UUT (5 MHz to 1.6GHz). Enter the same frequency for the detector input frequency.
c. Enter the VCO (Nominal) Tuning Constant (seeTable 7-2).
d. Enter the Tune Range of VCO (seeTable 7-2).
e. Enter the Center Voltage of VCO (seeTable 7-2).
f. Enter the Input Resistance of VCO (seeTable 7-2).
Table 7-2 Tuning Characteristics for Various Sources
VCO SourceCarrierFreq.
Tuning Constant(Hz/V)
CenterVoltage
(V)
Voltage TuningRange (± V)
InputResistance
(Ω)
TuningCalibration
Method
Agilent/HP 8662/3AEFCDCFM
υ0 5 E – 9 xυ0FM Deviation
00
1010
1E + 61 K (8662)600 (8663)
MeasureComputeCompute
Agilent/HP 8642A/B FM Deviation 0 10 600 Compute
7-4 Agilent Technologies E5500 Phase Noise Measurement System

Absolute Measurement ExamplesStable RF Oscillator
Selecting a ReferenceSource
1. From theDefine menu, chooseMeasurement;then choose theBlockDiagram tab from theDefine Measurementwindow.
2. From theReference Sourcepull-down list, selectyour source.
3. When you have completed these operations, click theClosebutton.
Agilent/HP 8644B FM Deviation 0 10 600 Compute
Other SignalGenerato rDCFM Calibrated for±1V
FM Deviation 0 10 Rin Compute
Other User VCOSource
Estimated within afactor of 2
–10 to+10
1 E + 6 Measure
VCO SourceCarrierFreq.
Tuning Constant(Hz/V)
CenterVoltage
(V)
Voltage TuningRange (± V)
InputResistance
(Ω)
TuningCalibration
Method
Agilent Technologies E5500 Phase Noise Measurement System 7-5

Absolute Measurement ExamplesStable RF Oscillator
toow
Selecting LoopSuppressionVerification
1. From theDefine menu, chooseMeasurement;then choose theCal tabfrom theDefine Measurementwindow.
2. In theCal dialog box, checkVerify calculated phase locked loopsuppressionandAlways Show Suppression Graph. SelectIf limit isexceeded: Show Loop Suppression Graph.
3. When you have completed these operations, click theClosebutton.
Setup Considerationsfor the Stable RFOscillatorMeasurement
Measurement Noise Floor
The signal amplitude at the R input (Signal Input) port on the Agilent/HP70420A sets the measurement noise floor level. Use the following graphdetermine the amplitude required to provide a noise floor level that is belthe expected noise floor of your UUT. (The Checking the Beatnoteprocedure in this section will provide you with an opportunity to estimatethe measurement noise floor that your UUT will provide.)
7-6 Agilent Technologies E5500 Phase Noise Measurement System

Absolute Measurement ExamplesStable RF Oscillator
tefier
Figure 7-1 Noise Floor for the Stable RF Oscillator Measurement
Figure 7-2 Noise Floor Example
If the output amplitude of your UUT is not sufficient to provide an adequameasurement noise floor, it will be necessary to insert a low-noise amplibetween the UUT and the test set. Refer to “Inserting an Device” in
Agilent Technologies E5500 Phase Noise Measurement System 7-7
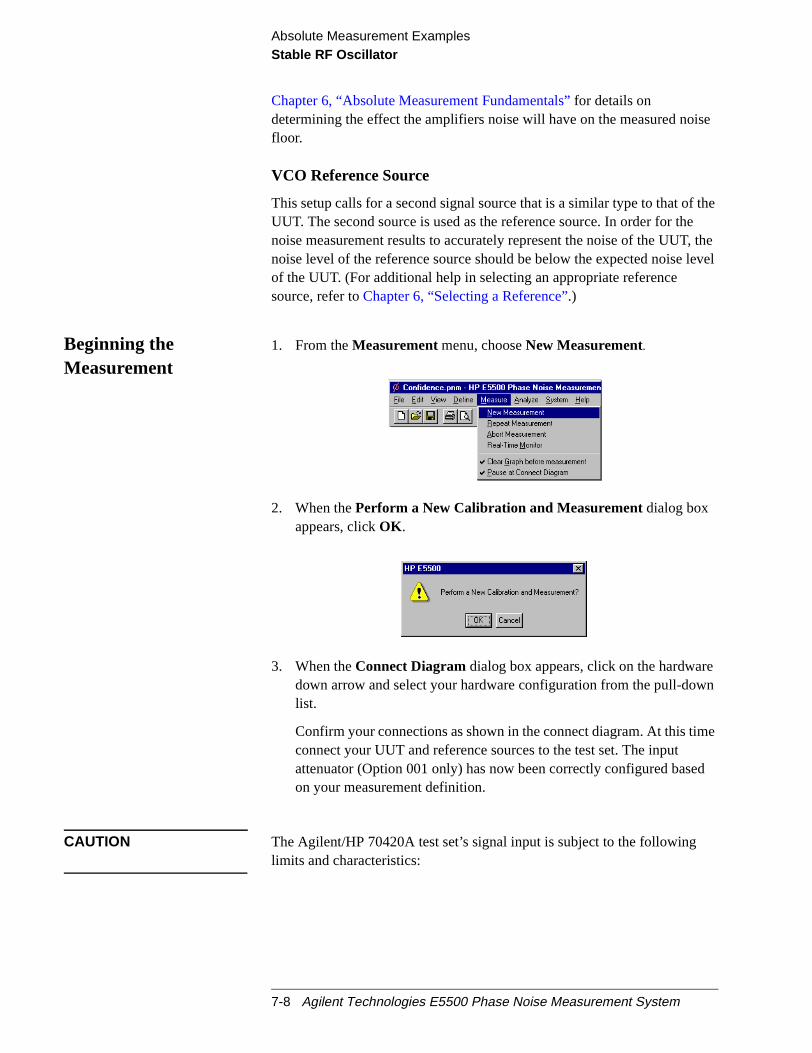
Absolute Measurement ExamplesStable RF Oscillator
ise
thee, theevel
n
e
d
Chapter 6, “Absolute Measurement Fundamentals”for details ondetermining the effect the amplifiers noise will have on the measured nofloor.
VCO Reference Source
This setup calls for a second signal source that is a similar type to that ofUUT. The second source is used as the reference source. In order for thnoise measurement results to accurately represent the noise of the UUTnoise level of the reference source should be below the expected noise lof the UUT. (For additional help in selecting an appropriate referencesource, refer toChapter 6, “Selecting a Reference”.)
Beginning theMeasurement
1. From theMeasurementmenu, chooseNew Measurement.
2. When thePerform a New Calibration and Measurementdialog boxappears, clickOK .
3. When theConnect Diagramdialog box appears, click on the hardwaredown arrow and select your hardware configuration from the pull-dowlist.
Confirm your connections as shown in the connect diagram. At this timconnect your UUT and reference sources to the test set. The inputattenuator (Option 001 only) has now been correctly configured baseon your measurement definition.
CAUTION The Agilent/HP 70420A test set’s signal input is subject to the followinglimits and characteristics:
7-8 Agilent Technologies E5500 Phase Noise Measurement System

Absolute Measurement ExamplesStable RF Oscillator
Table 7-3 Agilent/HP 70420A Test Set Signal Input Limits and Characteristics
Limits
Frequency 50 kHz to 1.6 GHz (Std)50 kHz to 26.5 GHz (Option 001)50 kHz to 26.5 GHz (Option 201)
Maximum Signal Input Power Sum of the reference and signal inputpower shall not exceed +23 dBm
At Attenuator Output, Operating LevelRange:
• RF Phase Detectors 0 to +23 dBm (Signal Input)+15 to +23 dBm (Reference Input)
• Microwave Phase Detectors 0 to +5 dBm (Signal Input)+7 to +10 dBm (Reference Input)
• Internal AM Detector 0 to +20 dBm
• Downconverters:
Agilent/HP 70422A 0 to +30 dBm
Agilent/HP 70427A +5 to +15 dBm
CAUTION:
To prevent damage to the Agilent/HP 70420A test set’s hardware components,the input signal must not be applied to the test set’s signal input connector untilthe input attenuator (Option 001) has been correctly set by the phase noisesoftware, which will occur at the connection diagram.
Characteristics:
Input Impedance 50 ohm Nominal
AM Noise dc coupled to 50 ohm load
Agilent Technologies E5500 Phase Noise Measurement System 7-9
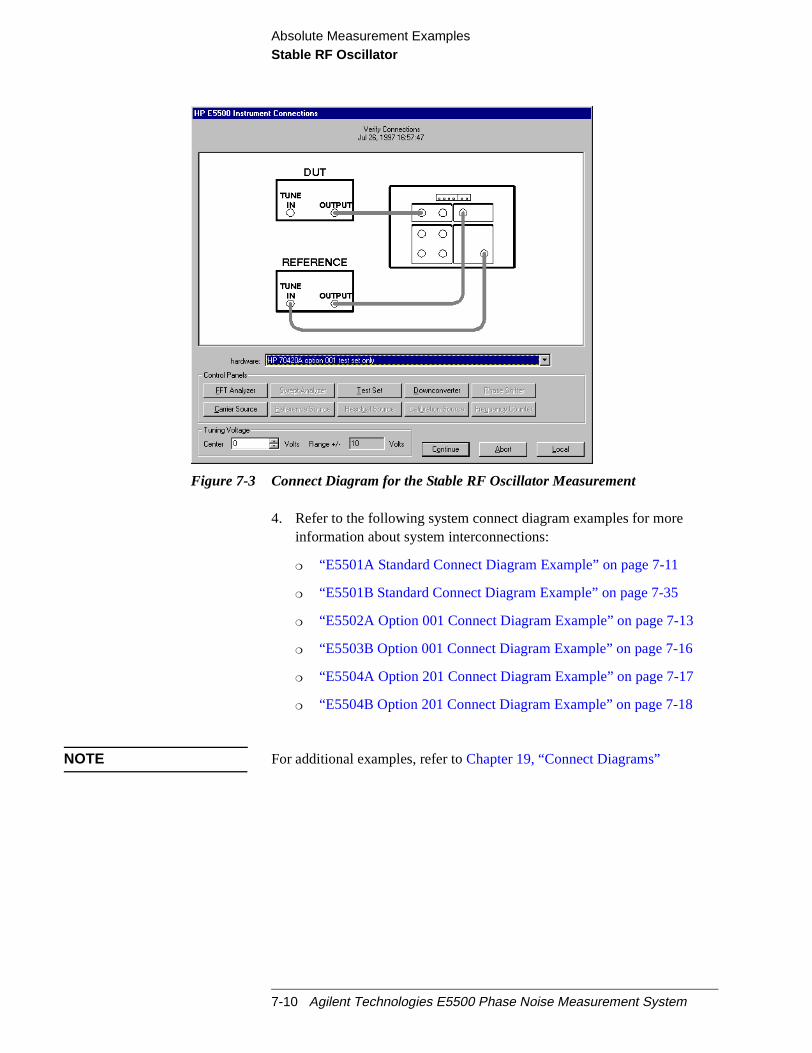
Absolute Measurement ExamplesStable RF Oscillator
Figure 7-3 Connect Diagram for the Stable RF Oscillator Measurement
4. Refer to the following system connect diagram examples for moreinformation about system interconnections:
“E5501A Standard Connect Diagram Example” on page 7-11
“E5501B Standard Connect Diagram Example” on page 7-35
“E5502A Option 001 Connect Diagram Example” on page 7-13
“E5503B Option 001 Connect Diagram Example” on page 7-16
“E5504A Option 201 Connect Diagram Example” on page 7-17
“E5504B Option 201 Connect Diagram Example” on page 7-18
NOTE For additional examples, refer toChapter 19, “Connect Diagrams”
7-10 Agilent Technologies E5500 Phase Noise Measurement System

Absolute Measurement ExamplesStable RF Oscillator
E5501A Standard Connect Diagram Example
Agilent Technologies E5500 Phase Noise Measurement System 7-11

Absolute Measurement ExamplesStable RF Oscillator
E5501B Standard Connect Diagram Example
7-12 Agilent Technologies E5500 Phase Noise Measurement System

Absolute Measurement ExamplesStable RF Oscillator
E5502A Option 001 Connect Diagram Example
Agilent Technologies E5500 Phase Noise Measurement System 7-13

Absolute Measurement ExamplesStable RF Oscillator
E5502B Option 001 Connect Diagram Example
7-14 Agilent Technologies E5500 Phase Noise Measurement System

Absolute Measurement ExamplesStable RF Oscillator
E5503A Option 001 Connect Diagram Example
Agilent Technologies E5500 Phase Noise Measurement System 7-15

Absolute Measurement ExamplesStable RF Oscillator
E5503B Option 001 Connect Diagram Example
7-16 Agilent Technologies E5500 Phase Noise Measurement System

Absolute Measurement ExamplesStable RF Oscillator
E5504A Option 201 Connect Diagram Example
Agilent Technologies E5500 Phase Noise Measurement System 7-17

Absolute Measurement ExamplesStable RF Oscillator
E5504B Option 201 Connect Diagram Example
7-18 Agilent Technologies E5500 Phase Noise Measurement System

Absolute Measurement ExamplesStable RF Oscillator
r ace
intem.
ofbe
the
its
en
cyuntil
ch
Checking the Beatnote While the connect diagram is still displayed, recommend that you use anoscilloscope (connected to the Monitor port on the Agilent/HP 70420A) ocounter to check the beatnote being created between the reference sourand your device-under-test. The objective of checking the beatnote is toensure that the center frequencies of the two sources are close enoughfrequency to create a beatnote that is within the capture range of the sys
The phase lock loop (PLL) capture range is 5% of the peak tuning rangethe VCO source you are using. (The peak tuning range for your VCO canestimated by multiplying the VCO tuning constant by the tune range ofVCO. Refer toChapter 15, “Evaluating Your Measurement Results”if youare not familiar with the relationship between the PLL capture range andpeak tuning range of the VCO.)
NOTE If the center frequencies of the sources are not close enough to create abeatnote within the capture range, the system will not be able to completemeasurement.
The beatnote frequency is set by the relative frequency difference betwethe two sources. If you have two very accurate sources set at the samefrequency, the resulting beatnote will be very close to 0 Hz.
Searching for the beatnote will require that you adjust the center frequenof one of the sources above and below the frequency of the other sourcethe beatnote appears on the oscilloscope’s display.
If incrementing the frequency of one of the sources does not produce abeatnote, you will need to verify the presence of an output signal from easource before proceeding.
Agilent Technologies E5500 Phase Noise Measurement System 7-19
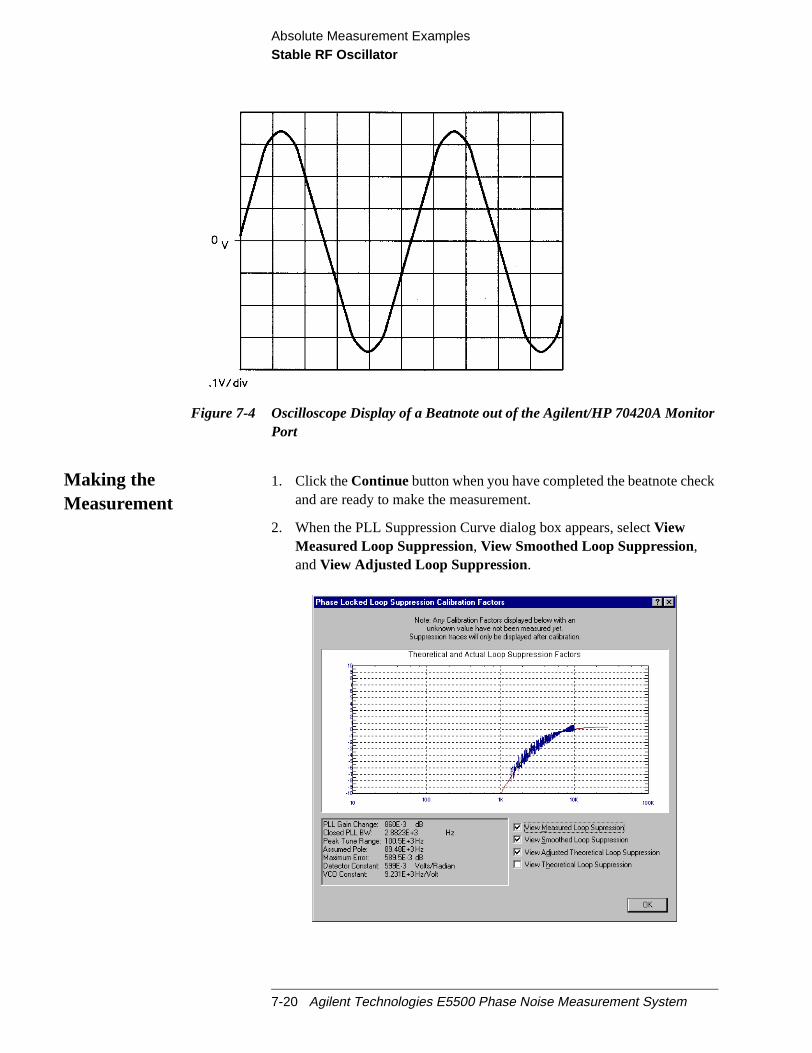
Absolute Measurement ExamplesStable RF Oscillator
r
ck
Figure 7-4 Oscilloscope Display of a Beatnote out of the Agilent/HP 70420A MonitoPort
Making theMeasurement
1. Click theContinue button when you have completed the beatnote cheand are ready to make the measurement.
2. When the PLL Suppression Curve dialog box appears, selectViewMeasured Loop Suppression, View Smoothed Loop Suppression,andView Adjusted Loop Suppression.
7-20 Agilent Technologies E5500 Phase Noise Measurement System

Absolute Measurement ExamplesStable RF Oscillator
the
for
d”on
the
There are four different curves available for the this graph (for moreinformation about loop suppression verification, refer toChapter 16,“Advanced Software Features”):
a. “Measured” loop suppression curve - this is the result of the loopsuppression measurement performed by the E5500 system;
b. “Smoothed” measured suppression curve - this is a curve-fitrepresentation of the measured results, it is used to compare with“theoretical” loop suppression;
c. “Theoretical” suppression curve - this is the predicted loopsuppression based on the initial loop parameters defined/selectedthis particular measurement (kphi, kvco, loop bandwidth, filters,gain, etc).
d. “Adjusted” theoretical suppression curve - this is the new “adjustetheoretical value of suppression for this measurement - it is basedchanging loop parameters (in the theoretical response) to match“smoothed” measured curve as closely as possible;
When the measurement is complete, refer toChapter 15, “Evaluating YourMeasurement Results”for help in evaluating your measurement results.
Figure 7-5 on page 7-21shows a typical phase noise curve for a stable RFOscillator.
Figure 7-5 Typical Phase Noise Curve for a Stable RF Oscillator.
Agilent Technologies E5500 Phase Noise Measurement System 7-21
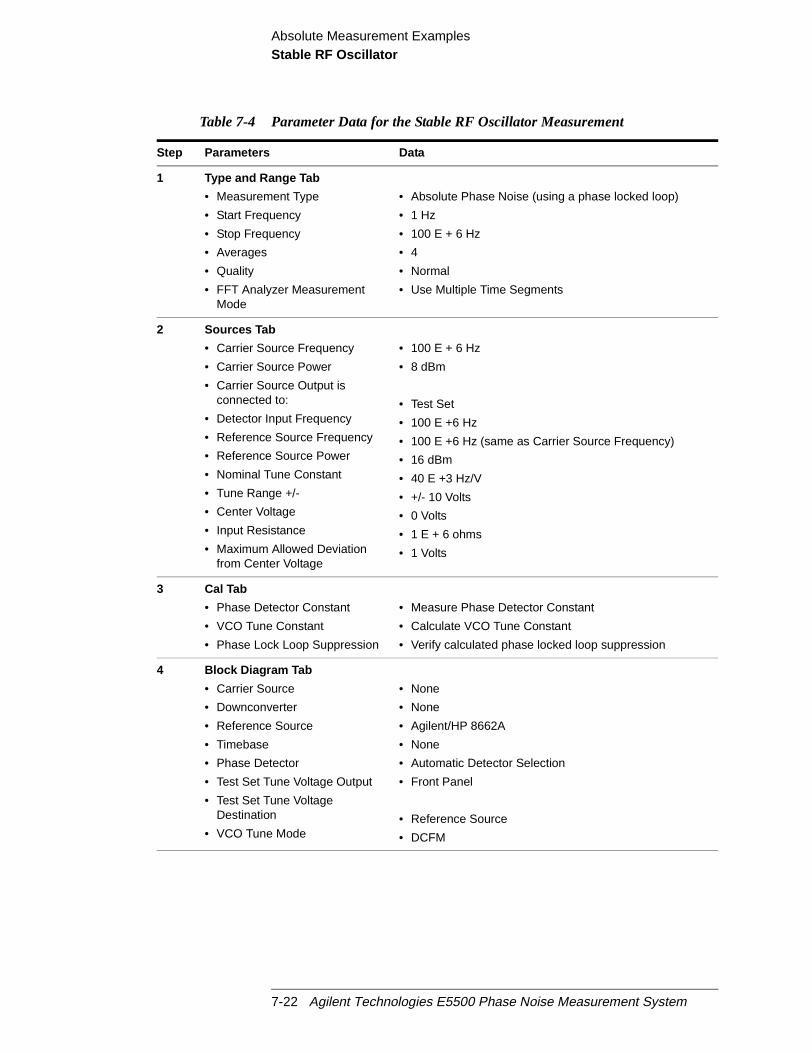
Absolute Measurement ExamplesStable RF Oscillator
Table 7-4 Parameter Data for the Stable RF Oscillator Measurement
Step Parameters Data
1 Type and Range Tab
• Measurement Type
• Start Frequency
• Stop Frequency
• Averages
• Quality
• FFT Analyzer MeasurementMode
• Absolute Phase Noise (using a phase locked loop)
• 1 Hz
• 100 E + 6 Hz
• 4
• Normal
• Use Multiple Time Segments
2 Sources Tab
• Carrier Source Frequency
• Carrier Source Power
• Carrier Source Output isconnected to:
• Detector Input Frequency
• Reference Source Frequency
• Reference Source Power
• Nominal Tune Constant
• Tune Range +/-
• Center Voltage
• Input Resistance
• Maximum Allowed Deviationfrom Center Voltage
• 100 E + 6 Hz
• 8 dBm
• Test Set
• 100 E +6 Hz
• 100 E +6 Hz (same as Carrier Source Frequency)
• 16 dBm
• 40 E +3 Hz/V
• +/- 10 Volts
• 0 Volts
• 1 E + 6 ohms
• 1 Volts
3 Cal Tab
• Phase Detector Constant
• VCO Tune Constant
• Phase Lock Loop Suppression
• Measure Phase Detector Constant
• Calculate VCO Tune Constant
• Verify calculated phase locked loop suppression
4 Block Diagram Tab
• Carrier Source
• Downconverter
• Reference Source
• Timebase
• Phase Detector
• Test Set Tune Voltage Output
• Test Set Tune VoltageDestination
• VCO Tune Mode
• None
• None
• Agilent/HP 8662A
• None
• Automatic Detector Selection
• Front Panel
• Reference Source
• DCFM
7-22 Agilent Technologies E5500 Phase Noise Measurement System

Absolute Measurement ExamplesStable RF Oscillator
5 Test Set Tab
• Input Attenuation
• LNA Low Pass Filter
• LNA Gain
• Detector Maximum InputLevels
Microwave Phase Detector
RF Phase Detector
AM Detector
• Ignore out-of-lock conditions
• Pulsed Carrier
• DC Block
• Analyzer View
• PLL Integrator Attenuation
• Auto checked
• Auto checked
• Auto Gain
• 0 dBm
• 0 dBm
• 0 dBm
• Not checked
• Not checked
• Not checked
• Baseband
• 0 dBm
6 Downconverter Tab • The downconverter parameters do not apply to thismeasurement example.
7 Graph Tab
• Title
• Graph Type
• X Scale Minimum
• X Scale Maximum
• Y Scale Minimum
• Y Scale Maximum
• Normalize trace data to a:
• Scale trace data to a newcarrier frequency of:
• Shift trace data DOWN by:
• Trace Smoothing Amount
• Power present at input of DUT
• Stable RF Oscillator vs Similar Reference Source
• Single-sideband Noise
• 1 Hz
• 10 E + 6 Hz
• 0 dBc/Hz
• - 170 dBc/Hz
• 1 Hz bandwidth
• 1 times the current carrier frequency
• 0 dB
• 0
• 0 dB
Table 7-4 Parameter Data for the Stable RF Oscillator Measurement
Step Parameters Data
Agilent Technologies E5500 Phase Noise Measurement System 7-23
Absolute Measurement ExamplesFree-Running RF Oscillator
e
e
Free-Running RF Oscillator
This measurement example will help you measure the phase noise of afree-running RF oscillator with frequency drift >20 ppm over a period ofthirty minutes.
CAUTION To prevent damage to the Agilent/HP 70420A test set’s hardwarecomponents, the input signalmust notbe applied to the signal inputconnector until the input attenuator has been correctly set for the desiredconfiguration, as show inTable 7-7 on page 7-31. Apply the input signalwhen theConnection Diagramappears.
Required Equipment The following equipment is required for this example in addition the phasnoise test system and your unit-under-test (UUT).
NOTE To ensure accurate measurements, you should allow the UUT andmeasurement equipment to warm up at least one hour before making thnoise measurement.
Table 7-5 Required Equipment for theFree-Running RF OscillatorMeasurement Example
Equipment Quantity Comments
Agilent/HP 8644B 1 Refer to the “Chapter 6,“Selecting a Reference”formore information about referencesource requirements
Coax Cables And adequate adapters to connectthe UUT and reference source tothe test set.
7-24 Agilent Technologies E5500 Phase Noise Measurement System
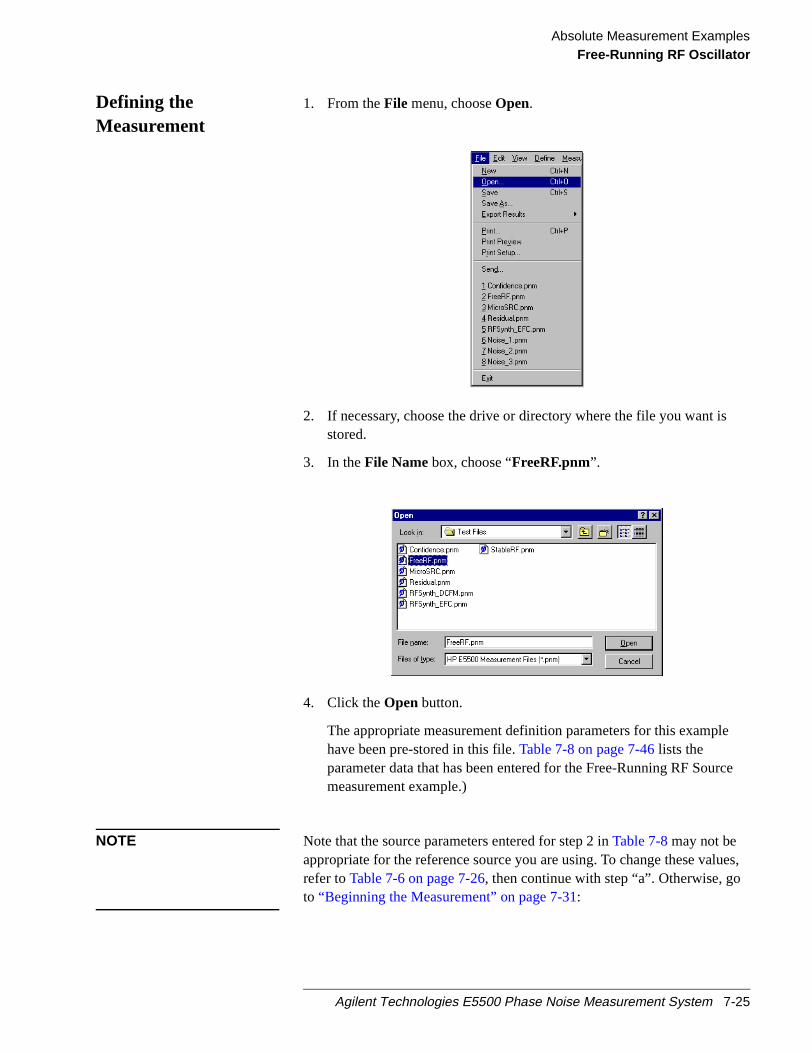
Absolute Measurement ExamplesFree-Running RF Oscillator
ce
es,
Defining theMeasurement
1. From theFile menu, chooseOpen.
2. If necessary, choose the drive or directory where the file you want isstored.
3. In theFile Namebox, choose “FreeRF.pnm”.
4. Click theOpen button.
The appropriate measurement definition parameters for this examplehave been pre-stored in this file.Table 7-8 on page 7-46lists theparameter data that has been entered for the Free-Running RF Sourmeasurement example.)
NOTE Note that the source parameters entered for step 2 inTable 7-8may not beappropriate for the reference source you are using. To change these valurefer toTable 7-6 on page 7-26, then continue with step “a”. Otherwise, goto “Beginning the Measurement” on page 7-31:
Agilent Technologies E5500 Phase Noise Measurement System 7-25

Absolute Measurement ExamplesFree-Running RF Oscillator
a. From theDefine menu, chooseMeasurement;then choose theSourcestab from theDefine Measurementwindow.
b. Enter the carrier (center) frequency of your UUT(5 MHz to1.6 GHz). Enter the same frequency for the detector inputfrequency.
c. Enter the VCO (Nominal) Tuning Constant (seeTable 7-6).
d. Enter the Tune Range of VCO (seeTable 7-6).
e. Enter the Center Voltage of VCO (seeTable 7-6).
f. Enter the Input Resistance of VCO (seeTable 7-6).
Table 7-6 Tuning Characteristics for Various Sources
VCO SourceCarrierFreq.
Tuning Constant(Hz/V)
CenterVoltage
(V)
Voltage TuningRange (± V)
InputResistance
(Ω)
TuningCalibration
Method
Agilent/HP 8662/3AEFCDCFM
υ0 5 E – 9 xυ0FM Deviation
00
1010
1E + 61 K (8662)600 (8663)
MeasureComputeCompute
Agilent/HP 8642A/B FM Deviation 0 10 600 Compute
7-26 Agilent Technologies E5500 Phase Noise Measurement System

Absolute Measurement ExamplesFree-Running RF Oscillator
Selecting a ReferenceSource
1. From theDefine menu, chooseMeasurement;then choose theBlockDiagram tab from theDefine Measurementwindow.
2. From theReference Sourcepull-down list, selectyour source.
3. When you have completed these operations, click theClosebutton.
Agilent/HP 8644B FM Deviation 0 10 600 Compute
Other SignalGenerato rDCFM Calibrated for±1V
FM Deviation 0 10 Rin Compute
Other User VCOSource
Estimated within afactor of 2
–10 to+10
1 E + 6 Measure
VCO SourceCarrierFreq.
Tuning Constant(Hz/V)
CenterVoltage
(V)
Voltage TuningRange (± V)
InputResistance
(Ω)
TuningCalibration
Method
Agilent Technologies E5500 Phase Noise Measurement System 7-27
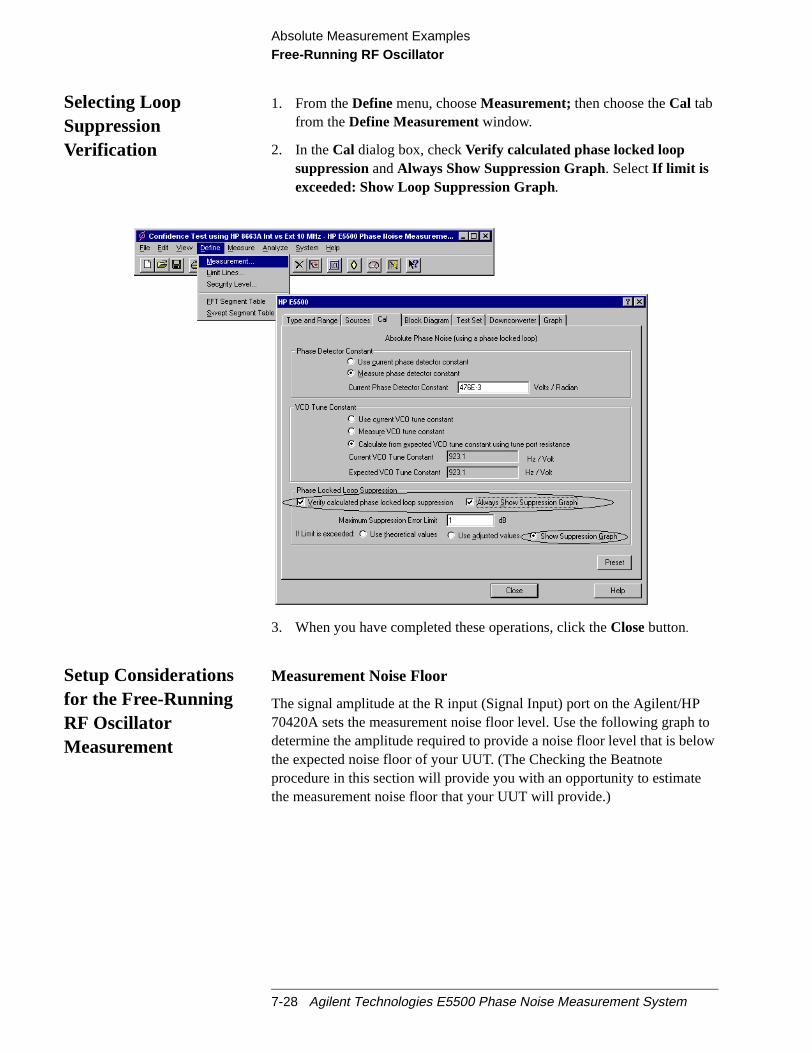
Absolute Measurement ExamplesFree-Running RF Oscillator
toow
Selecting LoopSuppressionVerification
1. From theDefine menu, chooseMeasurement;then choose theCal tabfrom theDefine Measurementwindow.
2. In theCal dialog box, checkVerify calculated phase locked loopsuppressionandAlways Show Suppression Graph. SelectIf limit isexceeded: Show Loop Suppression Graph.
3. When you have completed these operations, click theClosebutton.
Setup Considerationsfor the Free-RunningRF OscillatorMeasurement
Measurement Noise Floor
The signal amplitude at the R input (Signal Input) port on the Agilent/HP70420A sets the measurement noise floor level. Use the following graphdetermine the amplitude required to provide a noise floor level that is belthe expected noise floor of your UUT. (The Checking the Beatnoteprocedure in this section will provide you with an opportunity to estimatethe measurement noise floor that your UUT will provide.)
7-28 Agilent Technologies E5500 Phase Noise Measurement System
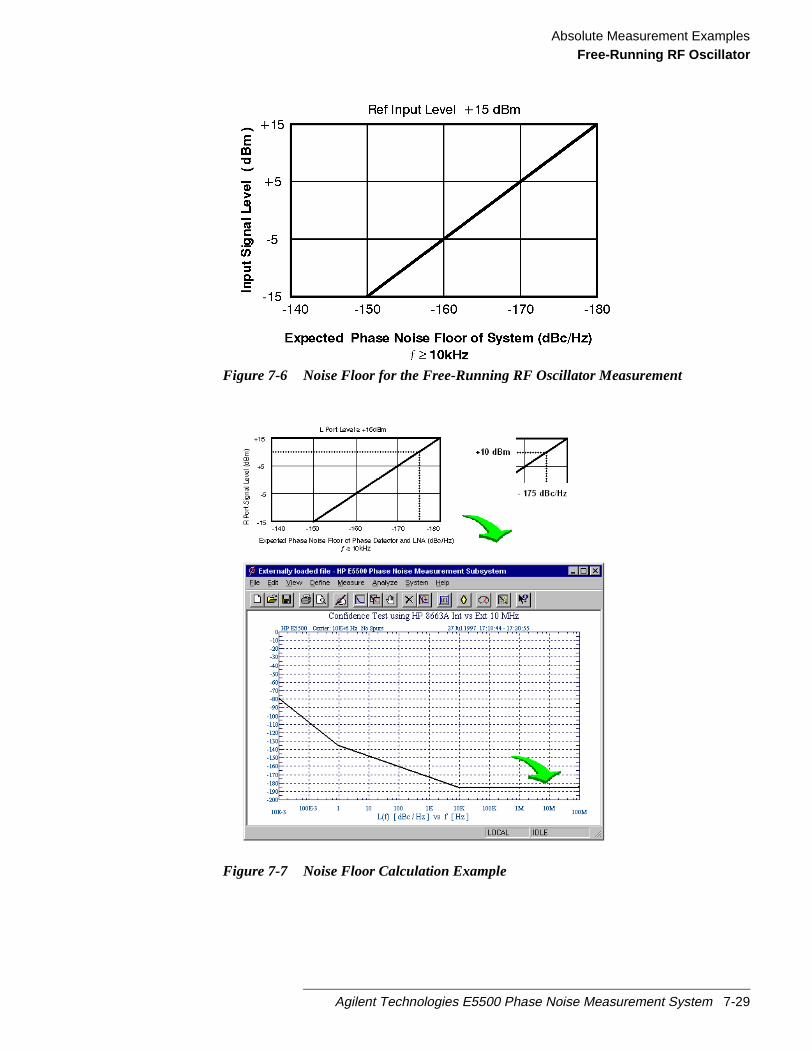
Absolute Measurement ExamplesFree-Running RF Oscillator
Figure 7-6 Noise Floor for the Free-Running RF Oscillator Measurement
Figure 7-7 Noise Floor Calculation Example
Agilent Technologies E5500 Phase Noise Measurement System 7-29

Absolute Measurement ExamplesFree-Running RF Oscillator
tefier
ise
oise
If the output amplitude of your UUT is not sufficient to provide an adequameasurement noise floor, it will be necessary to insert a low-noise amplibetween the UUT and the test set. Refer to “Inserting an Device” inChapter 6, “Absolute Measurement Fundamentals”for details ondetermining the effect the amplifiers noise will have on the measured nofloor.
VCO Reference
In order for the noise measurement results to accurately represent the nof the UUT, the noise level of the reference source should be below theexpected noise level of the UUT.
7-30 Agilent Technologies E5500 Phase Noise Measurement System
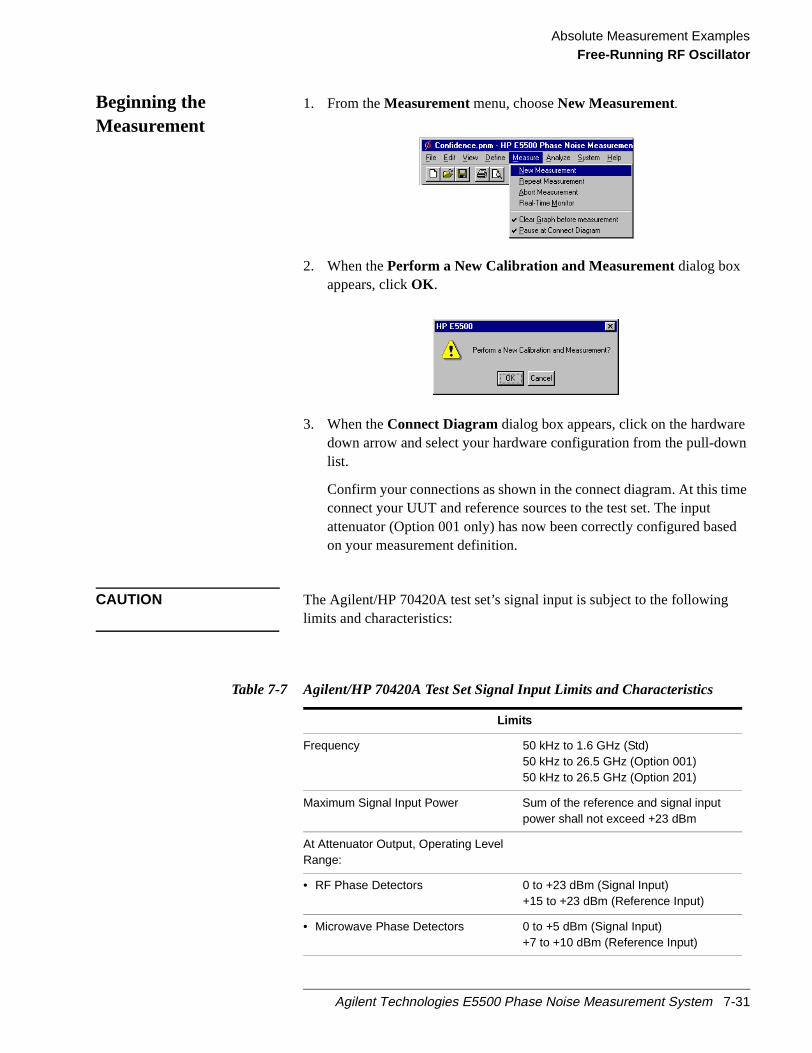
Absolute Measurement ExamplesFree-Running RF Oscillator
n
e
d
Beginning theMeasurement
1. From theMeasurementmenu, chooseNew Measurement.
2. When thePerform a New Calibration and Measurementdialog boxappears, clickOK .
3. When theConnect Diagramdialog box appears, click on the hardwaredown arrow and select your hardware configuration from the pull-dowlist.
Confirm your connections as shown in the connect diagram. At this timconnect your UUT and reference sources to the test set. The inputattenuator (Option 001 only) has now been correctly configured baseon your measurement definition.
CAUTION The Agilent/HP 70420A test set’s signal input is subject to the followinglimits and characteristics:
Table 7-7 Agilent/HP 70420A Test Set Signal Input Limits and Characteristics
Limits
Frequency 50 kHz to 1.6 GHz (Std)50 kHz to 26.5 GHz (Option 001)50 kHz to 26.5 GHz (Option 201)
Maximum Signal Input Power Sum of the reference and signal inputpower shall not exceed +23 dBm
At Attenuator Output, Operating LevelRange:
• RF Phase Detectors 0 to +23 dBm (Signal Input)+15 to +23 dBm (Reference Input)
• Microwave Phase Detectors 0 to +5 dBm (Signal Input)+7 to +10 dBm (Reference Input)
Agilent Technologies E5500 Phase Noise Measurement System 7-31

Absolute Measurement ExamplesFree-Running RF Oscillator
Figure 7-8 Connect Diagram for the Free-Running RF Oscillator Measurement
4. Refer to the following system connect diagram examples for moreinformation about system interconnections:
“E5501A Standard Connect Diagram Example” on page 7-34
“E5501B Standard Connect Diagram Example” on page 7-35
• Internal AM Detector 0 to +20 dBm
• Downconverters:
Agilent/HP 70422A 0 to +30 dBm
Agilent/HP 70427A +5 to +15 dBm
CAUTION:
To prevent damage to the Agilent/HP 70420A test set’s hardware components,the input signal must not be applied to the test set’s signal input connector untilthe input attenuator (Option 001) has been correctly set by the phase noisesoftware, which will occur at the connection diagram.
Characteristics:
Input Impedance 50 ohm Nominal
AM Noise dc coupled to 50 ohm load
Table 7-7 Agilent/HP 70420A Test Set Signal Input Limits and Characteristics
7-32 Agilent Technologies E5500 Phase Noise Measurement System

Absolute Measurement ExamplesFree-Running RF Oscillator
“E5502A Option 001 Connect Diagram Example” on page 7-36
“E5503B Option 001 Connect Diagram Example” on page 7-39
“E5504A Option 201 Connect Diagram Example” on page 7-40
“E5504B Option 201 Connect Diagram Example” on page 7-41
NOTE For additional examples, refer toChapter 19, “Connect Diagrams”
Agilent Technologies E5500 Phase Noise Measurement System 7-33

Absolute Measurement ExamplesFree-Running RF Oscillator
E5501A Standard Connect Diagram Example
7-34 Agilent Technologies E5500 Phase Noise Measurement System
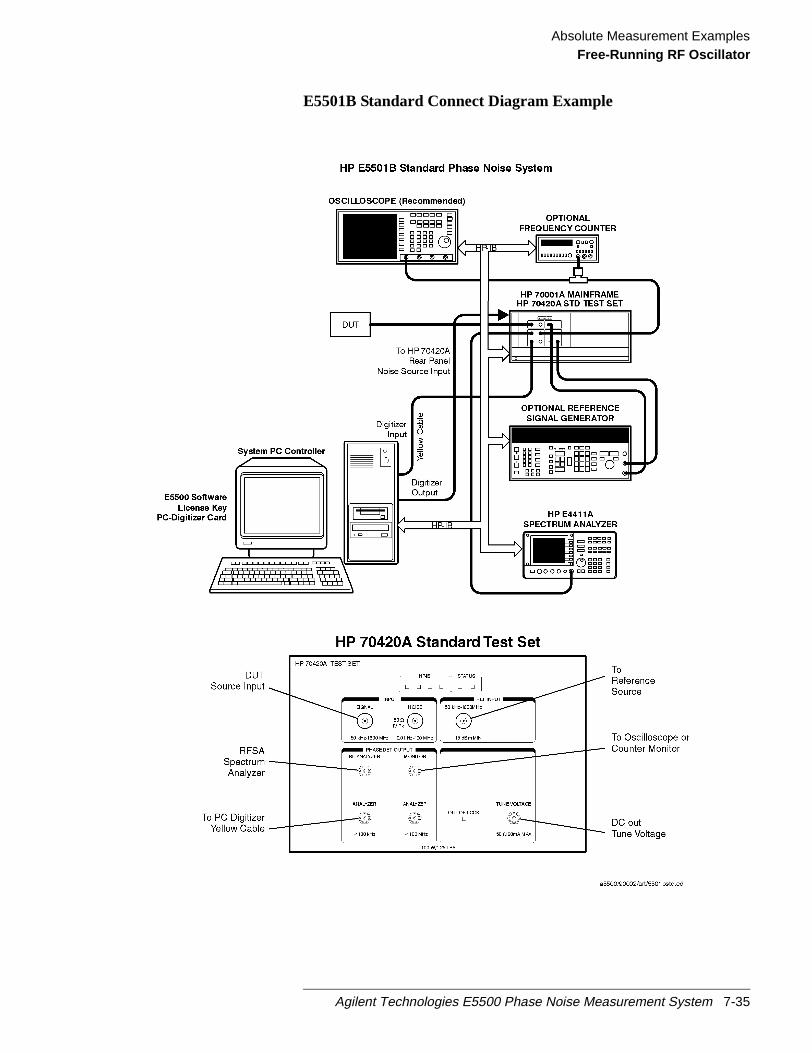
Absolute Measurement ExamplesFree-Running RF Oscillator
E5501B Standard Connect Diagram Example
Agilent Technologies E5500 Phase Noise Measurement System 7-35

Absolute Measurement ExamplesFree-Running RF Oscillator
E5502A Option 001 Connect Diagram Example
7-36 Agilent Technologies E5500 Phase Noise Measurement System

Absolute Measurement ExamplesFree-Running RF Oscillator
E5502B Option 001 Connect Diagram Example
Agilent Technologies E5500 Phase Noise Measurement System 7-37

Absolute Measurement ExamplesFree-Running RF Oscillator
E5503A Option 001 Connect Diagram Example
7-38 Agilent Technologies E5500 Phase Noise Measurement System

Absolute Measurement ExamplesFree-Running RF Oscillator
E5503B Option 001 Connect Diagram Example
Agilent Technologies E5500 Phase Noise Measurement System 7-39

Absolute Measurement ExamplesFree-Running RF Oscillator
E5504A Option 201 Connect Diagram Example
7-40 Agilent Technologies E5500 Phase Noise Measurement System

Absolute Measurement ExamplesFree-Running RF Oscillator
E5504B Option 201 Connect Diagram Example
Agilent Technologies E5500 Phase Noise Measurement System 7-41

Absolute Measurement ExamplesFree-Running RF Oscillator
r ace
intem.
ofbe
the
its
en
cyuntil
ch
Checking the Beatnote While the connect diagram is still displayed, recommend that you use anoscilloscope (connected to the Monitor port on the Agilent/HP 70420A) ocounter to check the beatnote being created between the reference sourand your device-under-test. The objective of checking the beatnote is toensure that the center frequencies of the two sources are close enoughfrequency to create a beatnote that is within the capture range of the sys
The phase lock loop (PLL) capture range is 5% of the peak tuning rangethe VCO source you are using. (The peak tuning range for your VCO canestimated by multiplying the VCO tuning constant by the tune range ofVCO. Refer toChapter 15, “Evaluating Your Measurement Results”if youare not familiar with the relationship between the PLL capture range andpeak tuning range of the VCO.)
NOTE If the center frequencies of the sources are not close enough to create abeatnote within the capture range, the system will not be able to completemeasurement.
The beatnote frequency is set by the relative frequency difference betwethe two sources. If you have two very accurate sources set at the samefrequency, the resulting beatnote will be very close to 0 Hz.
Searching for the beatnote will require that you adjust the center frequenof one of the sources above and below the frequency of the other sourcethe beatnote appears on the oscilloscope’s display.
If incrementing the frequency of one of the sources does not produce abeatnote, you will need to verify the presence of an output signal from easource before proceeding.
7-42 Agilent Technologies E5500 Phase Noise Measurement System
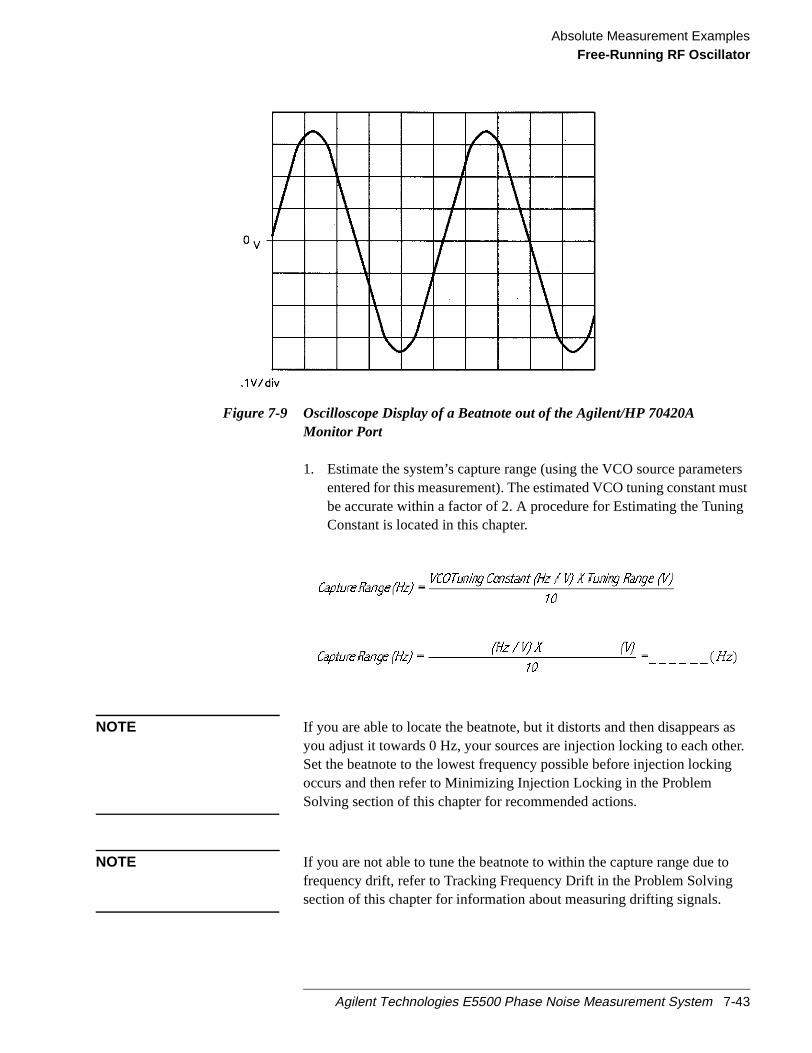
Absolute Measurement ExamplesFree-Running RF Oscillator
tersustg
aser.g
Figure 7-9 Oscilloscope Display of a Beatnote out of the Agilent/HP 70420AMonitor Port
1. Estimate the system’s capture range (using the VCO source parameentered for this measurement). The estimated VCO tuning constant mbe accurate within a factor of 2. A procedure for Estimating the TuninConstant is located in this chapter.
NOTE If you are able to locate the beatnote, but it distorts and then disappearsyou adjust it towards 0 Hz, your sources are injection locking to each othSet the beatnote to the lowest frequency possible before injection lockinoccurs and then refer to Minimizing Injection Locking in the ProblemSolving section of this chapter for recommended actions.
NOTE If you are not able to tune the beatnote to within the capture range due tofrequency drift, refer to Tracking Frequency Drift in the Problem Solvingsection of this chapter for information about measuring drifting signals.
Agilent Technologies E5500 Phase Noise Measurement System 7-43

Absolute Measurement ExamplesFree-Running RF Oscillator
ck
the
for
d”on
the
Making theMeasurement
1. Click theContinue button when you have completed the beatnote cheand are ready to make the measurement.
2. When the PLL Suppression Curve dialog box appears, selectViewMeasured Loop Suppression, View Smoothed Loop Suppression,andView Adjusted Loop Suppression.
There are four different curves available for the this graph (for moreinformation about loop suppression verification, refer toChapter 16,“Advanced Software Features”):
a. “Measured” loop suppression curve - this is the result of the loopsuppression measurement performed by the E5500 system;
b. “Smoothed” measured suppression curve - this is a curve-fitrepresentation of the measured results, it is used to compare with“theoretical” loop suppression;
c. “Theoretical” suppression curve - this is the predicted loopsuppression based on the initial loop parameters defined/selectedthis particular measurement (kphi, kvco, loop bandwidth, filters,gain, etc).
d. “Adjusted” theoretical suppression curve - this is the new “adjustetheoretical value of suppression for this measurement - it is basedchanging loop parameters (in the theoretical response) to match“smoothed” measured curve as closely as possible;
When the measurement is complete, refer toChapter 15, “Evaluating YourMeasurement Results”for help in evaluating your measurement results.
7-44 Agilent Technologies E5500 Phase Noise Measurement System

Absolute Measurement ExamplesFree-Running RF Oscillator
Figure 7-10 on page 7-45shows a typical phase noise curve for afree-running RF Oscillator.
Figure 7-10 Typical Phase Noise Curve for a Free-Running RF Oscillator.
Agilent Technologies E5500 Phase Noise Measurement System 7-45
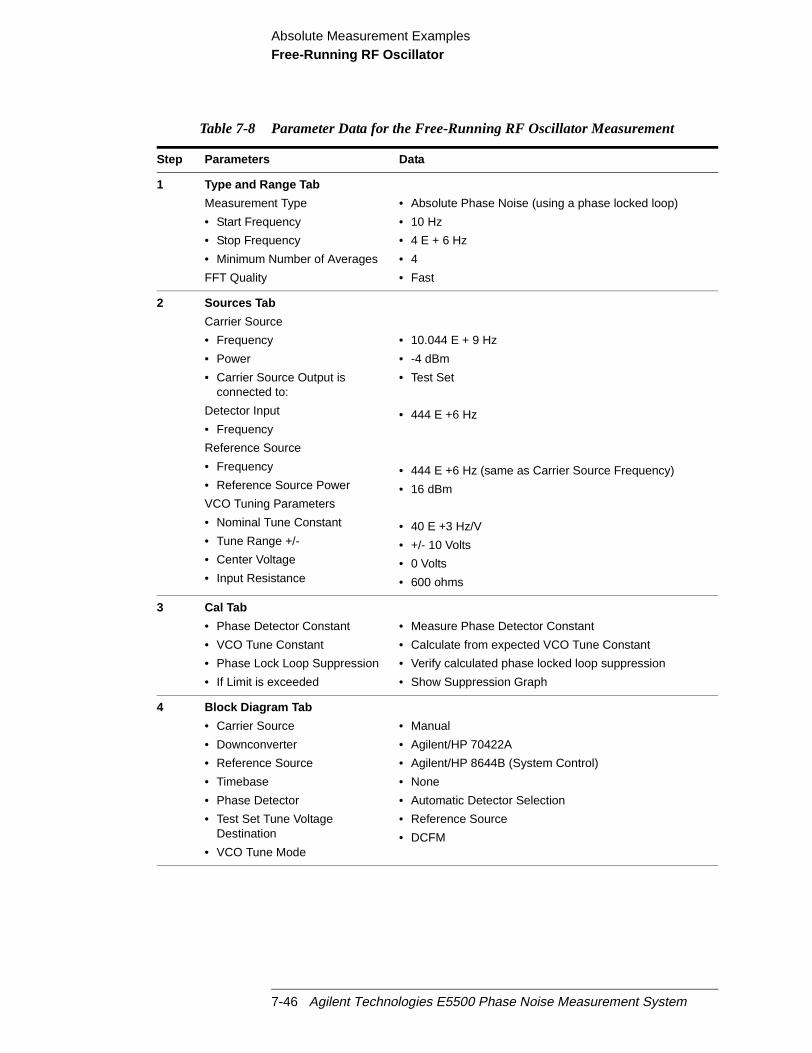
Absolute Measurement ExamplesFree-Running RF Oscillator
Table 7-8 Parameter Data for the Free-Running RF Oscillator Measurement
Step Parameters Data
1 Type and Range Tab
Measurement Type
• Start Frequency
• Stop Frequency
• Minimum Number of Averages
FFT Quality
• Absolute Phase Noise (using a phase locked loop)
• 10 Hz
• 4 E + 6 Hz
• 4
• Fast
2 Sources Tab
Carrier Source
• Frequency
• Power
• Carrier Source Output isconnected to:
Detector Input
• Frequency
Reference Source
• Frequency
• Reference Source Power
VCO Tuning Parameters
• Nominal Tune Constant
• Tune Range +/-
• Center Voltage
• Input Resistance
• 10.044 E + 9 Hz
• -4 dBm
• Test Set
• 444 E +6 Hz
• 444 E +6 Hz (same as Carrier Source Frequency)
• 16 dBm
• 40 E +3 Hz/V
• +/- 10 Volts
• 0 Volts
• 600 ohms
3 Cal Tab
• Phase Detector Constant
• VCO Tune Constant
• Phase Lock Loop Suppression
• If Limit is exceeded
• Measure Phase Detector Constant
• Calculate from expected VCO Tune Constant
• Verify calculated phase locked loop suppression
• Show Suppression Graph
4 Block Diagram Tab
• Carrier Source
• Downconverter
• Reference Source
• Timebase
• Phase Detector
• Test Set Tune VoltageDestination
• VCO Tune Mode
• Manual
• Agilent/HP 70422A
• Agilent/HP 8644B (System Control)
• None
• Automatic Detector Selection
• Reference Source
• DCFM
7-46 Agilent Technologies E5500 Phase Noise Measurement System

Absolute Measurement ExamplesFree-Running RF Oscillator
5 Test Set Tab
Input Attenuation
LNA Low Pass Filter
• LNA Gain
• DC Block
• PLL Integrator Attenuation
• 0 dB
• 20 MHz (Auto checked)
• Auto Gain (Minimum Auto Gain - 14 dB)
• Not checked
• 0 dBm
6 Downconverter Tab
Input Frequency
L.O. Frequency
I.F. Frequency
Millimeter Frequency
L.O. Power
Maximum AM Detector Level
Input Attenuation
I.F. Gain
• Auto
Microwave/Millimeter Band
Millimeter Band Mixer Bias
• Enable
• Current
Reference Chain
• Reference
• External Tune Enable
Tuning Sensitivity
• Nominal
• 100 MHz PLL Bandwidth
• 600 MHz PLL Bandwidth
• 10.044 E + 9
• Auto
• 444 E +6
• 0
• 20 dBM
• 0 dBm
• 0 dB
• 0 dB
• Checked
• Microwave (0 - 26.5 GHz)
• Unchecked
• 0 mA
• 10 MHz
• Unchecked
• 0 ppm/v
• 0 ppm/V
• 126 Hz
• 10000 Hz
7 Graph Tab
• Title
• Graph Type
• X Scale Minimum
• X Scale Maximum
• Y Scale Minimum
• Y Scale Maximum
• Normalize trace data to a:
• Scale trace data to a newcarrier frequency of:
• Shift trace data DOWN by:
• Trace Smoothing Amount
• Power present at input of DUT
• Free Running RF Oscillator vs. 8644B using DCFM
• Single-sideband Noise (dBc/Hz)
• 10 Hz
• 4 E + 6 Hz
• 0 dBc/Hz
• - 170 dBc/Hz
• 1 Hz bandwidth
• 1 times the current carrier frequency
• 0 dB
• 0
• 0 dB
Table 7-8 Parameter Data for the Free-Running RF Oscillator Measurement
Step Parameters Data
Agilent Technologies E5500 Phase Noise Measurement System 7-47

Absolute Measurement ExamplesRF Synthesizer using DCFM
oise
e
e
RF Synthesizer using DCFM
This measurement example will help you measure the absolute phase nof an RF synthesizer using DCFM.
CAUTION To prevent damage to the Agilent/HP 70420A test set’s hardwarecomponents, the input signalmust notbe applied to the signal inputconnector until the input attenuator has been correctly set for the desiredconfiguration, as show inTable 7-11 on page 7-55. Apply the input signalwhen theConnection Diagramappears.
Required Equipment The following equipment is required for this example in addition the phasnoise test system and your unit-under-test (UUT).
NOTE To ensure accurate measurements, you should allow the UUT andmeasurement equipment to warm up at least one hour before making thnoise measurement.
Table 7-9 Required Equipment for the RFSynthesizer using DCFM Measurement
Equipment Quantity Comments
Agilent/HP 8663A 1 Must have DCFM Input Port.
Refer to the Chapter 6,“Selecting a Reference”formore information about referencesource requirements
Coax Cables And adequate adapters to connectthe UUT and reference source tothe test set.
7-48 Agilent Technologies E5500 Phase Noise Measurement System

Absolute Measurement ExamplesRF Synthesizer using DCFM
es,
Defining theMeasurement
1. From theFile menu, chooseOpen.
2. If necessary, choose the drive or directory where the file you want isstored.
3. In theFile Namebox, choose “RFSynth_DCFM.pnm”.
4. Click theOpen button.
The appropriate measurement definition parameters for this examplehave been pre-stored in this file.Table 7-12 on page 7-70lists theparameter data that has been entered for the RF Synthesizer usingDCFM measurement example.)
NOTE Note that the source parameters entered for step 2 inTable 7-12may not beappropriate for the reference source you are using. To change these valurefer toTable 7-10 on page 7-50, then continue with step “a”. Otherwise, goto “Beginning the Measurement” on page 7-55:
Agilent Technologies E5500 Phase Noise Measurement System 7-49

Absolute Measurement ExamplesRF Synthesizer using DCFM
a. From theDefine menu, chooseMeasurement;then choose theSourcestab from theDefine Measurementwindow.
b. Enter the carrier (center) frequency of your UUT (5 MHz to 1.6GHz). Enter the same frequency for the detector input frequency.
c. Enter the VCO (Nominal) Tuning Constant (seeTable 7-10).
d. Enter the Tune Range of VCO (seeTable 7-10).
e. Enter the Center Voltage of VCO (seeTable 7-10).
f. Enter the Input Resistance of VCO (seeTable 7-10).
Table 7-10 Tuning Characteristics for Various Sources
VCO SourceCarrierFreq.
Tuning Constant(Hz/V)
CenterVoltage
(V)
Voltage TuningRange (± V)
InputResistance
(Ω)
TuningCalibration
Method
Agilent/HP 8662/3AEFCDCFM
υ0 5 E – 9 xυ0FM Deviation
00
1010
1E + 61 K (8662)600 (8663)
MeasureComputeCompute
Agilent/HP 8642A/B FM Deviation 0 10 600 Compute
7-50 Agilent Technologies E5500 Phase Noise Measurement System

Absolute Measurement ExamplesRF Synthesizer using DCFM
Selecting a ReferenceSource
1. From theDefine menu, chooseMeasurement;then choose theBlockDiagram tab from theDefine Measurementwindow.
2. From theReference Sourcepull-down list, selectyour source.
3. When you have completed these operations, click theClosebutton.
Agilent/HP 8644B FM Deviation 0 10 600 Compute
Other SignalGenerato rDCFM Calibrated for±1V
FM Deviation 0 10 Rin Compute
Other User VCOSource
Estimated within afactor of 2
–10 to+10
1 E + 6 Measure
VCO SourceCarrierFreq.
Tuning Constant(Hz/V)
CenterVoltage
(V)
Voltage TuningRange (± V)
InputResistance
(Ω)
TuningCalibration
Method
Agilent Technologies E5500 Phase Noise Measurement System 7-51

Absolute Measurement ExamplesRF Synthesizer using DCFM
or
Selecting LoopSuppressionVerification
1. From theDefine menu, chooseMeasurement;then choose theCal tabfrom theDefine Measurementwindow.
2. In theCal dialog box, checkVerify calculated phase locked loopsuppressionandAlways Show Suppression Graph. SelectIf limit isexceeded: Show Loop Suppression Graph.
3. When you have completed these operations, click theClosebutton.
Setup Considerationsfor the RF Synthesizerusing DCFMMeasurement
Measurement Noise Floor
The signal amplitude at the R input (Signal Input) port on theAgilent/HP 70420A sets the measurement noise floor level. Use thefollowing graph to determine the amplitude required to provide a noise flolevel that is below the expected noise floor of your UUT.
7-52 Agilent Technologies E5500 Phase Noise Measurement System

Absolute Measurement ExamplesRF Synthesizer using DCFM
Figure 7-11 Noise Floor for the RF Synthesizer (DCFM) Measurement
Figure 7-12 Noise Floor Calculation Example
Agilent Technologies E5500 Phase Noise Measurement System 7-53

Absolute Measurement ExamplesRF Synthesizer using DCFM
teiern
d
. Inoisehe
If the output amplitude of your UUT is not sufficient to provide an adequameasurement noise floor, it will be necessary to insert a low noise amplifbetween the UUT and the Agilent/HP 70420A input. (Refer to “Inserting aDevice” inChapter 6, “Absolute Measurement Fundamentals”for details ondetermining the effect that the amplifier’s noise will have on the measurenoise floor.)
Agilent/HP 8663A VCO Reference
This setup uses the Agilent/HP 8663A as the VCO reference sourceorder for the noise measurement results to accurately represent the nof the UUT, the noise level of the reference source should be below texpected noise level of the UUT.
7-54 Agilent Technologies E5500 Phase Noise Measurement System

Absolute Measurement ExamplesRF Synthesizer using DCFM
n
e
d
Beginning theMeasurement
1. From theMeasurementmenu, chooseNew Measurement.
2. When thePerform a New Calibration and Measurementdialog boxappears, clickOK .
3. When theConnect Diagramdialog box appears, click on the hardwaredown arrow and select your hardware configuration from the pull-dowlist.
Confirm your connections as shown in the connect diagram. At this timconnect your UUT and reference sources to the test set. The inputattenuator (Option 001 only) has now been correctly configured baseon your measurement definition.
CAUTION The Agilent/HP 70420A test set’s signal input is subject to the followinglimits and characteristics:
Table 7-11 Agilent/HP 70420A Test Set Signal Input Limits and Characteristics
Limits
Frequency 50 kHz to 1.6 GHz (Std)50 kHz to 26.5 GHz (Option 001)50 kHz to 26.5 GHz (Option 201)
Maximum Signal Input Power Sum of the reference and signal inputpower shall not exceed +23 dBm
At Attenuator Output, Operating LevelRange:
• RF Phase Detectors 0 to +23 dBm (Signal Input)+15 to +23 dBm (Reference Input)
• Microwave Phase Detectors 0 to +5 dBm (Signal Input)+7 to +10 dBm (Reference Input)
Agilent Technologies E5500 Phase Noise Measurement System 7-55

Absolute Measurement ExamplesRF Synthesizer using DCFM
Figure 7-13 Connect Diagram for the RF Synthesizer (DC FM) Measurement
4. Refer to the following system connect diagram examples for moreinformation about system interconnections:
“E5501A Standard Connect Diagram Example” on page 7-58
“E5501B Standard Connect Diagram Example” on page 7-59
• Internal AM Detector 0 to +20 dBm
• Downconverters:
Agilent/HP 70422A 0 to +30 dBm
Agilent/HP 70427A +5 to +15 dBm
CAUTION:
To prevent damage to the Agilent/HP 70420A test set’s hardware components,the input signal must not be applied to the test set’s signal input connector untilthe input attenuator (Option 001) has been correctly set by the phase noisesoftware, which will occur at the connection diagram.
Characteristics:
Input Impedance 50 ohm Nominal
AM Noise dc coupled to 50 ohm load
Table 7-11 Agilent/HP 70420A Test Set Signal Input Limits and Characteristics
7-56 Agilent Technologies E5500 Phase Noise Measurement System
Absolute Measurement ExamplesRF Synthesizer using DCFM
“E5502A Option 001 Connect Diagram Example” on page 7-36
“E5503B Option 001 Connect Diagram Example” on page 7-39
“E5504A Option 201 Connect Diagram Example” on page 7-64
“E5504B Option 201 Connect Diagram Example” on page 7-65
NOTE For additional examples, refer toChapter 19, “Connect Diagrams”
Agilent Technologies E5500 Phase Noise Measurement System 7-57
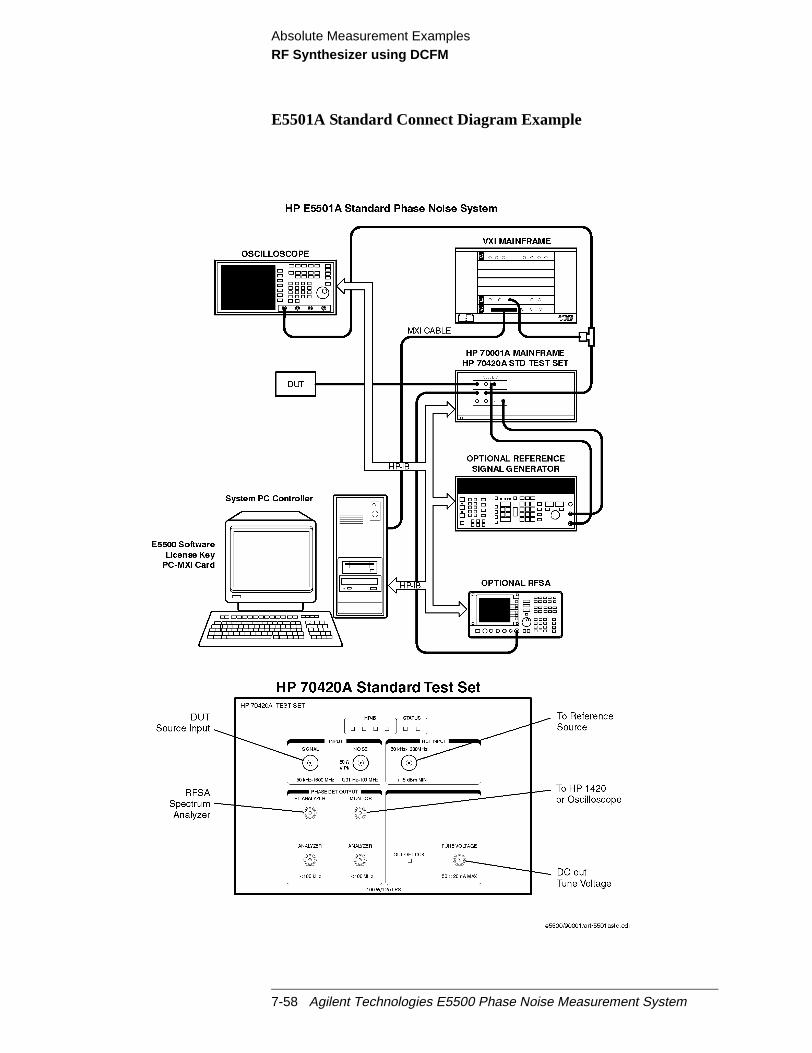
Absolute Measurement ExamplesRF Synthesizer using DCFM
E5501A Standard Connect Diagram Example
7-58 Agilent Technologies E5500 Phase Noise Measurement System

Absolute Measurement ExamplesRF Synthesizer using DCFM
E5501B Standard Connect Diagram Example
Agilent Technologies E5500 Phase Noise Measurement System 7-59
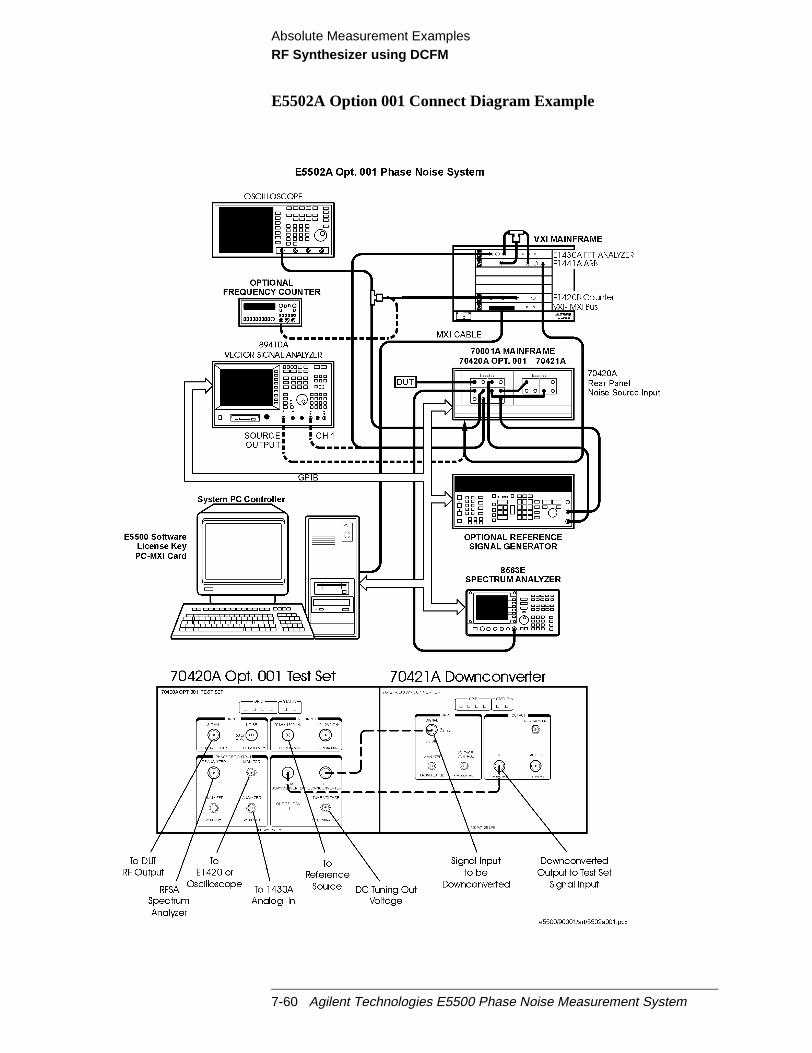
Absolute Measurement ExamplesRF Synthesizer using DCFM
E5502A Option 001 Connect Diagram Example
7-60 Agilent Technologies E5500 Phase Noise Measurement System
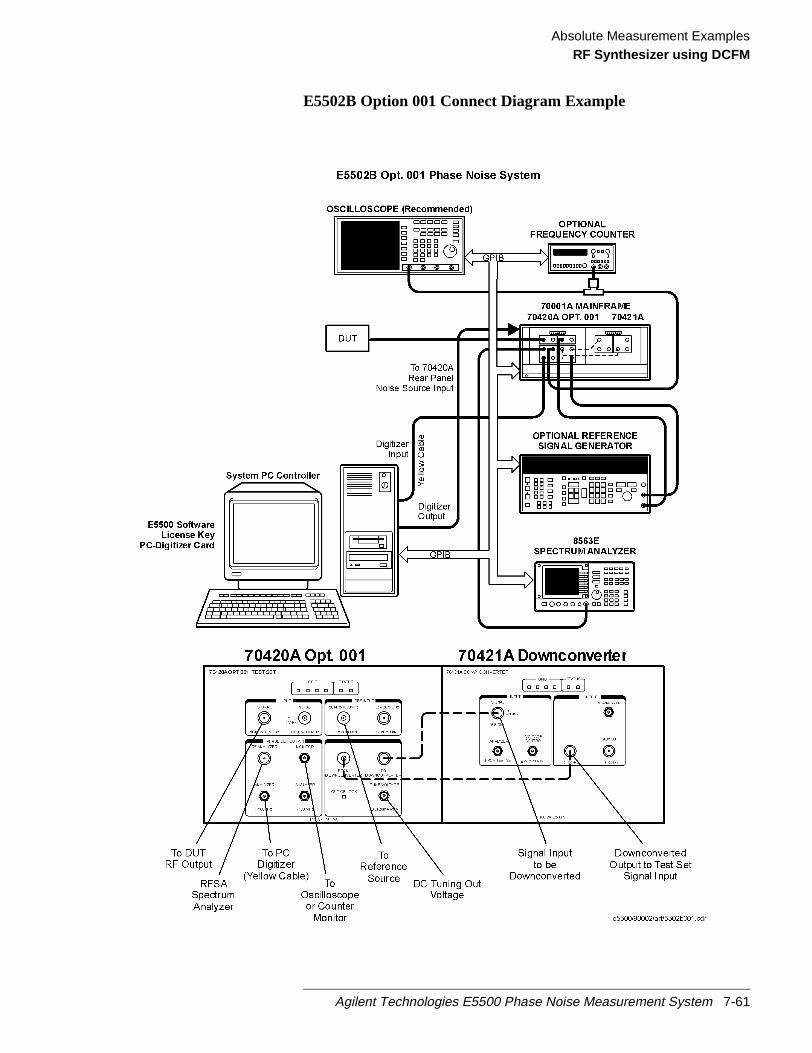
Absolute Measurement ExamplesRF Synthesizer using DCFM
E5502B Option 001 Connect Diagram Example
Agilent Technologies E5500 Phase Noise Measurement System 7-61

Absolute Measurement ExamplesRF Synthesizer using DCFM
E5503A Option 001 Connect Diagram Example
7-62 Agilent Technologies E5500 Phase Noise Measurement System

Absolute Measurement ExamplesRF Synthesizer using DCFM
E5503B Option 001 Connect Diagram Example
Agilent Technologies E5500 Phase Noise Measurement System 7-63

Absolute Measurement ExamplesRF Synthesizer using DCFM
E5504A Option 201 Connect Diagram Example
7-64 Agilent Technologies E5500 Phase Noise Measurement System

Absolute Measurement ExamplesRF Synthesizer using DCFM
E5504B Option 201 Connect Diagram Example
Agilent Technologies E5500 Phase Noise Measurement System 7-65
Absolute Measurement ExamplesRF Synthesizer using DCFM
r ace
intem.
ofbe
the
its
en
cyuntil
ch
Checking the Beatnote While the connect diagram is still displayed, recommend that you use anoscilloscope (connected to the Monitor port on the Agilent/HP 70420A) ocounter to check the beatnote being created between the reference sourand your device-under-test. The objective of checking the beatnote is toensure that the center frequencies of the two sources are close enoughfrequency to create a beatnote that is within the capture range of the sys
The phase lock loop (PLL) capture range is 5% of the peak tuning rangethe VCO source you are using. (The peak tuning range for your VCO canestimated by multiplying the VCO tuning constant by the tune range ofVCO. Refer toChapter 15, “Evaluating Your Measurement Results”if youare not familiar with the relationship between the PLL capture range andpeak tuning range of the VCO.)
NOTE If the center frequencies of the sources are not close enough to create abeatnote within the capture range, the system will not be able to completemeasurement.
The beatnote frequency is set by the relative frequency difference betwethe two sources. If you have two very accurate sources set at the samefrequency, the resulting beatnote will be very close to 0 Hz.
Searching for the beatnote will require that you adjust the center frequenof one of the sources above and below the frequency of the other sourcethe beatnote appears on the oscilloscope’s display.
If incrementing the frequency of one of the sources does not produce abeatnote, you will need to verify the presence of an output signal from easource before proceeding.
7-66 Agilent Technologies E5500 Phase Noise Measurement System

Absolute Measurement ExamplesRF Synthesizer using DCFM
r
Figure 7-14 Oscilloscope Display of a Beatnote out of the Agilent/HP 70420A MonitoPort
Agilent Technologies E5500 Phase Noise Measurement System 7-67
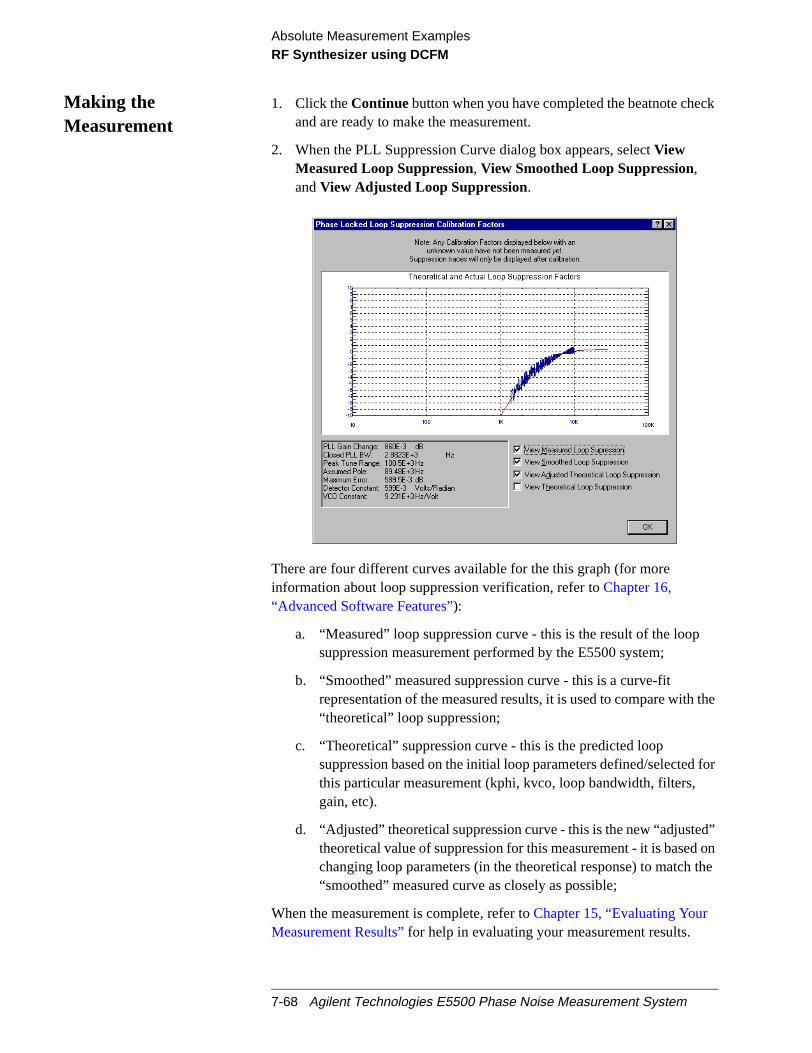
Absolute Measurement ExamplesRF Synthesizer using DCFM
ck
the
for
d”on
the
Making theMeasurement
1. Click theContinue button when you have completed the beatnote cheand are ready to make the measurement.
2. When the PLL Suppression Curve dialog box appears, selectViewMeasured Loop Suppression, View Smoothed Loop Suppression,andView Adjusted Loop Suppression.
There are four different curves available for the this graph (for moreinformation about loop suppression verification, refer toChapter 16,“Advanced Software Features”):
a. “Measured” loop suppression curve - this is the result of the loopsuppression measurement performed by the E5500 system;
b. “Smoothed” measured suppression curve - this is a curve-fitrepresentation of the measured results, it is used to compare with“theoretical” loop suppression;
c. “Theoretical” suppression curve - this is the predicted loopsuppression based on the initial loop parameters defined/selectedthis particular measurement (kphi, kvco, loop bandwidth, filters,gain, etc).
d. “Adjusted” theoretical suppression curve - this is the new “adjustetheoretical value of suppression for this measurement - it is basedchanging loop parameters (in the theoretical response) to match“smoothed” measured curve as closely as possible;
When the measurement is complete, refer toChapter 15, “Evaluating YourMeasurement Results”for help in evaluating your measurement results.
7-68 Agilent Technologies E5500 Phase Noise Measurement System
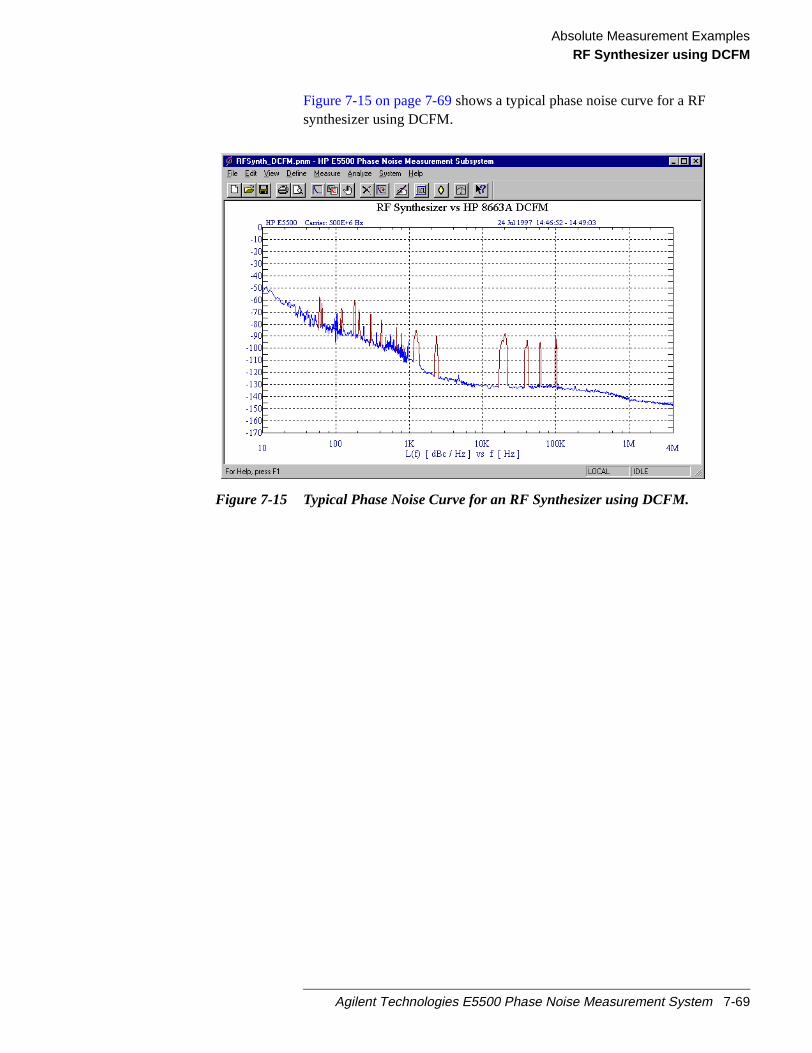
Absolute Measurement ExamplesRF Synthesizer using DCFM
Figure 7-15 on page 7-69shows a typical phase noise curve for a RFsynthesizer using DCFM.
Figure 7-15 Typical Phase Noise Curve for an RF Synthesizer using DCFM.
Agilent Technologies E5500 Phase Noise Measurement System 7-69

Absolute Measurement ExamplesRF Synthesizer using DCFM
Table 7-12 Parameter Data for the RF Synthesizer (DCFM) Measurement
Step Parameters Data
1 Type and Range Tab
Measurement Type
• Start Frequency
• Stop Frequency
• Minimum Number of Averages
FFT Quality
• Absolute Phase Noise (using a phase locked loop)
• 10 Hz
• 4 E + 6 Hz
• 4
• Fast
2 Sources Tab
Carrier Source
• Frequency
• Power
• Carrier Source Output isconnected to:
Detector Input
• Frequency
Reference Source
• Frequency
• Reference Source Power
VCO Tuning Parameters
• Nominal Tune Constant
• Tune Range +/-
• Center Voltage
• Input Resistance
• 600 E + 6 Hz
• 20 dBm
• Test Set
• 600 E +6 Hz
• 600 E +6 Hz (same as Carrier Source Frequency)
• 16 dBm
• 40 E +3 Hz/V
• +/- 10 Volts
• 0 Volts
• 600 ohms
3 Cal Tab
• Phase Detector Constant
• VCO Tune Constant
• Phase Lock Loop Suppression
• If Limit is exceeded
• Measure Phase Detector Constant
• Calculate from expected VCO Tune Constant
• Verify calculated phase locked loop suppression
• Show Suppression Graph
4 Block Diagram Tab
• Carrier Source
• Downconverter
• Reference Source
• Timebase
• Phase Detector
• Test Set Tune VoltageDestination
• VCO Tune Mode
• Manual
• None
• Agilent/HP 8663A
• None
• Automatic Detector Selection
• Reference Source
• DCFM
7-70 Agilent Technologies E5500 Phase Noise Measurement System

Absolute Measurement ExamplesRF Synthesizer using DCFM
5 Test Set Tab
Input Attenuation
LNA Low Pass Filter
• LNA Gain
• DC Block
• PLL Integrator Attenuation
• 0 dB
• 20 MHz (Auto checked)
• Auto Gain (Minimum Auto Gain - 14 dB)
• Not checked
• 0 dBm
6 Downconverter Tab • The downconverter parameters do not apply to thismeasurement example.
7 Graph Tab
• Title
• Graph Type
• X Scale Minimum
• X Scale Maximum
• Y Scale Minimum
• Y Scale Maximum
• Normalize trace data to a:
• Scale trace data to a newcarrier frequency of:
• Shift trace data DOWN by:
• Trace Smoothing Amount
• Power present at input of DUT
• RF Synthesizer vs Agilent/HP 8663A using DCFM
• Single-sideband Noise (dBc/Hz)
• 10 Hz
• 4 E + 6 Hz
• 0 dBc/Hz
• - 170 dBc/Hz
• 1 Hz bandwidth
• 1 times the current carrier frequency
• 0 dB
• 0
• 0 dB
Table 7-12 Parameter Data for the RF Synthesizer (DCFM) Measurement
Step Parameters Data
Agilent Technologies E5500 Phase Noise Measurement System 7-71

Absolute Measurement ExamplesRF Synthesizer using EFC
oise
e
e
RF Synthesizer using EFC
This measurement example will help you measure the absolute phase nof an RF synthesizer using EFC.
CAUTION To prevent damage to the Agilent/HP 70420A test set’s hardwarecomponents, the input signalmust notbe applied to the signal inputconnector until the input attenuator has been correctly set for the desiredconfiguration, as show inTable 7-15 on page 7-80. Apply the input signalwhen theConnection Diagramappears.
Required Equipment The following equipment is required for this example in addition the phasnoise test system and your unit-under-test (UUT).
NOTE To ensure accurate measurements, you should allow the UUT andmeasurement equipment to warm up at least one hour before making thnoise measurement.
Table 7-13 Required Equipment for the RFSynthesizer using EFC Measurement
Equipment Quantity Comments
Agilent/HP 8663A 1 Must have EFC Input Port.
Refer to Chapter 6, “Selecting aReference”for more informationabout reference sourcerequirements
Coax Cables And adequate adapters to connectthe UUT and reference source tothe test set.
7-72 Agilent Technologies E5500 Phase Noise Measurement System

Absolute Measurement ExamplesRF Synthesizer using EFC
FC
To
Defining theMeasurement
1. From theFile menu, chooseOpen.
2. If necessary, choose the drive or directory where the file you want isstored.
3. In theFile Namebox, choose “RFSynth_EFC.pnm”.
4. Click theOpen button.
The appropriate measurement definition parameters for this examplehave been pre-stored in this file.Table 7-16 on page 7-95lists theparameter data that has been entered for the RF Synthesizer using Emeasurement example.)
NOTE Note that the source parameters entered for step 2 inTable 7-16 onpage 7-95may not be appropriate for the reference source you are using.change these values, refer toTable 7-14 on page 7-75, then continue withstep “a”. Otherwise, go to“Beginning the Measurement” on page 7-80:
Agilent Technologies E5500 Phase Noise Measurement System 7-73

Absolute Measurement ExamplesRF Synthesizer using EFC
ng
a. From theDefine menu, chooseMeasurement;then choose theSourcestab from theDefine Measurementwindow.
b. Enter the carrier (center) frequency of your UUT (5 MHz to 1.6GHz). Enter the same frequency for the detector input frequency.
c. Enter the VCO Tuning Constant (seeTable 7-14 on page 7-75).
d. If you are going to use EFC tuning to tune the Agilent/HP 8663A,use the following equation to calculate the appropriate VCO TuniConstant to enter for the measurement.
VCO Tuning Constant = T x Carrier Frequency Where T= 5E-9 for EFC
For example, to calculate the Tuning Constant value to enter for EFCtuning when the center frequency is 300 MHz:
(5 E - 9) X (300 E + 6) = (1500 E - 3) = 1.5e. Enter the Tune Range of VCO (Table 7-14).
f. Enter the Center Voltage of VCO (seeTable 7-14).
g. Enter the Input Resistance of VCO (seeTable 7-14).
7-74 Agilent Technologies E5500 Phase Noise Measurement System

Absolute Measurement ExamplesRF Synthesizer using EFC
Table 7-14 Tuning Characteristics for Various Sources
Selecting a ReferenceSource
1. From theDefine menu, chooseMeasurement;then choose theBlockDiagram tab from theDefine Measurementwindow.
2. From theReference Sourcepull-down list, selectyour source.
VCO SourceCarrierFreq.
Tuning Constant(Hz/V)
CenterVoltage
(V)
Voltage TuningRange (± V)
InputResistance
(Ω)
TuningCalibration
Method
Agilent/HP 8662/3AEFCDCFM
υ0 5 E – 9 xυ0FM Deviation
00
1010
1E + 61 K (8662)600 (8663)
MeasureComputeCompute
Agilent/HP 8642A/B FM Deviation 0 10 600 Compute
Agilent/HP 8644B FM Deviation 0 10 600 Compute
Other SignalGenerato rDCFM Calibrated for±1V
FM Deviation 0 10 Rin Compute
Other User VCOSource
Estimated within afactor of 2
–10 to+10
1 E + 6 Measure
Agilent Technologies E5500 Phase Noise Measurement System 7-75
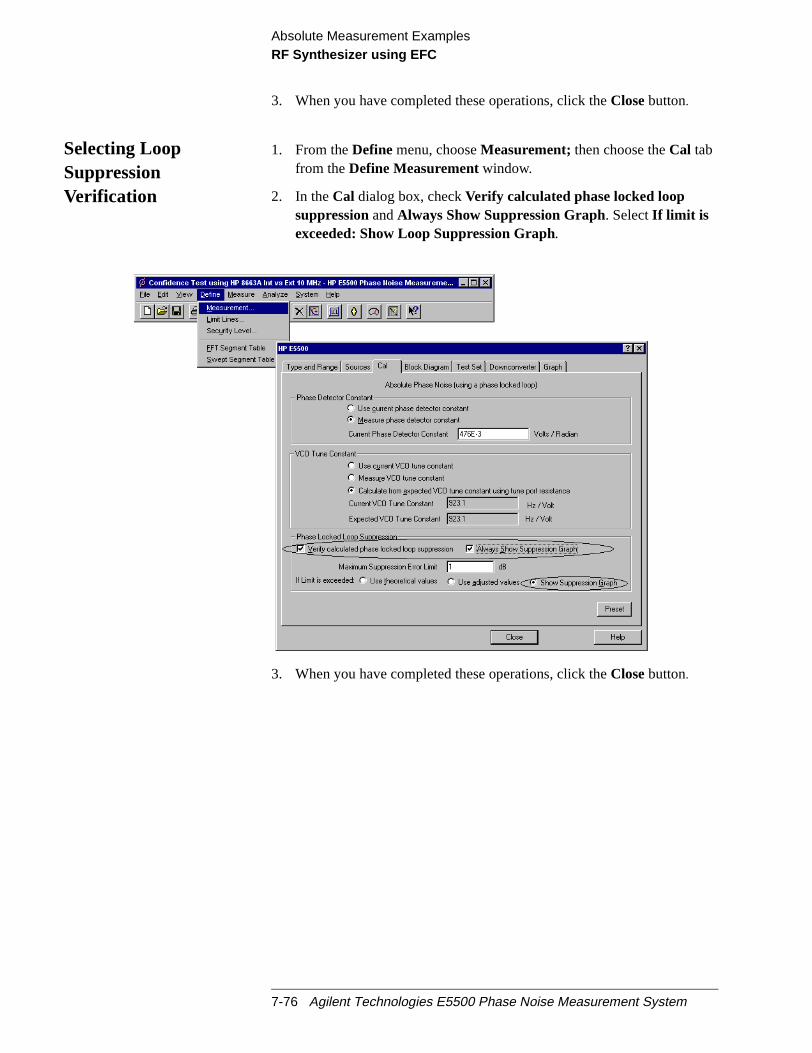
Absolute Measurement ExamplesRF Synthesizer using EFC
3. When you have completed these operations, click theClosebutton.
Selecting LoopSuppressionVerification
1. From theDefine menu, chooseMeasurement;then choose theCal tabfrom theDefine Measurementwindow.
2. In theCal dialog box, checkVerify calculated phase locked loopsuppressionandAlways Show Suppression Graph. SelectIf limit isexceeded: Show Loop Suppression Graph.
3. When you have completed these operations, click theClosebutton.
7-76 Agilent Technologies E5500 Phase Noise Measurement System

Absolute Measurement ExamplesRF Synthesizer using EFC
.
or
Selecting a ReferenceSource
1. From theDefine menu, chooseMeasurement;then choose theBlockDiagram tab from theDefine Measurementwindow.
2. From theReference Sourcepull-down list, select your reference source
3. When you have completed these operations, click theClosebutton.
Setup Considerationsfor the RF Synthesizerusing EFCMeasurement
Measurement Noise Floor
The signal amplitude at the R input (Signal Input) port on theAgilent/HP 70420A sets the measurement noise floor level. Use thefollowing graph to determine the amplitude required to provide a noise flolevel that is below the expected noise floor of your UUT.
Agilent Technologies E5500 Phase Noise Measurement System 7-77
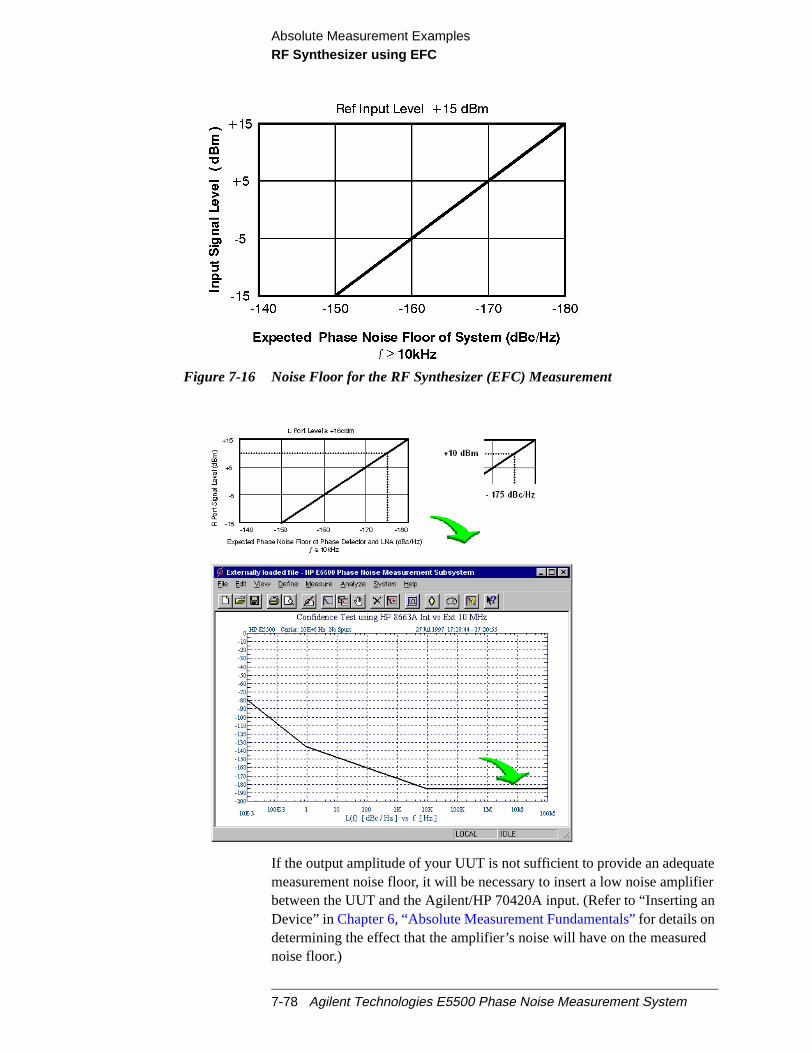
Absolute Measurement ExamplesRF Synthesizer using EFC
teiern
d
Figure 7-16 Noise Floor for the RF Synthesizer (EFC) Measurement
If the output amplitude of your UUT is not sufficient to provide an adequameasurement noise floor, it will be necessary to insert a low noise amplifbetween the UUT and the Agilent/HP 70420A input. (Refer to “Inserting aDevice” inChapter 6, “Absolute Measurement Fundamentals”for details ondetermining the effect that the amplifier’s noise will have on the measurenoise floor.)
7-78 Agilent Technologies E5500 Phase Noise Measurement System

Absolute Measurement ExamplesRF Synthesizer using EFC
rdere
ed
Agilent/HP 8663A VCO Reference
This setup uses the Agilent/HP 8663A as the VCO reference source. In ofor the noise measurement results to accurately represent the noise of thUUT, the noise level of the reference source should be below the expectnoise level of the UUT.
Agilent Technologies E5500 Phase Noise Measurement System 7-79
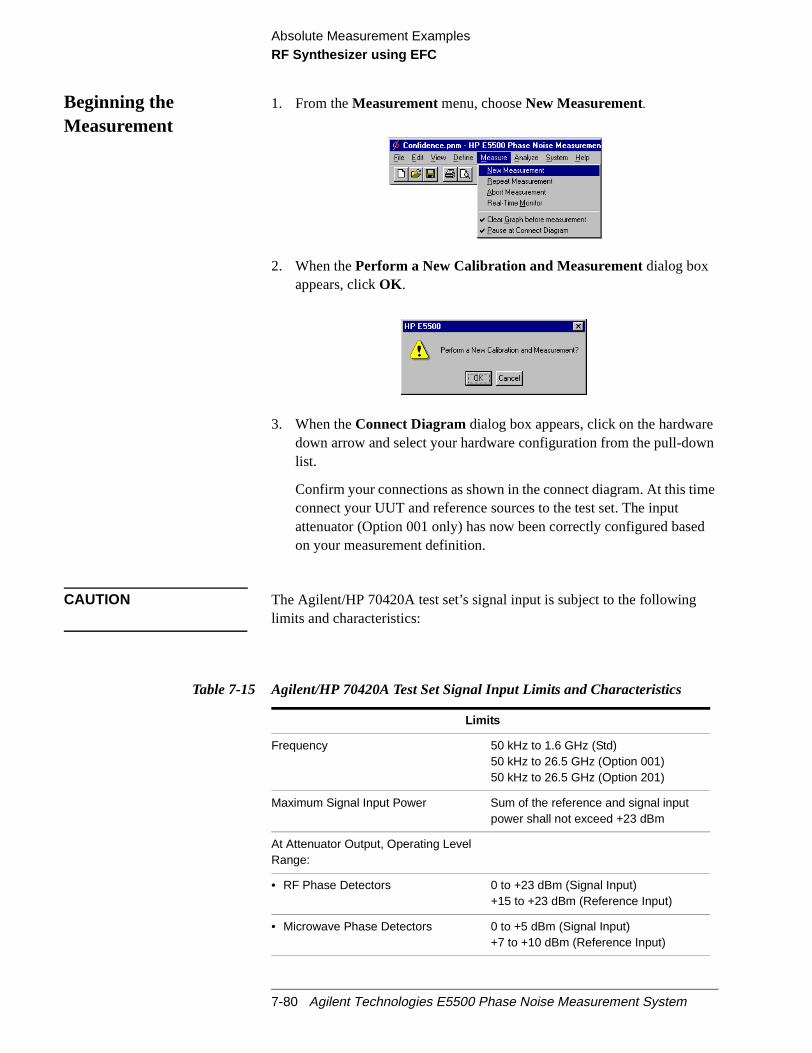
Absolute Measurement ExamplesRF Synthesizer using EFC
n
e
d
Beginning theMeasurement
1. From theMeasurementmenu, chooseNew Measurement.
2. When thePerform a New Calibration and Measurementdialog boxappears, clickOK .
3. When theConnect Diagramdialog box appears, click on the hardwaredown arrow and select your hardware configuration from the pull-dowlist.
Confirm your connections as shown in the connect diagram. At this timconnect your UUT and reference sources to the test set. The inputattenuator (Option 001 only) has now been correctly configured baseon your measurement definition.
CAUTION The Agilent/HP 70420A test set’s signal input is subject to the followinglimits and characteristics:
Table 7-15 Agilent/HP 70420A Test Set Signal Input Limits and Characteristics
Limits
Frequency 50 kHz to 1.6 GHz (Std)50 kHz to 26.5 GHz (Option 001)50 kHz to 26.5 GHz (Option 201)
Maximum Signal Input Power Sum of the reference and signal inputpower shall not exceed +23 dBm
At Attenuator Output, Operating LevelRange:
• RF Phase Detectors 0 to +23 dBm (Signal Input)+15 to +23 dBm (Reference Input)
• Microwave Phase Detectors 0 to +5 dBm (Signal Input)+7 to +10 dBm (Reference Input)
7-80 Agilent Technologies E5500 Phase Noise Measurement System
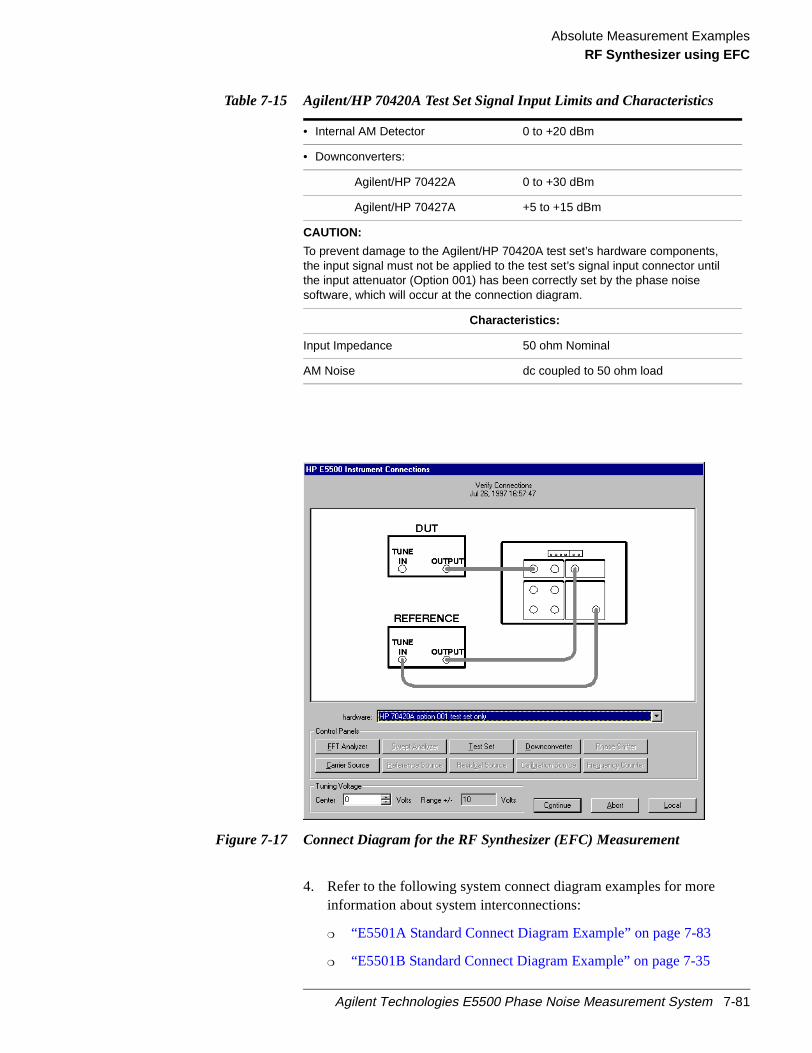
Absolute Measurement ExamplesRF Synthesizer using EFC
Figure 7-17 Connect Diagram for the RF Synthesizer (EFC) Measurement
4. Refer to the following system connect diagram examples for moreinformation about system interconnections:
“E5501A Standard Connect Diagram Example” on page 7-83
“E5501B Standard Connect Diagram Example” on page 7-35
• Internal AM Detector 0 to +20 dBm
• Downconverters:
Agilent/HP 70422A 0 to +30 dBm
Agilent/HP 70427A +5 to +15 dBm
CAUTION:
To prevent damage to the Agilent/HP 70420A test set’s hardware components,the input signal must not be applied to the test set’s signal input connector untilthe input attenuator (Option 001) has been correctly set by the phase noisesoftware, which will occur at the connection diagram.
Characteristics:
Input Impedance 50 ohm Nominal
AM Noise dc coupled to 50 ohm load
Table 7-15 Agilent/HP 70420A Test Set Signal Input Limits and Characteristics
Agilent Technologies E5500 Phase Noise Measurement System 7-81

Absolute Measurement ExamplesRF Synthesizer using EFC
“E5502A Option 001 Connect Diagram Example” on page 7-36
“E5503B Option 001 Connect Diagram Example” on page 7-88
“E5504A Option 201 Connect Diagram Example” on page 7-89
“E5504B Option 201 Connect Diagram Example” on page 7-90
NOTE For additional examples, refer toChapter 19, “Connect Diagrams”
7-82 Agilent Technologies E5500 Phase Noise Measurement System
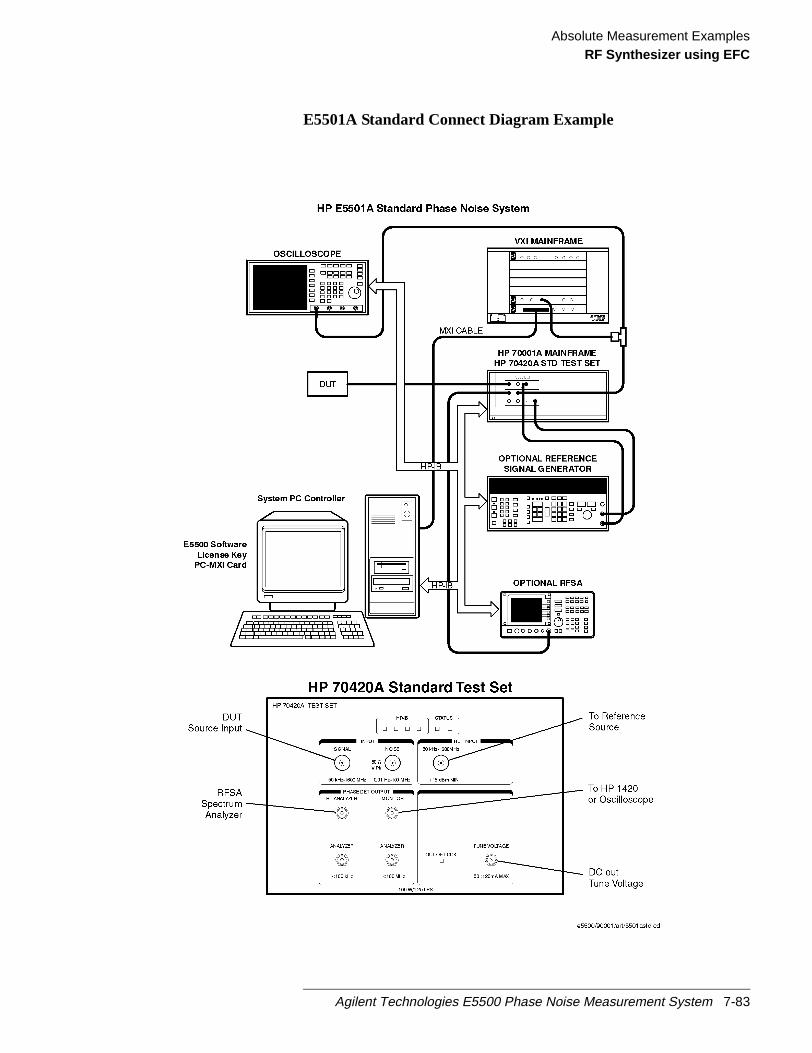
Absolute Measurement ExamplesRF Synthesizer using EFC
E5501A Standard Connect Diagram Example
Agilent Technologies E5500 Phase Noise Measurement System 7-83

Absolute Measurement ExamplesRF Synthesizer using EFC
E5501B Standard Connect Diagram Example
7-84 Agilent Technologies E5500 Phase Noise Measurement System

Absolute Measurement ExamplesRF Synthesizer using EFC
E5502A Option 001 Connect Diagram Example
Agilent Technologies E5500 Phase Noise Measurement System 7-85

Absolute Measurement ExamplesRF Synthesizer using EFC
E5502B Option 001 Connect Diagram Example
7-86 Agilent Technologies E5500 Phase Noise Measurement System

Absolute Measurement ExamplesRF Synthesizer using EFC
E5503A Option 001 Connect Diagram Example
Agilent Technologies E5500 Phase Noise Measurement System 7-87
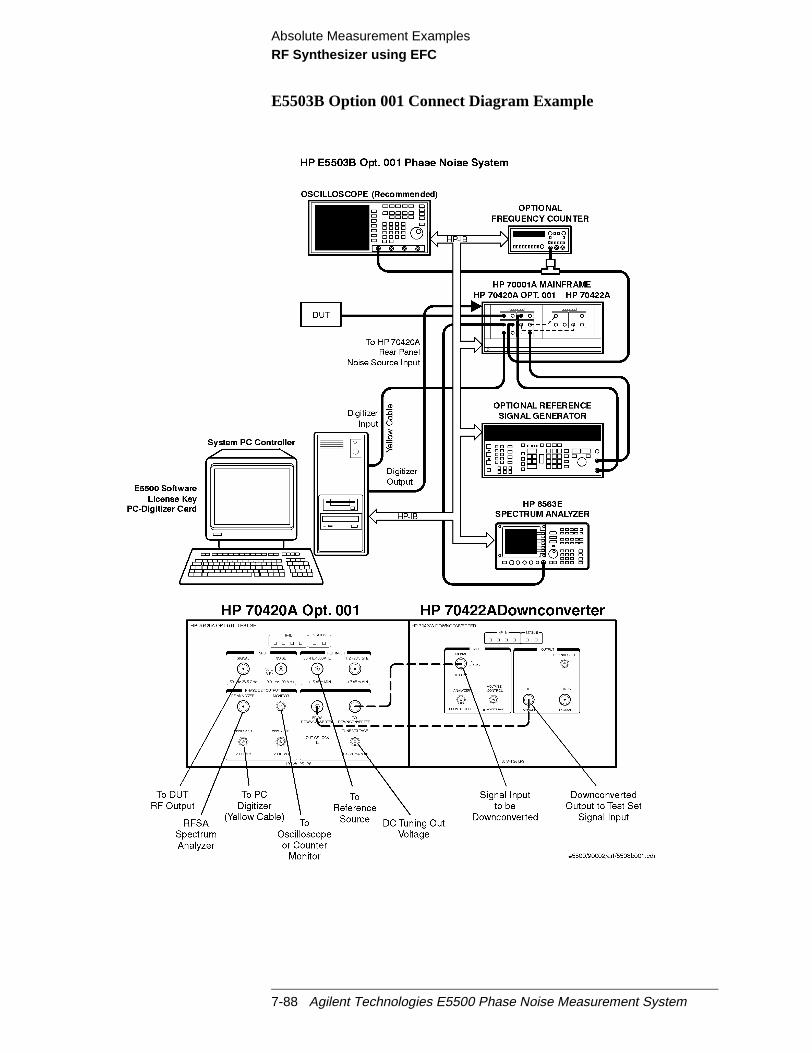
Absolute Measurement ExamplesRF Synthesizer using EFC
E5503B Option 001 Connect Diagram Example
7-88 Agilent Technologies E5500 Phase Noise Measurement System

Absolute Measurement ExamplesRF Synthesizer using EFC
E5504A Option 201 Connect Diagram Example
Agilent Technologies E5500 Phase Noise Measurement System 7-89
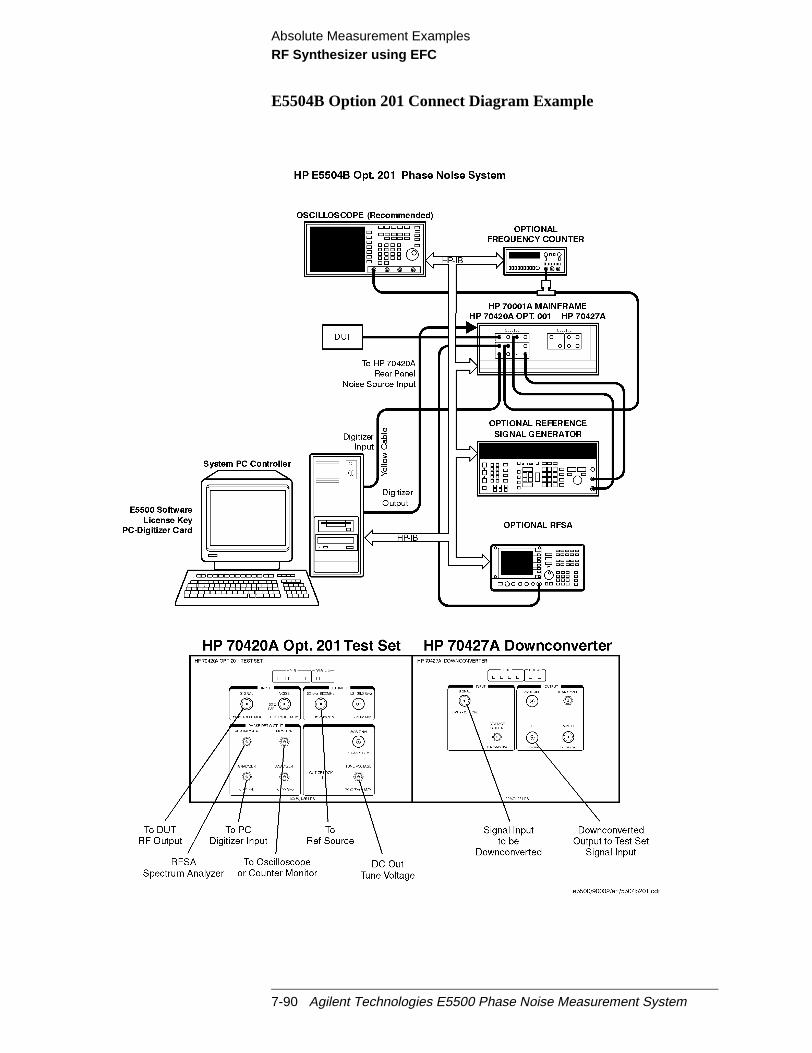
Absolute Measurement ExamplesRF Synthesizer using EFC
E5504B Option 201 Connect Diagram Example
7-90 Agilent Technologies E5500 Phase Noise Measurement System
Absolute Measurement ExamplesRF Synthesizer using EFC
r ace
intem.
ofbe
f the
its
en
cyuntil
ch
Checking the Beatnote While the connect diagram is still displayed, recommend that you use anoscilloscope (connected to the Monitor port on the Agilent/HP 70420A) ocounter to check the beatnote being created between the reference sourand your device-under-test. The objective of checking the beatnote is toensure that the center frequencies of the two sources are close enoughfrequency to create a beatnote that is within the capture range of the sys
The phase lock loop (PLL) capture range is 5% of the peak tuning rangethe VCO source you are using. (The peak tuning range for your VCO canestimated by multiplying the VCO tuning constant by the tune range ofVCO. Refer toFigure on page 15-1if you are not familiar with therelationship between the PLL capture range and the peak tuning range oVCO.)
NOTE If the center frequencies of the sources are not close enough to create abeatnote within the capture range, the system will not be able to completemeasurement.
The beatnote frequency is set by the relative frequency difference betwethe two sources. If you have two very accurate sources set at the samefrequency, the resulting beatnote will be very close to 0 Hz.
Searching for the beatnote will require that you adjust the center frequenof one of the sources above and below the frequency of the other sourcethe beatnote appears on the oscilloscope’s display.
If incrementing the frequency of one of the sources does not produce abeatnote, you will need to verify the presence of an output signal from easource before proceeding.
Agilent Technologies E5500 Phase Noise Measurement System 7-91
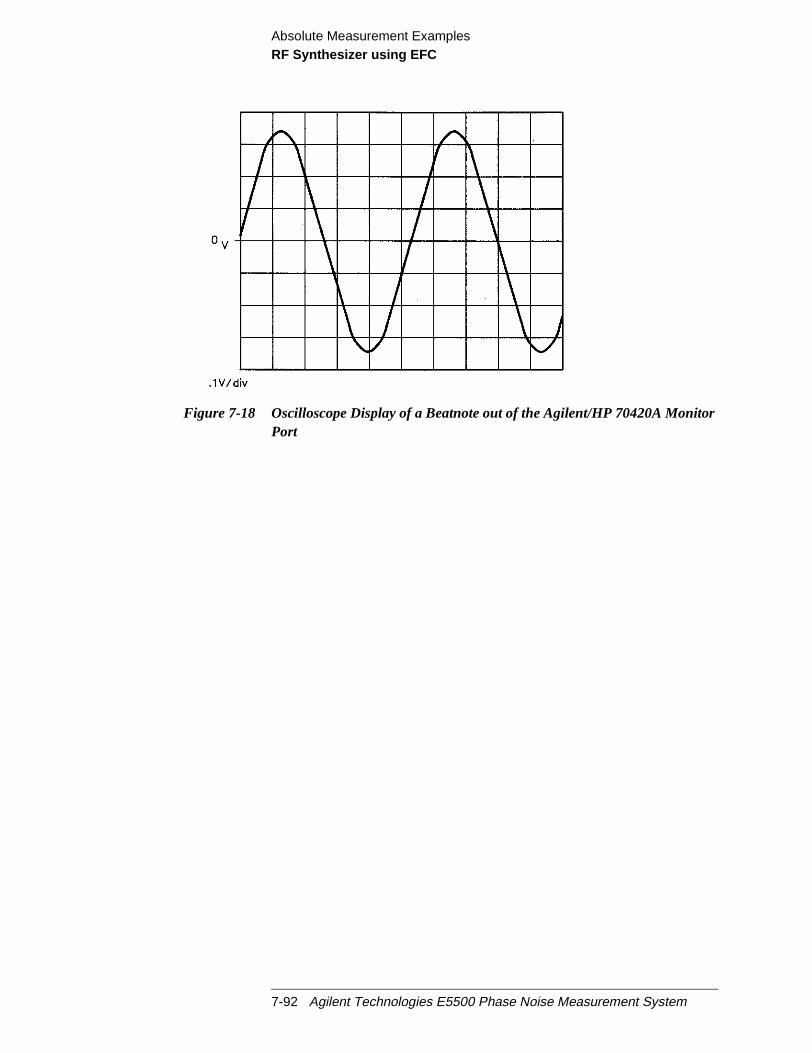
Absolute Measurement ExamplesRF Synthesizer using EFC
r
Figure 7-18 Oscilloscope Display of a Beatnote out of the Agilent/HP 70420A MonitoPort
7-92 Agilent Technologies E5500 Phase Noise Measurement System
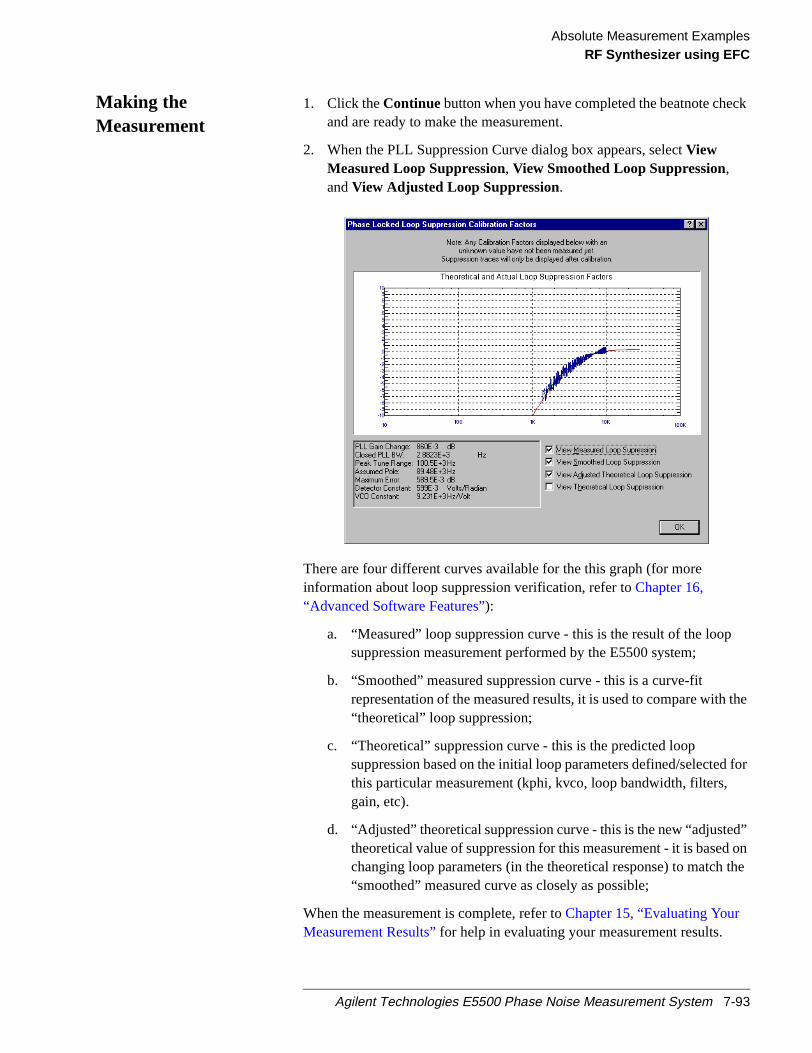
Absolute Measurement ExamplesRF Synthesizer using EFC
ck
the
for
d”on
the
Making theMeasurement
1. Click theContinue button when you have completed the beatnote cheand are ready to make the measurement.
2. When the PLL Suppression Curve dialog box appears, selectViewMeasured Loop Suppression, View Smoothed Loop Suppression,andView Adjusted Loop Suppression.
There are four different curves available for the this graph (for moreinformation about loop suppression verification, refer toChapter 16,“Advanced Software Features”):
a. “Measured” loop suppression curve - this is the result of the loopsuppression measurement performed by the E5500 system;
b. “Smoothed” measured suppression curve - this is a curve-fitrepresentation of the measured results, it is used to compare with“theoretical” loop suppression;
c. “Theoretical” suppression curve - this is the predicted loopsuppression based on the initial loop parameters defined/selectedthis particular measurement (kphi, kvco, loop bandwidth, filters,gain, etc).
d. “Adjusted” theoretical suppression curve - this is the new “adjustetheoretical value of suppression for this measurement - it is basedchanging loop parameters (in the theoretical response) to match“smoothed” measured curve as closely as possible;
When the measurement is complete, refer toChapter 15, “Evaluating YourMeasurement Results”for help in evaluating your measurement results.
Agilent Technologies E5500 Phase Noise Measurement System 7-93
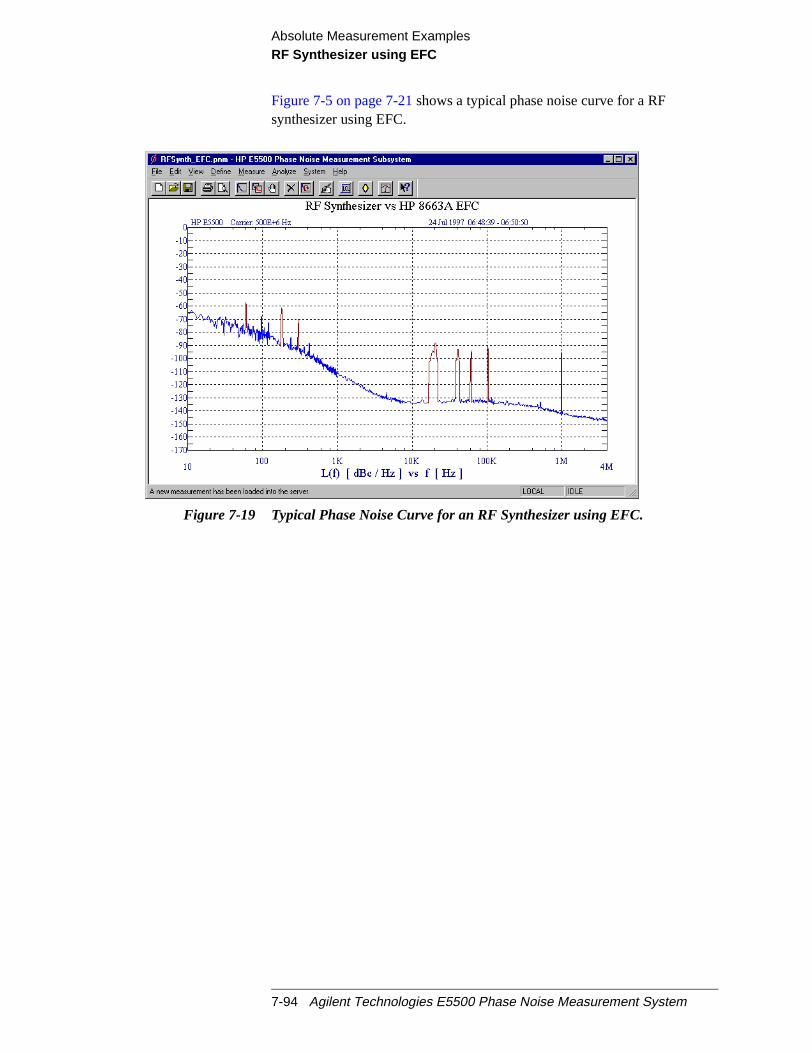
Absolute Measurement ExamplesRF Synthesizer using EFC
Figure 7-5 on page 7-21shows a typical phase noise curve for a RFsynthesizer using EFC.
Figure 7-19 Typical Phase Noise Curve for an RF Synthesizer using EFC.
7-94 Agilent Technologies E5500 Phase Noise Measurement System

Absolute Measurement ExamplesRF Synthesizer using EFC
Table 7-16 Parameter Data for the RF Synthesizer (EFC) Measurement
Step Parameters Data
1 Type and Range Tab
Measurement Type
• Start Frequency
• Stop Frequency
• Minimum Number of Averages
FFT Quality
• Absolute Phase Noise (using a phase locked loop)
• 10 Hz
• 4 E + 6 Hz
• 4
• Fast
2 Sources Tab
Carrier Source
• Frequency
• Power
• Carrier Source Output isconnected to:
Detector Input
• Frequency
Reference Source
• Frequency
• Reference Source Power
VCO Tuning Parameters
• Nominal Tune Constant
• Tune Range +/-
• Center Voltage
• Input Resistance
• 500 E + 6 Hz
• 10 dBm
• Test Set
• 500 E +6 Hz
• 500 E +6 Hz (same as Carrier Source Frequency)
• 16 dBm
• 2.5 Hz/V
• +/- 10 Volts
• 0 Volts
• 1 E +6 ohms
3 Cal Tab
• Phase Detector Constant
• VCO Tune Constant
• Phase Lock Loop Suppression
• If Limit is exceeded
• Measure Phase Detector Constant
• Measure from expected VCO Tune Constant
• Verify calculated phase locked loop suppression
• Show Suppression Graph
4 Block Diagram Tab
• Carrier Source
• Downconverter
• Reference Source
• Timebase
• Phase Detector
• Test Set Tune VoltageDestination
• VCO Tune Mode
• Manual
• None
• Agilent/HP 8663A
• None
• Automatic Detector Selection
• Reference Source
• EFC
Agilent Technologies E5500 Phase Noise Measurement System 7-95

Absolute Measurement ExamplesRF Synthesizer using EFC
5 Test Set Tab
Input Attenuation
LNA Low Pass Filter
• LNA Gain
• DC Block
• PLL Integrator Attenuation
• 0 dB
• 20 MHz (Auto checked)
• Auto Gain (Minimum Auto Gain - 14 dB)
• Not checked
• 0 dBm
6 Downconverter Tab • The downconverter parameters do not apply to thismeasurement example.
7 Graph Tab
• Title
• Graph Type
• X Scale Minimum
• X Scale Maximum
• Y Scale Minimum
• Y Scale Maximum
• Normalize trace data to a:
• Scale trace data to a newcarrier frequency of:
• Shift trace data DOWN by:
• Trace Smoothing Amount
• Power present at input of DUT
• RF Synthesizer vs Agilent/HP 8663A using EFC
• Single-sideband Noise (dBc/Hz)
• 10 Hz
• 4 E + 6 Hz
• 0 dBc/Hz
• - 170 dBc/Hz
• 1 Hz bandwidth
• 1 times the current carrier frequency
• 0 dB
• 0
• 0 dB
Table 7-16 Parameter Data for the RF Synthesizer (EFC) Measurement
Step Parameters Data
7-96 Agilent Technologies E5500 Phase Noise Measurement System

Absolute Measurement ExamplesMicrowave Source
oise
e
e
Microwave Source
This measurement example will help you measure the absolute phase nof a microwave source (2.5 to 18 GHz) with frequency drift of≤10E – 9 XCarrier Frequency over a period of thirty minutes.
CAUTION To prevent damage to the Agilent/HP 70420A test set’s hardwarecomponents, the input signalmust notbe applied to the signal inputconnector until the input attenuator has been correctly set for the desiredconfiguration, as show inTable 7-19 on page 7-103. Apply the input signalwhen theConnection Diagramappears.
Required Equipment The following equipment is required for this example in addition the phasnoise test system and your unit-under-test (UUT).
NOTE To ensure accurate measurements, you should allow the UUT andmeasurement equipment to warm up at least one hour before making thnoise measurement.
Table 7-17 Required Equipment for the MicrowaveSource Measurement Example
Equipment Quantity Comments
Agilent/HP 8644B 1 Must have DCFM Input Port.
Refer to Chapter 6, “Selecting aReference”for more informationabout reference sourcerequirements
Agilent/HP 70422A 1 Must be entered in the AssetManager and Server HardwareConnections dialog box.
Coax Cables And adequate adapters to connectthe UUT and reference source tothe test set.
Agilent Technologies E5500 Phase Noise Measurement System 7-97

Absolute Measurement ExamplesMicrowave Source
.
Defining theMeasurement
1. From theFile menu, chooseOpen.
2. If necessary, choose the drive or directory where the file you want isstored.
3. In theFile Namebox, choose “MicroSRC.pnm”.
4. Click theOpen button.
The appropriate measurement definition parameters for this examplehave been pre-stored in this file.Table 7-20 on page 7-114lists theparameter data that has been entered for the Microwave Sourcemeasurement example.)
NOTE Note that the source parameters entered for step 2 inTable 7-20 onpage 7-114may not be appropriate for the reference source you are usingTo change these values, refer toTable 7-18 on page 7-100, then continuewith step “a”. Otherwise, go to“Beginning the Measurement” onpage 7-103:
7-98 Agilent Technologies E5500 Phase Noise Measurement System
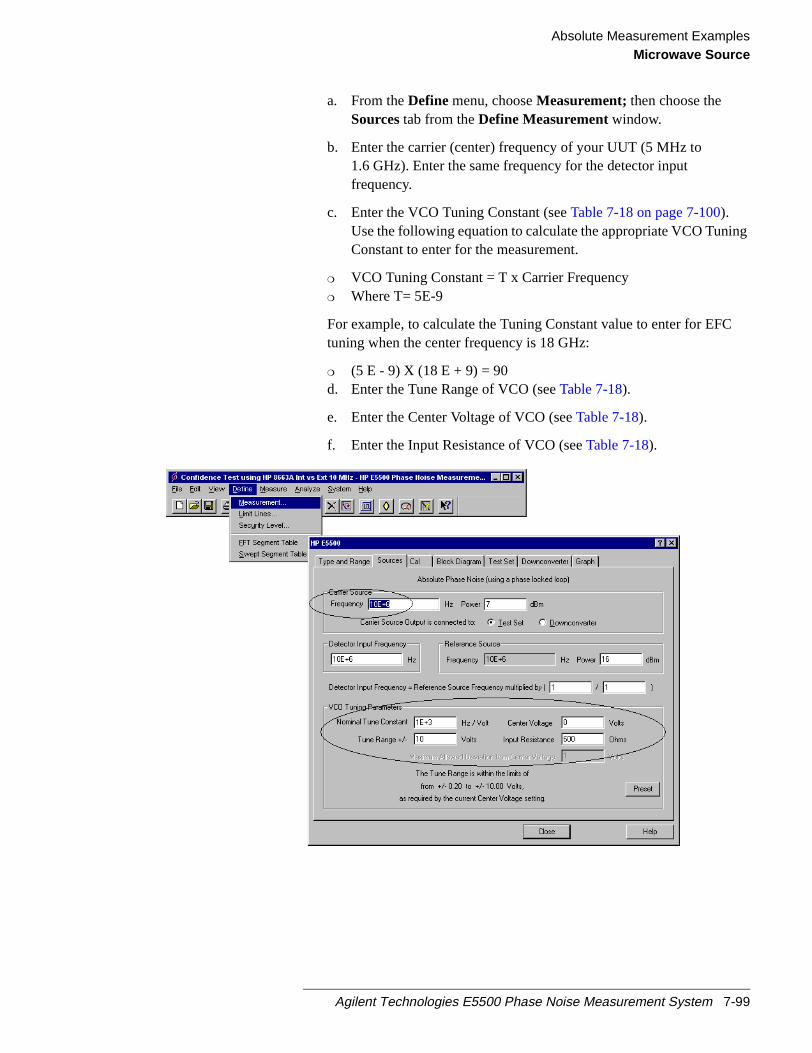
Absolute Measurement ExamplesMicrowave Source
g
a. From theDefine menu, chooseMeasurement;then choose theSourcestab from theDefine Measurementwindow.
b. Enter the carrier (center) frequency of your UUT (5 MHz to1.6 GHz). Enter the same frequency for the detector inputfrequency.
c. Enter the VCO Tuning Constant (seeTable 7-18 on page 7-100).Use the following equation to calculate the appropriate VCO TuninConstant to enter for the measurement.
VCO Tuning Constant = T x Carrier Frequency Where T= 5E-9
For example, to calculate the Tuning Constant value to enter for EFCtuning when the center frequency is 18 GHz:
(5 E - 9) X (18 E + 9) = 90d. Enter the Tune Range of VCO (seeTable 7-18).
e. Enter the Center Voltage of VCO (seeTable 7-18).
f. Enter the Input Resistance of VCO (seeTable 7-18).
Agilent Technologies E5500 Phase Noise Measurement System 7-99

Absolute Measurement ExamplesMicrowave Source
Table 7-18 Tuning Characteristics for Various Sources
Selecting a ReferenceSource
1. From theDefine menu, chooseMeasurement;then choose theBlockDiagram tab from theDefine Measurementwindow.
2. From theReference Sourcepull-down list, selectyour source.
VCO SourceCarrierFreq.
Tuning Constant(Hz/V)
CenterVoltage
(V)
Voltage TuningRange (± V)
InputResistance
(Ω)
TuningCalibration
Method
Agilent/HP 8662/3AEFCDCFM
υ0 5 E – 9 xυ0FM Deviation
00
1010
1E + 61 K (8662)600 (8663)
MeasureComputeCompute
Agilent/HP 8642A/B FM Deviation 0 10 600 Compute
Agilent/HP 8644B FM Deviation 0 10 600 Compute
Other SignalGenerato rDCFM Calibrated for±1V
FM Deviation 0 10 Rin Compute
Other User VCOSource
Estimated within afactor of 2
–10 to+10
1 E + 6 Measure
7-100 Agilent Technologies E5500 Phase Noise Measurement System

Absolute Measurement ExamplesMicrowave Source
forto
3. When you have completed these operations, click theClosebutton.
Selecting LoopSuppressionVerification
1. From theDefine menu, chooseMeasurement;then choose theCal tabfrom theDefine Measurementwindow.
2. In theCal dialog box, checkVerify calculated phase locked loopsuppressionandAlways Show Suppression Graph. SelectIf limit isexceeded: Show Loop Suppression Graph.
3. When you have completed these operations, click theClosebutton.
Setup Considerationsfor the MicrowaveSource Measurement
Measurement Noise Floor
The following noise characteristics graph shows a typical noise levelthe Agilent/HP 70422A when used with the Agilent/HP 8644B. Use ithelp you estimate if the measurement noise floor that it provides isbelow the expected noise level of your UUT.
Agilent Technologies E5500 Phase Noise Measurement System 7-101
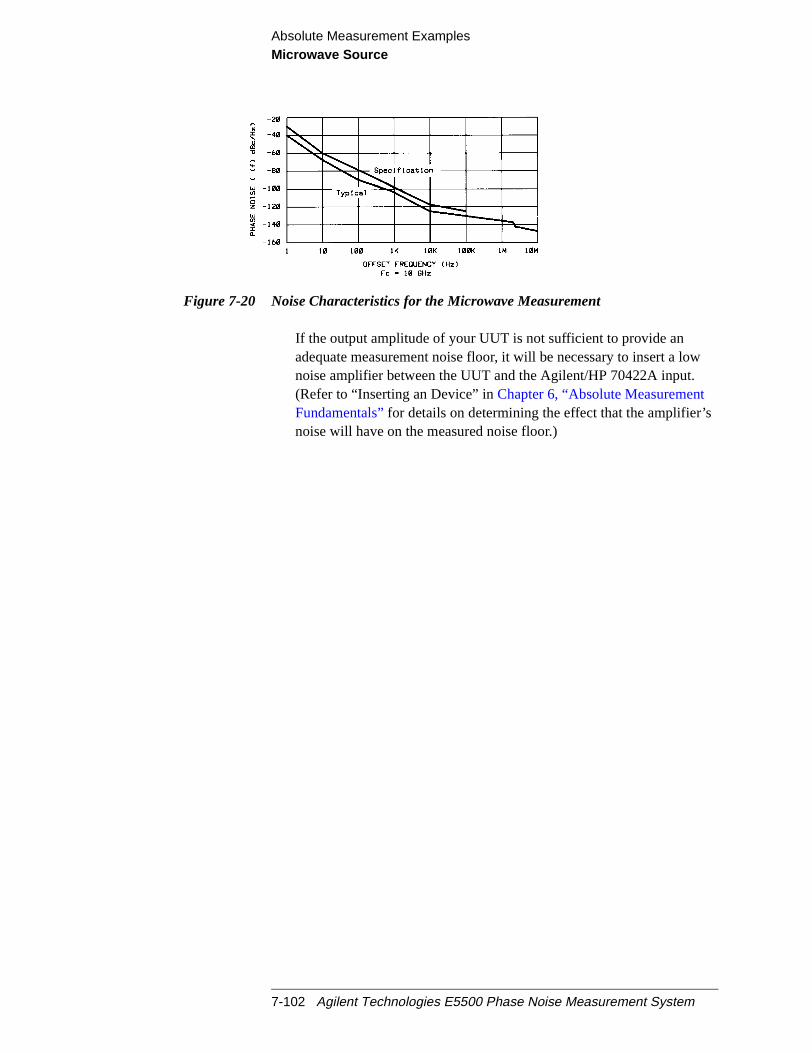
Absolute Measurement ExamplesMicrowave Source
Figure 7-20 Noise Characteristics for the Microwave Measurement
If the output amplitude of your UUT is not sufficient to provide anadequate measurement noise floor, it will be necessary to insert a lownoise amplifier between the UUT and the Agilent/HP 70422A input.(Refer to “Inserting an Device” inChapter 6, “Absolute MeasurementFundamentals”for details on determining the effect that the amplifier’snoise will have on the measured noise floor.)
7-102 Agilent Technologies E5500 Phase Noise Measurement System

Absolute Measurement ExamplesMicrowave Source
n
e
d
Beginning theMeasurement
1. From theMeasurementmenu, chooseNew Measurement.
2. When thePerform a New Calibration and Measurementdialog boxappears, clickOK .
3. When theConnect Diagramdialog box appears, click on the hardwaredown arrow and select your hardware configuration from the pull-dowlist.
Confirm your connections as shown in the connect diagram. At this timconnect your UUT and reference sources to the test set. The inputattenuator (Option 001 only) has now been correctly configured baseon your measurement definition.
CAUTION The Agilent/HP 70420A test set’s signal input is subject to the followinglimits and characteristics:
Table 7-19 Agilent/HP 70420A Test Set Signal Input Limits and Characteristics
Limits
Frequency 50 kHz to 1.6 GHz (Std)50 kHz to 26.5 GHz (Option 001)50 kHz to 26.5 GHz (Option 201)
Maximum Signal Input Power Sum of the reference and signal inputpower shall not exceed +23 dBm
At Attenuator Output, Operating LevelRange:
• RF Phase Detectors 0 to +23 dBm (Signal Input)+15 to +23 dBm (Reference Input)
• Microwave Phase Detectors 0 to +5 dBm (Signal Input)+7 to +10 dBm (Reference Input)
Agilent Technologies E5500 Phase Noise Measurement System 7-103
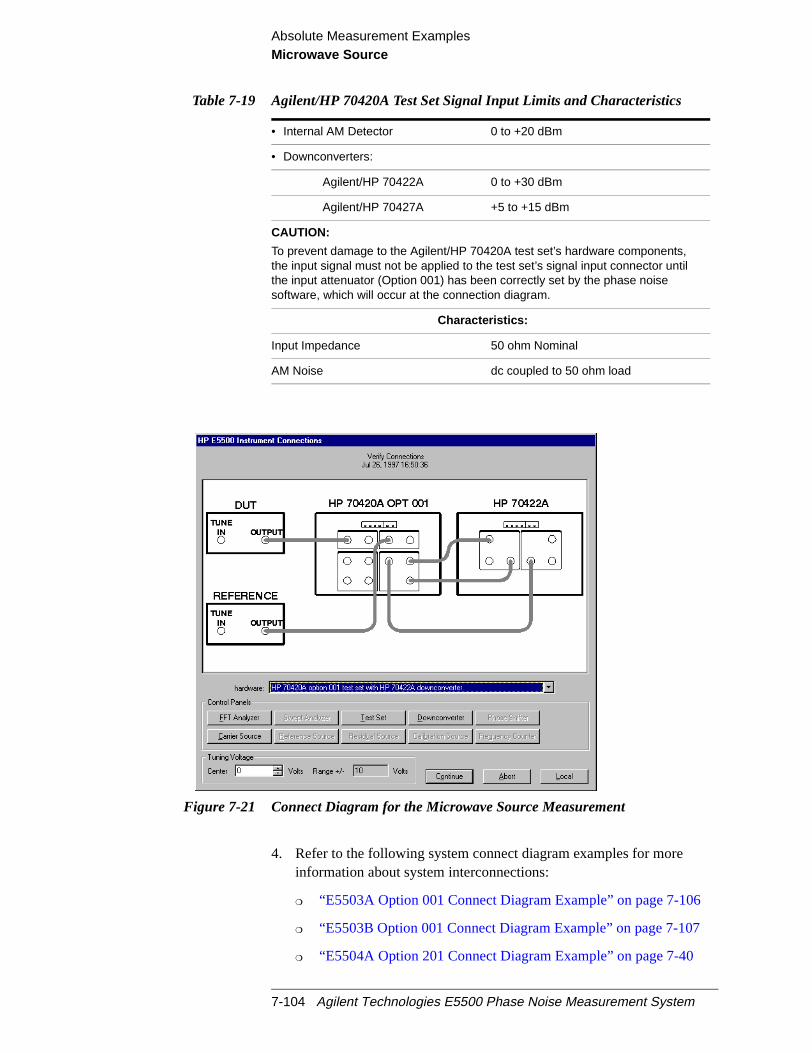
Absolute Measurement ExamplesMicrowave Source
Figure 7-21 Connect Diagram for the Microwave Source Measurement
4. Refer to the following system connect diagram examples for moreinformation about system interconnections:
“E5503A Option 001 Connect Diagram Example” on page 7-106
“E5503B Option 001 Connect Diagram Example” on page 7-107
“E5504A Option 201 Connect Diagram Example” on page 7-40
• Internal AM Detector 0 to +20 dBm
• Downconverters:
Agilent/HP 70422A 0 to +30 dBm
Agilent/HP 70427A +5 to +15 dBm
CAUTION:
To prevent damage to the Agilent/HP 70420A test set’s hardware components,the input signal must not be applied to the test set’s signal input connector untilthe input attenuator (Option 001) has been correctly set by the phase noisesoftware, which will occur at the connection diagram.
Characteristics:
Input Impedance 50 ohm Nominal
AM Noise dc coupled to 50 ohm load
Table 7-19 Agilent/HP 70420A Test Set Signal Input Limits and Characteristics
7-104 Agilent Technologies E5500 Phase Noise Measurement System

Absolute Measurement ExamplesMicrowave Source
“E5504B Option 201 Connect Diagram Example” on page 7-109
NOTE For additional examples, refer toChapter 19, “Connect Diagrams”
Agilent Technologies E5500 Phase Noise Measurement System 7-105
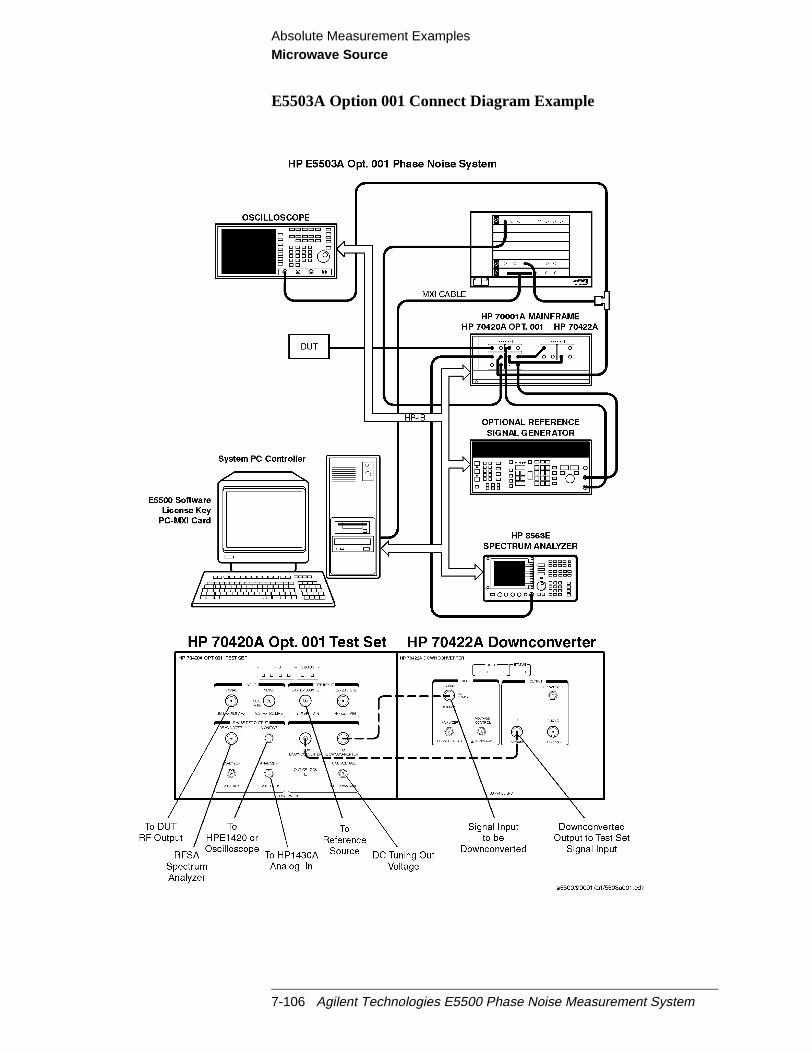
Absolute Measurement ExamplesMicrowave Source
E5503A Option 001 Connect Diagram Example
7-106 Agilent Technologies E5500 Phase Noise Measurement System
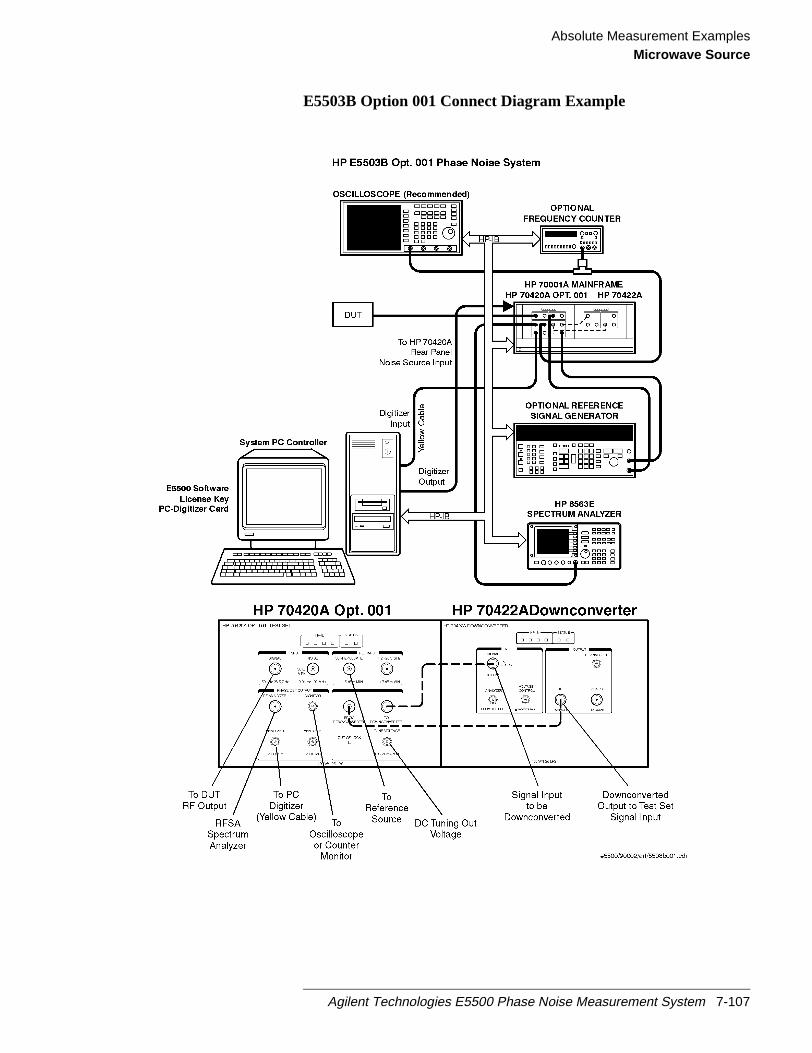
Absolute Measurement ExamplesMicrowave Source
E5503B Option 001 Connect Diagram Example
Agilent Technologies E5500 Phase Noise Measurement System 7-107

Absolute Measurement ExamplesMicrowave Source
E5504A Option 201 Connect Diagram Example
7-108 Agilent Technologies E5500 Phase Noise Measurement System
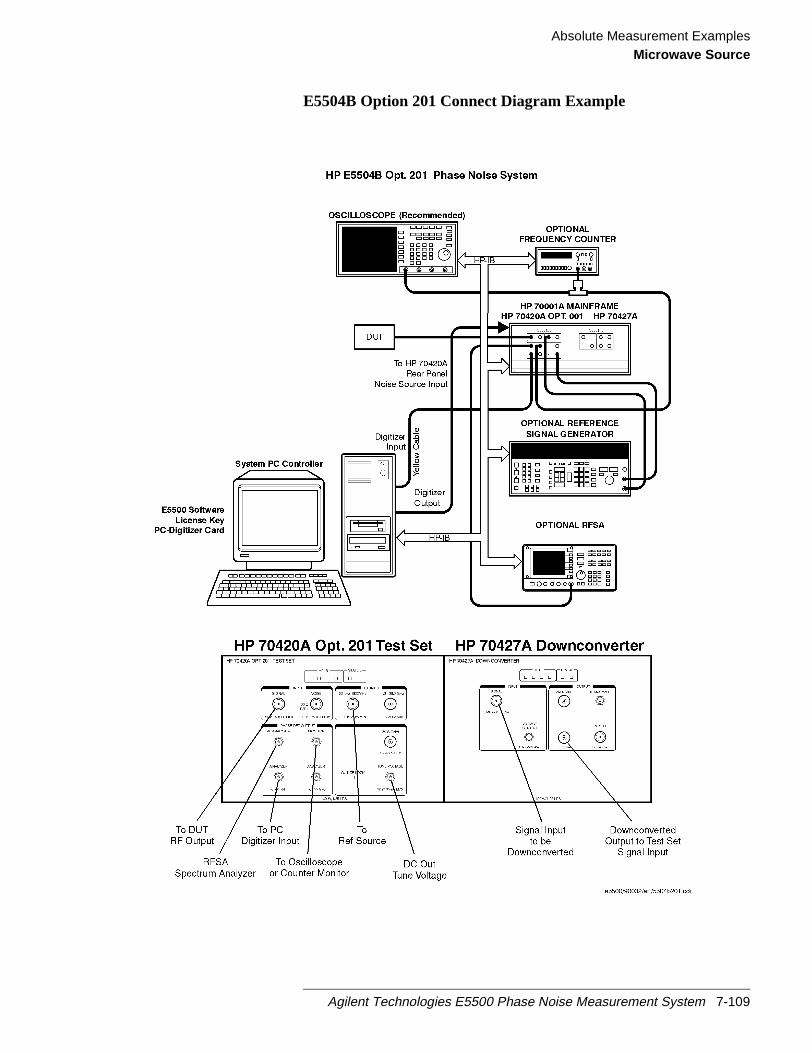
Absolute Measurement ExamplesMicrowave Source
E5504B Option 201 Connect Diagram Example
Agilent Technologies E5500 Phase Noise Measurement System 7-109

Absolute Measurement ExamplesMicrowave Source
r ace
intem.
ofbe
the
its
en
cyuntil
ch
Checking the Beatnote While the connect diagram is still displayed, recommend that you use anoscilloscope (connected to the Monitor port on the Agilent/HP 70420A) ocounter to check the beatnote being created between the reference sourand your device-under-test. The objective of checking the beatnote is toensure that the center frequencies of the two sources are close enoughfrequency to create a beatnote that is within the capture range of the sys
The phase lock loop (PLL) capture range is 5% of the peak tuning rangethe VCO source you are using. (The peak tuning range for your VCO canestimated by multiplying the VCO tuning constant by the tune range ofVCO. Refer toChapter 15, “Evaluating Your Measurement Results”if youare not familiar with the relationship between the PLL capture range andpeak tuning range of the VCO.)
NOTE If the center frequencies of the sources are not close enough to create abeatnote within the capture range, the system will not be able to completemeasurement.
The beatnote frequency is set by the relative frequency difference betwethe two sources. If you have two very accurate sources set at the samefrequency, the resulting beatnote will be very close to 0 Hz.
Searching for the beatnote will require that you adjust the center frequenof one of the sources above and below the frequency of the other sourcethe beatnote appears on the oscilloscope’s display.
If incrementing the frequency of one of the sources does not produce abeatnote, you will need to verify the presence of an output signal from easource before proceeding.
7-110 Agilent Technologies E5500 Phase Noise Measurement System
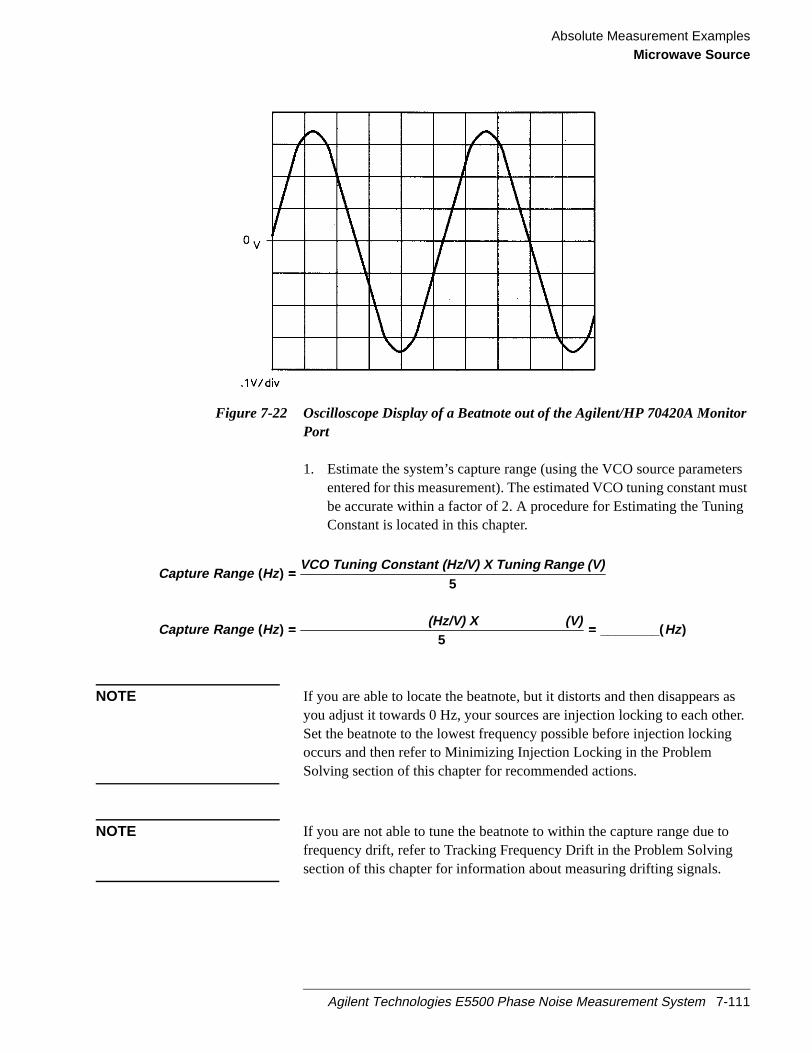
Absolute Measurement ExamplesMicrowave Source
r
tersustg
aser.g
Figure 7-22 Oscilloscope Display of a Beatnote out of the Agilent/HP 70420A MonitoPort
1. Estimate the system’s capture range (using the VCO source parameentered for this measurement). The estimated VCO tuning constant mbe accurate within a factor of 2. A procedure for Estimating the TuninConstant is located in this chapter.
NOTE If you are able to locate the beatnote, but it distorts and then disappearsyou adjust it towards 0 Hz, your sources are injection locking to each othSet the beatnote to the lowest frequency possible before injection lockinoccurs and then refer to Minimizing Injection Locking in the ProblemSolving section of this chapter for recommended actions.
NOTE If you are not able to tune the beatnote to within the capture range due tofrequency drift, refer to Tracking Frequency Drift in the Problem Solvingsection of this chapter for information about measuring drifting signals.
)________(5
)(
5)(
Hz(V)X(Hz/V)
HzRangeCapture
(V)RangeTuningX(Hz/V)ConstantTuningVCOHzRangeCapture
========
====
Agilent Technologies E5500 Phase Noise Measurement System 7-111

Absolute Measurement ExamplesMicrowave Source
ck
the
for
d”on
the
Making theMeasurement
1. Click theContinue button when you have completed the beatnote cheand are ready to make the measurement.
2. When the PLL Suppression Curve dialog box appears, selectViewMeasured Loop Suppression, View Smoothed Loop Suppression,andView Adjusted Loop Suppression.
There are four different curves available for the this graph (for moreinformation about loop suppression verification, refer toChapter 16,“Advanced Software Features”):
a. “Measured” loop suppression curve - this is the result of the loopsuppression measurement performed by the E5500 system;
b. “Smoothed” measured suppression curve - this is a curve-fitrepresentation of the measured results, it is used to compare with“theoretical” loop suppression;
c. “Theoretical” suppression curve - this is the predicted loopsuppression based on the initial loop parameters defined/selectedthis particular measurement (kphi, kvco, loop bandwidth, filters,gain, etc).
d. “Adjusted” theoretical suppression curve - this is the new “adjustetheoretical value of suppression for this measurement - it is basedchanging loop parameters (in the theoretical response) to match“smoothed” measured curve as closely as possible;
When the measurement is complete, refer toChapter 15, “Evaluating YourMeasurement Results”for help in evaluating your measurement results.
7-112 Agilent Technologies E5500 Phase Noise Measurement System

Absolute Measurement ExamplesMicrowave Source
e
Figure 7-5 on page 7-21shows a typical phase noise curve for a microwavsource.Figure 7-23 Typical Phase Noise Curve for an Microwave Source.
Agilent Technologies E5500 Phase Noise Measurement System 7-113
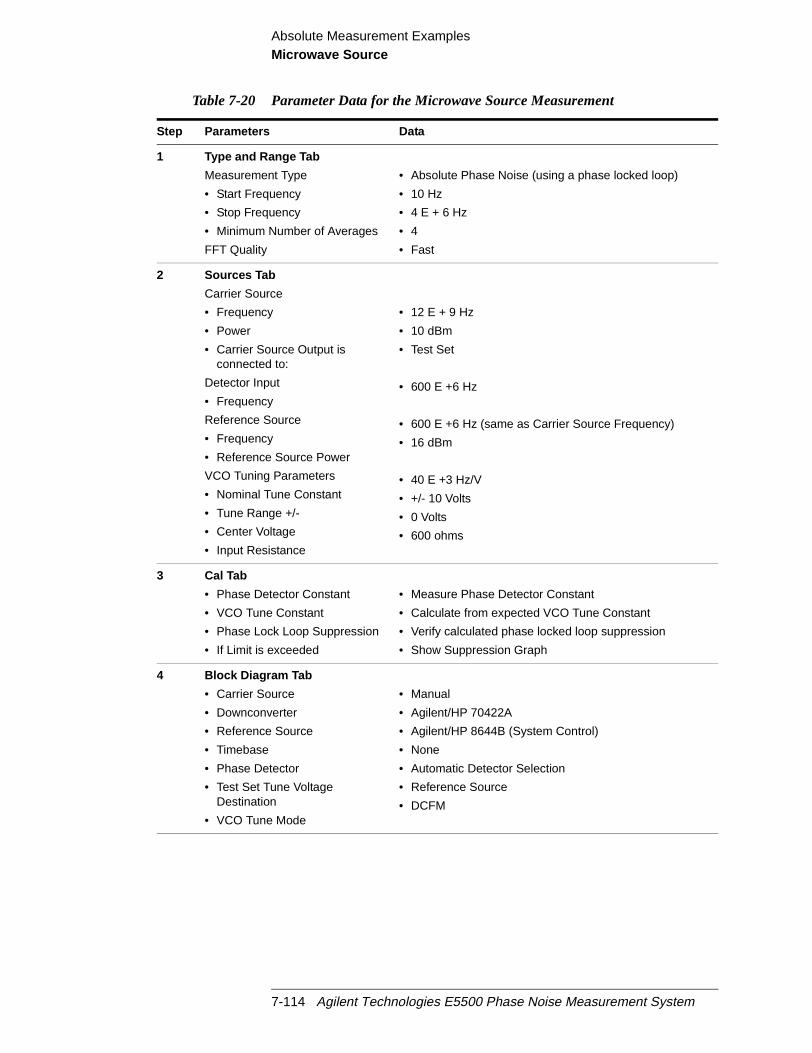
Absolute Measurement ExamplesMicrowave Source
Table 7-20 Parameter Data for the Microwave Source Measurement
Step Parameters Data
1 Type and Range Tab
Measurement Type
• Start Frequency
• Stop Frequency
• Minimum Number of Averages
FFT Quality
• Absolute Phase Noise (using a phase locked loop)
• 10 Hz
• 4 E + 6 Hz
• 4
• Fast
2 Sources Tab
Carrier Source
• Frequency
• Power
• Carrier Source Output isconnected to:
Detector Input
• Frequency
Reference Source
• Frequency
• Reference Source Power
VCO Tuning Parameters
• Nominal Tune Constant
• Tune Range +/-
• Center Voltage
• Input Resistance
• 12 E + 9 Hz
• 10 dBm
• Test Set
• 600 E +6 Hz
• 600 E +6 Hz (same as Carrier Source Frequency)
• 16 dBm
• 40 E +3 Hz/V
• +/- 10 Volts
• 0 Volts
• 600 ohms
3 Cal Tab
• Phase Detector Constant
• VCO Tune Constant
• Phase Lock Loop Suppression
• If Limit is exceeded
• Measure Phase Detector Constant
• Calculate from expected VCO Tune Constant
• Verify calculated phase locked loop suppression
• Show Suppression Graph
4 Block Diagram Tab
• Carrier Source
• Downconverter
• Reference Source
• Timebase
• Phase Detector
• Test Set Tune VoltageDestination
• VCO Tune Mode
• Manual
• Agilent/HP 70422A
• Agilent/HP 8644B (System Control)
• None
• Automatic Detector Selection
• Reference Source
• DCFM
7-114 Agilent Technologies E5500 Phase Noise Measurement System

Absolute Measurement ExamplesMicrowave Source
5 Test Set Tab
Input Attenuation
LNA Low Pass Filter
• LNA Gain
• DC Block
• PLL Integrator Attenuation
• 0 dB
• 20 MHz (Auto checked)
• Auto Gain (Minimum Auto Gain - 14 dB)
• Not checked
• 0 dBm
6 Downconverter Tab
Input Frequency
L.O. Frequency
I.F. Frequency
Millimeter Frequency
L.O. Power
Maximum AM Detector Level
Input Attenuation
I.F. Gain
• Auto
Microwave/Millimeter Band
Millimeter Band Mixer Bias
• Enable
• Current
Reference Chain
• Reference
• External Tune Enable
Tuning Sensitivity
• Nominal
• 100 MHz PLL Bandwidth
• 600 MHz PLL Bandwidth
• 12 E + 9
• Auto
• (Calculated by software)
• 0
• 20 dBM
• 0 dBm
• 0 dB
• 0 dB
• Checked
• Microwave (0 - 26.5 GHz)
• Unchecked
• 0 mA
• 10 MHz
• Unchecked
• 0 ppm/v
• 0 ppm/V
• 126 Hz
• 10000 Hz
7 Graph Tab
• Title
• Graph Type
• X Scale Minimum
• X Scale Maximum
• Y Scale Minimum
• Y Scale Maximum
• Normalize trace data to a:
• Scale trace data to a newcarrier frequency of:
• Shift trace data DOWN by:
• Trace Smoothing Amount
• Power present at input of DUT
• Microwave Source (12 GHz) vs. Agilent/HP 8644Busing EFC
• Single-sideband Noise (dBc/Hz)
• 10 Hz
• 4 E + 6 Hz
• 0 dBc/Hz
• - 170 dBc/Hz
• 1 Hz bandwidth
• 1 times the current carrier frequency
• 0 dB
• 0
• 0 dB
Table 7-20 Parameter Data for the Microwave Source Measurement
Step Parameters Data
Agilent Technologies E5500 Phase Noise Measurement System 7-115

8 Residual Measurement Fundamentals
What You’ll Find in This Chapter
• What is Residual Noise?, page 8-2
• Basic Assumptions Regarding Residual Phase Noise Measurements,page 8-4
• Calibrating the Measurement, page 8-6
• The Calibration Options, page 8-9
Measured +/- DC Peak Voltage, page 8-13
Measured Beatnote, page 8-16
Synthesized Residual Measurement using Beatnote Cal,page 8-19
Double-Sided Spur, page 8-21
Single-Sided Spur, page 8-24
• Measurement Difficulties, page 8-28
Agilent Technologies E5500 Phase Noise Measurement System 8-1
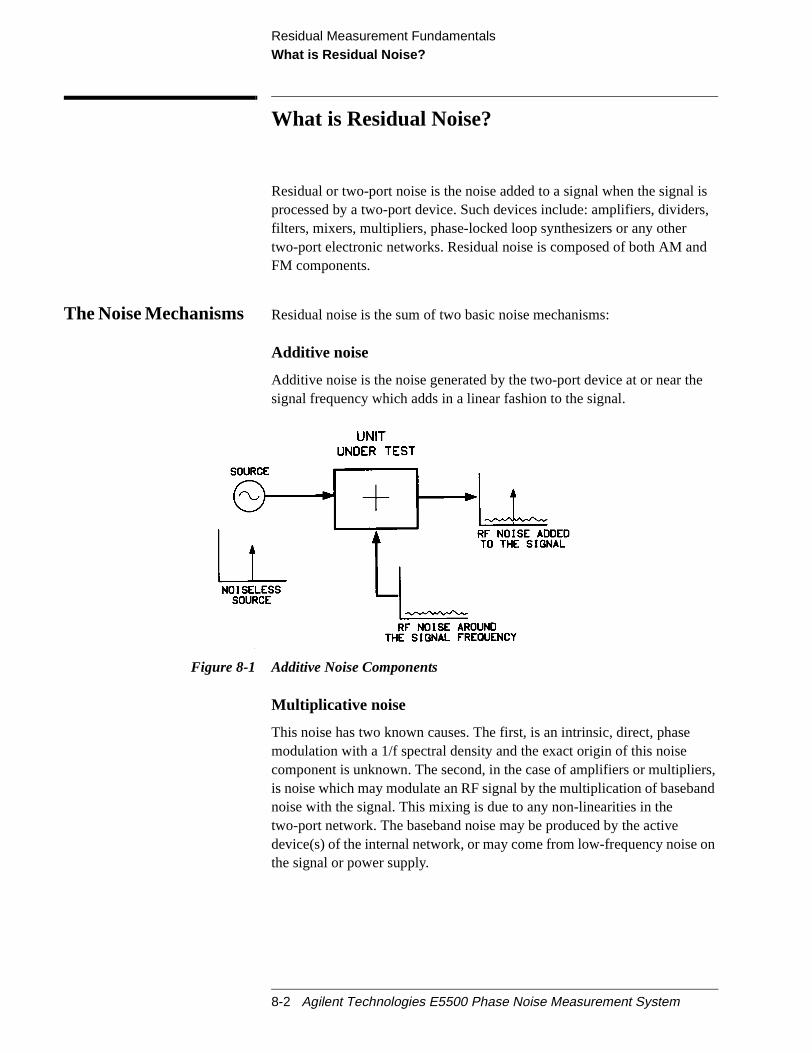
Residual Measurement FundamentalsWhat is Residual Noise?
l isrs,
d
e
rs,nd
on
What is Residual Noise?
Residual or two-port noise is the noise added to a signal when the signaprocessed by a two-port device. Such devices include: amplifiers, dividefilters, mixers, multipliers, phase-locked loop synthesizers or any othertwo-port electronic networks. Residual noise is composed of both AM anFM components.
The Noise Mechanisms Residual noise is the sum of two basic noise mechanisms:
Additive noise
Additive noise is the noise generated by the two-port device at or near thsignal frequency which adds in a linear fashion to the signal.
Figure 8-1 Additive Noise Components
Multiplicative noise
This noise has two known causes. The first, is an intrinsic, direct, phasemodulation with a 1/f spectral density and the exact origin of this noisecomponent is unknown. The second, in the case of amplifiers or multiplieis noise which may modulate an RF signal by the multiplication of basebanoise with the signal. This mixing is due to any non-linearities in thetwo-port network. The baseband noise may be produced by the activedevice(s) of the internal network, or may come from low-frequency noisethe signal or power supply.
8-2 Agilent Technologies E5500 Phase Noise Measurement System
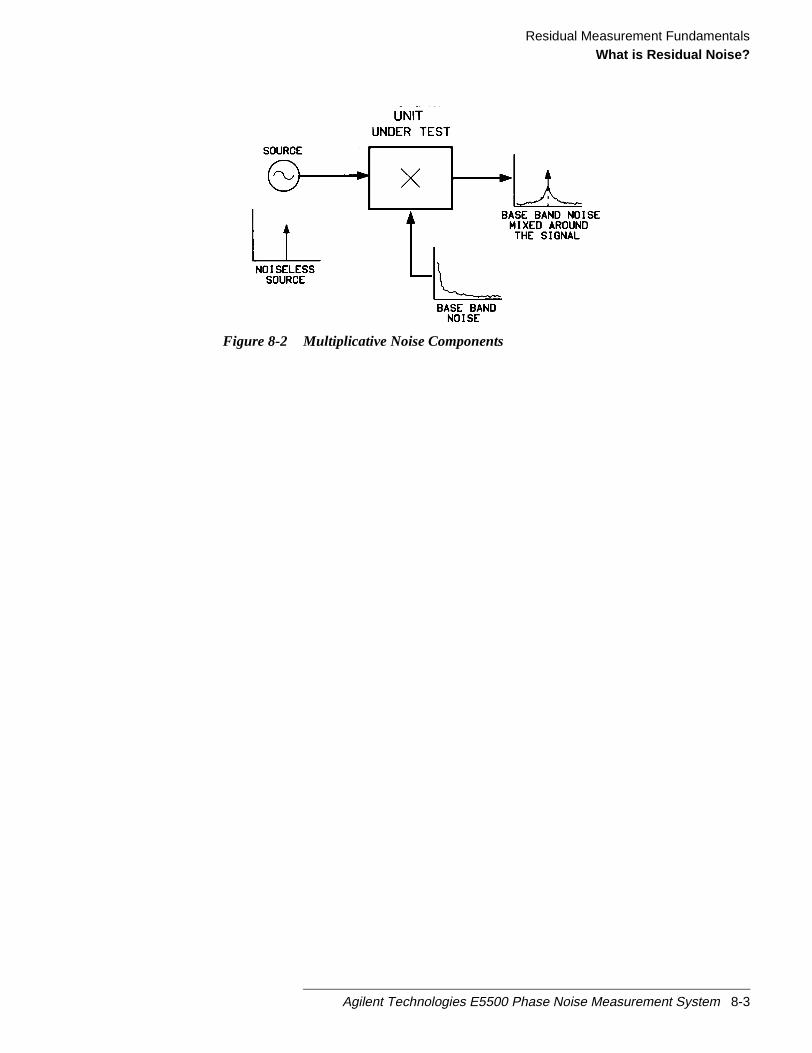
Residual Measurement FundamentalsWhat is Residual Noise?
Figure 8-2 Multiplicative Noise Components
Agilent Technologies E5500 Phase Noise Measurement System 8-3
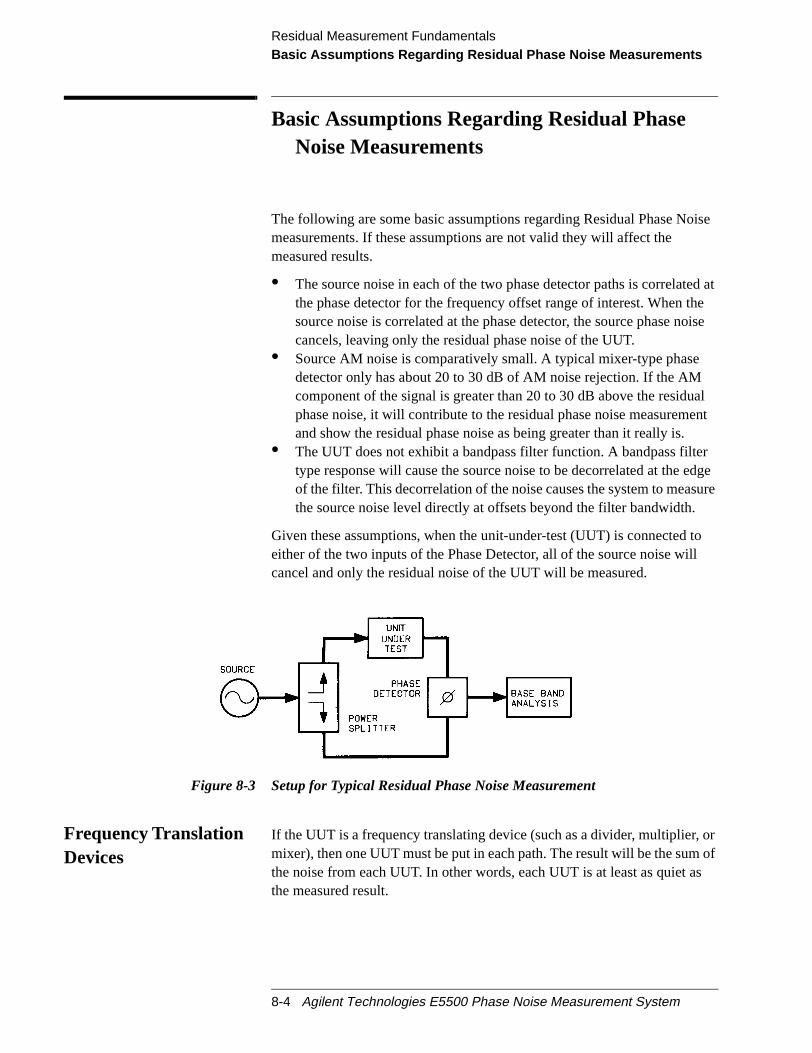
Residual Measurement FundamentalsBasic Assumptions Regarding Residual Phase Noise Measurements
ise
d ate
oise
alnt
rdgeure
to
orof
s
Basic Assumptions Regarding Residual PhaseNoise Measurements
The following are some basic assumptions regarding Residual Phase Nomeasurements. If these assumptions are not valid they will affect themeasured results.
• The source noise in each of the two phase detector paths is correlatethe phase detector for the frequency offset range of interest. When thsource noise is correlated at the phase detector, the source phase ncancels, leaving only the residual phase noise of the UUT.
• Source AM noise is comparatively small. A typical mixer-type phasedetector only has about 20 to 30 dB of AM noise rejection. If the AMcomponent of the signal is greater than 20 to 30 dB above the residuphase noise, it will contribute to the residual phase noise measuremeand show the residual phase noise as being greater than it really is.
• The UUT does not exhibit a bandpass filter function. A bandpass filtetype response will cause the source noise to be decorrelated at the eof the filter. This decorrelation of the noise causes the system to measthe source noise level directly at offsets beyond the filter bandwidth.
Given these assumptions, when the unit-under-test (UUT) is connectedeither of the two inputs of the Phase Detector, all of the source noise willcancel and only the residual noise of the UUT will be measured.
Figure 8-3 Setup for Typical Residual Phase Noise Measurement
Frequency TranslationDevices
If the UUT is a frequency translating device (such as a divider, multiplier,mixer), then one UUT must be put in each path. The result will be the sumthe noise from each UUT. In other words, each UUT is at least as quiet athe measured result.
8-4 Agilent Technologies E5500 Phase Noise Measurement System

Residual Measurement FundamentalsBasic Assumptions Regarding Residual Phase Noise Measurements
ishatast
cy,tase
If the UUT’s are identical, a possible (but not recommended) assumptionthat the noise of each UUT is half the measured result, or 3 dB less. All treally can be concluded is that the noise level of one of the UUT’s is at le3 dB lower than the measured result at any particular offset frequency.
If a more precise determination is required at any particular offset frequena third UUT must also be measured against the other two UUT’s. The dafrom each of the three measurements can then be processed by the phanoise software to give the noise of each of the individual UUT’s.
Figure 8-4 Measurement Setup for Two Similar UUTs
Agilent Technologies E5500 Phase Noise Measurement System 8-5
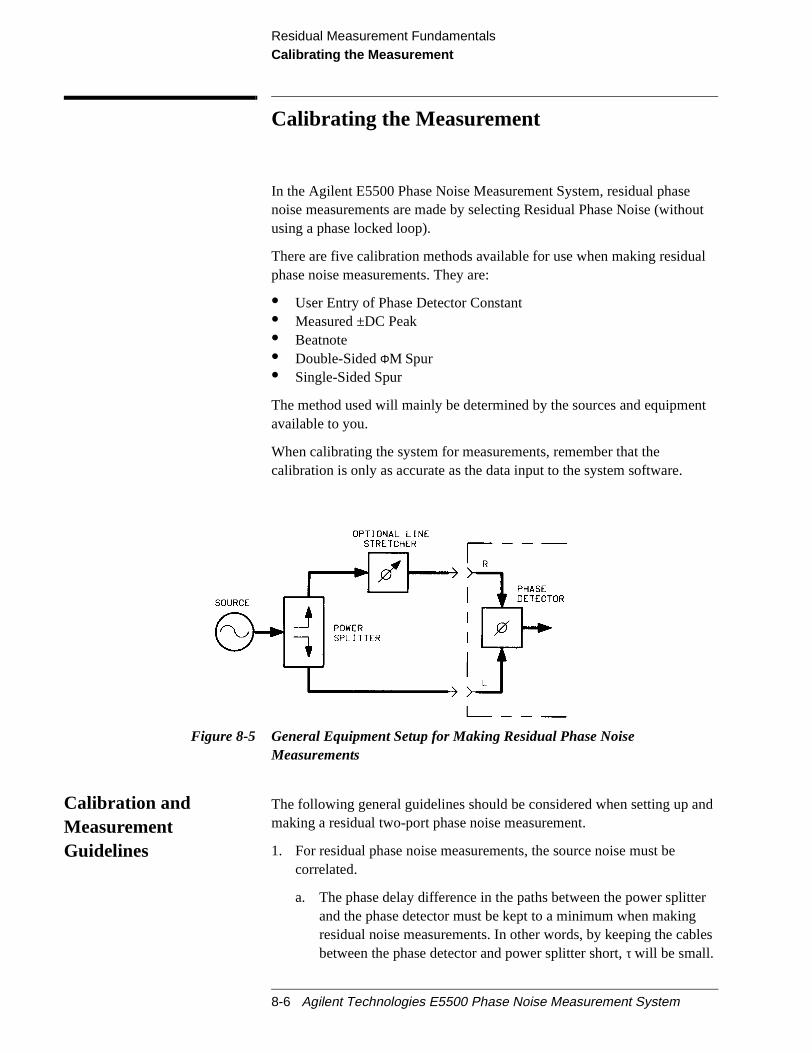
Residual Measurement FundamentalsCalibrating the Measurement
out
al
nt
nd
er
les
Calibrating the Measurement
In the Agilent E5500 Phase Noise Measurement System, residual phasenoise measurements are made by selecting Residual Phase Noise (withusing a phase locked loop).
There are five calibration methods available for use when making residuphase noise measurements. They are:
• User Entry of Phase Detector Constant• Measured ±DC Peak• Beatnote• Double-SidedΦM Spur• Single-Sided Spur
The method used will mainly be determined by the sources and equipmeavailable to you.
When calibrating the system for measurements, remember that thecalibration is only as accurate as the data input to the system software.
Figure 8-5 General Equipment Setup for Making Residual Phase NoiseMeasurements
Calibration andMeasurementGuidelines
The following general guidelines should be considered when setting up amaking a residual two-port phase noise measurement.
1. For residual phase noise measurements, the source noise must becorrelated.
a. The phase delay difference in the paths between the power splittand the phase detector must be kept to a minimum when makingresidual noise measurements. In other words, by keeping the cabbetween the phase detector and power splitter short,τ will be small.
8-6 Agilent Technologies E5500 Phase Noise Measurement System

Residual Measurement FundamentalsCalibrating the Measurement
et
rte
s
dB.e
e low
ed
it.plec
nedhecedgent
The attenuation of the source noise is a function of the carrier offsfrequency, and the delay time(τ ) and is equal to:
b. The source should also have a good broadband phase noise floobecause at sufficiently large carrier offsets it will tend to decorrelawhen measuring components with large delays. At , sourcenoise is rejected completely. the first null in noise can be used todetermine the delay difference. At , source noise showup unattenuated. At lower offsets, source noise is attenuated at20 dB per decade rate at.1 of , source noise is attenuated 20Examples of sources which best meet these requirements are thAgilent/HP 8644B and Agilent/HP 8642A/B.
The source used for making residual phase noise measurements must bin AM noise because source AM noise can cause AM toΦM conversion inthe UUT.
Mixer-type phase detectors only provide about 20 to 30 dB of rejection toAM noise in aΦM noise measurement so the AM noise can appear in thephase noise plot.
2. It is very important that all components in the test setup be well shieldfrom RFI. Unwanted RF coupling between components will make ameasurement setup very vulnerable to external electric fields aroundThe result may well be a setup going out of quadrature simply by peomoving around in the test setup area and altering surrounding electrifields. A loss of quadrature stops the measurement.
3. When making low-level measurements, the best results will be obtaifrom uncluttered setups. Soft foam rubber is very useful for isolating tUUT and other phase-sensitive components from mechanically-induphase noise. The mechanical shock of bumping the test set or kickinthe table will often knock a sensitive residual phase noise measuremout of quadrature.
f1τ---=
f1
2πτ----------=
12πτ----------
Agilent Technologies E5500 Phase Noise Measurement System 8-7
Residual Measurement FundamentalsCalibrating the Measurement
use
seracyque
nd
ey
he
he
er
4. When making an extremely sensitive measurement it is essential tosemi-rigid cable between the components. The bending of a flexiblecable from vibrations and temperature variations in the room can cauenough phase noise in flexible connecting cables to destroy the accuof a sensitive measurement. The connectors also must be tight; a torwrench is the best tool.
5. When measuring a low-noise device, it is important that the source aany amplification, required to achieve the proper power at the phasedetector, be placed before the splitter so it will be correlated out of thmeasurement. In cases where this is not possible; remember that annoise source, such as an amplifier, placed after the splitter in eitherphase detector path, will contribute to the measured noise.
6. An amplifier must be used in cases where the signal level out of theUUT is too small to drive the phase detector, or the drive level isinadequate to provide a low enough system noise floor. In this case tamplifier should have the following characteristics:
a. It should have the lowest possible noise figure, and the greatestpossible dynamic range.
b. The signal level must be kept as high as possible at all points in tsetup to minimize degradation from the thermal noise floor.
c. It should have only enough gain to provide the required signallevels. Excess gain leads to amplifiers operating in gaincompression, making them very vulnerable to multiplicative noiseproblems. The non-linearity of the active device produces mixingwhich multiplies the baseband noise of the active device and powsupply noise around the carrier.
d. The amplifier’s sensitivity to power supply noise and the powersupply noise itself must both be minimized.
8-8 Agilent Technologies E5500 Phase Noise Measurement System

Residual Measurement FundamentalsThe Calibration Options
ealso
ntan bean
o theer,
ther
oise
f all
e
The Calibration Options
There are five calibration methods that to choose from for calibrating atwo-port measurement. The procedure for each method is provided on thfollowing pages. The advantages and disadvantages of each method areprovided to help you select the best method for your application. Theprimary considerations for selecting a calibration method are:
• Measurement Accuracy• Equipment Availability
User Entry of PhaseDetector Constant
This calibration option requires that you know the phase detector constafor the specific measurement to be made. The phase detector constant cestimated from the source power levels (or a monitor oscilloscope) or it cbe determined using one of the other calibration methods.
Once determined, the phase detector constant can be entered directly intsystem software without going through a calibration sequence. Remembhowever, that the phase detector constant is unique to a particular set ofsources, the RF level into the phase detector and the test configuration.
Advantages:
• Easy method for calibrating the measurement system.• Requires little additional equipment: only an RF power meter to
manually measure the drive levels into the phase detector or monitoroscilloscope.
• Fastest method of calibration. If the same power levels are always atphase detector, (as in the case of leveled outputs), the phase detectosensitivity will always be essentially the same (within a dB or two). Ifthis accuracy is adequate, it is not necessary to recalibrate.
• Only one RF source is required.• Super-quick method of estimating the phase detector constant and n
floor to verify other calibration methods and check available dynamicrange.
Disadvantages:
• The user entry of the phase detector constant is the least accurate othe calibration methods.
• It does not take into account the amount of power at harmonics of thsignal.
Agilent Technologies E5500 Phase Noise Measurement System 8-9

Residual Measurement FundamentalsThe Calibration Options
you
he
Procedure
1. Connect circuit as perFigure 8-6, and tighten all connections.
Figure 8-6 Measuring Power at Phase Detector Signal Input Port
2. Measure the power level that will be applied to the signal input of theAgilent/HP 70420A’s Phase Detector. The following chart shows theacceptable amplitude ranges for the Agilent/HP 70420A PhaseDetectors.
Table 8-1 Acceptable Amplitude Ranges for the Phase Detectors
3. Locate the power level you measured on the left side of the PhaseDetector Sensitivity Graph (Figure 8-7 on page 8-11). Now move acrossthe graph at the measured level and find the corresponding PhaseDetector constant along the right edge of the graph. This is the valuewill enter as the Current Detector Constant when you define yourmeasurement. (Note that the approximate measurement noise floorprovided by the Signal Input port level is shown across the bottom of tgraph.)
Phase Detector
50 kHz to 1.6 GHz 1.2 to 26.5 GHz 1
1. Agilent/HP 70420A Phase Noise Test Set Options 001 and 201
Ref Input (L Port) Signal Input (RPort)
Ref Input (L Port) Signal Input (RPort)
+ 15 dBmto
+ 23 dBm
0 dBmto
+ 23 dBm
+ 7 dBmto
+ 10 dBm
0 dBmto
+ 5 dBm
8-10 Agilent Technologies E5500 Phase Noise Measurement System
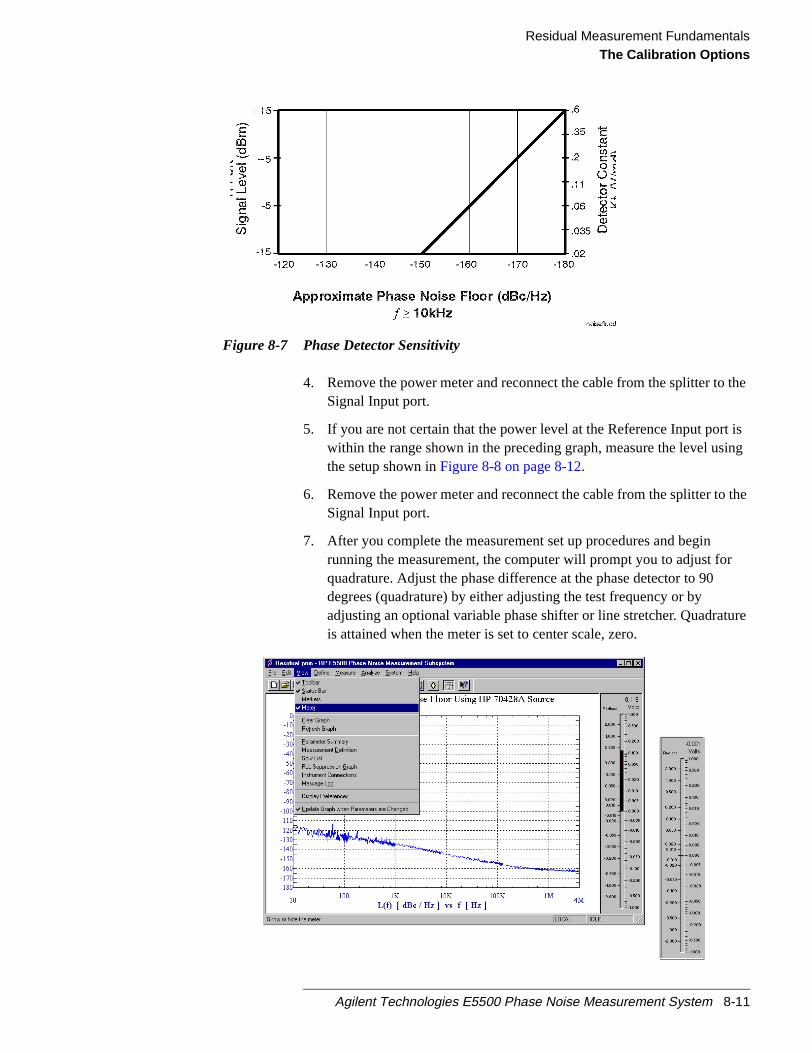
Residual Measurement FundamentalsThe Calibration Options
the
ising
the
ure
Figure 8-7 Phase Detector Sensitivity
4. Remove the power meter and reconnect the cable from the splitter toSignal Input port.
5. If you are not certain that the power level at the Reference Input portwithin the range shown in the preceding graph, measure the level usthe setup shown inFigure 8-8 on page 8-12.
6. Remove the power meter and reconnect the cable from the splitter toSignal Input port.
7. After you complete the measurement set up procedures and beginrunning the measurement, the computer will prompt you to adjust forquadrature. Adjust the phase difference at the phase detector to 90degrees (quadrature) by either adjusting the test frequency or byadjusting an optional variable phase shifter or line stretcher. Quadratis attained when the meter is set to center scale, zero.
Agilent Technologies E5500 Phase Noise Measurement System 8-11

Residual Measurement FundamentalsThe Calibration Options
e
e
NOTE For the system to accept the adjustment to quadrature, the meter must bwithin ±2 mV to ±4 mV.
8. Once you have attained quadrature, you are ready to proceed with thmeasurement.
Figure 8-8 Measuring Power at Phase Detector Reference Input Port
8-12 Agilent Technologies E5500 Phase Noise Measurement System
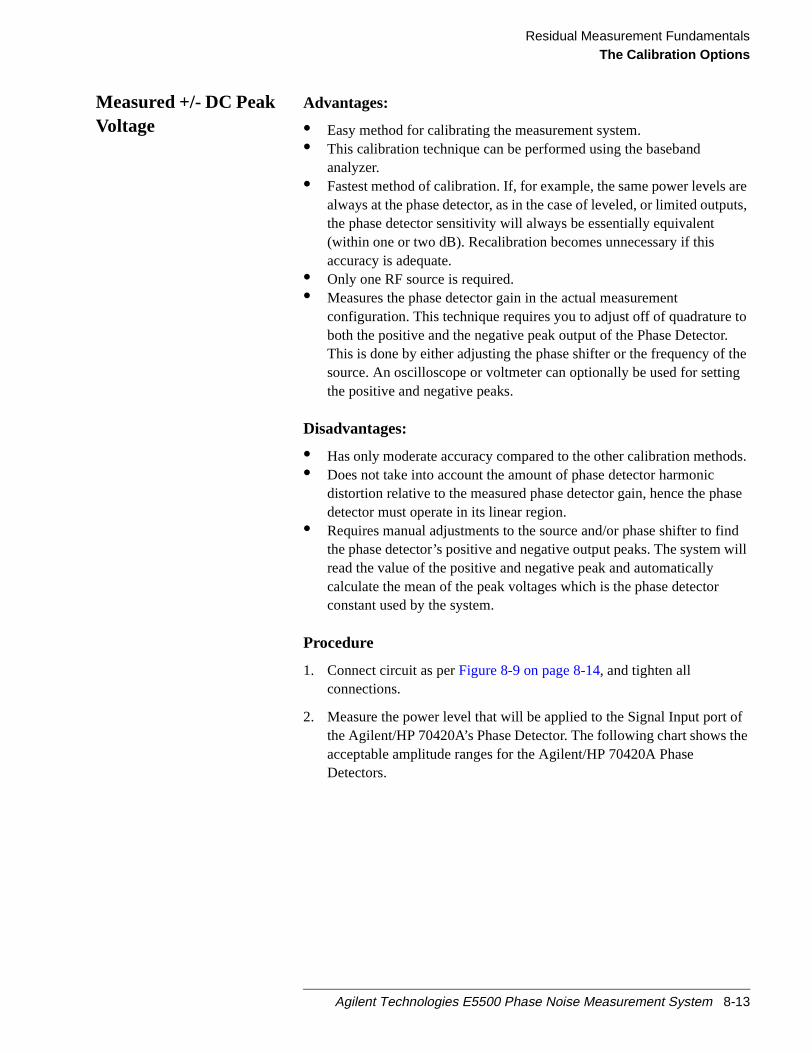
Residual Measurement FundamentalsThe Calibration Options
areuts,
to.theg
ds.
ase
indwill
fhe
Measured +/- DC PeakVoltage
Advantages:
• Easy method for calibrating the measurement system.• This calibration technique can be performed using the baseband
analyzer.• Fastest method of calibration. If, for example, the same power levels
always at the phase detector, as in the case of leveled, or limited outpthe phase detector sensitivity will always be essentially equivalent(within one or two dB). Recalibration becomes unnecessary if thisaccuracy is adequate.
• Only one RF source is required.• Measures the phase detector gain in the actual measurement
configuration. This technique requires you to adjust off of quadratureboth the positive and the negative peak output of the Phase DetectorThis is done by either adjusting the phase shifter or the frequency ofsource. An oscilloscope or voltmeter can optionally be used for settinthe positive and negative peaks.
Disadvantages:
• Has only moderate accuracy compared to the other calibration metho• Does not take into account the amount of phase detector harmonic
distortion relative to the measured phase detector gain, hence the phdetector must operate in its linear region.
• Requires manual adjustments to the source and/or phase shifter to fthe phase detector’s positive and negative output peaks. The systemread the value of the positive and negative peak and automaticallycalculate the mean of the peak voltages which is the phase detectorconstant used by the system.
Procedure
1. Connect circuit as perFigure 8-9 on page 8-14, and tighten allconnections.
2. Measure the power level that will be applied to the Signal Input port othe Agilent/HP 70420A’s Phase Detector. The following chart shows tacceptable amplitude ranges for the Agilent/HP 70420A PhaseDetectors.
Agilent Technologies E5500 Phase Noise Measurement System 8-13

Residual Measurement FundamentalsThe Calibration Options
e
eital
herse
usegas,
Table 8-2 Acceptable Amplitude Ranges for the Phase Detectors
Figure 8-9 Connection to Optional Oscilloscope for Determining Voltage Peaks
3. Adjust the phase difference at the phase detector as prompted by thphase noise software.
4. The system will measure the positive and negative peak voltage of thphase detector using an internal voltmeter. The quadrature meter digdisplay can be used to find the peak. The phase may be adjusted eitby varying the frequency of the source or by adjusting a variable phashifter or line stretcher.
NOTE Connecting an oscilloscope to the MONITOR port is recommended becathe signal can then be viewed to give visual confidence in the signal beinmeasured. As an example, noise could affect a voltmeter reading, whereon the oscilloscope any noise can be viewed and the signal corrected tominimize the noise before making the reading.
Phase Detector
50 kHz to 1.6 GHz 1.2 to 26.5 GHz 1
1. Agilent/HP 70420A Phase Noise Test Set Options 001 and 201
Ref Input (L Port) Signal Input (RPort)
Ref Input (L Port) Signal Input (RPort)
+ 15 dBmto
+ 23 dBm
0 dBmto
+ 23 dBm
+ 7 dBmto
+ 10 dBm
0 dBmto
+ 5 dBm
8-14 Agilent Technologies E5500 Phase Noise Measurement System

Residual Measurement FundamentalsThe Calibration Options
5. The system software will then calculate the phase detector constantautomatically using the following algorithm:
6. The system software will then prompt you to set the phase noisesoftware’s meter to quadrature.
7. The system will now measure the noise data.
Agilent Technologies E5500 Phase Noise Measurement System 8-15

Residual Measurement FundamentalsThe Calibration Options
ethe
seted
Measured Beatnote This calibration option requires that one of the input frequency sources btunable such that a beatnote can be acquired from the two sources. Forsystem to calibrate, the beatnote frequency must be within the followingranges.
Advantages:
• Simple method of calibration.
Disadvantages:
• It requires two RF sources, separated by .1 Hz to 50 MHz at the phadetector. The calibration source output power must be manually adjusto the same level as the power splitter output it replaces (requires apower meter).
Table 8-3 Beatnote Frequency Ranges
Carrier FrequencyBeatnote FrequencyRange
<500 kHz 10 Hz to 10 kHz
<5 MHz 10 Hz to 100 kHz
<50 MHz 10 Hz to 1 MHz
<250 MHz 10 Hz to 10 MHz
>250 MHz 10 Hz to 50 MHz
or 1/2 the frequency range of the configured analyzer, orwhichever is lower.
8-16 Agilent Technologies E5500 Phase Noise Measurement System

Residual Measurement FundamentalsThe Calibration Options
fhe
red
in
Procedure 1. Connect circuit as perFigure 8-10 on page 8-17, and tighten allconnections.
Figure 8-10 Measuring Power from Splitter
2. Measure the power level that will be applied to the Signal Input port othe Agilent/HP 70420A’s Phase Detector. The following chart shows tacceptable amplitude ranges for the Agilent/HP 70420A PhaseDetectors.
Table 8-4 Acceptable Amplitude Ranges for the Phase Detectors
3. Measure the output power at the side of the power splitter where thecalibration source will be substituted, then terminate in 50 ohms.
4. Adjust the calibration source to the same output power as the measuoutput power of the power splitter.
5. Adjust the output frequency such that the beatnote frequency is withthe range of the analyzers being used.
6. The system can now measure the calibration constant.
7. Disconnect the calibration source and reconnect the power splitter.
Phase Detector
50 kHz to 1.6 GHz 1.2 to 26.5 GHz 1
1. Agilent/HP 70420A Phase Noise Test Set Options 001 and 201
Ref Input (L Port) Signal Input (RPort)
Ref Input (L Port) Signal Input (RPort)
+ 15 dBmto
+ 23 dBm
0 dBmto
+ 23 dBm
+ 7 dBmto
+ 10 dBm
0 dBmto
+ 5 dBm
Agilent Technologies E5500 Phase Noise Measurement System 8-17
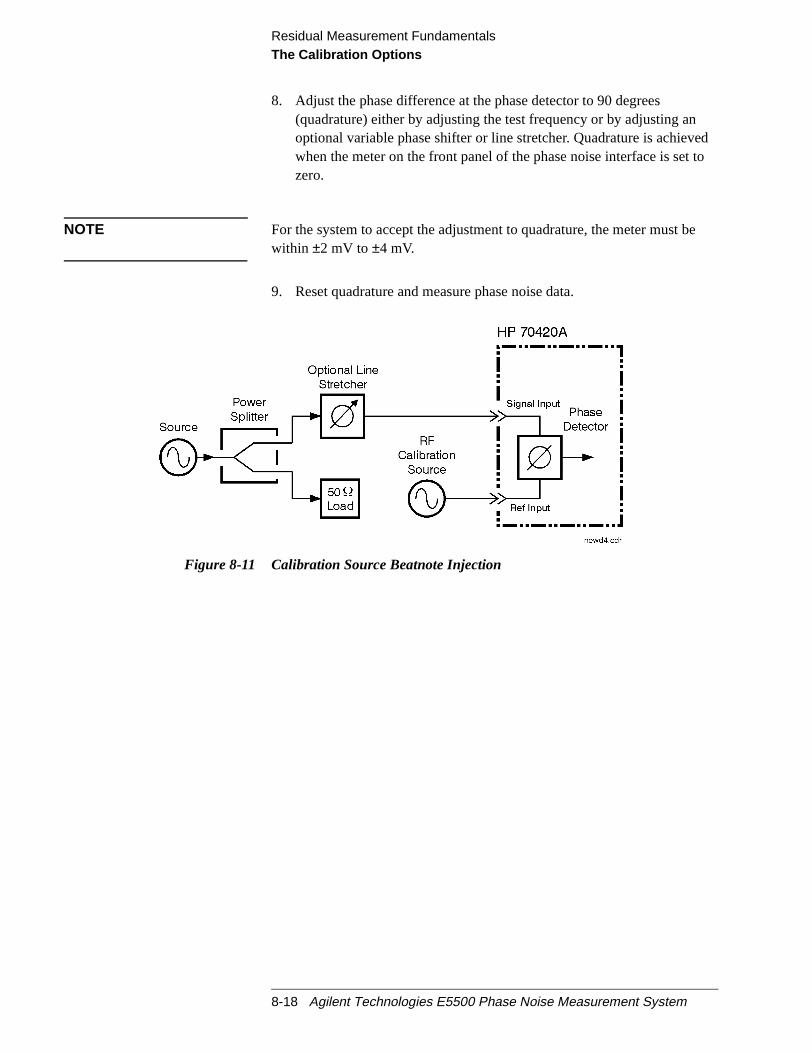
Residual Measurement FundamentalsThe Calibration Options
edto
e
8. Adjust the phase difference at the phase detector to 90 degrees(quadrature) either by adjusting the test frequency or by adjusting anoptional variable phase shifter or line stretcher. Quadrature is achievwhen the meter on the front panel of the phase noise interface is setzero.
NOTE For the system to accept the adjustment to quadrature, the meter must bwithin ±2 mV to ±4 mV.
9. Reset quadrature and measure phase noise data.
Figure 8-11 Calibration Source Beatnote Injection
8-18 Agilent Technologies E5500 Phase Noise Measurement System

Residual Measurement FundamentalsThe Calibration Options
, the
for
Synthesized ResidualMeasurement usingBeatnote Cal
This calibration option requires two synthesizers of which one must betunable such that a beatnote can be acquired. For the system to calibratebeatnote frequency must be within the following ranges.
Procedure 1. Connect circuit as perFigure 8-12 on page 8-19, and tighten allconnections.
Figure 8-12 Synthesized Residual Measurement using Beatnote Cal
2. Offset the carrier frequency of one synthesizer to produce a beatnotecal.
Table 8-5 Beatnote Frequency Ranges
Carrier FrequencyBeatnote FrequencyRange
<500 kHz 10 Hz to 10 kHz
<5 MHz 10 Hz to 100 kHz
<50 MHz 10 Hz to 1 MHz
<250 MHz 10 Hz to 10 MHz
>250 MHz 10 Hz to 50 MHz
or 1/2 the frequency range of the configured analyzer, orwhichever is lower.
Agilent Technologies E5500 Phase Noise Measurement System 8-19
Residual Measurement FundamentalsThe Calibration Options
the
edto
3. After the phase noise system reads the beatnote, set the software tosame carrier frequency.
4. Adjust the phase difference at the phase detector to 90 degrees(quadrature) either by adjusting the synthesizer or by adjusting anoptional variable phase shifter or line stretcher. Quadrature is achievwhen the meter on the front panel of the phase noise interface is setzero.
8-20 Agilent Technologies E5500 Phase Noise Measurement System
Residual Measurement FundamentalsThe Calibration Options
z
t.
ns,e
ide
Double-Sided Spur This calibration option has the following requirements:
• One of the input frequency sources must be capable of being phasemodulated.
• The resultant sideband spurs from the phase modulation must haveamplitudes that are –100 dB and –20 dB relative to the carrieramplitude.
• The offset frequency or modulation frequency must be between 10 Hand maximum (See the“Measured Beatnote”technique onpage 8-16).
Advantages:
• Requires only one RF source• Calibration is done under actual measurement conditions so all
non-linearities and harmonics of the phase detector are calibrated ou
NOTE Because the calibration is performed under actual measurement conditiothe Double-sided Spur Method and the Single-sided Spur Method are thtwo most accurate calibration methods.
Disadvantages:
• Requires a phase modulator which operates at the desired carrierfrequency.
• Requires audio calibration source.• Requires RF spectrum analyzer for manual measurement ofΦM
sidebands or preferably a modulation analyzer.
NOTE Most phase modulators are typically narrow-band devices; therefore, a wrange of test frequencies may require multiple phase modulators.
Agilent Technologies E5500 Phase Noise Measurement System 8-21

Residual Measurement FundamentalsThe Calibration Options
fhe
eor’s
andnd
Procedure
1. Connect circuit as perFigure 8-13 on page 8-22, and tighten allconnections.
Figure 8-13 Calibration Setup
2. Measure the power level that will be applied to the Signal Input port othe Agilent/HP 70420A’s Phase Detector. The following chart shows tacceptable amplitude ranges for the Agilent/HP 70420A PhaseDetectors.
Table 8-6 Acceptable Amplitude Ranges for the Phase Detectors
3. Using the RF spectrum analyzer or modulation analyzer, measure thcarrier-to-sideband ratio of the phase modulation at the phase detectmodulated port and the modulation frequency. The audio calibrationsource should be adjusted such that the sidebands are between –30–60 dB below the carrier and the audio frequency is between 50 Hz a50 MHz.
Phase Detector
50 kHz to 1.6 GHz 1.2 to 26.5 GHz 1
1. Agilent/HP 70420A Phase Noise Test Set Options 001 and 201
Ref Input (L Port) Signal Input (RPort)
Ref Input (L Port) Signal Input (RPort)
+ 15 dBmto
+ 23 dBm
0 dBmto
+ 23 dBm
+ 7 dBmto
+ 10 dBm
0 dBmto
+ 5 dBm
8-22 Agilent Technologies E5500 Phase Noise Measurement System

Residual Measurement FundamentalsThe Calibration Options
el of
thellern the
r.ng
ed
e
Figure 8-14 Measuring Carrier-to-sideband Ratio of the Modulated Port
4. Measure the carrier-to-sideband ratio of the non-modulated side of thphase detector. It must be at least 20 dB less than the modulation levethe modulated port. This level is necessary to prevent cancellation ofmodulation in the phase detector. Cancellation would result in a smaphase detector constant, or a measured noise level that is worse thaactual performance. The modulation level is set by the port-to-portisolation of the power splitter and the isolation of the phase modulatoThis isolation can be improved at the expense of signal level by addian attenuator between the phase modulator and the power splitter.
5. Connect the phase detector.
6. Adjust the phase difference at the phase detector to 90 degrees(quadrature) either by adjusting the test frequency or by adjusting anoptional variable phase shifter or line stretcher. Quadrature is achievwhen the meter in the phase noise software is set to center scale(±2 mV).
NOTE For the system to accept the adjustment to quadrature, the meter must bwithin ±2 mV to ±4 mV.
7. Set the Type of Measurement to Phase Noise Without Using a PLL.
8. Set the Calibration Technique to Derive From Double-sided Spur andenter the sideband amplitude and offset frequency.
9. Select New Measurement.
Agilent Technologies E5500 Phase Noise Measurement System 8-23
Residual Measurement FundamentalsThe Calibration Options
sing
ur
z.r
on
on
st,
rce
10. Check quadrature and measure the phase detector constant by presY to proceed.
11. Remove audio source.
12. Reset quadrature and measure phase noise data.
Single-Sided Spur This calibration option has the following requirements:
• A third source to generate a single sided spur.• An external power combiner (or directional coupler) to add the
calibration spur to the frequency carrier under test. The calibration spmust have an amplitude –100 dB and –20 dB relative to the carrieramplitude. The offset frequency of the spur must be 20 Hz and 20 MH
• A spectrum analyzer or other means to measure the single sided spurelative to the carrier signal.
You will find that the equipment setup for this calibration option is similar tthe others except that an additional source and a power splitter have beeadded so that the spur can be summed with the input carrier frequency.
Advantages:
Calibration is done under actual measurement conditions so allnon-linearities and harmonics of the phase detector are calibrated out.
NOTE The Single-sided Spur Method and the Double-sided Spur Method (Opti4) are the two most accurate methods.
Broadband couplers with good directivity are available, at reasonable coto couple in the calibration spur.
Disadvantages:
Requires a second RF sources that can be set between 10 Hz and up to50 MHz (depending on the baseband analyzer used) from the carrier soufrequency.
Requires an RF spectrum analyzer for manual measurement of thesignal-to-spur ratio and the spur offset frequency.
8-24 Agilent Technologies E5500 Phase Noise Measurement System

Residual Measurement FundamentalsThe Calibration Options
fhe
Procedure
1. Connect circuit as perFigure 8-15 on page 8-25, and tighten allconnections. Note that the input signal into the directional coupler isbeing supplied to the coupler’s output port.
Figure 8-15 Calibration Setup
2. Measure the power level that will be applied to the Signal Input port othe Agilent/HP 70420A’s Phase Detector. The following chart shows tacceptable amplitude ranges for the Agilent/HP 70420A PhaseDetectors.
Table 8-7 Acceptable Amplitude Ranges for the Phase Detectors
Phase Detector
50 kHz to 1.6 GHz 1.2 to 26.5 GHz 1
1. Agilent/HP 70420A Phase Noise Test Set Options 001 and 201
Ref Input (L Port) Signal Input (RPort)
Ref Input (L Port) Signal Input (RPort)
+ 15 dBmto
+ 23 dBm
0 dBmto
+ 23 dBm
+ 7 dBmto
+ 10 dBm
0 dBmto
+ 5 dBm
Agilent Technologies E5500 Phase Noise Measurement System 8-25

Residual Measurement FundamentalsThe Calibration Options
e
chthe
ase
llern the
ng
3. Measure the carrier-to-single-sided-spur ratio out of the coupler at thphase detector’s modulated port and the offset frequency with the RFspectrum analyzer. The RF calibration source should be adjusted suthat the sidebands are between –30 and –60 dB below the carrier andfrequency offset of the spur between 10 Hz and 50 MHz.
Figure 8-16 Carrier-to-spur Ratio of Modulated Signal
4. Measure the carrier-to-spur ratio of the non-modulated side of the phdetector. It must be at least 20 dB less than the spur ratio of themodulated port. This level is necessary to prevent cancellation of themodulation in the phase detector. Cancellation would result in a smaphase detector constant, or a measured noise level that is worse thaactual performance. The isolation level is set by the port-to-portisolation of the power splitter and the isolation of the –20 dB coupler.This isolation can be improved at the expense of signal level by addian attenuator between the coupler and the power splitter.
8-26 Agilent Technologies E5500 Phase Noise Measurement System
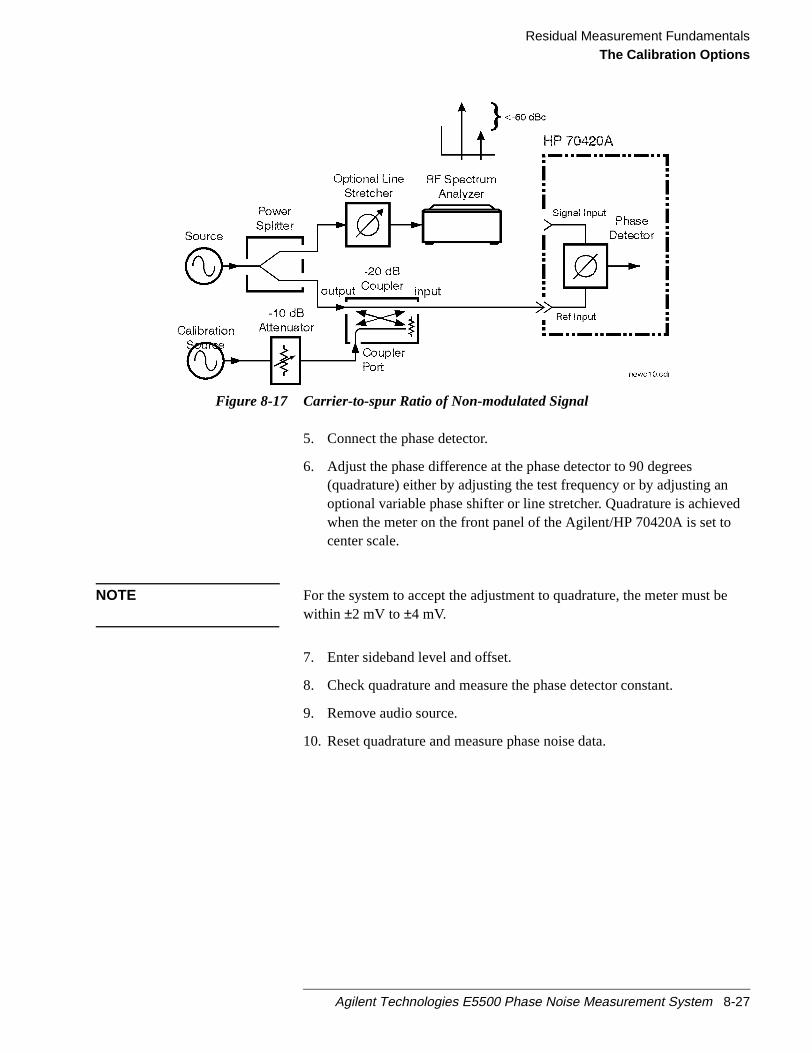
Residual Measurement FundamentalsThe Calibration Options
ed
e
Figure 8-17 Carrier-to-spur Ratio of Non-modulated Signal
5. Connect the phase detector.
6. Adjust the phase difference at the phase detector to 90 degrees(quadrature) either by adjusting the test frequency or by adjusting anoptional variable phase shifter or line stretcher. Quadrature is achievwhen the meter on the front panel of the Agilent/HP 70420A is set tocenter scale.
NOTE For the system to accept the adjustment to quadrature, the meter must bwithin ±2 mV to ±4 mV.
7. Enter sideband level and offset.
8. Check quadrature and measure the phase detector constant.
9. Remove audio source.
10. Reset quadrature and measure phase noise data.
Agilent Technologies E5500 Phase Noise Measurement System 8-27

Residual Measurement FundamentalsMeasurement Difficulties
eed.
lems
s
ndre.
Measurement Difficulties
Chapter 6, Evaluating Results, contains troubleshooting information to bused after the measurement has been made, and a plot has been obtain
NOTE When making phase noise measurements it is important to keep yourequipment connected until the measurements have been made, all probcorrected, and the results have been evaluated to make sure that themeasurement is valid. If the equipment is disconnected before the resulthave been fully evaluated, it may be difficult to troubleshoot themeasurement.
System Connections The first thing to check if problems occur is the instrument connections asettings as this is the most common error. It is also important to make suthe levels are correct into the Agilent/HP 70420A Phase Detector Inputs
8-28 Agilent Technologies E5500 Phase Noise Measurement System

9 Residual Measurement Examples
What You’ll Find in This Chapter
• Amplifier Measurement Example, page 9-2(res_noise_1ghz_demoamp.pnm)
CAUTION To prevent damage to the Agilent/HP 70420A test set’s hardwarecomponents, the input signalmust notbe applied to the signal inputconnector until the input attenuator has been correctly set for the desiredconfiguration, as show inTable 9-2 on page 9-8. Apply the input signalwhen theConnection Diagramappears.
Agilent Technologies E5500 Phase Noise Measurement System 9-1

Residual Measurement ExamplesAmplifier Measurement Example
f
F
e
e
Amplifier Measurement Example
This example contains information about measuring the residual noise otwo port devices
This example demostrates a residual phase noise measurement for an RAmplifier. Refer toChapter 8, “Residual Measurement Fundamentals”formore information about residual phase noise measurements.
CAUTION To prevent damage to the Agilent/HP 70420A test set’s hardwarecomponents, the input signalmust notbe applied to the signal inputconnector until the input attenuator has been correctly set for the desiredconfiguration, as show inTable 9-2 on page 9-8. Apply the input signalwhen theConnection Diagramappears.
Required Equipment The following equipment is required for this example in addition the phasnoise test system and your unit-under-test (UUT).
NOTE To ensure accurate measurements, you should allow the UUT andmeasurement equipment to warm up at least one hour before making thnoise measurement.
Table 9-1 Required Equipment for theResidual Measurement using theAgilent/HP 70420A MeasurementExample
Equipment Quantity Comments
RF Amplifier 1
Stimulus Source 1 Frequency of amplitude under test
Power Splitter 1 NARDA 30183
Coax Cables And adequate adapters to connectthe UUT and reference source tothe test set.
9-2 Agilent Technologies E5500 Phase Noise Measurement System

Residual Measurement ExamplesAmplifier Measurement Example
to set
The setup for a residual phase noise measurement uses a phase shifterquadrature at the phase detector.Defining theMeasurement
1. From theFile menu, chooseOpen.
2. If necessary, choose the drive or directory where the file you want isstored.
3. In theFile Namebox, choose “res_noise_1ghz_demoamp.pnm”.
Agilent Technologies E5500 Phase Noise Measurement System 9-3

Residual Measurement ExamplesAmplifier Measurement Example
4. Click theOpen button.
The appropriate measurement definition parameters for this examplehave been pre-stored in this file.Table 9-4 on page 9-14lists theparameter data that has been entered for this residual phase noisemeasurement example.)
5. From theDefine menu, chooseMeasurement; then choose theTypeand Rangetab from theDefine Measurementwindow.
a. From the Measurement Type pull-down, selectResidual PhaseNoise (without using phase lock loop).
9-4 Agilent Technologies E5500 Phase Noise Measurement System

Residual Measurement ExamplesAmplifier Measurement Example
6. Choose theSourcestab from theDefine Measurementwindow.
a. Enter the carrier (center) frequency of your UUT. Enter the samefrequency for the detector input frequency.
7. Choose theCal tab from theDefine Measurementwindow.
b. SelectDerive detector constant from measured +/- DC peakvoltageas the calibration method.
Agilent Technologies E5500 Phase Noise Measurement System 9-5

Residual Measurement ExamplesAmplifier Measurement Example
w.
8. Choose the Block Diagram tab from the Define Measurement windoa. From thePhase Shifterpull-down, selectManual.
b. From thePhase Detectorpull-down, selectAutomatic DetectorSelection.
9. Choose theGraph tab from theDefine Measurementwindow.
a. Enter a graph description of your choice (E5500 Residual PhaseNoise Measurement @ 1 GHz, for example).
10. When you have completed these operations, click the Close button.
9-6 Agilent Technologies E5500 Phase Noise Measurement System

Residual Measurement ExamplesAmplifier Measurement Example
s
e forown
Setup Considerations Connecting Cables
The best results will be obtained if semi-rigid coaxial cables are used toconnect the components used in the measurement; however, BNC cablehave been specified because they are more widely available. Using BNCcables may degrade the close-in phase noise results and, while adequatthis example, should not be used for an actual measurement on an unkndevice unless absolutely necessary.
Measurement Environment
The low noise floors typical of these devices may require that specialattention be given to the measurement environment. The followingprecautions will help ensure reliable test results:
• Filtering on power supply lines• Protection from microphonics• Shielding from air currents may be necessary.
Beginning theMeasurement
1. From theView menu, chooseMeter to select the quadrature meter.
Agilent Technologies E5500 Phase Noise Measurement System 9-7
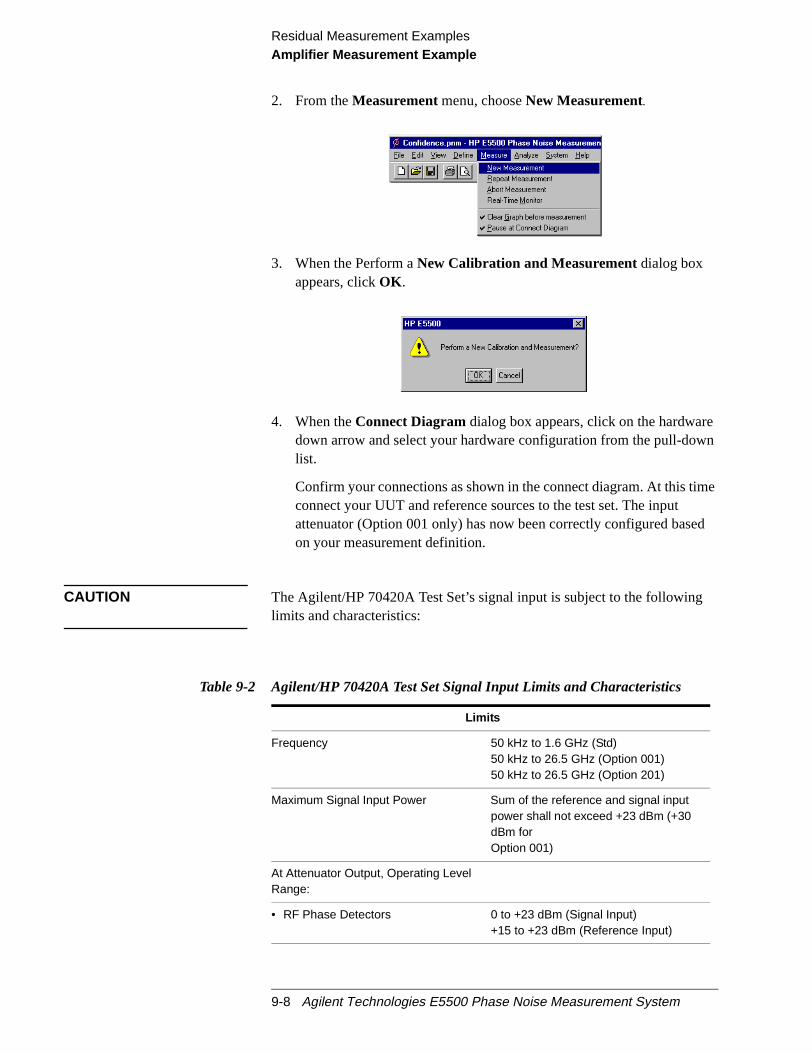
Residual Measurement ExamplesAmplifier Measurement Example
n
e
d
2. From theMeasurementmenu, chooseNew Measurement.
3. When the Perform aNew Calibration and Measurementdialog boxappears, clickOK .
4. When theConnect Diagramdialog box appears, click on the hardwaredown arrow and select your hardware configuration from the pull-dowlist.
Confirm your connections as shown in the connect diagram. At this timconnect your UUT and reference sources to the test set. The inputattenuator (Option 001 only) has now been correctly configured baseon your measurement definition.
CAUTION The Agilent/HP 70420A Test Set’s signal input is subject to the followinglimits and characteristics:
Table 9-2 Agilent/HP 70420A Test Set Signal Input Limits and Characteristics
Limits
Frequency 50 kHz to 1.6 GHz (Std)50 kHz to 26.5 GHz (Option 001)50 kHz to 26.5 GHz (Option 201)
Maximum Signal Input Power Sum of the reference and signal inputpower shall not exceed +23 dBm (+30dBm forOption 001)
At Attenuator Output, Operating LevelRange:
• RF Phase Detectors 0 to +23 dBm (Signal Input)+15 to +23 dBm (Reference Input)
9-8 Agilent Technologies E5500 Phase Noise Measurement System
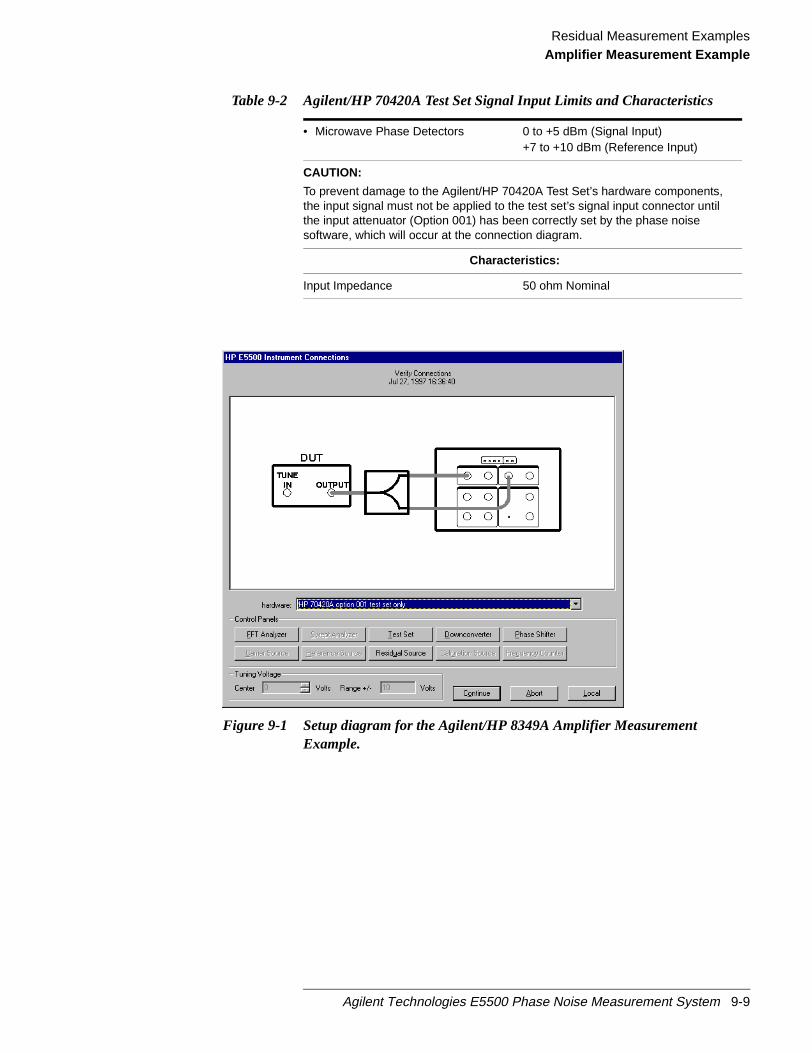
Residual Measurement ExamplesAmplifier Measurement Example
Figure 9-1 Setup diagram for the Agilent/HP 8349A Amplifier MeasurementExample.
• Microwave Phase Detectors 0 to +5 dBm (Signal Input)+7 to +10 dBm (Reference Input)
CAUTION:
To prevent damage to the Agilent/HP 70420A Test Set’s hardware components,the input signal must not be applied to the test set’s signal input connector untilthe input attenuator (Option 001) has been correctly set by the phase noisesoftware, which will occur at the connection diagram.
Characteristics:
Input Impedance 50 ohm Nominal
Table 9-2 Agilent/HP 70420A Test Set Signal Input Limits and Characteristics
Agilent Technologies E5500 Phase Noise Measurement System 9-9

Residual Measurement ExamplesAmplifier Measurement Example
fheors.
Residual Connect Diagram Example
Making theMeasurement
Calibrate the Measurement using Measured +/- DC Peak Voltage
Refer toChapter 8, “Residual Measurement Fundamentals”for moreinformation about residual phase noise measurements calibration types.
Procedure
1. Connect circuit as perFigure 9-2 on page 9-11, and tighten allconnections.
2. Measure the power level that will be applied to the Signal Input port othe Agilent/HP 70420A’s phase detector. The following chart shows tacceptable amplitude ranges for the Agilent/HP 70420A phase detect
9-10 Agilent Technologies E5500 Phase Noise Measurement System

Residual Measurement ExamplesAmplifier Measurement Example
Table 9-3 Acceptable Amplitude Ranges for the Phase Detectors
Figure 9-2 Connection to Optional Oscilloscope for Determining Voltage Peaks
Phase Detector
50 kHz to 1.6 GHz 1.2 to 26.5 GHz 1
1. Agilent/HP 70420A Phase Noise Test Set Options 001 and 201
Ref Input (L Port) Signal Input (RPort)
Ref Input (L Port) Signal Input (RPort)
+ 15 dBmto
+ 23 dBm
0 dBmto
+ 23 dBm
+ 7 dBmto
+ 10 dBm
0 dBmto
+ 5 dBm
Agilent Technologies E5500 Phase Noise Measurement System 9-11
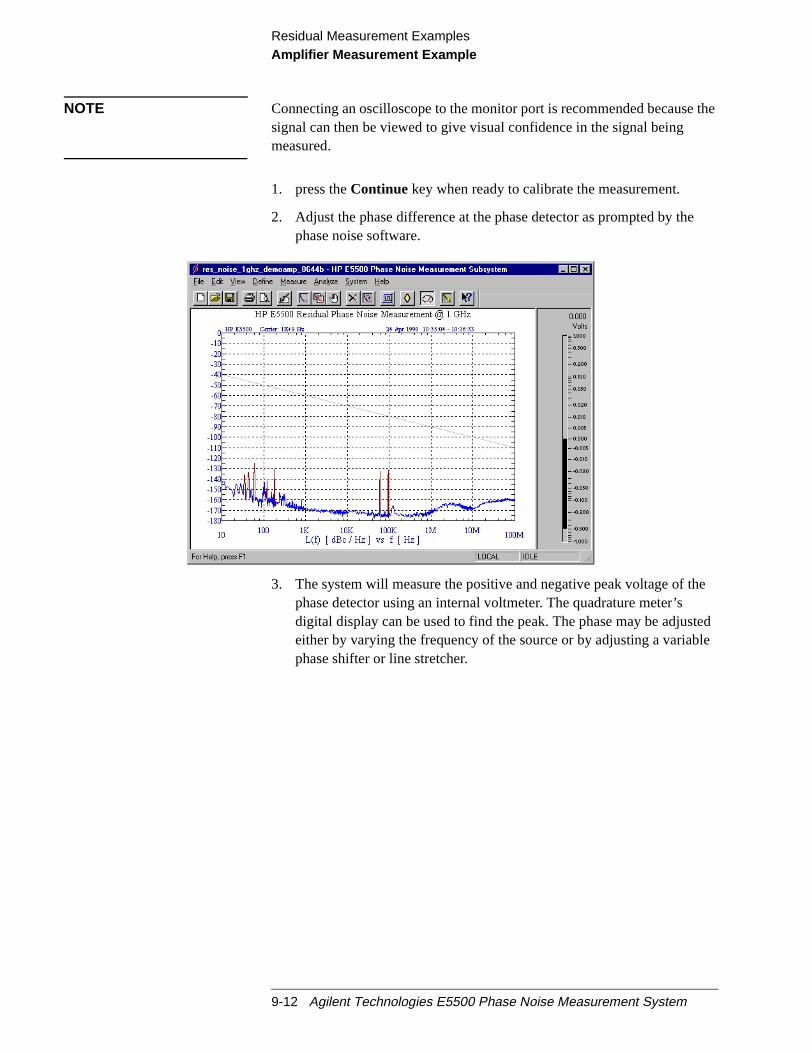
Residual Measurement ExamplesAmplifier Measurement Example
the
e
e
tedle
NOTE Connecting an oscilloscope to the monitor port is recommended becausesignal can then be viewed to give visual confidence in the signal beingmeasured.
1. press theContinue key when ready to calibrate the measurement.
2. Adjust the phase difference at the phase detector as prompted by thphase noise software.
3. The system will measure the positive and negative peak voltage of thphase detector using an internal voltmeter. The quadrature meter’sdigital display can be used to find the peak. The phase may be adjuseither by varying the frequency of the source or by adjusting a variabphase shifter or line stretcher.
9-12 Agilent Technologies E5500 Phase Noise Measurement System
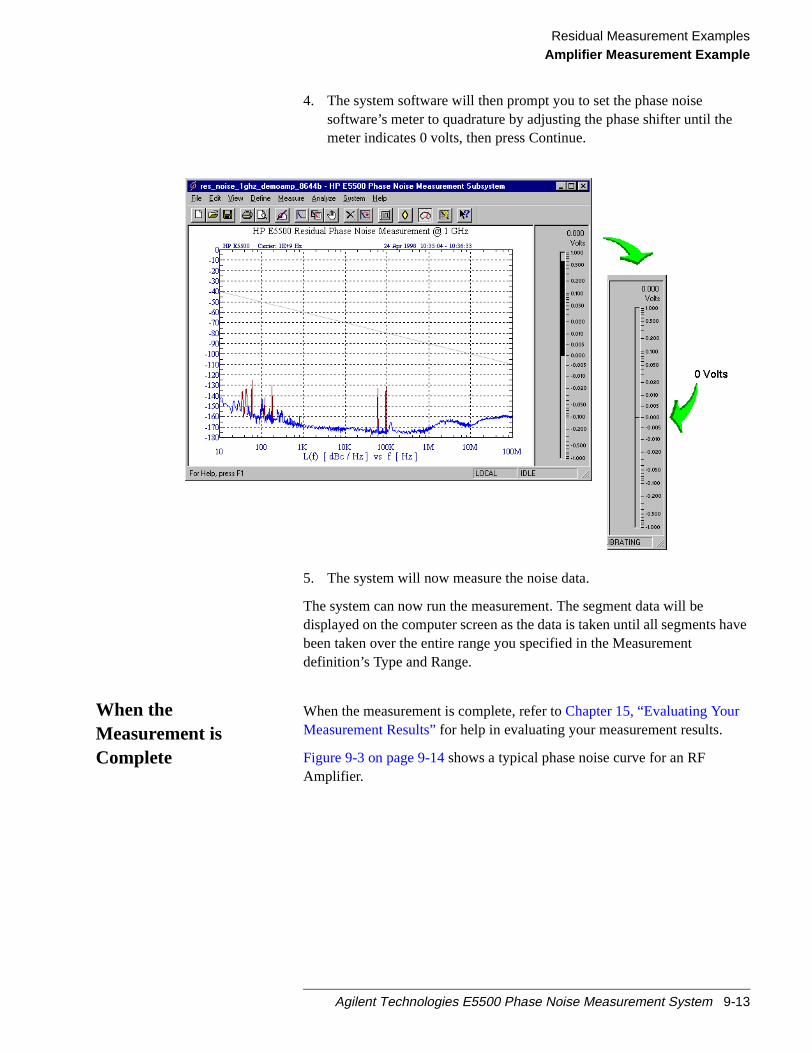
Residual Measurement ExamplesAmplifier Measurement Example
have
4. The system software will then prompt you to set the phase noisesoftware’s meter to quadrature by adjusting the phase shifter until themeter indicates 0 volts, then press Continue.
5. The system will now measure the noise data.
The system can now run the measurement. The segment data will bedisplayed on the computer screen as the data is taken until all segmentsbeen taken over the entire range you specified in the Measurementdefinition’s Type and Range.
When theMeasurement isComplete
When the measurement is complete, refer toChapter 15, “Evaluating YourMeasurement Results”for help in evaluating your measurement results.
Figure 9-3 on page 9-14shows a typical phase noise curve for an RFAmplifier.
Agilent Technologies E5500 Phase Noise Measurement System 9-13
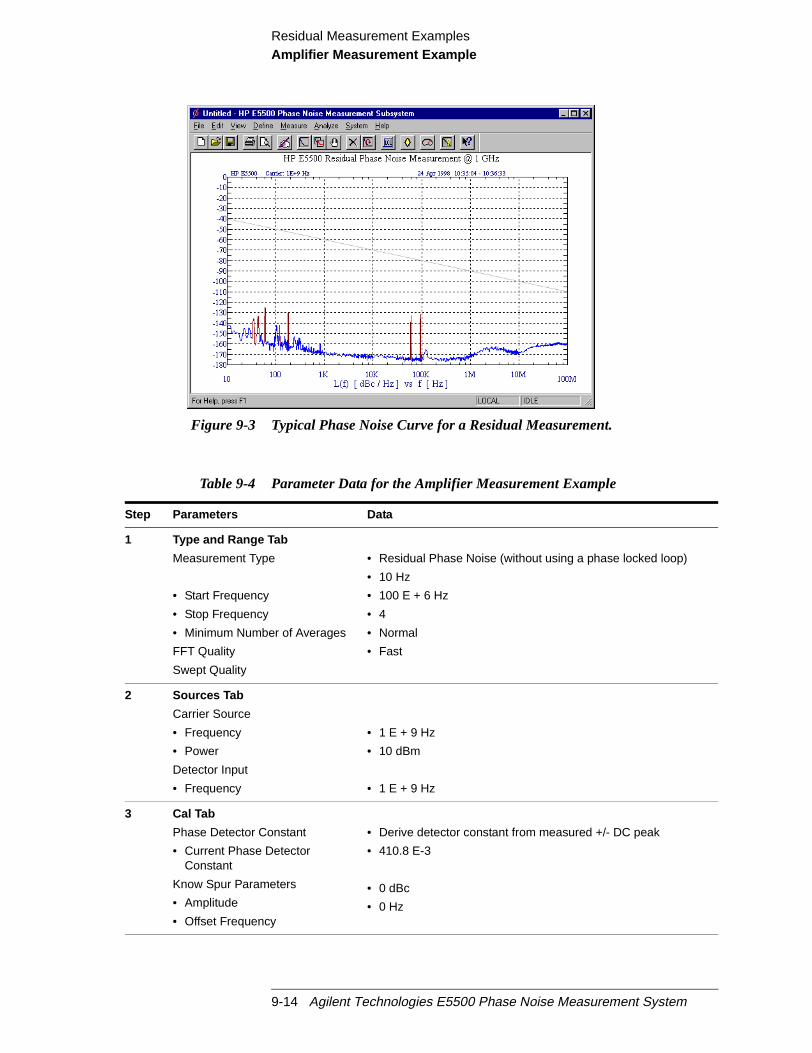
Residual Measurement ExamplesAmplifier Measurement Example
Figure 9-3 Typical Phase Noise Curve for a Residual Measurement.
Table 9-4 Parameter Data for the Amplifier Measurement Example
Step Parameters Data
1 Type and Range Tab
Measurement Type
• Start Frequency
• Stop Frequency
• Minimum Number of Averages
FFT Quality
Swept Quality
• Residual Phase Noise (without using a phase locked loop)
• 10 Hz
• 100 E + 6 Hz
• 4
• Normal
• Fast
2 Sources Tab
Carrier Source
• Frequency
• Power
Detector Input
• Frequency
• 1 E + 9 Hz
• 10 dBm
• 1 E + 9 Hz
3 Cal Tab
Phase Detector Constant
• Current Phase DetectorConstant
Know Spur Parameters
• Amplitude
• Offset Frequency
• Derive detector constant from measured +/- DC peak
• 410.8 E-3
• 0 dBc
• 0 Hz
9-14 Agilent Technologies E5500 Phase Noise Measurement System

Residual Measurement ExamplesAmplifier Measurement Example
4 Block Diagram Tab
• Carrier Source
• Phase Shifter
• DUT in Path
• Phase Detector
• Adjust the Quadrature byadjusting the
• Manual
• Manual
• checked
• Automatic Detector Selection
• phase shifter
5 Test Set Tab
Input Attenuation
LNA Low Pass Filter
• LNA Gain
• DC Block
• PLL Integrator Attenuation
• 0 dB
• 20 MHz (Auto checked)
• Auto Gain (Minimum Auto Gain - 14 dB)
• Not checked
• 0 dBm
6 Dowconverter Tab • The downconverter parameters do not apply to thismeasurement example.
7 Graph Tab
• Title
• Graph Type
• X Scale Minimum
• X Scale Maximum
• Y Scale Minimum
• Y Scale Maximum
• Normalize trace data to a:
• Scale trace data to a newcarrier frequency of:
• Shift trace data DOWN by:
• Trace Smoothing Amount
• Power present at input of DUT
• HP E5500 Residual Phase Noise Measurement @ 1 GHz.
• Single-sideband Noise (dBc/Hz)
• 10 Hz
• 100 E + 6 Hz
• 0 dBc/Hz
• - 180 dBc/Hz
• 1 Hz bandwidth
• 1 times the current carrier frequency
• 0 dB
• 0
• 0 dB
Table 9-4 Parameter Data for the Amplifier Measurement Example
Step Parameters Data
Agilent Technologies E5500 Phase Noise Measurement System 9-15
10 FM Discriminator Fundamentals
What You’ll Find in This Chapter
• The Frequency Discriminator Method, page 10-2
Basic Theory, page 10-2
The Discriminator Transfer Response, page 10-3
System Sensitivity, page 10-3 Optimum Sensitivity, page 10-5
Agilent Technologies E5500 Phase Noise Measurement System 10-1

FM Discriminator FundamentalsThe Frequency Discriminator Method
oestest
are
d. Athexial
n is a
ed
The Frequency Discriminator Method
Unlike the phase detector method, the frequency discriminator method dnot require a second reference source phase locked to the source under(Figure 10-1).
Figure 10-1 Basic delay line/mixer frequency discriminator method.
This makes the frequency discriminator method extremely useful formeasuring sources that are difficult to phase lock, including sources thatmicrophonic or drift quickly. It can also be used to measure sources withhigh-level, low-rate phase noise, or high close-in spurious sidebands,conditions with can pose serious problems for the phase detector methowide-band delay line frequency discriminator is easy to implement usingAgilent E5500A/B Phase Noise Measurement System and common coacable.
Basic Theory The delay line implementation of the frequency discriminator (Figure 10-1)converts short-term frequency fluctuations of a source into voltagefluctuations that can be measured by a baseband analyzer. The coversiotwo part process, first converting the frequency fluctuations into phasefluctuations, and then converting the phase fluctuations to voltagefluctuations.
The frequency fluctuation to phase fluctuation transformation ( )takes place in the delay line. The nominal frequency arrives at thedouble-balanced mixer at a particular phase. As the frequency changesslightly, the phase shift incurred in the fixed delay time will changeproportionally. The delay line converts the frequency change at the lineinput to a phase change a the line output when compared to the undelaysignal arriving at the mixer in the second path.
∆f ∆φ→
10-2 Agilent Technologies E5500 Phase Noise Measurement System

FM Discriminator FundamentalsThe Frequency Discriminator Method
ithis
ise
orst
y
feror
tor
The double-balanced mixer, acting as a phase detector, transforms theinstantaneous phase fluctuations into voltage fluctuations ( ). Wthe two input signals 90° out of phase (phase quadrature), the voltage outproportional to the input phase fluctuations. The voltage fluctuations canthen be measured by the baseband analyzer and converted to phase nounits.
The DiscriminatorTransfer Response
The important equation is the final magnitude of the transfer response.
Where represents the voltage fluctuations out of the discriminatand represents the frequency fluctuations of the device under te(DUT). is the phase detector constant (phase to voltage translation).is the amount of delay provided by the delay line and is the frequencoffset from the carrier that the phase noise measurement is made.
System Sensitivity
A frequency discriminator’s system sensitivity is determined by the transresponse. As shown below, it is desirable to make both the phase detectconstant and the amount of delay large so that the voltagefluctuations out of a frequency discriminator will be measurable foreven small fluctuations .
NOTE The system sensitivity is independent of carrier frequency .
The magnitude of the sinusoidal output term or the frequency discriminais proportional to . This implies that the outputresponse will have peaks and nulls, with the first null occurring at
. Increasing the rate of a modulation signal applied to thesystem will cause nulls to appear at frequency multiples of(Figure 10-2 on page 10-4).
∆φ ∆V→
∆V f m( ) Kφ2πτd∆f f m( ) πfmτd( )sinπfmτd( )
-----------------------------=
∆V f m( )∆f fm( )
Kφ τdfm
K φ τd∆V
∆f
∆V f m( ) Kφ2πτdπfmτd( )sin
πfmτd( )----------------------------- ∆f fm( )( )=
fo
πfmτd( ) πfmτd( )⁄sin
fm 1 τd⁄=1 τd⁄
Agilent Technologies E5500 Phase Noise Measurement System 10-3

FM Discriminator FundamentalsThe Frequency Discriminator Method
eto
the
set
the
this
and
le
Figure 10-2 Nulls in sensitivity of delay line discriminator.
To avoid having to compensate for sin (x)/x response, measurements artypically made at offset frequencies ( ) much less . It is possiblemeasure at offset frequencies out to and beyond the null by scaling themeasured results using the transfer equation. However, the sensitivity ofsystem get very poor results near the nulls.
The transfer function shows that increasing the delay increases thesensitivity of the system. However, increasing also decreases the offfrequencies ( ) that can be measured without compensating for thesin(x)/x response. For example, a 200 ns delay line will have bettersensitivity close to carrier than a 50 ns delay line., but will not be usablebeyond 2.5 MHz offsets without compensating for the sin(x)/x response;50 ns line is usable to offsets of 10 MHz.
Increasing the delay , also increases the attenuation of the line. Whilehas no direct effect on the sensitivity provided by the delay line, it doesreduce the signal into the phase detector and can result in decreaseddecreased system sensitivity.
The phase detector constant equals the slope of the mixer sine waveoutput at the zero crossings. When the mixer is not in compression,equals where is the mixer efficiency and is the voltage intothe Signal Input port (R port) of the mixer. is also the voltage availabat the output of the delay line.
fm 1 2τd⁄
τdτd
fm
τd
Kφ
KφK φ
K LV R K L V R
V R
10-4 Agilent Technologies E5500 Phase Noise Measurement System

FM Discriminator FundamentalsThe Frequency Discriminator Method
) isbe
by
um
ged
egth
t of
.
ence
itslay
velnt.
Optimum Sensitivity
If measurements are made such that the offset frequency of interest (<1/2 the sin(x)/x term can be ignored and the transfer response canreduced to
where is the discriminator constant.
CompressionThe level of the outputsignal at which the gain ofa device is reduced by aspecific amount, usuallyexpressed in decibels(dB), as in the 1 dBcompression point.
The reduced transfer equation implies that a frequency discriminator’ssystem sensitivity can be increased simply by increasing the delay orincreasing the phase detector constant . This assumption is notcompletely correct. is dependent on the signal level provided by thedelay line and cannot exceed a device dependent maximum. This maximis achieved when the phase detector is operating incompression. Increasingthe delay will reduce the signal level out of the delay line often reducinthe sensitivity of the phase detector. Optimum system sensitivity is obtainin a trade-off between delay and attenuation.
Sensitivity = KLVinLX(10)−LZ/20
Where KL is the phase detector efficiency, Vin is the signal voltage into thedelay line, LX (dB) is the sensitivity provided by the delay line and LZ is thattenuation of the delay line. Taking the derivative with respect to the lenL to find the maximum of this equation results in
LZ = 8.7 dB of attenuation
The optimum sensitivity of a system with the phase detector operating ouresults from using a length of coaxial line that has 8.7 dB of attenuation.
One way to increase the sensitivity of the discriminator when the phasedetector is out of compression is to increase the signal into the delay lineThis can be accomplished with an RF amplifier before the signal splitter.The noise of the RF amplifier will not degrade the measurement if thetwo-port noise of the amplifier is much less than the noise of the DUT.However, some attenuation may be needed in the signal path to the referinput to the double-balanced mixer (phase detector) to protect it fromexcessive power levels.
If the amplifier signal puts the phase detector into compression, is atmaximum and system sensitivity is now dependent on the length of the de
. For maximum sensitivity more delay can be added until the signal leout of the delay line is 8.7 dB below the phase detector compression poi
fmπτd
∆V f m( ) Kd∆f f m( ) Kφπτd∆f f m( )= =
Kd
τdK φ
K φ
τd
K φ
τd
Agilent Technologies E5500 Phase Noise Measurement System 10-5
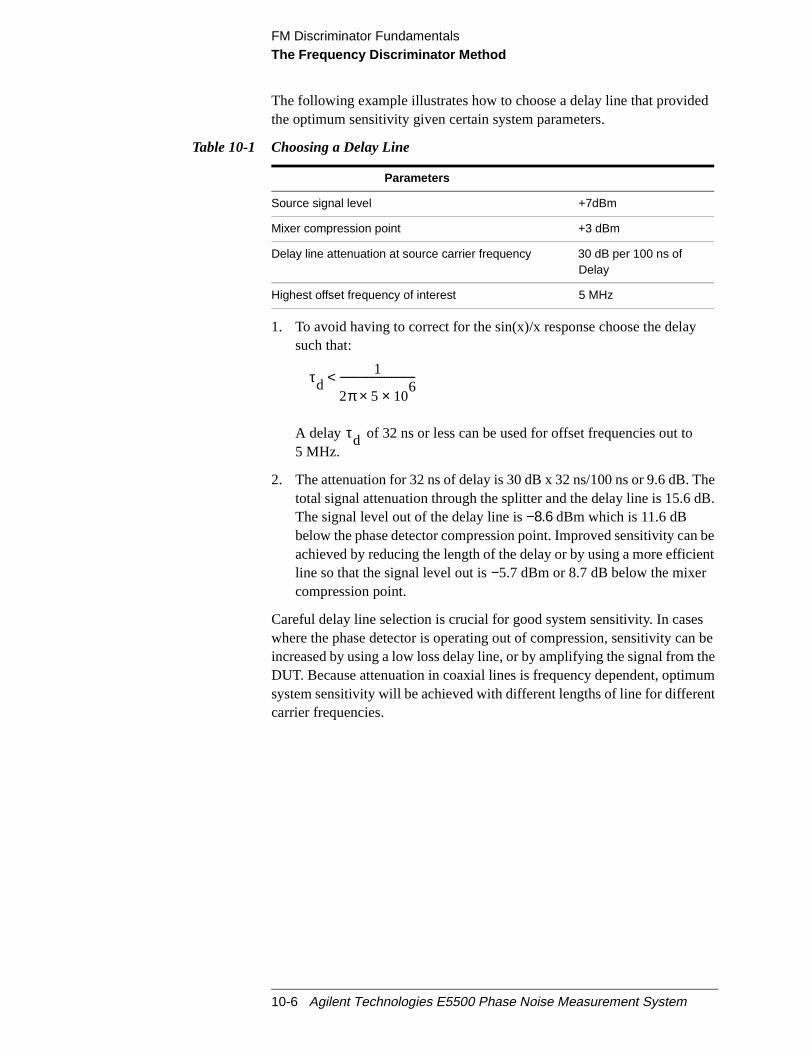
FM Discriminator FundamentalsThe Frequency Discriminator Method
d
heB.
bent
sbe
heumt
The following example illustrates how to choose a delay line that providethe optimum sensitivity given certain system parameters.
1. To avoid having to correct for the sin(x)/x response choose the delaysuch that:
A delay of 32 ns or less can be used for offset frequencies out to5 MHz.
2. The attenuation for 32 ns of delay is 30 dB x 32 ns/100 ns or 9.6 dB. Ttotal signal attenuation through the splitter and the delay line is 15.6 dThe signal level out of the delay line is−8.6 dBm which is 11.6 dBbelow the phase detector compression point. Improved sensitivity canachieved by reducing the length of the delay or by using a more efficieline so that the signal level out is−5.7 dBm or 8.7 dB below the mixercompression point.
Careful delay line selection is crucial for good system sensitivity. In casewhere the phase detector is operating out of compression, sensitivity canincreased by using a low loss delay line, or by amplifying the signal from tDUT. Because attenuation in coaxial lines is frequency dependent, optimsystem sensitivity will be achieved with different lengths of line for differencarrier frequencies.
Table 10-1 Choosing a Delay Line
Parameters
Source signal level +7dBm
Mixer compression point +3 dBm
Delay line attenuation at source carrier frequency 30 dB per 100 ns ofDelay
Highest offset frequency of interest 5 MHz
τd1
2π 5 106××
-------------------------------<
τd
10-6 Agilent Technologies E5500 Phase Noise Measurement System

11 FM Discriminator Measurement Examples
What You’ll Find in This Chapter
• FM Discriminator Measurement using Double-Sided SpurCalibration , page 11-3
• Discriminator Measurement using FM Rate and DeviationCalibration , page 11-18.
CAUTION To prevent damage to the Agilent/HP 70420A test set’s hardwarecomponents, the input signalmust notbe applied to the signal inputconnector until the input attenuator (Agilent/HP 70420A Option 001) hasbeen correctly set for the desired configuration, as show inTable 11-2 onpage 11-11. Apply the input signal when theConnection Diagramappears.
Agilent Technologies E5500 Phase Noise Measurement System 11-1

FM Discriminator Measurement ExamplesIntroduction
e
heent
t
er
Introduction
These two measurement examples demostrates the FM Discriminatormeasurement technique for measuring the phase noise of a signal sourcusing two different calibration methods.
These measurement techniques work well for measuring free-runningoscillators that drift over a range that exceeds the tuning range limits of tphase-locked-loop measurement technique. The Discriminator measuremis also useful for measuring sources when a VCO reference source is noavailable to provide adequate drift tracking.
The setup for a discriminator measurement uses a delay line to convertfrequency fluctuations to phase fluctuations and a phase shifter to setquadrature at the phase detector.
In the Discriminator measurement, the source is placed ahead of the powsplitter. One output of the splitter feeds a delay line with enough delay todecorrelate the source noise. The delay line generates a phase shiftproportional to the frequency. The phase shift is measured in the phasedetector by comparing the delay output with the other output from thesplitter. The output of the phase detector is a voltage proportional to thefrequency fluctuations of the source.
For more information about FM Discrimination basics, refer toChapter 10,“FM Discriminator Fundamentals”.
11-2 Agilent Technologies E5500 Phase Noise Measurement System
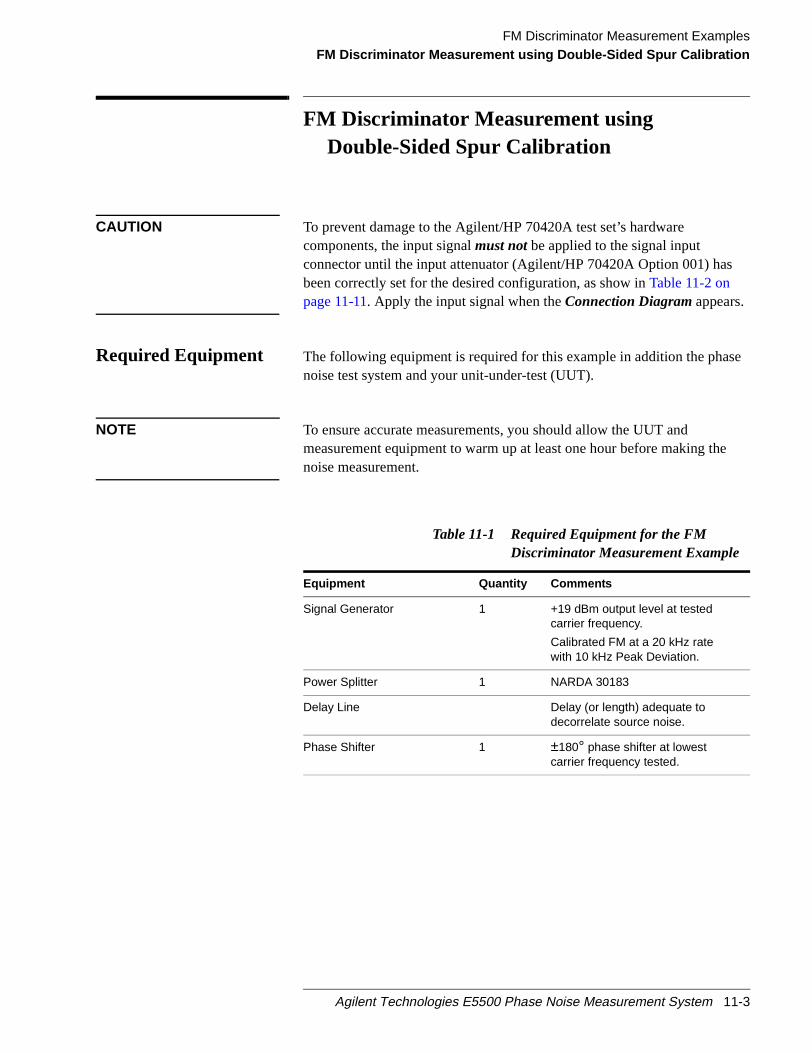
FM Discriminator Measurement ExamplesFM Discriminator Measurement using Double-Sided Spur Calibration
e
e
FM Discriminator Measurement usingDouble-Sided Spur Calibration
CAUTION To prevent damage to the Agilent/HP 70420A test set’s hardwarecomponents, the input signalmust notbe applied to the signal inputconnector until the input attenuator (Agilent/HP 70420A Option 001) hasbeen correctly set for the desired configuration, as show inTable 11-2 onpage 11-11. Apply the input signal when theConnection Diagramappears.
Required Equipment The following equipment is required for this example in addition the phasnoise test system and your unit-under-test (UUT).
NOTE To ensure accurate measurements, you should allow the UUT andmeasurement equipment to warm up at least one hour before making thnoise measurement.
Table 11-1 Required Equipment for the FMDiscriminator Measurement Example
Equipment Quantity Comments
Signal Generator 1 +19 dBm output level at testedcarrier frequency.
Calibrated FM at a 20 kHz ratewith 10 kHz Peak Deviation.
Power Splitter 1 NARDA 30183
Delay Line Delay (or length) adequate todecorrelate source noise.
Phase Shifter 1 ±180° phase shifter at lowestcarrier frequency tested.
Agilent Technologies E5500 Phase Noise Measurement System 11-3

FM Discriminator Measurement ExamplesFM Discriminator Measurement using Double-Sided Spur Calibration
that
(
benof
ied
Determining theDiscriminator(Delay Line) Length
Perform the following steps to determine the minimum delay line length (τ)Possible to provide an adequate noise to measure the source.
1. Determine the delay necessary to provide a discriminator noise flooris below the expected noise level of the DUT.Figure 11-1shows thenoise floor of the discriminator for given delay times (τ).
2. Determine the length of coax required to provide the necessary delayτ).(Eight feet of BNC cable will provide 12 ns of delay for this example.)
3. Determine the loss in the delay line. Verify that the signal source willable to provide a power level at the output of the delay line of betwee+5 and +17 dBm. Be sure to take into account an additional 4 to 6 dBloss in the power splitter. (The loss across 8 feet of BNC cable specifin this example is negligible.) The Agilent/HP 70420A test set Signaland Reference inputs requires +15 dBm.
Figure 11-1 Discriminator Noise Floor as a Function of Delay Time
11-4 Agilent Technologies E5500 Phase Noise Measurement System

FM Discriminator Measurement ExamplesFM Discriminator Measurement using Double-Sided Spur Calibration
Defining theMeasurement
1. From the File menu, choose Open.
2. If necessary, choose the drive or directory where the file you want isstored.
3. In the File Name box, choose “vco_dss.pnm”.
4. Click the Open button.
The appropriate measurement definition parameters for this examplehave been pre-stored in this file.Table 11-3 on page 11-16lists theparameter data that has been entered for the FM discriminatormeasurement example.)
Agilent Technologies E5500 Phase Noise Measurement System 11-5

FM Discriminator Measurement ExamplesFM Discriminator Measurement using Double-Sided Spur Calibration
5. From theDefine menu, chooseMeasurement; then choose theTypeand Rangetab from theDefine Measurementwindow.
a. From theMeasurement Typepull-down, select Absolute PhaseNoise (using an FM discriminator).
11-6 Agilent Technologies E5500 Phase Noise Measurement System

FM Discriminator Measurement ExamplesFM Discriminator Measurement using Double-Sided Spur Calibration
rumrto
6. Choose theSourcestab from theDefine Measurementwindow.
a. Enter the carrier (center) frequency of your UUT (5 MHz to1.6 GHz). Enter the same frequency for the detector inputfrequency.
7. Choose theCal tab from theDefine Measurementwindow.
b. SelectDerive constant from double-sided spuras the calibrationmethod.
Take a modulated calibration source and feed the output into a spectanalyzer. Measure the 1st modulation sideband frequency and powerelative to the carrier’s frequency and power. Enter the parameters inthe following step.
Agilent Technologies E5500 Phase Noise Measurement System 11-7

FM Discriminator Measurement ExamplesFM Discriminator Measurement using Double-Sided Spur Calibration
on
c. Set theKnow Spur Parameters Offset FrequencyandAmplitudefor the spur you plan to use for calibration purposes.This calibratimethod requires that you enter the offset and amplitude for aknownspur.
8. Choose theBlock Diagram tab from theDefine Measurementwindow.
a. From theReference Sourcepull-down, selectManual.
b. From thePhase Detectorpull-down, selectAutomatic DetectorSelection.
11-8 Agilent Technologies E5500 Phase Noise Measurement System

FM Discriminator Measurement ExamplesFM Discriminator Measurement using Double-Sided Spur Calibration
s
e forown
9. Choose theGraph tab from theDefine Measurementwindow.
a. Enter a graph description of your choice.
10. When you have completed these operations, click theClosebutton.
Setup Considerations Connecting Cables
The best results will be obtained if semi-rigid coaxial cables are used toconnect the components used in the measurement; however, BNC cablehave been specified because they are more widely available. Using BNCcables may degrade the close-in phase noise results and, while adequatthis example, should not be used for an actual measurement on an unkndevice unless absolutely necessary.
Measurement Environment
The low noise floors typical of these devices may require that specialattention be given to the measurement environment. The followingprecautions will help ensure reliable test results:
• Filtering on power supply lines• Protection from microphonics• Shielding from air currents may be necessary.
Agilent Technologies E5500 Phase Noise Measurement System 11-9
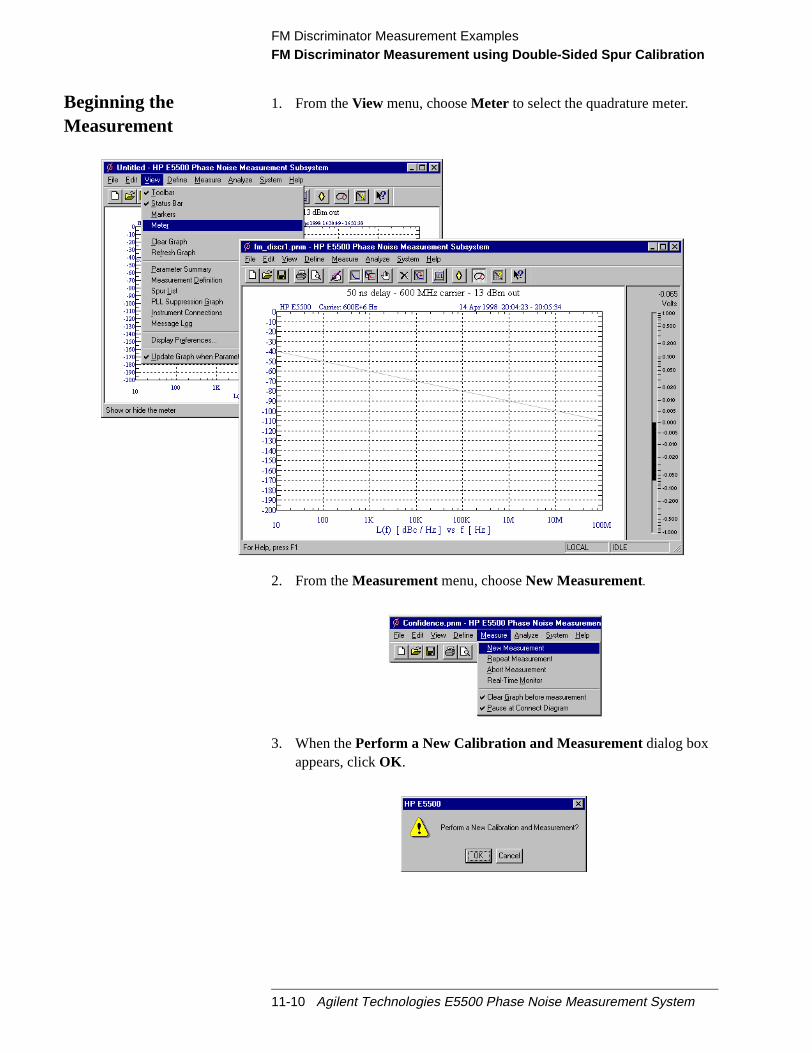
FM Discriminator Measurement ExamplesFM Discriminator Measurement using Double-Sided Spur Calibration
Beginning theMeasurement
1. From theView menu, chooseMeter to select the quadrature meter.
2. From theMeasurementmenu, chooseNew Measurement.
3. When thePerform a New Calibration and Measurementdialog boxappears, clickOK .
11-10 Agilent Technologies E5500 Phase Noise Measurement System

FM Discriminator Measurement ExamplesFM Discriminator Measurement using Double-Sided Spur Calibration
A
4. When theConnect Diagramdialog box appears, confirm yourconnections as shown in the connect diagram. The Agilent/HP 70420test set’s signal input is subject to the following limits andcharacteristics:
Table 11-2 Agilent/HP 70420A Test Set Signal Input Limits and Characteristics
Limits
Frequency 50 kHz to 1.6 GHz (Std)50 kHz to 26.5 GHz (Option 001)50 kHz to 26.5 GHz (Option 201)
Maximum Signal Input Power Sum of the reference and signal inputpower shall not exceed +23 dBm
At Attenuator Output, Operating LevelRange:
• RF Phase Detectors 0 to +23 dBm (Signal Input)+15 to +23 dBm (Reference Input)
• Microwave Phase Detectors 0 to +5 dBm (Signal Input)+7 to +10 dBm (Reference Input)
• Internal AM Detector 0 to +20 dBm
• Downconverters:
Agilent/HP 70422A 0 to +30 dBm
Agilent/HP 70427A +5 to +15 dBm
CAUTION:
To prevent damage to the Agilent/HP 70420A test set’s hardware components,the input signal must not be applied to the test set’s signal input connector untilthe input attenuator (Option 001) has been correctly set by the phase noisesoftware, which will occur at the connection diagram.
Characteristics:
Input Impedance 50 ohm Nominal
AM Noise dc coupled to 50 ohm load
Agilent Technologies E5500 Phase Noise Measurement System 11-11
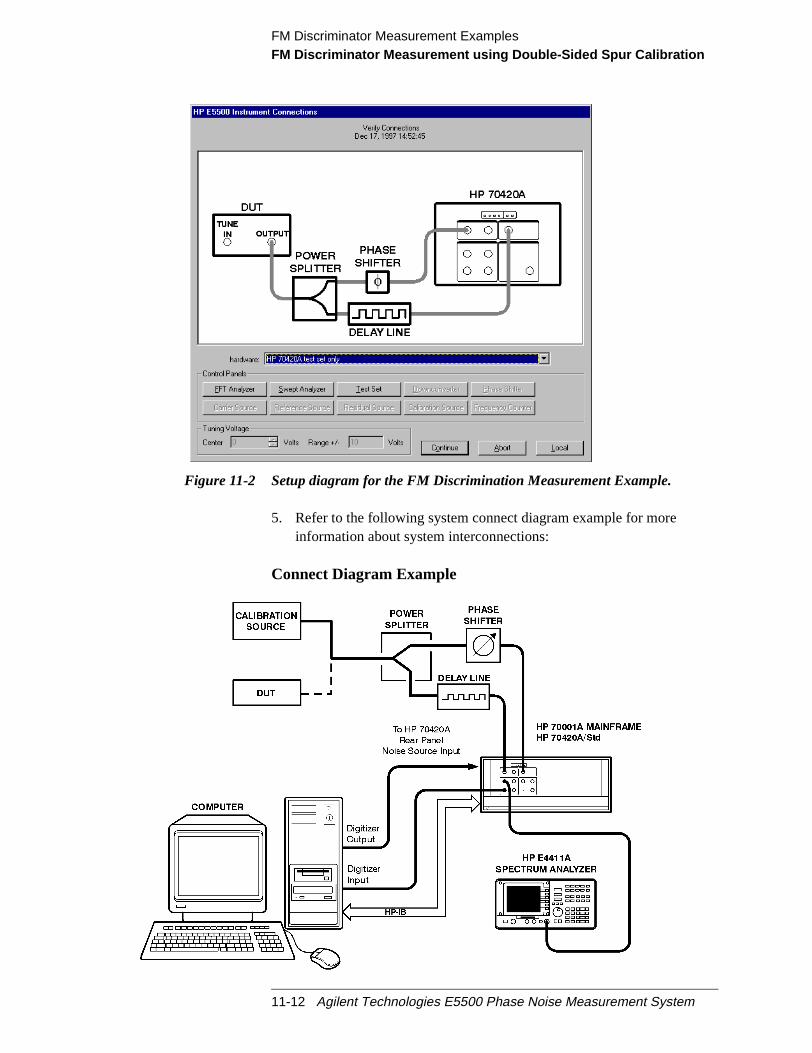
FM Discriminator Measurement ExamplesFM Discriminator Measurement using Double-Sided Spur Calibration
Figure 11-2 Setup diagram for the FM Discrimination Measurement Example.
5. Refer to the following system connect diagram example for moreinformation about system interconnections:
Connect Diagram Example
11-12 Agilent Technologies E5500 Phase Noise Measurement System

FM Discriminator Measurement ExamplesFM Discriminator Measurement using Double-Sided Spur Calibration
t.
thenal.
ter
Making theMeasurement
1. press theContinue key when you are ready to make the measuremen
Calibrating the Measurement
The calibration procedure determines the discriminator constant to use intransfer response by measuring the system response to a known FM sig
NOTE Note that the system must be operating in quadrature during calibration.
2. First establish quadrature by adjusting the phase shifter until the meindicates 0 volts, then press Continue.
Agilent Technologies E5500 Phase Noise Measurement System 11-13

FM Discriminator Measurement ExamplesFM Discriminator Measurement using Double-Sided Spur Calibration
3. Next, apply modulation to the carrier signal, then pressContinue.
Remove the modulation from the carrier and connect your DUT.
4. The system can now run the measurement. at the appropriate point,re-establish quadrature and continue the measurement.
11-14 Agilent Technologies E5500 Phase Noise Measurement System

FM Discriminator Measurement ExamplesFM Discriminator Measurement using Double-Sided Spur Calibration
isified
you
M
The segment data will be displayed on the computer screen as the datataken until all segments have been taken over the entire range you specin the Measurement definition’s Type and Range.
When theMeasurement isComplete
When the measurement is complete, refer toChapter 15, “Evaluating YourMeasurement Results”for help in evaluating your measurement results. (Ifthe test system has problems completing the measurement, it will informby placing a message on the computer display.
Figure 11-3 on page 11-15shows a typical absolute measurement using Fdiscrimination.
Figure 11-3 Typical Phase Noise Curve using Double-Sided Spur Calibration.
Agilent Technologies E5500 Phase Noise Measurement System 11-15
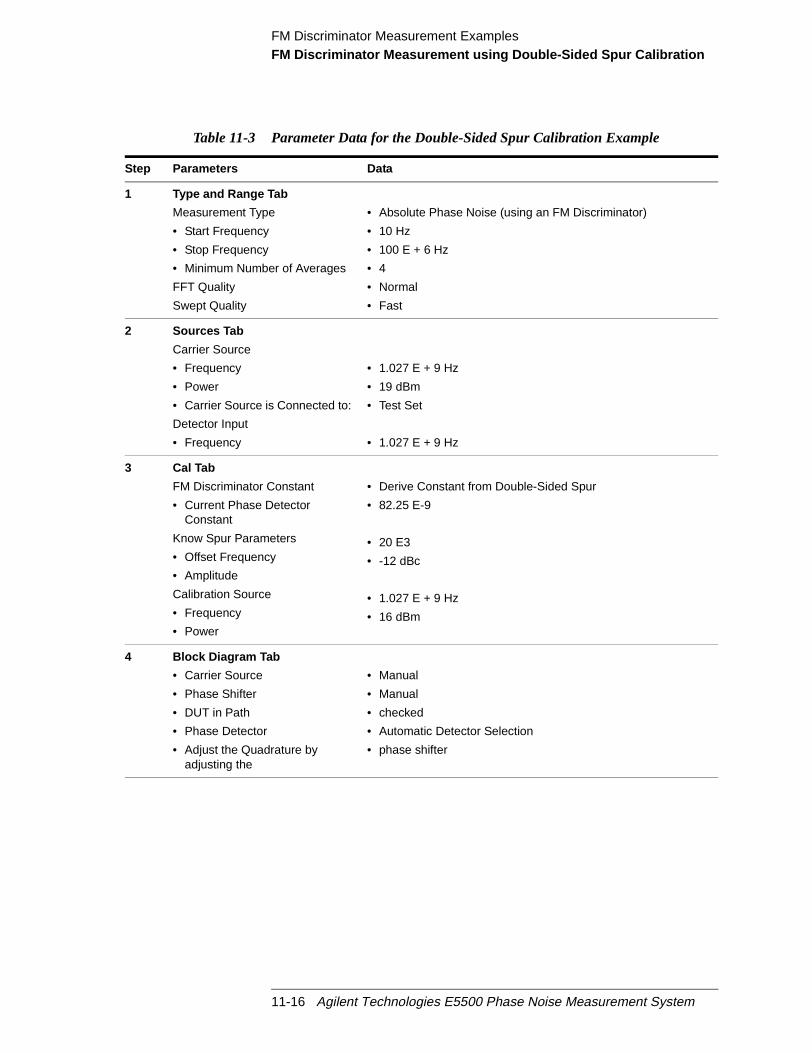
FM Discriminator Measurement ExamplesFM Discriminator Measurement using Double-Sided Spur Calibration
Table 11-3 Parameter Data for the Double-Sided Spur Calibration Example
Step Parameters Data
1 Type and Range Tab
Measurement Type
• Start Frequency
• Stop Frequency
• Minimum Number of Averages
FFT Quality
Swept Quality
• Absolute Phase Noise (using an FM Discriminator)
• 10 Hz
• 100 E + 6 Hz
• 4
• Normal
• Fast
2 Sources Tab
Carrier Source
• Frequency
• Power
• Carrier Source is Connected to:
Detector Input
• Frequency
• 1.027 E + 9 Hz
• 19 dBm
• Test Set
• 1.027 E + 9 Hz
3 Cal Tab
FM Discriminator Constant
• Current Phase DetectorConstant
Know Spur Parameters
• Offset Frequency
• Amplitude
Calibration Source
• Frequency
• Power
• Derive Constant from Double-Sided Spur
• 82.25 E-9
• 20 E3
• -12 dBc
• 1.027 E + 9 Hz
• 16 dBm
4 Block Diagram Tab
• Carrier Source
• Phase Shifter
• DUT in Path
• Phase Detector
• Adjust the Quadrature byadjusting the
• Manual
• Manual
• checked
• Automatic Detector Selection
• phase shifter
11-16 Agilent Technologies E5500 Phase Noise Measurement System

FM Discriminator Measurement ExamplesFM Discriminator Measurement using Double-Sided Spur Calibration
5 Test Set Tab • The test set parameters do not apply to this measurementexample.
6 Dowconverter Tab • The downconverter parameters do not apply to thismeasurement example.
7 Graph Tab
• Title
• Graph Type
• X Scale Minimum
• X Scale Maximum
• Y Scale Minimum
• Y Scale Maximum
• Normalize trace data to a:
• Scale trace data to a newcarrier frequency of:
• Shift trace data DOWN by:
• Trace Smoothing Amount
• Power present at input of DUT
• FM Discrim - 50 ns dly - 1.027GHz, +19 dBm out, VCO,DSS
• Single-sideband Noise (dBc/Hz)
• 10 Hz
• 100 E + 6 Hz
• 10 dBc/Hz
• - 190 dBc/Hz
• 1 Hz bandwidth
• 1 times the current carrier frequency
• 0 dB
• 0
• 0 dB
Step Parameters Data
Agilent Technologies E5500 Phase Noise Measurement System 11-17
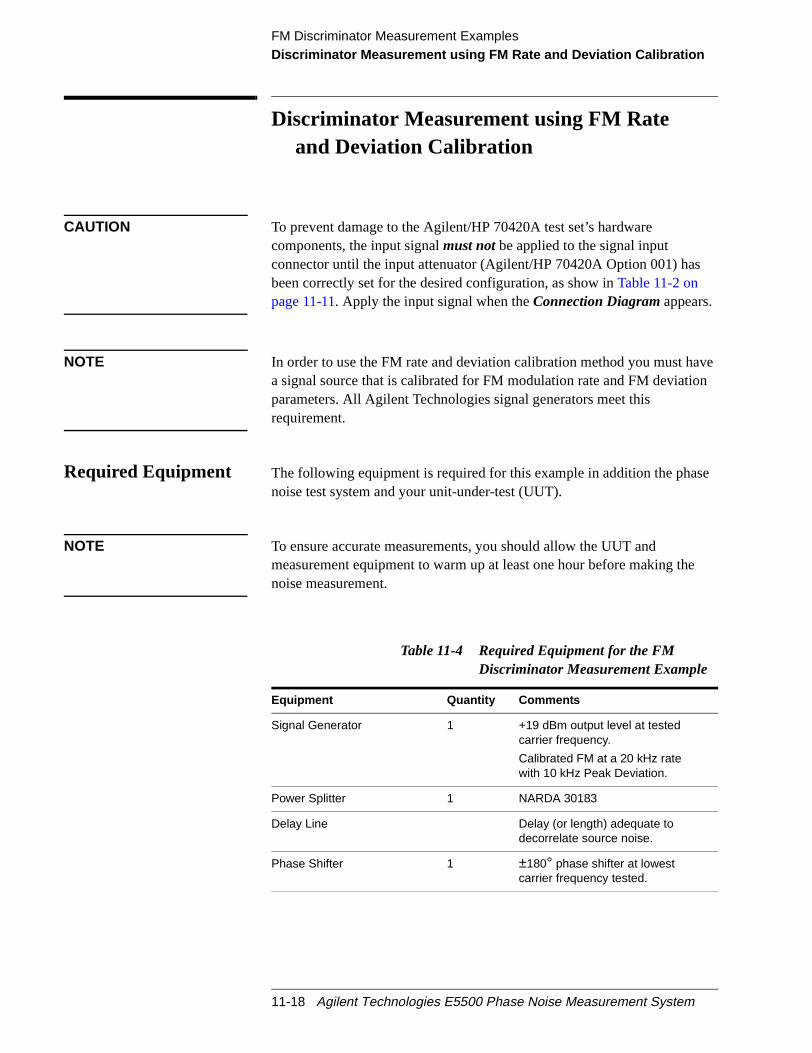
FM Discriminator Measurement ExamplesDiscriminator Measurement using FM Rate and Deviation Calibration
ven
e
e
Discriminator Measurement using FM Rateand Deviation Calibration
CAUTION To prevent damage to the Agilent/HP 70420A test set’s hardwarecomponents, the input signalmust notbe applied to the signal inputconnector until the input attenuator (Agilent/HP 70420A Option 001) hasbeen correctly set for the desired configuration, as show inTable 11-2 onpage 11-11. Apply the input signal when theConnection Diagramappears.
NOTE In order to use the FM rate and deviation calibration method you must haa signal source that is calibrated for FM modulation rate and FM deviatioparameters. All Agilent Technologies signal generators meet thisrequirement.
Required Equipment The following equipment is required for this example in addition the phasnoise test system and your unit-under-test (UUT).
NOTE To ensure accurate measurements, you should allow the UUT andmeasurement equipment to warm up at least one hour before making thnoise measurement.
Table 11-4 Required Equipment for the FMDiscriminator Measurement Example
Equipment Quantity Comments
Signal Generator 1 +19 dBm output level at testedcarrier frequency.
Calibrated FM at a 20 kHz ratewith 10 kHz Peak Deviation.
Power Splitter 1 NARDA 30183
Delay Line Delay (or length) adequate todecorrelate source noise.
Phase Shifter 1 ±180° phase shifter at lowestcarrier frequency tested.
11-18 Agilent Technologies E5500 Phase Noise Measurement System

FM Discriminator Measurement ExamplesDiscriminator Measurement using FM Rate and Deviation Calibration
that
(
benof
ied
Determining theDiscriminator(Delay Line) Length
Perform the following steps to determine the minimum delay line length (τ)Possible to provide an adequate noise to measure the source.
1. Determine the delay necessary to provide a discriminator noise flooris below the expected noise level of the DUT.Figure 11-1shows thenoise floor of the discriminator for given delay times (τ).
2. Determine the length of coax required to provide the necessary delayτ).(Eight feet of BNC cable will provide 12 ns of delay for this example.)
3. Determine the loss in the delay line. Verify that the signal source willable to provide a power level at the output of the delay line of betwee+5 and +17 dBm. Be sure to take into account an additional 4 to 6 dBloss in the power splitter. (The loss across 8 feet of BNC cable specifin this example is negligible.) The Agilent/HP 70420A test set Signaland Reference inputs requires +15 dBm.
Figure 11-4 Discriminator Noise Floor as a Function of Delay Time
Agilent Technologies E5500 Phase Noise Measurement System 11-19
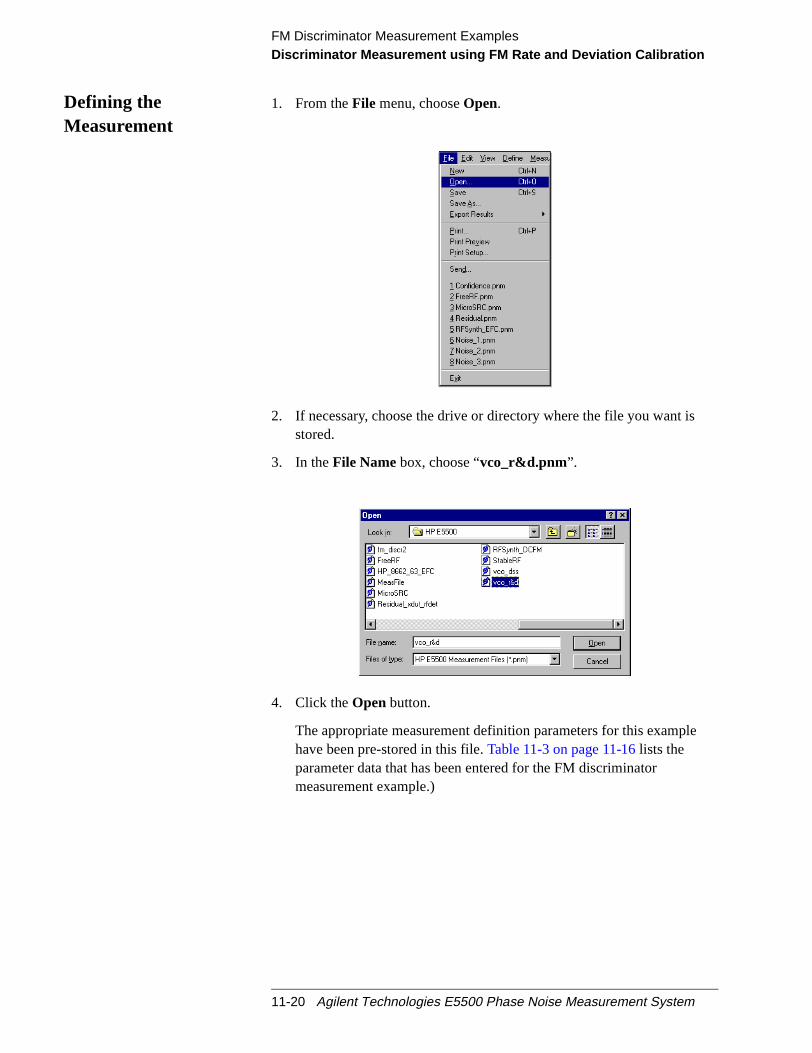
FM Discriminator Measurement ExamplesDiscriminator Measurement using FM Rate and Deviation Calibration
Defining theMeasurement
1. From theFile menu, chooseOpen.
2. If necessary, choose the drive or directory where the file you want isstored.
3. In theFile Namebox, choose “vco_r&d.pnm”.
4. Click theOpen button.
The appropriate measurement definition parameters for this examplehave been pre-stored in this file.Table 11-3 on page 11-16lists theparameter data that has been entered for the FM discriminatormeasurement example.)
11-20 Agilent Technologies E5500 Phase Noise Measurement System

FM Discriminator Measurement ExamplesDiscriminator Measurement using FM Rate and Deviation Calibration
5. From theDefine menu, chooseMeasurement; then choose theTypeand Rangetab from theDefine Measurement window.
a. From theMeasurement Typepull-down, selectAbsolute PhaseNoise (using an FM discriminator).
Agilent Technologies E5500 Phase Noise Measurement System 11-21
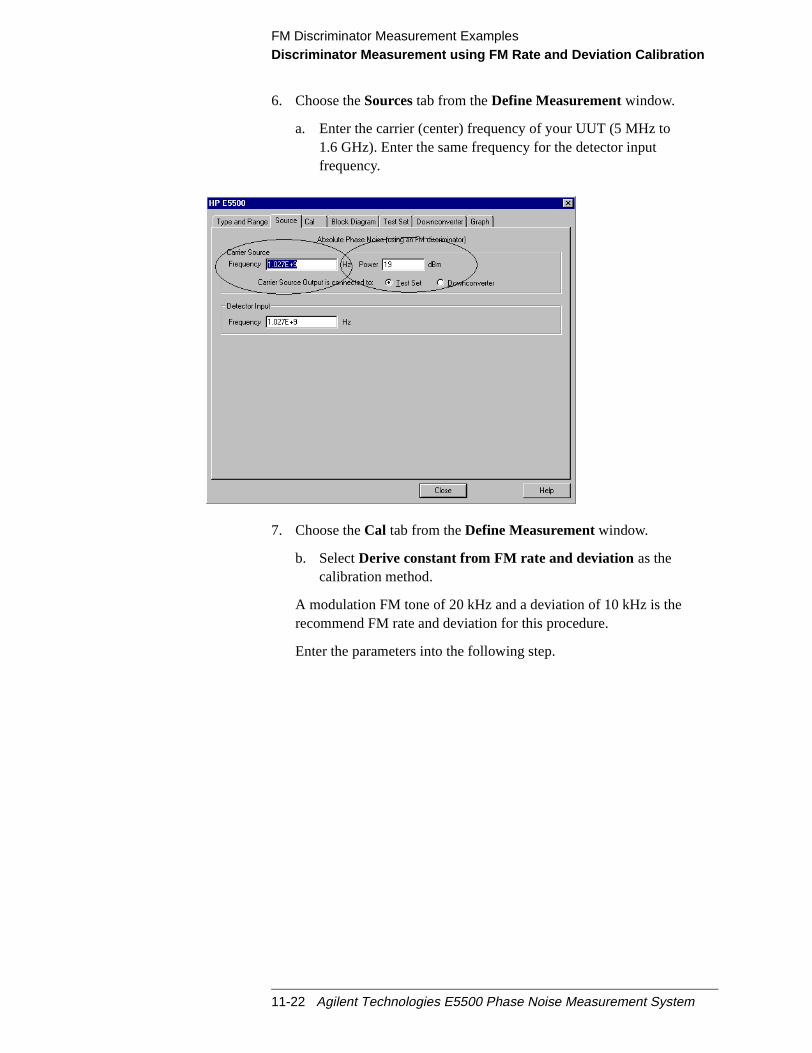
FM Discriminator Measurement ExamplesDiscriminator Measurement using FM Rate and Deviation Calibration
6. Choose theSourcestab from theDefine Measurementwindow.
a. Enter the carrier (center) frequency of your UUT (5 MHz to1.6 GHz). Enter the same frequency for the detector inputfrequency.
7. Choose theCal tab from theDefine Measurementwindow.
b. SelectDerive constant from FM rate and deviation as thecalibration method.
A modulation FM tone of 20 kHz and a deviation of 10 kHz is therecommend FM rate and deviation for this procedure.
Enter the parameters into the following step.
11-22 Agilent Technologies E5500 Phase Noise Measurement System
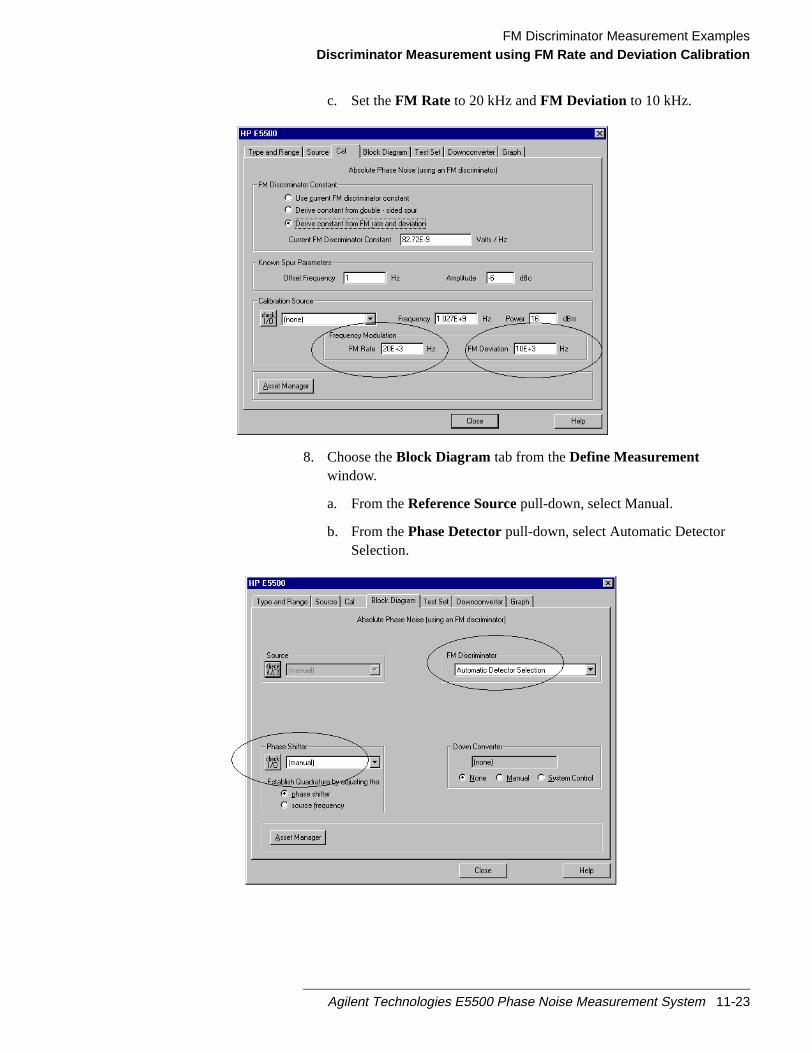
FM Discriminator Measurement ExamplesDiscriminator Measurement using FM Rate and Deviation Calibration
c. Set theFM Rate to 20 kHz andFM Deviation to 10 kHz.
8. Choose theBlock Diagram tab from theDefine Measurementwindow.
a. From theReference Sourcepull-down, select Manual.
b. From thePhase Detectorpull-down, select Automatic DetectorSelection.
Agilent Technologies E5500 Phase Noise Measurement System 11-23
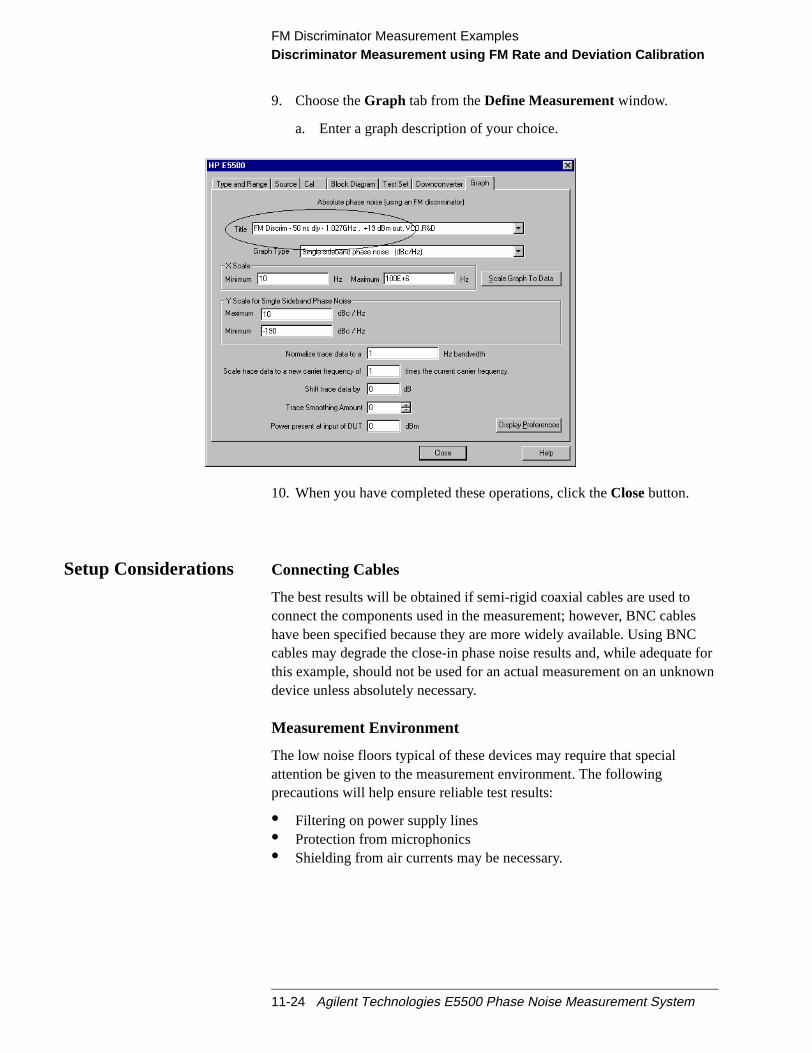
FM Discriminator Measurement ExamplesDiscriminator Measurement using FM Rate and Deviation Calibration
s
te forown
9. Choose theGraph tab from theDefine Measurementwindow.
a. Enter a graph description of your choice.
10. When you have completed these operations, click theClosebutton.
Setup Considerations Connecting Cables
The best results will be obtained if semi-rigid coaxial cables are used toconnect the components used in the measurement; however, BNC cablehave been specified because they are more widely available. Using BNCcables may degrade the close-in phase noise results and, while adequathis example, should not be used for an actual measurement on an unkndevice unless absolutely necessary.
Measurement Environment
The low noise floors typical of these devices may require that specialattention be given to the measurement environment. The followingprecautions will help ensure reliable test results:
• Filtering on power supply lines• Protection from microphonics• Shielding from air currents may be necessary.
11-24 Agilent Technologies E5500 Phase Noise Measurement System
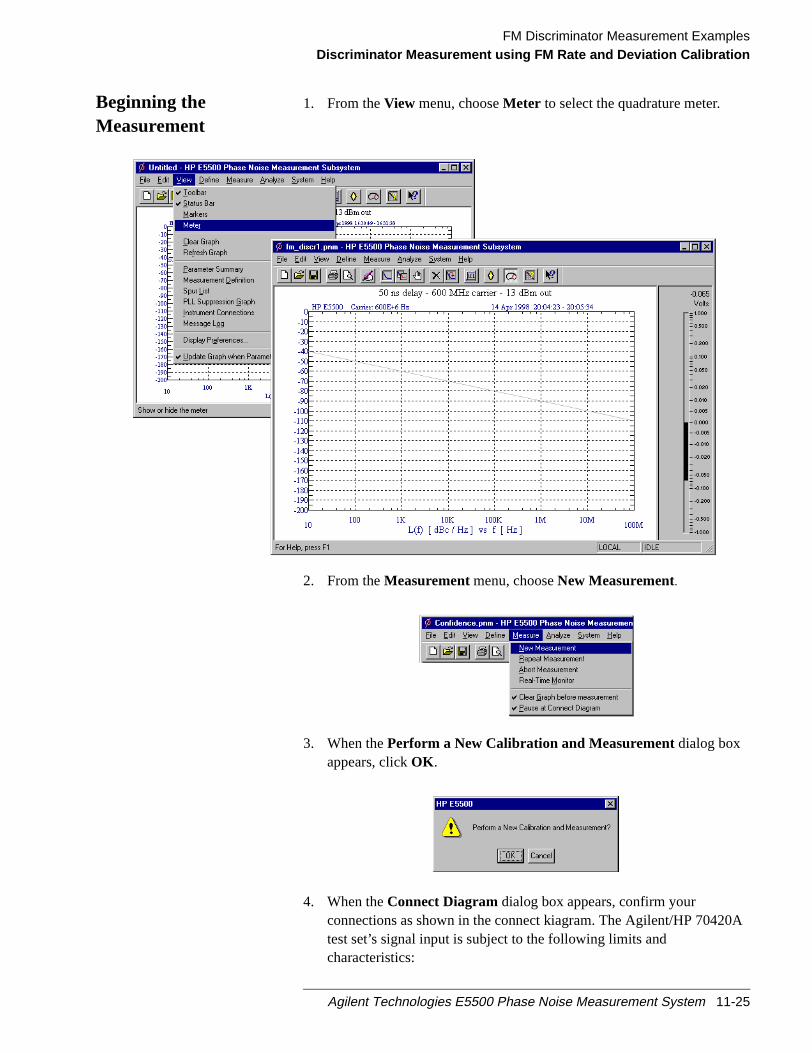
FM Discriminator Measurement ExamplesDiscriminator Measurement using FM Rate and Deviation Calibration
A
Beginning theMeasurement
1. From theView menu, chooseMeter to select the quadrature meter.
2. From theMeasurementmenu, chooseNew Measurement.
3. When thePerform a New Calibration and Measurementdialog boxappears, clickOK .
4. When theConnect Diagramdialog box appears, confirm yourconnections as shown in the connect kiagram. The Agilent/HP 70420test set’s signal input is subject to the following limits andcharacteristics:
Agilent Technologies E5500 Phase Noise Measurement System 11-25
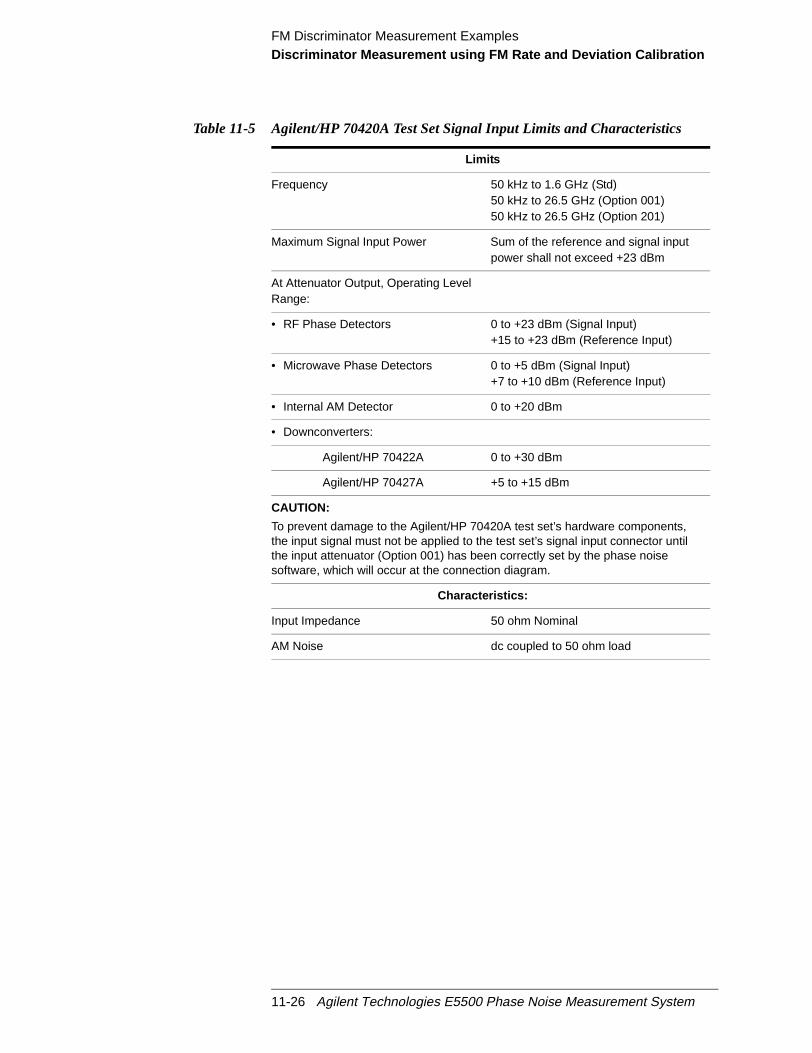
FM Discriminator Measurement ExamplesDiscriminator Measurement using FM Rate and Deviation Calibration
Table 11-5 Agilent/HP 70420A Test Set Signal Input Limits and Characteristics
Limits
Frequency 50 kHz to 1.6 GHz (Std)50 kHz to 26.5 GHz (Option 001)50 kHz to 26.5 GHz (Option 201)
Maximum Signal Input Power Sum of the reference and signal inputpower shall not exceed +23 dBm
At Attenuator Output, Operating LevelRange:
• RF Phase Detectors 0 to +23 dBm (Signal Input)+15 to +23 dBm (Reference Input)
• Microwave Phase Detectors 0 to +5 dBm (Signal Input)+7 to +10 dBm (Reference Input)
• Internal AM Detector 0 to +20 dBm
• Downconverters:
Agilent/HP 70422A 0 to +30 dBm
Agilent/HP 70427A +5 to +15 dBm
CAUTION:
To prevent damage to the Agilent/HP 70420A test set’s hardware components,the input signal must not be applied to the test set’s signal input connector untilthe input attenuator (Option 001) has been correctly set by the phase noisesoftware, which will occur at the connection diagram.
Characteristics:
Input Impedance 50 ohm Nominal
AM Noise dc coupled to 50 ohm load
11-26 Agilent Technologies E5500 Phase Noise Measurement System

FM Discriminator Measurement ExamplesDiscriminator Measurement using FM Rate and Deviation Calibration
Figure 11-5 Setup diagram for the FM Discrimination Measurement Example.
5. Refer to the following system connect diagram example for moreinformation about system interconnections:
Connect Diagram Example
Agilent Technologies E5500 Phase Noise Measurement System 11-27

FM Discriminator Measurement ExamplesDiscriminator Measurement using FM Rate and Deviation Calibration
t.
thenal.
ter
Making theMeasurement
1. press theContinue key when you are ready to make the measuremen
Calibrating the Measurement
The calibration procedure determines the discriminator constant to use intransfer response by measuring the system response to a known FM sig
NOTE Note that the system must be operating in quadrature during calibration.
2. First establish quadrature by adjusting the phase shifter until the meindicates 0 volts, then pressContinue.
11-28 Agilent Technologies E5500 Phase Noise Measurement System
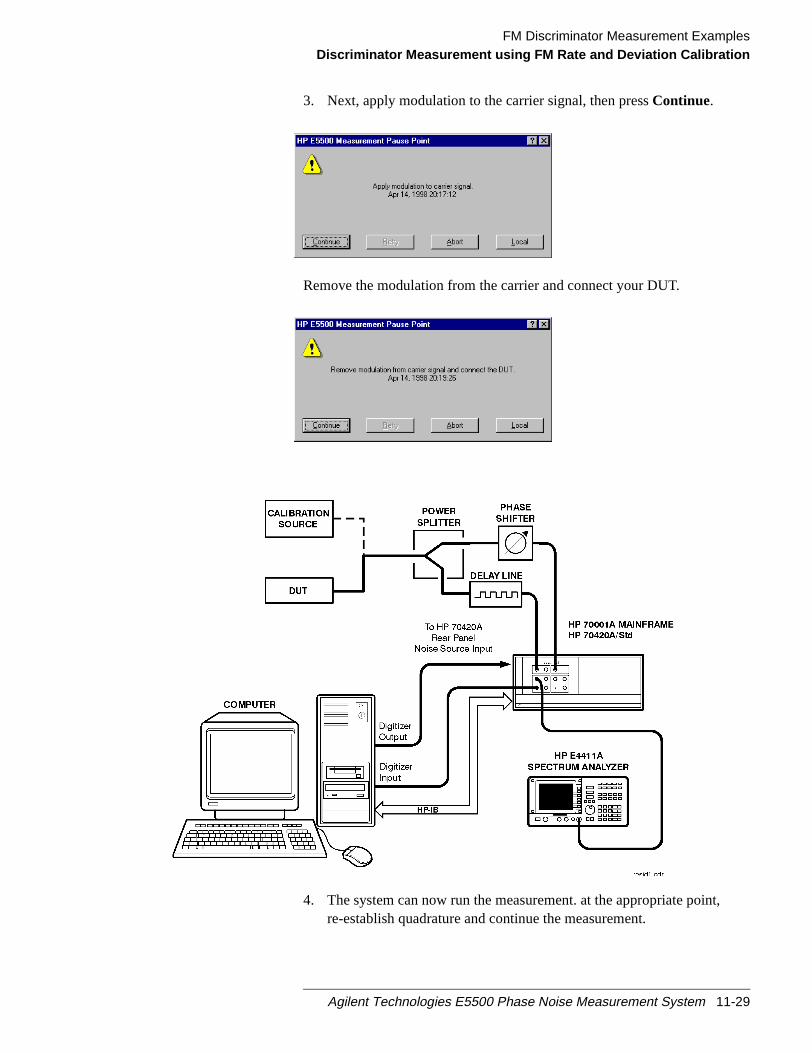
FM Discriminator Measurement ExamplesDiscriminator Measurement using FM Rate and Deviation Calibration
3. Next, apply modulation to the carrier signal, then pressContinue.
Remove the modulation from the carrier and connect your DUT.
4. The system can now run the measurement. at the appropriate point,re-establish quadrature and continue the measurement.
Agilent Technologies E5500 Phase Noise Measurement System 11-29

FM Discriminator Measurement ExamplesDiscriminator Measurement using FM Rate and Deviation Calibration
isified
you
M
The segment data will be displayed on the computer screen as the datataken until all segments have been taken over the entire range you specin the Measurement definition’s Type and Range.
When theMeasurement isComplete
When the measurement is complete, refer toChapter 15, “Evaluating YourMeasurement Results”for help in evaluating your measurement results. (Ifthe test system has problems completing the measurement, it will informby placing a message on the computer display.
Figure 11-6 on page 11-30shows a typical absolute measurement using Fdiscrimination.
Figure 11-6 Typical Phase Noise Curve using Rate and Deviation Calibration.
11-30 Agilent Technologies E5500 Phase Noise Measurement System

FM Discriminator Measurement ExamplesDiscriminator Measurement using FM Rate and Deviation Calibration
Table 11-6 Parameter Data for the Rate and Deviation Calibration Example
Step Parameters Data
1 Type and Range Tab
Measurement Type
• Start Frequency
• Stop Frequency
• Minimum Number of Averages
FFT Quality
Swept Quality
• Absolute Phase Noise (using an FM Discriminator)
• 10 Hz
• 100 E + 6 Hz
• 4
• Normal
• Fast
2 Sources Tab
Carrier Source
• Frequency
• Power
• Carrier Source is Connected to:
Detector Input
• Frequency
• 1.027 E + 9 Hz
• 19 dBm
• Test Set
• 1.027 E + 9 Hz
3 Cal Tab
FM Discriminator Constant
• Current Phase DetectorConstant
Know Spur Parameters
• Offset Frequency
• Amplitude
Calibration Source
• Frequency
• Power
Frequency Modulation
• FM Rate
• FM Deviation
• Derive Constant from FM rate and deviation
• 82.25 E-9
• 1 E3
• -6 dBc
• 1.027 E + 9 Hz
• 16 dBm
• 20 E +3 Hz
• 10 E +3 Hz
4 Block Diagram Tab
• Carrier Source
• Phase Shifter
• DUT in Path
• Phase Detector
• Adjust the Quadrature byadjusting the
• Manual
• Manual
• checked
• Automatic Detector Selection
• phase shifter
Agilent Technologies E5500 Phase Noise Measurement System 11-31

FM Discriminator Measurement ExamplesDiscriminator Measurement using FM Rate and Deviation Calibration
5 Test Set Tab • The test set parameters do not apply to this measurementexample.
6 Dowconverter Tab • The downconverter parameters do not apply to thismeasurement example.
7 Graph Tab
• Title
• Graph Type
• X Scale Minimum
• X Scale Maximum
• Y Scale Minimum
• Y Scale Maximum
• Normalize trace data to a:
• Scale trace data to a newcarrier frequency of:
• Shift trace data DOWN by:
• Trace Smoothing Amount
• Power present at input of DUT
• FM Discrim - 50 ns dly - 1.027GHz, +19 dBm out, VCO,R&D
• Single-sideband Noise (dBc/Hz)
• 10 Hz
• 100 E + 6 Hz
• 10 dBc/Hz
• - 190 dBc/Hz
• 1 Hz bandwidth
• 1 times the current carrier frequency
• 0 dB
• 0
• 0 dB
Step Parameters Data
11-32 Agilent Technologies E5500 Phase Noise Measurement System
12 AM Noise Measurement Fundamentals
What You’ll Find in This Chapter
• AM-Noise Measurement Theory of Operation, page 12-2
• Amplitude Noise Measurement, page 12-3
AM Detector, page 12-4
• Measurement Methods
Method 1: User Entry of Phase Detector Constant, page 12-8
Method 2: Double-Sided Spur, page 12-12
Method 3: Single-Sided-Spur, page 12-17
Agilent Technologies E5500 Phase Noise Measurement System 12-1
AM Noise Measurement FundamentalsAM-Noise Measurement Theory of Operation
ing
ata
he
end
m
t a
dB,t
AM-Noise Measurement Theory of Operation
Basic NoiseMeasurement
The Agilent E5500A phase noise measurement software uses the followprocess to measure carrier noise by:
• Calibrating the noise detector sensitivity.• Measuring the recovered baseband noise out of the detector.• Calculating the noise around the signal by correcting the measured d
by the detector sensitivity.• Displaying the measured noise data in the required format.
Given a detector calibration, the system looks at the signal out of thedetector as just a noise voltage which must be measured over a band offrequencies regardless of the signal’s origin.
The detector calibration is accomplished by applying a known signal to tdetector. The known signal is then measured at baseband. Finally, thetransfer function between the known signal and the measured basebandsignal is calculated.
Phase NoiseMeasurement
In the case of small angle phase modulation (<0.1 rad), the modulationsideband amplitude is constant with increasing modulation frequency. Thphase detector gain can thus be measured at a single offset frequency, athe same constant will apply at all offset frequencies.
• In the case of calibrating with phase modulation sidebands, the systerequires the carrier-to-sideband ratio and the frequency offset of thesidebands. The offset frequency is equal to the baseband modulationfrequency. The ratio of the baseband signal voltage to thecarrier-to-sideband ratio is the sensitivity of the detector.
• In the case of calibrating with a single-sided spur, it can be shown thasingle-sided spur is equal to a PM signal plus an AM signal. Themodulation sidebands for both are 6 dB below the original single-sidespur. Since the phase detector attenuates the AM by more than 30 dthe calibration constant can be measured as in the previous case, buwith an additional 6 dB correction factor.
12-2 Agilent Technologies E5500 Phase Noise Measurement System

AM Noise Measurement FundamentalsAmplitude Noise Measurement
ing
itude
al
the
Amplitude Noise Measurement
The level of amplitude modulation sidebands is also constant with increasmodulation frequency. The AM detector gain can thus be measured at asingle offset frequency and the same constant will apply at all offsetfrequencies. Replacing the phase detector with an AM detector, the AMnoise measurement can be calibrated in the same way as PM noisemeasurement, except the phase modulation must be replaced with amplmodulation.
The AM noise measurement is a characterization of a source. The residuAM noise of a DUT can only be made by using a source with lower AMnoise, then subtracting that AM noise from the measured output noise ofDUT. The noise floor of this technique is the noise floor of the source.
AM NoiseMeasurementBlock Diagrams
Figure 12-1 AM Noise System Block Diagram using an E5500 Opt 001
Figure 12-2 AM Noise System Block Diagram using an External Detector
Agilent Technologies E5500 Phase Noise Measurement System 12-3

AM Noise Measurement FundamentalsAmplitude Noise Measurement
Figure 12-3 AM Noise System Block Diagram using an Agilent/HP 70429A Opt K21
Figure 12-4 AM Noise System Block Diagram using an Agilent/HP 70427ADownconverter
AM Detector
Figure 12-5 AM Detector Schematic
AM Detector Specifications
Detector type low barrier Schottky diode
Carrier frequency range 10 MHz to 26.5 GHz
Maximum input power +23 dBm
12-4 Agilent Technologies E5500 Phase Noise Measurement System
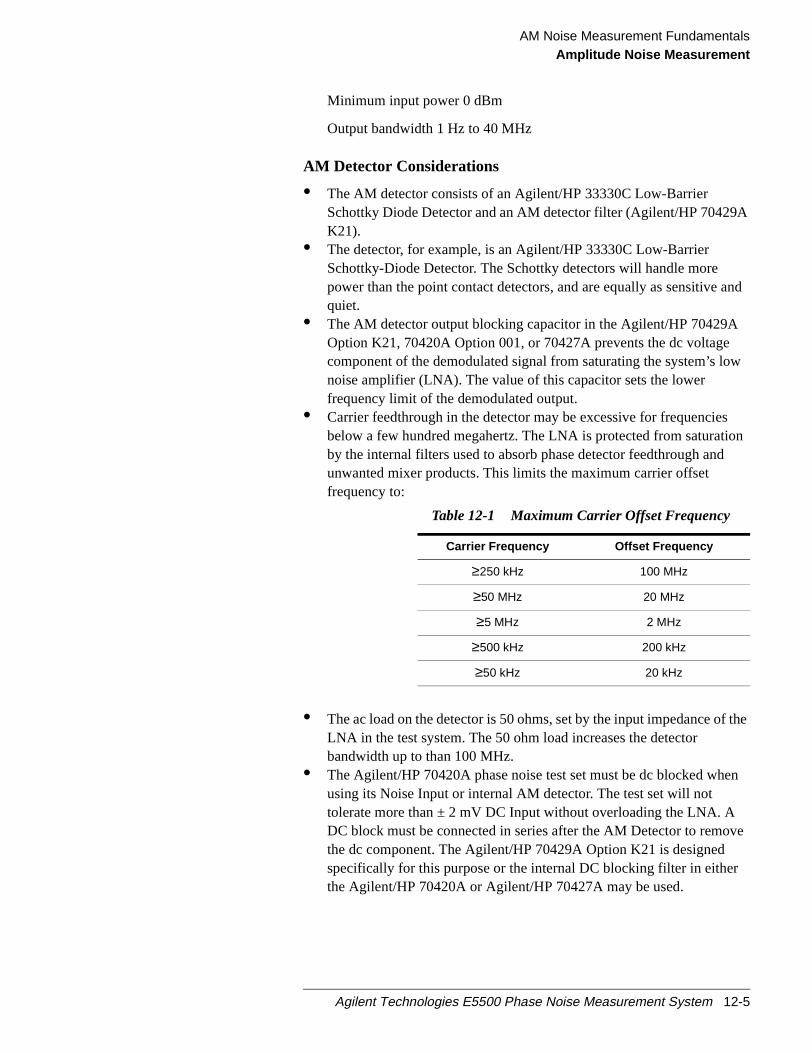
AM Noise Measurement FundamentalsAmplitude Noise Measurement
A
and
w
n
the
n
ve
Minimum input power 0 dBm
Output bandwidth 1 Hz to 40 MHz
AM Detector Considerations
• The AM detector consists of an Agilent/HP 33330C Low-BarrierSchottky Diode Detector and an AM detector filter (Agilent/HP 70429K21).
• The detector, for example, is an Agilent/HP 33330C Low-BarrierSchottky-Diode Detector. The Schottky detectors will handle morepower than the point contact detectors, and are equally as sensitivequiet.
• The AM detector output blocking capacitor in the Agilent/HP 70429AOption K21, 70420A Option 001, or 70427A prevents the dc voltagecomponent of the demodulated signal from saturating the system’s lonoise amplifier (LNA). The value of this capacitor sets the lowerfrequency limit of the demodulated output.
• Carrier feedthrough in the detector may be excessive for frequenciesbelow a few hundred megahertz. The LNA is protected from saturatioby the internal filters used to absorb phase detector feedthrough andunwanted mixer products. This limits the maximum carrier offsetfrequency to:
• The ac load on the detector is 50 ohms, set by the input impedance ofLNA in the test system. The 50 ohm load increases the detectorbandwidth up to than 100 MHz.
• The Agilent/HP 70420A phase noise test set must be dc blocked wheusing its Noise Input or internal AM detector. The test set will nottolerate more than ± 2 mV DC Input without overloading the LNA. ADC block must be connected in series after the AM Detector to remothe dc component. The Agilent/HP 70429A Option K21 is designedspecifically for this purpose or the internal DC blocking filter in eitherthe Agilent/HP 70420A or Agilent/HP 70427A may be used.
Table 12-1 Maximum Carrier Offset Frequency
Carrier Frequency Offset Frequency
≥250 kHz 100 MHz
≥50 MHz 20 MHz
≥5 MHz 2 MHz
≥500 kHz 200 kHz
≥50 kHz 20 kHz
Agilent Technologies E5500 Phase Noise Measurement System 12-5

AM Noise Measurement FundamentalsCalibration and Measurement General Guidelines
yste.
P
ifmld
d
ove
ald
ible
est
esseir
Calibration and Measurement GeneralGuidelines
NOTE Read This The following general guidelines should be considered whensetting up and making an AM-noise measurement.
• The AM detector must be well shielded from external noise especiall60 Hz noise. The components between the diode detector and the tesystem should be packaged in a metal box to prevent RFI interferenc
NOTE The internal detectors in the Agilent/HP 70420A Option 001 and Agilent/H70427A, along with the Agilent/HP 70429A Option K21 provide this levelof protection.
Also, the AM detector should be connected directly to the test systempossible, to minimize ground loops. If the AM detector and test systemust be separated, semi-rigid cable should be used to keep the shieresistance to a minimum.
• Although AM noise measurements are less vulnerable than residualphase-noise measurements to noise induced by vibration andtemperature fluctuation, care should be taken to ensure that allconnections are tight and that all cables are electrically sound.
• The output voltage monitor on the AM detector must be disconnectefrom digital voltmeters or other noisy monitoring equipment beforenoise measurement data is taken.
• The noise floor of the detector may degrade as power increases ab+15 dBm. Noise in the region of the detector is best measured withabout +10 dBm of drive level. The noise floor is best measured withabout +20 dBm of drive level.
• An amplifier must be used in cases where the signal level out of theDUT is too small to drive the AM detector or is inadequate to producelow enough measurement noise floor. In this case the amplifier shouhave the following characteristics.
• It should have the lowest possible noise figure, and the greatest possdynamic range.
• The signal level must be kept as high as possible at all points in the tsetup to avoid noise floor degradation.
• It should have only enough gain to get the required signal levels. Excgain leads to amplifiers operating in gain compression, increasing thlikelihood of suppressing the AM noise to be measured.
1f---
1f---
12-6 Agilent Technologies E5500 Phase Noise Measurement System

AM Noise Measurement FundamentalsCalibration and Measurement General Guidelines
• The amplifier’s sensitivity to power supply noise and the supply noiseitself must both be minimized.
Agilent Technologies E5500 Phase Noise Measurement System 12-7
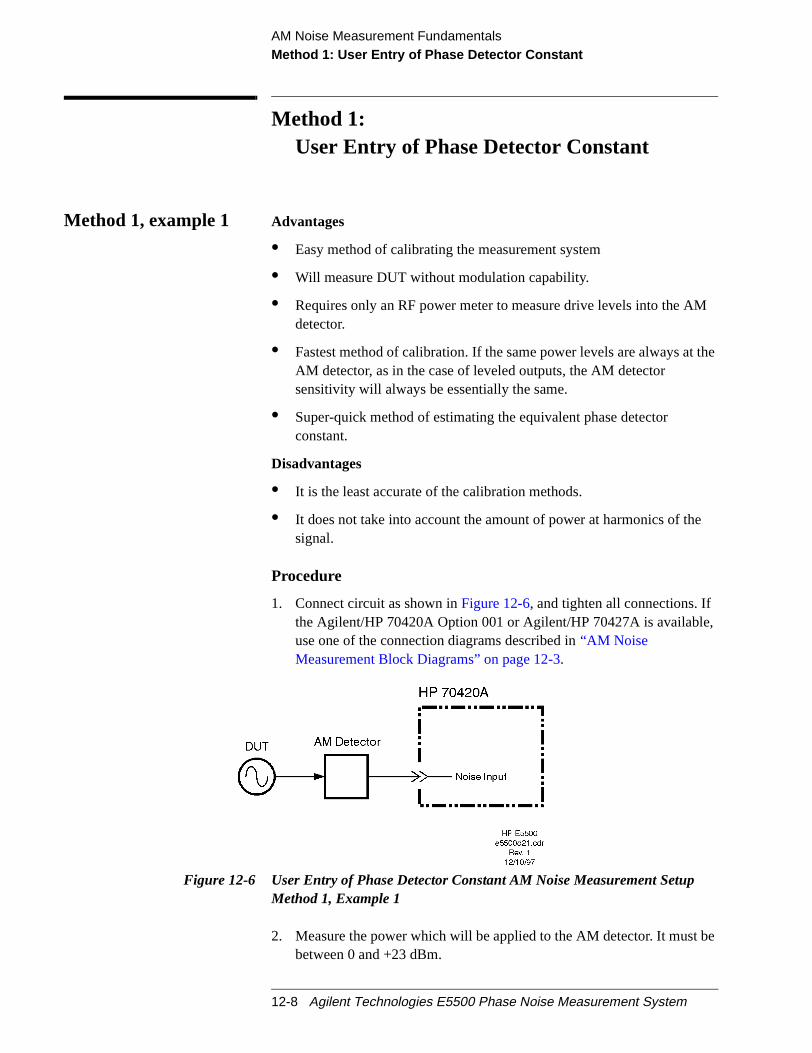
AM Noise Measurement FundamentalsMethod 1: User Entry of Phase Detector Constant
the
,
e
Method 1:User Entry of Phase Detector Constant
Method 1, example 1 Advantages
• Easy method of calibrating the measurement system
• Will measure DUT without modulation capability.
• Requires only an RF power meter to measure drive levels into the AMdetector.
• Fastest method of calibration. If the same power levels are always atAM detector, as in the case of leveled outputs, the AM detectorsensitivity will always be essentially the same.
• Super-quick method of estimating the equivalent phase detectorconstant.
Disadvantages
• It is the least accurate of the calibration methods.
• It does not take into account the amount of power at harmonics of thesignal.
Procedure
1. Connect circuit as shown inFigure 12-6, and tighten all connections. Ifthe Agilent/HP 70420A Option 001 or Agilent/HP 70427A is availableuse one of the connection diagrams described in“AM NoiseMeasurement Block Diagrams” on page 12-3.
Figure 12-6 User Entry of Phase Detector Constant AM Noise Measurement SetupMethod 1, Example 1
2. Measure the power which will be applied to the AM detector. It must bbetween 0 and +23 dBm.
12-8 Agilent Technologies E5500 Phase Noise Measurement System
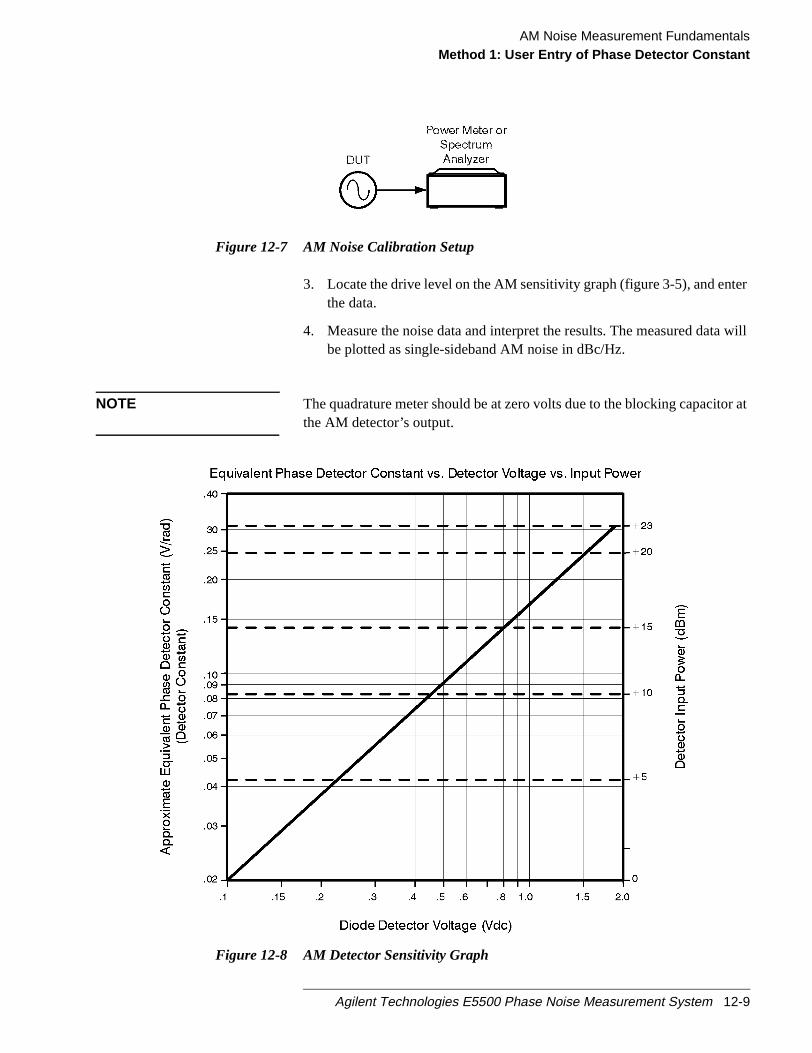
AM Noise Measurement FundamentalsMethod 1: User Entry of Phase Detector Constant
er
will
or at
Figure 12-7 AM Noise Calibration Setup
3. Locate the drive level on the AM sensitivity graph (figure 3-5), and entthe data.
4. Measure the noise data and interpret the results. The measured databe plotted as single-sideband AM noise in dBc/Hz.
NOTE The quadrature meter should be at zero volts due to the blocking capacitthe AM detector’s output.
Figure 12-8 AM Detector Sensitivity Graph
Agilent Technologies E5500 Phase Noise Measurement System 12-9
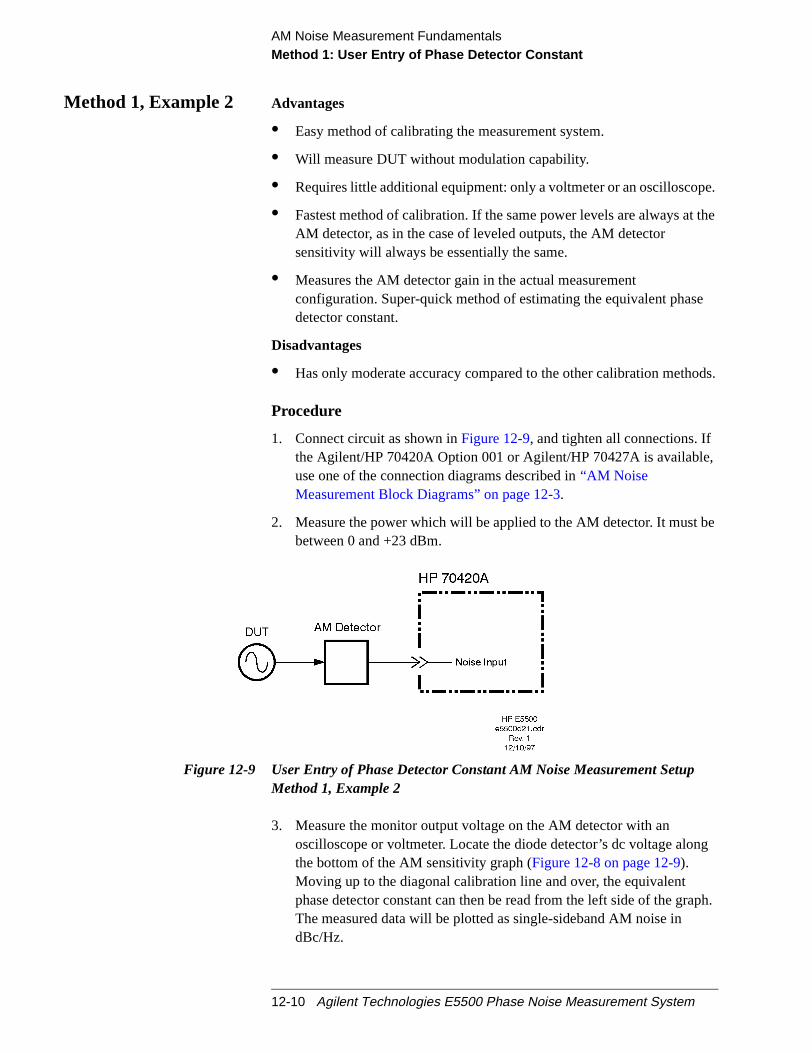
AM Noise Measurement FundamentalsMethod 1: User Entry of Phase Detector Constant
e.
the
e
ods.
,
e
g
ph.
Method 1, Example 2 Advantages
• Easy method of calibrating the measurement system.
• Will measure DUT without modulation capability.
• Requires little additional equipment: only a voltmeter or an oscilloscop
• Fastest method of calibration. If the same power levels are always atAM detector, as in the case of leveled outputs, the AM detectorsensitivity will always be essentially the same.
• Measures the AM detector gain in the actual measurementconfiguration. Super-quick method of estimating the equivalent phasdetector constant.
Disadvantages
• Has only moderate accuracy compared to the other calibration meth
Procedure
1. Connect circuit as shown inFigure 12-9, and tighten all connections. Ifthe Agilent/HP 70420A Option 001 or Agilent/HP 70427A is availableuse one of the connection diagrams described in“AM NoiseMeasurement Block Diagrams” on page 12-3.
2. Measure the power which will be applied to the AM detector. It must bbetween 0 and +23 dBm.
Figure 12-9 User Entry of Phase Detector Constant AM Noise Measurement SetupMethod 1, Example 2
3. Measure the monitor output voltage on the AM detector with anoscilloscope or voltmeter. Locate the diode detector’s dc voltage alonthe bottom of the AM sensitivity graph (Figure 12-8 on page 12-9).Moving up to the diagonal calibration line and over, the equivalentphase detector constant can then be read from the left side of the graThe measured data will be plotted as single-sideband AM noise indBc/Hz.
12-10 Agilent Technologies E5500 Phase Noise Measurement System

AM Noise Measurement FundamentalsMethod 1: User Entry of Phase Detector Constant
or at
Figure 12-10 Modulation Sideband Calibration Setup
4. Measure noise data and interpret the results.
NOTE The quadrature meter should be at zero volts due to the blocking capacitthe AM detector’s output.
Agilent Technologies E5500 Phase Noise Measurement System 12-11

AM Noise Measurement FundamentalsMethod 2: Double-Sided Spur
hetwo
d
,
e
rce0 dB
Method 2: Double-Sided Spur
Method 2, Example 1 Advantages
• Requires only one RF source (DUT)
• Calibration is done under actual measurement conditions so allnon-linearities and harmonics of the AM detector are calibrated out. Tdouble-sided spur method and the single-sided-spur method are themost accurate methods for this reason.
Disadvantages
• Required that the DUT have adjustable AM which may also be turneoff.
• Requires the AM of the DUT to be extremely accurate; otherwise amodulation analyzer, for manual measurement of AM sidebands isrequired.
Procedure
1. Connect circuit as shown inFigure 12-11, and tighten all connections. Ifthe Agilent/HP 70420A Option 001 or Agilent/HP 70427A is availableuse one of the connection diagrams described in“AM NoiseMeasurement Block Diagrams” on page 12-3.
Figure 12-11 Double-sided Spur AM Noise Measurement Setup Method 1, Example 1
2. Measure the power which will be applied to the AM detector. It must bbetween 0 and +23 dBm.
3. Measure the carrier-to-sideband ratio of the AM at the AM detector’sinput with an RF spectrum analyzer or modulation analyzer. The soushould be adjusted such that the sidebands are between –30 and –6below the carrier with a modulation rate between 10 Hz and 20 MHz.
12-12 Agilent Technologies E5500 Phase Noise Measurement System
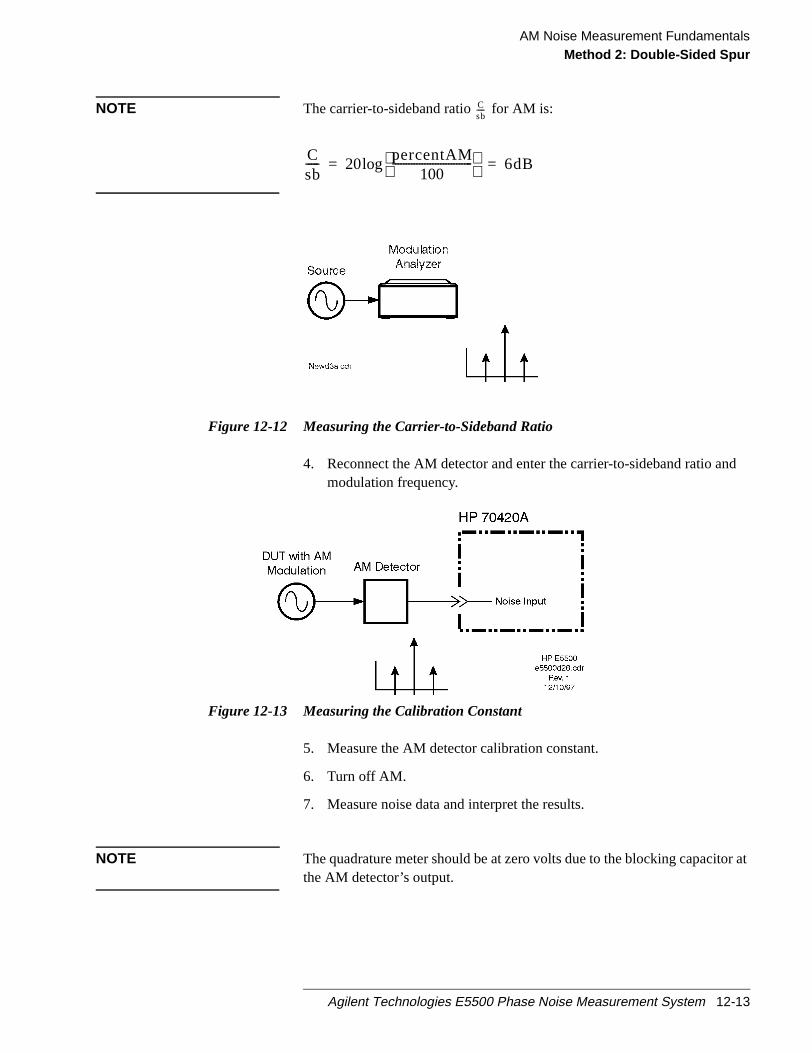
AM Noise Measurement FundamentalsMethod 2: Double-Sided Spur
d
or at
NOTE The carrier-to-sideband ratio for AM is:
Figure 12-12 Measuring the Carrier-to-Sideband Ratio
4. Reconnect the AM detector and enter the carrier-to-sideband ratio anmodulation frequency.
Figure 12-13 Measuring the Calibration Constant
5. Measure the AM detector calibration constant.
6. Turn off AM.
7. Measure noise data and interpret the results.
NOTE The quadrature meter should be at zero volts due to the blocking capacitthe AM detector’s output.
Csb-----
Csb----- 20
percentAM100
------------------------------ log 6dB= =
Agilent Technologies E5500 Phase Noise Measurement System 12-13
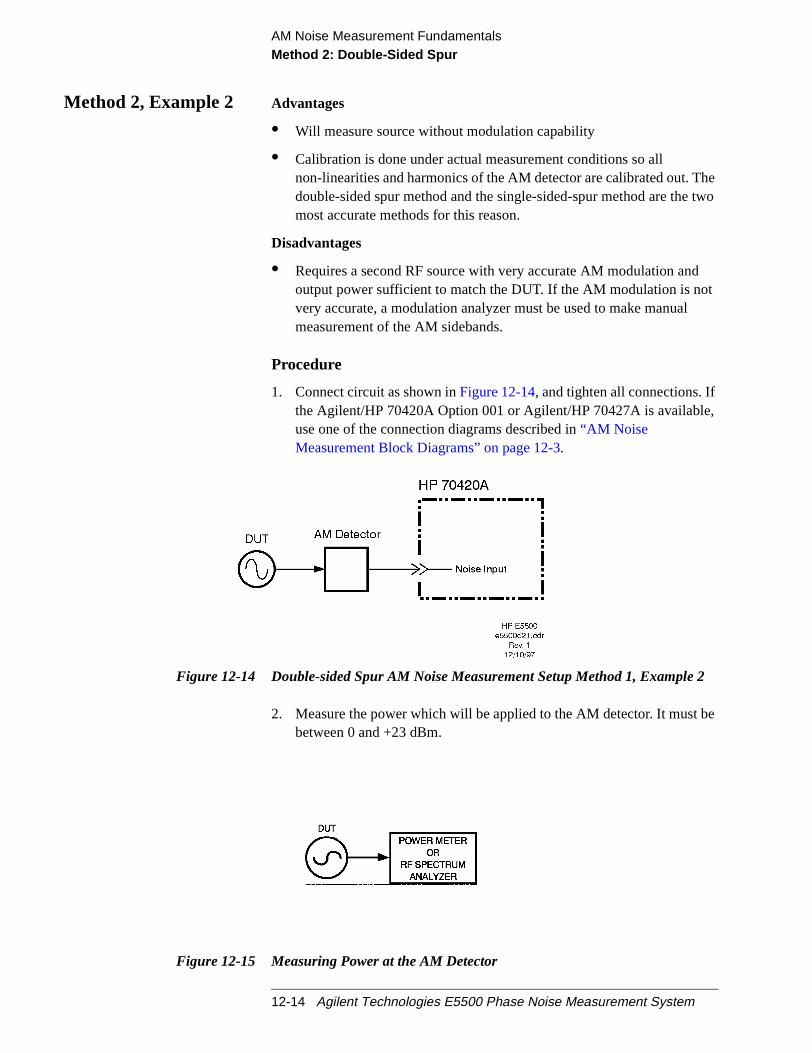
AM Noise Measurement FundamentalsMethod 2: Double-Sided Spur
hetwo
t
,
e
Method 2, Example 2 Advantages
• Will measure source without modulation capability
• Calibration is done under actual measurement conditions so allnon-linearities and harmonics of the AM detector are calibrated out. Tdouble-sided spur method and the single-sided-spur method are themost accurate methods for this reason.
Disadvantages
• Requires a second RF source with very accurate AM modulation andoutput power sufficient to match the DUT. If the AM modulation is novery accurate, a modulation analyzer must be used to make manualmeasurement of the AM sidebands.
Procedure
1. Connect circuit as shown inFigure 12-14, and tighten all connections. Ifthe Agilent/HP 70420A Option 001 or Agilent/HP 70427A is availableuse one of the connection diagrams described in“AM NoiseMeasurement Block Diagrams” on page 12-3.
Figure 12-14 Double-sided Spur AM Noise Measurement Setup Method 1, Example 2
2. Measure the power which will be applied to the AM detector. It must bbetween 0 and +23 dBm.
Figure 12-15 Measuring Power at the AM Detector
12-14 Agilent Technologies E5500 Phase Noise Measurement System

AM Noise Measurement FundamentalsMethod 2: Double-Sided Spur
re
3. Using a source with AM, set its output power equal to the powermeasured in step 2. The source should be adjusted such that thesidebands are between –30 and –60 dB below the carrier with amodulation rate between 10 Hz and 20 MHz.
NOTE The carrier-to-sideband ratio for AM is:
To check the AM performance of the source, measure thecarrier-to-sideband ratio of the AM at the source output with a modulationanalyzer.
Figure 12-16 Measuring Carrier-to-Sideband Ratio
4. Enter the carrier-to-sideband ratio and offset frequency, then measuthe calibration constant.
Figure 12-17 Measuring the Calibration Constant
5. Remove the AM source and reconnect the DUT.
6. Measure noise data and interpret the results.
Csb-----
Csb----- 20
percentAM100
------------------------------ log 6dB= =
Agilent Technologies E5500 Phase Noise Measurement System 12-15
AM Noise Measurement FundamentalsMethod 2: Double-Sided Spur
or at
NOTE The quadrature meter should be at zero volts due to the blocking capacitthe AM detector’s output.12-16 Agilent Technologies E5500 Phase Noise Measurement System

AM Noise Measurement FundamentalsMethod 3: Single-Sided-Spur
hetwo
part
,
e
Method 3: Single-Sided-Spur
Advantages
• Will measure source without modulation capability.
• Calibration is done under actual measurement conditions so allnon-linearities and harmonics of the AM detector are calibrated out. Tdouble-sided spur method and the single-sided-spur method are themost accurate methods for this reason.
Disadvantages
• Requires 2 RF sources, which must be between 10 Hz and 40 MHz ain frequency.
• Requires an RF spectrum analyzer for manual measurement of thesignal-to-spur ratio and spur offset.
Procedure
1. Connect circuit as shown inFigure 12-6, and tighten all connections. Ifthe Agilent/HP 70420A Option 001 or Agilent/HP 70427A is availableuse one of the connection diagrams described in“AM NoiseMeasurement Block Diagrams” on page 12-3.
Figure 12-18 AM Noise Measurement Setup Using Single-Sided-Spur
2. Measure the power which will be applied to the AM detector. It must bbetween 0 and +23 dBm.
Agilent Technologies E5500 Phase Noise Measurement System 12-17
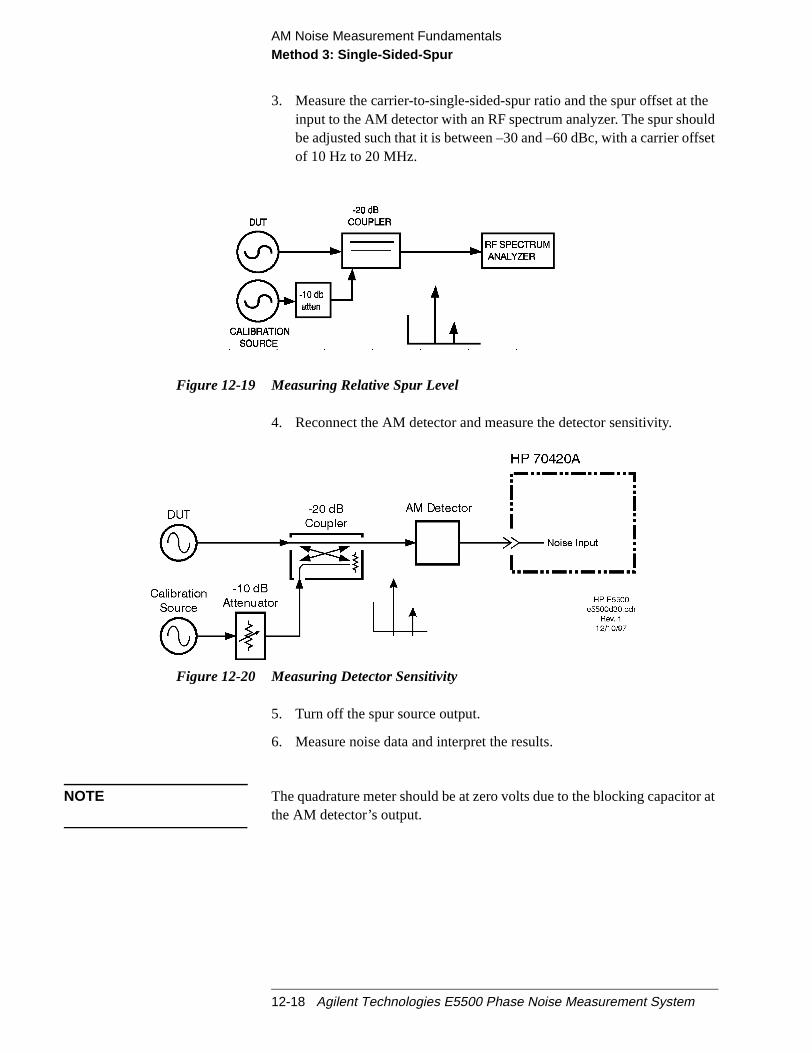
AM Noise Measurement FundamentalsMethod 3: Single-Sided-Spur
heuldfset
or at
3. Measure the carrier-to-single-sided-spur ratio and the spur offset at tinput to the AM detector with an RF spectrum analyzer. The spur shobe adjusted such that it is between –30 and –60 dBc, with a carrier ofof 10 Hz to 20 MHz.
Figure 12-19 Measuring Relative Spur Level
4. Reconnect the AM detector and measure the detector sensitivity.
Figure 12-20 Measuring Detector Sensitivity
5. Turn off the spur source output.
6. Measure noise data and interpret the results.
NOTE The quadrature meter should be at zero volts due to the blocking capacitthe AM detector’s output.
12-18 Agilent Technologies E5500 Phase Noise Measurement System
13 AM Noise Measurement Examples
What You’ll Find in This Chapter
• “AM Noise using an Agilent/HP 70420A Option 001” on page 13-2(AM_noise_1ghz_8644b.pnm)
CAUTION To prevent damage to the Agilent/HP 70420A test set’s hardwarecomponents, the input signalmust notbe applied to the signal inputconnector until the input attenuator has been correctly set for the desiredconfiguration, as show inTable 13-2 on page 13-7. Apply the input signalwhen theConnection Diagramappears.
Agilent Technologies E5500 Phase Noise Measurement System 13-1

AM Noise Measurement ExamplesAM Noise using an Agilent/HP 70420A Option 001
on
e
AM Noise using an Agilent/HP 70420AOption 001
This example demonstrates the AM noise measurement of anAgilent/HP 8662A Signal Generator using the AM detector in theAgilent/HP 70420A Option 001 Phase Noise test set. For more informatiabout various calibration techniques, refer toChapter 12, “AM NoiseMeasurement Fundamentals”.
This measurement uses the double sided spur calibration method.
The measurement of a source with amplitude modulation capability isamong the simplest of the AM noise measurements. The modulationsidebands used to calibrate the AM detector are generated by the DUT.Required Equipment
CAUTION To prevent damage to the Agilent/HP 70420A test set’s hardwarecomponents, the input signalmust notbe applied to the signal inputconnector until the input attenuator has been correctly set for the desiredconfiguration, as show inTable 13-2 on page 13-7. Apply the input signalwhen theConnection Diagramappears.
The following equipment is required for this example in addition to thephase noise test system and your unit-under-test (UUT).
NOTE To ensure accurate measurements, you should allow the UUT andmeasurement equipment to warm up at least one hour before making thnoise measurement.
The following is the configuration used for an AM noise measurement.
Table 13-1 Required Equipment for the AM Noiseusing the Agilent/HP 70420A Option001 Measurement Example
Equipment Quantity Comments
Agilent/HP 8644B 1
Coax Cables And adequate adapters to connectthe UUT and reference source tothe test set.
13-2 Agilent Technologies E5500 Phase Noise Measurement System
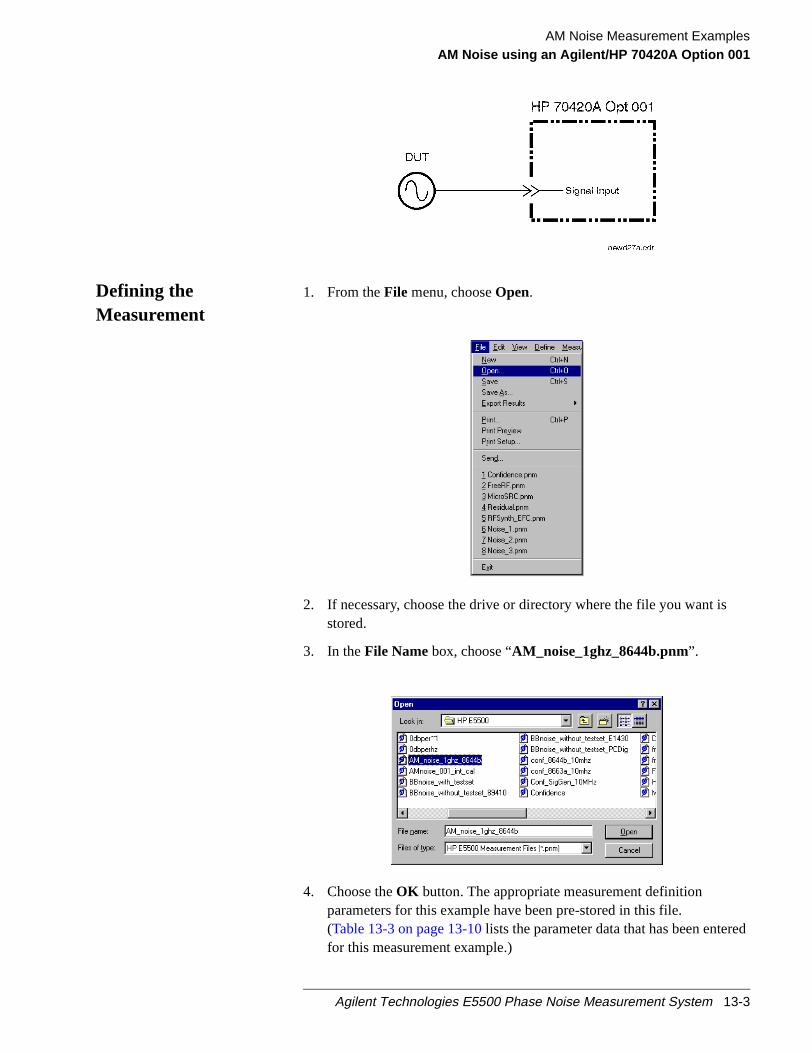
AM Noise Measurement ExamplesAM Noise using an Agilent/HP 70420A Option 001
ed
Defining theMeasurement
1. From theFile menu, chooseOpen.
2. If necessary, choose the drive or directory where the file you want isstored.
3. In theFile Namebox, choose “AM_noise_1ghz_8644b.pnm”.
4. Choose theOK button. The appropriate measurement definitionparameters for this example have been pre-stored in this file.(Table 13-3 on page 13-10lists the parameter data that has been enterfor this measurement example.)
Agilent Technologies E5500 Phase Noise Measurement System 13-3

AM Noise Measurement ExamplesAM Noise using an Agilent/HP 70420A Option 001
e
NOTE The amplitude of a source under system control, for an AM noisemeasurement, will automatically be set to +10 dBm. If any other amplitudis desired, the source should be placed under manual control. All othermeasurements set the source to +16 dBm automatically.
The appropriate measurement definition parameters for this examplehave been pre-stored in this file.Table 13-3 on page 13-10lists theparameter data that has been entered for the FM Discriminatormeasurement example.)
5. From theDefine menu, chooseMeasurement; then choose theTypeand Rangetab from theDefine Measurementwindow.
a. From the Measurement Type pull-down, selectAM Noise.
13-4 Agilent Technologies E5500 Phase Noise Measurement System

AM Noise Measurement ExamplesAM Noise using an Agilent/HP 70420A Option 001
s,
6. Choose theSourcestab from theDefine Measurementwindow.
a. Enter the carrier (center) frequency of your UUT. Enter the samefrequency for the detector input frequency.
7. Choose theCal tab from theDefine Measurementwindow.
a. SelectUse automatic internal self-calibrationas the calibrationmethod. For more information about various calibration techniquerefer toChapter 12, “AM Noise Measurement Fundamentals”.
Agilent Technologies E5500 Phase Noise Measurement System 13-5

AM Noise Measurement ExamplesAM Noise using an Agilent/HP 70420A Option 001
8. Choose theBlock Diagram tab from theDefine Measurementwindow.
a. From thePhase Detectorpull-down, selectAM Detector.
9. Choose theGraph tab from theDefine Measurementwindow.
a. Enter a graph description of your choice.
10. When you have completed these operations, click theClosebutton.
13-6 Agilent Technologies E5500 Phase Noise Measurement System
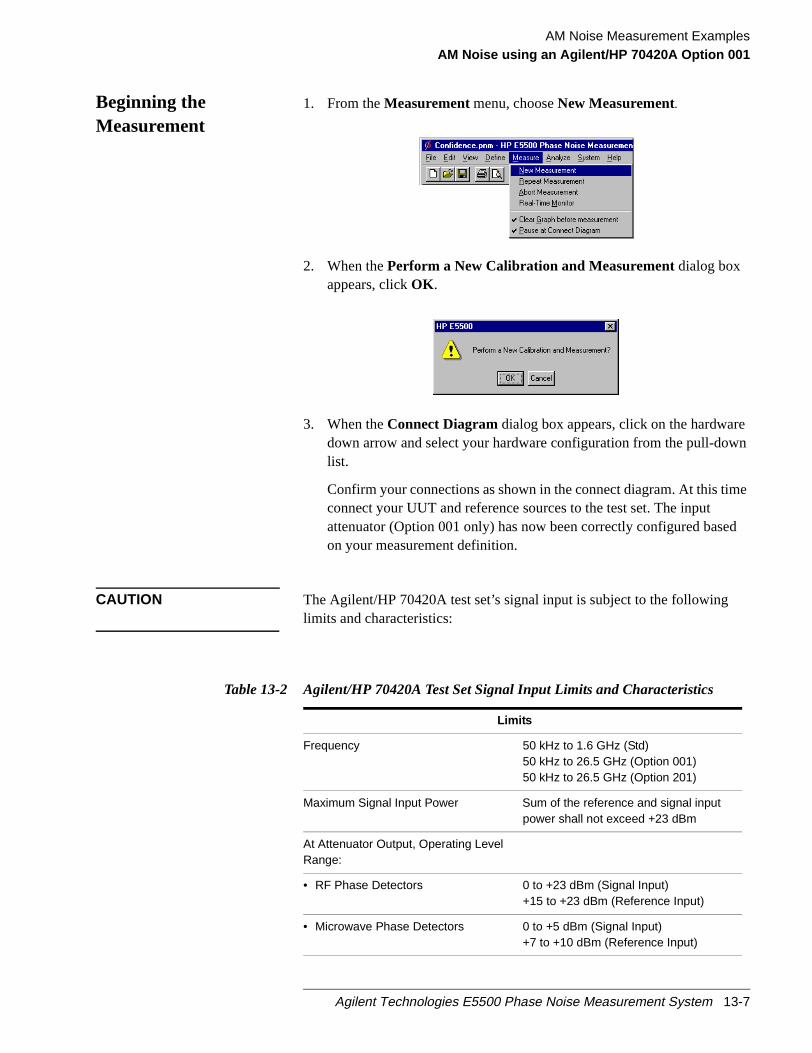
AM Noise Measurement ExamplesAM Noise using an Agilent/HP 70420A Option 001
n
e
d
Beginning theMeasurement
1. From theMeasurementmenu, chooseNew Measurement.
2. When thePerform a New Calibration and Measurementdialog boxappears, clickOK .
3. When theConnect Diagramdialog box appears, click on the hardwaredown arrow and select your hardware configuration from the pull-dowlist.
Confirm your connections as shown in the connect diagram. At this timconnect your UUT and reference sources to the test set. The inputattenuator (Option 001 only) has now been correctly configured baseon your measurement definition.
CAUTION The Agilent/HP 70420A test set’s signal input is subject to the followinglimits and characteristics:
Table 13-2 Agilent/HP 70420A Test Set Signal Input Limits and Characteristics
Limits
Frequency 50 kHz to 1.6 GHz (Std)50 kHz to 26.5 GHz (Option 001)50 kHz to 26.5 GHz (Option 201)
Maximum Signal Input Power Sum of the reference and signal inputpower shall not exceed +23 dBm
At Attenuator Output, Operating LevelRange:
• RF Phase Detectors 0 to +23 dBm (Signal Input)+15 to +23 dBm (Reference Input)
• Microwave Phase Detectors 0 to +5 dBm (Signal Input)+7 to +10 dBm (Reference Input)
Agilent Technologies E5500 Phase Noise Measurement System 13-7
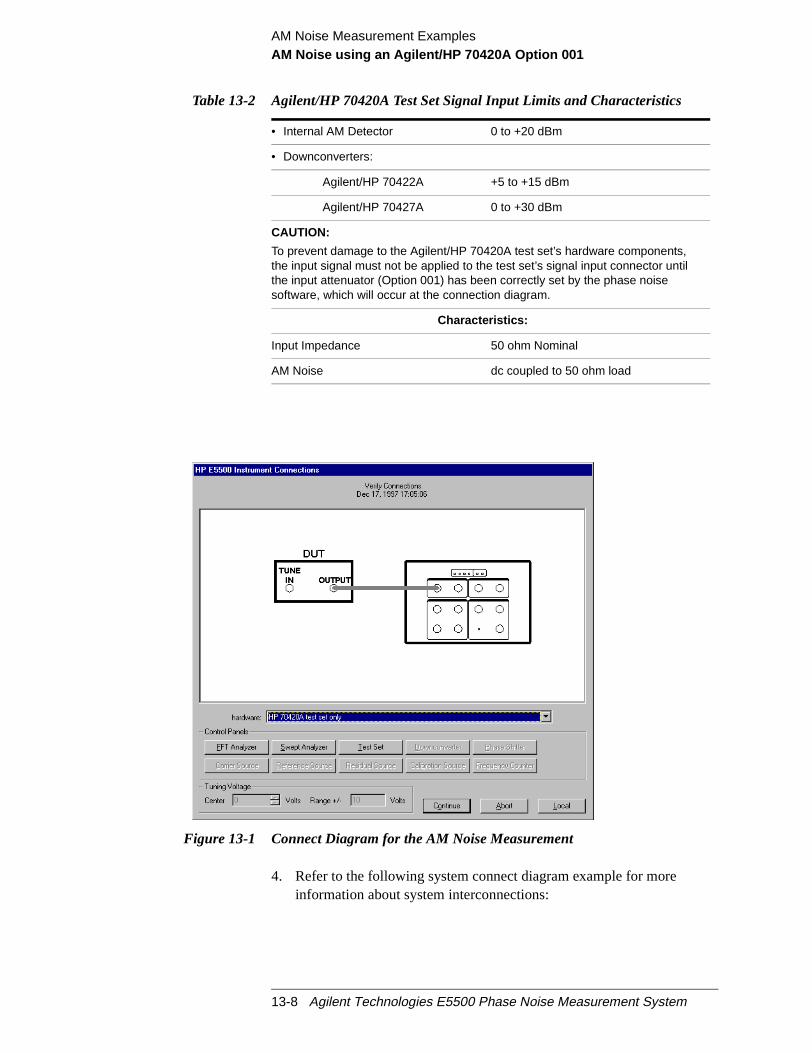
AM Noise Measurement ExamplesAM Noise using an Agilent/HP 70420A Option 001
Figure 13-1 Connect Diagram for the AM Noise Measurement
4. Refer to the following system connect diagram example for moreinformation about system interconnections:
• Internal AM Detector 0 to +20 dBm
• Downconverters:
Agilent/HP 70422A +5 to +15 dBm
Agilent/HP 70427A 0 to +30 dBm
CAUTION:
To prevent damage to the Agilent/HP 70420A test set’s hardware components,the input signal must not be applied to the test set’s signal input connector untilthe input attenuator (Option 001) has been correctly set by the phase noisesoftware, which will occur at the connection diagram.
Characteristics:
Input Impedance 50 ohm Nominal
AM Noise dc coupled to 50 ohm load
Table 13-2 Agilent/HP 70420A Test Set Signal Input Limits and Characteristics
13-8 Agilent Technologies E5500 Phase Noise Measurement System
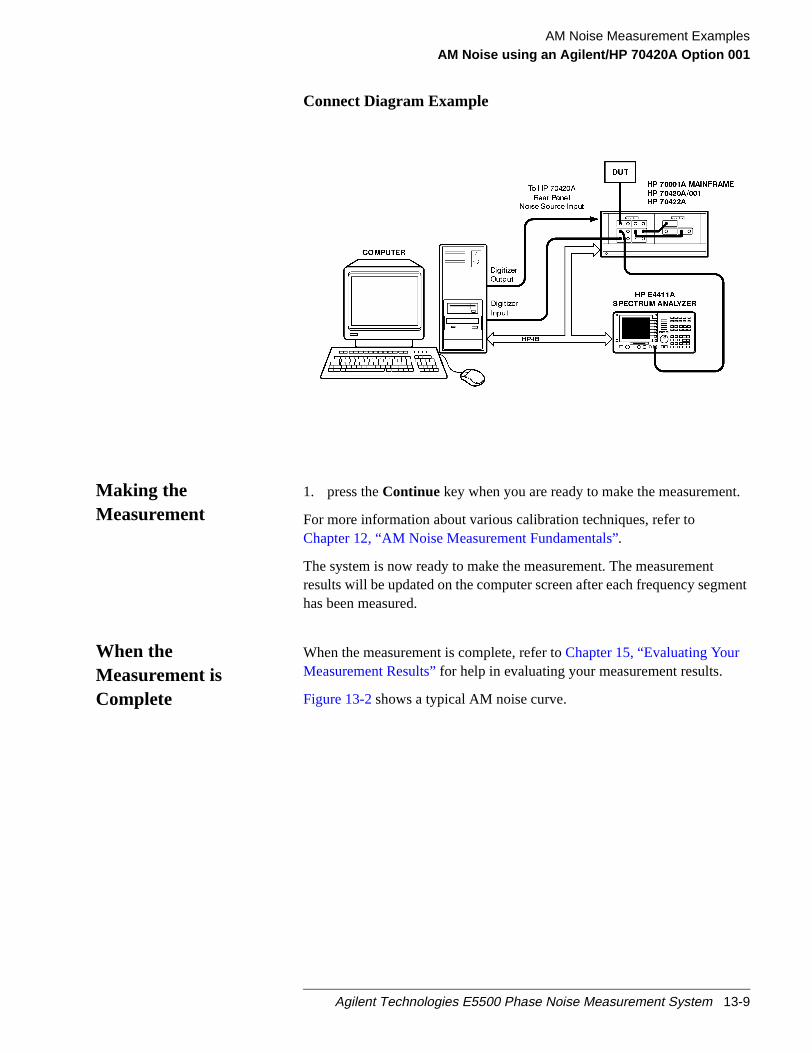
AM Noise Measurement ExamplesAM Noise using an Agilent/HP 70420A Option 001
t.
ment
Connect Diagram Example
Making theMeasurement
1. press theContinue key when you are ready to make the measuremen
For more information about various calibration techniques, refer toChapter 12, “AM Noise Measurement Fundamentals”.
The system is now ready to make the measurement. The measurementresults will be updated on the computer screen after each frequency seghas been measured.
When theMeasurement isComplete
When the measurement is complete, refer toChapter 15, “Evaluating YourMeasurement Results”for help in evaluating your measurement results.
Figure 13-2shows a typical AM noise curve.
Agilent Technologies E5500 Phase Noise Measurement System 13-9

AM Noise Measurement ExamplesAM Noise using an Agilent/HP 70420A Option 001
Figure 13-2 Typical AM Noise Curve.
Table 13-3 Parameter Data for the AM Noise using an Agilent/HP 70420A Option001
Step Parameters Data
1 Type and Range Tab
• Measurement Type
• Start Frequency
• Stop Frequency
• Averages
• FFT Quality
• Swept Quality
• AM Noise
• 10 Hz
• 100 E + 6 Hz
• 4
• Fast
• Fast
2 Sources Tab
• Carrier Source Frequency
• Carrier Source Power
• Carrier Source Output isconnected to:
• Detector Input Frequency
• 600 E + 6 Hz
• 20 dBm
• Test Set
• 600 E +6 Hz
3 Cal Tab
• Detector Constant
• Known Spur Parameters
Offset Frequency
Amplitude
• Use internal automatic self-calibration
• 1 Hz
• -130 dBc
13-10 Agilent Technologies E5500 Phase Noise Measurement System
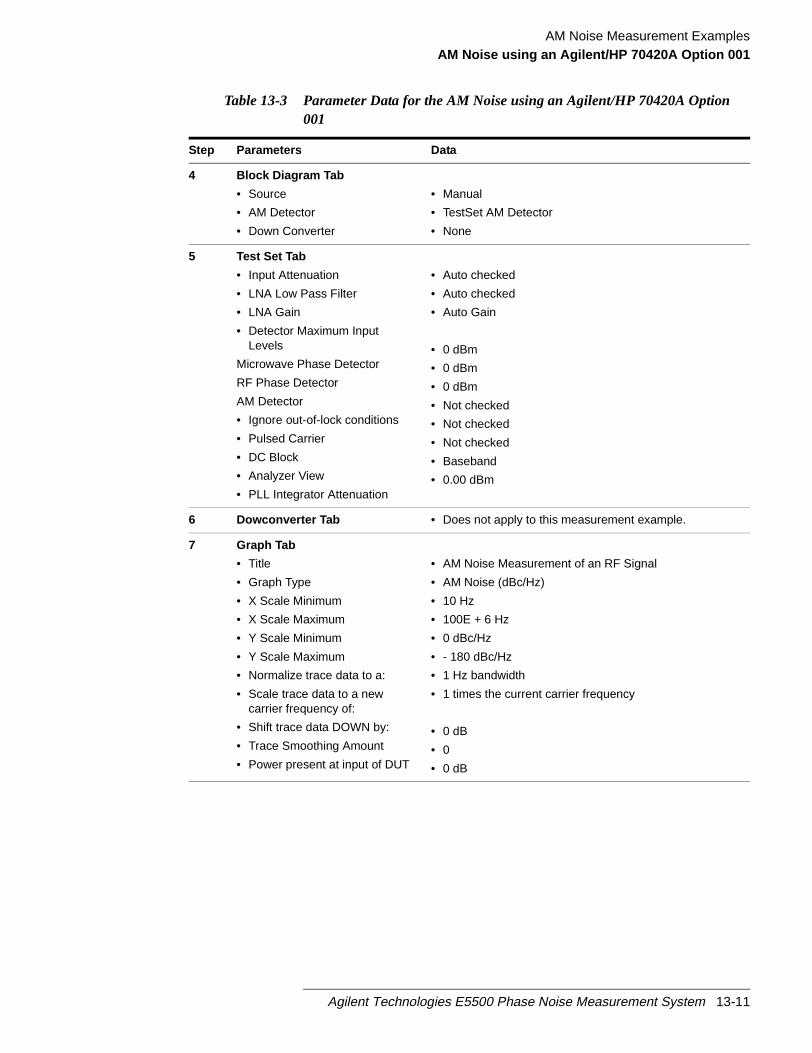
AM Noise Measurement ExamplesAM Noise using an Agilent/HP 70420A Option 001
4 Block Diagram Tab
• Source
• AM Detector
• Down Converter
• Manual
• TestSet AM Detector
• None
5 Test Set Tab
• Input Attenuation
• LNA Low Pass Filter
• LNA Gain
• Detector Maximum InputLevels
Microwave Phase Detector
RF Phase Detector
AM Detector
• Ignore out-of-lock conditions
• Pulsed Carrier
• DC Block
• Analyzer View
• PLL Integrator Attenuation
• Auto checked
• Auto checked
• Auto Gain
• 0 dBm
• 0 dBm
• 0 dBm
• Not checked
• Not checked
• Not checked
• Baseband
• 0.00 dBm
6 Dowconverter Tab • Does not apply to this measurement example.
7 Graph Tab
• Title
• Graph Type
• X Scale Minimum
• X Scale Maximum
• Y Scale Minimum
• Y Scale Maximum
• Normalize trace data to a:
• Scale trace data to a newcarrier frequency of:
• Shift trace data DOWN by:
• Trace Smoothing Amount
• Power present at input of DUT
• AM Noise Measurement of an RF Signal
• AM Noise (dBc/Hz)
• 10 Hz
• 100E + 6 Hz
• 0 dBc/Hz
• - 180 dBc/Hz
• 1 Hz bandwidth
• 1 times the current carrier frequency
• 0 dB
• 0
• 0 dB
Table 13-3 Parameter Data for the AM Noise using an Agilent/HP 70420A Option001
Step Parameters Data
Agilent Technologies E5500 Phase Noise Measurement System 13-11

14 Baseband Noise Measurement Examples
What You’ll Find in This Chapter
• Baseband Noise using a Test Set Measurement Example, page 14-2
• Baseband Noise without using a Test Set Measurement Example,page 14-6
Agilent Technologies E5500 Phase Noise Measurement System 14-1
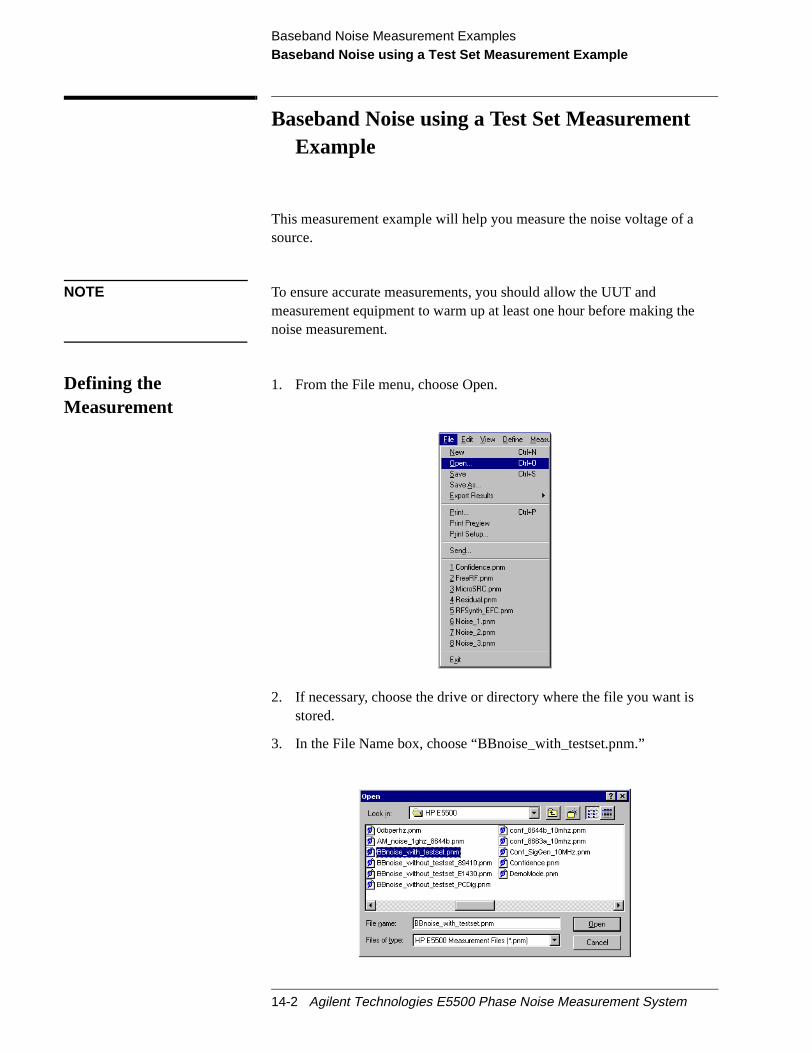
Baseband Noise Measurement ExamplesBaseband Noise using a Test Set Measurement Example
e
Baseband Noise using a Test Set MeasurementExample
This measurement example will help you measure the noise voltage of asource.
NOTE To ensure accurate measurements, you should allow the UUT andmeasurement equipment to warm up at least one hour before making thnoise measurement.
Defining theMeasurement
1. From the File menu, choose Open.
2. If necessary, choose the drive or directory where the file you want isstored.
3. In the File Name box, choose “BBnoise_with_testset.pnm.”
14-2 Agilent Technologies E5500 Phase Noise Measurement System
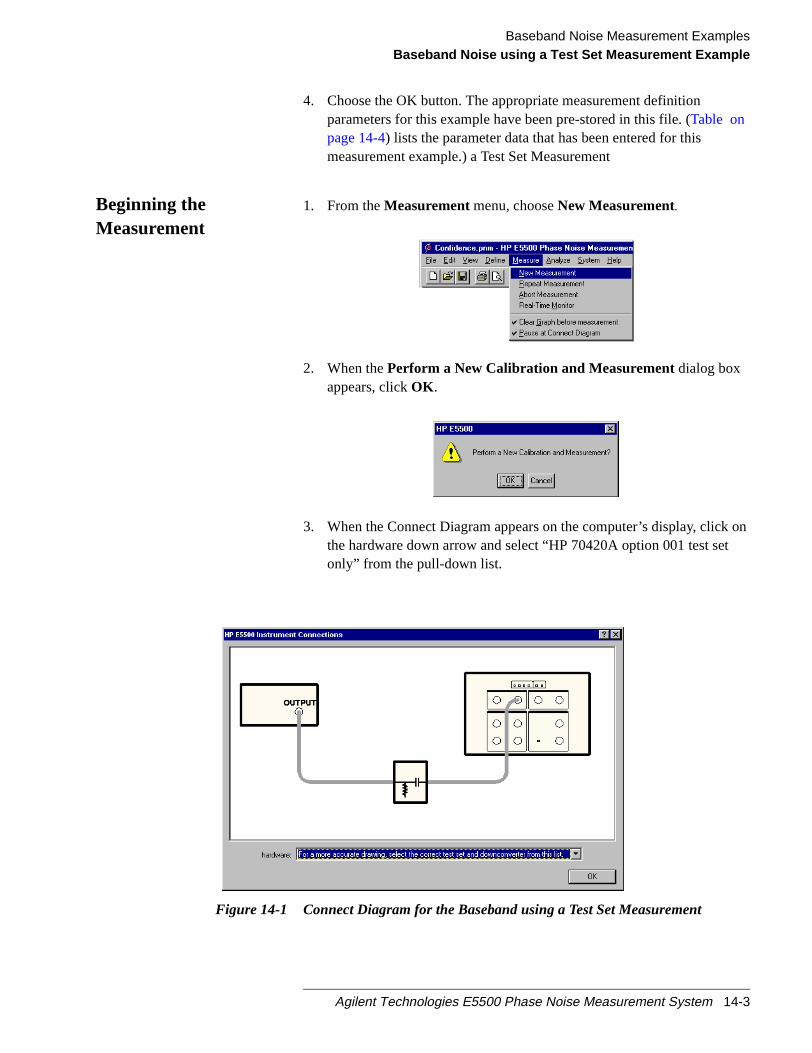
Baseband Noise Measurement ExamplesBaseband Noise using a Test Set Measurement Example
on
4. Choose the OK button. The appropriate measurement definitionparameters for this example have been pre-stored in this file. (Table onpage 14-4) lists the parameter data that has been entered for thismeasurement example.) a Test Set Measurement
Beginning theMeasurement
1. From theMeasurementmenu, chooseNew Measurement.
2. When thePerform a New Calibration and Measurementdialog boxappears, clickOK .
3. When the Connect Diagram appears on the computer’s display, clickthe hardware down arrow and select “HP 70420A option 001 test setonly” from the pull-down list.
Figure 14-1 Connect Diagram for the Baseband using a Test Set Measurement
Agilent Technologies E5500 Phase Noise Measurement System 14-3
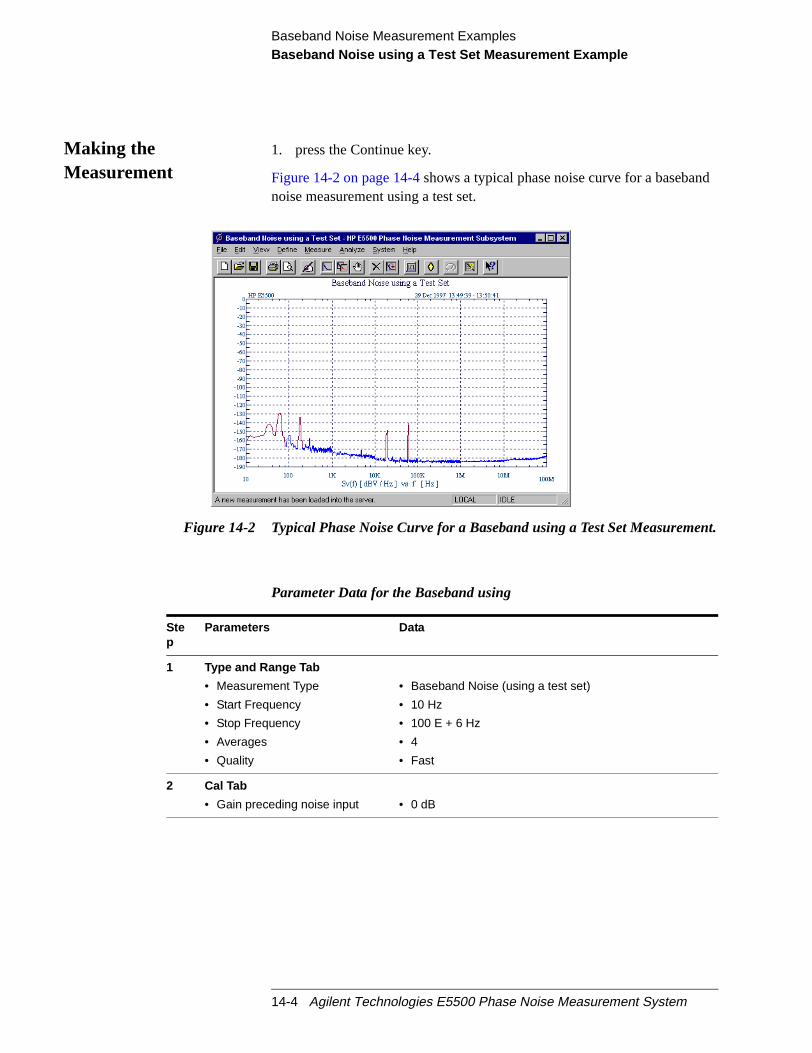
Baseband Noise Measurement ExamplesBaseband Noise using a Test Set Measurement Example
d
nt.
Making theMeasurement
1. press the Continue key.
Figure 14-2 on page 14-4shows a typical phase noise curve for a basebannoise measurement using a test set.
Figure 14-2 Typical Phase Noise Curve for a Baseband using a Test Set Measureme
Parameter Data for the Baseband using
Step
Parameters Data
1 Type and Range Tab
• Measurement Type
• Start Frequency
• Stop Frequency
• Averages
• Quality
• Baseband Noise (using a test set)
• 10 Hz
• 100 E + 6 Hz
• 4
• Fast
2 Cal Tab
• Gain preceding noise input • 0 dB
14-4 Agilent Technologies E5500 Phase Noise Measurement System
Baseband Noise Measurement ExamplesBaseband Noise using a Test Set Measurement Example
3 Block Diagram Tab
• Noise Source • Test Set Noise Input
4 Test Set Tab
Input Attenuation
LNA Low Pass Filter
• LNA Gain
• DC Block
• PLL Integrator Attenuation
• 0 dB
• 20 MHz (Auto checked)
• Auto Gain (Minimum Auto Gain - 14 dB)
• Not checked
• 0 dBm
5 Graph Tab
• Title
• Graph Type
• X Scale Minimum
• X Scale Maximum
• Y Scale Minimum
• Y Scale Maximum
• Normalize trace data to a:
• Scale trace data to a newcarrier frequency of:
• Shift trace data DOWN by:
• Trace Smoothing Amount
• Power present at input of DUT
• Baseband using the Agilent/HP 70420A Test Set
• Baseband Noise (dBV)
• 10 Hz
• 100 E + 6 Hz
• 0 dBc/Hz
• - 200 dBV/Hz
• 1 Hz bandwidth
• 1 times the current carrier frequency
• 0 dB
• 0
• 0 dB
Step
Parameters Data
Agilent Technologies E5500 Phase Noise Measurement System 14-5

Baseband Noise Measurement ExamplesBaseband Noise without using a Test Set Measurement Example
e
”.
Baseband Noise without using a Test Set MeasurementExample
This measurement example will help you measure the noise voltage of asource.
NOTE To ensure accurate measurements, you should allow the UUT andmeasurement equipment to warm up at least one hour before making thnoise measurement.
Defining theMeasurement
1. From the File menu, choose Open.
2. If necessary, choose the drive or directory where the file you want isstored.
3. In the File Name box, choose “BBnoise_without_testset_89410.pnm
14-6 Agilent Technologies E5500 Phase Noise Measurement System

Baseband Noise Measurement ExamplesBaseband Noise without using a Test Set Measurement Example
on
4. Choose the OK button. The appropriate measurement definitionparameters for this example have been pre-stored in this file. (Table onpage 14-4) lists the parameter data that has been entered for thismeasurement example.) a Test Set Measurement
Beginning theMeasurement
1. From theMeasurementmenu, chooseNew Measurement.
2. When thePerform a New Calibration and Measurementdialog boxappears, clickOK .
Making theMeasurement
3. When the Connect Diagram appears on the computer’s display, clickthe Continue button.
Figure 14-3 Connect Diagram for the Baseband using a Test Set Measurement
Agilent Technologies E5500 Phase Noise Measurement System 14-7

Baseband Noise Measurement ExamplesBaseband Noise without using a Test Set Measurement Example
d
Figure 14-4 on page 14-8shows a typical phase noise curve for a basebannoise measurement without using a test set.Figure 14-4 Typical Phase Noise Curve for a Baseband without using a Test SetMeasurement.
Table 14-1 Parameter Data for the Baseband without using a Test Set Measurement
Step
Parameters Data
1 Type and Range Tab
• Measurement Type
• Start Frequency
• Stop Frequency
• Averages
• Quality
• Baseband Noise (without using a test set)
• 10 Hz
• 100 E + 6 Hz
• 4
• Normal
14-8 Agilent Technologies E5500 Phase Noise Measurement System

Baseband Noise Measurement ExamplesBaseband Noise without using a Test Set Measurement Example
2 Cal Tab
• Gain preceding noise input • 0 dB
3 Block Diagram Tab
• Noise Source • Test Set Noise Input
5 Graph Tab
• Title
• Graph Type
• X Scale Minimum
• X Scale Maximum
• Y Scale Minimum
• Y Scale Maximum
• Normalize trace data to a:
• Scale trace data to a newcarrier frequency of:
• Shift trace data DOWN by:
• Trace Smoothing Amount
• Power present at input of DUT
• Baseband Noise without using a Test Set
• Baseband (dBV)
• 10 Hz
• 100 E + 6 Hz
• 0 dBc/Hz
• - 200 dBV/Hz
• 1 Hz bandwidth
• 1 times the current carrier frequency
• 0 dB
• 0
• 0 dB
Step
Parameters Data
Agilent Technologies E5500 Phase Noise Measurement System 14-9
ults
ld be
as
15 Evaluating Your Measurement Results
What You’ll Find in This Chapter
This chapter contains information to help you evaluate and output the resof your noise measurements. To use the information in this chapter, youshould have completed your noise measurement, and the computer shoudisplaying a graph of its measurement results. Storing the measurementresults in the Result File is recommended for each measurement.
To help you reference directly to the information you need, this chapter hbeen organized into three sections:
• Evaluating the Results, page 15-2 -- Refer here for information thatwill help you confirm the validity of your measurement results.
• Outputting the Results, page 15-7 -- Refer here for information aboutthe graphics and hard copy functions.
• Problem Solving, page 15-13 -- Refer here for help in solving specificproblems on the noise graph.
Agilent Technologies E5500 Phase Noise Measurement System 15-1
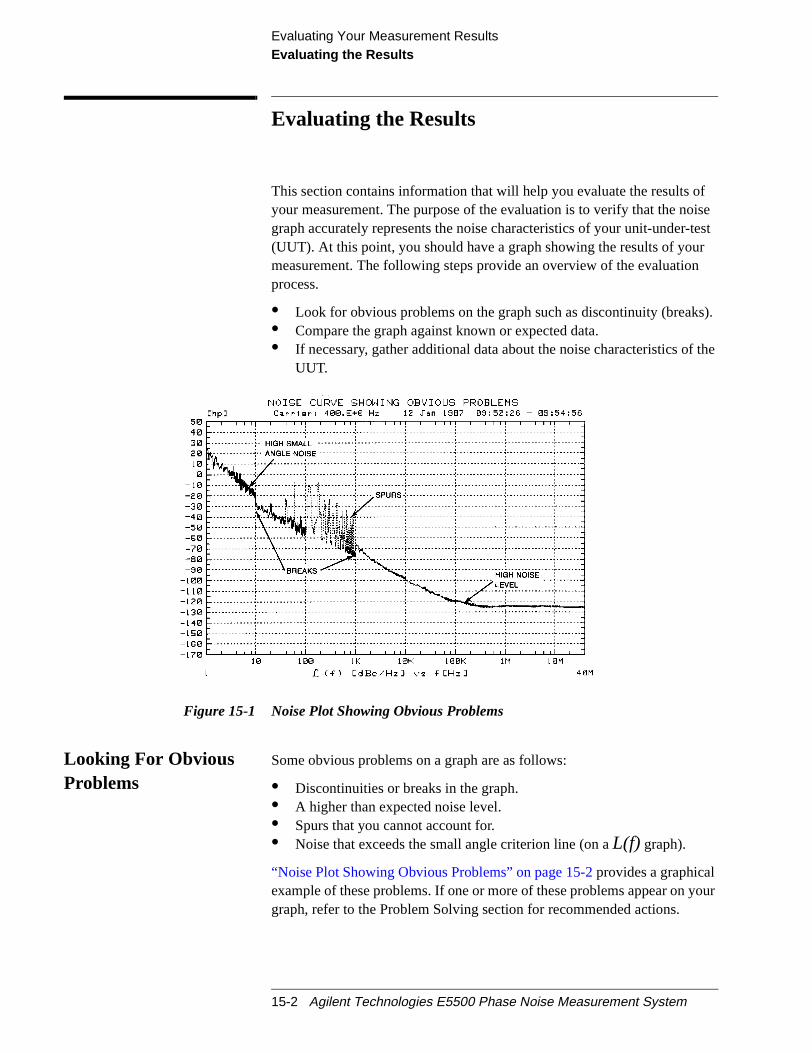
Evaluating Your Measurement ResultsEvaluating the Results
fisetestr
s).
f the
your
Evaluating the Results
This section contains information that will help you evaluate the results oyour measurement. The purpose of the evaluation is to verify that the nograph accurately represents the noise characteristics of your unit-under-(UUT). At this point, you should have a graph showing the results of youmeasurement. The following steps provide an overview of the evaluationprocess.
• Look for obvious problems on the graph such as discontinuity (break• Compare the graph against known or expected data.• If necessary, gather additional data about the noise characteristics o
UUT.
Figure 15-1 Noise Plot Showing Obvious Problems
Looking For ObviousProblems
Some obvious problems on a graph are as follows:
• Discontinuities or breaks in the graph.• A higher than expected noise level.• Spurs that you cannot account for.• Noise that exceeds the small angle criterion line (on aL(f) graph).
“Noise Plot Showing Obvious Problems” on page 15-2provides a graphicalexample of these problems. If one or more of these problems appear ongraph, refer to the Problem Solving section for recommended actions.
15-2 Agilent Technologies E5500 Phase Noise Measurement System
Evaluating Your Measurement ResultsEvaluating the Results
stics
its
ilar
ee
ce isurcel ofurceults
this,d
Comparing AgainstExpected Data
If none of the problems shown appear on your graph, there still may beproblems or uncertainties that are not obvious at first glance. Theseuncertainties can be evaluated by comparing your measurement resultsagainst the following data:
• The noise characteristics expected for your unit-under-test.• The noise floor and accuracy specifications of the phase noise test
system.• The noise characteristics of the signal source used as the reference
source.
The Unit-Under-Test
If you are testing a product for which published specifications exist,compare the measurement results against the noise and spur characterispecified for the product. If the product is operating correctly, the noisegraph provided by the phase noise system should be within the noise limspecified for the product.
If the device is a prototype or breadboard circuit, it may be possible toestimate its general noise characteristics using the characteristics of a simtype of circuit operating in a similar manner.
The Reference Source
It is important that you know the noise and spur characteristics of yourreference source when you are making phase noise measurements. (Thnoise measurement results provided when using this technique reflect thsum of all contributing noise sources in the system.)
The best way to determine the noise characteristics of the reference sourto measure them. If three comparable sources are available, the Three SoComparison technique can be used to determine the absolute noise leveeach of the three sources. If you are using as your reference source, a sofor which published specifications exist, compare your measurement resagainst the noise and spur characteristics specified for that source.
If you have obtained an actual (measured) noise curve for the referencesource you are using, you can use it to determine if your measurementresults have been increased by the noise of the reference source. To dodetermine the difference (in dB) between the level of the results graph anthat of the reference source. Then use the graph shown in“Graph ShowingHow Much to Decrease Measured Noise to Compensate for AddedReference Source Noise.” on page 15-5to determine if the measurementresults need to be decreased to reflect the actual noise level of the UUT.
Agilent Technologies E5500 Phase Noise Measurement System 15-3

Evaluating Your Measurement ResultsEvaluating the Results
l
For example, applying the 7 dB difference in noise levels, shown in“Example Comparison of Measurement Results and Reference SourceNoise.” on page 15-4at 10 kHz, to the graph, reveals that the measuredresults should be decreased by about 1 dB at 10 kHz to reflect the actuanoise of the UUT.
Figure 15-2 Example Comparison of Measurement Results and Reference SourceNoise.
15-4 Agilent Technologies E5500 Phase Noise Measurement System

Evaluating Your Measurement ResultsEvaluating the Results
e
Figure 15-3 Graph Showing How Much to Decrease Measured Noise to Compensatfor Added Reference Source Noise.
Agilent Technologies E5500 Phase Noise Measurement System 15-5

Evaluating Your Measurement ResultsGathering More Data
atularing adedhal
ay
d inhe
Gathering More Data
Repeating theMeasurement
Making phase noise measurements is often an iterative process. Theinformation derived from the first measurement will sometimes indicate thchanges to the measurement setup are necessary for measuring a particdevice. When you make changes to the measurement setup (such as trydifferent signal source, shortening cables, or any other action recommenin “Problem Solving” on page 15-13), repeating the measurement after eacchange allows you to check the effect that the change has had on the totnoise graph.
To repeat a measurement, on theMeasurementmenu, clickRepeatMeasurement.
Doing More Research If you are still uncertain about the validity of the measurement results, it mbe necessary to do further research to find other validating data for yourmeasurement. Additional information (such as typical noise curves fordevices similar to the unit-under-test or data sheets for components usethe device) can often provide insights into the expected performance of tunit-under-test.
15-6 Agilent Technologies E5500 Phase Noise Measurement System

Evaluating Your Measurement ResultsOutputting the Results
d to
Outputting the Results
This section describes the software’s capabilities for generating a printedhardcopy of your test results. You must have a printer must be connectethe computer to generate hard copies.
Using a Printer To print the phase noise graph, along with parameter summary data:
On theFile menu, clickPrint .
Agilent Technologies E5500 Phase Noise Measurement System 15-7

Evaluating Your Measurement ResultsGraph of Results
, andsload
Graph of Results
The Graph of Results functions are accessed from the main graph menuare used to display and evaluate the measurement results. This screen iautomatically displayed as a measurement is being made. You can alsoa result file using the File System functions, and then display the results.
The following functions are available to help you evaluate your results:
• Marker , page 15-9
• Omit Spurs, page 15-10
• Parameter Summary, page 15-12
15-8 Agilent Technologies E5500 Phase Noise Measurement System

Evaluating Your Measurement ResultsGraph of Results
n:
ck
Marker The marker function allows you to display the exact frequency andamplitude of any point on the results graph. To access the marker functio
On theView menu, clickMarkers.
Up to nine markers may be added. To remove the highlighted marker, clitheDeletebutton.
Agilent Technologies E5500 Phase Noise Measurement System 15-9

Evaluating Your Measurement ResultsGraph of Results
s
Omit Spurs Omit Spurs plots the currently loaded results without displaying any spurthat may be present.1. On theView menu, clickDisplay Preferences.
2. In theDisplay Preferencesdialog box, uncheckSpurs. Click OK
15-10 Agilent Technologies E5500 Phase Noise Measurement System
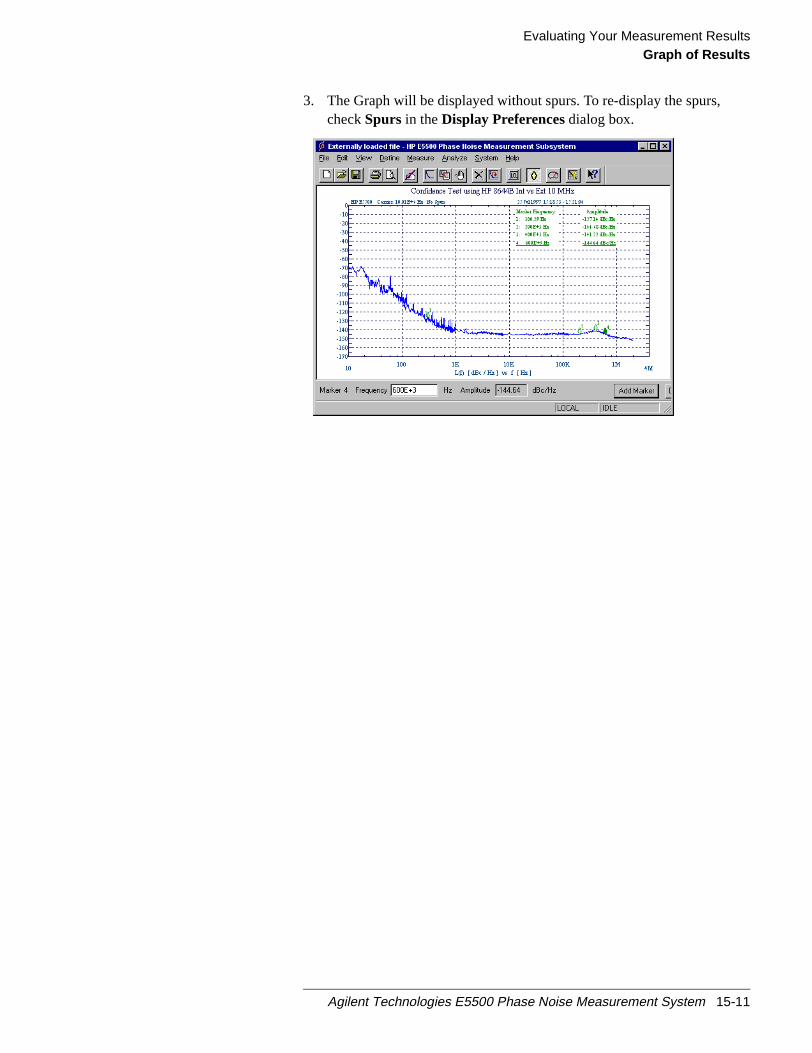
Evaluating Your Measurement ResultsGraph of Results
3. The Graph will be displayed without spurs. To re-display the spurs,checkSpurs in theDisplay Preferencesdialog box.
Agilent Technologies E5500 Phase Noise Measurement System 15-11

Evaluating Your Measurement ResultsGraph of Results
be
Parameter Summary The Parameter Summary function allows you to quickly review themeasurement parameter entries that were used for this measurement.The parameter summary data is included when you print the graph.
1. On theView menu, clickParameter Summary.
2. The Parameter Summary Notepad dialog box appears. The data canprinted or changed using standard Notepad functionality.
15-12 Agilent Technologies E5500 Phase Noise Measurement System

Evaluating Your Measurement ResultsProblem Solving
Problem Solving
Table 15-1 Problem Solving
If you need to know: Refer to:
• What to do about breaks in the noise graph Discontinuity in the Graph
• How to verify a noise level that is higher than expected High Noise Level
• How to verify unexpected spurs on the graph Spurs on the Graph
• How to interpret noise above the small angle line Small Angle Line
Agilent Technologies E5500 Phase Noise Measurement System 15-13
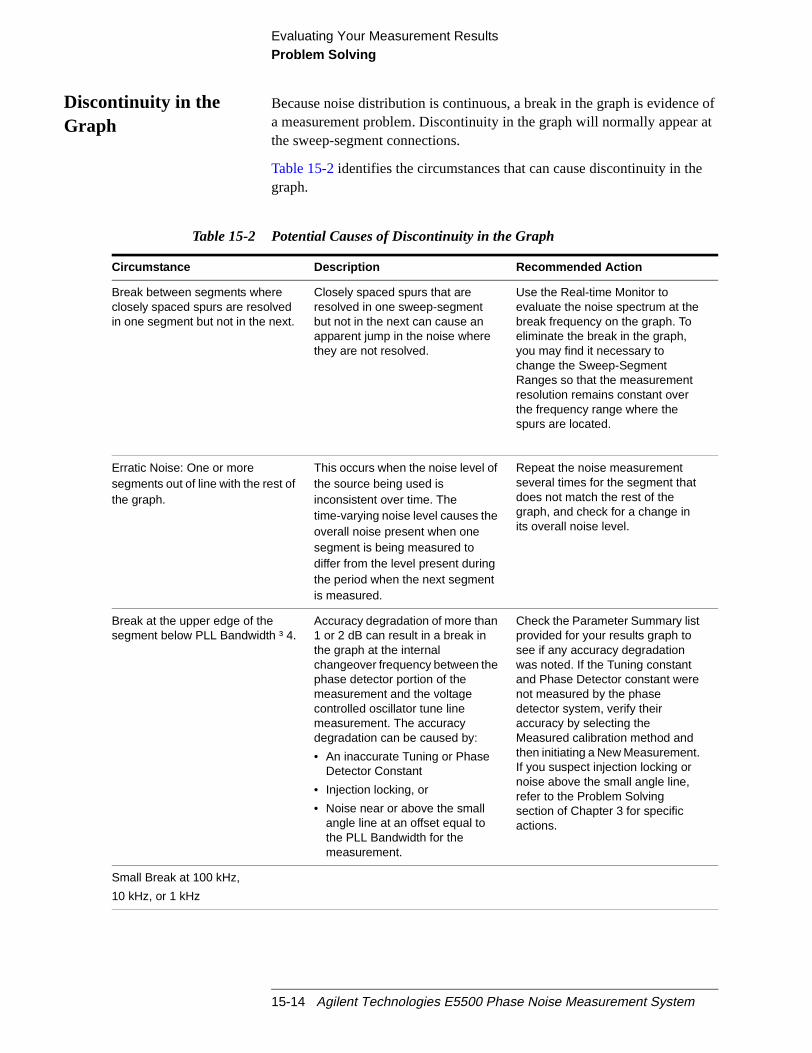
Evaluating Your Measurement ResultsProblem Solving
e ofat
Discontinuity in theGraph
Because noise distribution is continuous, a break in the graph is evidenca measurement problem. Discontinuity in the graph will normally appearthe sweep-segment connections.
Table 15-2identifies the circumstances that can cause discontinuity in thegraph.
Table 15-2 Potential Causes of Discontinuity in the Graph
Circumstance Description Recommended Action
Break between segments whereclosely spaced spurs are resolvedin one segment but not in the next.
Closely spaced spurs that areresolved in one sweep-segmentbut not in the next can cause anapparent jump in the noise wherethey are not resolved.
Use the Real-time Monitor toevaluate the noise spectrum at thebreak frequency on the graph. Toeliminate the break in the graph,you may find it necessary tochange the Sweep-SegmentRanges so that the measurementresolution remains constant overthe frequency range where thespurs are located.
Erratic Noise: One or moresegments out of line with the rest ofthe graph.
This occurs when the noise level ofthe source being used isinconsistent over time. Thetime-varying noise level causes theoverall noise present when onesegment is being measured todiffer from the level present duringthe period when the next segmentis measured.
Repeat the noise measurementseveral times for the segment thatdoes not match the rest of thegraph, and check for a change inits overall noise level.
Break at the upper edge of thesegment below PLL Bandwidth ³ 4.
Accuracy degradation of more than1 or 2 dB can result in a break inthe graph at the internalchangeover frequency between thephase detector portion of themeasurement and the voltagecontrolled oscillator tune linemeasurement. The accuracydegradation can be caused by:
• An inaccurate Tuning or PhaseDetector Constant
• Injection locking, or
• Noise near or above the smallangle line at an offset equal tothe PLL Bandwidth for themeasurement.
Check the Parameter Summary listprovided for your results graph tosee if any accuracy degradationwas noted. If the Tuning constantand Phase Detector constant werenot measured by the phasedetector system, verify theiraccuracy by selecting theMeasured calibration method andthen initiating a New Measurement.If you suspect injection locking ornoise above the small angle line,refer to the Problem Solvingsection of Chapter 3 for specificactions.
Small Break at 100 kHz,
10 kHz, or 1 kHz
15-14 Agilent Technologies E5500 Phase Noise Measurement System
Evaluating Your Measurement ResultsProblem Solving
euredof
Higher Noise Level The noise level measured by the test system reflects the sum of all of thenoise sources affecting the system. This includes noise sources within thsystem as well as external noise sources. If the general noise level measfor your device is much higher than you expected, begin evaluating eachthe potential noise sources. The following table will help you identify andevaluate many of the potential causes of a high noise floor.
Agilent Technologies E5500 Phase Noise Measurement System 15-15
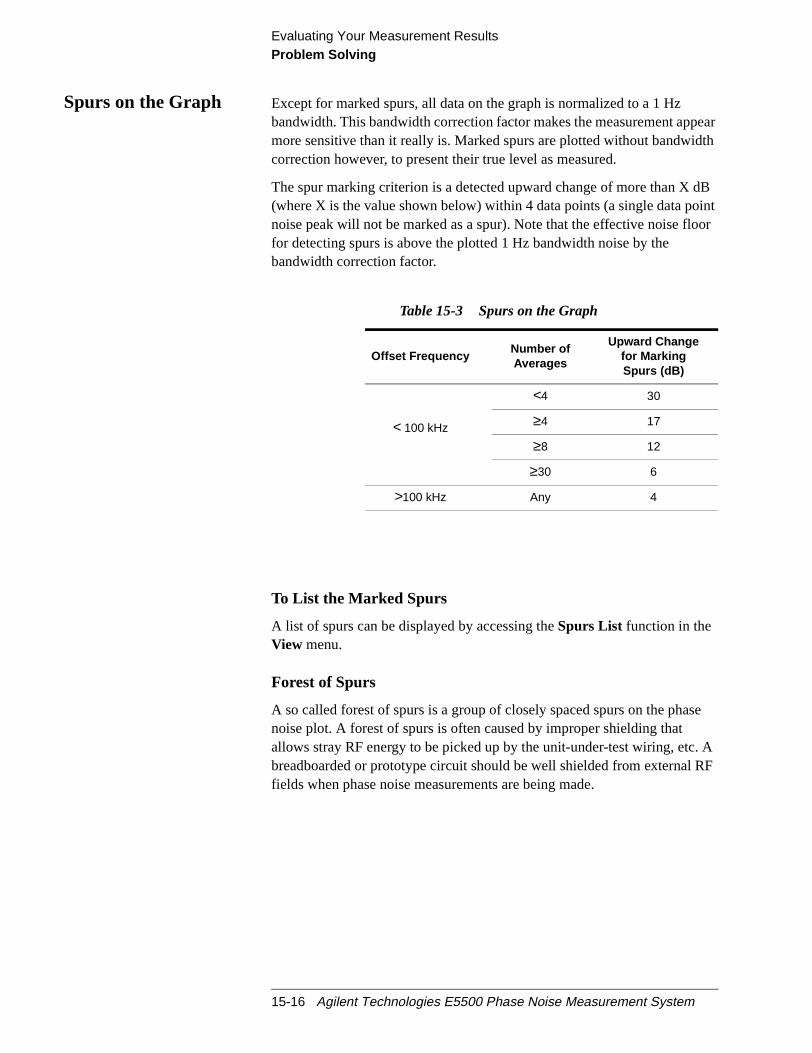
Evaluating Your Measurement ResultsProblem Solving
pearth
dBintor
se
ARF
Spurs on the Graph Except for marked spurs, all data on the graph is normalized to a 1 Hzbandwidth. This bandwidth correction factor makes the measurement apmore sensitive than it really is. Marked spurs are plotted without bandwidcorrection however, to present their true level as measured.
The spur marking criterion is a detected upward change of more than X(where X is the value shown below) within 4 data points (a single data ponoise peak will not be marked as a spur). Note that the effective noise flofor detecting spurs is above the plotted 1 Hz bandwidth noise by thebandwidth correction factor.
To List the Marked Spurs
A list of spurs can be displayed by accessing theSpurs List function in theView menu.
Forest of Spurs
A so called forest of spurs is a group of closely spaced spurs on the phanoise plot. A forest of spurs is often caused by improper shielding thatallows stray RF energy to be picked up by the unit-under-test wiring, etc.breadboarded or prototype circuit should be well shielded from externalfields when phase noise measurements are being made.
Table 15-3 Spurs on the Graph
Offset FrequencyNumber ofAverages
Upward Changefor MarkingSpurs (dB)
< 100 kHz
<4 30
≥4 17
≥8 12
≥30 6
>100 kHz Any 4
15-16 Agilent Technologies E5500 Phase Noise Measurement System
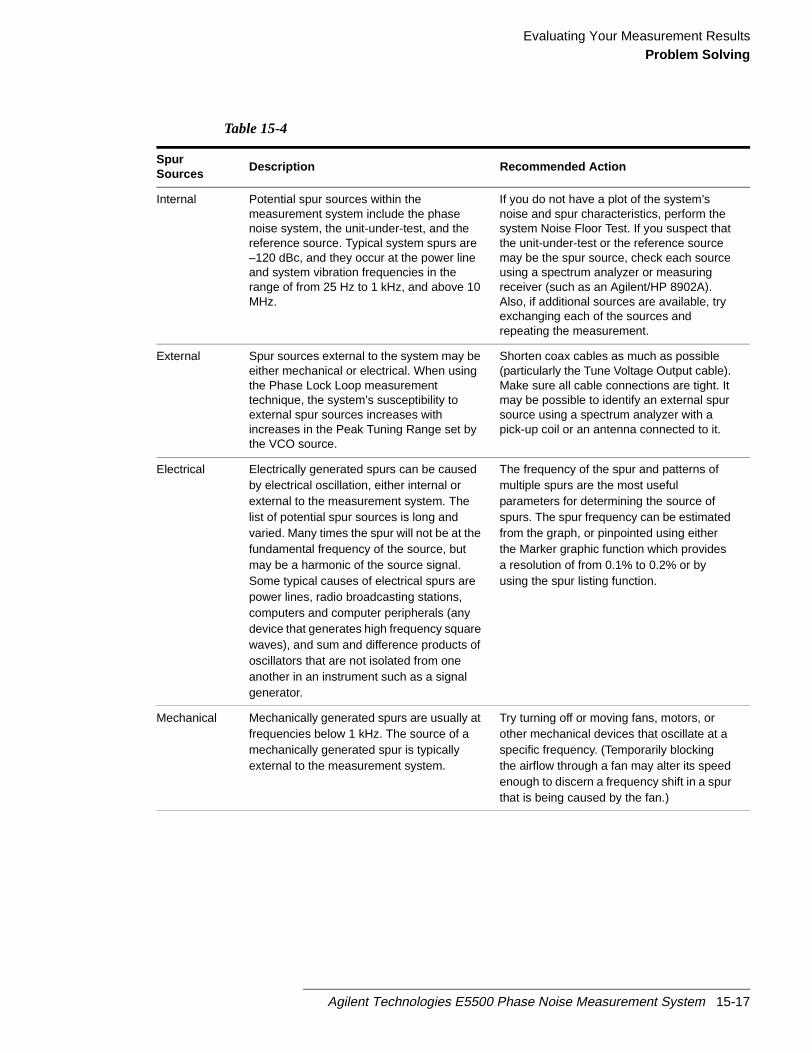
Evaluating Your Measurement ResultsProblem Solving
Table 15-4
SpurSources
Description Recommended Action
Internal Potential spur sources within themeasurement system include the phasenoise system, the unit-under-test, and thereference source. Typical system spurs are–120 dBc, and they occur at the power lineand system vibration frequencies in therange of from 25 Hz to 1 kHz, and above 10MHz.
If you do not have a plot of the system’snoise and spur characteristics, perform thesystem Noise Floor Test. If you suspect thatthe unit-under-test or the reference sourcemay be the spur source, check each sourceusing a spectrum analyzer or measuringreceiver (such as an Agilent/HP 8902A).Also, if additional sources are available, tryexchanging each of the sources andrepeating the measurement.
External Spur sources external to the system may beeither mechanical or electrical. When usingthe Phase Lock Loop measurementtechnique, the system’s susceptibility toexternal spur sources increases withincreases in the Peak Tuning Range set bythe VCO source.
Shorten coax cables as much as possible(particularly the Tune Voltage Output cable).Make sure all cable connections are tight. Itmay be possible to identify an external spursource using a spectrum analyzer with apick-up coil or an antenna connected to it.
Electrical Electrically generated spurs can be causedby electrical oscillation, either internal orexternal to the measurement system. Thelist of potential spur sources is long andvaried. Many times the spur will not be at thefundamental frequency of the source, butmay be a harmonic of the source signal.Some typical causes of electrical spurs arepower lines, radio broadcasting stations,computers and computer peripherals (anydevice that generates high frequency squarewaves), and sum and difference products ofoscillators that are not isolated from oneanother in an instrument such as a signalgenerator.
The frequency of the spur and patterns ofmultiple spurs are the most usefulparameters for determining the source ofspurs. The spur frequency can be estimatedfrom the graph, or pinpointed using eitherthe Marker graphic function which providesa resolution of from 0.1% to 0.2% or byusing the spur listing function.
Mechanical Mechanically generated spurs are usually atfrequencies below 1 kHz. The source of amechanically generated spur is typicallyexternal to the measurement system.
Try turning off or moving fans, motors, orother mechanical devices that oscillate at aspecific frequency. (Temporarily blockingthe airflow through a fan may alter its speedenough to discern a frequency shift in a spurthat is being caused by the fan.)
Agilent Technologies E5500 Phase Noise Measurement System 15-17

Evaluating Your Measurement ResultsProblem Solving
f thethe
asecy.he
Small Angle Line
Figure 15-4 L(f) Is Only Valid for Noise Levels Below the Small Angle Line
Caution must be exercised whereL(f) is calculated from the spectral densityof the phase modulationSφ(f)/2 because of the small angle criterion. Belowthe line, the plot ofL(f) is correct; above the line,L(f) is increasinglyinvalid and Sf(f) must be used to accurately represent the phase noise osignal. To accurately plot noise that exceeds the small angle line, selectSpectral Density of Phase Modulation (dB/Hz) graph type (Sφ(f)). L(f)raises the noise floor by 3 dB.
The –10 dB per decade line is drawn on the plot for an instantaneous phdeviation of 0.2 radians integrated over any one decade of offset frequenAt approximately 0.2 radians, the power in the higher order sideband of tphase modulation is still insignificant compared to the power in the firstorder sideband. This ensures that the calculation of cal L(f) is still valid.
15-18 Agilent Technologies E5500 Phase Noise Measurement System

m,
16 Advanced Software Features
What You’ll Find in This Chapter…
• Phase Lock Loop Suppression, page 16-3
• Blanking Frequency and Amplitude Information on the Phase NoiseGraph, page 16-13
NOTE Additional “Advanced Features” information will be included in futureversions of this manual. For information about our no-cost update prograrefer toSoftware and Documentation Updates, page 21-2.
Agilent Technologies E5500 Phase Noise Measurement System 16-1

Advanced Software FeaturesIntroduction
he
ges
Introduction
Advanced Functions allows you to manipulate the test system or tocustomize a measurement using the extended capabilities provided by tAgilent E5500 phase noise measurement software. These functions arerecommended to be used only by those who understand how themeasurement and the test system are affected. Refer to the following pafor details:
16-2 Agilent Technologies E5500 Phase Noise Measurement System
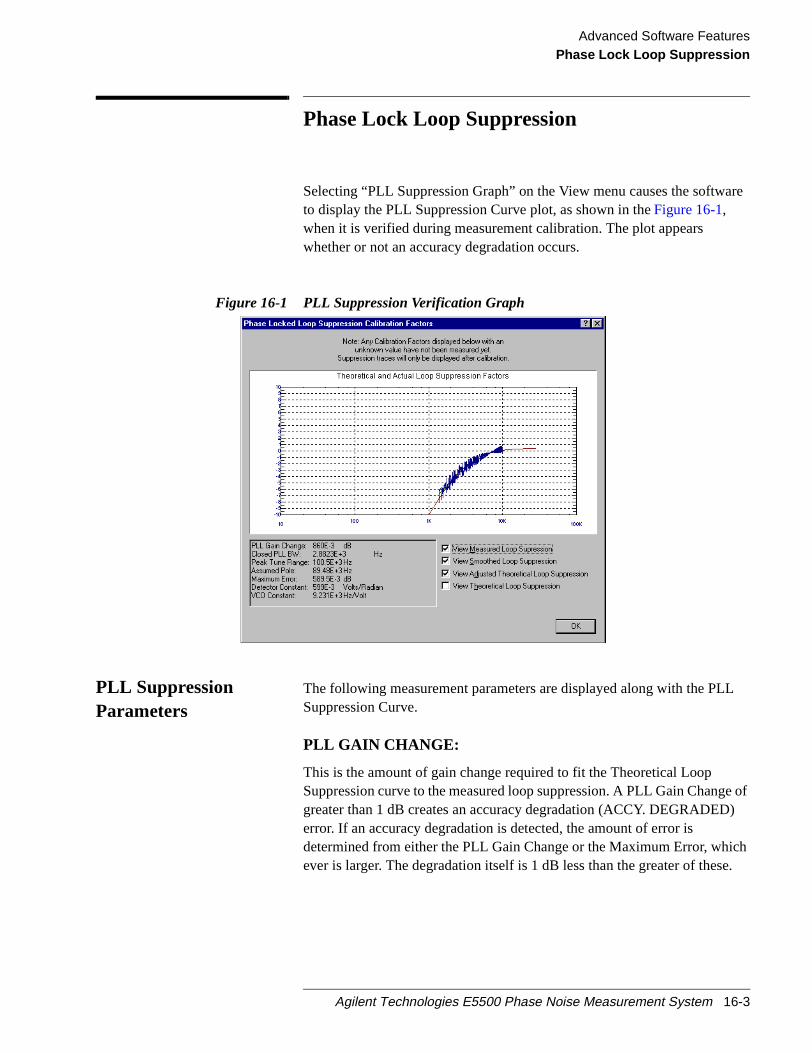
Advanced Software FeaturesPhase Lock Loop Suppression
re
L
e of)
che.
Phase Lock Loop Suppression
Selecting “PLL Suppression Graph” on the View menu causes the softwato display the PLL Suppression Curve plot, as shown in theFigure 16-1,when it is verified during measurement calibration. The plot appearswhether or not an accuracy degradation occurs.
Figure 16-1 PLL Suppression Verification Graph
PLL SuppressionParameters
The following measurement parameters are displayed along with the PLSuppression Curve.
PLL GAIN CHANGE:
This is the amount of gain change required to fit the Theoretical LoopSuppression curve to the measured loop suppression. A PLL Gain Changgreater than 1 dB creates an accuracy degradation (ACCY. DEGRADEDerror. If an accuracy degradation is detected, the amount of error isdetermined from either the PLL Gain Change or the Maximum Error, whiever is larger. The degradation itself is 1 dB less than the greater of thes
Agilent Technologies E5500 Phase Noise Measurement System 16-3
Advanced Software FeaturesPhase Lock Loop Suppression
p
the
Theill
e
rom
nd
d
t or, or
icalThe
nz,hiftolethe
MAX ERROR:
This is the measured error that still exists between the the measured LooSuppression and the Adjusted Theoretical Loop Suppression. The fourpoints on the Loop Suppression graph marked with arrows (ranging frompeak down to approximately ––8 dB) are the points over which theMaximum Error is determined. An error of greater than 1 dB results in anaccuracy degradation.
CLOSED PLL BW:
This is the predicted Phase Lock Loop Bandwidth for the measurement.predicted PLL BW is based on the predicted PTR. The Closed PLL BW wnot be adjusted as a result of an accuracy degradation. If an accuracydegradation is detected, the amount of error is determined from either thPLL Gain Change or the Maximum Error, which ever is larger. Thedegradation itself is 1 dB less than the greater of these.
PEAK TUNE RANGE:
This is the Peak Tuning Range (PTR) for the measurement determined fthe VCO Tune Constant and the Tune Range of VCO. This is the keyparameter in determining the PLL properties, the Drift Tracking Range, athe ability to phase lock sources with high close in noise.
The PTR displayed should be approximately equal to the product of theVCO Tune Constant times the Tune Range of VCO. This is not the casewhen a significant accuracy degradation is detected (4 dB) by the LoopSuppression Verification. In this case, the PTR and Assumed Pole areadjusted when fitting the Theoretical Loop Suppression to the smoothedmeasured Loop Suppression, and the test system will display the adjustePTR. If the PTR must be adjusted by more than 1 dB, as indicated by anaccuracy degradation of greater than 0 dB, the Phase Detector Constanthe VCO Tune Constant is in error at frequency offsets near the PLL BWthe PLL BW is being affected by some other problem such as injectionlocking.
ASSUMED POLE:
This is the frequency of the Assumed Pole required to adjust the TheoretLoop suppression to match the smoothed measured Loop suppression.Assumed Pole frequency is normally much greater than the Closed PLLBW. An Assumed Pole frequency of less than 10 X PLL BW is an indicatioof peaking on the PLL Suppression curve. For PLL BWs less than 20 kHan Assumed Pole of less than 10 X PLL BW indicates a delay or phase sin the VCO Tune Port. For PLL BWs greater than 20 kHz, the Assumed Pmay be adjusted to less than 10 X PLL BW to account for phase shifts intest set.
16-4 Agilent Technologies E5500 Phase Noise Measurement System

Advanced Software FeaturesPhase Lock Loop Suppression
ed
r,
edes
W /
oft.s of
DET. CONSTANT:
This is the phase Detector Constant (sensitivity of the phase detector) usfor the measurement. The accuracy of the Phase Detector Constant isverified if the PLL suppression is verified. The accuracy of the phaseDetector Constant determines the accuracy of the noise measurement.
The phase Detector Constant value, along with the LNA In/Out parametedetermines the Agilent/HP 3048A System noise floor exclusive of thereference source. VCO CONSTANT: This is the VCO Tune Constant usfor the measurement. The accuracy of the VCO Tune Constant determinthe accuracy of the PLL noise measurement for offset frequencies insegments where the entire plotted frequency range is less than the PLL B4. The accuracy of the VCO Tune Constant is verified if the PLLSuppression is Verified. The VCO Tune Constant times the Tune RangeVCO determines the Peak Tune Range (PTR) value for the measuremenThe PTR sets the drift tracking and close-in noise suppression capabilitiethe test system.
Agilent Technologies E5500 Phase Noise Measurement System 16-5
Advanced Software FeaturesIgnore Out Of Lock Mode
kted,hed
y
Ignore Out Of Lock Mode
The Ignore Out Of Lock test mode enables all of the troubleshoot modefunctions, plus it causes the software to not check for an out-of-lockcondition before or during a measurement. This allows you to measuresources with high close-in noise that normally would cause an out-of-loccondition and stop the measurement. When Ignore Out Of Lock is selecthe user is responsible for monitoring phase lock. This can be accomplisusing an oscilloscope connected to the Agilent/HP 70420A Aux. Monitorport to verify the absence of a beatnote and monitor the dc output level.
• When Ignore Out Of Lock is selected, the test system does not verifthe phase lock of the measurement. The user must ensure that themeasurement maintains phase lock during the measurement.
16-6 Agilent Technologies E5500 Phase Noise Measurement System

Advanced Software FeaturesPLL Suppression Verification Process
lne
wellnalal.
ehetput
n
PLL Suppression Verification Process
When “Verify calculated phase locked loop suppression” is selected, it isrecommended that “Always Show Suppression Graph” also be selected.Verifying phase locked loop suppression is a function which is very usefuin detecting errors in the phase detector constant or tune constant, the tuconstant linearity, limited VCO tune port bandwidth conditions, andinjection locking conditions. If the DUT is well behaved (injection lockingissues do not exist or have been eliminated) and the reference source isbehaved (well known tuning characteristics or a system controlled RF siggenerator) then the need to select PLL suppression verification is minim
To verify PLL suppression, a stimulus source is required for the FFTanalyzer. This stimulus signal is connected to the “Noise Input” port on threar-panel of the Agilent/HP 70420A test set. For the E550xB systems, tPC digitizer used as the FFT analyzer also provides a companion D/A outo be used for this purpose. When an Agilent/HP 89410A vector signalanalyzer is the system FFT analyzer, the Agilent/HP 89410As companiosource output is used. For the E550xA systems, the Agilent/HPE1441A VXI arbitrary source is used as the stimulus signal for theAgilent/HP E1430A VXI digitizer and is connected perFigure 16-2.
NOTE The sync output from the Agilent/HP E1441A MUST Connect to both theExt trigger inputs - use a BNC “T”.
Figure 16-2 Using the E1441A as a Stimulus Response for the E1430A
Agilent Technologies E5500 Phase Noise Measurement System 16-7
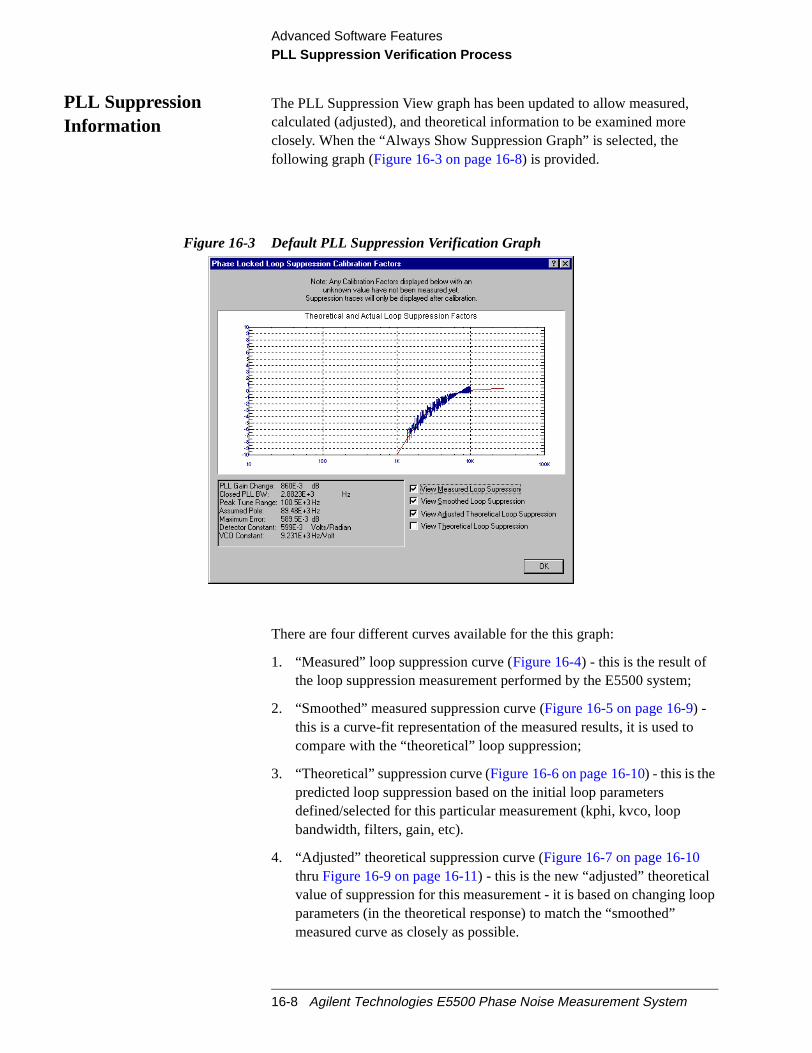
Advanced Software FeaturesPLL Suppression Verification Process
;
oop
PLL SuppressionInformation
The PLL Suppression View graph has been updated to allow measured,calculated (adjusted), and theoretical information to be examined moreclosely. When the “Always Show Suppression Graph” is selected, thefollowing graph (Figure 16-3 on page 16-8) is provided.
Figure 16-3 Default PLL Suppression Verification Graph
There are four different curves available for the this graph:
1. “Measured” loop suppression curve (Figure 16-4) - this is the result ofthe loop suppression measurement performed by the E5500 system
2. “Smoothed” measured suppression curve (Figure 16-5 on page 16-9) -this is a curve-fit representation of the measured results, it is used tocompare with the “theoretical” loop suppression;
3. “Theoretical” suppression curve (Figure 16-6 on page 16-10) - this is thepredicted loop suppression based on the initial loop parametersdefined/selected for this particular measurement (kphi, kvco, loopbandwidth, filters, gain, etc).
4. “Adjusted” theoretical suppression curve (Figure 16-7 on page 16-10thru Figure 16-9 on page 16-11) - this is the new “adjusted” theoreticalvalue of suppression for this measurement - it is based on changing lparameters (in the theoretical response) to match the “smoothed”measured curve as closely as possible.
16-8 Agilent Technologies E5500 Phase Noise Measurement System

Advanced Software FeaturesPLL Suppression Verification Process
Figure 16-4 Measured Loop Suppression Curve
Figure 16-5 Smoothed Loop Suppression Curve
Agilent Technologies E5500 Phase Noise Measurement System 16-9
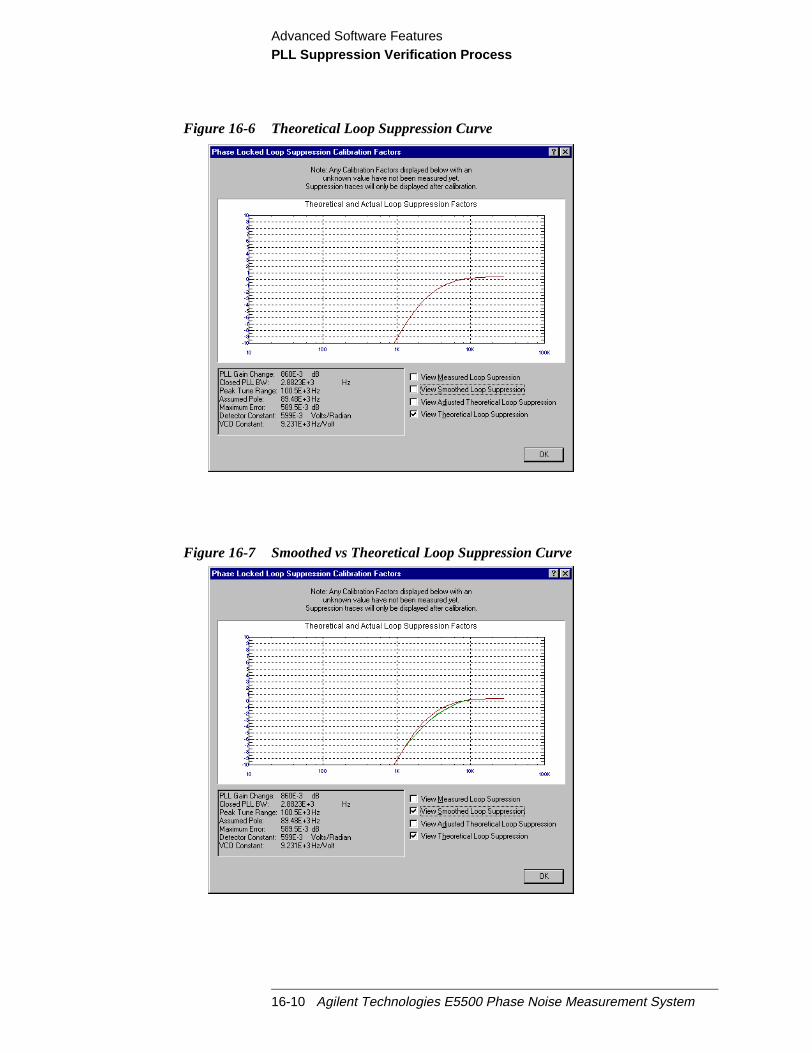
Advanced Software FeaturesPLL Suppression Verification Process
Figure 16-6 Theoretical Loop Suppression Curve
Figure 16-7 Smoothed vs Theoretical Loop Suppression Curve
16-10 Agilent Technologies E5500 Phase Noise Measurement System

Advanced Software FeaturesPLL Suppression Verification Process
Figure 16-8 Smoothed vs Adjusted Theoretical Loop Suppression Curve
Figure 16-9 Adjusted Theoretical vs Theoretical Loop Suppression Curve
Agilent Technologies E5500 Phase Noise Measurement System 16-11

Advanced Software FeaturesPLL Suppression Verification Process
Pole
d
sed
ncyis
ll.
um
0.to
PLL Gain Change PLL gain change is the amount in dB by which the theoretical gain of thePLL must be adjusted to best match the smoothed measured loopsuppression. The parameters of the theoretical loop suppression that aremodified are Peak Tune Range (basically open loop gain) and Assumed(for example a pole on the VCO tune port that may cause peaking).
Maximum Error Maximum Error is the largest difference between the smoothed measureloop suppression and the adjusted theoretical loop suppression in thefrequency range plotted for the smoothed measured loop suppression.
The frequency of the assumed pole is normally much greater than the CloPLL BW and there is no loop peaking. If the smoothed measured PLLsuppression shows peaking, the assumed pole is shifted down in frequeto simulate the extra phase shift that caused the peaking. If the peakingreally due to a single pole at a frequency near the Closed PLL BW, theadjusted theoretical loop suppression and smoothed measured loopsuppression will show a good match and the maximum error will be sma
Accuracy Degradation Accuracy spec. degradation is determined by taking the larger of MaximError and magnitude of PLL Gain Change and then subtracting 1 dB.
Supporting anEmbedded VXI PC:
A.01.04 also allows the use of an embedded VXI PC running WIN NT 4.In this case, the VXI interface to the VXI assets will be “VXI direct” (selecwithin the Asset Manager Configuration). The VISA I/O libraries must alssupport the embedded PC’s GPIB card.
16-12 Agilent Technologies E5500 Phase Noise Measurement System
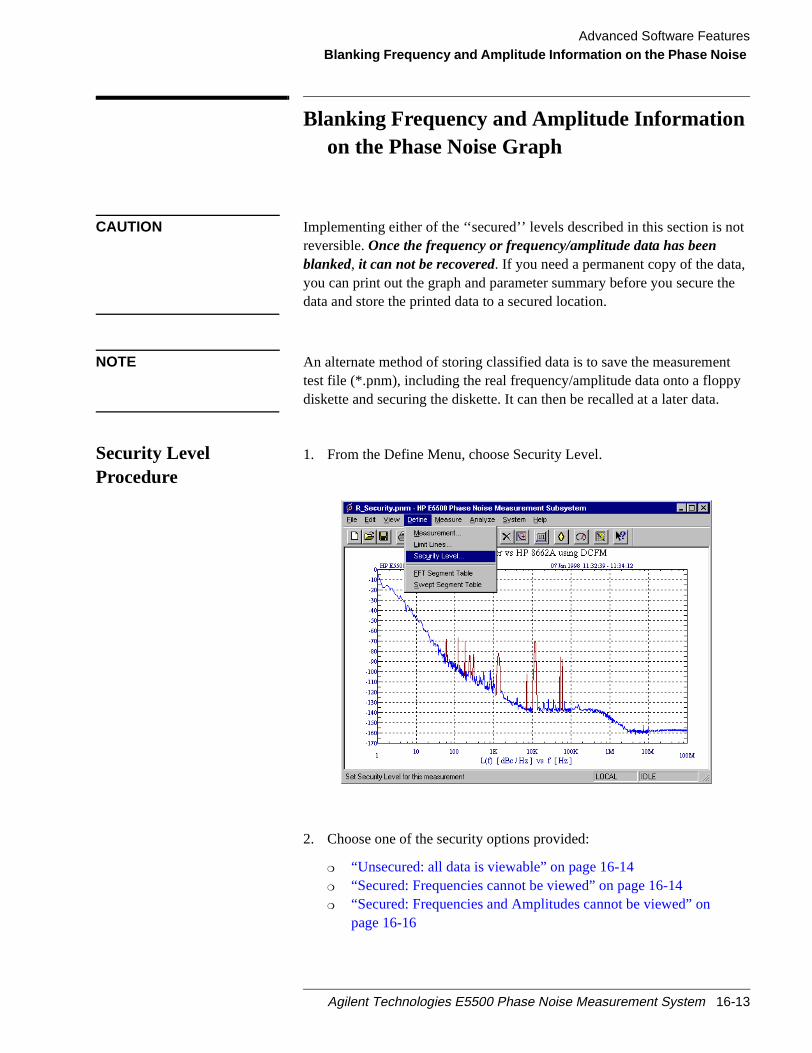
Advanced Software FeaturesBlanking Frequency and Amplitude Information on the Phase Noise
ot
,he
nty
Blanking Frequency and Amplitude Informationon the Phase Noise Graph
CAUTION Implementing either of the ‘‘secured’’ levels described in this section is nreversible.Once the frequency or frequency/amplitude data has beenblanked, it can not be recovered. If you need a permanent copy of the datayou can print out the graph and parameter summary before you secure tdata and store the printed data to a secured location.
NOTE An alternate method of storing classified data is to save the measuremetest file (*.pnm), including the real frequency/amplitude data onto a floppdiskette and securing the diskette. It can then be recalled at a later data.
Security LevelProcedure
1. From the Define Menu, choose Security Level.
2. Choose one of the security options provided:
“Unsecured: all data is viewable” on page 16-14 “Secured: Frequencies cannot be viewed” on page 16-14 “Secured: Frequencies and Amplitudes cannot be viewed” on
page 16-16
Agilent Technologies E5500 Phase Noise Measurement System 16-13
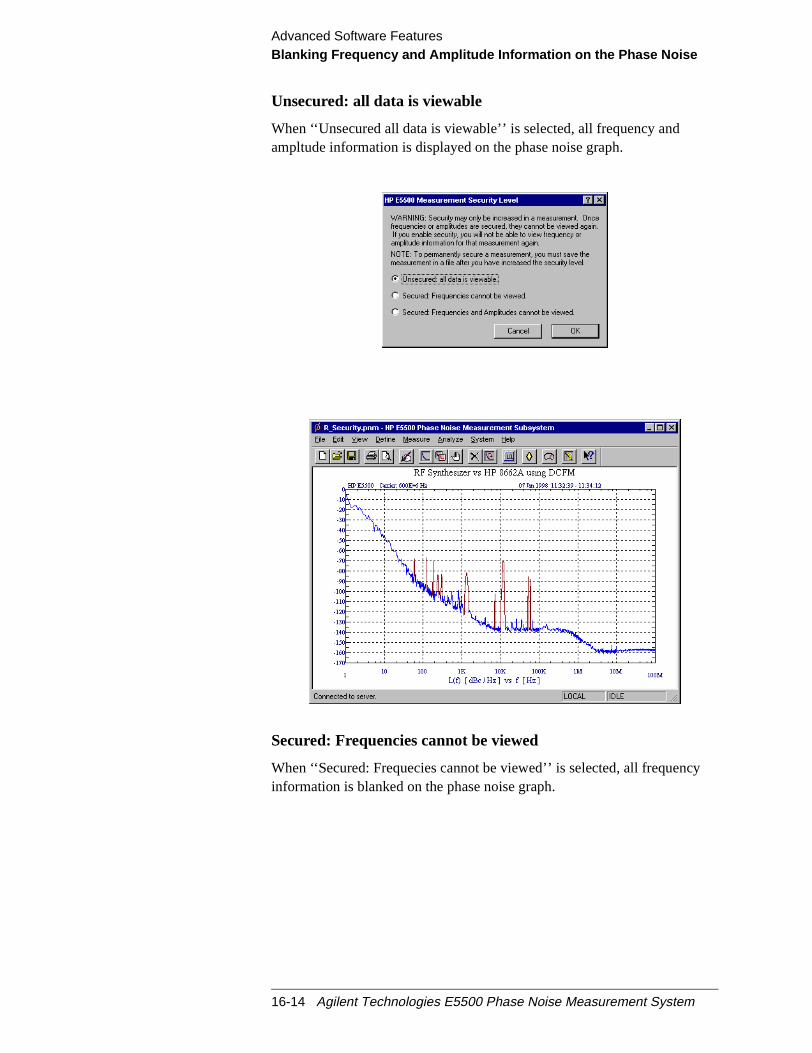
Advanced Software FeaturesBlanking Frequency and Amplitude Information on the Phase Noise
y
Unsecured: all data is viewable
When ‘‘Unsecured all data is viewable’’ is selected, all frequency andampltude information is displayed on the phase noise graph.
Secured: Frequencies cannot be viewed
When ‘‘Secured: Frequecies cannot be viewed’’ is selected, all frequencinformation is blanked on the phase noise graph.
16-14 Agilent Technologies E5500 Phase Noise Measurement System
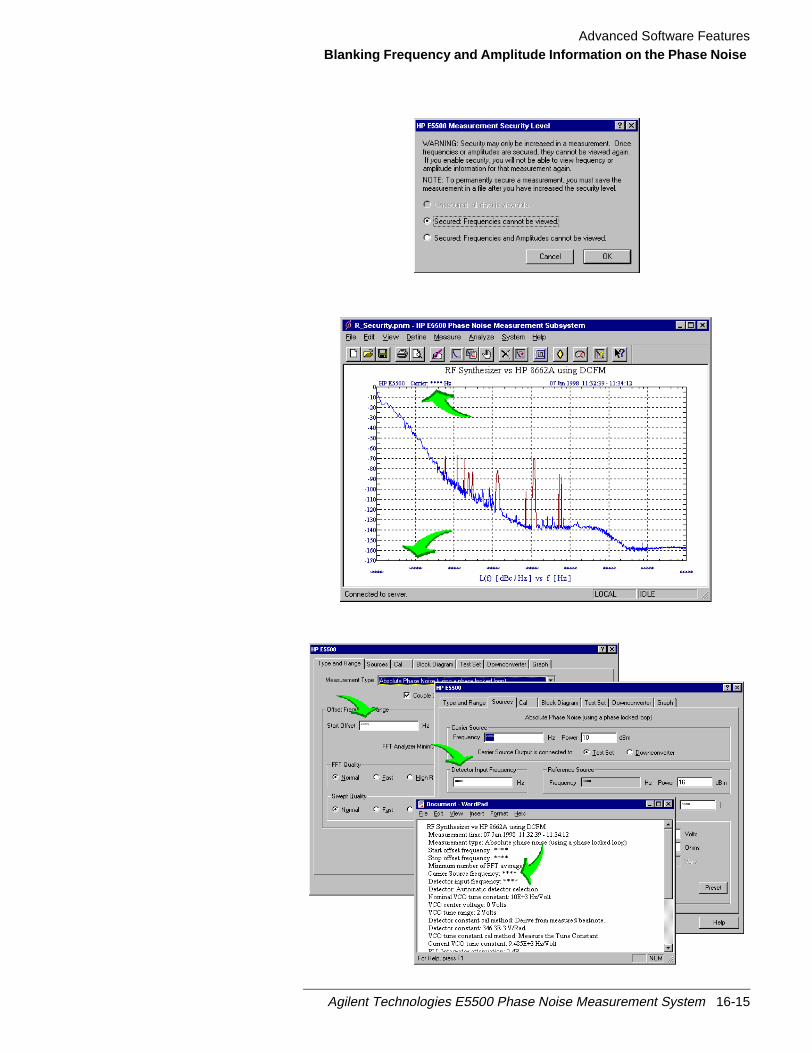
Advanced Software FeaturesBlanking Frequency and Amplitude Information on the Phase Noise
Agilent Technologies E5500 Phase Noise Measurement System 16-15

Advanced Software FeaturesBlanking Frequency and Amplitude Information on the Phase Noise
y
Secured: Frequencies and Amplitudes cannot be viewed
When ‘‘Secured: Frequecies cannot be viewed’’ is selected, all frequencand amplitude information is blanked on the phase noise graph.
16-16 Agilent Technologies E5500 Phase Noise Measurement System
17 Error Messages and SystemTroubleshooting
What You’ll Find in This Chapter
NOTE Error messages and troubleshooting information is not included in thisversion of the manual. They will be included in a future version. Forinformation about our no-cost update program, refer toSoftware andDocumentation Updates, page 21-2.
Agilent Technologies E5500 Phase Noise Measurement System 17-1
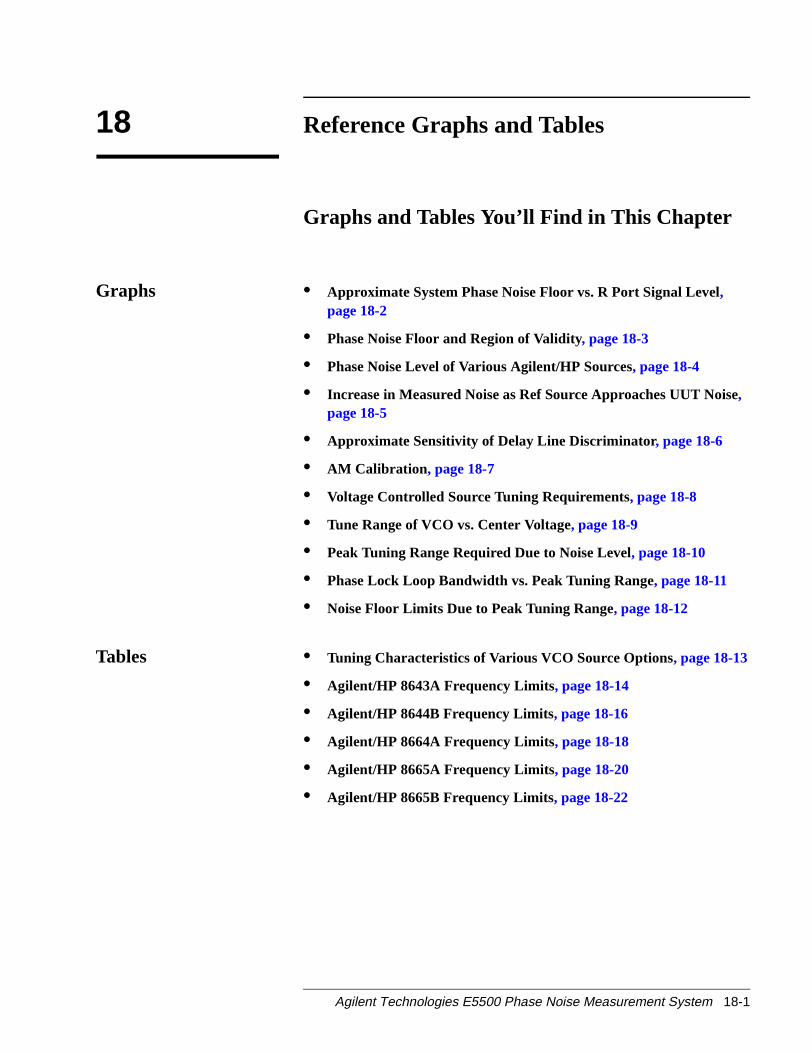
18 Reference Graphs and Tables
Graphs and Tables You’ll Find in This Chapter
Graphs • Approximate System Phase Noise Floor vs. R Port Signal Level,page 18-2
• Phase Noise Floor and Region of Validity, page 18-3
• Phase Noise Level of Various Agilent/HP Sources, page 18-4
• Increase in Measured Noise as Ref Source Approaches UUT Noise,page 18-5
• Approximate Sensitivity of Delay Line Discriminator, page 18-6
• AM Calibration , page 18-7
• Voltage Controlled Source Tuning Requirements, page 18-8
• Tune Range of VCO vs. Center Voltage, page 18-9
• Peak Tuning Range Required Due to Noise Level, page 18-10
• Phase Lock Loop Bandwidth vs. Peak Tuning Range, page 18-11
• Noise Floor Limits Due to Peak Tuning Range, page 18-12
Tables • Tuning Characteristics of Various VCO Source Options, page 18-13
• Agilent/HP 8643A Frequency Limits, page 18-14
• Agilent/HP 8644B Frequency Limits, page 18-16
• Agilent/HP 8664A Frequency Limits, page 18-18
• Agilent/HP 8665A Frequency Limits, page 18-20
• Agilent/HP 8665B Frequency Limits, page 18-22
Agilent Technologies E5500 Phase Noise Measurement System 18-1

Reference Graphs and TablesApproximate System Phase Noise Floor vs. R Port Signal Level
d byete
ve
put
Approximate System Phase Noise Floor vs. RPort Signal Level
The sensitivity of the phase noise measurement system can be improveincreasing the signal power at the R input port (Signal Input) of the phasdetector in the test set. The graph shown above illustrates the approximanoise floor of the Agilent/HP 70420A test set for a range of R input portsignal levels from -15 dBm to +15 dBm. These estimates of sensitivityassume the signal level at the L port is appropriate for either the microwaor the RF mixer that is used (+7 dBm or +15 dBm, respectively). Theapproximate phase Detector calibration Constant that results from the insignal level at the R port is shown on the right side of the graph.
18-2 Agilent Technologies E5500 Phase Noise Measurement System
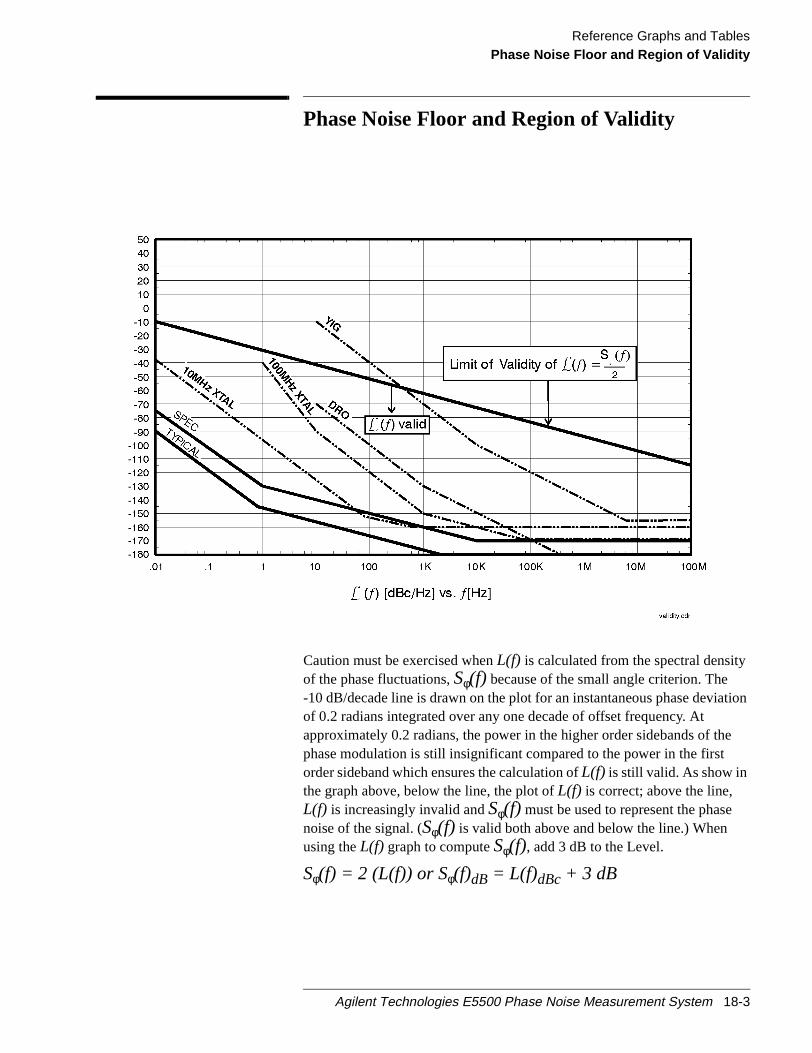
Reference Graphs and TablesPhase Noise Floor and Region of Validity
tion
e
Phase Noise Floor and Region of Validity
Caution must be exercised whenL(f) is calculated from the spectral densityof the phase fluctuations,Sφ(f) because of the small angle criterion. The-10 dB/decade line is drawn on the plot for an instantaneous phase deviaof 0.2 radians integrated over any one decade of offset frequency. Atapproximately 0.2 radians, the power in the higher order sidebands of thphase modulation is still insignificant compared to the power in the firstorder sideband which ensures the calculation ofL(f) is still valid. As show inthe graph above, below the line, the plot ofL(f) is correct; above the line,L(f) is increasingly invalid andSφ(f) must be used to represent the phasenoise of the signal. (Sφ(f) is valid both above and below the line.) Whenusing theL(f) graph to computeSφ(f), add 3 dB to the Level.
Sφ(f) = 2 (L(f)) or Sφ(f)dB = L(f)dBc+ 3 dB
Agilent Technologies E5500 Phase Noise Measurement System 18-3
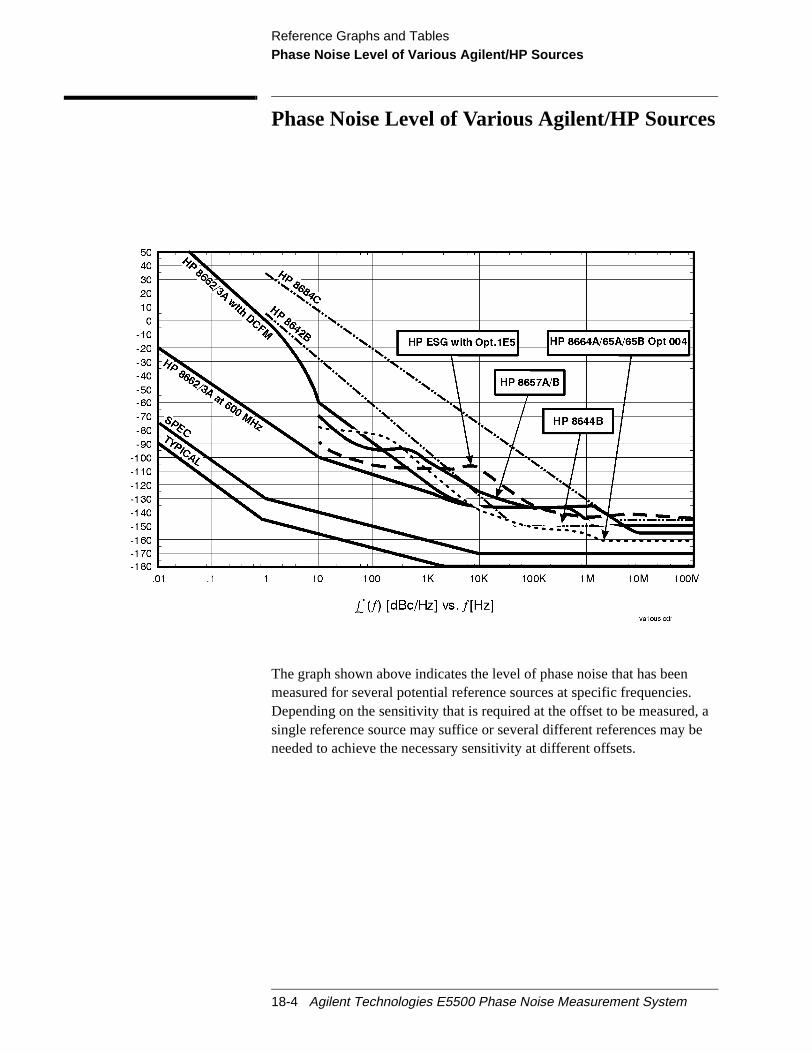
Reference Graphs and TablesPhase Noise Level of Various Agilent/HP Sources
., a
be
Phase Noise Level of Various Agilent/HP Sources
The graph shown above indicates the level of phase noise that has beenmeasured for several potential reference sources at specific frequenciesDepending on the sensitivity that is required at the offset to be measuredsingle reference source may suffice or several different references mayneeded to achieve the necessary sensitivity at different offsets.
18-4 Agilent Technologies E5500 Phase Noise Measurement System
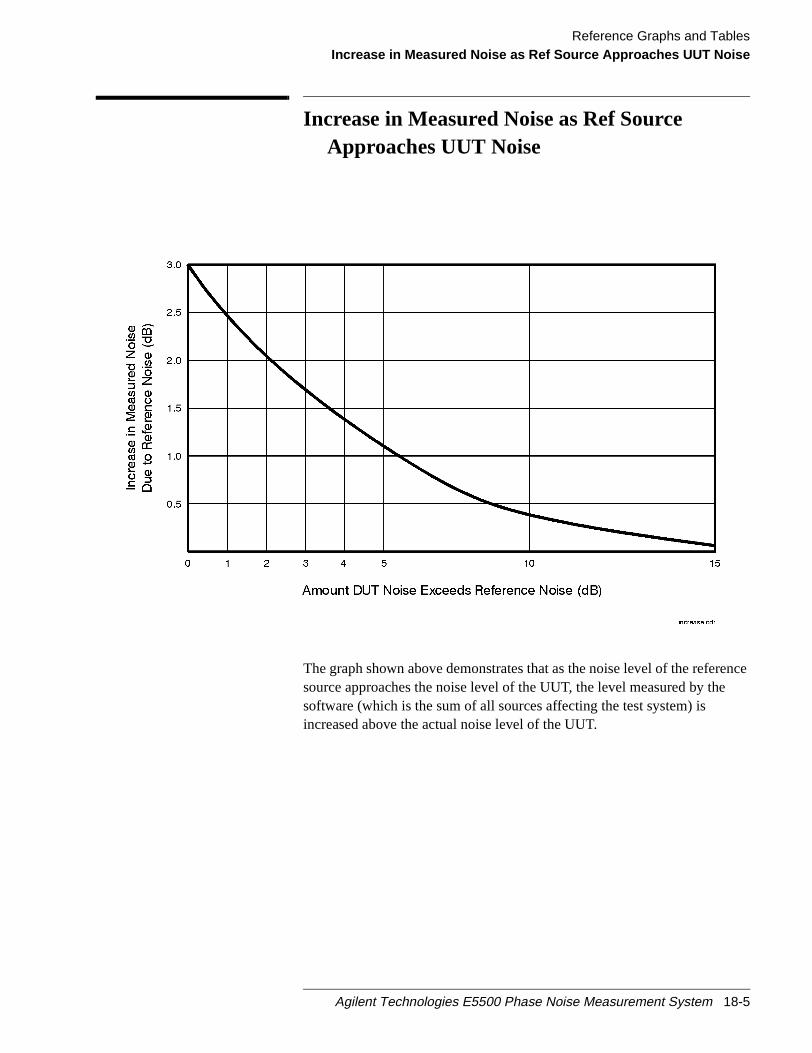
Reference Graphs and TablesIncrease in Measured Noise as Ref Source Approaches UUT Noise
ence
Increase in Measured Noise as Ref SourceApproaches UUT Noise
The graph shown above demonstrates that as the noise level of the refersource approaches the noise level of the UUT, the level measured by thesoftware (which is the sum of all sources affecting the test system) isincreased above the actual noise level of the UUT.
Agilent Technologies E5500 Phase Noise Measurement System 18-5

Reference Graphs and TablesApproximate Sensitivity of Delay Line Discriminator
s
withe
m
Approximate Sensitivity of Delay LineDiscriminator
The dependence of a frequency discriminator's sensitivity on the offsetfrequency is obvious in the graph shown above. By comparing thesensitivity specified for the phase detector to the delay line sensitivity, it iapparent the delay line sensitivity is ``tipped up’’ by 20 dB/decadebeginning at an offset of 1/2πτ The sensitivity graphs indicate the delay linefrequency discriminator can be used to measure some types of sourcesuseful sensitivity. Longer delay lines improve sensitivity, but eventually thloss in the delay line will exceed the available power of the source andcancel any further improvement. Also, longer delay lines limit the maximuoffset frequency that can be measured.
18-6 Agilent Technologies E5500 Phase Noise Measurement System
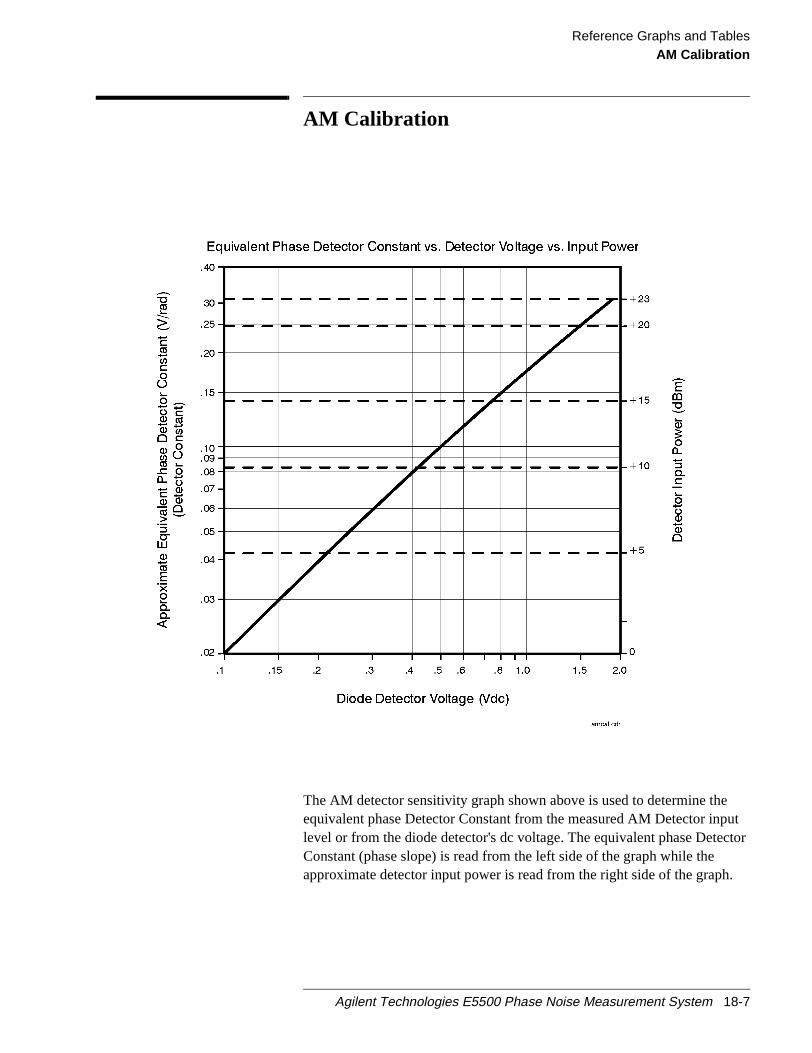
Reference Graphs and TablesAM Calibration
utctor
.
AM Calibration
The AM detector sensitivity graph shown above is used to determine theequivalent phase Detector Constant from the measured AM Detector inplevel or from the diode detector's dc voltage. The equivalent phase DeteConstant (phase slope) is read from the left side of the graph while theapproximate detector input power is read from the right side of the graph
Agilent Technologies E5500 Phase Noise Measurement System 18-7

Reference Graphs and TablesVoltage Controlled Source Tuning Requirements
tor
is
ter
uests
Voltage Controlled Source Tuning Requirements
Peak Tuning Range (PTR)≈ Tune Range of VCO x VCO Tune Constant.
Min. PTR =.1 Hz
Max. PTR = Up to (200 MHz depending on analyzer and phase detecLPF).
Drift Tracking Range = Allowable Drift During Measurement.
The tuning range that the software actually uses to maintain quadraturelimited to a fraction of the peak tuning range (PTR) to ensure the tuningslope is well behaved and the VCO Tune Constant remains accurate. Afphase lock is established, the test system monitors the tuning voltagerequired to maintain lock. If the tuning voltage exceeds 5% of the PTRduring the measurement, the test system again informs the user and reqthe oscillator be retuned or the problem be otherwise corrected beforeproceeding with the measurement. These limits have been found toguarantee good results.
18-8 Agilent Technologies E5500 Phase Noise Measurement System

Reference Graphs and TablesTune Range of VCO vs. Center Voltage
of
ases
Tune Range of VCO vs. Center Voltage
The graph shown above outlines the minimum to maximum Tune RangeVCO which the software provides for a given center voltage. The Tunerange of VCO decreases as the absolute value of the center voltage incredue to hardware limitations of the test system.
Agilent Technologies E5500 Phase Noise Measurement System 18-9
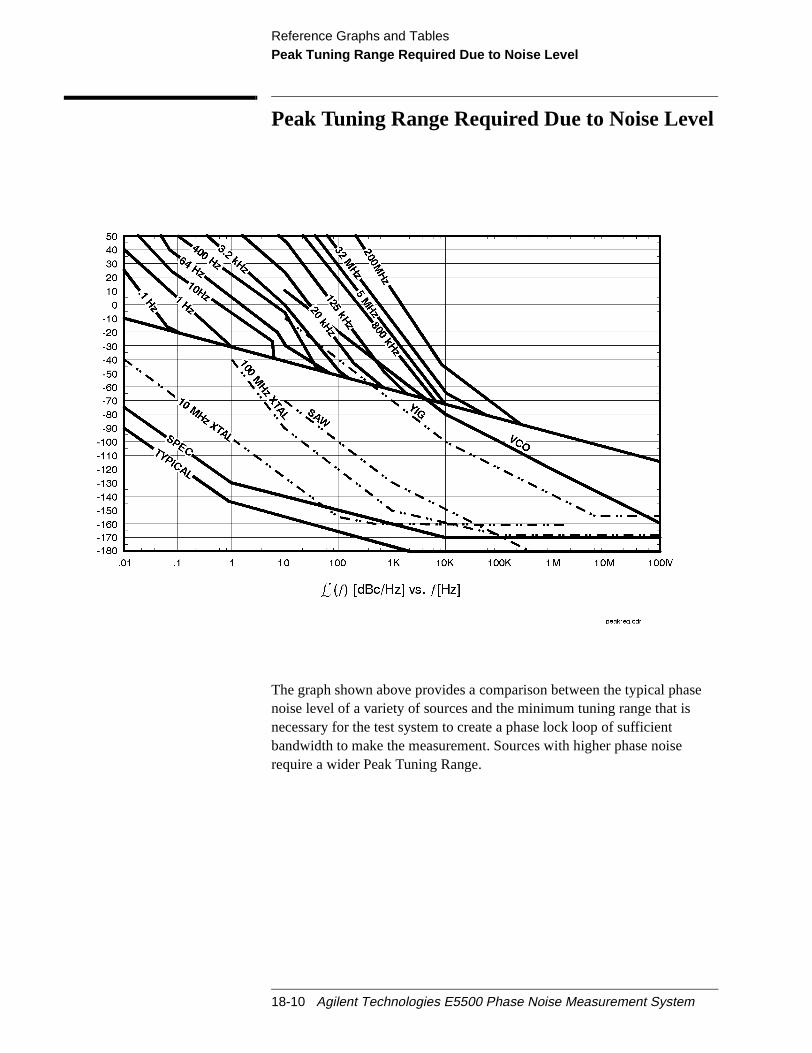
Reference Graphs and TablesPeak Tuning Range Required Due to Noise Level
se
Peak Tuning Range Required Due to Noise Level
The graph shown above provides a comparison between the typical phanoise level of a variety of sources and the minimum tuning range that isnecessary for the test system to create a phase lock loop of sufficientbandwidth to make the measurement. Sources with higher phase noiserequire a wider Peak Tuning Range.
18-10 Agilent Technologies E5500 Phase Noise Measurement System
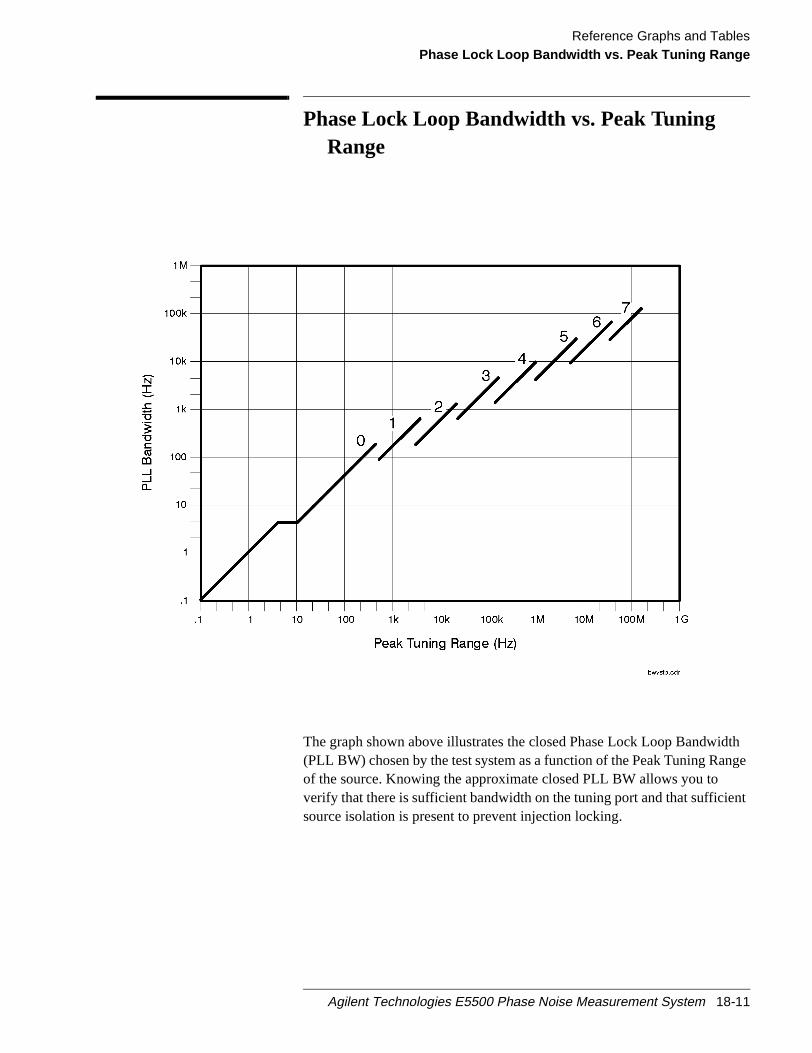
Reference Graphs and TablesPhase Lock Loop Bandwidth vs. Peak Tuning Range
thnge
nt
Phase Lock Loop Bandwidth vs. Peak TuningRange
The graph shown above illustrates the closed Phase Lock Loop Bandwid(PLL BW) chosen by the test system as a function of the Peak Tuning Raof the source. Knowing the approximate closed PLL BW allows you toverify that there is sufficient bandwidth on the tuning port and that sufficiesource isolation is present to prevent injection locking.
Agilent Technologies E5500 Phase Noise Measurement System 18-11

Reference Graphs and TablesNoise Floor Limits Due to Peak Tuning Range
kt set
Noise Floor Limits Due to Peak Tuning Range
The graph shown above illustrates the equivalent phase noise at the PeaTuning Range entered for the source due to the inherent noise at the tesTune Voltage Output port. (A Tune Range of VCO +/-10 V and phaseDetector Constant of 0.2V/Rad is assumed.)
18-12 Agilent Technologies E5500 Phase Noise Measurement System

Reference Graphs and TablesTuning Characteristics of Various VCO Source Options
Tuning Characteristics of Various VCO SourceOptions
The table shown above lists tuning parameters for several VCO options.
VCO SourceCarrierFreq.
Tuning Constant(Hz/V)
CenterVoltage (V)
Voltage TuningRange (± V)
InputResistance
(Ω)
TuningCalibration
Method
Agilent/HP 8662/3AEFCDCFM
υ0 5 E – 9 xυ0FM Deviation
00
1010
1E + 61 k (8662)600 (8663)
MeasureCalculateCalculate
Agilent/HP 8642A/B FM Deviation 0 10 600 Calculate
Agilent/HP8643A/44B
FM Deviation 0 10 600 Calculate
Agilent/HP 8664AAgilent/HP 8665A/B
FM Deviation 0 51
(See CautionBelow)
600 Calculate
Other SignalGenerato rDCFM Calibrated for±1V
FM Deviation 0 10 Rin Calculate
Other User VCOSource
Estimated within afactor of 2
–10 to+10
See “Tune Rangeof VCO vs. Center
Voltage” onpage 18-9
1 E + 6 Measure
1 Caution: Exceeding 5 volts maximum may damage equipment.
Agilent Technologies E5500 Phase Noise Measurement System 18-13
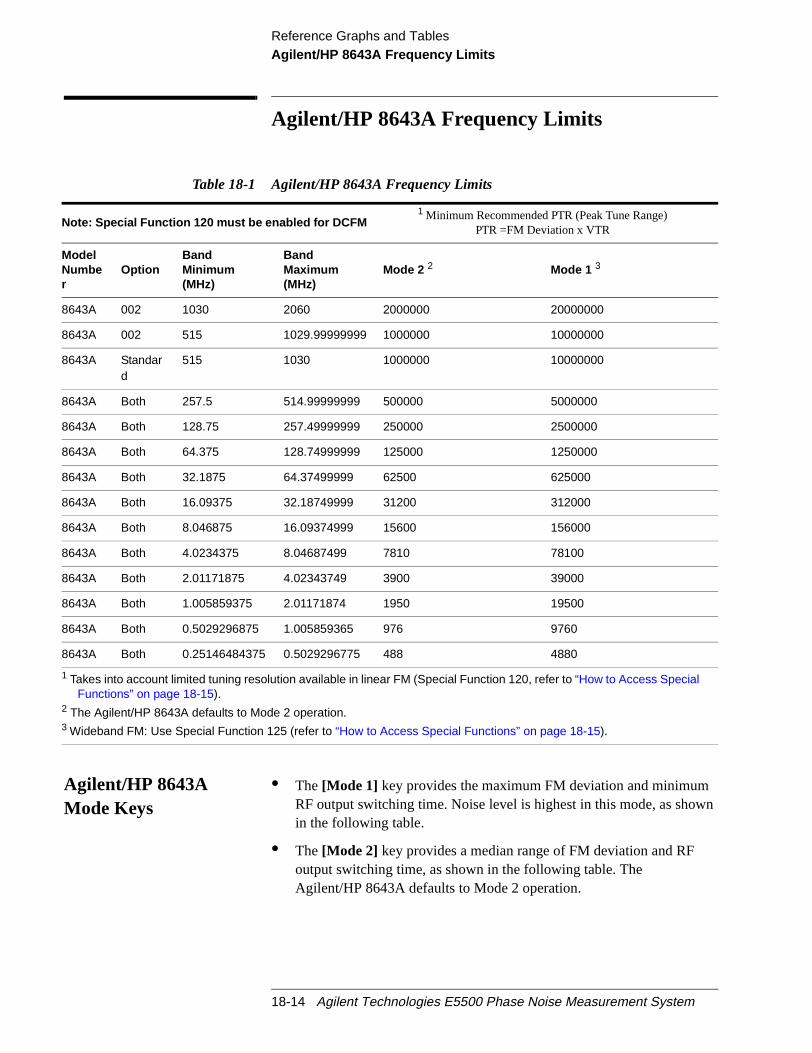
Reference Graphs and TablesAgilent/HP 8643A Frequency Limits
n
Agilent/HP 8643A Frequency Limits
Agilent/HP 8643AMode Keys
• The[Mode 1] key provides the maximum FM deviation and minimumRF output switching time. Noise level is highest in this mode, as showin the following table.
• The[Mode 2] key provides a median range of FM deviation and RFoutput switching time, as shown in the following table. TheAgilent/HP 8643A defaults to Mode 2 operation.
Table 18-1 Agilent/HP 8643A Frequency Limits
Note: Special Function 120 must be enabled for DCFM1 Minimum Recommended PTR (Peak Tune Range)
PTR =FM Deviation x VTR
ModelNumber
OptionBandMinimum(MHz)
BandMaximum(MHz)
Mode 2 2 Mode 1 3
8643A 002 1030 2060 2000000 20000000
8643A 002 515 1029.99999999 1000000 10000000
8643A Standard
515 1030 1000000 10000000
8643A Both 257.5 514.99999999 500000 5000000
8643A Both 128.75 257.49999999 250000 2500000
8643A Both 64.375 128.74999999 125000 1250000
8643A Both 32.1875 64.37499999 62500 625000
8643A Both 16.09375 32.18749999 31200 312000
8643A Both 8.046875 16.09374999 15600 156000
8643A Both 4.0234375 8.04687499 7810 78100
8643A Both 2.01171875 4.02343749 3900 39000
8643A Both 1.005859375 2.01171874 1950 19500
8643A Both 0.5029296875 1.005859365 976 9760
8643A Both 0.25146484375 0.5029296775 488 4880
1 Takes into account limited tuning resolution available in linear FM (Special Function 120, refer to “How to Access SpecialFunctions” on page 18-15).
2 The Agilent/HP 8643A defaults to Mode 2 operation.3 Wideband FM: Use Special Function 125 (refer to “How to Access Special Functions” on page 18-15).
18-14 Agilent Technologies E5500 Phase Noise Measurement System

Reference Graphs and TablesAgilent/HP 8643A Frequency Limits
sfic
M
s2
isvel
How to Access SpecialFunctions
Press the “Special” key and enter the special function number of yourchoice. Access the special function key by pressing the “Enter” key. Presthe [ON] (ENTER) key to terminate data entries that do not require speciunits (kHz, mV, rad, for example)
Example:
[Special], [1], [2], [0], [ON] (Enter).
Description of SpecialFunctions 120 and 125
120: FM Synthesis
This special function allows you to have the instrument synthesize the Fsignal in a digitized or linear manner. Digitized FM is best for signal-tonemodulation and provides very accurate center frequency at low deviationrates. Linear FM is best for multi-tone modulation and provides a moreconstant group delay than the Digitized FM.
125: Wide FM Deviation (Agilent/HP 8643A only)
Mode 1 operation can be selected using this special function, which allowyou to turn on wide FM deviation. The Agilent/HP 8643 defaults to Modeoperation. Wide FM deviation provides the maximum FM deviation andminimum RF output switching time. In this mode, the maximum deviationincreased, by a factor of 10, to 10 MHz (for a 1 GHz carrier). The noise leof the generator is also increased in this mode, however.
Table 18-2 Operating Characteristics for Agilent/HP 8643A Modes 1, 2, and 3
CharateristicSynthisis Mode
Mode 1 Mode 2
RF Frequency Switching Time 90 ms 200 ms
FM Deviation at 1 GHz 10 MHz 1 MHz
Phase Noise (20 kHz offset at 1 GHz) -120 dBc -130 dBc
Agilent Technologies E5500 Phase Noise Measurement System 18-15

Reference Graphs and TablesAgilent/HP 8644B Frequency Limits
n
Agilent/HP 8644B Frequency Limits
Agilent/HP 8644BMode Keys
• The[Mode 1] key provides the maximum FM deviation and minimumRF output switching time. Noise level is highest in this mode, as showin the following table.
• The[Mode 2] key provides a median range of FM deviation and RFoutput switching time, as shown in the following table.
• The[Mode 3] key provides the lowest noise level at the RF output, FMdeviation bandwidth is narrower, and the RF switching time is slowerthan in either Modes 1 or 2.
Table 18-3 Agilent/HP 8644B Frequency Limits
Note: Special Function 120 must be enabled for DCFM1 Minimum Recommended PTR (Peak Tune Range)
PTR =FM Deviation x VTR
ModelNumber
OptionBandMinimum(MHz)
BandMaximum(MHz)
Mode 3 Mode 2 Mode 1
8644B 002 1030 2060 200000 2000000 20000000
8644B 002 515 1029.99999999 100000 1000000 10000000
8644B Standard
515 1030 100000 1000000 10000000
8644B Both 257.5 514.99999999 50000 500000 5000000
8644B Both 128.75 257.49999999 25000 250000 2500000
8644B Both 64.375 128.74999999 12500 125000 1250000
8644B Both 32.1875 64.37499999 6250 62500 625000
8644B Both 16.09375 32.18749999 3120 31200 312000
8644B Both 8.046875 16.09374999 1560 15600 156000
8644B Both 4.0234375 8.04687499 781 7810 78100
8644B Both 2.01171875 4.02343749 390 3900 39000
8644B Both 1.005859375 2.01171874 195 1950 19500
8644B Both 0.5029296875 1.005859365 97.6 976 9760
8644B Both 0.25146484375 0.5029296775 48.8 488 4880
1 Takes into account limited tuning resolution available in linear FM (Special Function 120, refer to “How to Access SpecialFunctions” on page 18-15).
18-16 Agilent Technologies E5500 Phase Noise Measurement System

Reference Graphs and TablesAgilent/HP 8644B Frequency Limits
sfic
M
How to Access SpecialFunctions
Press the “Special” key and enter the special function number of yourchoice. Access the special function key by pressing the “Enter” key. Presthe [ON] (ENTER) key to terminate data entries that do not require speciunits (kHz, mV, rad, for example)
Example:
[Special], [1], [2], [0], [ON] (Enter).
Description of SpecialFunction 120
120: FM Synthesis
This special function allows you to have the instrument synthesize the Fsignal in a digitized or linear manner. Digitized FM is best for signal-tonemodulation and provides very accurate center frequency at low deviationrates. Linear FM is best for multi-tone modulation and provides a moreconstant group delay than the Digitized FM.
Table 18-4 Operating Characteristics for Agilent/HP 8644B Modes 1, 2, and 3
CharateristicSynthisis Mode
Mode 1 Mode 2 Mode 3
RF Frequency Switching Time 90 ms 200 ms 350 ms
FM Deviation at 1 GHz 10 MHz 1 MHz 100 kHz
Phase Noise (20 kHz offset at 1 GHz) -120 dBc -130 dBc -136 dBc
Agilent Technologies E5500 Phase Noise Measurement System 18-17
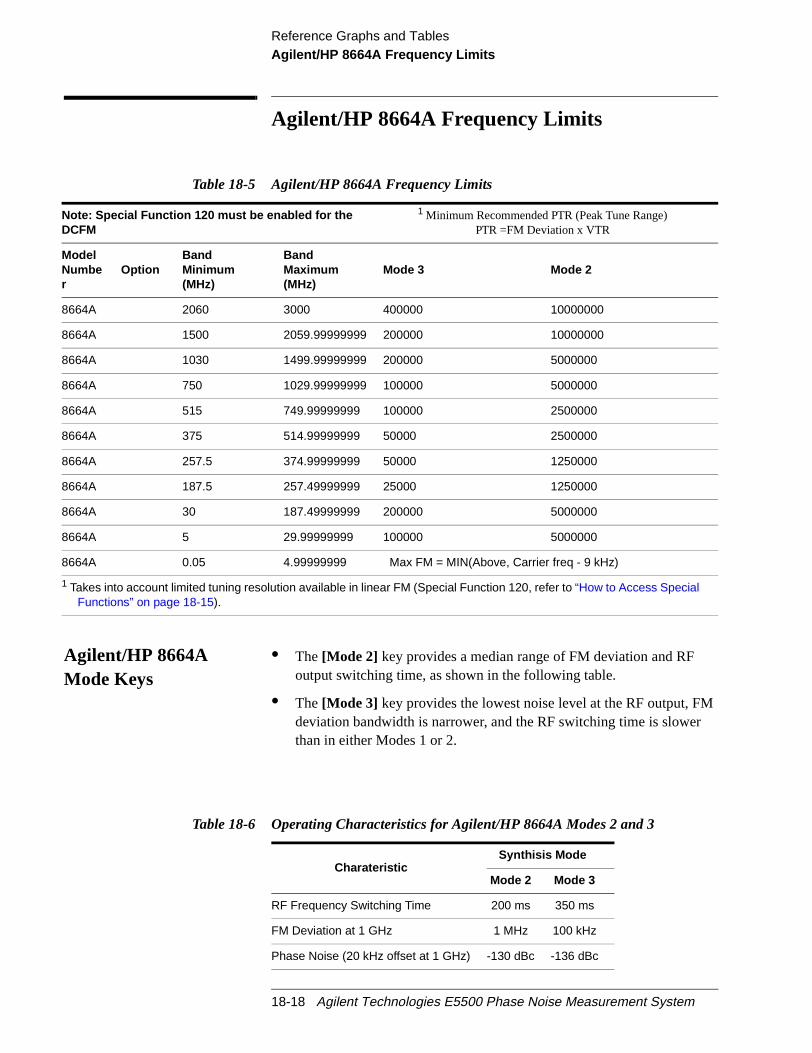
Reference Graphs and TablesAgilent/HP 8664A Frequency Limits
Agilent/HP 8664A Frequency Limits
Agilent/HP 8664AMode Keys
• The[Mode 2] key provides a median range of FM deviation and RFoutput switching time, as shown in the following table.
• The[Mode 3] key provides the lowest noise level at the RF output, FMdeviation bandwidth is narrower, and the RF switching time is slowerthan in either Modes 1 or 2.
Table 18-5 Agilent/HP 8664A Frequency Limits
Note: Special Function 120 must be enabled for theDCFM
1 Minimum Recommended PTR (Peak Tune Range)PTR =FM Deviation x VTR
ModelNumber
OptionBandMinimum(MHz)
BandMaximum(MHz)
Mode 3 Mode 2
8664A 2060 3000 400000 10000000
8664A 1500 2059.99999999 200000 10000000
8664A 1030 1499.99999999 200000 5000000
8664A 750 1029.99999999 100000 5000000
8664A 515 749.99999999 100000 2500000
8664A 375 514.99999999 50000 2500000
8664A 257.5 374.99999999 50000 1250000
8664A 187.5 257.49999999 25000 1250000
8664A 30 187.49999999 200000 5000000
8664A 5 29.99999999 100000 5000000
8664A 0.05 4.99999999 Max FM = MIN(Above, Carrier freq - 9 kHz)
1 Takes into account limited tuning resolution available in linear FM (Special Function 120, refer to “How to Access SpecialFunctions” on page 18-15).
Table 18-6 Operating Characteristics for Agilent/HP 8664A Modes 2 and 3
CharateristicSynthisis Mode
Mode 2 Mode 3
RF Frequency Switching Time 200 ms 350 ms
FM Deviation at 1 GHz 1 MHz 100 kHz
Phase Noise (20 kHz offset at 1 GHz) -130 dBc -136 dBc
18-18 Agilent Technologies E5500 Phase Noise Measurement System

Reference Graphs and TablesAgilent/HP 8664A Frequency Limits
sfic
M
How to Access SpecialFunctions
Press the “Special” key and enter the special function number of yourchoice. Access the special function key by pressing the “Enter” key. Presthe [ON] (ENTER) key to terminate data entries that do not require speciunits (kHz, mV, rad, for example)
Example:
[Special], [1], [2], [0], [ON] (Enter).
Description of SpecialFunctions 120
120: FM Synthesis
This special function allows you to have the instrument synthesize the Fsignal in a digitized or linear manner. Digitized FM is best for signal-tonemodulation and provides very accurate center frequency at low deviationrates. Linear FM is best for multi-tone modulation and provides a moreconstant group delay than the Digitized FM.
Agilent Technologies E5500 Phase Noise Measurement System 18-19

Reference Graphs and TablesAgilent/HP 8665A Frequency Limits
Agilent/HP 8665A Frequency Limits
Agilent/HP 8665AMode Keys
• The[Mode 2] key provides a median range of FM deviation and RFoutput switching time, as shown in the following table.
• The[Mode 3] key provides the lowest noise level at the RF output, FMdeviation bandwidth is narrower, and the RF switching time is slowerthan in either Modes 1 or 2.
Table 18-7 Agilent/HP 8665A Frequency Limits
Note: Special Function 120 must be enabled for DCFM1 Minimum Recommended PTR (Peak Tune Range)
PTR =FM Deviation x VTR
ModelNumber
OptionBandMinimum(MHz)
BandMaximum(MHz)
Mode 3 Mode 2
8665A 4120 4200 800000 20000000
8665A 3000 4119.99999999 400000 20000000
8665A 2060 2999.99999999 400000 10000000
8665A 1500 2059.99999999 200000 10000000
8665A 1030 1499.99999999 200000 5000000
8665A 750 1029.99999999 100000 5000000
8665A 515 749.99999999 100000 2500000
8665A 375 514.99999999 50000 2500000
8665A 257.5 374.99999999 50000 1250000
8665A 187.5 257.49999999 25000 1250000
8665A 30 187.49999999 200000 5000000
8665A 5 29.99999999 100000 5000000
8665A 0.05 4.99999999 Max FM = MIN(Above, Carrier freq - 9 kHz)
1 Takes into account limited tuning resolution available in linear FM (Special Function 120, refer to “How to Access SpecialFunctions” on page 18-15).
Table 18-8 Operating Characteristics for Agilent/HP 8665A Modes 2 and 3
CharateristicSynthisis Mode
Mode 2 Mode 3
RF Frequency Switching Time 200 ms 350 ms
FM Deviation at 1 GHz 1 MHz 100 kHz
Phase Noise (20 kHz offset at 1 GHz) -130 dBc -136 dBc
18-20 Agilent Technologies E5500 Phase Noise Measurement System

Reference Graphs and TablesAgilent/HP 8665A Frequency Limits
sfic
M
o
z
How to Access SpecialFunctions
Press the “Special” key and enter the special function number of yourchoice. Access the special function key by pressing the “Enter” key. Presthe [ON] (ENTER) key to terminate data entries that do not require speciunits (kHz, mV, rad, for example)
Example:
[Special], [1], [2], [0], [ON] (ENTER).
Description of SpecialFunctions 120 and 124
120: FM Synthesis
This special function allows you to have the instrument synthesize the Fsignal in a digitized or linear manner. Digitized FM is best for signal-tonemodulation and provides very accurate center frequency at low deviationrates. Linear FM is best for multi-tone modulation and provides a moreconstant group delay than the Digitized FM. The preset condition is FMDigitized.
124: FM Dly Equalizer
This special function allows you to turn off FM Delay Equializer circuitry.When [ON] (The preset condition), 30µsec of group delay is added to theFM modulated signal to get better FM frequency response.
You may want to turn [OFF] the FM Delay Equializer circuitry when thesignal generator is used as the VCO in a phase-locked loop application treduce phase shift, of when you want to extend the FM bandwidth to200 kHz. When [OFF], FM Indicator Accuracy is worse for rates of 1-5 kHand better beyond 30 kHz. Refer to the Agilent/HP 8643A/8644B User’sGuide for specific details.
Agilent Technologies E5500 Phase Noise Measurement System 18-21

Reference Graphs and TablesAgilent/HP 8665B Frequency Limits
Agilent/HP 8665B Frequency Limits
Agilent/HP 8665BMode Keys
• The[Mode 2] key provides a median range of FM deviation and RFoutput switching time, as shown in the following table.
• The[Mode 3] key provides the lowest noise level at the RF output, FMdeviation bandwidth is narrower, and the RF switching time is slowerthan in either Modes 1 or 2.
Table 18-9 Agilent/HP 8665B Frequency Limits
Note: Special Function 120 must be enabled for DCFM1 Minimum Recommended PTR (Peak Tune Range)
PTR =FM Deviation x VTR
ModelNumber
OptionBandMinimum(MHz)
BandMaximum(MHz)
Mode 3 Mode 2
8665B 4120 6000 800000 20000000
8665B 3000 4119.99999999 400000 20000000
8665B 2060 2999.99999999 400000 10000000
8665B 1500 2059.99999999 200000 10000000
8665B 1030 1499.99999999 200000 5000000
8665B 750 1029.99999999 100000 5000000
8665B 515 749.99999999 100000 2500000
8665B 375 514.99999999 50000 2500000
8665B 257.5 374.99999999 50000 1250000
8665B 187.5 257.49999999 25000 1250000
8665B 30 187.49999999 200000 5000000
8665B 5 29.99999999 100000 5000000
8665B 0.05 4.99999999 Max FM = MIN(Above, Carrier freq - 9 kHz)
1 Takes into account limited tuning resolution available in linear FM (Special Function 120, refer to “How to Access SpecialFunctions” on page 18-15).
Table 18-10 Operating Characteristics for Agilent/HP 8665B Modes 2 and 3
CharateristicSynthisis Mode
Mode 2 Mode 3
RF Frequency Switching Time 200 ms 350 ms
FM Deviation at 1 GHz 1 MHz 100 kHz
Phase Noise (20 kHz offset at 1 GHz) -130 dBc -136 dBc
18-22 Agilent Technologies E5500 Phase Noise Measurement System

Reference Graphs and TablesAgilent/HP 8665B Frequency Limits
the
M
o
de
How to Access SpecialFunctions
Press the “Special” key and enter the special function number of yourchoice. Access the special function key by pressing the “Enter” key.Press[ON] (ENTER) key to terminate data entries that do not require specificunits (kHz, mV, rad, for example)
Example:
[Special], [1], [2], [0], [ON] (Enter).
Description of SpecialFunctions 120 and 124
120: FM Synthesis
This special function allows you to have the instrument synthesize the Fsignal in a digitized or linear manner. Digitized FM is best for signal-tonemodulation and provides very accurate center frequency at low deviationrates. Linear FM is best for multi-tone modulation and provides a moreconstant group delay than the Digitized FM.
124: FM Dly Equalizer
This special function allows you to turn off FM Delay Equializer circuitry.When [ON] (The preset condition), 30µsec of group delay is added to theFM modulated signal to get better FM frequency response.
You may want to turn [OFF] the FM Delay Equializer circuitry when thesignal generator is used as the VCO in a phase-locked loop application treduce phase shift, of when you want to extend the FM bandwidth to 200kHz. When [OFF], FM Indicator Accuracy is worse for rates of 1-5 kHz anbetter beyond 30 kHz. Refer to the Agilent/HP 8643A/8644B User’s Guidfor specific details.
Agilent Technologies E5500 Phase Noise Measurement System 18-23

19 Connect Diagrams
Connect Diagrams You’ll Find in This Chapter
• E5501A Standard Connect Diagram, page 19-2
• E5501A Opt. 001 Connect Diagram, page 19-3
• E5501A Opt. 201, 430, 440 Connect Diagram, page 19-4
• E5501A Opt. 201 Connect Diagram, page 19-5
• E5502A Standard Connect Diagram, page 19-6
• E5502A Opt. 001 Connect Diagram, page 19-7
• E5502A Opt. 201 Connect Diagram, page 19-8
• E5503A Standard Connect Diagram, page 19-9
• E5503A Opt. 001 Connect Diagram, page 19-10
• E5503A Opt. 201 Connect Diagram, page 19-11
• E5504A Standard Connect Diagram, page 19-12
• E5504A Opt. 001 Connect Diagram, page 19-13
• E5504A Opt. 201 Connect Diagram, page 19-14
• E5501B Standard Connect Diagram, page 19-15
• E5501B Opt. 001 Connect Diagram, page 19-16
• E5501B Opt. 201 Connect Diagram, page 19-17
• E5502B Standard Connect Diagram, page 19-18
• E5502B Opt. 001 Connect Diagram, page 19-19
• E5502B Opt. 201 Connect Diagram, page 19-20
• E5503B Standard Connect Diagram, page 19-21
• E5503B Opt. 001 Connect Diagram, page 19-22
• E5503B Opt. 201 Connect Diagram, page 19-23
• E5504B Standard Connect Diagram, page 19-24
• E5504B Opt. 001 Connect Diagram, page 19-25
• E5504B Opt. 201 Connect Diagram, page 19-26
Agilent Technologies E5500 Phase Noise Measurement System 19-1

Connect DiagramsE5501A Standard Connect Diagram
E5501A Standard Connect Diagram
19-2 Agilent Technologies E5500 Phase Noise Measurement System
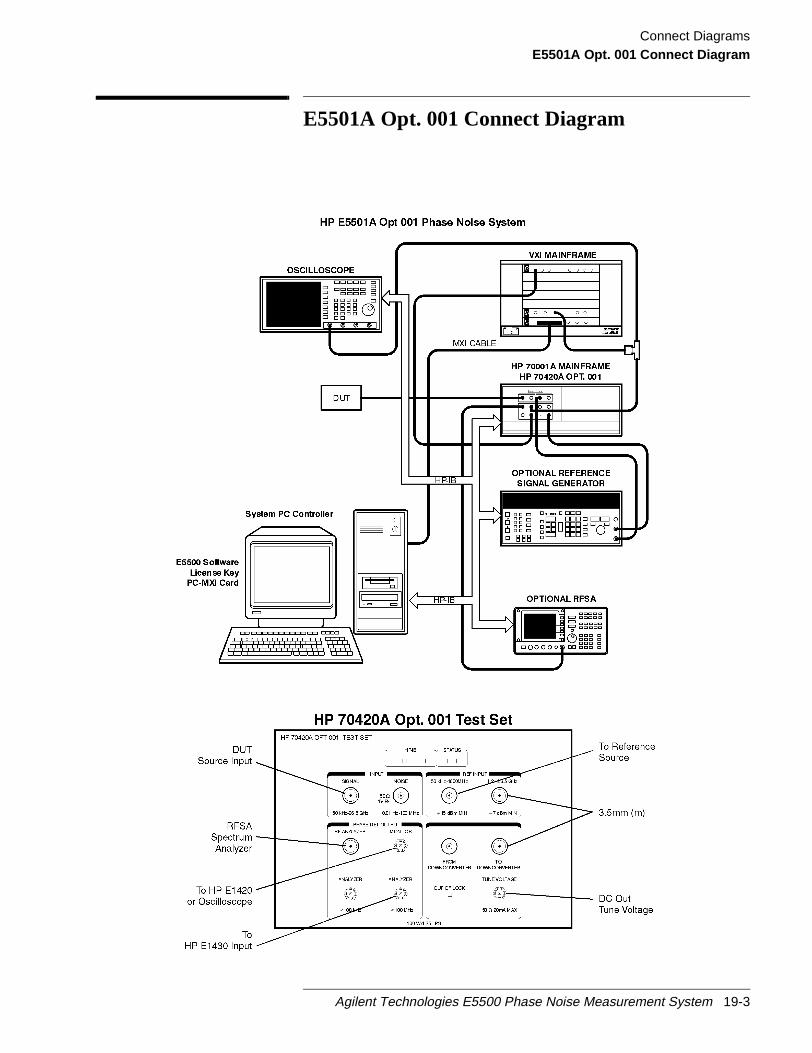
Connect DiagramsE5501A Opt. 001 Connect Diagram
E5501A Opt. 001 Connect Diagram
Agilent Technologies E5500 Phase Noise Measurement System 19-3
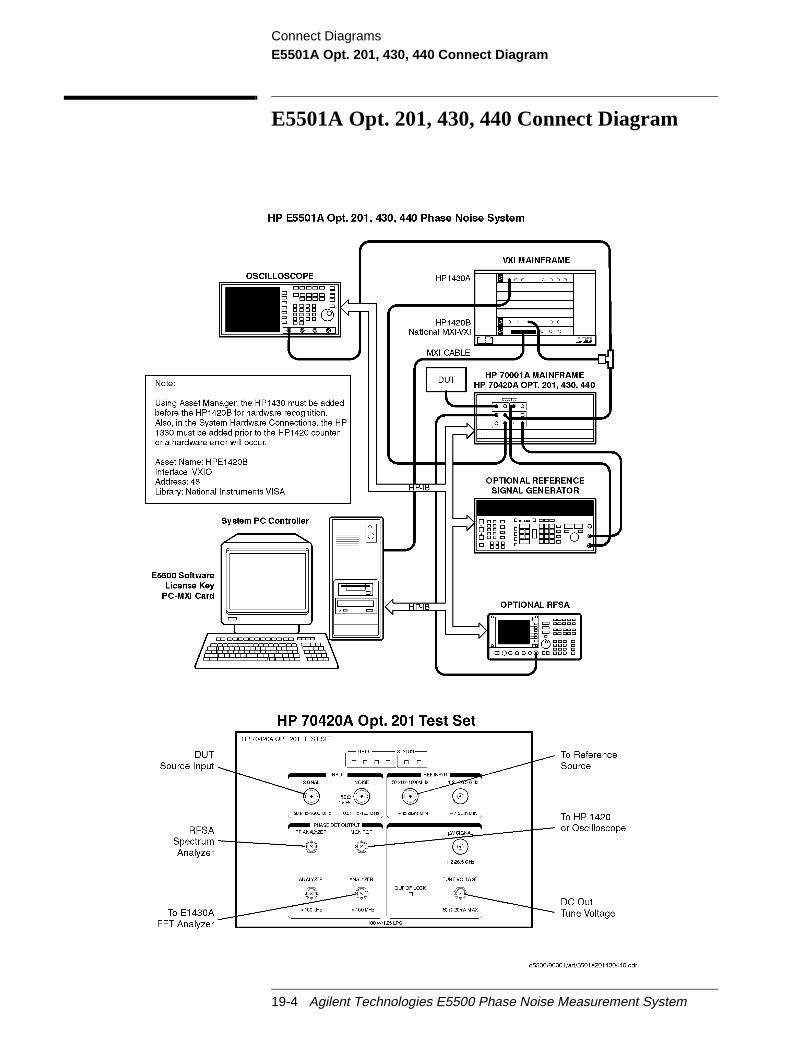
Connect DiagramsE5501A Opt. 201, 430, 440 Connect Diagram
E5501A Opt. 201, 430, 440 Connect Diagram
19-4 Agilent Technologies E5500 Phase Noise Measurement System
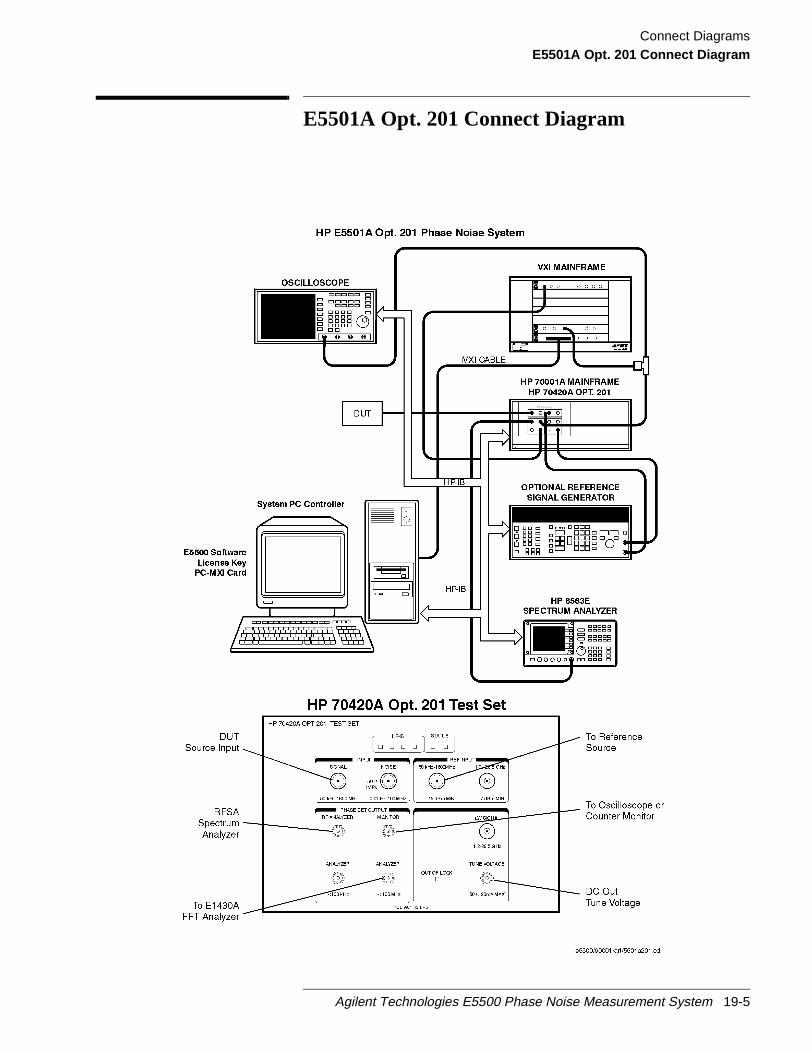
Connect DiagramsE5501A Opt. 201 Connect Diagram
E5501A Opt. 201 Connect Diagram
Agilent Technologies E5500 Phase Noise Measurement System 19-5

Connect DiagramsE5502A Standard Connect Diagram
E5502A Standard Connect Diagram
19-6 Agilent Technologies E5500 Phase Noise Measurement System

Connect DiagramsE5502A Opt. 001 Connect Diagram
E5502A Opt. 001 Connect Diagram
Agilent Technologies E5500 Phase Noise Measurement System 19-7

Connect DiagramsE5502A Opt. 201 Connect Diagram
E5502A Opt. 201 Connect Diagram
19-8 Agilent Technologies E5500 Phase Noise Measurement System

Connect DiagramsE5503A Standard Connect Diagram
E5503A Standard Connect Diagram
Agilent Technologies E5500 Phase Noise Measurement System 19-9
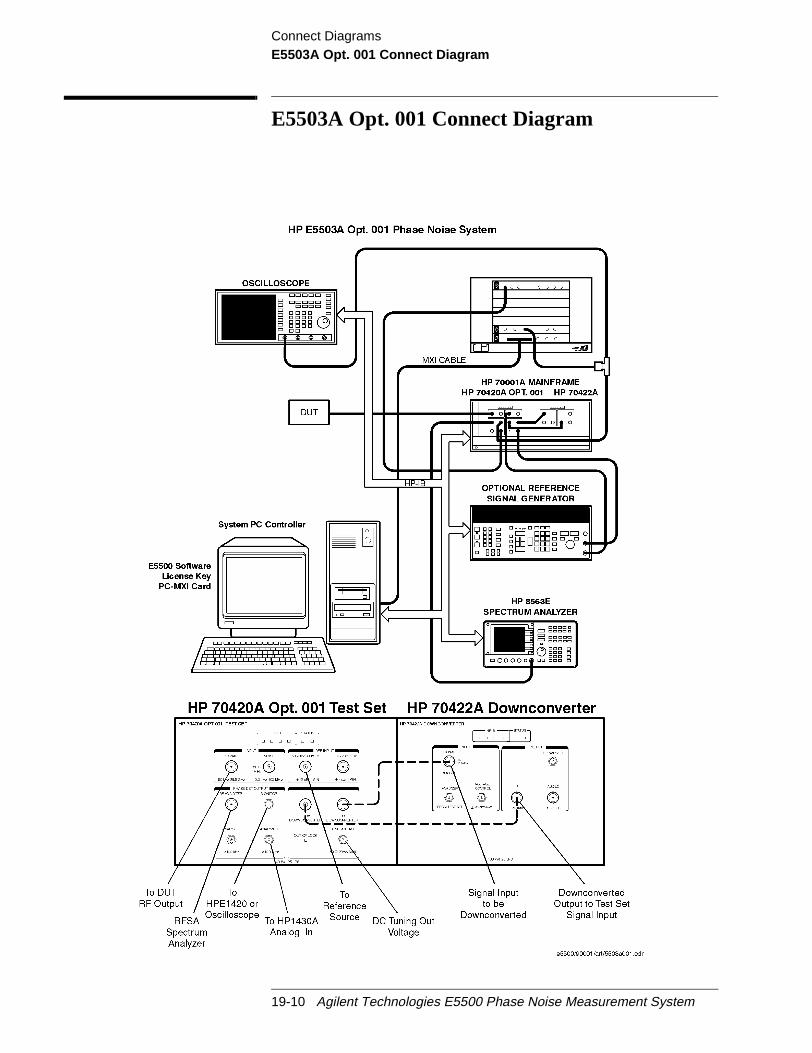
Connect DiagramsE5503A Opt. 001 Connect Diagram
E5503A Opt. 001 Connect Diagram
19-10 Agilent Technologies E5500 Phase Noise Measurement System
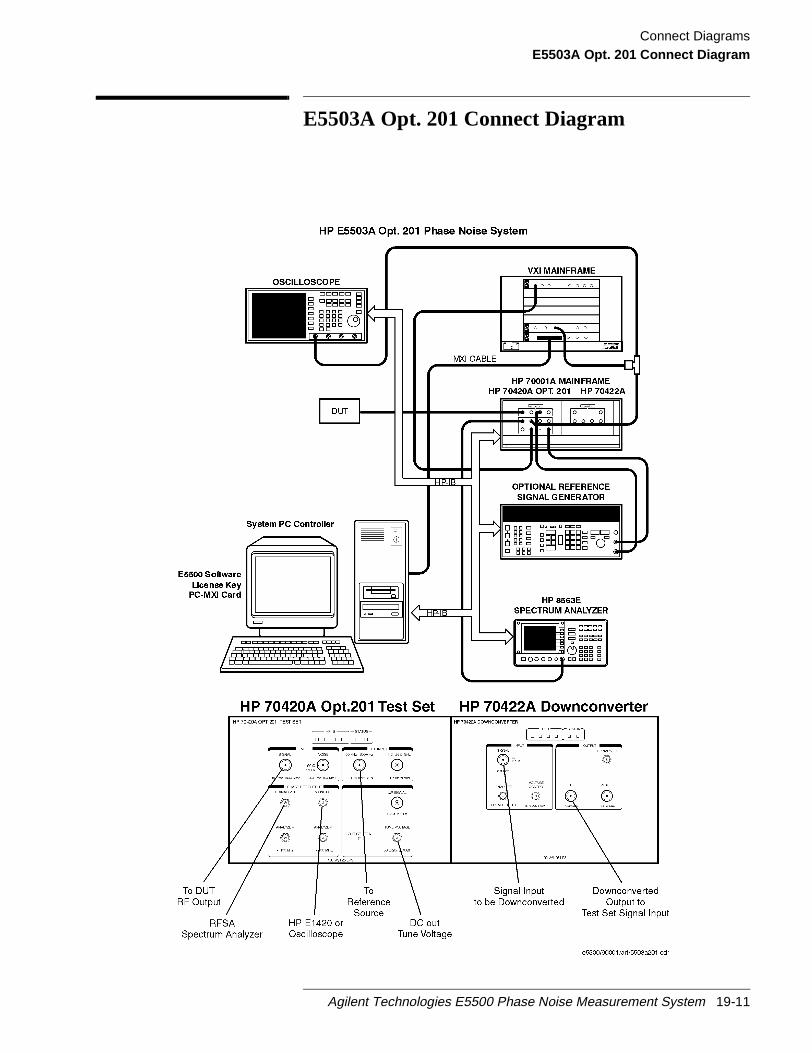
Connect DiagramsE5503A Opt. 201 Connect Diagram
E5503A Opt. 201 Connect Diagram
Agilent Technologies E5500 Phase Noise Measurement System 19-11

Connect DiagramsE5504A Standard Connect Diagram
E5504A Standard Connect Diagram
19-12 Agilent Technologies E5500 Phase Noise Measurement System

Connect DiagramsE5504A Opt. 001 Connect Diagram
E5504A Opt. 001 Connect Diagram
Agilent Technologies E5500 Phase Noise Measurement System 19-13
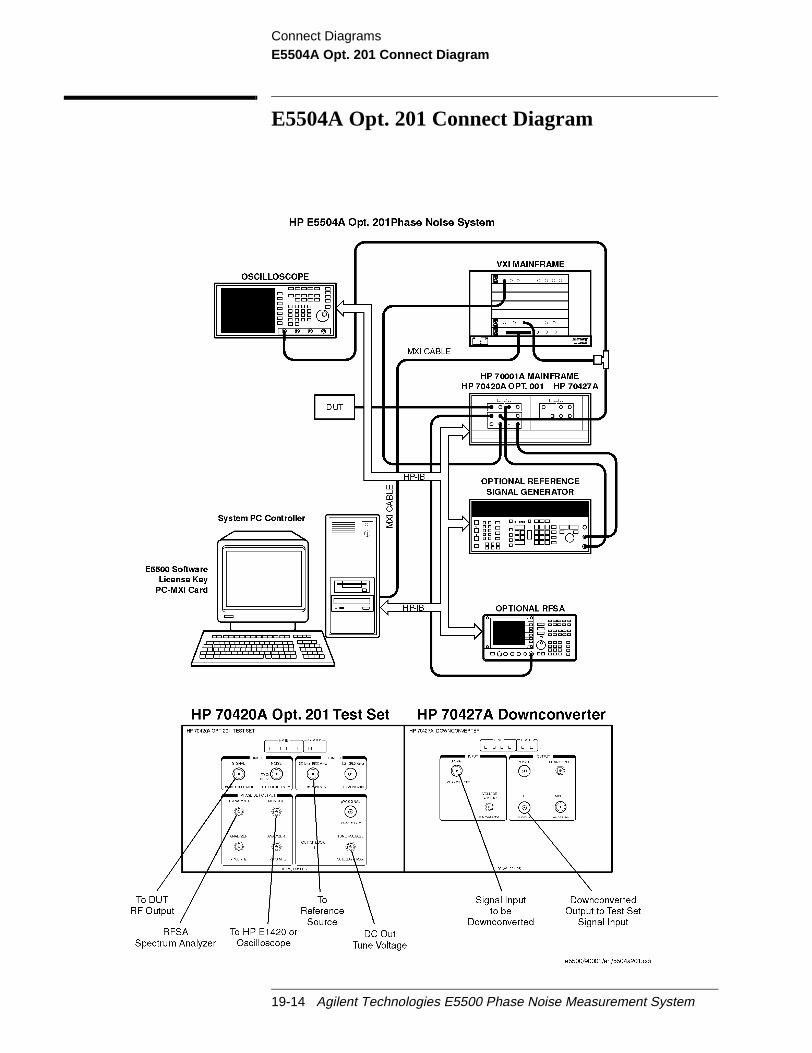
Connect DiagramsE5504A Opt. 201 Connect Diagram
E5504A Opt. 201 Connect Diagram
19-14 Agilent Technologies E5500 Phase Noise Measurement System
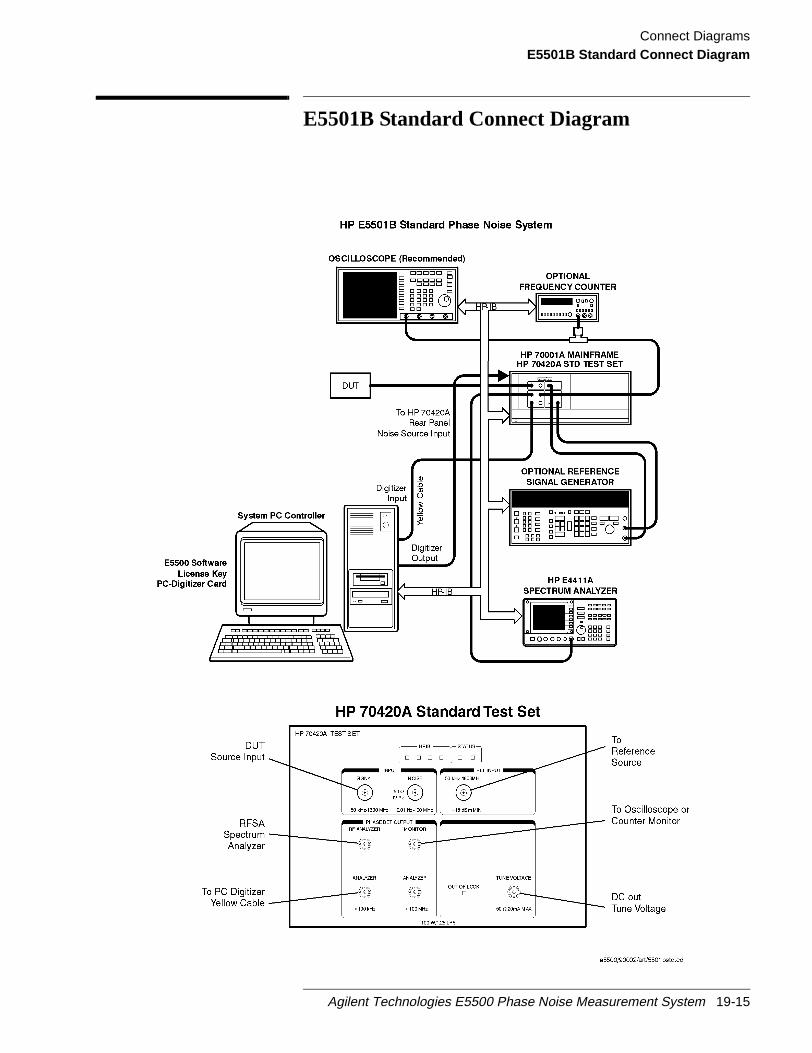
Connect DiagramsE5501B Standard Connect Diagram
E5501B Standard Connect Diagram
Agilent Technologies E5500 Phase Noise Measurement System 19-15

Connect DiagramsE5501B Opt. 001 Connect Diagram
E5501B Opt. 001 Connect Diagram
19-16 Agilent Technologies E5500 Phase Noise Measurement System
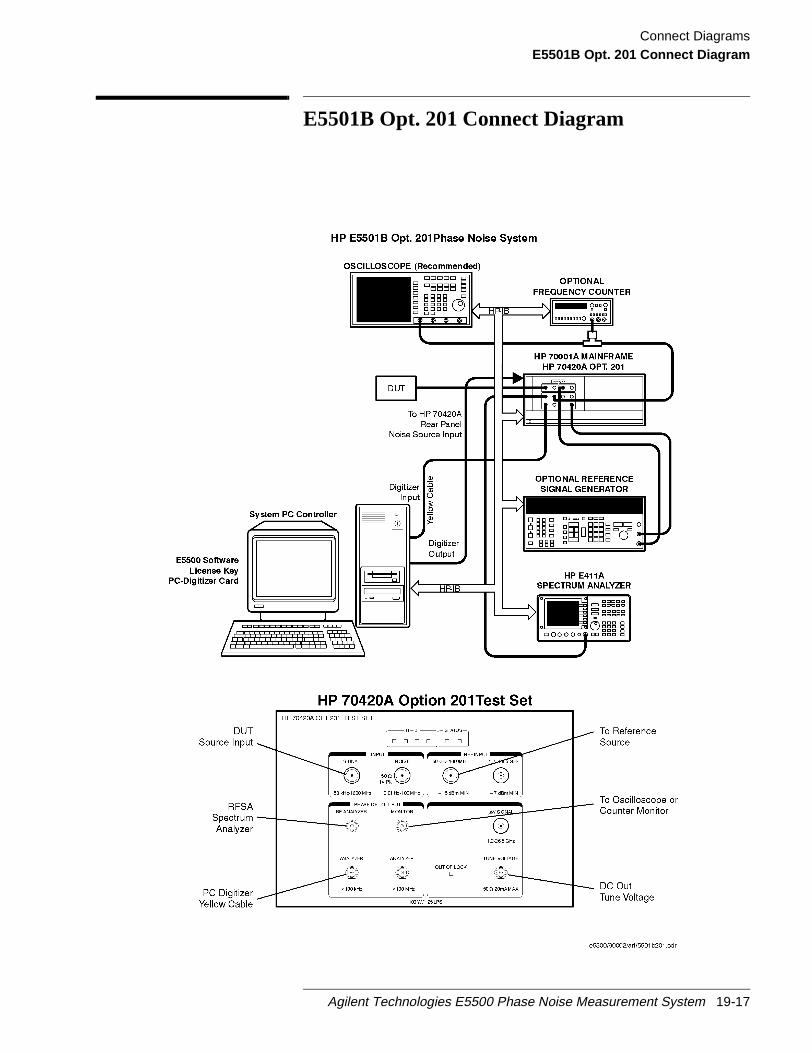
Connect DiagramsE5501B Opt. 201 Connect Diagram
E5501B Opt. 201 Connect Diagram
Agilent Technologies E5500 Phase Noise Measurement System 19-17
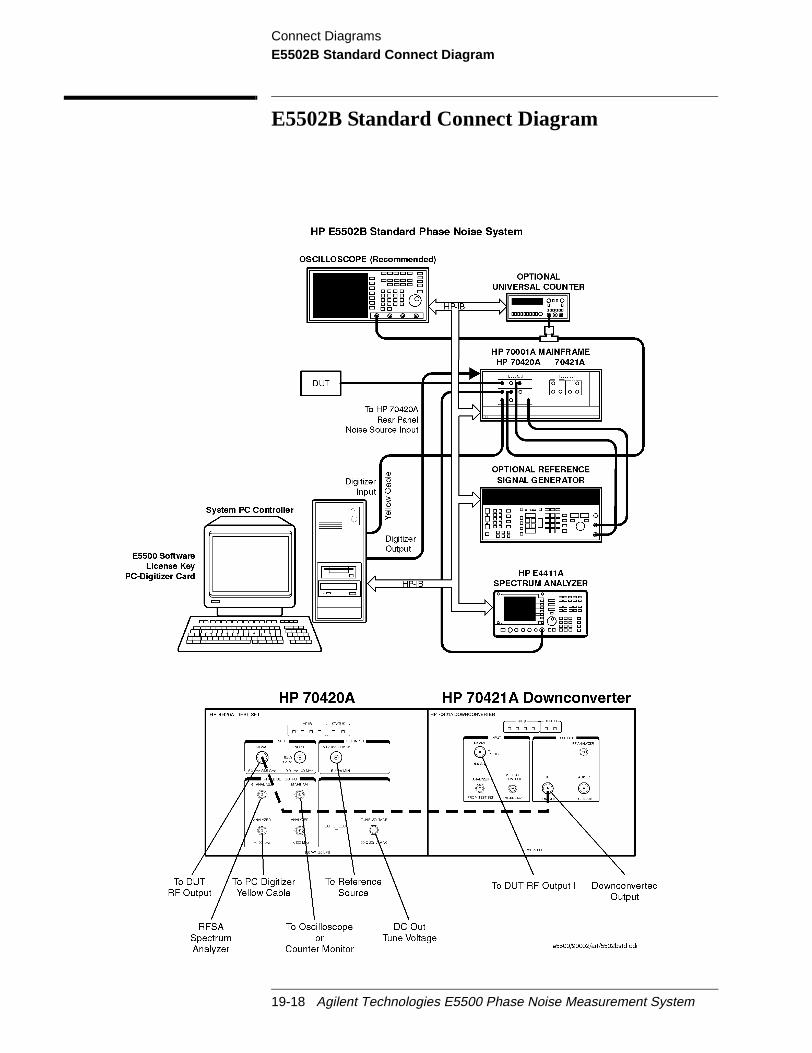
Connect DiagramsE5502B Standard Connect Diagram
E5502B Standard Connect Diagram
19-18 Agilent Technologies E5500 Phase Noise Measurement System

Connect DiagramsE5502B Opt. 001 Connect Diagram
E5502B Opt. 001 Connect Diagram
Agilent Technologies E5500 Phase Noise Measurement System 19-19

Connect DiagramsE5502B Opt. 201 Connect Diagram
E5502B Opt. 201 Connect Diagram
19-20 Agilent Technologies E5500 Phase Noise Measurement System
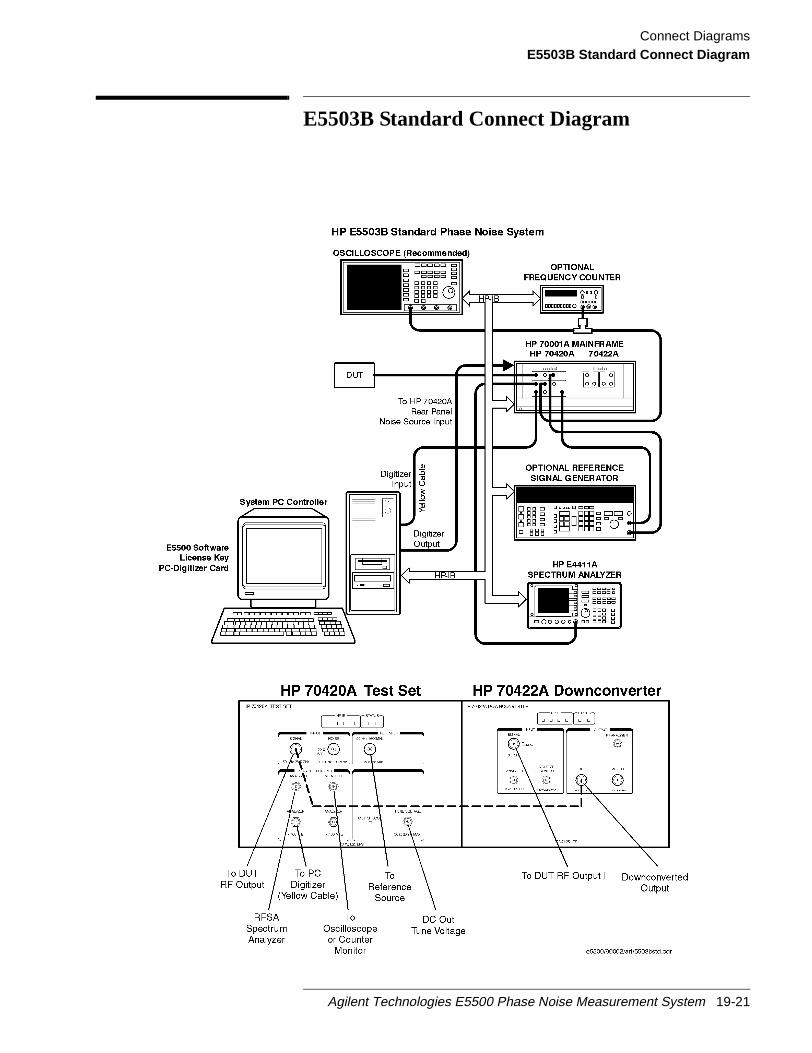
Connect DiagramsE5503B Standard Connect Diagram
E5503B Standard Connect Diagram
Agilent Technologies E5500 Phase Noise Measurement System 19-21

Connect DiagramsE5503B Opt. 001 Connect Diagram
E5503B Opt. 001 Connect Diagram
19-22 Agilent Technologies E5500 Phase Noise Measurement System

Connect DiagramsE5503B Opt. 201 Connect Diagram
E5503B Opt. 201 Connect Diagram
Agilent Technologies E5500 Phase Noise Measurement System 19-23

Connect DiagramsE5504B Standard Connect Diagram
E5504B Standard Connect Diagram
19-24 Agilent Technologies E5500 Phase Noise Measurement System

Connect DiagramsE5504B Opt. 001 Connect Diagram
E5504B Opt. 001 Connect Diagram
Agilent Technologies E5500 Phase Noise Measurement System 19-25
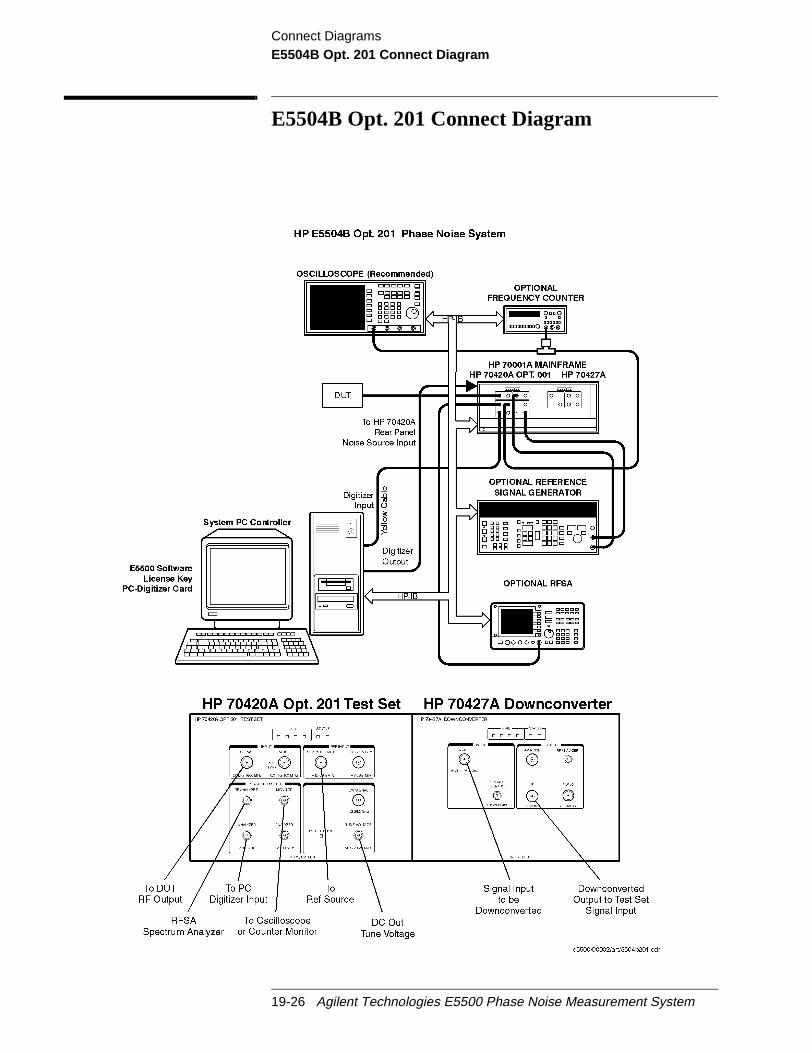
Connect DiagramsE5504B Opt. 201 Connect Diagram
E5504B Opt. 201 Connect Diagram
19-26 Agilent Technologies E5500 Phase Noise Measurement System
20 System Specifications
What You’ll Find in This Chapter…
• Specifications, page 20-2
Agilent Technologies E5500 Phase Noise Measurement System 20-1

System SpecificationsSpecifications
inty
o
may
betheing
O
Specifications
Reliable Accuracy The Agilent E5500 phase noise system minimizes measurement uncertaby assuring you of accurate and repeatable measurement results.
MeasurementQualifications
In order for the E5500 to meet its accuracy specifications, the followingqualifications must be met by the signal sources you are using.
• Source Return Loss: 9.5 dB (<2:1 SWR)
• Source Harmonic Distortion <–20 dB (or a square wave)
• Nonharmonic spurious≤ -26 dBc (except for phase modulation close tthe carrier.
If either of these conditions are not met, system measurement accuracybe reduced.
Tuning The tuning range of the voltage-controlled-oscillator (VCO) source mustcommensurate with the frequency stability of the sources being used. Iftuning range is too narrow, the system will not properly phase lock, resultin an aborted measurement. If the tuning range of the VCO source is toolarge, noise on the control line may increase the effective noise of the VCsource.
Table 20-1 RF Phase Detector Accuracy
RF Phase Detector Accuracy
Frequency Range Offset from Carrier
.01 Hz to 1 MHz ± 2 dB
1 MHz to 100 MHz ± 4 dB
Table 20-2 AM Detector Accuracy
AM Detector Accuracy
Frequency Range Offset from Carrier
.01 Hz to 1 MHz ± 3 dB
1 MHz to 100 MHz ± 5 dB
20-2 Agilent Technologies E5500 Phase Noise Measurement System
21 Phase Noise Customer Support
What You’ll Find in This Chapter
• Software and Documentation Updates, page 21-2
• Contacting Customer Support, page 21-3
• Phase Noise Customer Support Fax Form, page 21-5
Agilent Technologies E5500 Phase Noise Measurement System 21-1

Phase Noise Customer SupportSoftware and Documentation Updates
nt
Software and Documentation Updates
NOTE To receiveSOFTWARE and DOCUMENTATION UPDATES , pleasesend us your:
• Name
• Address
• Phone number
• Agilent/HP 70420A Test Set serial number
To find the test set’s serial number, open the door on the lower-froof the HP 70001A Mainframe.
The following methods are available for sending us the information:
• Phase Noise Hot Line: (707) 577-5859
• Phase Noise e-mail address: [email protected]
• Phase Noise Fax Number: (707) 577-4446 (Use thePhase NoiseCustomer Support Fax Form, page 21-5)
21-2 Agilent Technologies E5500 Phase Noise Measurement System
Phase Noise Customer SupportContacting Customer Support
the
.
. If
Contacting Customer Support
Feel free to contact us using one of the methods described under“Softwareand Documentation Updates” on page 21-2if you have any questionsregarding theSOFTWARE UPDATE program.
If you have an application question, or are experiencing difficulties withyour system, you may also contact us for assistance.
NOTE Please provide as much information as possible when contacting the HPPhase Noise Customer Support department. If available, please includefollowing information:
• A complete description of the problem, or (if asking a question aboutsystem or hardware operation) a brief description of your application
• A block diagram of the system hardware configuration you are usingappropriate, include frequency and power levels for thedevice-under-test and reference sources.
• A graph of your measurement, if available. Use the software’s “FileMenu” and “Print” capabilities to provide a graph and parametersummary.
Agilent Technologies E5500 Phase Noise Measurement System 21-3
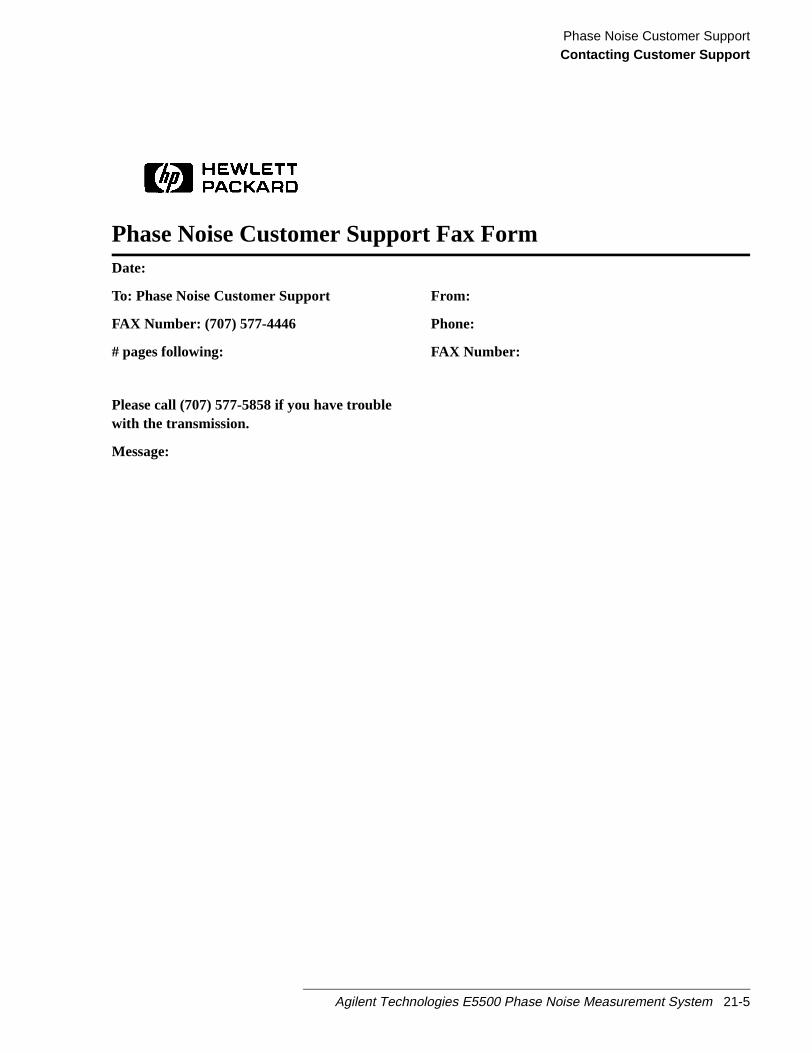
Phase Noise Customer SupportContacting Customer Support
Phase Noise Customer Support Fax FormDate:
To: Phase Noise Customer Support From:
FAX Number: (707) 577-4446 Phone:
# pages following: FAX Number:
Please call (707) 577-5858 if you have troublewith the transmission.
Message:
Agilent Technologies E5500 Phase Noise Measurement System 21-5

A Connector Care andPreventive Maintenance
What You’ll Find in This Appendix…
• Using, Inspecting, and Cleaning RF Connectors, page A-2
Repeatability, page A-2
Proper Connector Torque, page A-3
Cleaning Procedure, page A-4
• Removing and Reinstalling Instruments, page A-6
General Procedures and Techniques, page A-6
MMS Module Removal and Reinstallation, page A-11
• Touch-Up Paint, page A-12
Agilent Technologies E5500 Phase Noise Measurement System A-1
Connector Care and Preventive MaintenanceUsing, Inspecting, and Cleaning RF Connectors
s or
s.r of
e
g aake
Using, Inspecting, and Cleaning RF Connectors
Taking proper care of cables and connectors will protect your system’sability to make accurate measurements. One of the main sources ofmeasurement inaccuracy can be caused by improperly made connectionby dirty or damaged connectors.
The condition of system connectors affects measurement accuracy andrepeatability. Worn, out-of-tolerance, or dirty connectors degrade thesemeasurement performance characteristics. For more information onconnector care, please refer to the documentation that came with yourcalibration kit.
Repeatability If you make two identical measurements with your system, the differenceshould be so small that they will not affect the value of the measurementRepeatability (the amount of similarity from one measurement to anothethe same type) can be affected by:
• Dirty or damaged connectors
• Connections that have been made without using proper torquetechniques (this applies primarily when connectors in the system havbeen disconnected, then reconnected)
CAUTION Static-Sensitive Devices
This system contains instruments and devices that are static-sensitive.Always take proper electrostatic precautions before touching the centerconductor of any connector, or the center conductor of any cable that isconnected to any system instrument.
Handle Agilent Technologies instruments and devices only when wearingrounded wrist or foot strap. When handling devices on a work bench, msure you are working on an anti-static worksurface.
A-2 Agilent Technologies E5500 Phase Noise Measurement System

Connector Care and Preventive MaintenanceUsing, Inspecting, and Cleaning RF Connectors
.st be
d
ble
ertor
ical
ise.
ue.
RF Cable andConnector Care
Connectors are the most critical link in a precision measurement systemThese devices are manufactured to extremely precise tolerances and muused and maintained with care to protect the measurement accuracy anrepeatability of your system.
To extend the life of your cables or connectors:
• Avoid repeated bending of cables—a single sharp bend can ruin a cainstantly.
• Avoid repeated connection and disconnection of cable connectors.
• Inspect the connectors before connection; look for dirt, nicks, and othsigns of damage or wear. A bad connector can ruin the good connecinstantly.
• Clean dirty connectors. Dirt and foreign matter can cause poor electrconnections and may damage the connector.
• Minimize the number of times you bend cables.
• Never bend a cable at a sharp angle.
• Do not bend cables near the connectors.
• If any of the cables will be flexed repeatedly, buy a back-up cable. Thwill allow immediate replacement and will minimize system down tim
Before connecting the cables to any device:
• Check all connectors for wear or dirt.
• When making the connection, torque the connector to the proper val
Proper ConnectorTorque
• Provides more accurate measurements
• Keeps moisture out the connectors
• Eliminates radio frequency interference (RFI) from affecting yourmeasurements
The torque required depends on the type of connector. Refer toTable A-1.Do not overtighten the connector. Torque wrenches are supplied in thecalibration and verification kits that came with the system.
Agilent Technologies E5500 Phase Noise Measurement System A-3
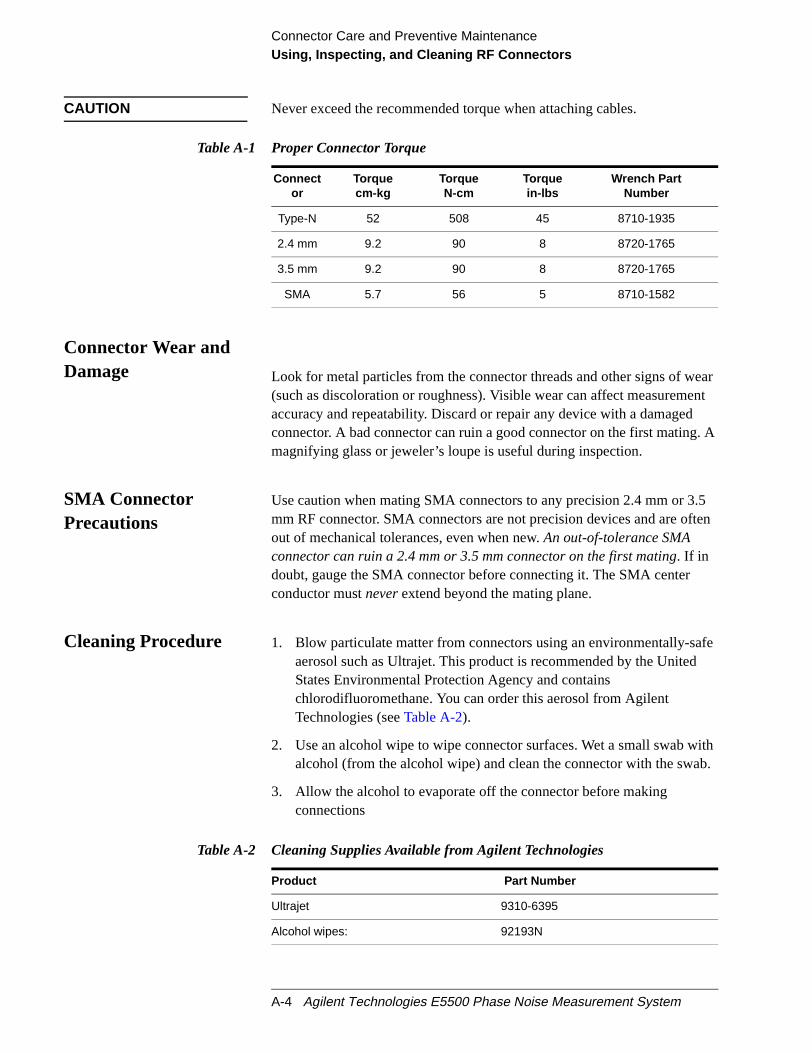
Connector Care and Preventive MaintenanceUsing, Inspecting, and Cleaning RF Connectors
earnt
. A
5ten
fe
ithb.
CAUTION Never exceed the recommended torque when attaching cables.
Connector Wear andDamage Look for metal particles from the connector threads and other signs of w
(such as discoloration or roughness). Visible wear can affect measuremeaccuracy and repeatability. Discard or repair any device with a damagedconnector. A bad connector can ruin a good connector on the first matingmagnifying glass or jeweler’s loupe is useful during inspection.
SMA ConnectorPrecautions
Use caution when mating SMA connectors to any precision 2.4 mm or 3.mm RF connector. SMA connectors are not precision devices and are ofout of mechanical tolerances, even when new.An out-of-tolerance SMAconnector can ruin a 2.4 mm or 3.5 mm connector on the first mating. If indoubt, gauge the SMA connector before connecting it. The SMA centerconductor mustneverextend beyond the mating plane.
Cleaning Procedure 1. Blow particulate matter from connectors using an environmentally-saaerosol such as Ultrajet. This product is recommended by the UnitedStates Environmental Protection Agency and containschlorodifluoromethane. You can order this aerosol from AgilentTechnologies (seeTable A-2).
2. Use an alcohol wipe to wipe connector surfaces. Wet a small swab walcohol (from the alcohol wipe) and clean the connector with the swa
3. Allow the alcohol to evaporate off the connector before makingconnections
Table A-1 Proper Connector Torque
Connector
Torquecm-kg
TorqueN-cm
Torquein-lbs
Wrench PartNumber
Type-N 52 508 45 8710-1935
2.4 mm 9.2 90 8 8720-1765
3.5 mm 9.2 90 8 8720-1765
SMA 5.7 56 5 8710-1582
Table A-2 Cleaning Supplies Available from Agilent Technologies
Product Part Number
Ultrajet 9310-6395
Alcohol wipes: 92193N
A-4 Agilent Technologies E5500 Phase Noise Measurement System

Connector Care and Preventive MaintenanceUsing, Inspecting, and Cleaning RF Connectors
ts.
lowatto
CAUTION Do not allow excessive alcohol to run into the connector. Excessive alcoholentering the connector collects in pockets in the connector’s internal parThe liquid will cause random changes in the connector’s electricalperformance. If excessive alcohol gets into a connector, lay it aside to althe alcohol to evaporate. This may take up to three days. If you attach thconnector to another device it can take much longer for trapped alcoholevaporate.
Lint-Free cloths: 9310-4242
Small foam swabs: 9300-1270
Large foam swabs 9300-0468
Table A-2 Cleaning Supplies Available from Agilent Technologies
Product Part Number
Agilent Technologies E5500 Phase Noise Measurement System A-5
Connector Care and Preventive MaintenanceRemoving and Reinstalling Instruments
d in! EA
Removing and Reinstalling Instruments
General Proceduresand Techniques
This section introduces you to the various cable and connector types usethe system. Read this section before attempting to remove an instrumentconnector type may have unique considerations. For example, someconnectors are loosened by turning them clockwise, others by turningcounter clockwise.
Always use care when working with system cables and instruments.
A-6 Agilent Technologies E5500 Phase Noise Measurement System
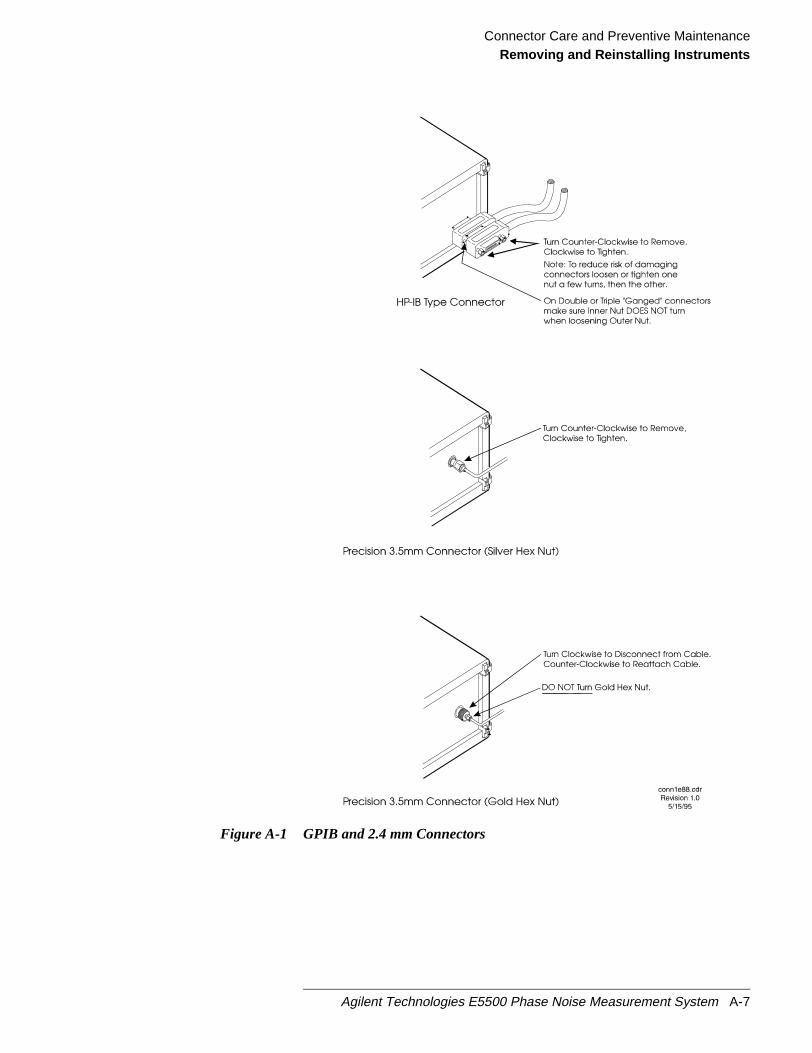
Connector Care and Preventive MaintenanceRemoving and Reinstalling Instruments
Figure A-1 GPIB and 2.4 mm Connectors
Agilent Technologies E5500 Phase Noise Measurement System A-7

Connector Care and Preventive MaintenanceRemoving and Reinstalling Instruments
ctor;sary.
notn
m
e do
le’s
theall
will
tor.
GPIB Connectors These are removed by two captured screw, one on each end of the connethese usually can be turned by hand. Use a flathead screwdriver if neces
GPIB connectors often are stacked two or three deep. When you areremoving multiple GPIB connectors, disconnect each connector one at atime. It is a good practice to connect them back together even if you haveyet replaced the instrument; this avoids confusion, especially if more thaone instrument has been removed.
When putting GPIB connectors back on, you must again detach them froone another and put them on one at a time.
Precision 2.4 mm and3.5 mm Connectors
These are precision connectors. Always use care when connecting ordisconnecting this type of connector. When reconnecting, make sure youalign the male connector properly. Carefully join the connectors, beingcareful not to cross-thread them.
Loosen precision 2.4 mm (or 3.5 mm) connectors on flexible cables byturning the connector nut counter-clockwise with a 5/16 inch wrench.Always reconnect using an 8 inch-lb torque wrench (part number8720-1765). This wrench may be ordered from Agilent Technologies.
Semirigid cables are metal tubes, custom-formed for this system fromsemirigid coax cable stock.
2.4 mm (or 3.5 mm) connectors with a gold hex nut.The semirigid cablesthat go the RF outputs of some devices have a gold connector nut. Thesnot turn. Instead, the RF connector on the instrument has a cylindricalconnector body that turns. To disconnect this type of connector, turn theconnector body on the instrument clockwise. This action pushes the cabconnector out of the instrument connector.
To reconnect, align the cable with the connector on the instrument. Turnconnector body counterclockwise. You may have to move the cable a smamount until alignment is correct the connectors mate. When the twoconnectors are properly aligned, turning the instruments connector bodypull in the semirigid cable’s connector. Tighten firmly by hand.
2.4 mm (or 3.5 mm) connectors with a silver hex nut.All other semirigidcable connectors use a silver-colored nut thatcanbe turned. To remove thistype of connector, turn the silver nut counter-clockwise with a 5/16 inchwrench.
When reconnecting this type of cable:
• Carefully insert the male connector center pin into the female connec(Try to make sure the cable is aligned with the instrument connectorproperly before joining them.)
A-8 Agilent Technologies E5500 Phase Noise Measurement System

Connector Care and Preventive MaintenanceRemoving and Reinstalling Instruments
ay
and, its
• Turn the silver nut clockwise by hand until it is snug, then tighten withan 8 inch-lb torque wrench (part number 8720-1765). This wrench mbe ordered from Agilent Technologies.
Bent Semirigid Cables Semirigid cables are not intended to be bent outside of the factory. Anaccidental bend that is slight or gradual may be straightened carefully byhand. Semirigid cables that are crimped will affect system performance,must be replaced. Do not attempt to straighten a crimped semirigid cableperformance will not be restored.
Other MultipinConnectors
There are other multipin connectors in the system (Agilent/HP MSIB, forexample). These are sometimes held in place by a pair of screws.
Agilent Technologies E5500 Phase Noise Measurement System A-9

Connector Care and Preventive MaintenanceRemoving and Reinstalling Instruments
Figure A-2 Type-N, Power Sensor, and BNC Connectors
A-10 Agilent Technologies E5500 Phase Noise Measurement System
Connector Care and Preventive MaintenanceRemoving and Reinstalling Instruments
tal
nel
se
taln it.
ch
MMS ModuleRemoval andReinstallation
To Remove an MMS Module
1. Set the mainframe line switch to OFF.
2. Remove all rear panel cables going to the module
3. On the bottom of the mainframe front panel is a dark-colored, horizonaccess panel. Pry outward at the top of this panel to open it.
4. With an 8 mm hex-ball driver, loosen the module hex nut latch.
5. Go to the back of the system and press against the module’s rear paand slide the module forward several inches.
6. From the front of the system, pull the module out.
To Reinstall an MMS Module
1. Set the MMS mainframe line switch to OFF.
2. Check the GPIB address switch on the module for the correct addressetting. Refer to the manual for the MMS module for information on thHP-MSIB switch. For proper address settings, refer to the systeminformation chapter.
CAUTION Reinstalling an MMS module without setting the GPIB address will causethe system to malfunction. (Not all MMS modules use GPIB settings.)
3. On the bottom of the mainframe front panel is a dark-colored, horizonaccess panel. If necessary, pry outward at the top of this panel to ope
4. Slide the module into the mainframe.
5. Press against the front of the module while tightening the hex-nut lat(with an 8 mm hex-ball driver).
6. Close the access panel.
7. Go to the back of the system and connect intermodule cables.
Agilent Technologies E5500 Phase Noise Measurement System A-11

Connector Care and Preventive MaintenanceTouch-Up Paint
and
Touch-Up Paint
Touch-up paint is shipped in spray cans. Spray a cotton swab with paintapply it to the damaged area.
Table A-3 Touch-Up Paint
Touch-Up Paint Color Where the Color is Used Part Number
Dove Gray • Front panel frames
• Portions of front handles
6010-1146
French Gray • Side, top, and bottom covers 6010-1147
Parchment Gray • Rack mount flanges
• Front panels
6010-1148
A-12 Agilent Technologies E5500 Phase Noise Measurement System
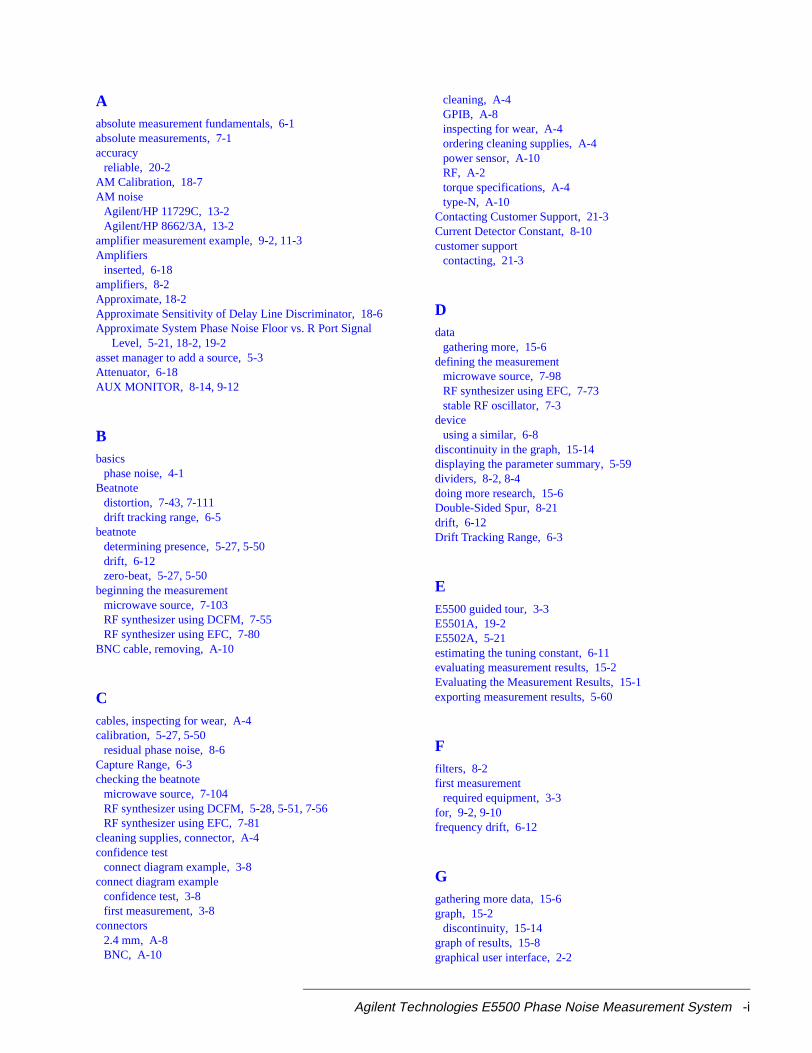
Aabsolute measurement fundamentals, 6-1absolute measurements, 7-1accuracy
reliable, 20-2AM Calibration, 18-7AM noise
Agilent/HP 11729C, 13-2Agilent/HP 8662/3A, 13-2
amplifier measurement example, 9-2, 11-3Amplifiers
inserted, 6-18amplifiers, 8-2Approximate, 18-2Approximate Sensitivity of Delay Line Discriminator, 18-6Approximate System PhaseNoise Floor vs. R Port Signal
Level, 5-21, 18-2, 19-2asset manager to add a source, 5-3Attenuator, 6-18AUX MONITOR, 8-14, 9-12
Bbasics
phase noise, 4-1Beatnote
distortion, 7-43, 7-111drift tracking range, 6-5
beatnotedetermining presence, 5-27, 5-50drift, 6-12zero-beat, 5-27, 5-50
beginning the measurementmicrowave source, 7-103RF synthesizer using DCFM, 7-55RF synthesizer using EFC, 7-80
BNC cable, removing, A-10
Ccables, inspecting for wear, A-4calibration, 5-27, 5-50
residual phase noise, 8-6Capture Range, 6-3checking the beatnote
microwave source, 7-104RF synthesizer using DCFM, 5-28, 5-51, 7-56RF synthesizer using EFC, 7-81
cleaning supplies, connector, A-4confidence test
connect diagram example, 3-8connect diagram example
confidence test, 3-8first measurement, 3-8
connectors2.4 mm, A-8BNC, A-10
cleaning, A-4GPIB, A-8inspecting for wear, A-4ordering cleaning supplies, A-4power sensor, A-10RF, A-2torque specifications, A-4type-N, A-10
Contacting Customer Support, 21-3Current Detector Constant, 8-10customer support
contacting, 21-3
Ddata
gathering more, 15-6defining the measurement
microwave source, 7-98RF synthesizer using EFC, 7-73stable RF oscillator, 7-3
deviceusing a similar, 6-8
discontinuity in the graph, 15-14displaying the parameter summary, 5-59dividers, 8-2, 8-4doing more research, 15-6Double-Sided Spur, 8-21drift, 6-12Drif t Tracking Range, 6-3
EE5500 guided tour, 3-3E5501A, 19-2E5502A, 5-21estimating the tuning constant, 6-11evaluating measurement results, 15-2Evaluating the Measurement Results, 15-1exporting measurement results, 5-60
Ffi lters, 8-2first measurement
required equipment, 3-3for, 9-2, 9-10frequency drift, 6-12
Ggathering more data, 15-6graph, 15-2
discontinuity, 15-14graph of results, 15-8graphical user interface, 2-2
Agilent Technologies E5500 Phase Noise Measurement System -i
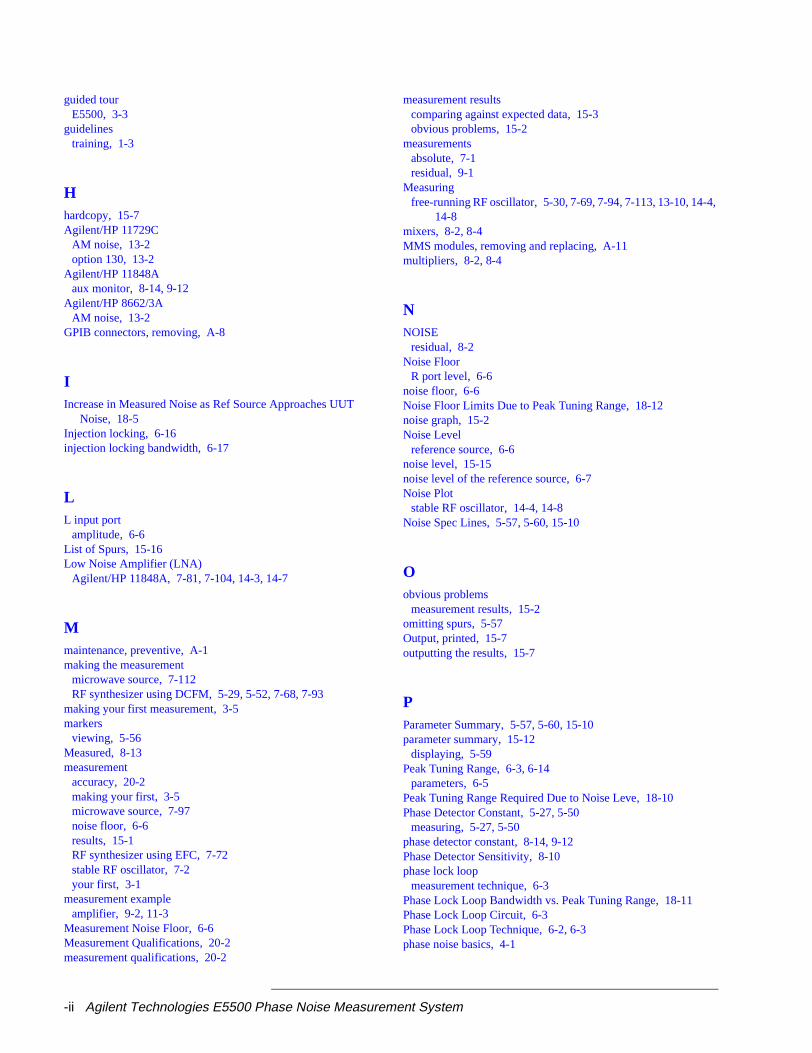
guided tourE5500, 3-3
guidelinestraining, 1-3
Hhardcopy, 15-7Agilent/HP 11729C
AM noise, 13-2option 130, 13-2
Agilent/HP 11848Aaux monitor, 8-14, 9-12
Agilent/HP 8662/3AAM noise, 13-2
GPIB connectors, removing, A-8
IIncrease in Measured Noiseas Ref Source Approaches UUT
Noise, 18-5Injection locking, 6-16injection locking bandwidth, 6-17
LL input port
amplitude, 6-6List of Spurs, 15-16Low Noise Amplifi er (LNA)
Agilent/HP 11848A, 7-81, 7-104, 14-3, 14-7
Mmaintenance, preventive, A-1making the measurement
microwave source, 7-112RF synthesizer using DCFM, 5-29, 5-52, 7-68, 7-93
making your first measurement, 3-5markers
viewing, 5-56Measured, 8-13measurement
accuracy, 20-2making your first, 3-5microwave source, 7-97noise floor, 6-6results, 15-1RF synthesizer using EFC, 7-72stable RF oscillator, 7-2your first, 3-1
measurement exampleamplifier , 9-2, 11-3
Measurement Noise Floor, 6-6Measurement Qualifications, 20-2measurement qualifications, 20-2
measurement resultscomparing against expected data, 15-3obvious problems, 15-2
measurementsabsolute, 7-1residual, 9-1
Measuringfree-runningRF oscillator, 5-30, 7-69, 7-94, 7-113, 13-10, 14-4,
14-8mixers, 8-2, 8-4MMS modules, removing and replacing, A-11multipliers, 8-2, 8-4
NNOISE
residual, 8-2Noise Floor
R port level, 6-6noise floor, 6-6Noise Floor Limits Due to Peak Tuning Range, 18-12noise graph, 15-2Noise Level
reference source, 6-6noise level, 15-15noise level of the reference source, 6-7Noise Plot
stable RF oscillator, 14-4, 14-8Noise Spec Lines, 5-57, 5-60, 15-10
Oobvious problems
measurement results, 15-2omitting spurs, 5-57Output, printed, 15-7outputting the results, 15-7
PParameter Summary, 5-57, 5-60, 15-10parameter summary, 15-12
displaying, 5-59Peak Tuning Range, 6-3, 6-14
parameters, 6-5Peak Tuning Range Required Due to Noise Leve, 18-10Phase Detector Constant, 5-27, 5-50
measuring, 5-27, 5-50phase detector constant, 8-14, 9-12Phase Detector Sensitivity, 8-10phase lock loop
measurement technique, 6-3Phase Lock Loop Bandwidth vs. Peak Tuning Range, 18-11Phase Lock Loop Circuit, 6-3Phase Lock Loop Technique, 6-2, 6-3phase noise basics, 4-1
-ii Agilent Technologies E5500 Phase Noise Measurement System
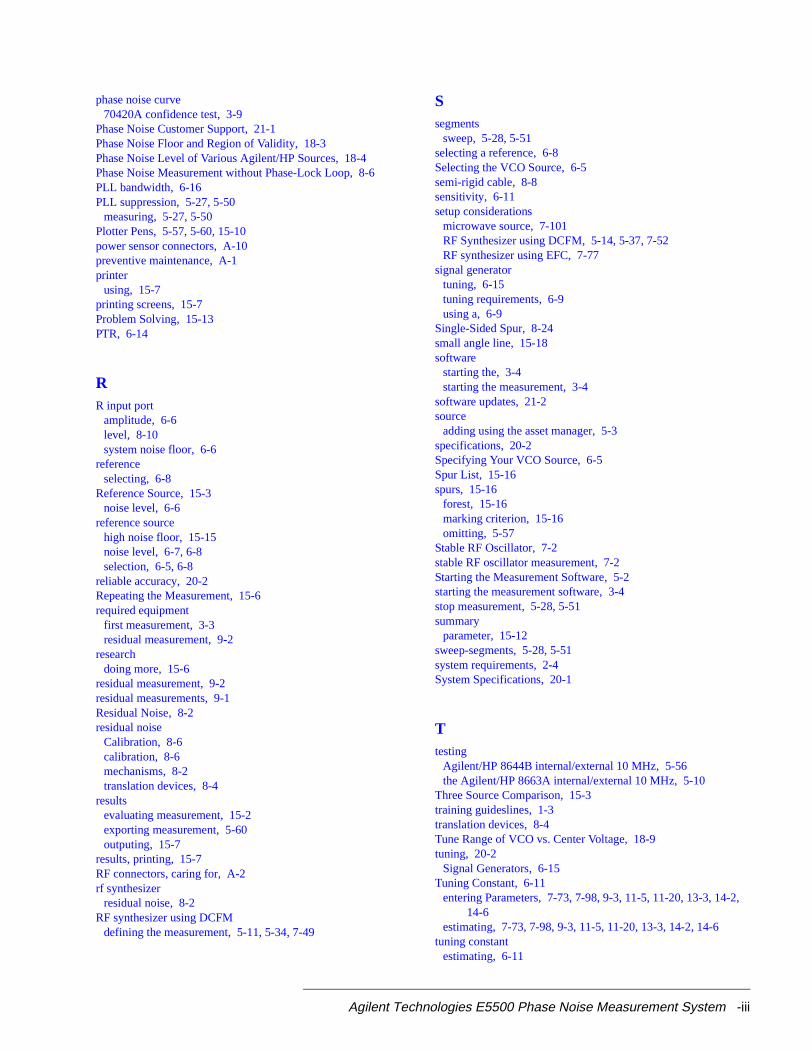
phase noise curve70420A confidence test, 3-9
Phase Noise Customer Support, 21-1Phase Noise Floor and Region of Validity, 18-3Phase Noise Level of Various Agilent/HP Sources, 18-4Phase Noise Measurement without Phase-Lock Loop, 8-6PLL bandwidth, 6-16PLL suppression, 5-27, 5-50
measuring, 5-27, 5-50Plotter Pens, 5-57, 5-60, 15-10power sensor connectors, A-10preventive maintenance, A-1printer
using, 15-7printing screens, 15-7Problem Solving, 15-13PTR, 6-14
RR input port
amplitude, 6-6level, 8-10system noise floor, 6-6
referenceselecting, 6-8
Reference Source, 15-3noise level, 6-6
reference sourcehigh noise floor, 15-15noise level, 6-7, 6-8selection, 6-5, 6-8
reliable accuracy, 20-2Repeating the Measurement, 15-6required equipment
first measurement, 3-3residual measurement, 9-2
researchdoing more, 15-6
residual measurement, 9-2residual measurements, 9-1Residual Noise, 8-2residual noise
Calibration, 8-6calibration, 8-6mechanisms, 8-2translation devices, 8-4
resultsevaluating measurement, 15-2exporting measurement, 5-60outputing, 15-7
results, printing, 15-7RF connectors, caring for, A-2rf synthesizer
residual noise, 8-2RF synthesizer using DCFM
defining the measurement, 5-11, 5-34, 7-49
Ssegments
sweep, 5-28, 5-51selecting a reference, 6-8Selecting the VCO Source, 6-5semi-rigid cable, 8-8sensitivi ty, 6-11setup considerations
microwave source, 7-101RF Synthesizer using DCFM, 5-14, 5-37, 7-52RF synthesizer using EFC, 7-77
signal generatortuning, 6-15tuning requirements, 6-9using a, 6-9
Single-Sided Spur, 8-24small angle line, 15-18software
starting the, 3-4starting the measurement, 3-4
software updates, 21-2source
adding using the asset manager, 5-3specifications, 20-2Specifying Your VCO Source, 6-5Spur List, 15-16spurs, 15-16
forest, 15-16marking criterion, 15-16omitting, 5-57
StableRF Oscillator, 7-2stable RF oscillator measurement, 7-2Starting the Measurement Software, 5-2starting the measurement software, 3-4stop measurement, 5-28, 5-51summary
parameter, 15-12sweep-segments, 5-28, 5-51system requirements, 2-4System Specifications, 20-1
Ttesting
Agilent/HP 8644B internal/external 10 MHz, 5-56the Agilent/HP 8663A internal/external 10 MHz, 5-10
Three Source Comparison, 15-3training guideslines, 1-3translation devices, 8-4Tune Range of VCO vs. Center Voltage, 18-9tuning, 20-2
Signal Generators, 6-15Tuning Constant, 6-11
entering Parameters, 7-73, 7-98, 9-3, 11-5, 11-20, 13-3, 14-2,14-6
estimating, 7-73, 7-98, 9-3, 11-5, 11-20, 13-3, 14-2, 14-6tuning constant
estimating, 6-11
Agilent Technologies E5500 Phase Noise Measurement System -iii
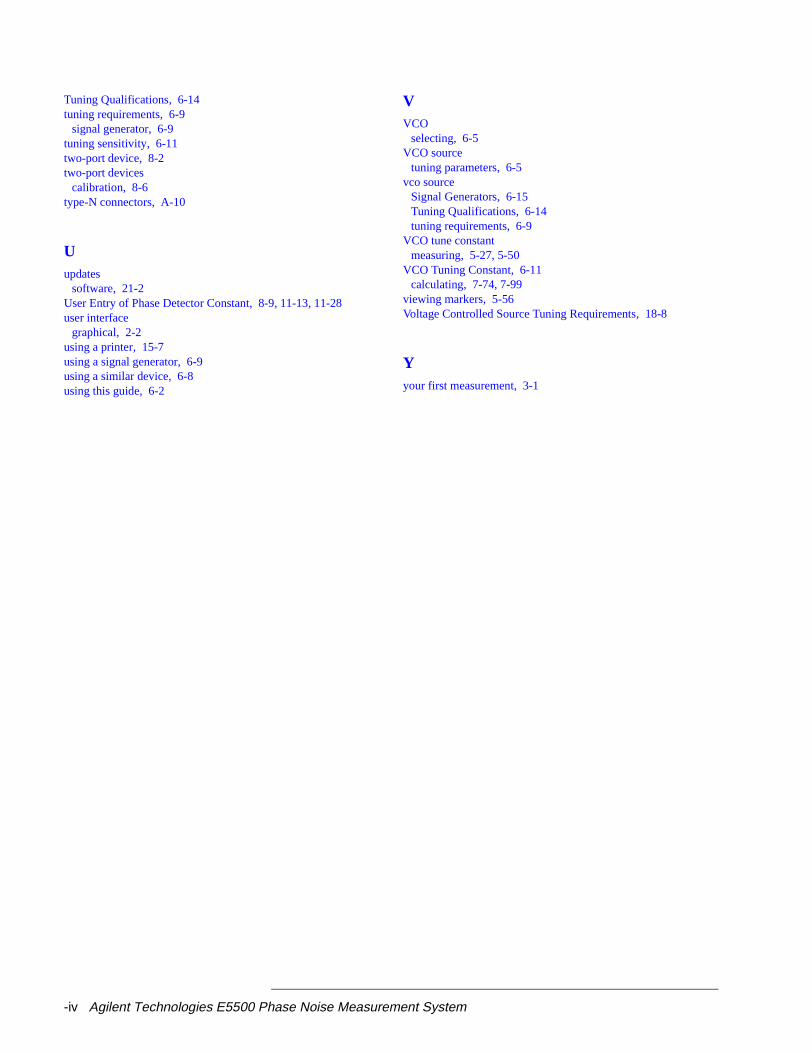
Tuning Qualifications, 6-14tuning requirements, 6-9
signal generator, 6-9tuning sensitivity, 6-11two-port device, 8-2two-port devices
calibration, 8-6type-N connectors, A-10
Uupdates
software, 21-2User Entry of Phase Detector Constant, 8-9, 11-13, 11-28user interface
graphical, 2-2using a printer, 15-7using a signal generator, 6-9using a similar device, 6-8using this guide, 6-2
VVCO
selecting, 6-5VCO source
tuning parameters, 6-5vco source
Signal Generators, 6-15Tuning Qualifications, 6-14tuning requirements, 6-9
VCO tune constantmeasuring, 5-27, 5-50
VCO Tuning Constant, 6-11calculating, 7-74, 7-99
viewing markers, 5-56Voltage Controlled Source Tuning Requirements, 18-8
Yyour first measurement, 3-1
-iv Agilent Technologies E5500 Phase Noise Measurement System