agilent’s gc/ms & gc/ms/ms analyzers for environmental labs · pdf...
TRANSCRIPT

Agilent’s GC/MS & GC/MS/MS Analyzers for Environmental Labs
Philip L. Wylie, Ph.D.
Agilent Technologies
Wilmington, DE
Users Meeting: Tucson March 2014
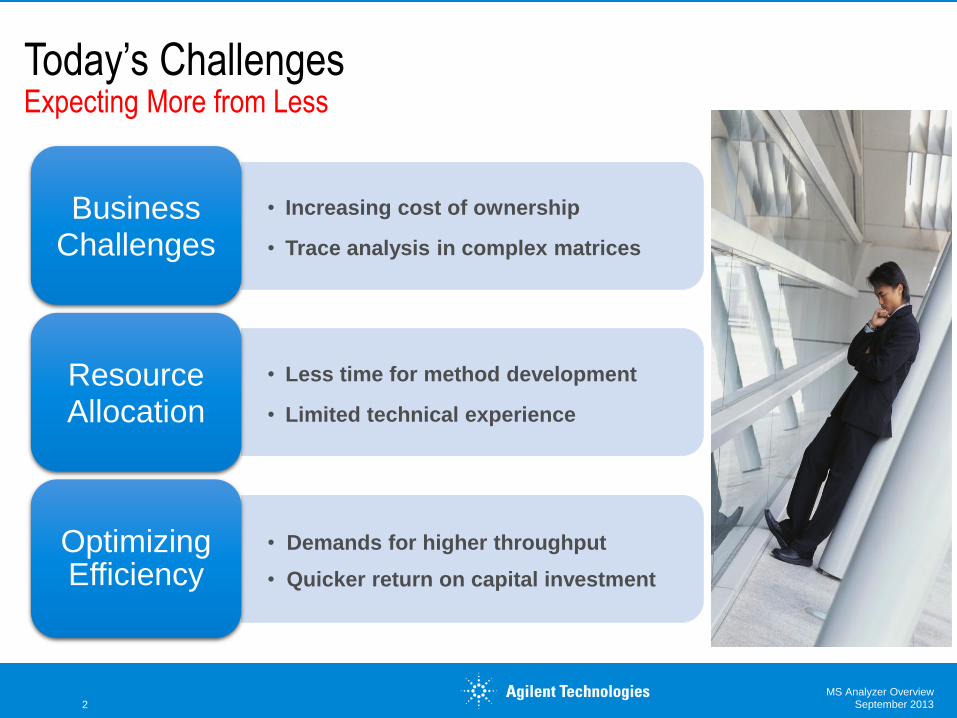
Today’s Challenges Expecting More from Less
• Increasing cost of ownership
• Trace analysis in complex matrices
Business Challenges
• Less time for method development
• Limited technical experience
Resource Allocation
• Demands for higher throughput
• Quicker return on capital investment
Optimizing Efficiency
2 September 2013 MS Analyzer Overview
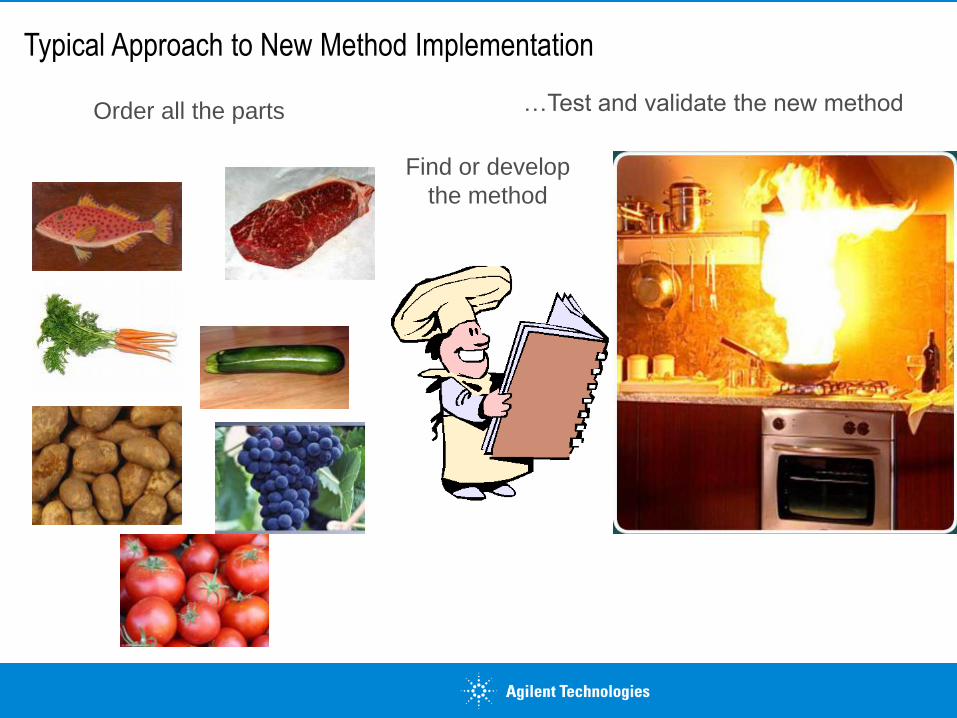
Typical Approach to New Method Implementation
Order all the parts
…Test and validate the new method
Find or develop
the method
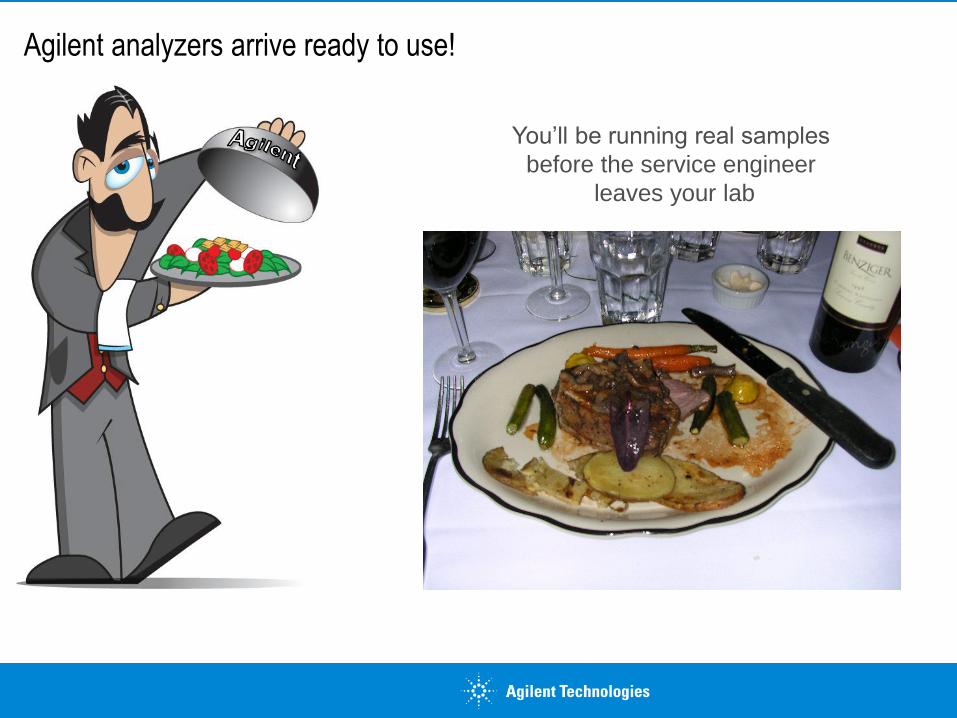
Agilent analyzers arrive ready to use!
You’ll be running real samples
before the service engineer
leaves your lab
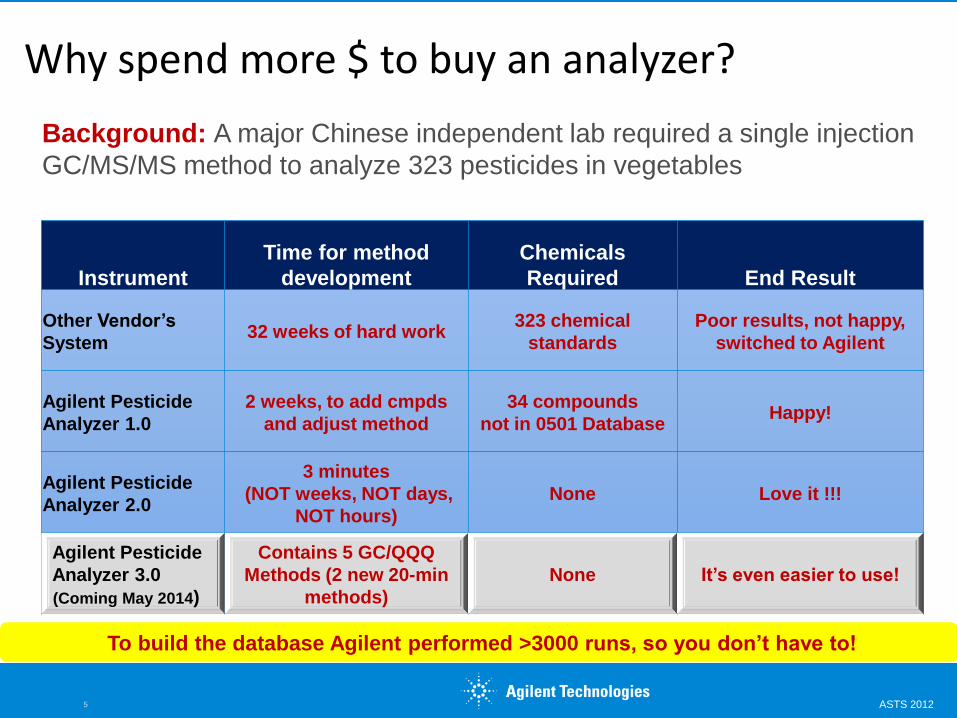
Why spend more $ to buy an analyzer?
Background: A major Chinese independent lab required a single injection
GC/MS/MS method to analyze 323 pesticides in vegetables
Instrument
Time for method
development
Chemicals
Required End Result
Other Vendor’s
System 32 weeks of hard work
323 chemical
standards
Poor results, not happy,
switched to Agilent
Agilent Pesticide
Analyzer 1.0
2 weeks, to add cmpds
and adjust method
34 compounds
not in 0501 Database Happy!
Agilent Pesticide
Analyzer 2.0
3 minutes
(NOT weeks, NOT days,
NOT hours)
None Love it !!!
Agilent Pesticide
Analyzer 3.0
(Coming May 2014)
Contains 5 GC/QQQ
Methods (2 new 20-min
methods)
None It’s even easier to use!
To build the database Agilent performed >3000 runs, so you don’t have to!
5 ASTS 2012
App. optimized
consumables
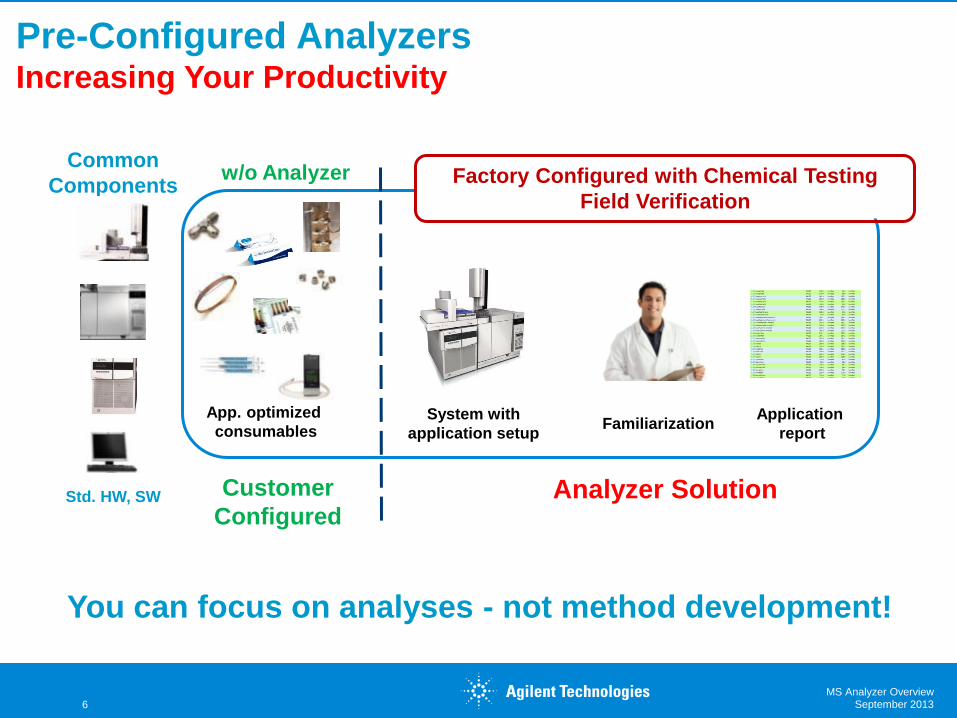
Pre-Configured Analyzers Increasing Your Productivity
Application
report
System with
application setup
w/o Analyzer
Familiarization
Common
Components Factory Configured with Chemical Testing
Field Verification
Std. HW, SW Customer
Configured Analyzer Solution
You can focus on analyses - not method development!
6 September 2013 MS Analyzer Overview
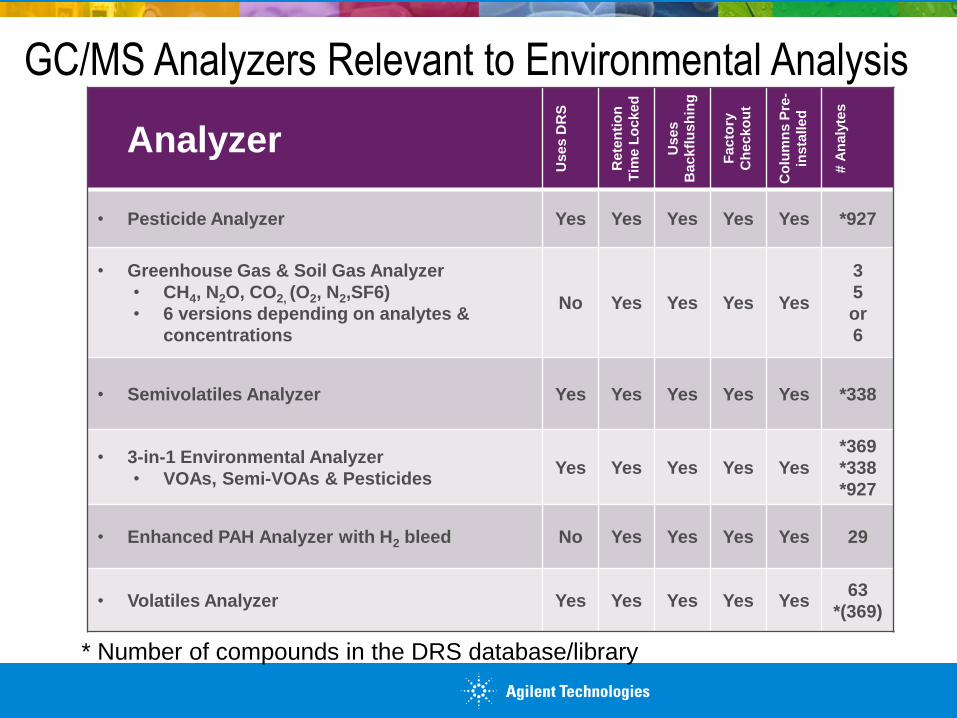
GC/MS Analyzers Relevant to Environmental Analysis
Analyzer
Us
es
DR
S
Re
ten
tio
n
Tim
e L
oc
ke
d
Us
es
Ba
ck
flu
sh
ing
Fa
cto
ry
Ch
ec
ko
ut
Co
lum
ns
Pre
-
ins
talle
d
# A
na
lyte
s
• Pesticide Analyzer Yes Yes Yes Yes Yes *927
• Greenhouse Gas & Soil Gas Analyzer
• CH4, N2O, CO2, (O2, N2,SF6)
• 6 versions depending on analytes &
concentrations
No Yes Yes Yes Yes
3
5
or
6
• Semivolatiles Analyzer Yes Yes Yes Yes Yes *338
• 3-in-1 Environmental Analyzer
• VOAs, Semi-VOAs & Pesticides Yes Yes Yes Yes Yes
*369
*338
*927
• Enhanced PAH Analyzer with H2 bleed No Yes Yes Yes Yes 29
• Volatiles Analyzer Yes Yes Yes Yes Yes 63
*(369)
* Number of compounds in the DRS database/library
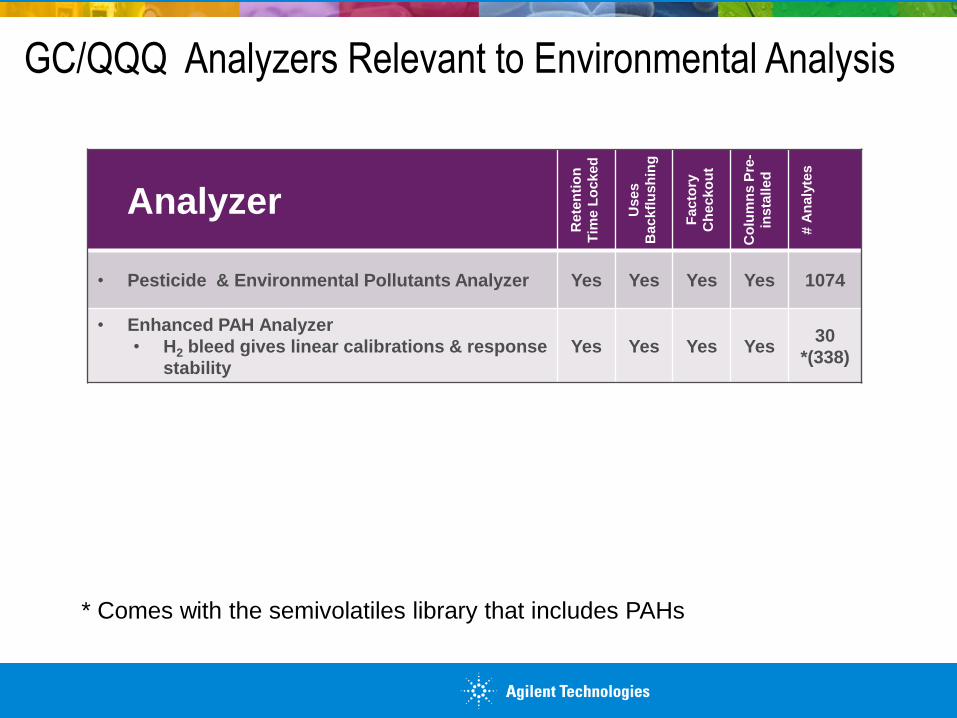
GC/QQQ Analyzers Relevant to Environmental Analysis
Analyzer
Rete
nti
on
Tim
e L
oc
ke
d
Us
es
Ba
ck
flu
sh
ing
Fa
cto
ry
Ch
ec
ko
ut
Co
lum
ns P
re-
ins
talle
d
# A
na
lyte
s
• Pesticide & Environmental Pollutants Analyzer Yes Yes Yes Yes 1074
• Enhanced PAH Analyzer
• H2 bleed gives linear calibrations & response
stability
Yes Yes Yes Yes 30
*(338)
* Comes with the semivolatiles library that includes PAHs
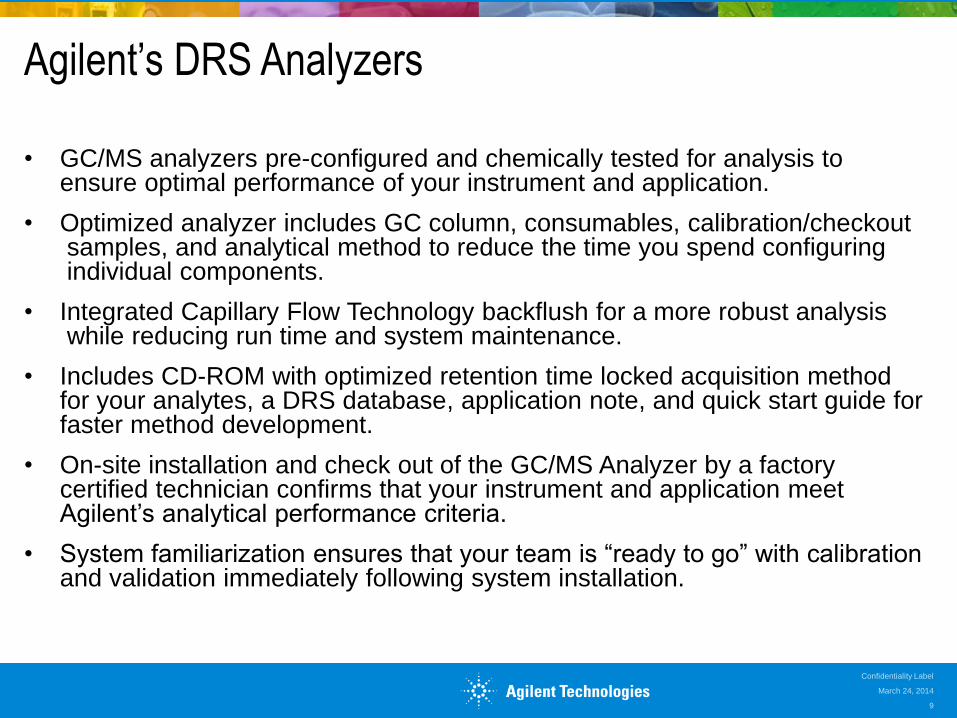
Agilent’s DRS Analyzers
• GC/MS analyzers pre-configured and chemically tested for analysis to ensure optimal performance of your instrument and application.
• Optimized analyzer includes GC column, consumables, calibration/checkout samples, and analytical method to reduce the time you spend configuring individual components.
• Integrated Capillary Flow Technology backflush for a more robust analysis while reducing run time and system maintenance.
• Includes CD-ROM with optimized retention time locked acquisition method for your analytes, a DRS database, application note, and quick start guide for faster method development.
• On-site installation and check out of the GC/MS Analyzer by a factory certified technician confirms that your instrument and application meet Agilent’s analytical performance criteria.
• System familiarization ensures that your team is “ready to go” with calibration and validation immediately following system installation.
March 24, 2014
Confidentiality Label
9
Let’s Focus on Three Analyzers
March 24, 2014
Confidentiality Label
10
DRS Pesticides Analyzer (GC/MS)
Enhanced PAH Analyzer (GC/MS/MS)
Pesticides and Environmental Pollutants Analyzer (GC/MS/MS)
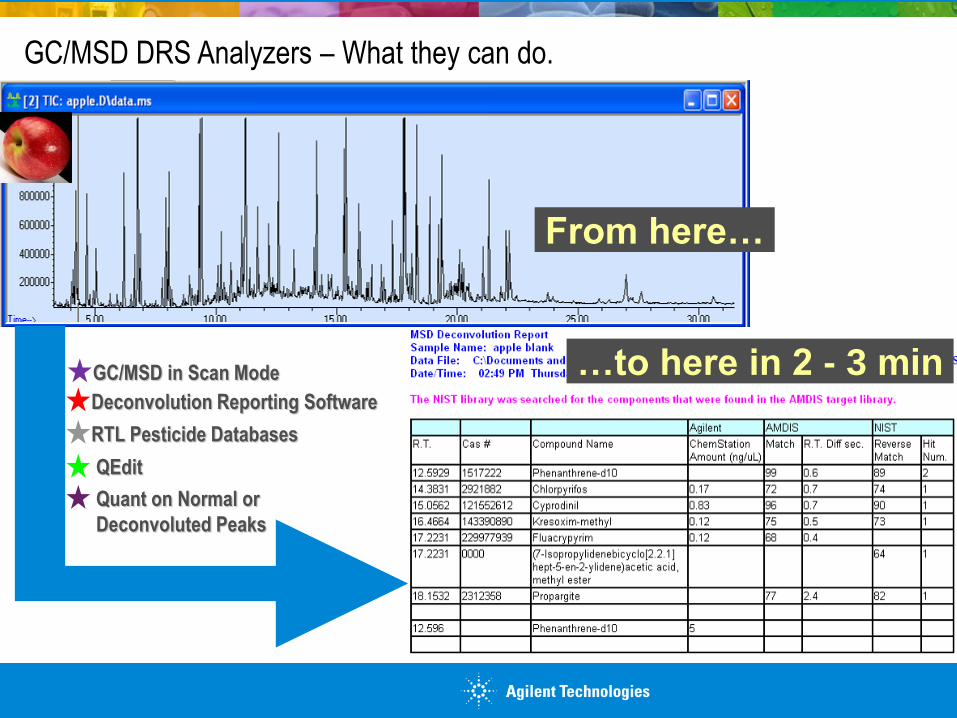
GC/MSD DRS Analyzers – What they can do.
From here…
…to here in 2 - 3 min
RTL Pesticide Databases
Deconvolution Reporting Software
QEdit
Quant on Normal or
Deconvoluted Peaks
GC/MSD in Scan Mode
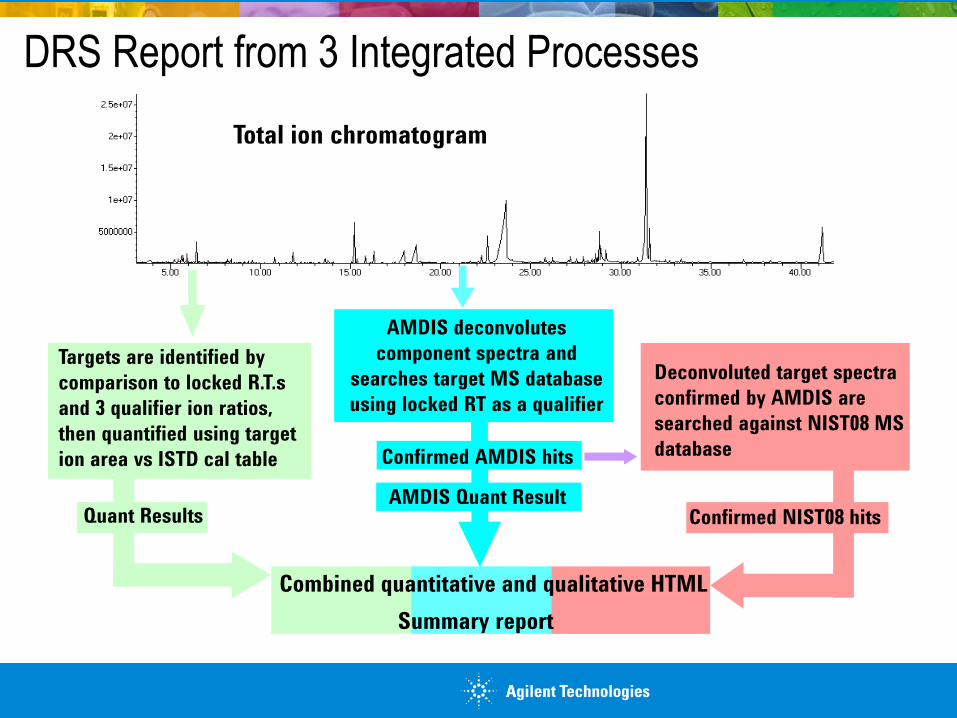
DRS Report from 3 Integrated Processes
Total ion chromatogram
Combined quantitative and qualitative HTML
Summary report
Quant Results
Targets are identified by
comparison to locked R.T.s
and 3 qualifier ion ratios,
then quantified using target
ion area vs ISTD cal table
Deconvoluted target spectra
confirmed by AMDIS are
searched against NIST08 MS
database
Confirmed NIST08 hits
AMDIS deconvolutes
component spectra and
searches target MS database
using locked RT as a qualifier
Confirmed AMDIS hits
AMDIS Quant Result
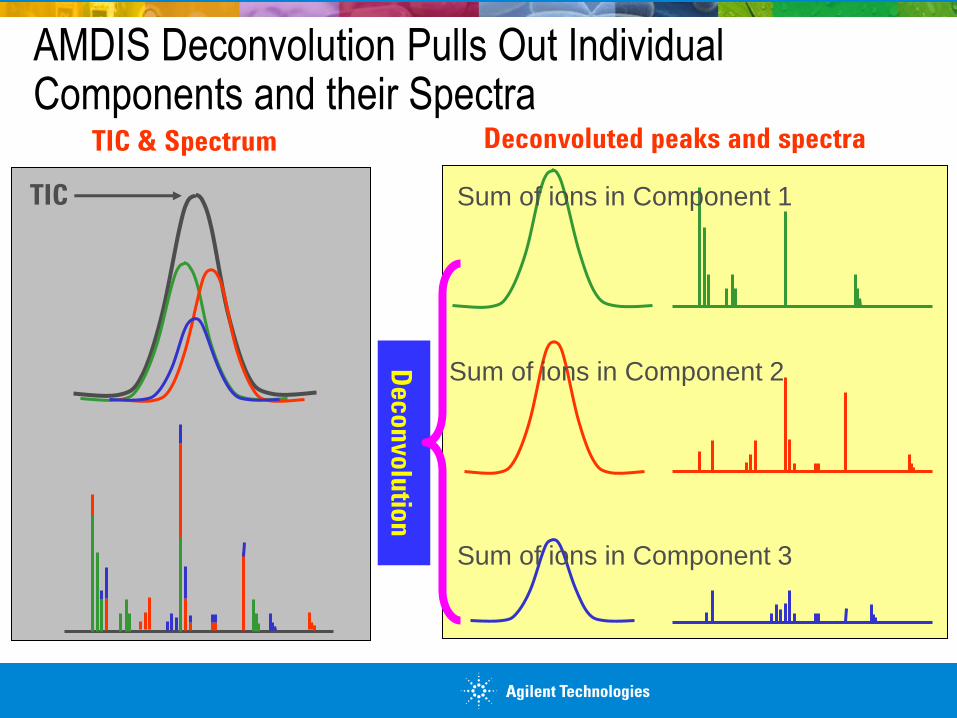
AMDIS Deconvolution Pulls Out Individual Components and their Spectra
TIC & Spectrum
TIC Sum of ions in Component 1
Sum of ions in Component 3
Sum of ions in Component 2 Decon
volu
tion
Deconvoluted peaks and spectra
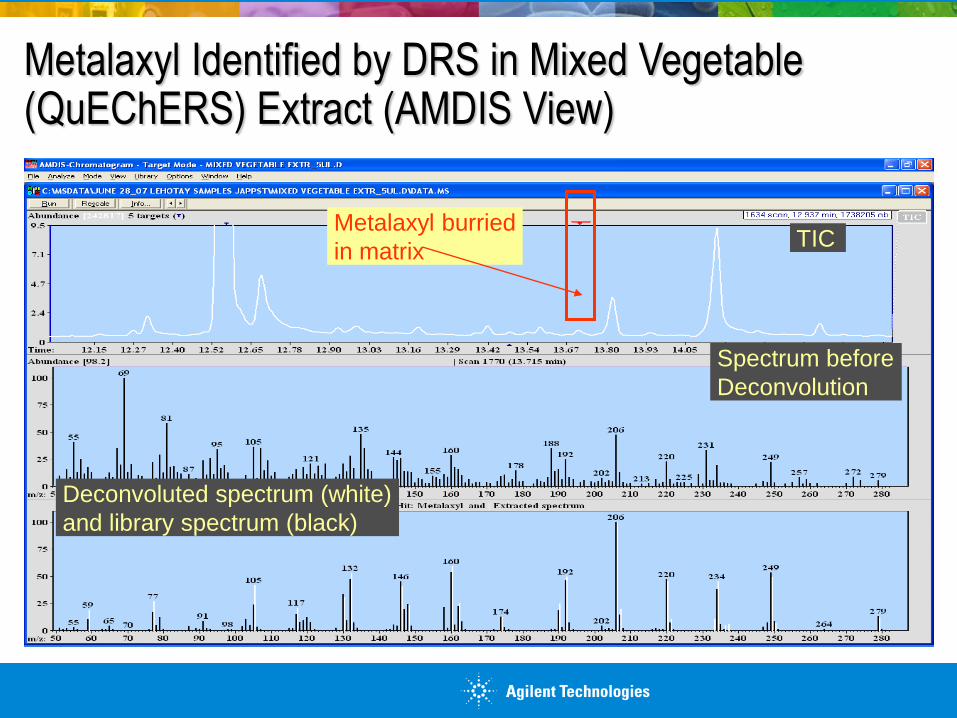
Metalaxyl Identified by DRS in Mixed Vegetable (QuEChERS) Extract (AMDIS View)
TIC
Spectrum before
Deconvolution
Deconvoluted spectrum (white)
and library spectrum (black)
Metalaxyl burried
in matrix
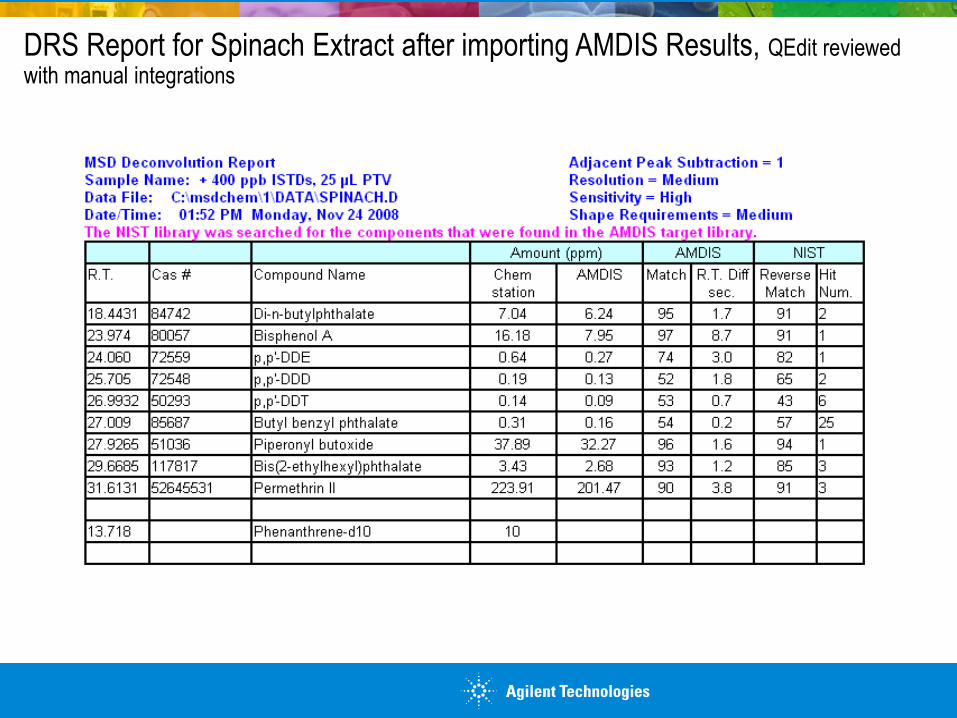
DRS Report for Spinach Extract after importing AMDIS Results, QEdit reviewed with manual integrations
5.00 10.00 15.00 20.00 25.00 30.00 35.00 40.00
5.00 10.00 15.00 20.00 25.00 30.00 35.00 40.00
5.00 10.00 15.00 20.00 25.00 30.00 35.00 40.00
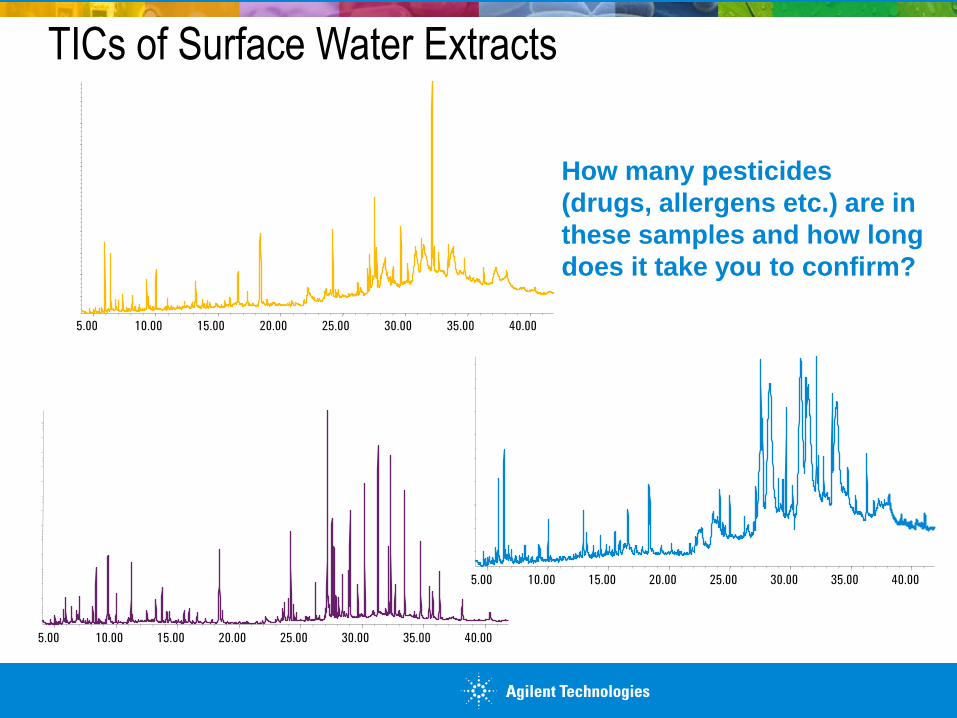
TICs of Surface Water Extracts
How many pesticides
(drugs, allergens etc.) are in
these samples and how long
does it take you to confirm?
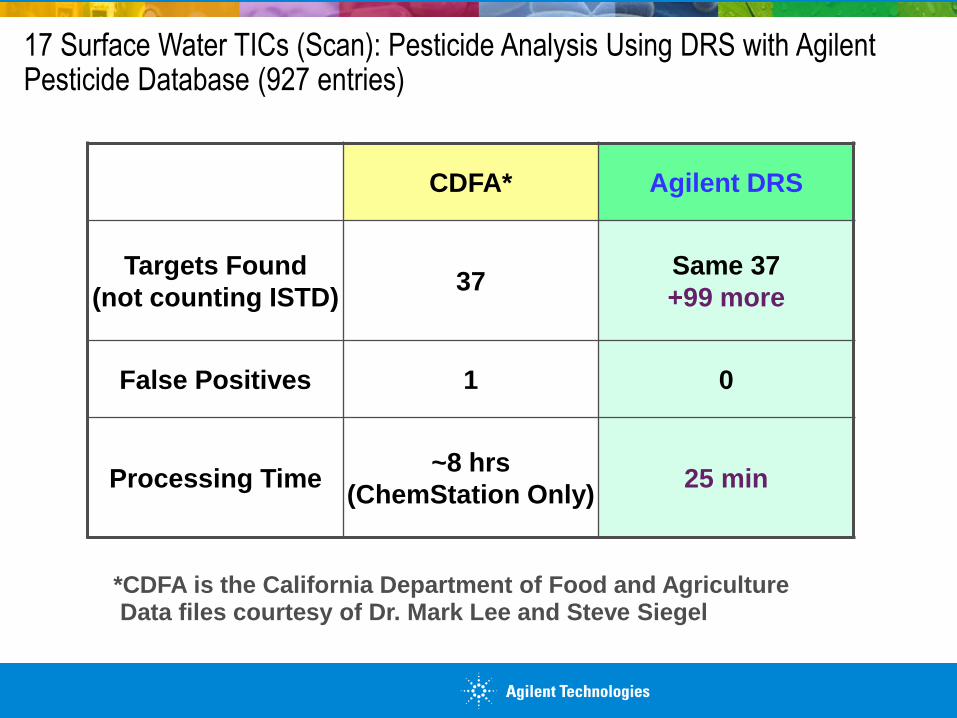
17 Surface Water TICs (Scan): Pesticide Analysis Using DRS with Agilent Pesticide Database (927 entries)
*CDFA is the California Department of Food and Agriculture Data files courtesy of Dr. Mark Lee and Steve Siegel
CDFA* Agilent DRS
Targets Found
(not counting ISTD) 37
Same 37
+99 more
False Positives 1 0
Processing Time ~8 hrs
(ChemStation Only) 25 min
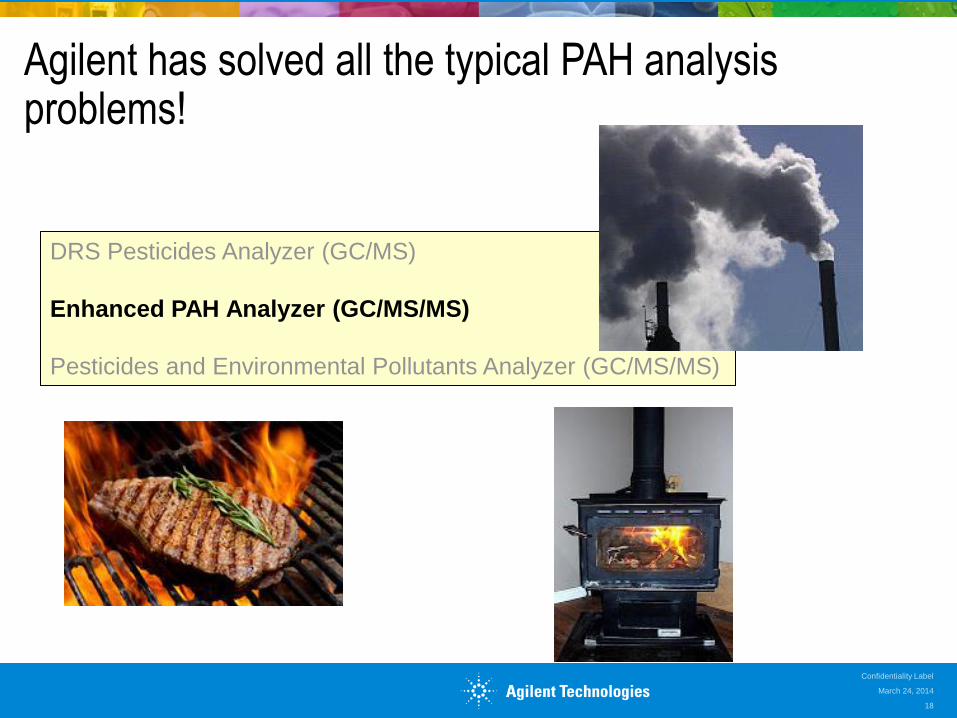
Agilent has solved all the typical PAH analysis problems!
March 24, 2014
Confidentiality Label
18
DRS Pesticides Analyzer (GC/MS)
Enhanced PAH Analyzer (GC/MS/MS)
Pesticides and Environmental Pollutants Analyzer (GC/MS/MS)
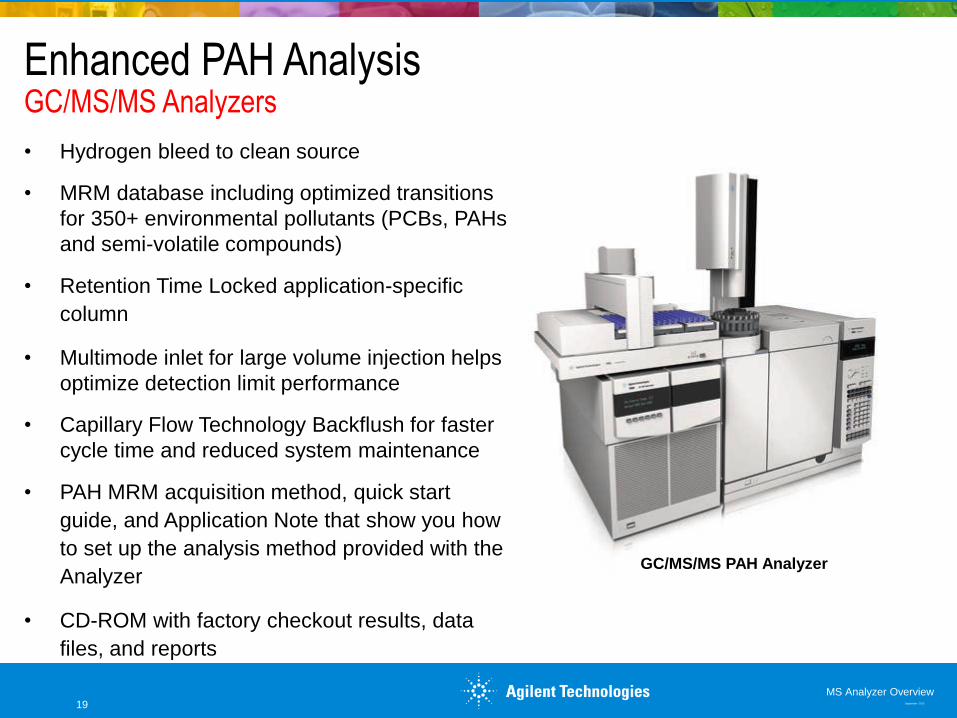
Enhanced PAH Analysis GC/MS/MS Analyzers
• Hydrogen bleed to clean source
• MRM database including optimized transitions
for 350+ environmental pollutants (PCBs, PAHs
and semi-volatile compounds)
• Retention Time Locked application-specific
column
• Multimode inlet for large volume injection helps
optimize detection limit performance
• Capillary Flow Technology Backflush for faster
cycle time and reduced system maintenance
• PAH MRM acquisition method, quick start
guide, and Application Note that show you how
to set up the analysis method provided with the
Analyzer
• CD-ROM with factory checkout results, data
files, and reports
GC/MS/MS PAH Analyzer
19 September 2013
MS Analyzer Overview
PAH Analysis
March 24, 2014 Confidentiality Label
20
4.00 6.00 8.00 10.00 12.00 14.00 16.00
4
3 5,6,7
9
10
12
11
13
14
1,2
17 18
20 21
22,23
25,26,27
2
4
28,29
31
32,33
15,16 30
34
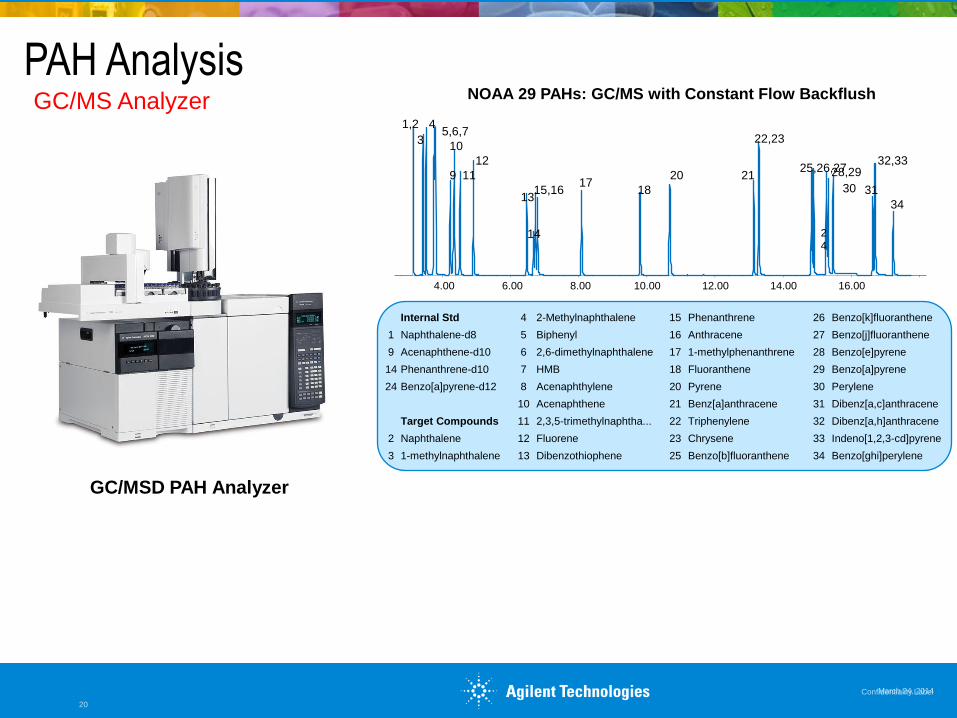
Internal Std 4 2-Methylnaphthalene 15 Phenanthrene 26 Benzo[k]fluoranthene
1 Naphthalene-d8 5 Biphenyl 16 Anthracene 27 Benzo[j]fluoranthene
9 Acenaphthene-d10 6 2,6-dimethylnaphthalene 17 1-methylphenanthrene 28 Benzo[e]pyrene
14 Phenanthrene-d10 7 HMB 18 Fluoranthene 29 Benzo[a]pyrene
24 Benzo[a]pyrene-d12 8 Acenaphthylene 20 Pyrene 30 Perylene
10 Acenaphthene 21 Benz[a]anthracene 31 Dibenz[a,c]anthracene
Target Compounds 11 2,3,5-trimethylnaphtha... 22 Triphenylene 32 Dibenz[a,h]anthracene
2 Naphthalene 12 Fluorene 23 Chrysene 33 Indeno[1,2,3-cd]pyrene
3 1-methylnaphthalene 13 Dibenzothiophene 25 Benzo[b]fluoranthene 34 Benzo[ghi]perylene
NOAA 29 PAHs: GC/MS with Constant Flow Backflush GC/MS Analyzer
GC/MSD PAH Analyzer
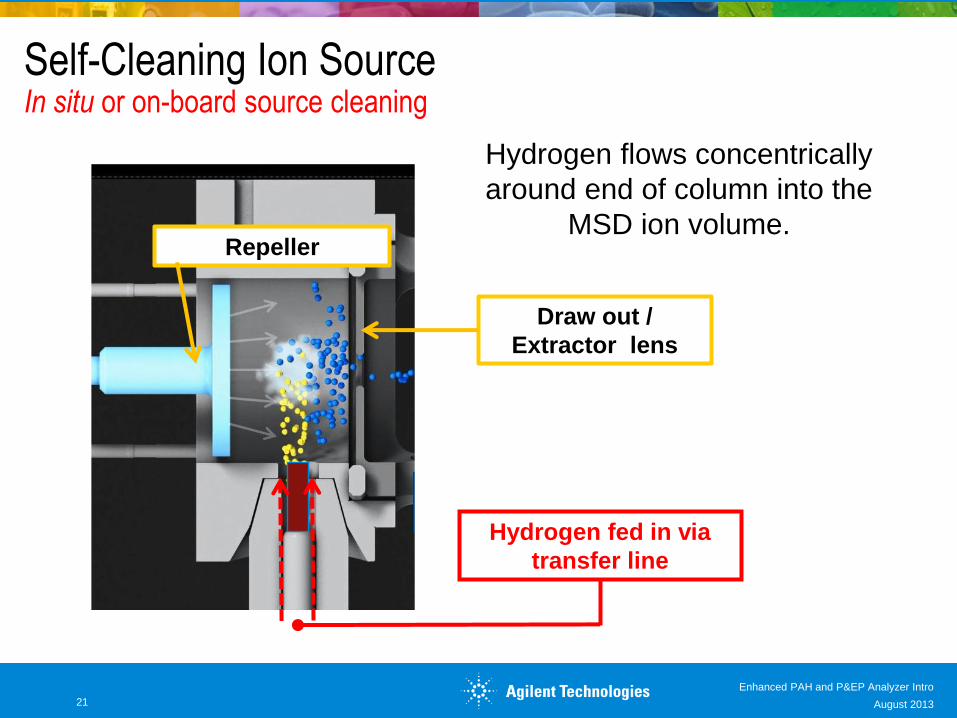
Self-Cleaning Ion Source In situ or on-board source cleaning
Hydrogen fed in via
transfer line
Hydrogen flows concentrically
around end of column into the
MSD ion volume. Repeller
Draw out /
Extractor lens
Enhanced PAH and P&EP Analyzer Intro
21 August 2013
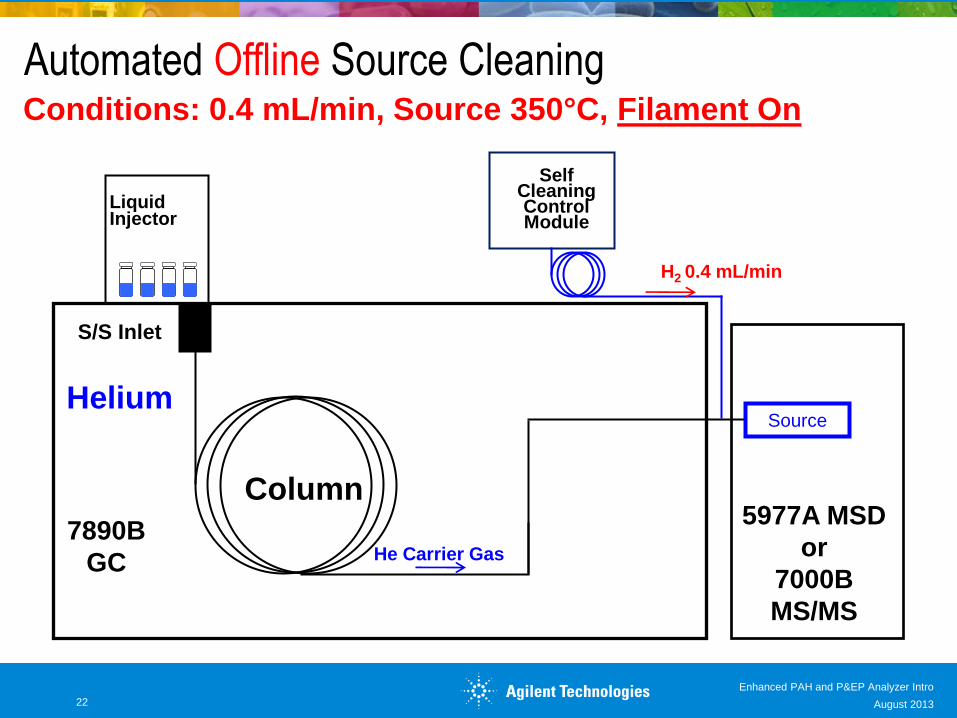
Automated Offline Source Cleaning
7890B
GC
Conditions: 0.4 mL/min, Source 350°C, Filament On
Liquid Injector
Column 5977A MSD
or
7000B
MS/MS
S/S Inlet
Helium
Self Cleaning Control Module
He Carrier Gas
H2 0.4 mL/min
Source
Enhanced PAH and P&EP Analyzer Intro
22 August 2013
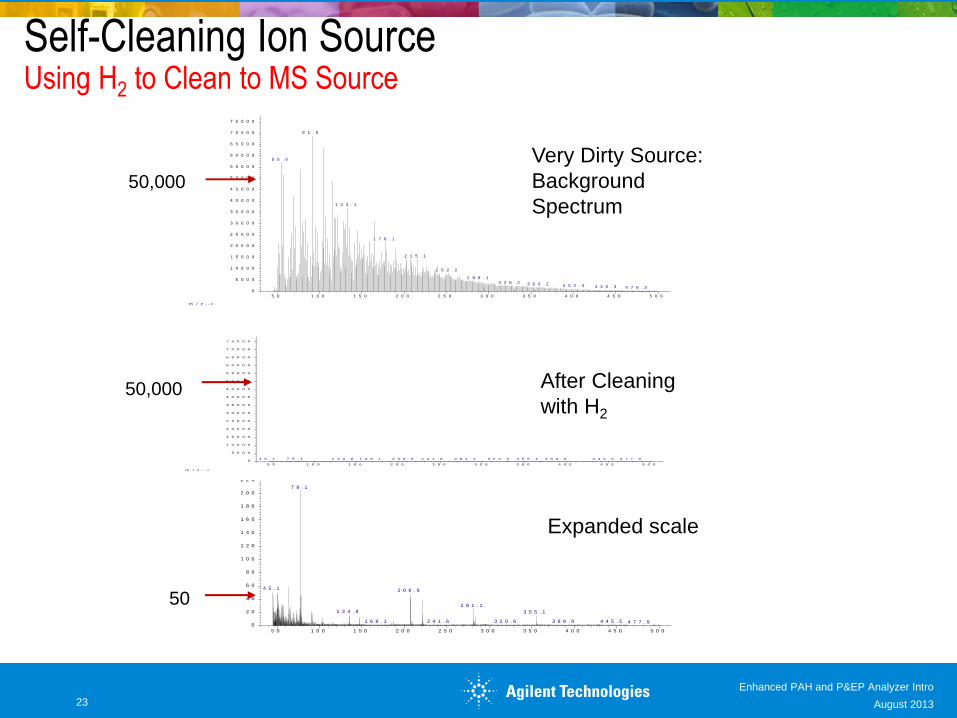
Self-Cleaning Ion Source Using H2 to Clean to MS Source
5 0 1 0 0 1 5 0 2 0 0 2 5 0 3 0 0 3 5 0 4 0 0 4 5 0 5 0 0
0
5 0 0 0
1 0 0 0 0
1 5 0 0 0
2 0 0 0 0
2 5 0 0 0
3 0 0 0 0
3 5 0 0 0
4 0 0 0 0
4 5 0 0 0
5 0 0 0 0
5 5 0 0 0
6 0 0 0 0
6 5 0 0 0
7 0 0 0 0
7 5 0 0 0
m / z - - >
A b u n d a n c e
A v e r a g e o f 1 . 9 6 9 t o 1 0 . 0 4 6 m i n . : E I - b a c k g r d - r e p 0 . D \ d a t a . m s
9 1 . 0
5 5 . 0
1 3 3 . 1
1 7 8 . 1
2 1 5 . 1
2 5 2 . 2
2 8 9 . 1
3 2 6 . 2 3 6 0 . 2 4 0 2 . 3 4 4 0 . 3 4 7 6 . 3
Very Dirty Source:
Background
Spectrum
50,000
5 0 1 0 0 1 5 0 2 0 0 2 5 0 3 0 0 3 5 0 4 0 0 4 5 0 5 0 0
0
5 0 0 0
1 0 0 0 0
1 5 0 0 0
2 0 0 0 0
2 5 0 0 0
3 0 0 0 0
3 5 0 0 0
4 0 0 0 0
4 5 0 0 0
5 0 0 0 0
5 5 0 0 0
6 0 0 0 0
6 5 0 0 0
7 0 0 0 0
7 5 0 0 0
m / z - - >
A b u n d a n c e
A v e r a g e o f 1 0 0 . 0 0 9 t o 1 1 0 . 0 2 7 m i n . : E I - b a c k g r d - r e p 3 . D \ d a t a . m s
7 8 . 14 5 . 1 2 0 6 . 9 2 8 1 . 11 3 4 . 9 3 5 5 . 1 4 4 5 . 52 4 1 . 61 6 8 . 1 3 2 0 . 6 3 8 8 . 9 4 7 7 . 9
After Cleaning
with H2
50,000
5 0 1 0 0 1 5 0 2 0 0 2 5 0 3 0 0 3 5 0 4 0 0 4 5 0 5 0 0
0
2 0
4 0
6 0
8 0
1 0 0
1 2 0
1 4 0
1 6 0
1 8 0
2 0 0
2 2 0
2 4 0
m / z - - >
A b u n d a n c e
A v e r a g e o f 1 0 0 . 0 0 9 t o 1 1 0 . 0 2 7 m in . : E I - b a c k g r d - r e p 3 . D \ d a t a . m s
7 8 . 1
4 5 . 1 2 0 6 . 9
2 8 1 . 1
1 3 4 . 9 3 5 5 . 1
4 4 5 . 52 4 1 . 61 6 8 . 1 3 2 0 . 6 3 8 8 . 9 4 7 7 . 9
Expanded scale
50
Enhanced PAH and P&EP Analyzer Intro
23 August 2013
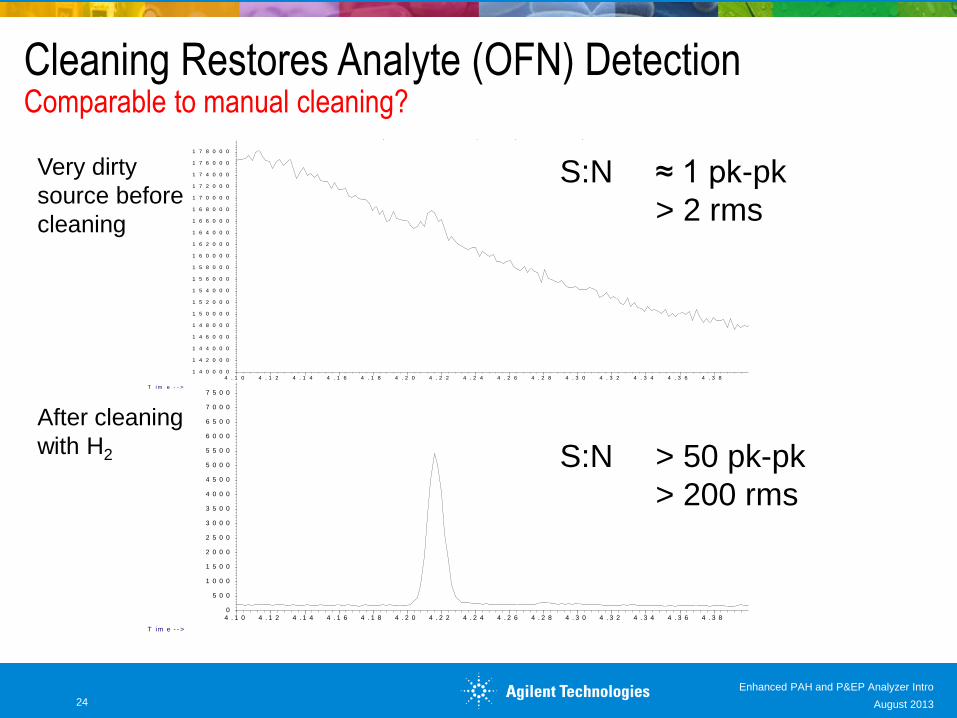
Cleaning Restores Analyte (OFN) Detection Comparable to manual cleaning?
4 . 1 0 4 . 1 2 4 . 1 4 4 . 1 6 4 . 1 8 4 . 2 0 4 . 2 2 4 . 2 4 4 . 2 6 4 . 2 8 4 . 3 0 4 . 3 2 4 . 3 4 4 . 3 6 4 . 3 8
1 4 0 0 0 0
1 4 2 0 0 0
1 4 4 0 0 0
1 4 6 0 0 0
1 4 8 0 0 0
1 5 0 0 0 0
1 5 2 0 0 0
1 5 4 0 0 0
1 5 6 0 0 0
1 5 8 0 0 0
1 6 0 0 0 0
1 6 2 0 0 0
1 6 4 0 0 0
1 6 6 0 0 0
1 6 8 0 0 0
1 7 0 0 0 0
1 7 2 0 0 0
1 7 4 0 0 0
1 7 6 0 0 0
1 7 8 0 0 0
T i m e - - >
A b u n d a n c e
I o n 2 4 1 . 0 0 ( 2 4 0 . 7 0 t o 2 4 1 . 7 0 ) : O F N - p r e c o n d - 0 - r e p 0 0 . D \ d a t a . m s
4 . 1 0 4 . 1 2 4 . 1 4 4 . 1 6 4 . 1 8 4 . 2 0 4 . 2 2 4 . 2 4 4 . 2 6 4 . 2 8 4 . 3 0 4 . 3 2 4 . 3 4 4 . 3 6 4 . 3 8
0
5 0 0
1 0 0 0
1 5 0 0
2 0 0 0
2 5 0 0
3 0 0 0
3 5 0 0
4 0 0 0
4 5 0 0
5 0 0 0
5 5 0 0
6 0 0 0
6 5 0 0
7 0 0 0
7 5 0 0
T im e - - >
A b u n d a n c e
T I C : O F N - p o s t c o n d - 1 - p r e t u n e - r e p 0 2 . D \ d a t a . m s
S:N > 50 pk-pk
> 200 rms
S:N ≈ 1 pk-pk
> 2 rms
Very dirty
source before
cleaning
After cleaning
with H2
Enhanced PAH and P&EP Analyzer Intro
24 August 2013
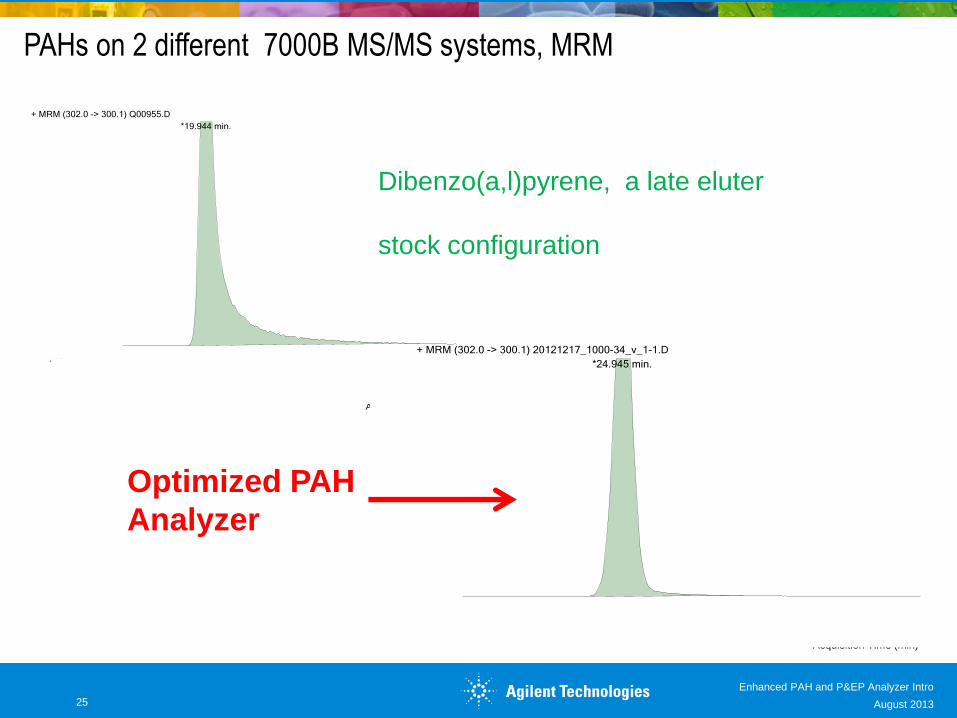
PAHs on 2 different 7000B MS/MS systems, MRM
Dibenzo(a,l)pyrene, a late eluter
stock configuration
Optimized PAH
Analyzer
Enhanced PAH and P&EP Analyzer Intro
25 August 2013
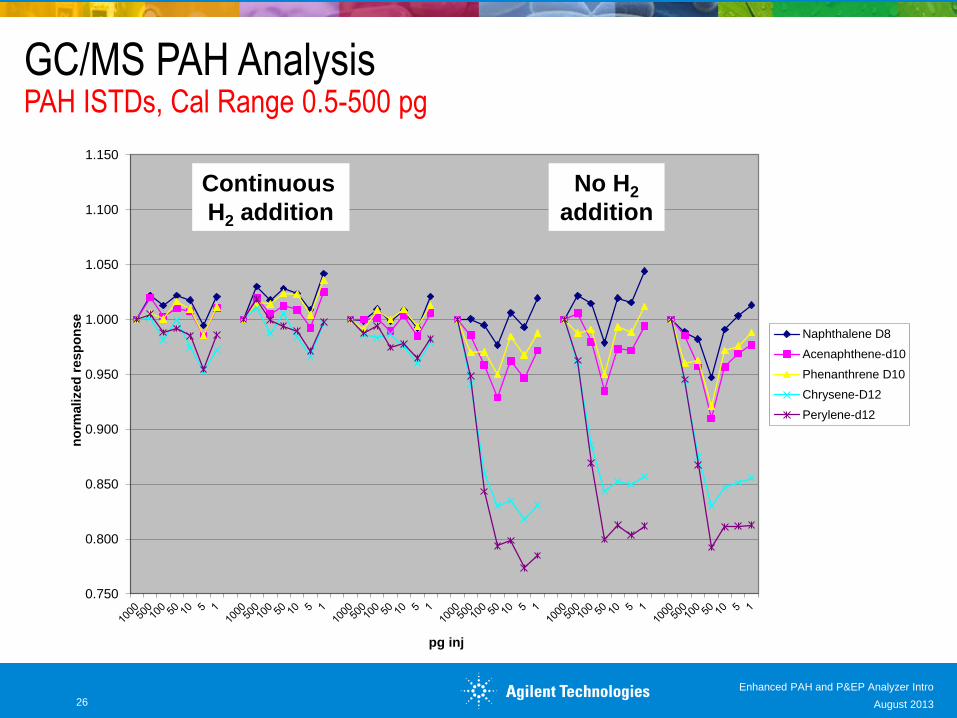
0.750
0.800
0.850
0.900
0.950
1.000
1.050
1.100
1.150
no
rmalized
resp
on
se
pg inj
30 Mix PAH ISTDs, 9 mm DO With 75 uL/min H2 on SQ
Naphthalene D8
Acenaphthene-d10
Phenanthrene D10
Chrysene-D12
Perylene-d12
Continuous
H2 addition
No H2
addition
GC/MS PAH Analysis PAH ISTDs, Cal Range 0.5-500 pg
Enhanced PAH and P&EP Analyzer Intro
26 August 2013
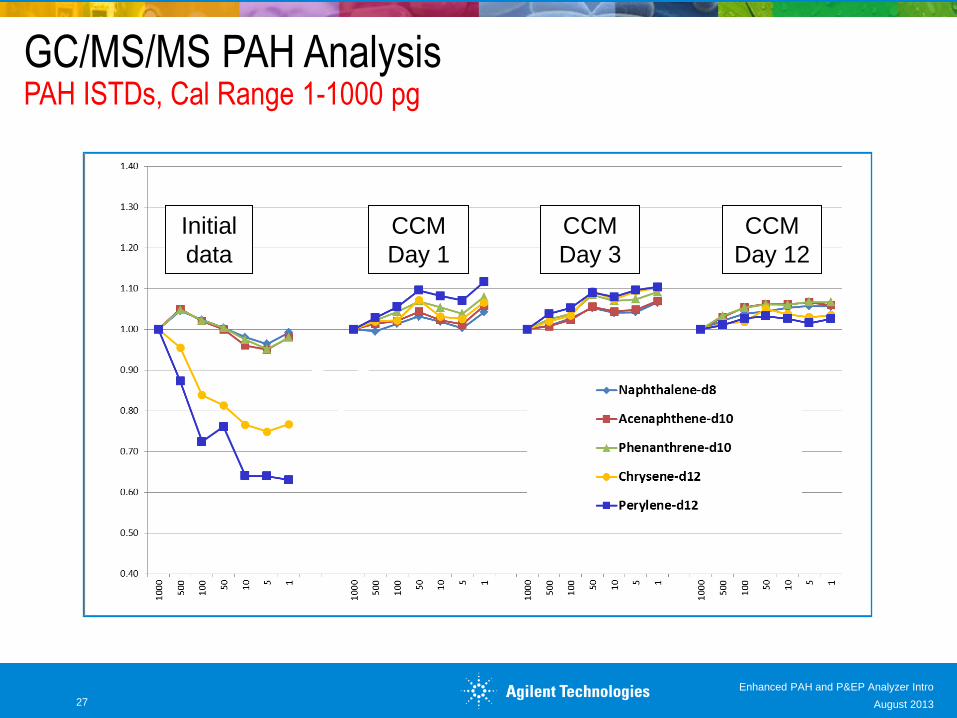
GC/MS/MS PAH Analysis PAH ISTDs, Cal Range 1-1000 pg
Initial
data
CCM
Day 1
CCM
Day 3
CCM
Day 12
Enhanced PAH and P&EP Analyzer Intro
27 August 2013
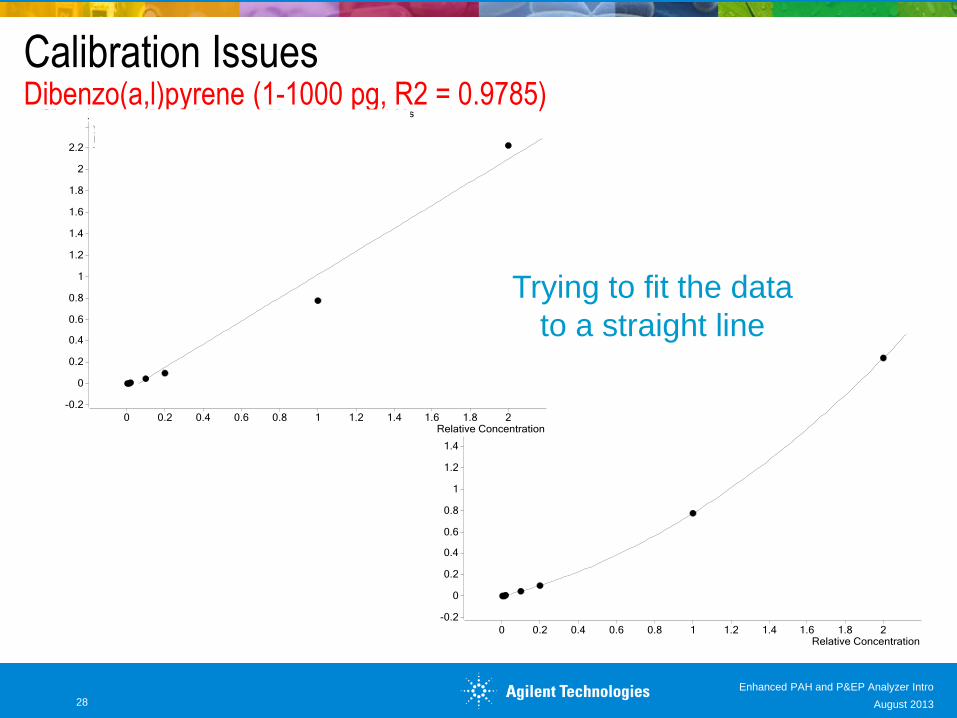
Calibration Issues Dibenzo(a,l)pyrene (1-1000 pg, R2 = 0.9785)
Trying to fit the data
to a straight line
Enhanced PAH and P&EP Analyzer Intro
28 August 2013
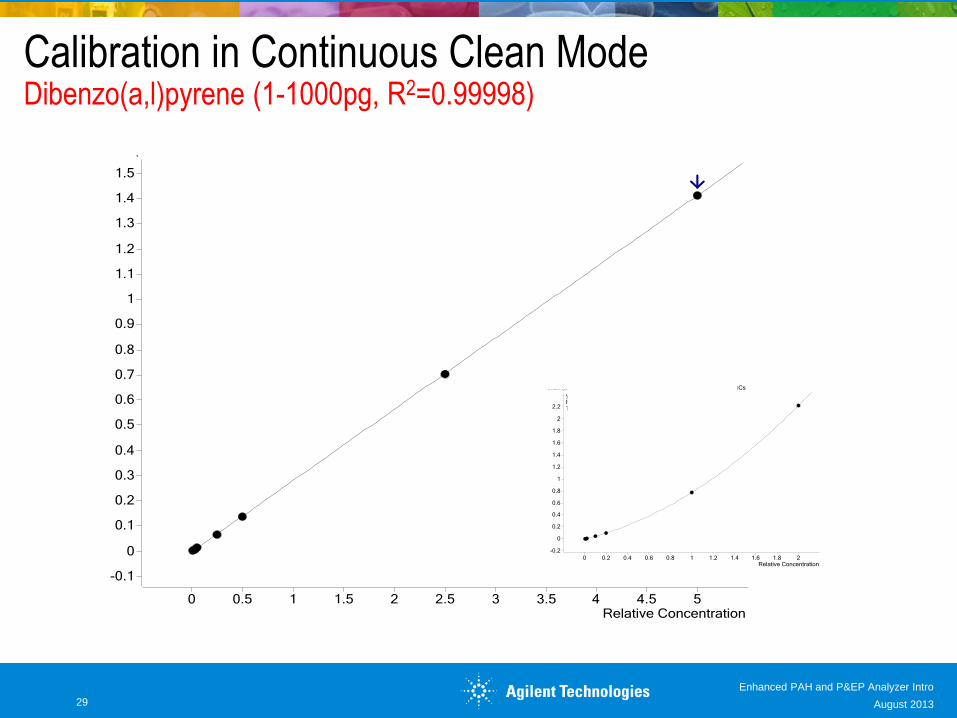
Calibration in Continuous Clean Mode Dibenzo(a,l)pyrene (1-1000pg, R2=0.99998)
Enhanced PAH and P&EP Analyzer Intro
29 August 2013
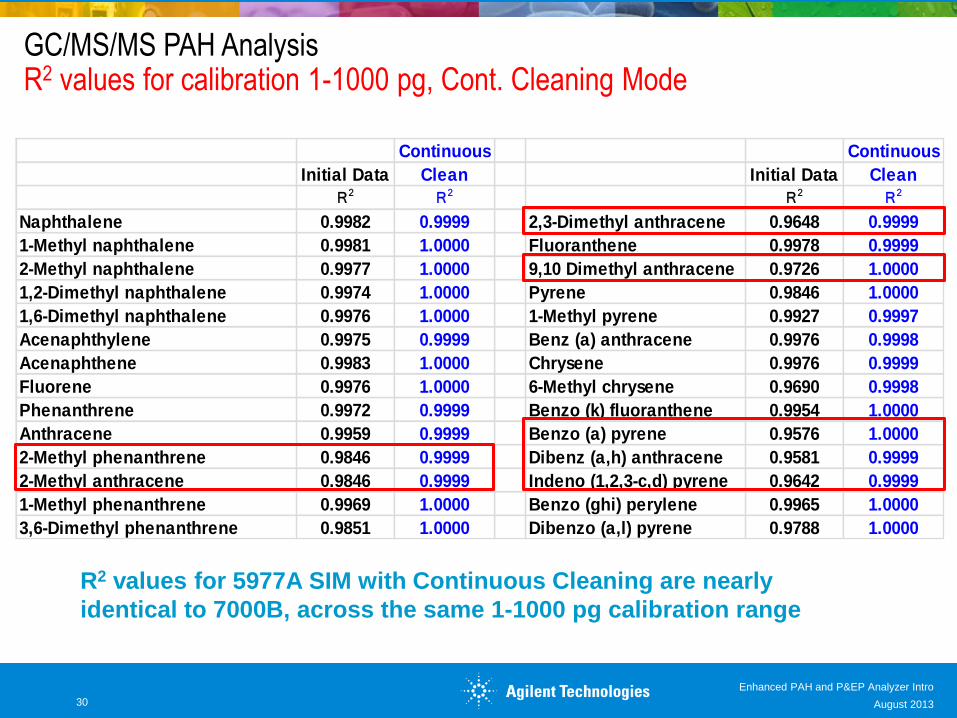
GC/MS/MS PAH Analysis R2 values for calibration 1-1000 pg, Cont. Cleaning Mode
R2 values for 5977A SIM with Continuous Cleaning are nearly
identical to 7000B, across the same 1-1000 pg calibration range
Continuous Continuous
Initial Data Clean Initial Data Clean
R2 R2 R2 R2
Naphthalene 0.9982 0.9999 2,3-Dimethyl anthracene 0.9648 0.9999
1-Methyl naphthalene 0.9981 1.0000 Fluoranthene 0.9978 0.9999
2-Methyl naphthalene 0.9977 1.0000 9,10 Dimethyl anthracene 0.9726 1.0000
1,2-Dimethyl naphthalene 0.9974 1.0000 Pyrene 0.9846 1.0000
1,6-Dimethyl naphthalene 0.9976 1.0000 1-Methyl pyrene 0.9927 0.9997
Acenaphthylene 0.9975 0.9999 Benz (a) anthracene 0.9976 0.9998
Acenaphthene 0.9983 1.0000 Chrysene 0.9976 0.9999
Fluorene 0.9976 1.0000 6-Methyl chrysene 0.9690 0.9998
Phenanthrene 0.9972 0.9999 Benzo (k) fluoranthene 0.9954 1.0000
Anthracene 0.9959 0.9999 Benzo (a) pyrene 0.9576 1.0000
2-Methyl phenanthrene 0.9846 0.9999 Dibenz (a,h) anthracene 0.9581 0.9999
2-Methyl anthracene 0.9846 0.9999 Indeno (1,2,3-c,d) pyrene 0.9642 0.9999
1-Methyl phenanthrene 0.9969 1.0000 Benzo (ghi) perylene 0.9965 1.0000
3,6-Dimethyl phenanthrene 0.9851 1.0000 Dibenzo (a,l) pyrene 0.9788 1.0000
Enhanced PAH and P&EP Analyzer Intro
30 August 2013
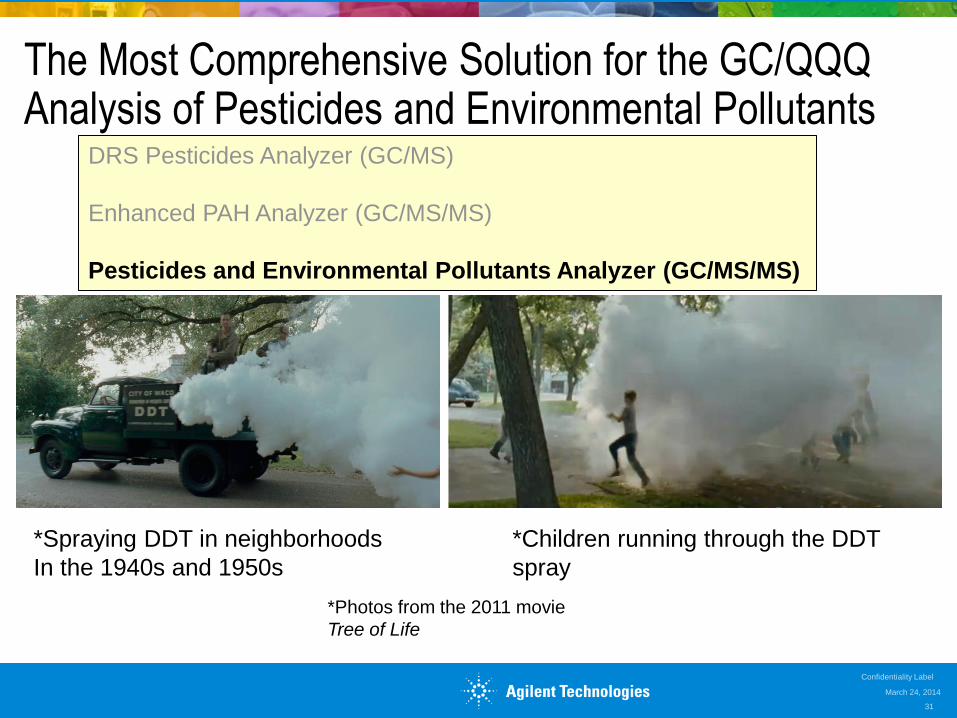
The Most Comprehensive Solution for the GC/QQQ Analysis of Pesticides and Environmental Pollutants
March 24, 2014
Confidentiality Label
31
DRS Pesticides Analyzer (GC/MS)
Enhanced PAH Analyzer (GC/MS/MS)
Pesticides and Environmental Pollutants Analyzer (GC/MS/MS)
*Spraying DDT in neighborhoods
In the 1940s and 1950s
*Children running through the DDT
spray
*Photos from the 2011 movie
Tree of Life
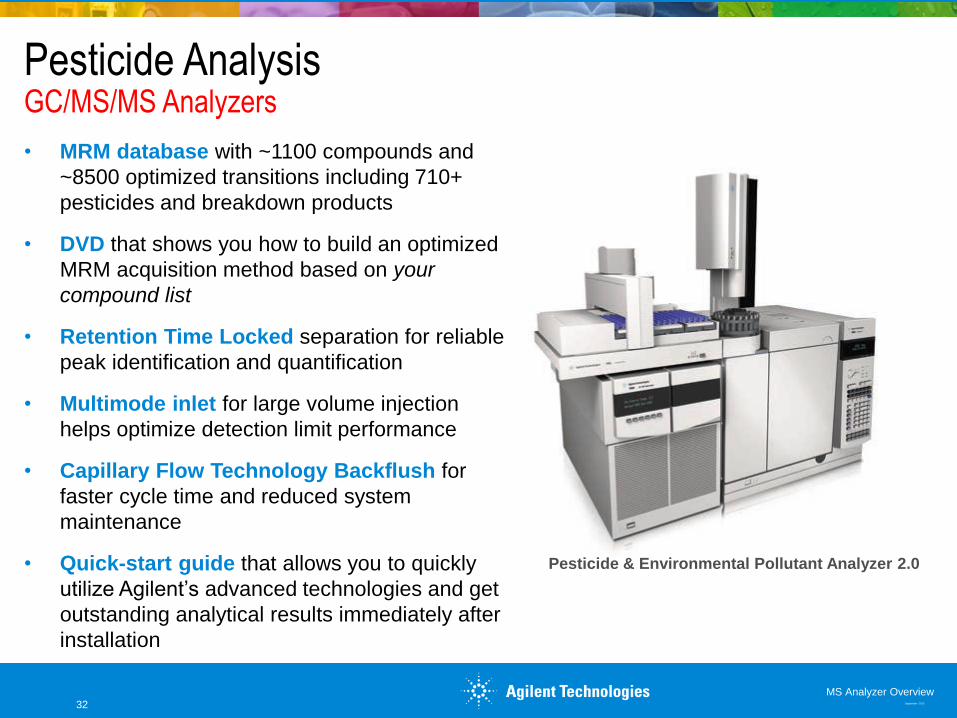
Pesticide Analysis GC/MS/MS Analyzers
Pesticide & Environmental Pollutant Analyzer 2.0
32 September 2013
MS Analyzer Overview
• MRM database with ~1100 compounds and
~8500 optimized transitions including 710+
pesticides and breakdown products
• DVD that shows you how to build an optimized
MRM acquisition method based on your
compound list
• Retention Time Locked separation for reliable
peak identification and quantification
• Multimode inlet for large volume injection
helps optimize detection limit performance
• Capillary Flow Technology Backflush for
faster cycle time and reduced system
maintenance
• Quick-start guide that allows you to quickly
utilize Agilent’s advanced technologies and get
outstanding analytical results immediately after
installation
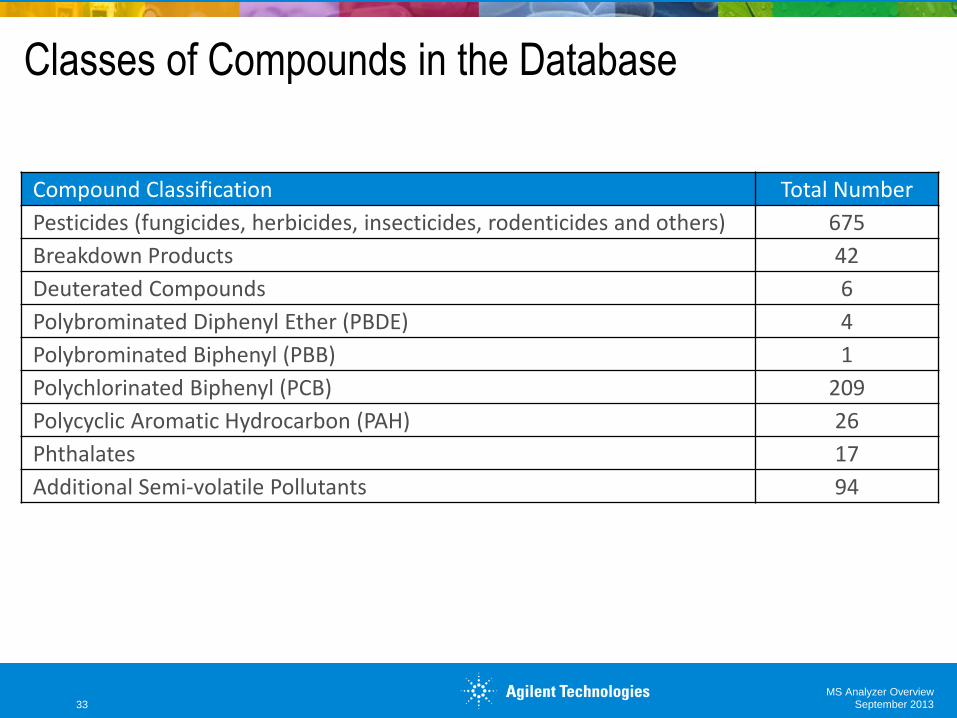
Classes of Compounds in the Database
Compound Classification Total Number
Pesticides (fungicides, herbicides, insecticides, rodenticides and others) 675
Breakdown Products 42
Deuterated Compounds 6
Polybrominated Diphenyl Ether (PBDE) 4
Polybrominated Biphenyl (PBB) 1
Polychlorinated Biphenyl (PCB) 209
Polycyclic Aromatic Hydrocarbon (PAH) 26
Phthalates 17
Additional Semi-volatile Pollutants 94
33 September 2013 MS Analyzer Overview
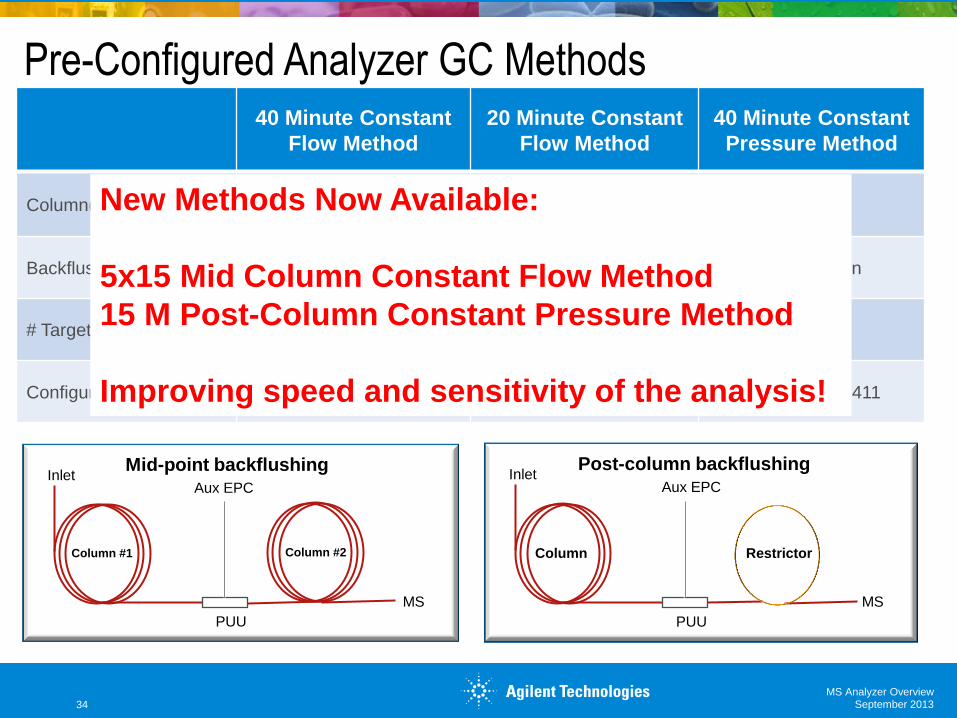
40 Minute Constant
Flow Method
20 Minute Constant
Flow Method
40 Minute Constant
Pressure Method
Column(s) 2 x 15m 2 x 15m 1 x 30m
Backflushing type Mid-point Mid-point Post-column
# Targets ~300+ ~200+ ~300+
Configuration G3445B Opt. 412 G3445B Opt. 412 G3445B Opt. 411
Ease of re-lock
Inlet
MS
Aux EPC
Column
PUU
Post-column backflushing
Restrictor
Inlet
MS
Aux EPC
Column #1 Column #2
PUU
Mid-point backflushing
Pre-Configured Analyzer GC Methods
34 September 2013 MS Analyzer Overview
New Methods Now Available:
5x15 Mid Column Constant Flow Method
15 M Post-Column Constant Pressure Method
Improving speed and sensitivity of the analysis!
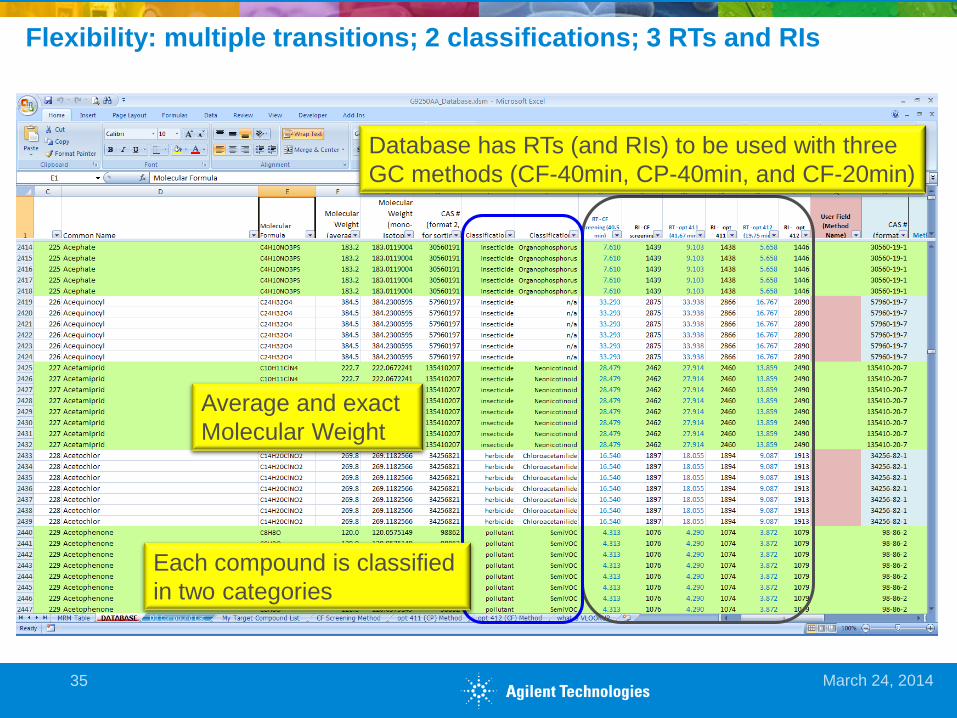
Average and exact
Molecular Weight
Each compound is classified
in two categories
Database has RTs (and RIs) to be used with three
GC methods (CF-40min, CP-40min, and CF-20min)
Flexibility: multiple transitions; 2 classifications; 3 RTs and RIs
March 24, 2014 35
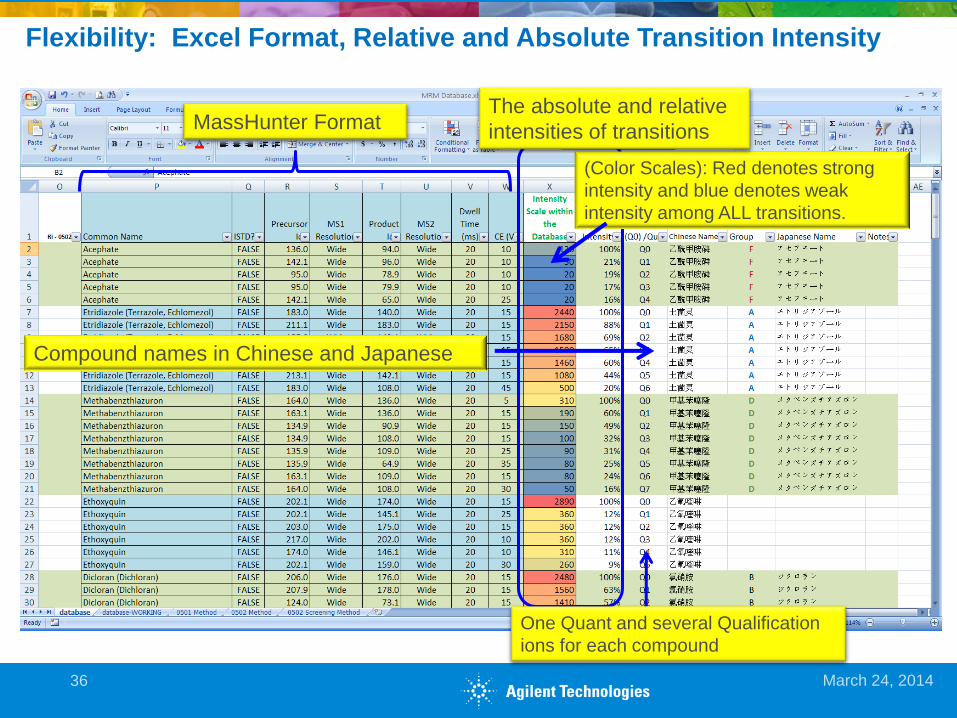
(Color Scales): Red denotes strong
intensity and blue denotes weak
intensity among ALL transitions.
36
Flexibility: Excel Format, Relative and Absolute Transition Intensity
MassHunter Format
One Quant and several Qualification
ions for each compound
The absolute and relative
intensities of transitions
Compound names in Chinese and Japanese
March 24, 2014
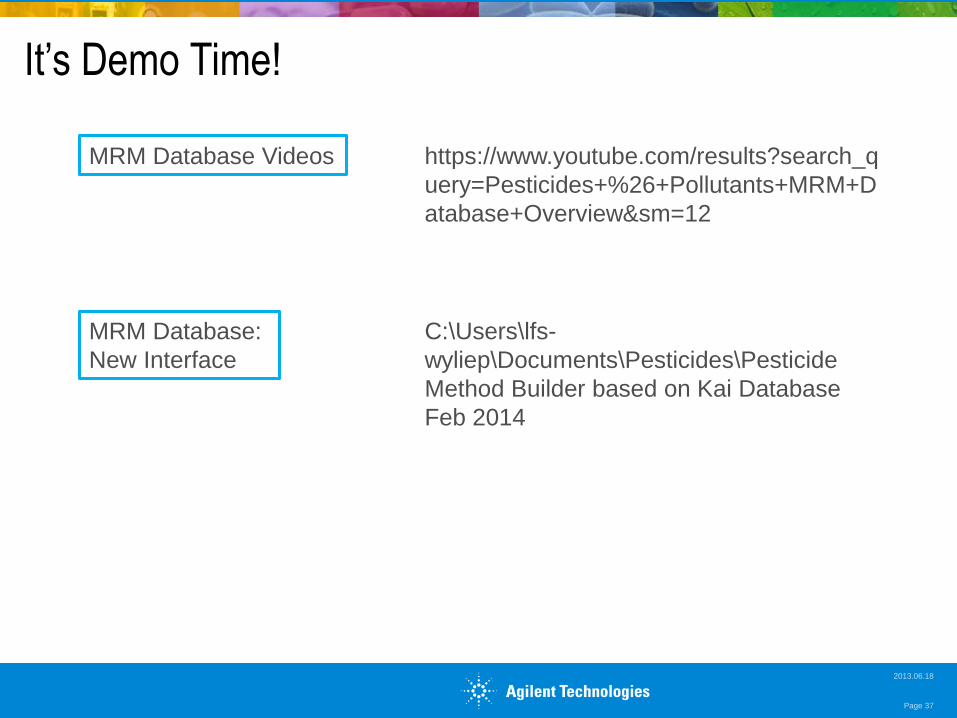
It’s Demo Time!
2013.06.18
Page 37
https://www.youtube.com/results?search_q
uery=Pesticides+%26+Pollutants+MRM+D
atabase+Overview&sm=12
C:\Users\lfs-
wyliep\Documents\Pesticides\Pesticide
Method Builder based on Kai Database
Feb 2014
MRM Database Videos
MRM Database:
New Interface
Our Analyzers all use Backflushing!
March 24, 2014
Confidentiality Label
38
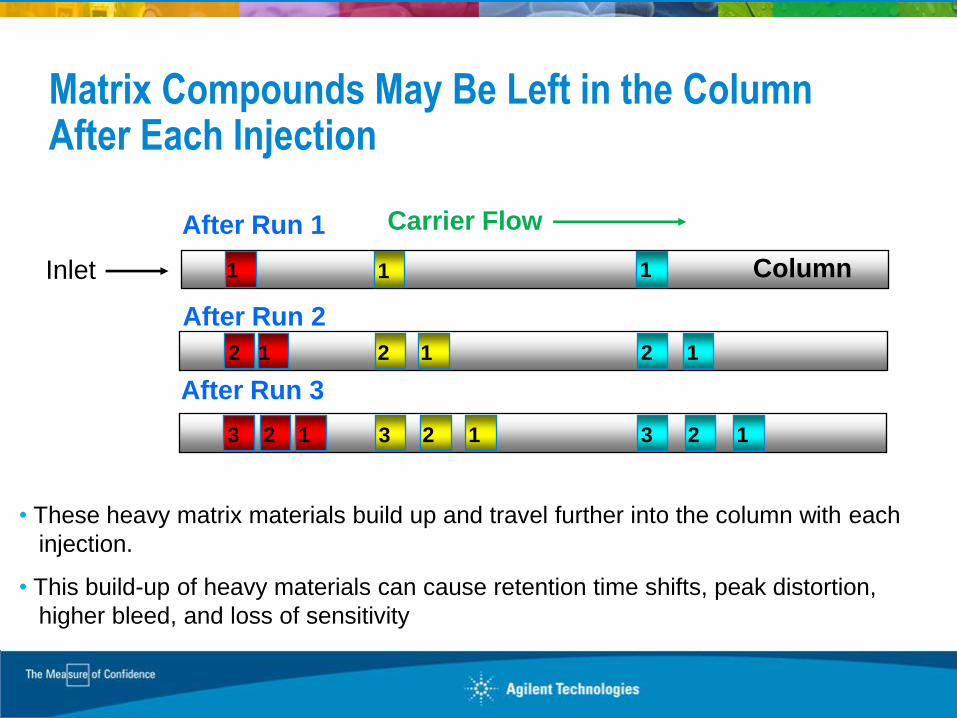
Matrix Compounds May Be Left in the Column After Each Injection
Column Inlet
After Run 1
After Run 2
After Run 3
Carrier Flow
• These heavy matrix materials build up and travel further into the column with each
injection.
• This build-up of heavy materials can cause retention time shifts, peak distortion,
higher bleed, and loss of sensitivity
1 1 1
1 1 1 2 2 2
1 1 1 2 2 2 3 3 3
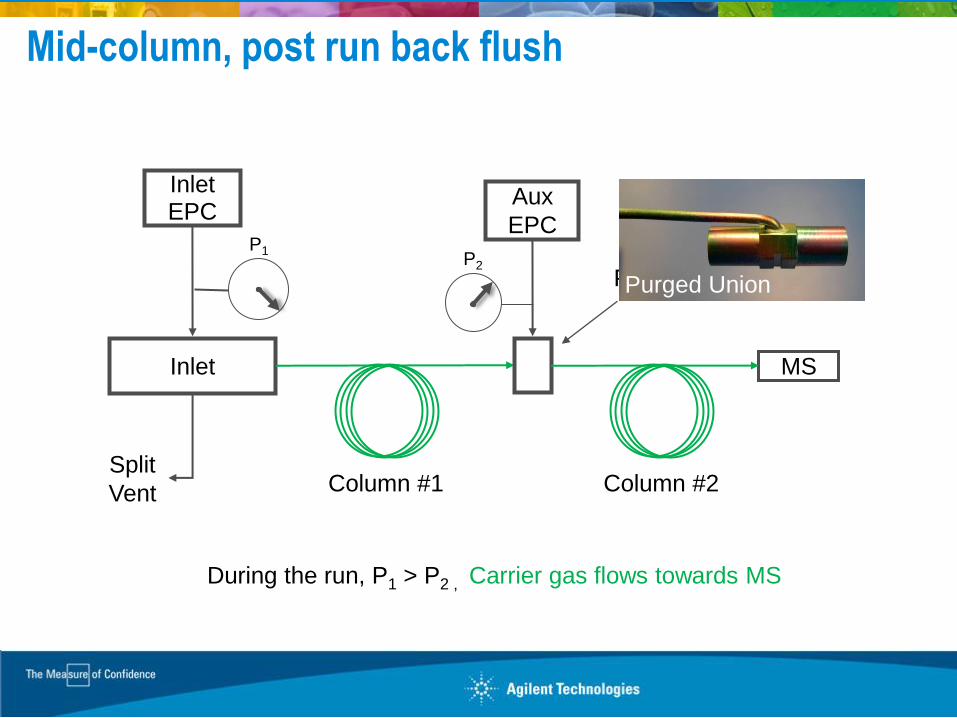
Mid-column, post run back flush
Purged Union
MS
Inlet
Inlet EPC
P1
Column #1
Aux
EPC
P2
Split
Vent
Purged Union
During the run, P1 > P2 , Carrier gas flows towards MS
Column #2
Column #1
Purged Union
MS
Inlet EPC
P1
Aux
EPC
P2
Split
Vent
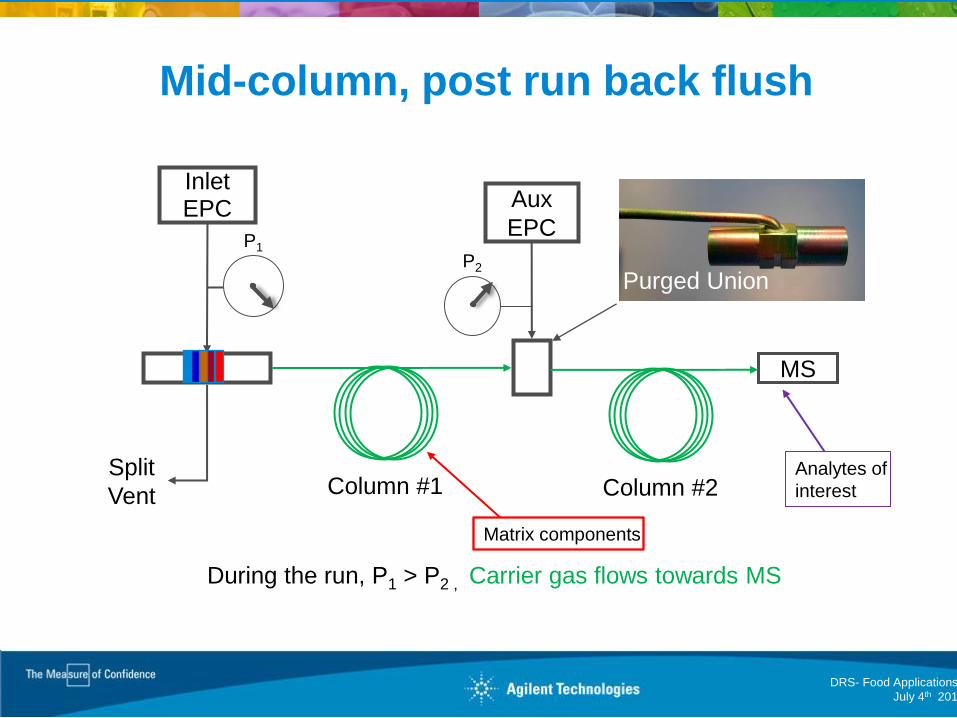
Mid-column, post run back flush
During the run, P1 > P2 , Carrier gas flows towards MS
Analytes of
interest
Matrix components
Pesticides in Tea
7000 GC-QQQ
Using G9250AA Database
DRS- Food Applications
July 4th 2012
Column #2
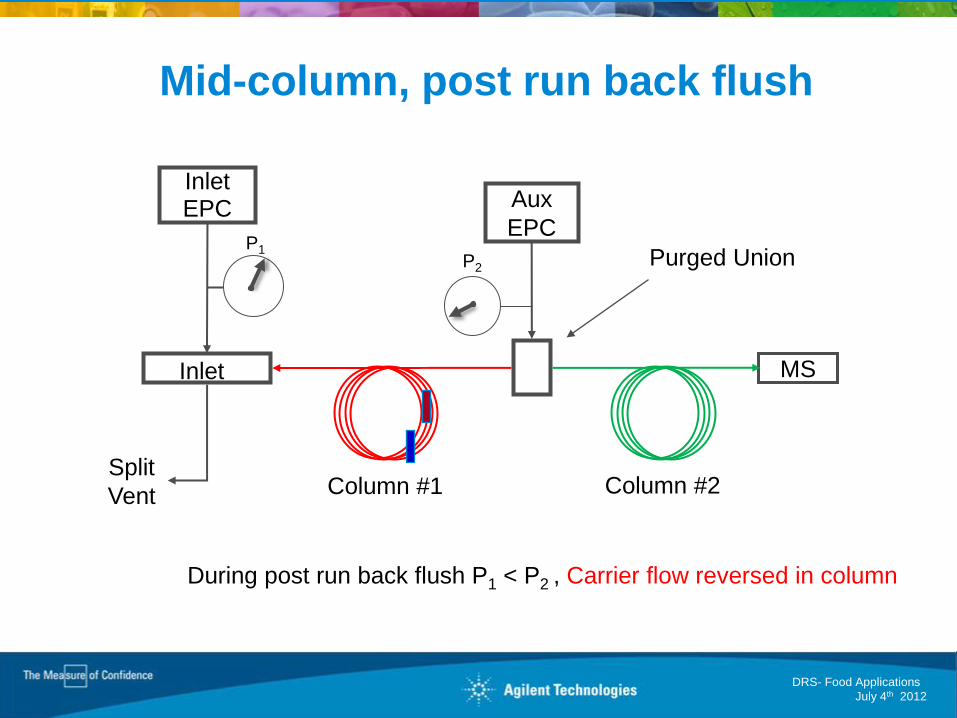
Column #1
Purged Union
MS
Inlet EPC
P1
Aux
EPC
P2
Split
Vent
Inlet
Mid-column, post run back flush
During post run back flush P1 < P2 , Carrier flow reversed in column
DRS- Food Applications
July 4th 2012
Column #2
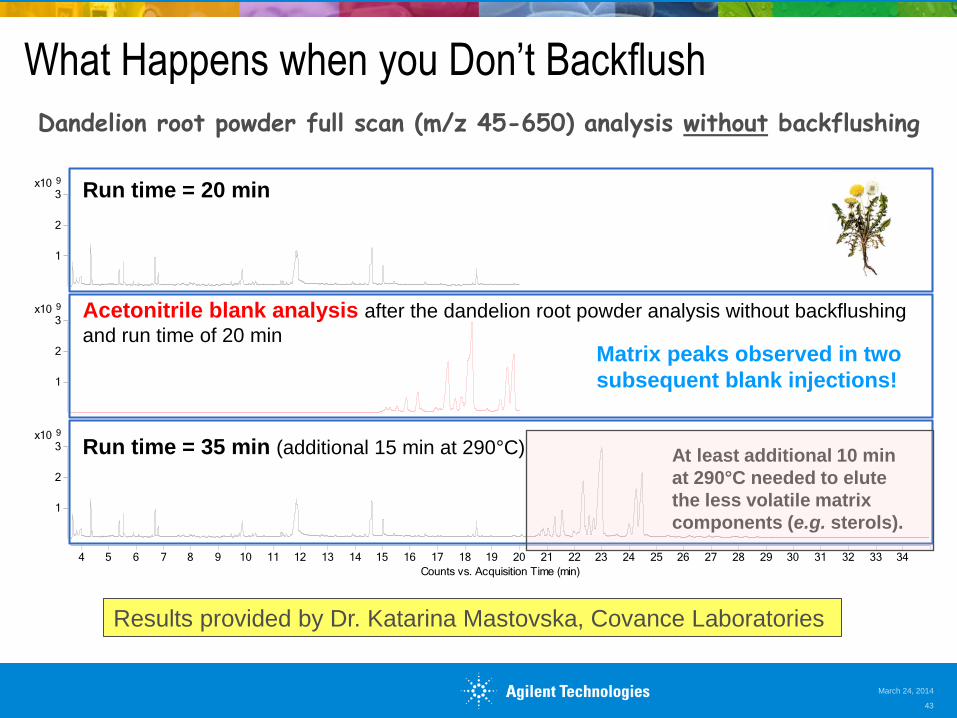
What Happens when you Don’t Backflush
March 24, 2014
43
9x10
1
2
3
9x10
1
2
3
9x10
1
2
3
Counts vs. Acquisition Time (min)
4 5 6 7 8 9 10 11 12 13 14 15 16 17 18 19 20 21 22 23 24 25 26 27 28 29 30 31 32 33 34
Acetonitrile blank analysis after the dandelion root powder analysis without backflushing
and run time of 20 min
Run time = 20 min
Run time = 35 min (additional 15 min at 290°C)
Matrix peaks observed in two
subsequent blank injections!
At least additional 10 min
at 290°C needed to elute
the less volatile matrix
components (e.g. sterols).
Dandelion root powder full scan (m/z 45-650) analysis without backflushing
Results provided by Dr. Katarina Mastovska, Covance Laboratories
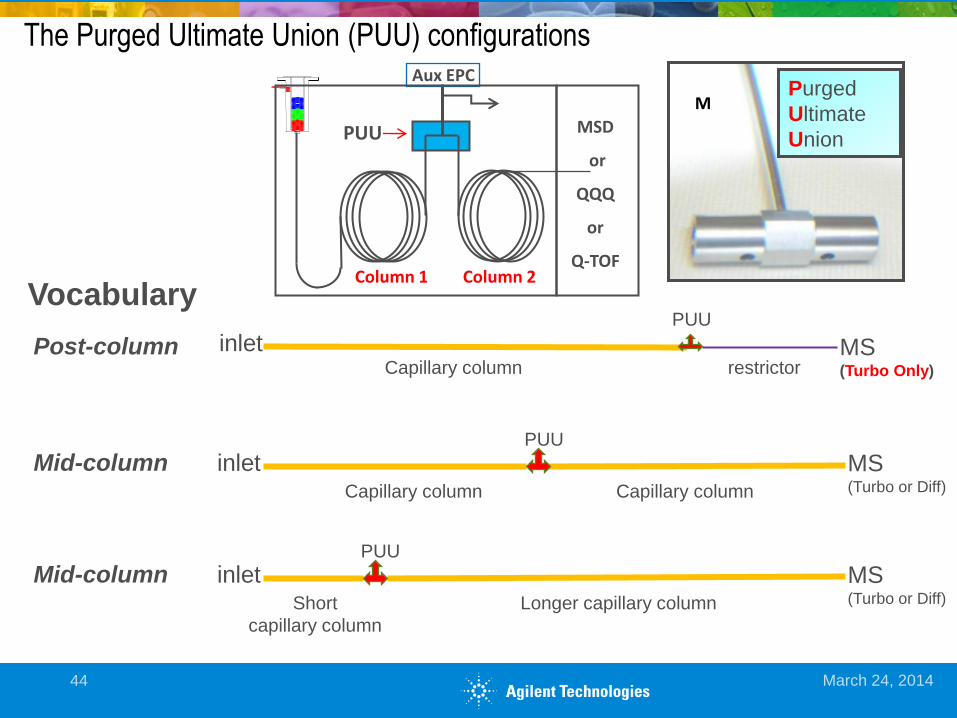
The Purged Ultimate Union (PUU) configurations Aux EPC
Column 1 Column 2
PUU MSD
or
QQQ
or
Q-TOF
inlet MS (Turbo Only)
Vocabulary
Post-column
PUU
restrictor Capillary column
inlet Mid-column PUU
Capillary column Capillary column
MS (Turbo or Diff)
Purged
Ultimate
Union
inlet Mid-column PUU
Longer capillary column Short
capillary column
MS (Turbo or Diff)
March 24, 2014 44
M
45
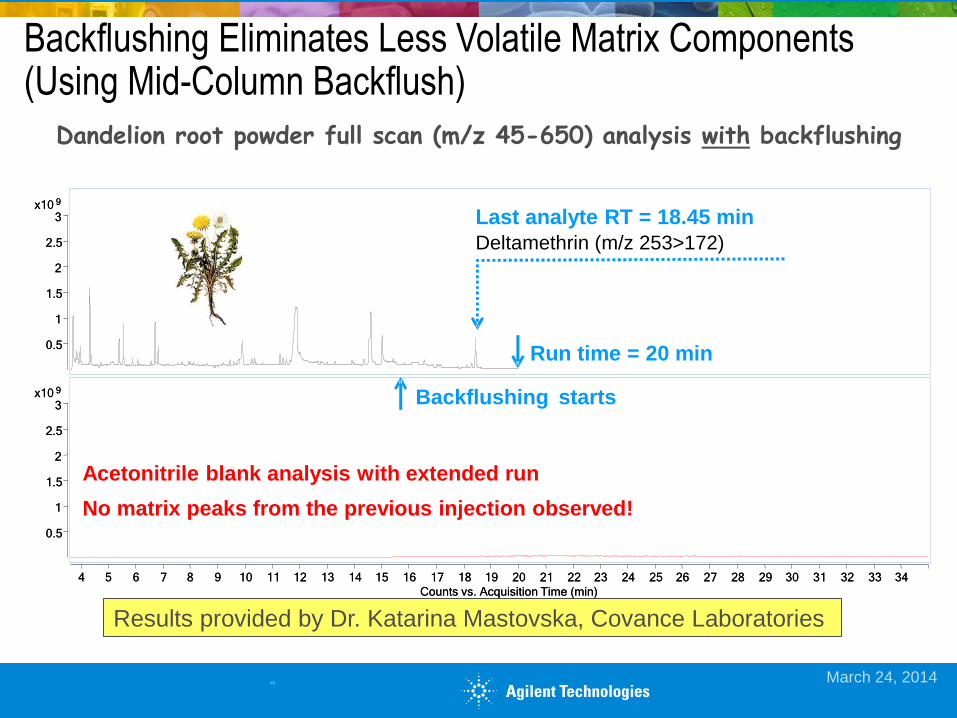
Backflushing Eliminates Less Volatile Matrix Components (Using Mid-Column Backflush)
Dandelion root powder full scan (m/z 45-650) analysis with backflushing
Results provided by Dr. Katarina Mastovska, Covance Laboratories
9 x10
0.5
1
1.5
2
2.5
3
9 x10
0.5
1
1.5
2
2.5
3
Counts vs. Acquisition Time (min)
4 5 6 7 8 9 10 11 12 13 14 15 16 17 18 19 20 21 22 23 24 25 26 27 28 29 30 31 32 33 34
Acetonitrile blank analysis (no backflushing , additional 15 min at 290 ° C)
after the dandelion root powder analysis with backflushing
No matrix peaks from the previous injection observed!
Run time = 20 min
Backflushing starts
(after deltamethrin safely elutes from the first column)
Last analyte RT = 18.45 min
Deltamethrin ( m/z 253 >172)
2 x10
0
1
2
3
4
5
6
Counts vs. Acquisition Time (min)
18.2 18.3 18.4 18.5 18.6
9 x10
0.5
1
1.5
2
2.5
3
9 x10
0.5
1
1.5
2
2.5
3
Counts vs. Acquisition Time (min)
4 5 6 7 8 9 10 11 12 13 14 15 16 17 18 19 20 21 22 23 24 25 26 27 28 29 30 31 32 33 34
Acetonitrile blank analysis with extended run
No matrix peaks from the previous injection observed!
Run time = 20 min
Backflushing starts
Last analyte RT = 18.45 min
Deltamethrin ( m/z 253 >172)
March 24, 2014
Summary
Agilent Analyzers:
• Get you up and running before the service engineer leaves your
lab!
• Save you from method development
• Can expand your scope of analytes
• Are pre-configured and pre-tested in Agilent factory
• Are based on what we know works
• Use backflushing to reduce/eliminate source cleaning, carryover,
column clipping, interferences, etc.
Yes, they cost a little more, but they save you time and $ in the end!
March 24, 2014
Confidentiality Label
46