agilent’s lc/ms portfolio and applications examples · agilent’s lc/ms portfolio and...
TRANSCRIPT

Agilent’s LC/MS Portfolio and Applications Examples
Michael Scott LC/MS Product Specialist Agilent Technologies
March 2013
For Research Use Only. Not for use in diagnostic procedures.
Agilent 6000 Series LCMS
Pa
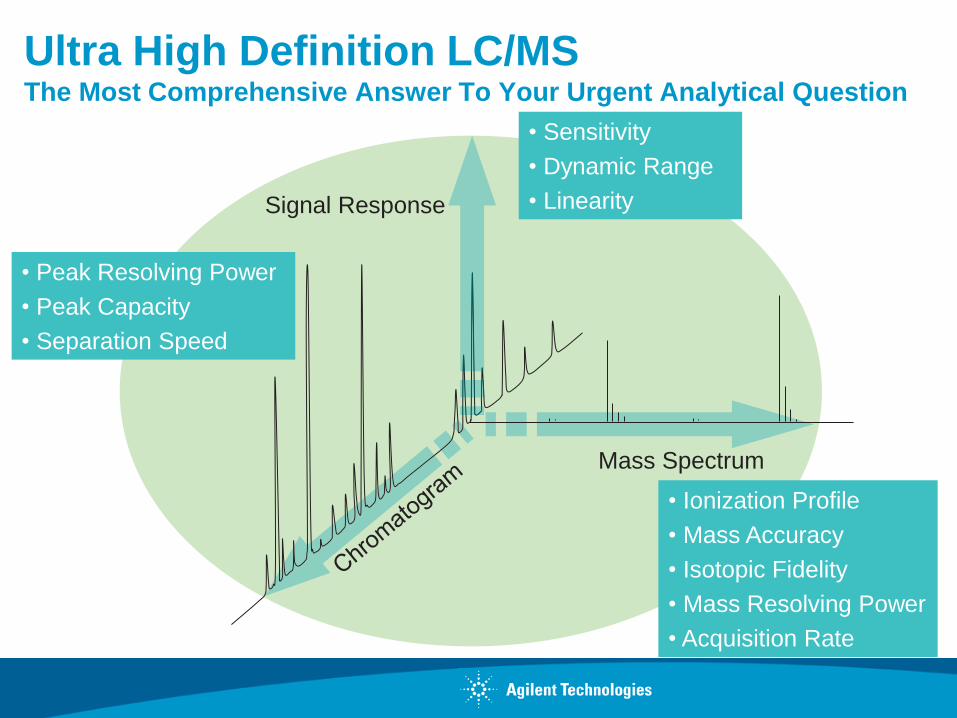
Ultra High Definition LC/MS The Most Comprehensive Answer To Your Urgent Analytical Question
Signal Response
Mass Spectrum
• Sensitivity • Dynamic Range • Linearity
• Ionization Profile • Mass Accuracy • Isotopic Fidelity • Mass Resolving Power • Acquisition Rate
• Peak Resolving Power • Peak Capacity • Separation Speed

…a few words about chromatography
Pa
LC - MS
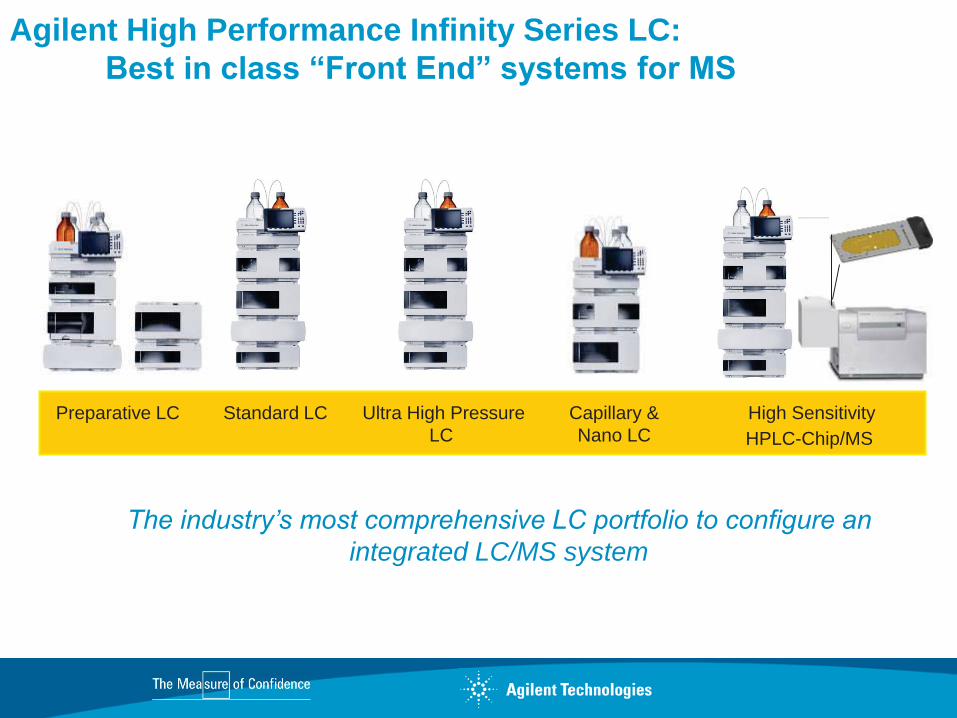
Preparative LC Capillary & Nano LC
Standard LC Ultra High Pressure LC
High Sensitivity HPLC-Chip/MS
Agilent High Performance Infinity Series LC: Best in class “Front End” systems for MS
The industry’s most comprehensive LC portfolio to configure an integrated LC/MS system
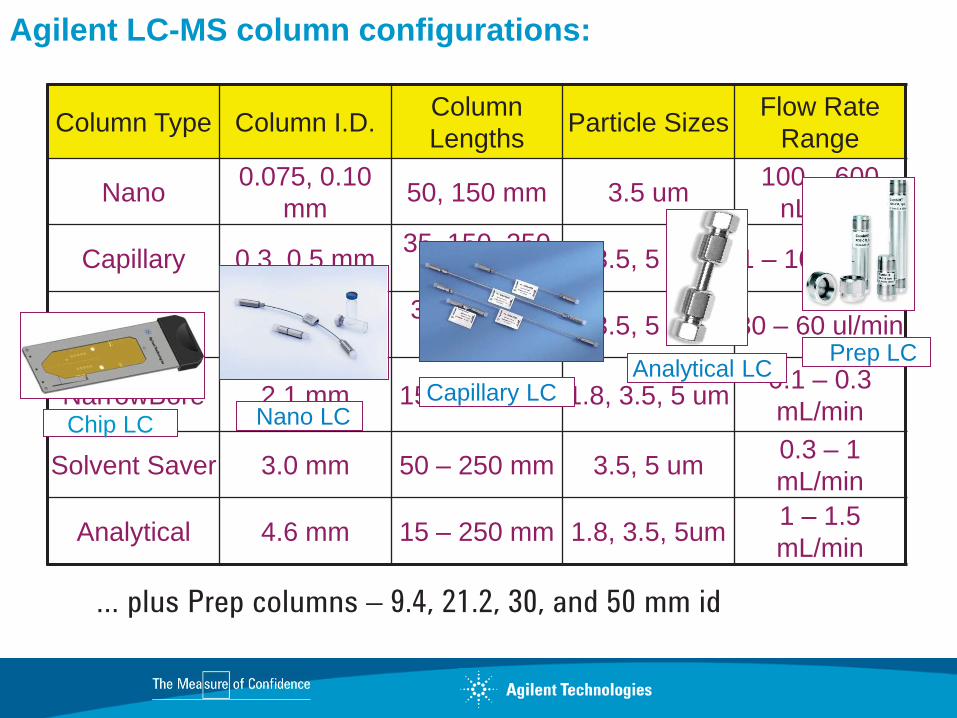
Agilent LC-MS column configurations:
Column Type Column I.D. Column Lengths Particle Sizes Flow Rate
Range
Nano 0.075, 0.10 mm 50, 150 mm 3.5 um 100 – 600
nL/min
Capillary 0.3, 0.5 mm 35, 150, 250 mm 3.5, 5 um 1 – 10 uL/min
MicroBore 1.0 mm 30, 50, 150 mm 3.5, 5 um 30 – 60 ul/min
NarrowBore 2.1 mm 15 – 250 mm 1.8, 3.5, 5 um 0.1 – 0.3 mL/min
Solvent Saver 3.0 mm 50 – 250 mm 3.5, 5 um 0.3 – 1 mL/min
Analytical 4.6 mm 15 – 250 mm 1.8, 3.5, 5um 1 – 1.5 mL/min
… plus Prep columns – 9.4, 21.2, 30, and 50 mm id
Nano LC Capillary LC
Analytical LC Prep LC
Chip LC
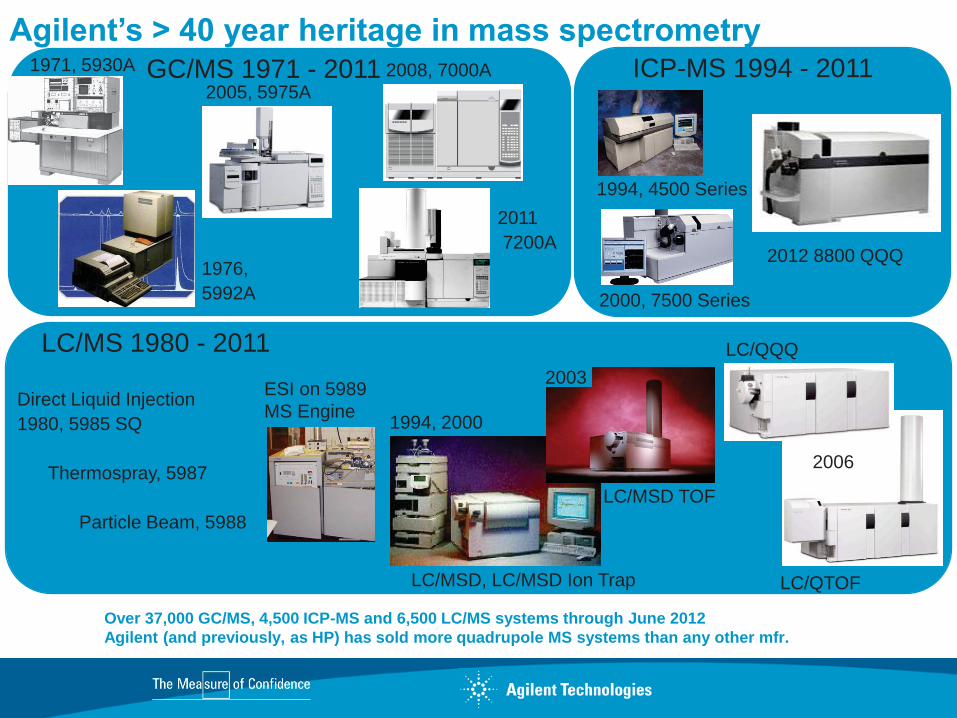
Over 37,000 GC/MS, 4,500 ICP-MS and 6,500 LC/MS systems through June 2012 Agilent (and previously, as HP) has sold more quadrupole MS systems than any other mfr.
1971, 5930A 2005, 5975A
GC/MS 1971 - 2011
LC/MSD, LC/MSD Ion Trap
LC/MSD TOF
1994, 2000
LC/MS 1980 - 2011 2003
Agilent’s > 40 year heritage in mass spectrometry 2008, 7000A
LC/QQQ
LC/QTOF
2006
1976, 5992A
1994, 4500 Series
ICP-MS 1994 - 2011
2012 8800 QQQ
2000, 7500 Series
Direct Liquid Injection 1980, 5985 SQ Thermospray, 5987 Particle Beam, 5988
ESI on 5989 MS Engine
2011 7200A
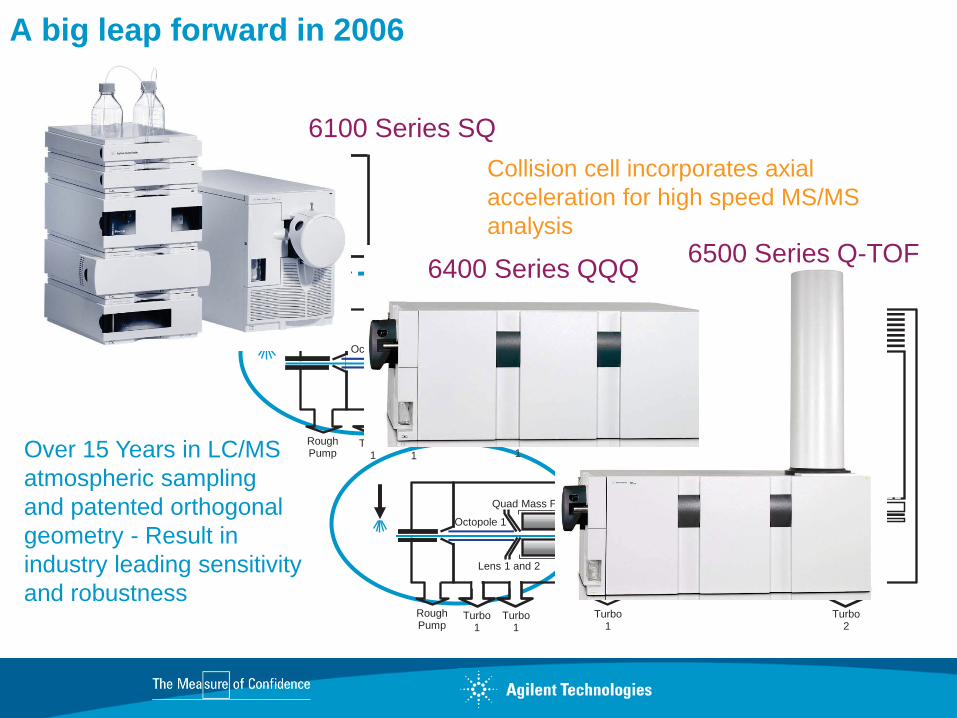
A big leap forward in 2006
Over 15 Years in LC/MS atmospheric sampling and patented orthogonal geometry - Result in industry leading sensitivity and robustness
Rough Pump
Octopole 1
Turbo 1
Turbo 1
Turbo 1
Quad Mass Filter (Q1)
Collision Cell
Lens 1 and 2
Quad Mass Filter (Q3)
10KV Detector
Ion Pulser
Turbo 2
Octopole 1
DC Quad
Rough Pump
Turbo 1
Turbo 1
Turbo 1
Quad Mass Filter (Q1)
Collision Cell Lens 1 and 2
Octopole 2
Rough Pump
Octopole 1
Turbo 1
Turbo 1
Turbo 1
Quad Mass Filter (Q1)
Lens 1 and 2 10KV
Detector
Collision cell incorporates axial acceleration for high speed MS/MS analysis
6500 Series Q-TOF 6400 Series QQQ
6100 Series SQ

Agilent offers a range of LC/MS systems
Single quad
Triple quad
Ion trap
TOF QTOF
3/26/2013 Page 11
Introduction to the Agilent LC/MS Portfolio Agilent Restricted
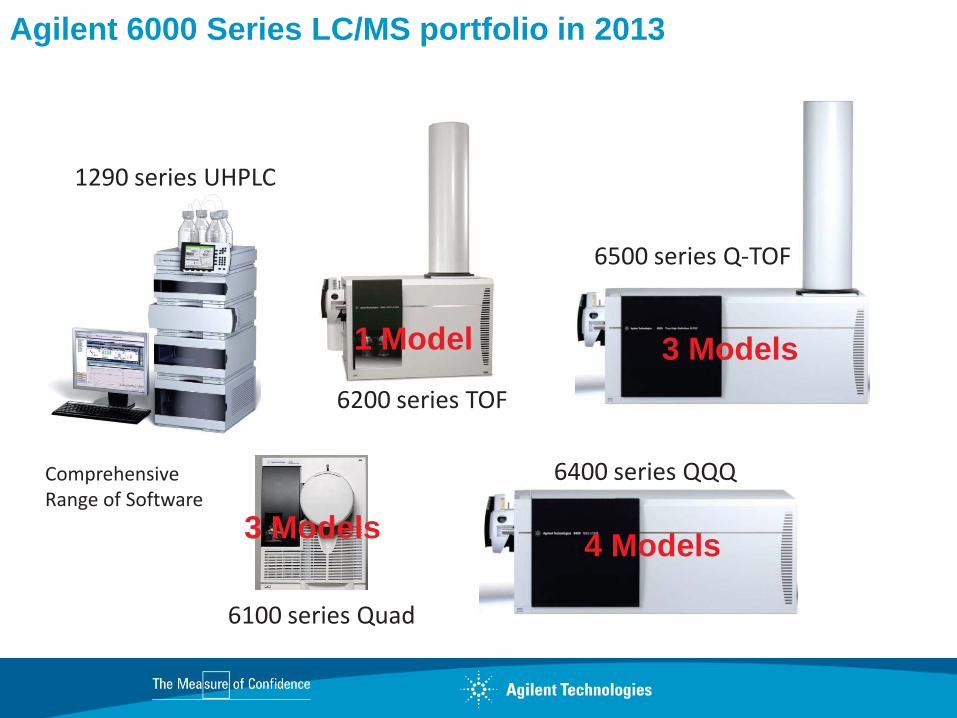
Agilent 6000 Series LC/MS portfolio in 2013
1290 series UHPLC
Comprehensive Range of Software
6200 series TOF
6100 series Quad
6500 series Q-TOF
6400 series QQQ
1 Model 3 Models
4 Models 3 Models
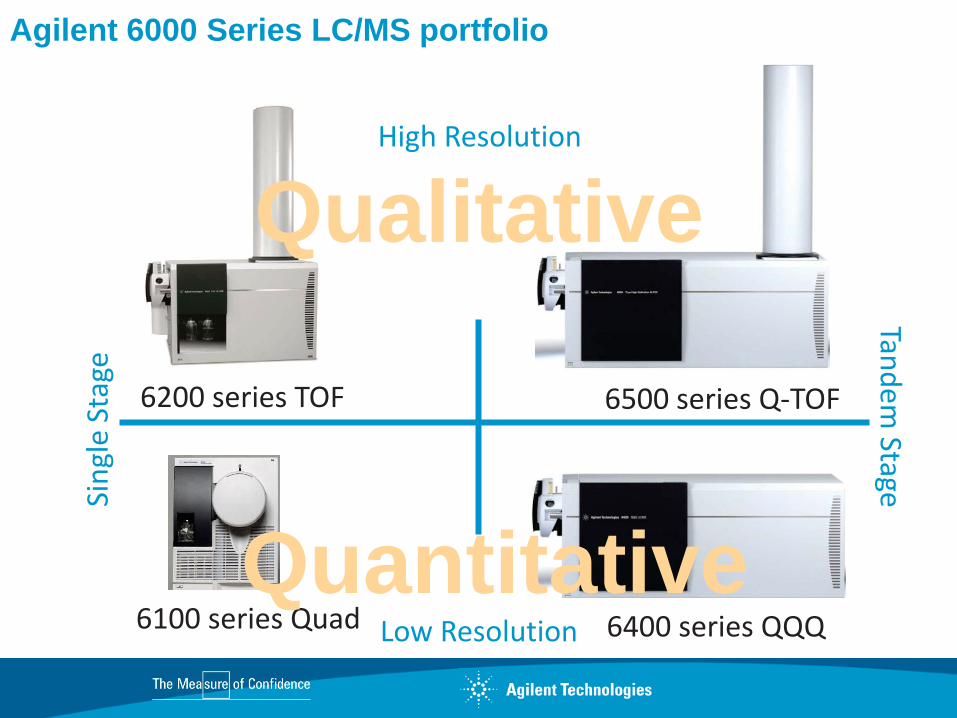
Agilent 6000 Series LC/MS portfolio
6200 series TOF
6100 series Quad
6500 series Q-TOF
6400 series QQQ
High Resolution
Low Resolution
Sing
le S
tage
Tandem
Stage
Qualitative
Quantitative
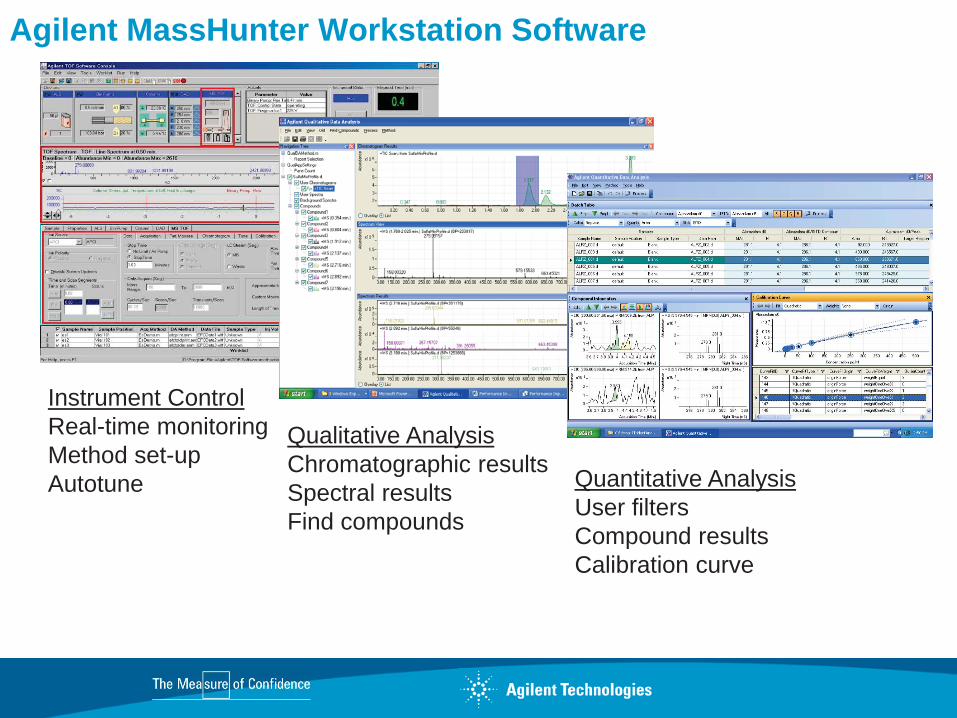
Agilent MassHunter Workstation Software
Instrument Control Real-time monitoring Method set-up Autotune
Qualitative Analysis Chromatographic results Spectral results Find compounds
Quantitative Analysis User filters Compound results Calibration curve
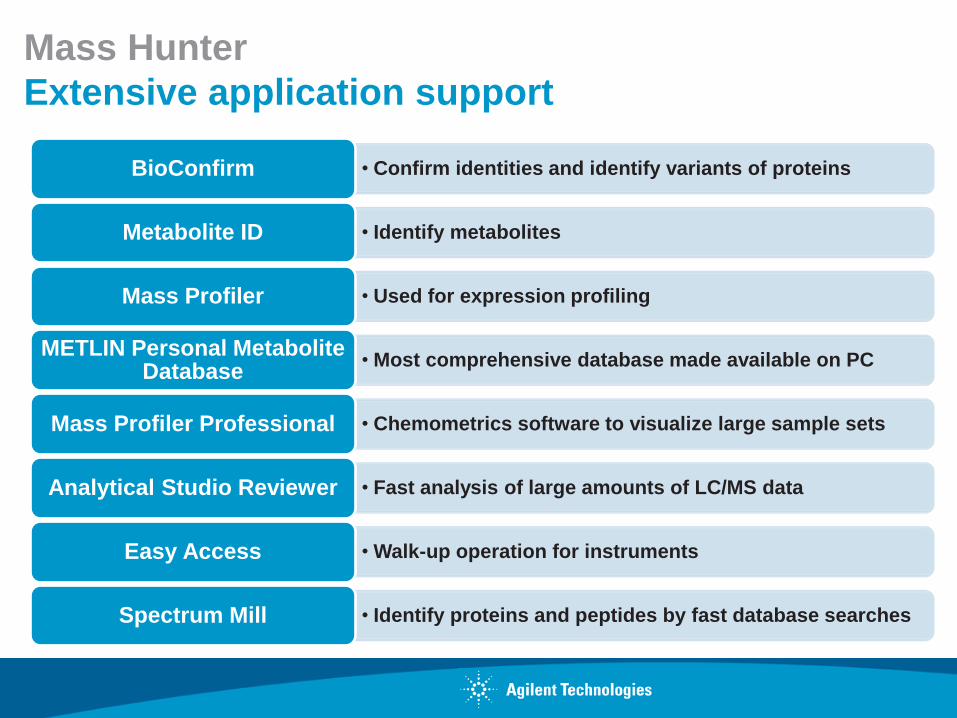
Mass Hunter Extensive application support
• Confirm identities and identify variants of proteins BioConfirm
• Identify metabolites Metabolite ID
• Used for expression profiling Mass Profiler
• Most comprehensive database made available on PC METLIN Personal Metabolite Database
• Chemometrics software to visualize large sample sets Mass Profiler Professional
• Fast analysis of large amounts of LC/MS data Analytical Studio Reviewer
• Walk-up operation for instruments Easy Access
• Identify proteins and peptides by fast database searches Spectrum Mill
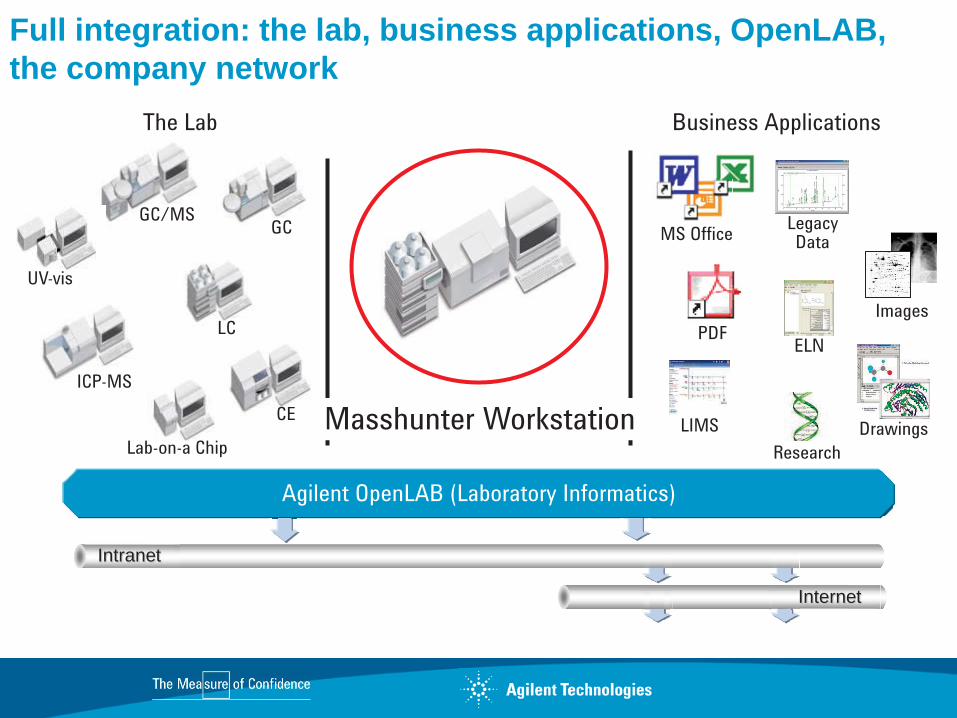
Full integration: the lab, business applications, OpenLAB, the company network
Intranet
Internet
GC
CE
LC
Lab-on-a Chip
GC/MS
ICP-MS
UV-vis
ELN PDF Images
Drawings LIMS Research
MS Office Legacy Data
The Lab Business Applications
Agilent OpenLAB (Laboratory Informatics)
Masshunter Workstation
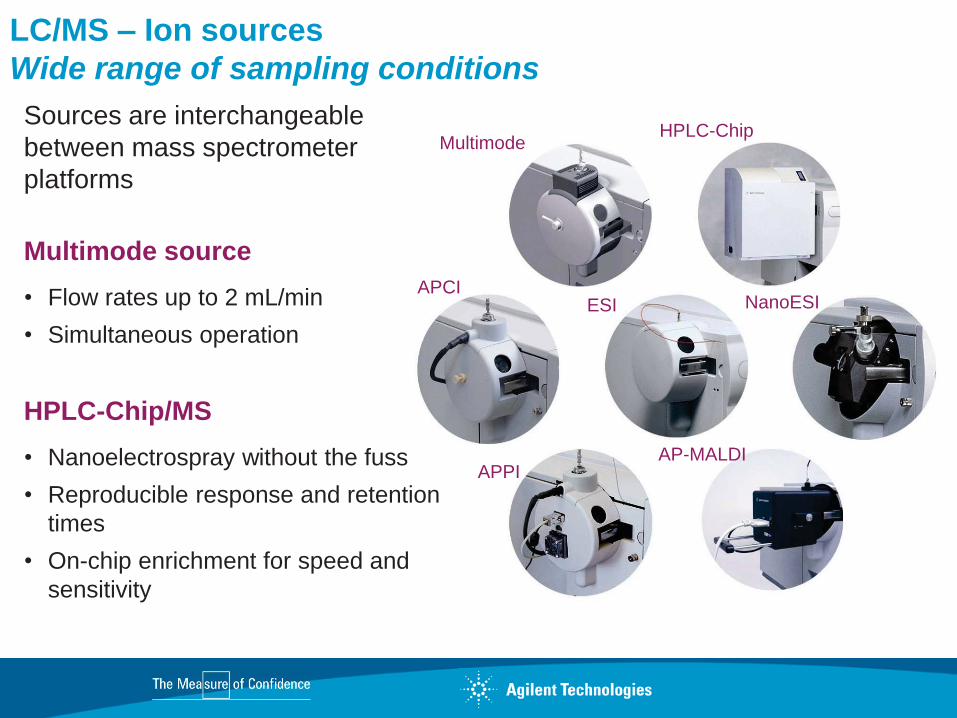
LC/MS – Ion sources Wide range of sampling conditions Sources are interchangeable between mass spectrometer platforms
Multimode source • Flow rates up to 2 mL/min • Simultaneous operation
HPLC-Chip/MS • Nanoelectrospray without the fuss • Reproducible response and retention
times • On-chip enrichment for speed and
sensitivity
Multimode HPLC-Chip
APCI ESI NanoESI
APPI AP-MALDI
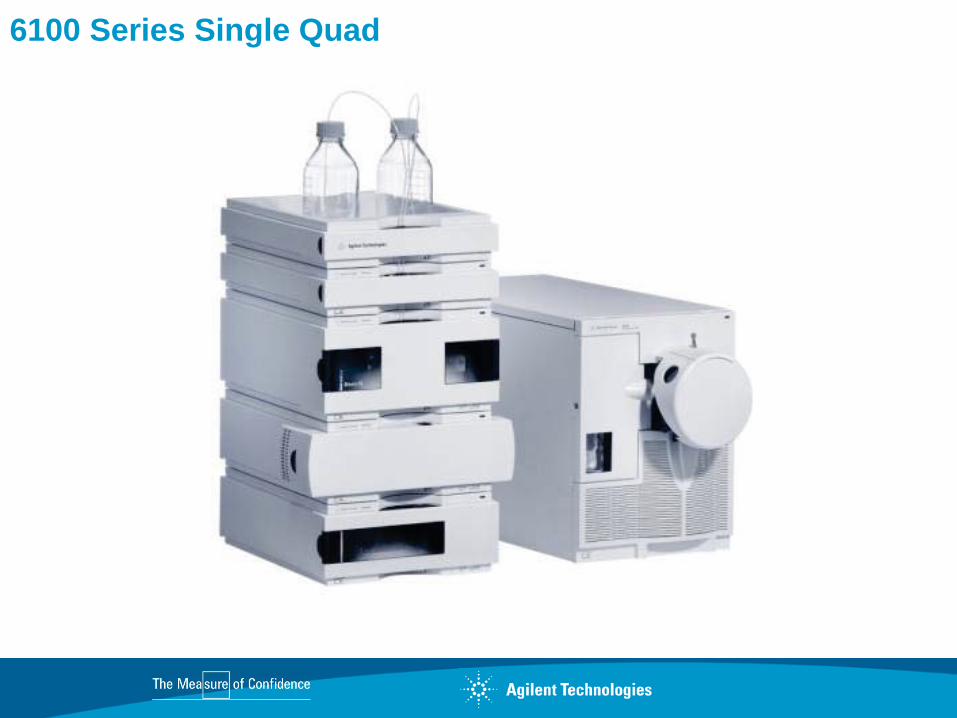
6100 Series Single Quad

Quadrupole – Operation Principles
Each m/z value has a unique DC and RF potential that will allow that ion to be passed through the quadrupole analyzer
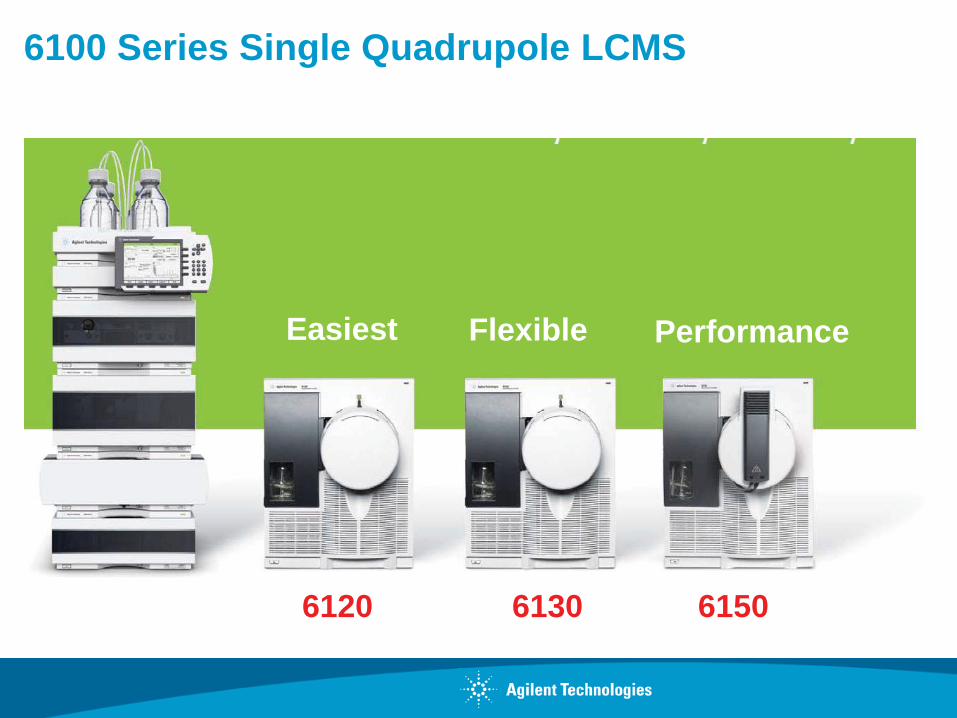
6100 Series Single Quadrupole LCMS
6120 6130 6150
Easiest Flexible Performance
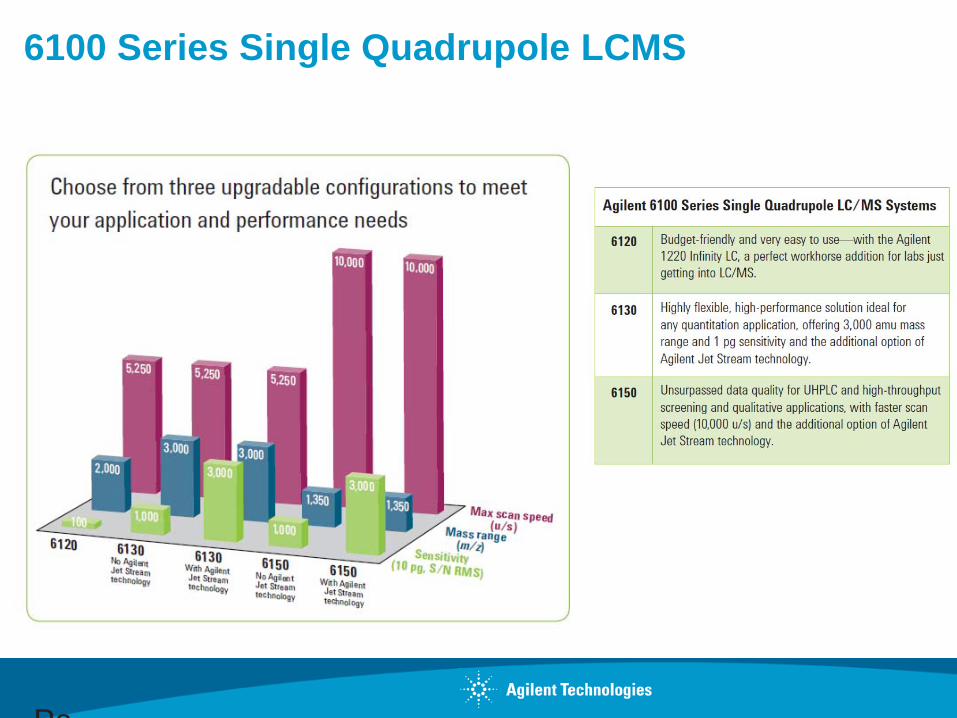
6100 Series Single Quadrupole LCMS
Pa
Page 22
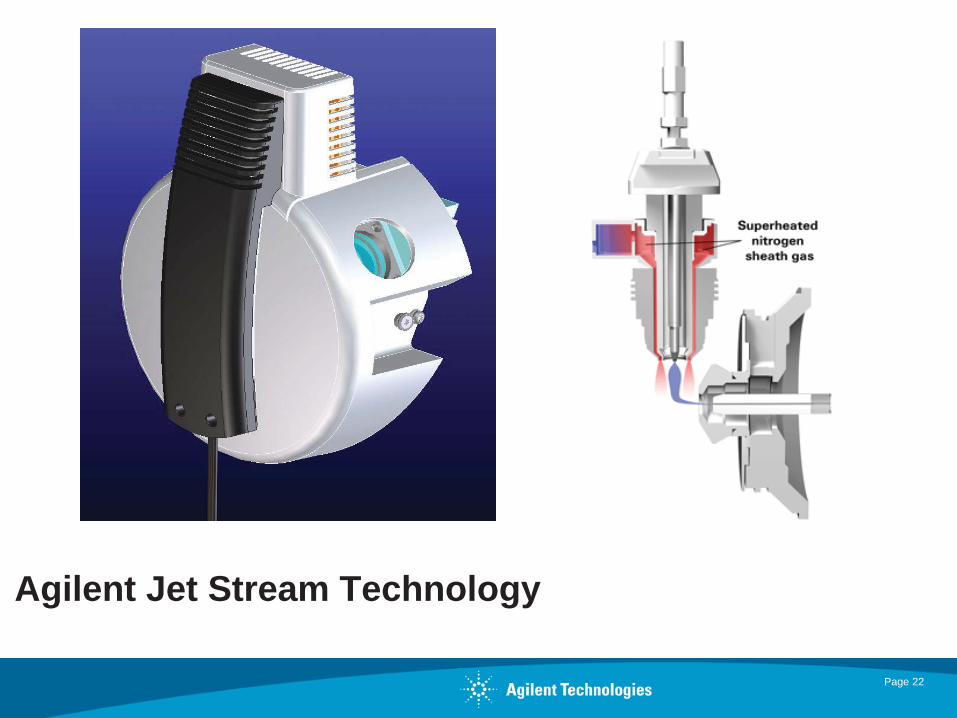
Agilent Jet Stream Technology
June 2008, Denver Page 23
Agilent Restricted 23
Agilent Jet Stream
Enter slide show mode to see the animation on this page.
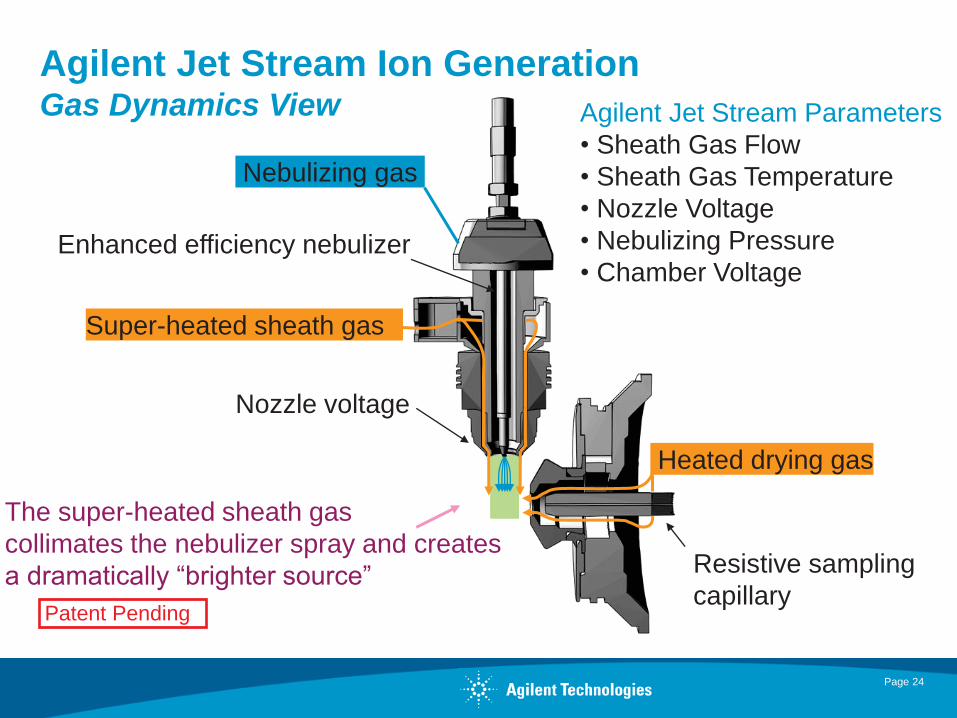
The super-heated sheath gas collimates the nebulizer spray and creates a dramatically “brighter source”
Nozzle voltage
Resistive sampling capillary
Nebulizing gas
Super-heated sheath gas
Heated drying gas
Enhanced efficiency nebulizer
Patent Pending
Agilent Jet Stream Parameters • Sheath Gas Flow • Sheath Gas Temperature • Nozzle Voltage • Nebulizing Pressure • Chamber Voltage
Agilent Jet Stream Ion Generation Gas Dynamics View
Page 24
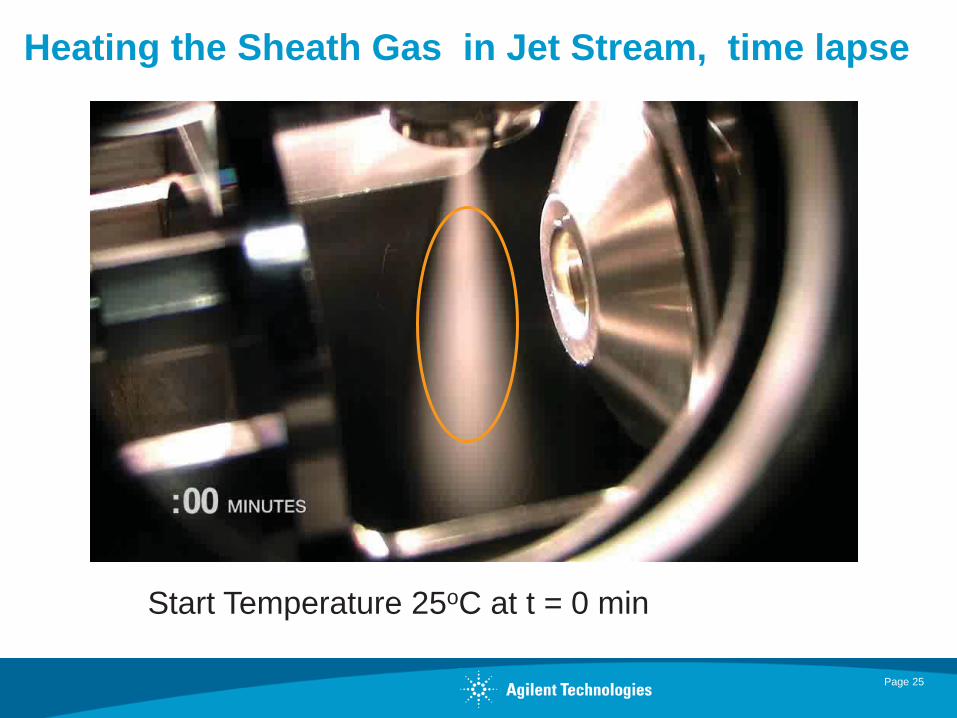
Heating the Sheath Gas in Jet Stream, time lapse
Start Temperature 25oC at t = 0 min
Page 25
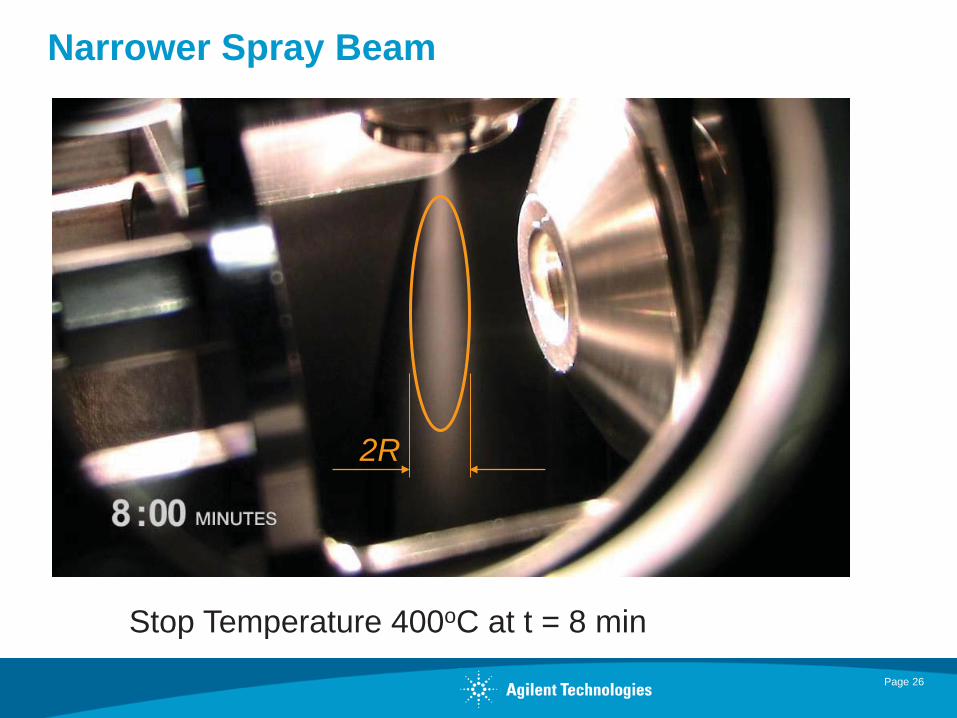
Narrower Spray Beam
Stop Temperature 400oC at t = 8 min
2R
Page 26

Herbicides in Water Anglian Water Laboratories, Huntingdon, UK
ppb
For clean matrix, LC/MSD (single quad) is a very useful and inexpensive tool for screening and quantitation)
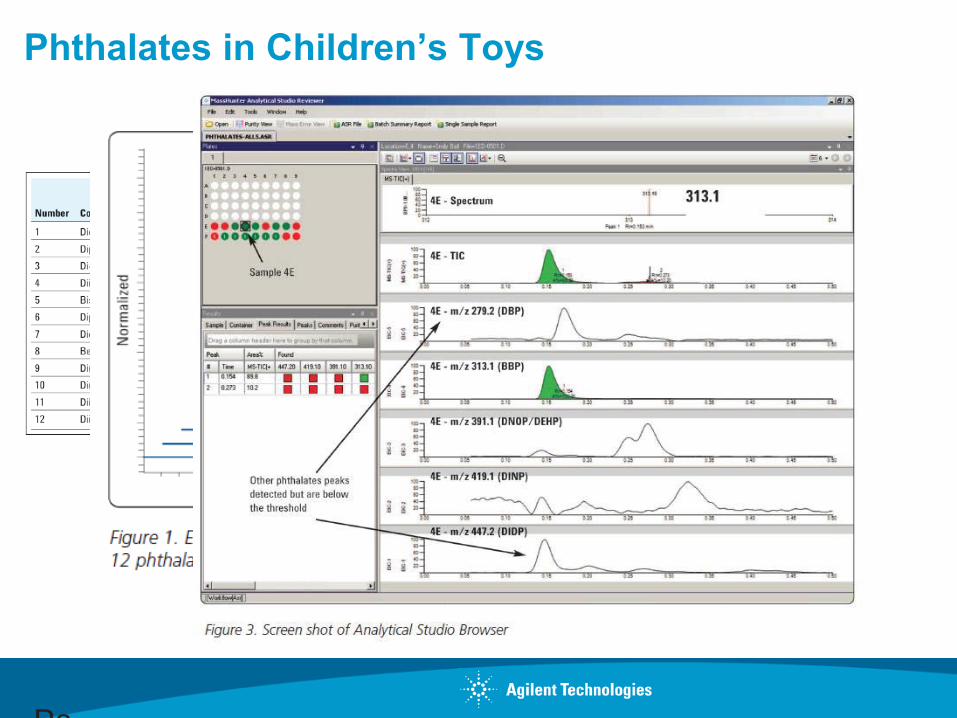
Phthalates in Children’s Toys
Pa
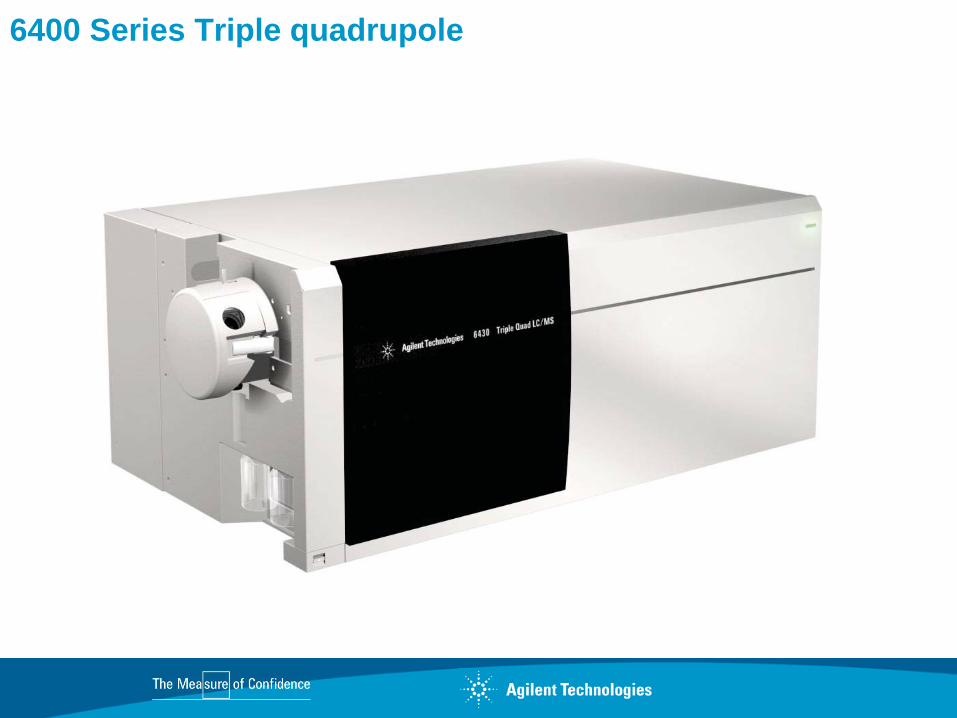
6400 Series Triple quadrupole

31
Ancient proverb: On a dark night you can see more stars
Why a Triple Quad ?
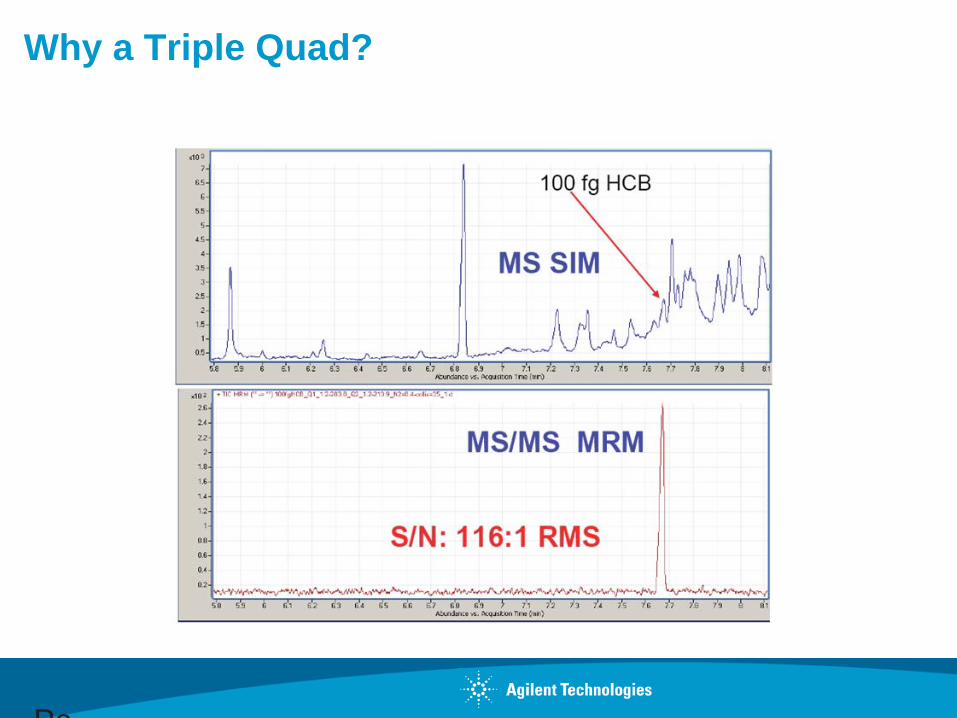
Why a Triple Quad?
Pa
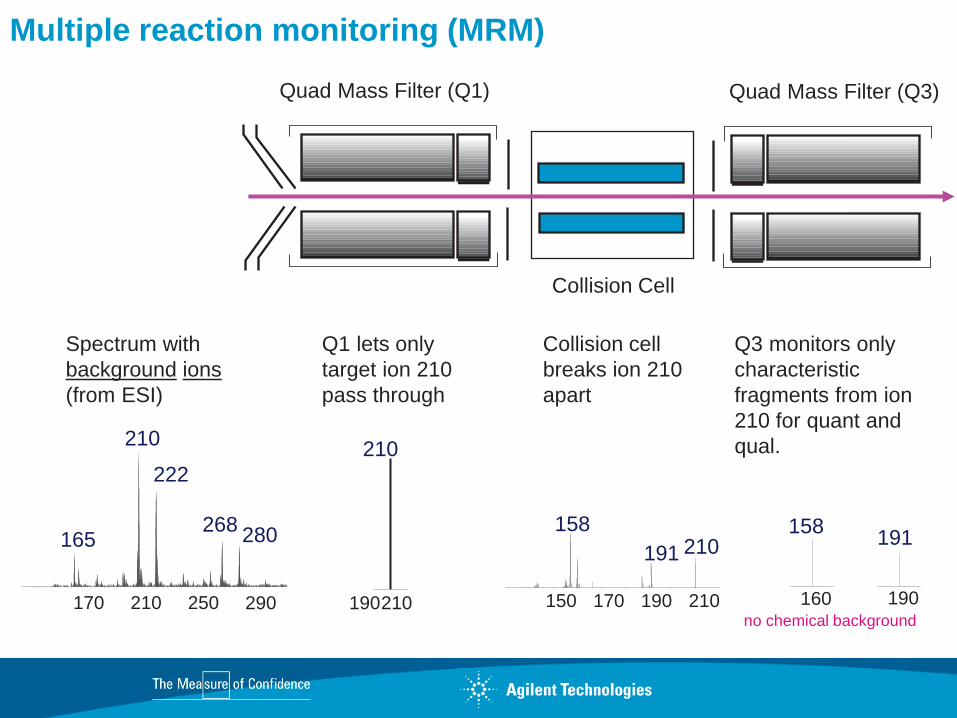
Multiple reaction monitoring (MRM)
Quad Mass Filter (Q3) Quad Mass Filter (Q1)
Collision Cell
170 210 250 290
210
222
268 280 165
Spectrum with background ions (from ESI)
Q1 lets only target ion 210 pass through
190 210
210
Collision cell breaks ion 210 apart
150 170 190 210
210 158
191
Q3 monitors only characteristic fragments from ion 210 for quant and qual.
160
158
190
191
no chemical background
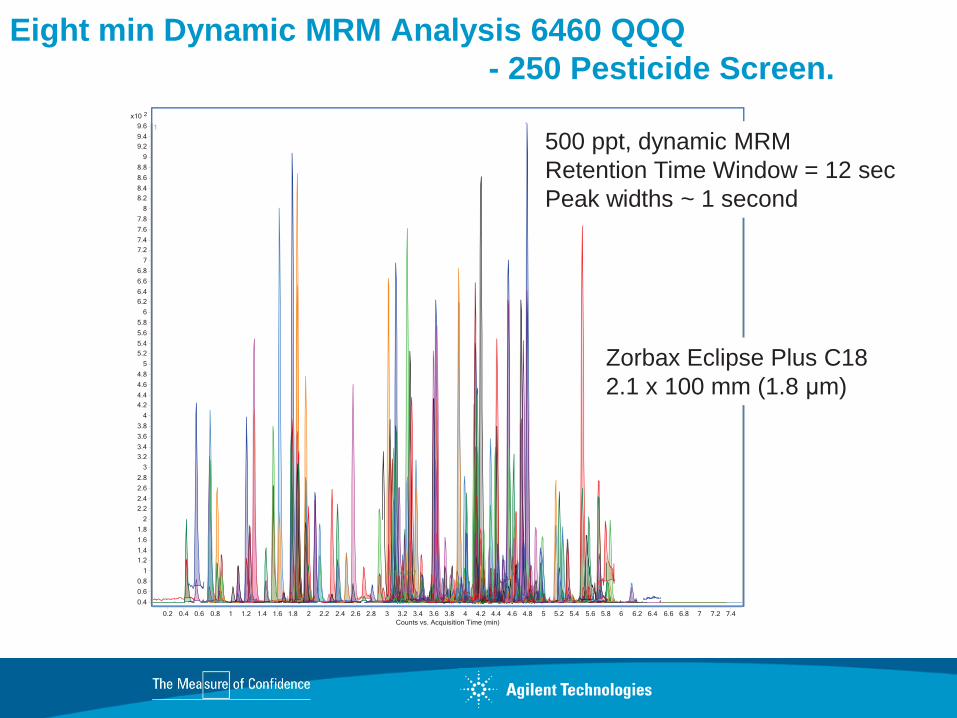
Eight min Dynamic MRM Analysis 6460 QQQ - 250 Pesticide Screen.
500 ppt, dynamic MRM Retention Time Window = 12 sec Peak widths ~ 1 second
Zorbax Eclipse Plus C18 2.1 x 100 mm (1.8 μm)
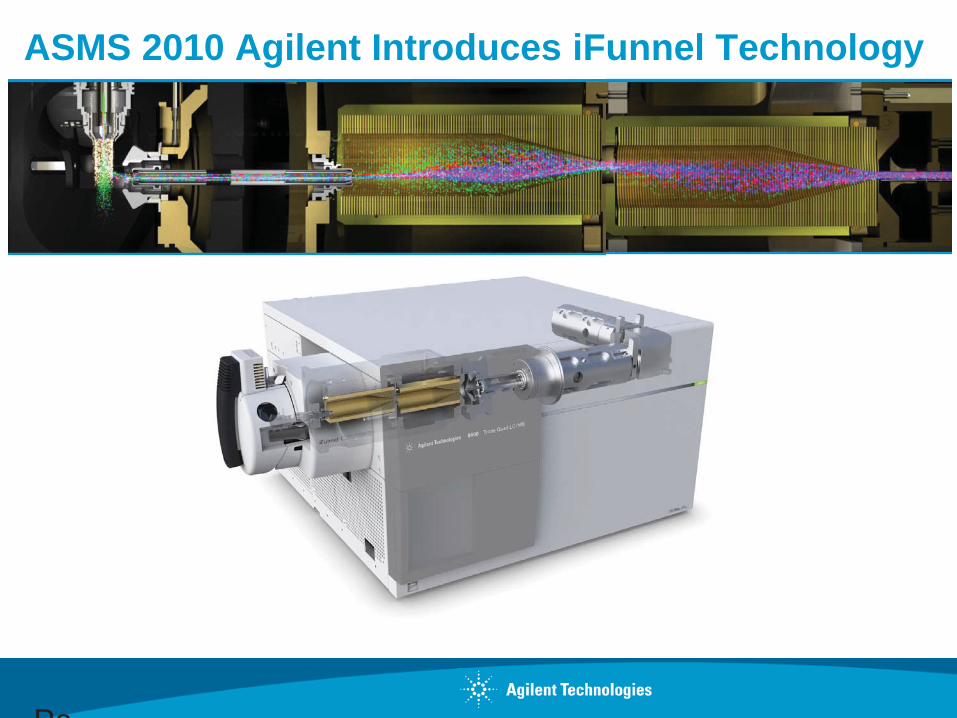
ASMS 2010 Agilent Introduces iFunnel Technology
Pa
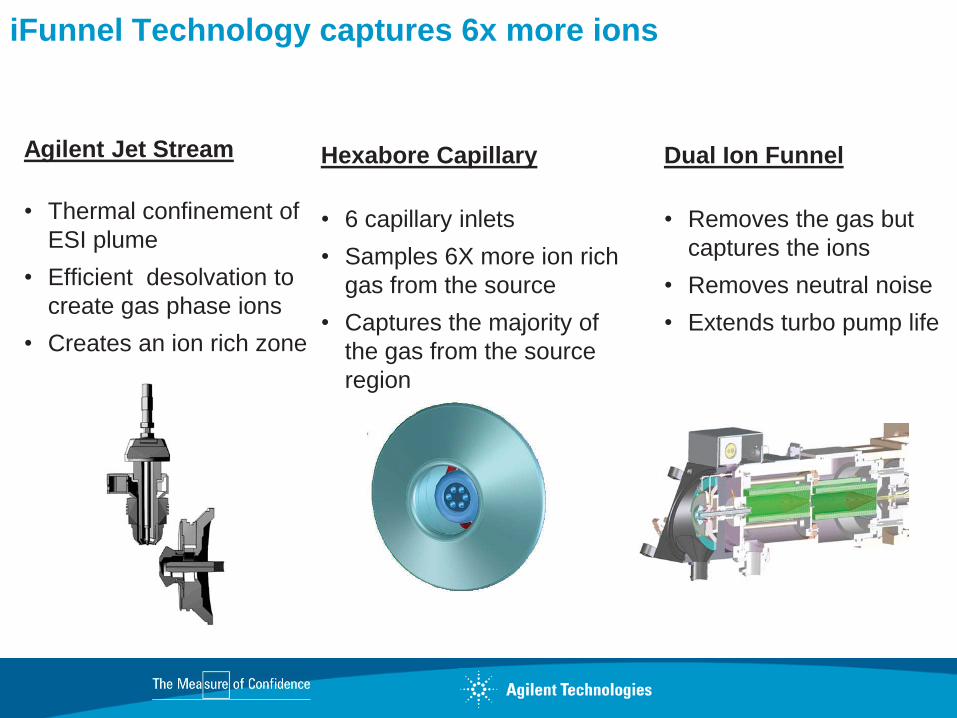
Agilent Jet Stream
• Thermal confinement of ESI plume
• Efficient desolvation to create gas phase ions
• Creates an ion rich zone
N E W I F U N N E L T E C H N O L O G Y
Hexabore Capillary
• 6 capillary inlets • Samples 6X more ion rich
gas from the source • Captures the majority of
the gas from the source region
Dual Ion Funnel
• Removes the gas but captures the ions
• Removes neutral noise • Extends turbo pump life
iFunnel Technology captures 6x more ions
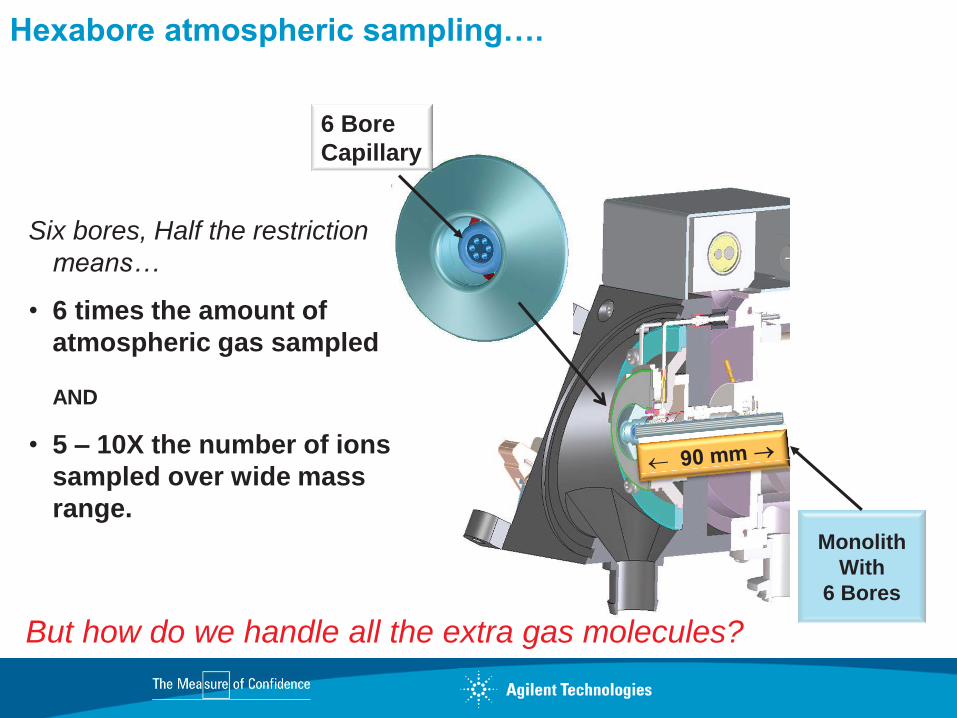
Six bores, Half the restriction means…
• 6 times the amount of atmospheric gas sampled
AND
• 5 – 10X the number of ions sampled over wide mass range.
But how do we handle all the extra gas molecules?
Monolith With
6 Bores
6 Bore Capillary
Hexabore atmospheric sampling….
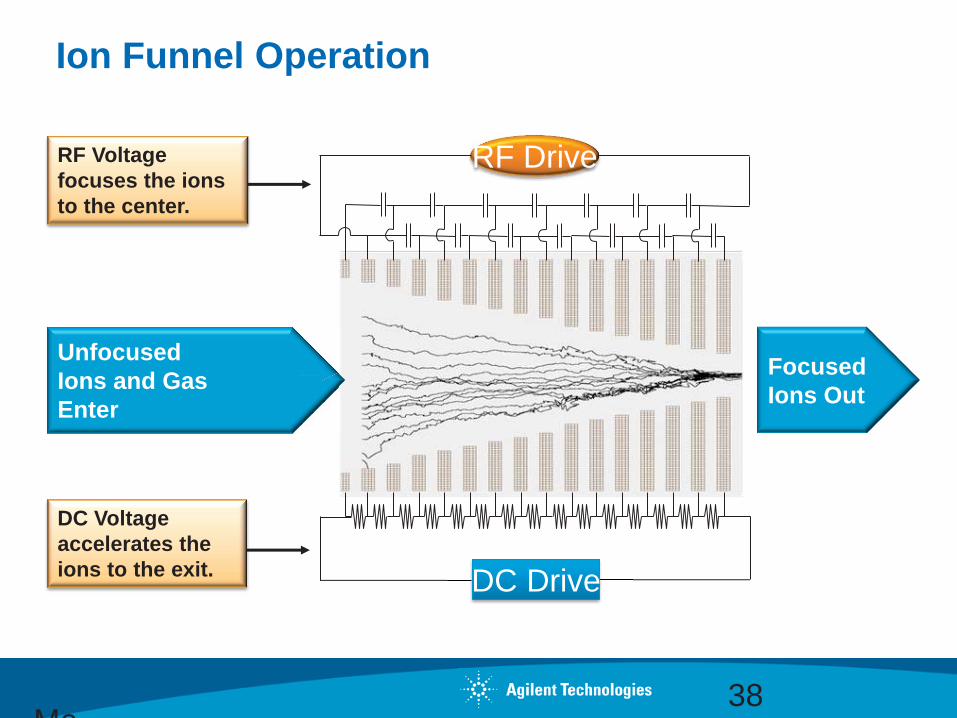
Ion Funnel Operation
RF Drive RF Voltage focuses the ions to the center.
DC Voltage accelerates the ions to the exit. DC Drive
Unfocused Ions and Gas Enter
Focused Ions Out
Ma38
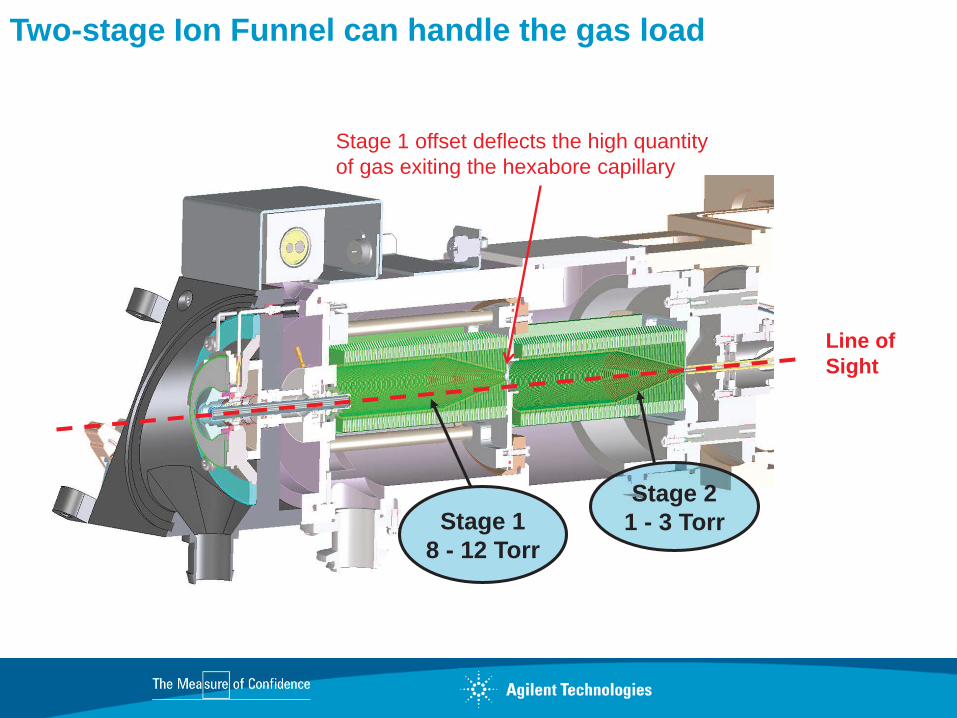
Two-stage Ion Funnel can handle the gas load
Stage 1 8 - 12 Torr
Stage 2 1 - 3 Torr
Stage 1 offset deflects the high quantity of gas exiting the hexabore capillary
Line of Sight

0
1000
2000
3000
4000
5000
6000
7000
8000
9000
10000
2006 2007 2008 2009 2010
6410 6460
6490 SN
R 1
pg
rese
rpin
e
New 6490 advances in sensitivity 50 fold in 4 years

Acquisition Time (min) 0.1 0.2 0.3 0.4 0.5 0.6 0.7 0.8 0.9
X101
4.2
4.3
4.4
4.5
Res
pons
e
Blank
6490/iFunnel: Zeptomolar detection limits 100 attograms Verapamil on-column (200 zeptomoles)
+ MRM (455.3 -> 164.9)
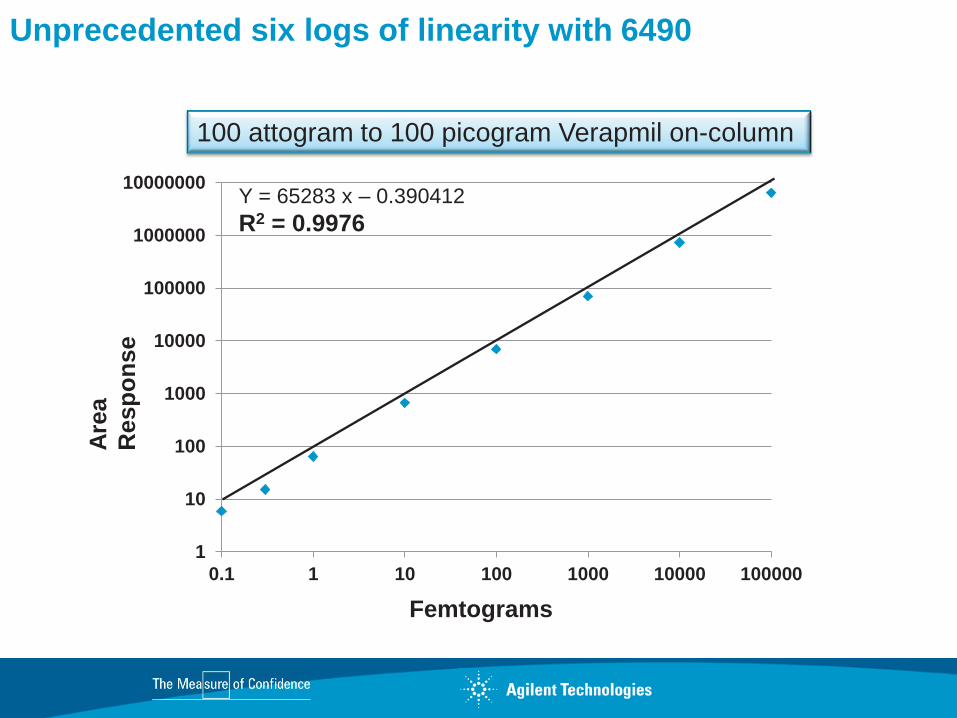
Unprecedented six logs of linearity with 6490
Y = 65283 x – 0.390412 R2 = 0.9976
Femtograms
Area
R
espo
nse
1
10
100
1000
10000
100000
1000000
10000000
0.1 1 10 100 1000 10000 100000
100 attogram to 100 picogram Verapmil on-column
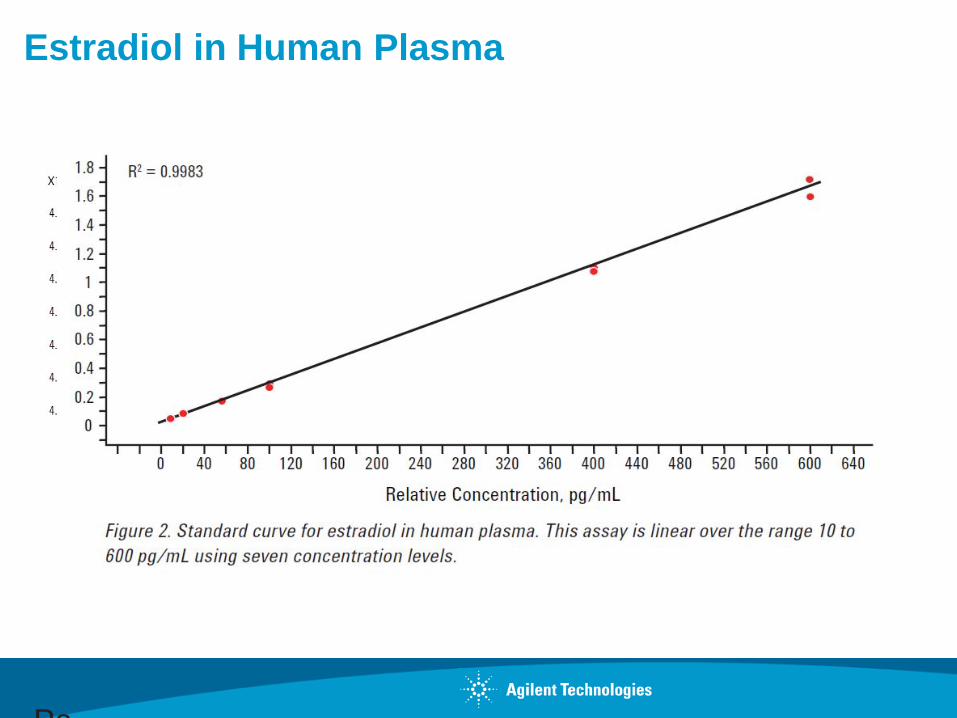
Estradiol in Human Plasma
Pa
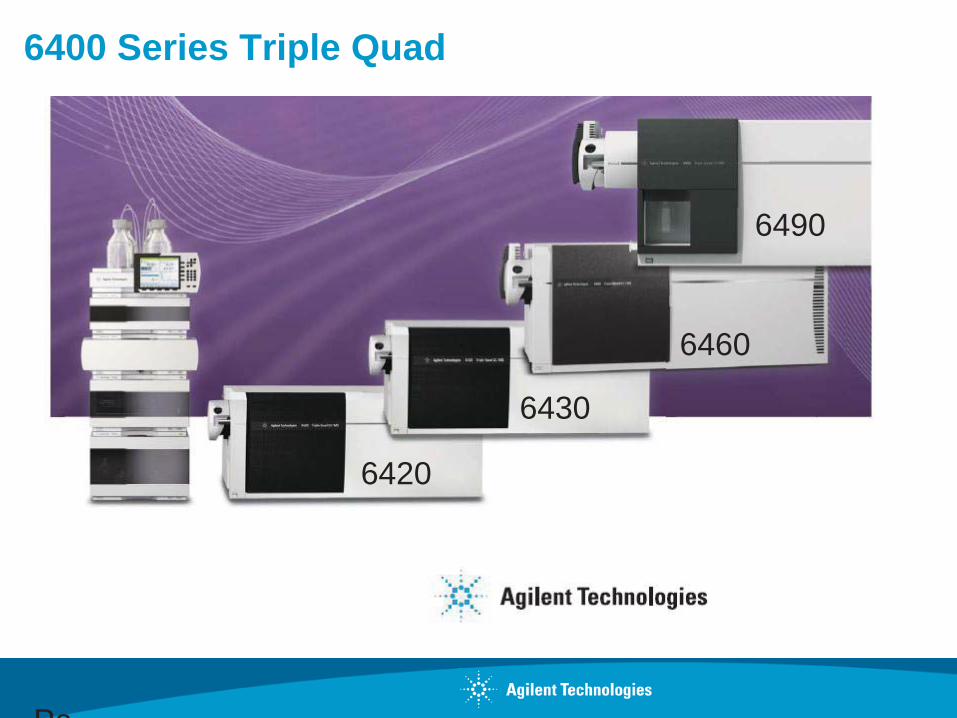
6400 Series Triple Quad
Pa
6420
6430
6460
6490
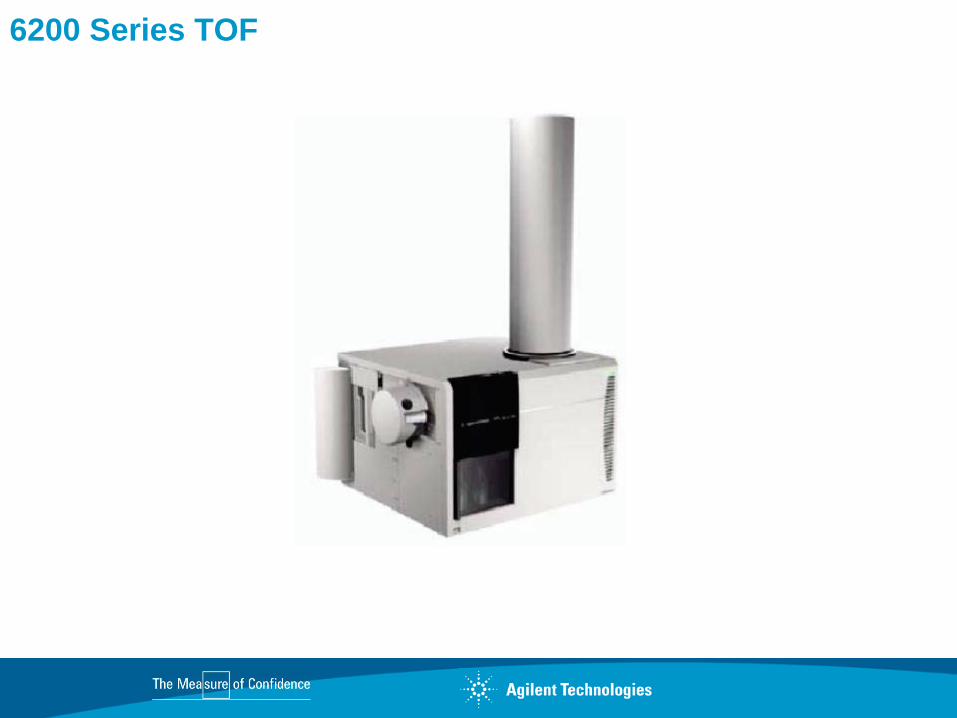
6200 Series TOF
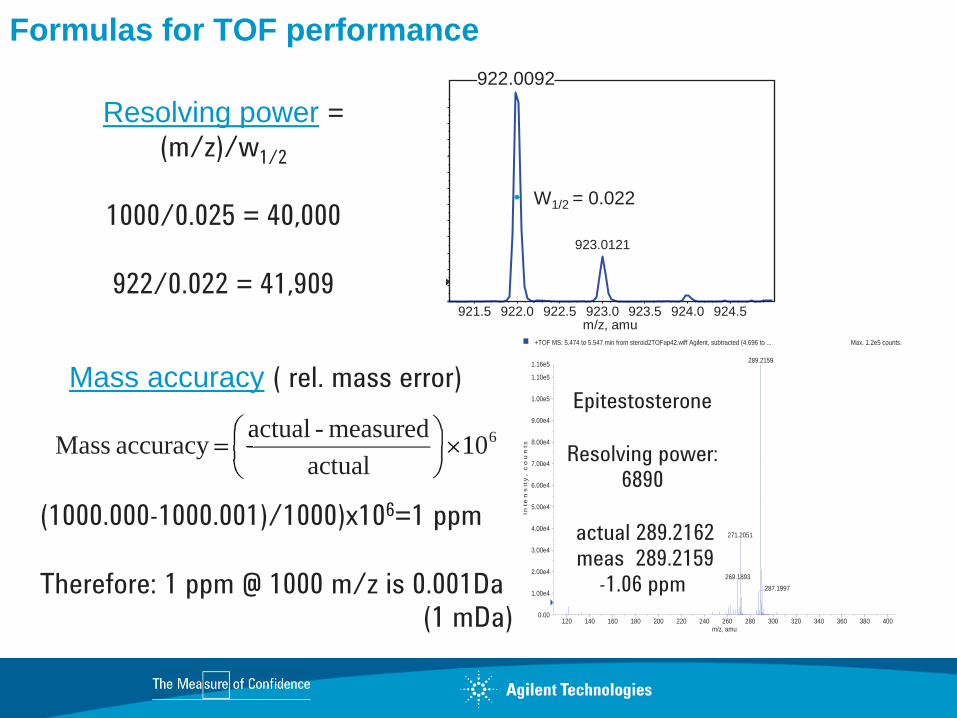
Formulas for TOF performance
Resolving power = (m/z)/w1/2
1000/0.025 = 40,000
922/0.022 = 41,909
Mass accuracy ( rel. mass error)
(1000.000-1000.001)/1000)x106=1 ppm
Therefore: 1 ppm @ 1000 m/z is 0.001Da (1 mDa)
921.5 922.0 922.5 923.0 923.5 924.0 924.5 m/z, amu
923.0121
W1/2 = 0.022
610actual
measured - actual accuracy Mass 1aa
+TOF MS: 5.474 to 5.547 min from steroid2TOFap42.wiff Agilent, subtracted (4.696 to ... Max. 1.2e5 counts.
120 140 160 180 200 220 240 260 280 300 320 340 360 380 400m/z, amu
0.00
1.00e4
2.00e4
3.00e4
4.00e4
5.00e4
6.00e4
7.00e4
8.00e4
9.00e4
1.00e5
1.10e5
1.16e5
Inte
ns
ity
, c
ou
nts
289.2159
271.2051
269.1893287.1997
Epitestosterone
Resolving power: 6890
actual 289.2162 meas 289.2159
-1.06 ppm
922.0092
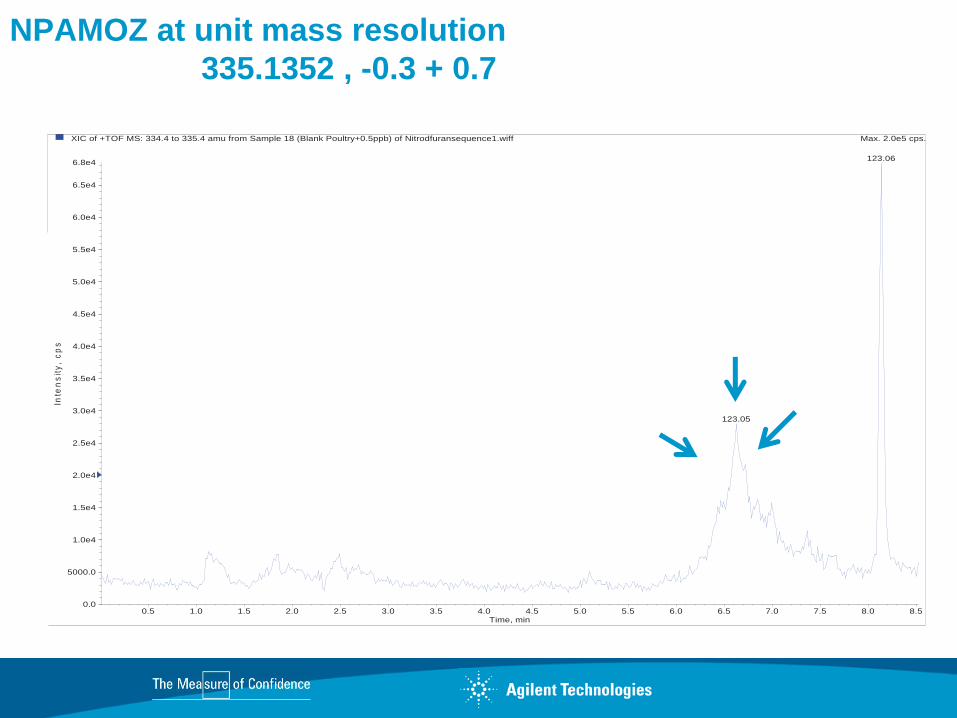
XIC of +TOF MS: 334.4 to 335.4 amu from Sample 18 (Blank Poultry+0.5ppb) of Nitrodfuransequence1.wiff Max. 2.0e5 cps.
0.5 1.0 1.5 2.0 2.5 3.0 3.5 4.0 4.5 5.0 5.5 6.0 6.5 7.0 7.5 8.0 8.5Time, min
0.0
5000.0
1.0e4
1.5e4
2.0e4
2.5e4
3.0e4
3.5e4
4.0e4
4.5e4
5.0e4
5.5e4
6.0e4
6.5e4
6.8e4
Inte
nsi
ty,
cps
123.06
123.05
NPAMOZ at unit mass resolution 335.1352 , -0.3 + 0.7
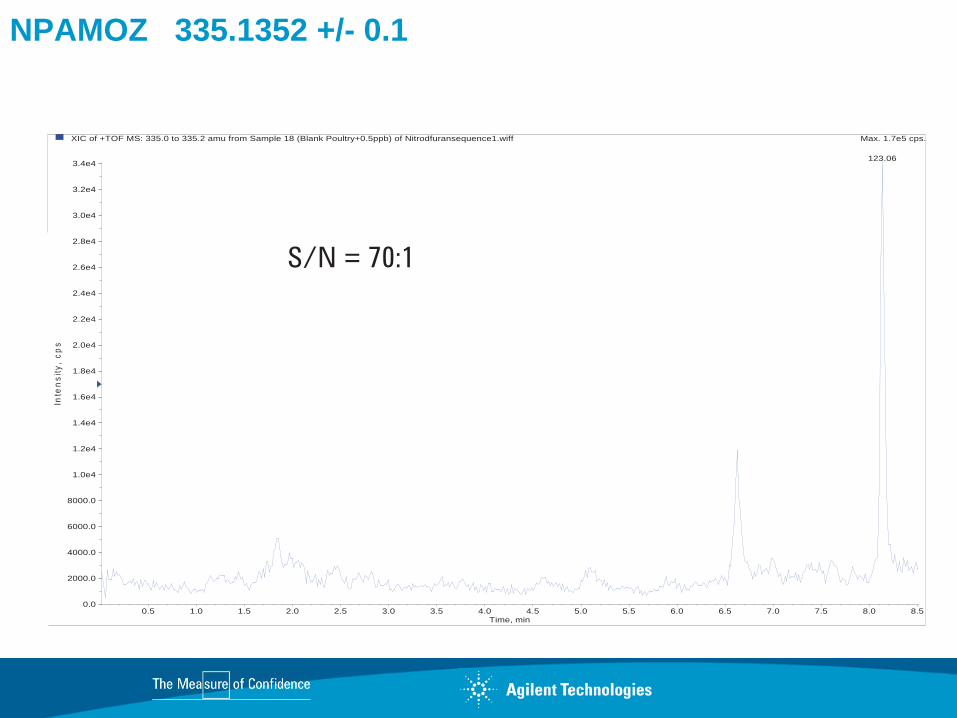
NPAMOZ 335.1352 +/- 0.1
XIC of +TOF MS: 335.0 to 335.2 amu from Sample 18 (Blank Poultry+0.5ppb) of Nitrodfuransequence1.wiff Max. 1.7e5 cps.
0.5 1.0 1.5 2.0 2.5 3.0 3.5 4.0 4.5 5.0 5.5 6.0 6.5 7.0 7.5 8.0 8.5Time, min
0.0
2000.0
4000.0
6000.0
8000.0
1.0e4
1.2e4
1.4e4
1.6e4
1.8e4
2.0e4
2.2e4
2.4e4
2.6e4
2.8e4
3.0e4
3.2e4
3.4e4
Inte
nsi
ty,
cps
123.06
S/N = 70:1

XIC of +TOF MS: 335.1 to 335.2 amu from Sample 18 (Blank Poultry+0.5ppb) of Nitrodfuransequence1.wiff Max. 9.3e4 cps.
0.5 1.0 1.5 2.0 2.5 3.0 3.5 4.0 4.5 5.0 5.5 6.0 6.5 7.0 7.5 8.0 8.5Time, min
0
500
1000
1500
2000
2500
3000
3500
4000
4500
5000
5500
6000
6500
7000
7500
8000
8500
9000
Inte
nsi
ty,
cps
NPAMOZ 335.1352 +/- 100 ppm (335.09939 - 335.16641)
S/N = 103:1
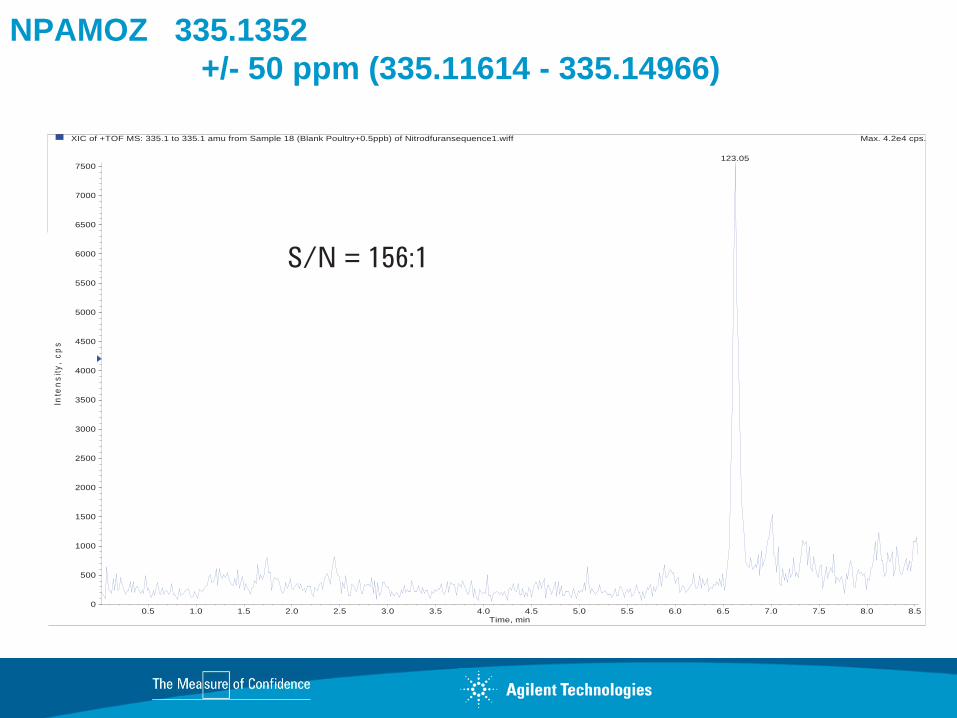
XIC of +TOF MS: 335.1 to 335.1 amu from Sample 18 (Blank Poultry+0.5ppb) of Nitrodfuransequence1.wiff Max. 4.2e4 cps.
0.5 1.0 1.5 2.0 2.5 3.0 3.5 4.0 4.5 5.0 5.5 6.0 6.5 7.0 7.5 8.0 8.5Time, min
0
500
1000
1500
2000
2500
3000
3500
4000
4500
5000
5500
6000
6500
7000
7500
Inte
nsi
ty,
cps
123.05
NPAMOZ 335.1352 +/- 50 ppm (335.11614 - 335.14966)
S/N = 156:1
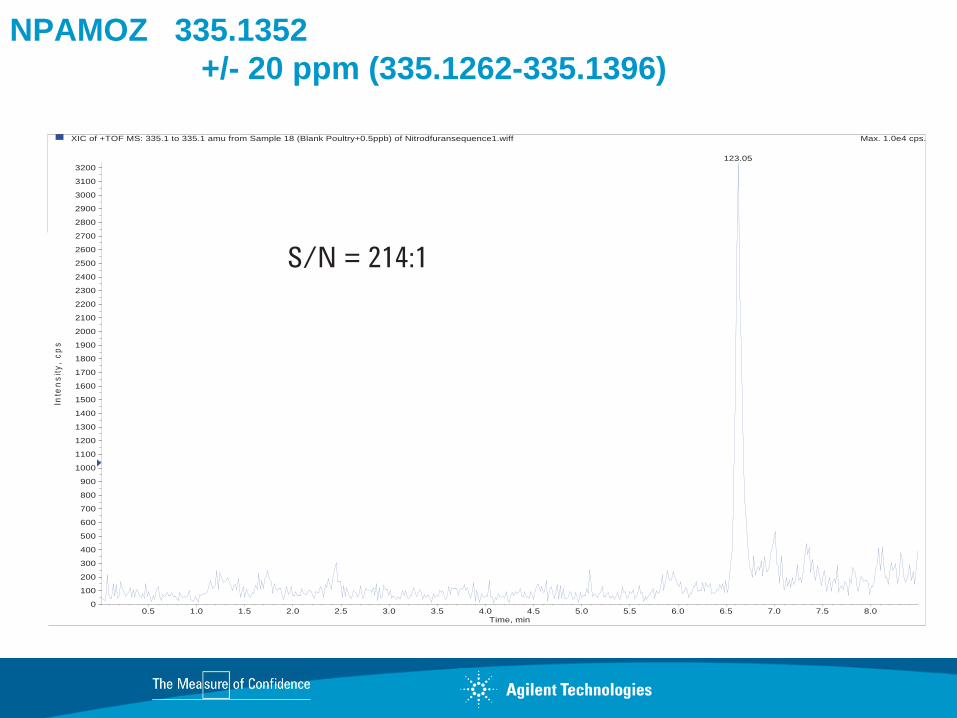
NPAMOZ 335.1352 +/- 20 ppm (335.1262-335.1396)
XIC of +TOF MS: 335.1 to 335.1 amu from Sample 18 (Blank Poultry+0.5ppb) of Nitrodfuransequence1.wiff Max. 1.0e4 cps.
0.5 1.0 1.5 2.0 2.5 3.0 3.5 4.0 4.5 5.0 5.5 6.0 6.5 7.0 7.5 8.0Time, min
0
100
200
300
400
500
600
700
800
900
1000
1100
1200
1300
1400
1500
1600
1700
1800
1900
2000
2100
2200
2300
2400
2500
2600
2700
2800
2900
3000
3100
3200
Inte
nsi
ty,
cps
123.05
S/N = 214:1
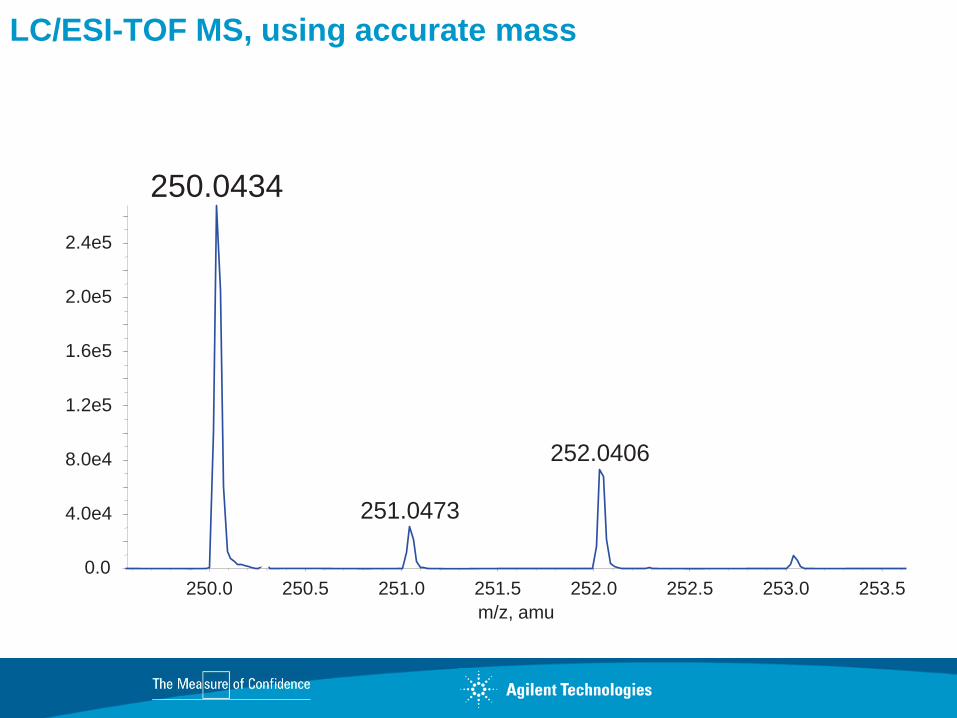
LC/ESI-TOF MS, using accurate mass
250.0 250.5 251.0 251.5 252.0 252.5 253.0 253.5 m/z, amu
0.0
4.0e4
8.0e4
1.2e5
1.6e5
2.0e5
2.4e5
250.0434
252.0406
251.0473
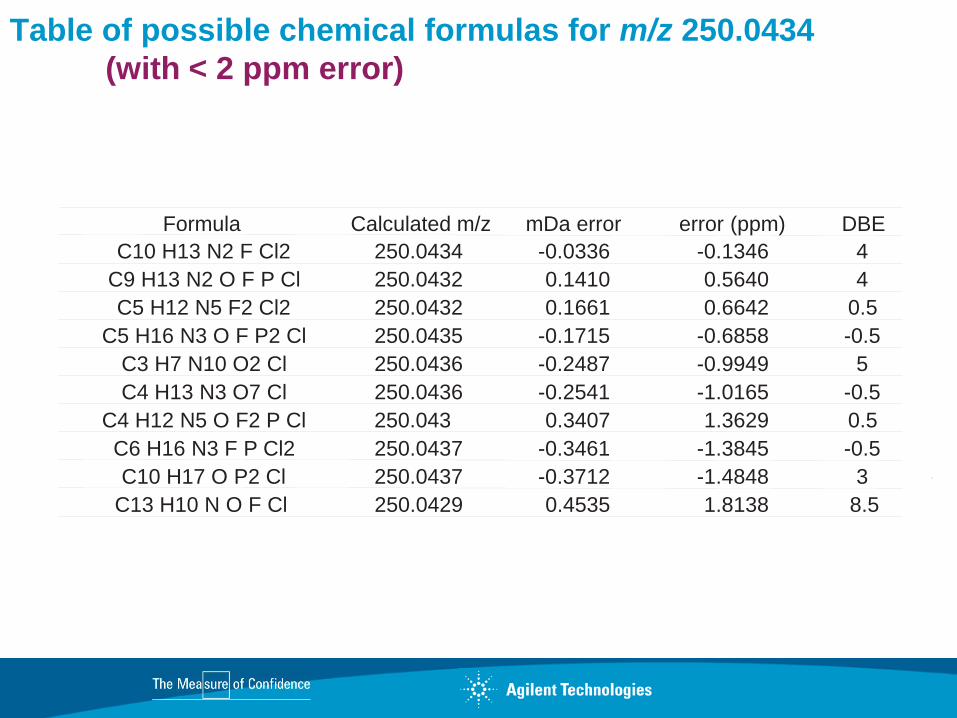
Table of possible chemical formulas for m/z 250.0434 (with < 2 ppm error)
Formula Calculated m/z mDa error error (ppm) DBE C10 H13 N2 F Cl2 250.0434 -0.0336 -0.1346 4
C9 H13 N2 O F P Cl 250.0432 0.1410 0.5640 4 C5 H12 N5 F2 Cl2 250.0432 0.1661 0.6642 0.5
C5 H16 N3 O F P2 Cl 250.0435 -0.1715 -0.6858 -0.5 C3 H7 N10 O2 Cl 250.0436 -0.2487 -0.9949 5 C4 H13 N3 O7 Cl 250.0436 -0.2541 -1.0165 -0.5
C4 H12 N5 O F2 P Cl 250.043 0.3407 1.3629 0.5 C6 H16 N3 F P Cl2 250.0437 -0.3461 -1.3845 -0.5 C10 H17 O P2 Cl 250.0437 -0.3712 -1.4848 3
C13 H10 N O F Cl 250.0429 0.4535 1.8138 8.5
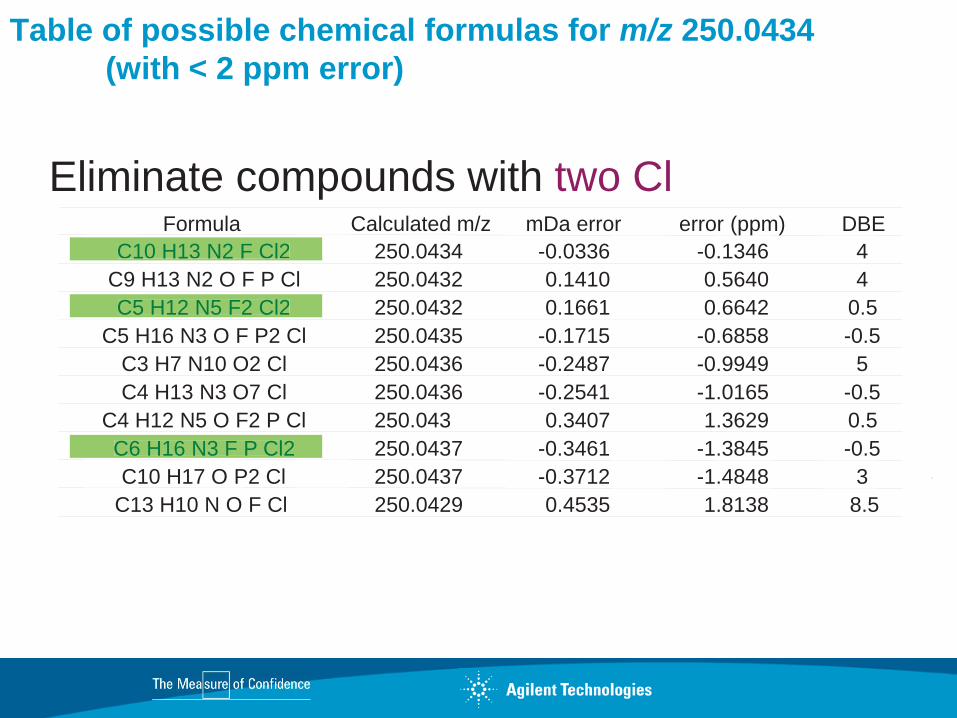
C10 H13 N2 F Cl2
C5 H12 N5 F2 Cl2
C6 H16 N3 F P Cl2
Eliminate compounds with two Cl
Formula Calculated m/z mDa error error (ppm) DBE C10 H13 N2 F Cl2 250.0434 -0.0336 -0.1346 4
C9 H13 N2 O F P Cl 250.0432 0.1410 0.5640 4 C5 H12 N5 F2 Cl2 250.0432 0.1661 0.6642 0.5
C5 H16 N3 O F P2 Cl 250.0435 -0.1715 -0.6858 -0.5 C3 H7 N10 O2 Cl 250.0436 -0.2487 -0.9949 5 C4 H13 N3 O7 Cl 250.0436 -0.2541 -1.0165 -0.5
C4 H12 N5 O F2 P Cl 250.043 0.3407 1.3629 0.5 C6 H16 N3 F P Cl2 250.0437 -0.3461 -1.3845 -0.5 C10 H17 O P2 Cl 250.0437 -0.3712 -1.4848 3
C13 H10 N O F Cl 250.0429 0.4535 1.8138 8.5
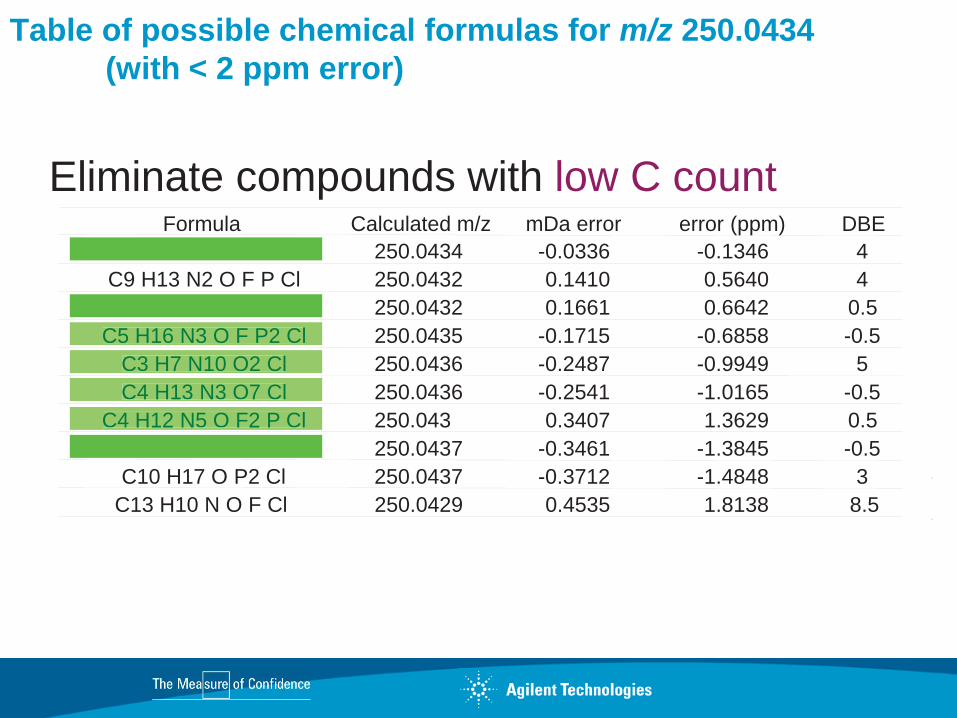
C5 H16 N3 O F P2 ClC3 H7 N10 O2 ClC4 H13 N3 O7 Cl
C4 H12 N5 O F2 P Cl
Eliminate compounds with low C count
Table of possible chemical formulas for m/z 250.0434 (with < 2 ppm error)

Formula Calculated m/z mDa error error (ppm) DBE C10 H13 N2 F Cl2 250.0434 -0.0336 -0.1346 4
C9 H13 N2 O F P Cl 250.0432 0.1410 0.5640 4 C5 H12 N5 F2 Cl2 250.0432 0.1661 0.6642 0.5
C5 H16 N3 O F P2 Cl 250.0435 -0.1715 -0.6858 -0.5 C3 H7 N10 O2 Cl 250.0436 -0.2487 -0.9949 5 C4 H13 N3 O7 Cl 250.0436 -0.2541 -1.0165 -0.5
C4 H12 N5 O F2 P Cl 250.043 0.3407 1.3629 0.5 C6 H16 N3 F P Cl2 250.0437 -0.3461 -1.3845 -0.5 C10 H17 O P2 Cl 250.0437 -0.3712 -1.4848 3
C13 H10 N O F Cl 250.0429 0.4535 1.8138 8.5
C9 H13 N2 O F P Cl
C10 H17 O P2 Cl
Apply the ‘Nitrogen Rule’
10 -> 1 compound
Table of possible chemical formulas for m/z 250.0434 (with < 2 ppm error)
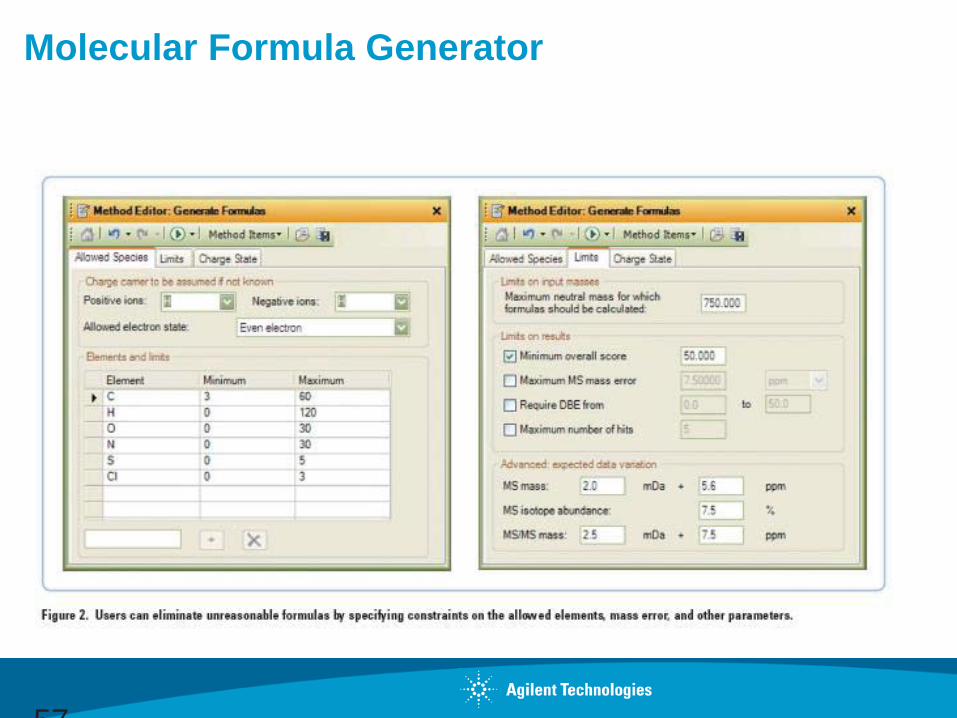
Molecular Formula Generator
57
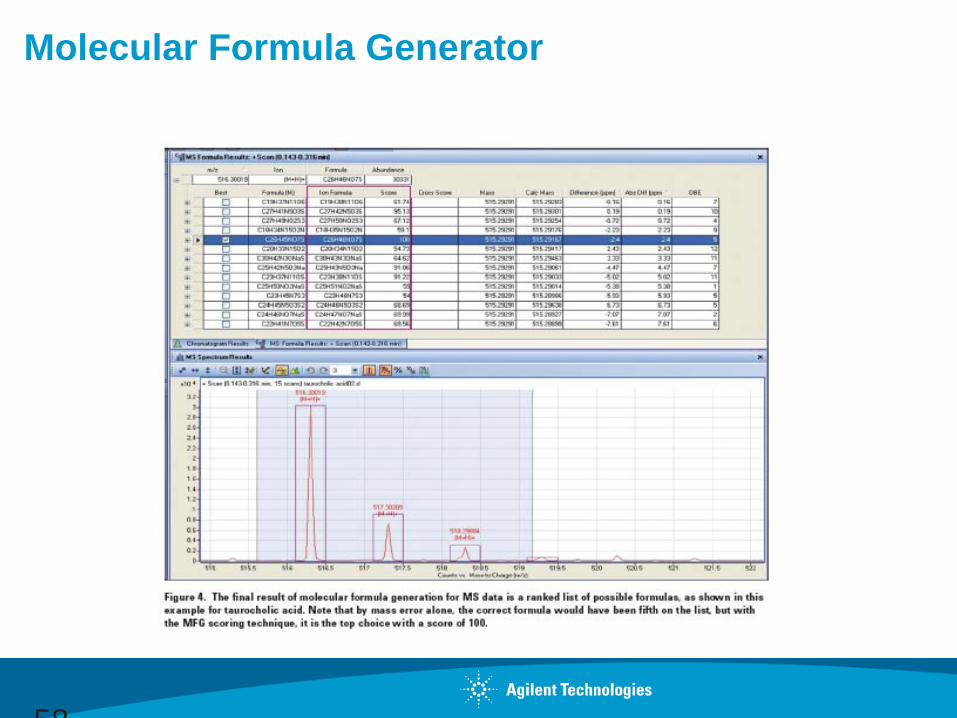
Molecular Formula Generator
58
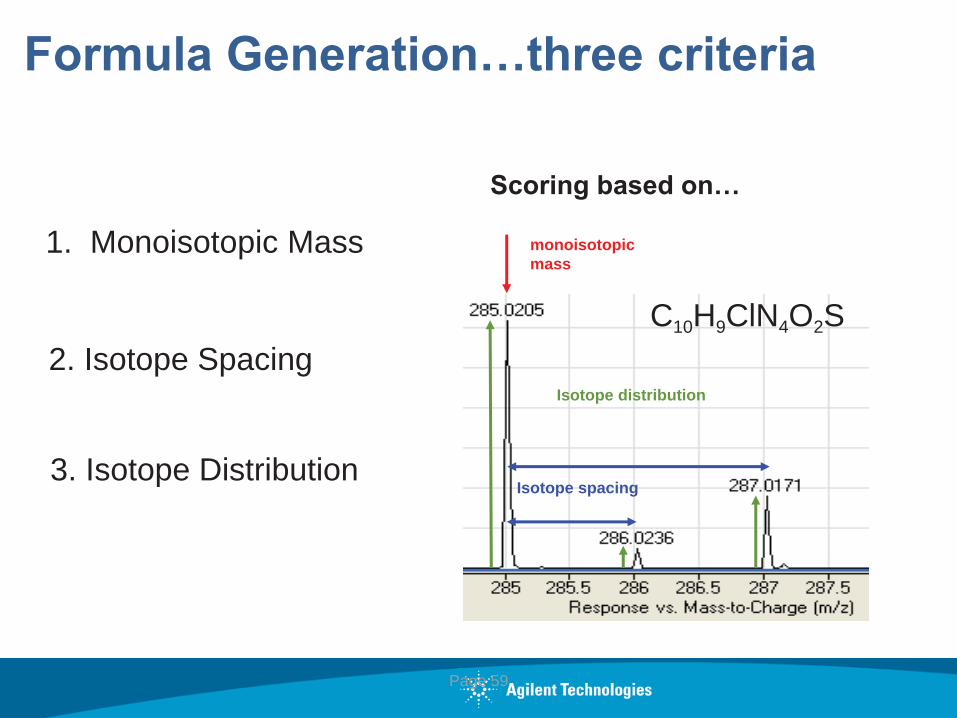
Formula Generation…three criteria
Page 59
monoisotopic mass
Isotope spacing
Isotope distribution
Scoring based on…
1. Monoisotopic Mass
2. Isotope Spacing C10H9ClN4O2S
3. Isotope Distribution
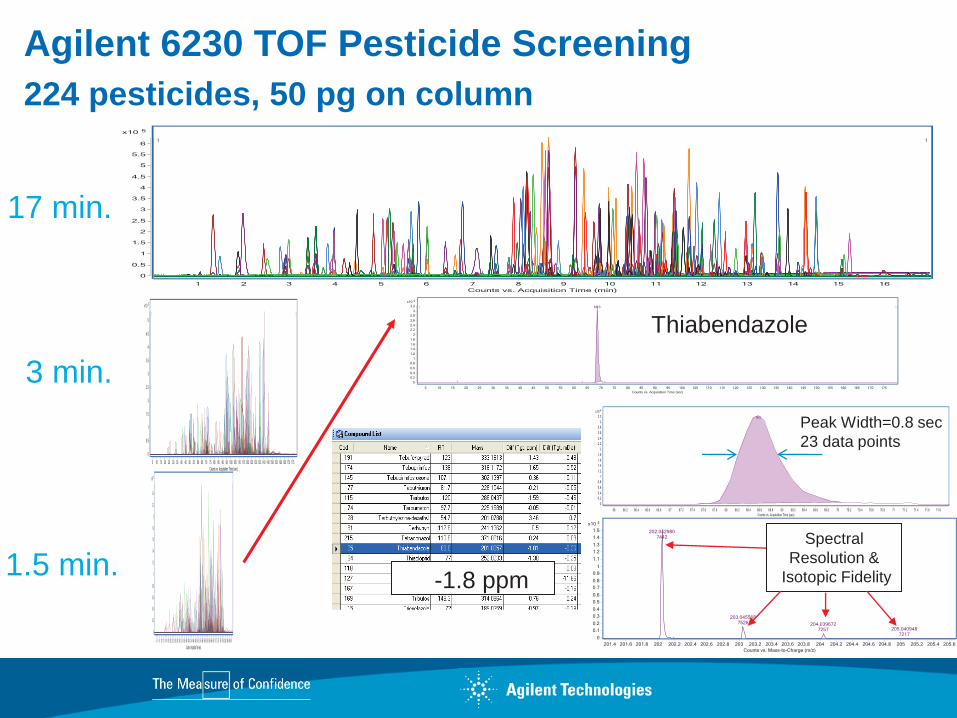
17 min.
3 min.
1.5 min.
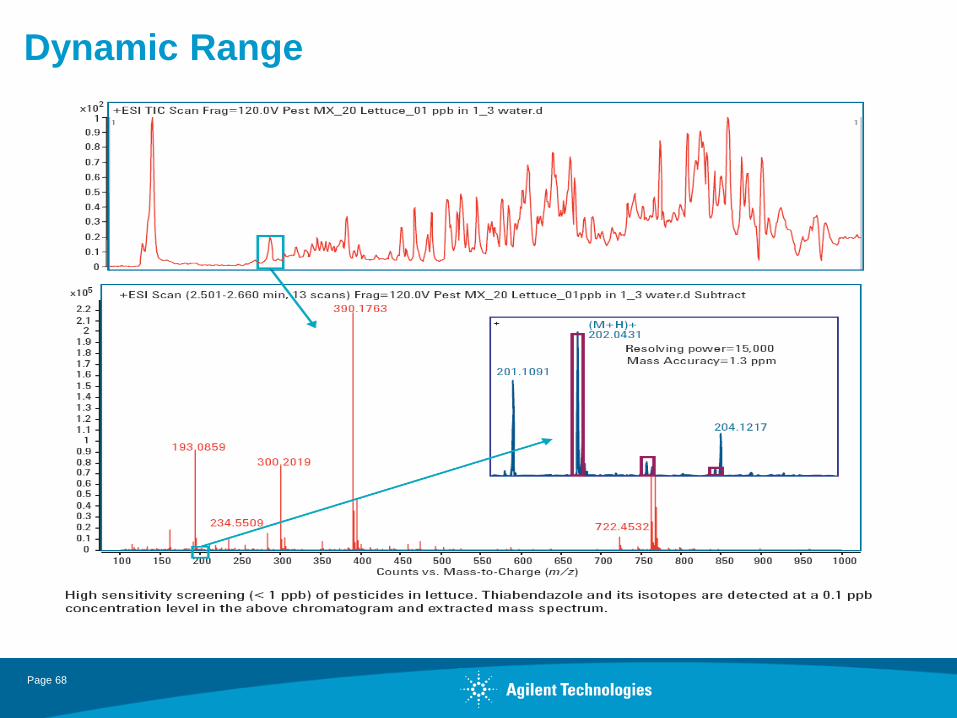
Agilent 6230 TOF Pesticide Screening 224 pesticides, 50 pg on column
Thiabendazole
Peak Width=0.8 sec 23 data points
-1.8 ppm
Spectral Resolution &
Isotopic Fidelity
6500 Series QTOF design
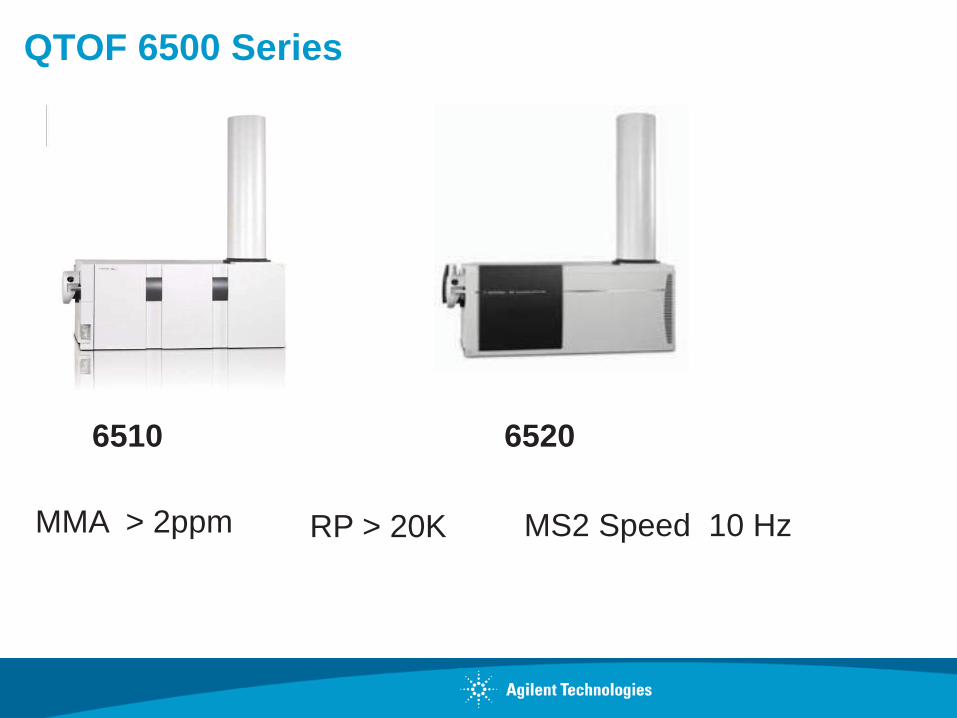
QTOF 6500 Series
6510 6520
MMA > 2ppm RP > 20K MS2 Speed 10 Hz
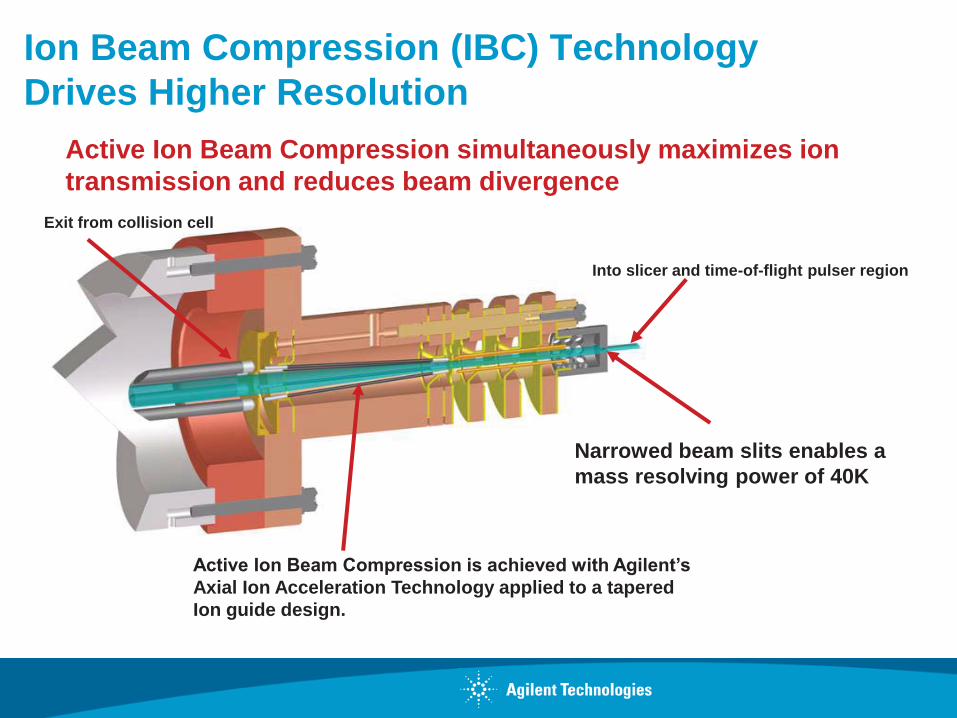
Ion Beam Compression (IBC) Technology Drives Higher Resolution
Active Ion Beam Compression is achieved with Agilent’s Axial Ion Acceleration Technology applied to a tapered Ion guide design.
Exit from collision cell
Into slicer and time-of-flight pulser region
Narrowed beam slits enables a mass resolving power of 40K
Active Ion Beam Compression simultaneously maximizes ion transmission and reduces beam divergence

Pa
6540 UHD
Ultra High Definition QTOF
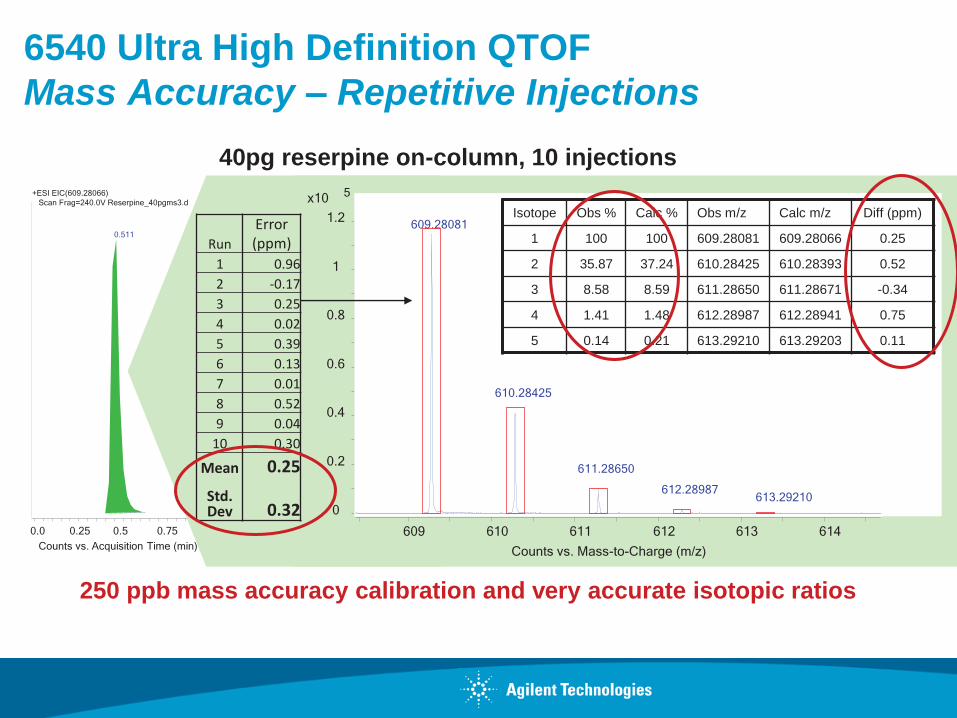
6540 Ultra High Definition QTOF Mass Accuracy – Repetitive Injections
+ESI EIC(609.28066) Scan Frag=240.0V Reserpine_40pgms3.d
0.511
Counts vs. Acquisition Time (min) 0.0 0.25 0.5 0.75 1
5 x10
0
0.2
0.4
0.6
0.8
1
1.2 609.28081
610.28425
611.28650
612.28987
Counts vs. Mass-to-Charge (m/z) 609 610 611 612 613 614
613.29210
Isotope Obs % Calc % Obs m/z Calc m/z Diff (ppm)
1 100 100 609.28081 609.28066 0.25
2 35.87 37.24 610.28425 610.28393 0.52
3 8.58 8.59 611.28650 611.28671 -0.34
4 1.41 1.48 612.28987 612.28941 0.75
5 0.14 0.21 613.29210 613.29203 0.11
Run Error (ppm)
1 0.96 2 -0.17 3 0.25 4 0.02 5 0.39 6 0.13 7 0.01 8 0.52 9 0.04
10 0.30
Mean 0.25
Std. Dev 0.32
40pg reserpine on-column, 10 injections
250 ppb mass accuracy calibration and very accurate isotopic ratios

6540 Ultra High Definition QTOF Sensitivity – Full Scan MS Mode- 1 picogram
3 x10
0
1
2 609.280347
(M+H)+
610.283168
611.287790
612.292649
Counts vs. Mass-to-Charge (m/z)
607 608 609 610 611 612 613 614 615 616
4 x10
0
1
2
Counts vs. Acquisition Time (min)
0.0 0.5 1 1.5
S/N = 319 RMS
Ratio m/z Diff. Theor. Expt. Theor. Expt. (ppm) 100.00 100.00 609.2807 609.2803 -0.51 37.24 36.36 610.2839 610.2832 -1.25 8.59 8.39 611.2867 611.2878 1.77 1.48 1.45 612.2894 612.2926 5.29
Resolution ~ 33,000
Excellent sensitivity, accuracy and resolution at 1 pg on column
6 x10
0
0.5
1
1.5
2
2.5
3
3.5
4
Counts vs. Mass - to - Charge ( m/z ) 322 322.5 323 323.5 324 324.5 325 325.5 326
322.05432 20535
323.05854 20415 324.05976
21517 325.06230
21835 326.20440
17254
6 x10
0
0.5
1
1.5
2
2.5
3
3.5
4
Counts vs. Mass - to - Charge ( m/z ) 322 322.5 323 323.5 324 324.5 325 325.5 326
322.05432 20535
323.05854 20415 324.05976
21517 325.06230
21835 326.20440
17254
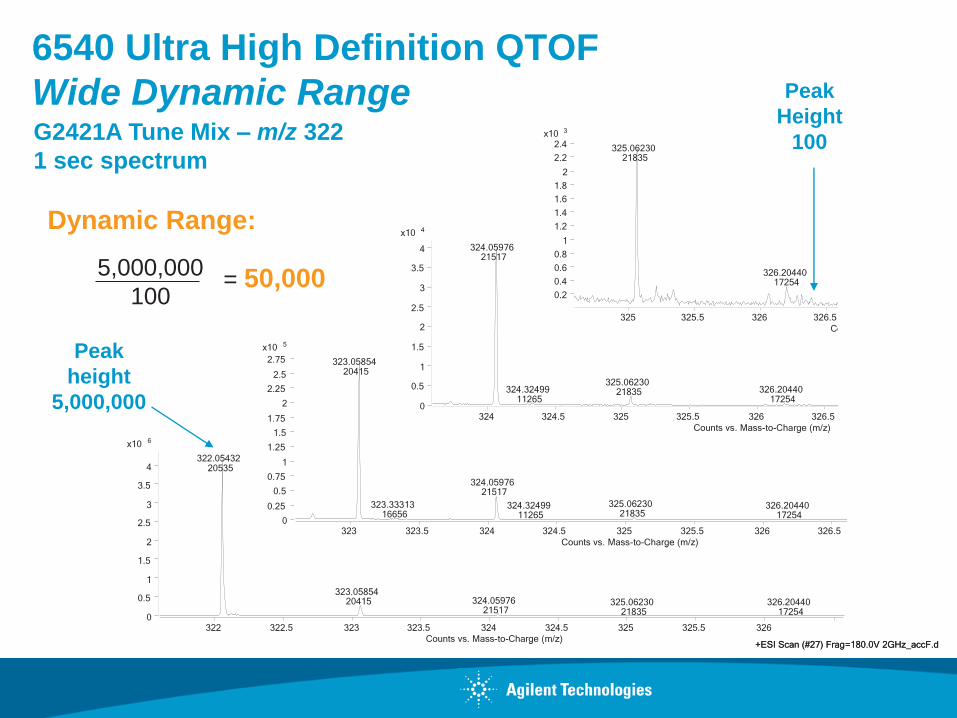
6540 Ultra High Definition QTOF Wide Dynamic Range
Peak height
5,000,000
Dynamic Range:
G2421A Tune Mix – m/z 322 1 sec spectrum
5x10
0
0.25
0.5
0.75
1
1.25
1.5
1.75
2
2.25
2.5
2.75
Counts vs. Mass-to-Charge (m/z)323 323.5 324 324.5 325 325.5 326 326.5
323.0585420415
324.0597621517
325.0623021835
323.3331316656
324.3249911265
326.2044017254
5x10
0
0.25
0.5
0.75
1
1.25
1.5
1.75
2
2.25
2.5
2.75
Counts vs. Mass-to-Charge (m/z)323 323.5 324 324.5 325 325.5 326 326.5
323.0585420415
324.0597621517
325.0623021835
323.3331316656
324.3249911265
326.2044017254
4x10
0
0.5
1
1.5
2
2.5
3
3.5
4
Counts vs. Mass-to-Charge (m/z)324 324.5 325 325.5 326 326.5
324.0597621517
325.0623021835324.32499
11265326.20440
17254
4x10
0
0.5
1
1.5
2
2.5
3
3.5
4
Counts vs. Mass-to-Charge (m/z)324 324.5 325 325.5 326 326.5
324.0597621517
325.0623021835324.32499
11265326.20440
17254
3x10
0.2
0.4
0.6
0.8
1
1.2
1.4
1.6
1.8
2
2.2
2.4
Co325 325.5 326 326.5
325.0623021835
326.2044017254
3x10
0.2
0.4
0.6
0.8
1
1.2
1.4
1.6
1.8
2
2.2
2.4
Co325 325.5 326 326.5
325.0623021835
326.2044017254
+ESI Scan (#27) Frag =180.0V 2GHz_accF.d +ESI Scan (#27) Frag =180.0V 2GHz_accF.d
5,000,000 100
= 50,000
Peak Height
100
Dynamic Range
Page 68
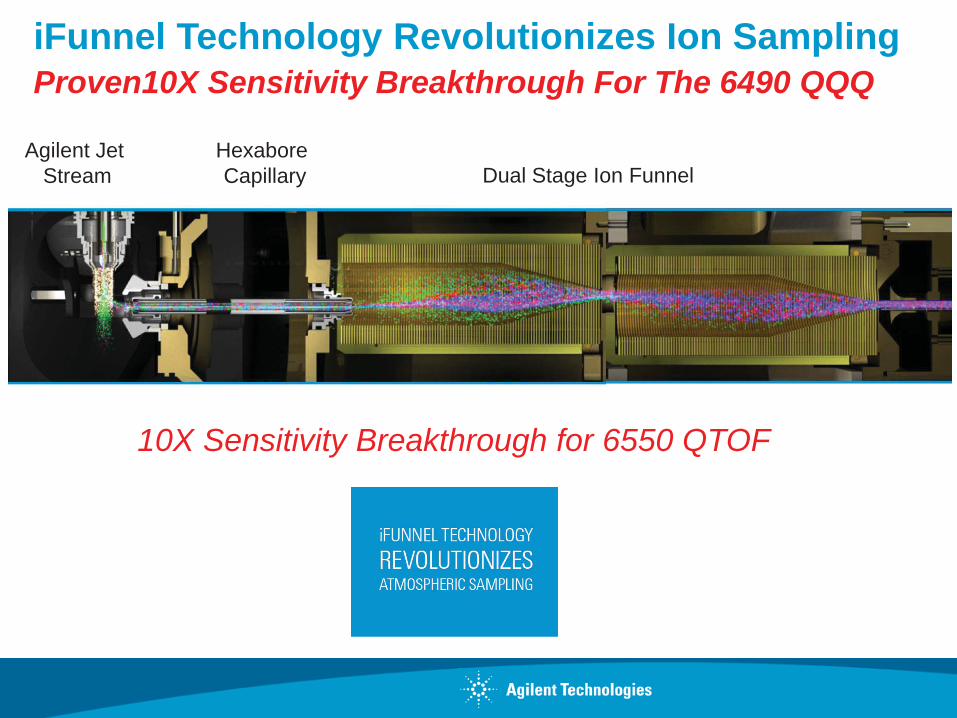
iFunnel Technology Revolutionizes Ion Sampling Proven10X Sensitivity Breakthrough For The 6490 QQQ Agilent Jet Stream
Hexabore Capillary Dual Stage Ion Funnel
10X Sensitivity Breakthrough for 6550 QTOF

6550 iFunnel Q-TOF LC/MS System
ASMS 2010
Sensitivity
• Dramatically improved quantitative capabilities • New Qual/Quan Workflows • Superior metabolite and protein detection • Non-targeted compound screening
Comprehensive Performance Enhancements
• Mass Resolution >40,000 • 50 spectra /sec MS and 33 spectra/sec MS/MS • 5 orders of linear dynamic range • <1 ppm MS mass accuracy; <2 ppm MS/MS • Unrivalled sensitivity
New 6550 iFunnel QTOF 10X Sensitivity Gain Enables Applications
TOF and QTOF Fundamentals
March 2007 Page 71
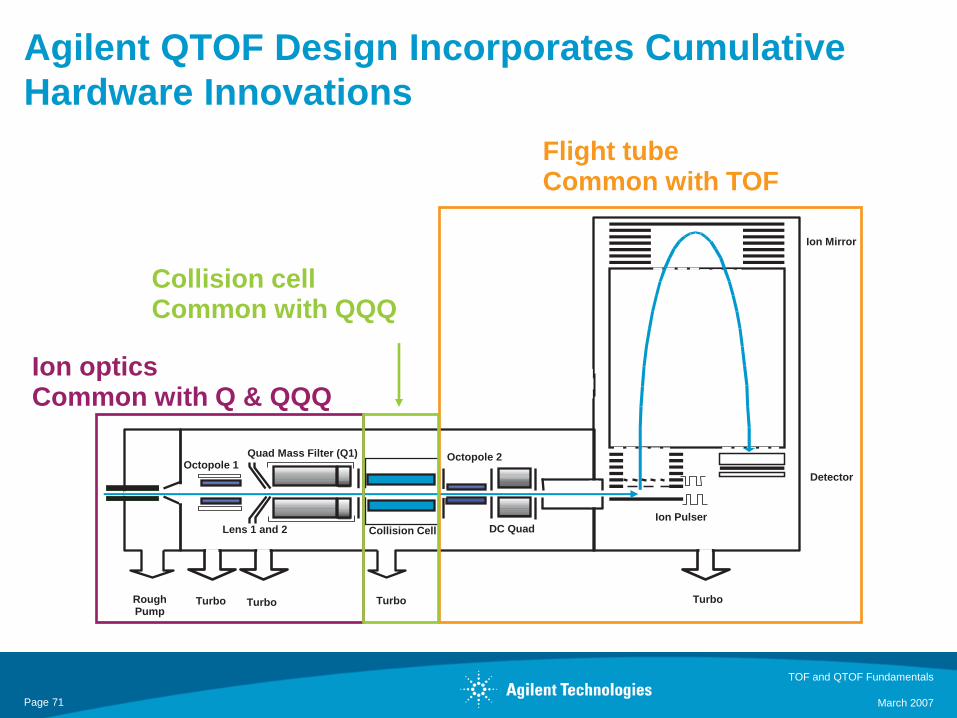
Agilent QTOF Design Incorporates Cumulative Hardware Innovations
Ion optics Common with Q & QQQ
Flight tube Common with TOF
Octopole 1
DC Quad
Collision cell Common with QQQ
Rough Pump
Turbo Turbo Turbo
Quad Mass Filter (Q1)
Collision Cell Lens 1 and 2
Octopole 2
Ion Pulser
Ion Mirror
Detector
Turbo
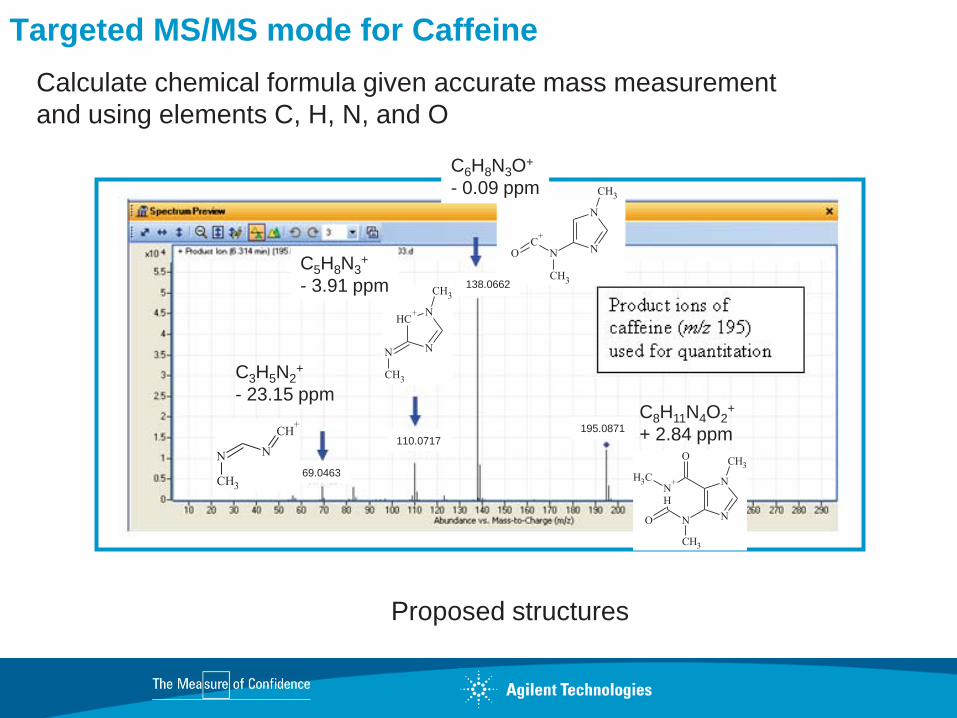
Targeted MS/MS mode for Caffeine
N
NH
+ N
NO
CH3O
CH3
CH3
NC+
N
NO
CH3
CH3
C8H11N4O2+
+ 2.84 ppm
C6H8N3O+ - 0.09 ppm
Calculate chemical formula given accurate mass measurement and using elements C, H, N, and O
C3H5N2+
- 23.15 ppm
Proposed structures
CH +
N
N
N
CH3
CH3
C5H8N3+
- 3.91 ppm
N
CH+
N
CH369.0463
110.0717
138.0662
195.0871

MS-MS Data Resolved
Pa
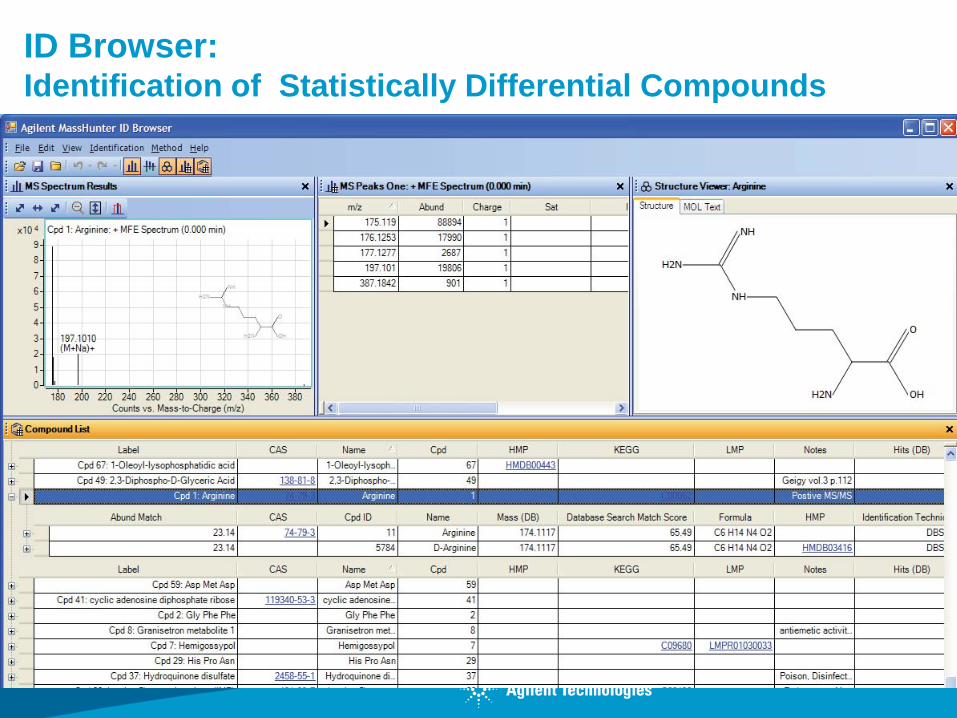
ID Browser: Identification of Statistically Differential Compounds
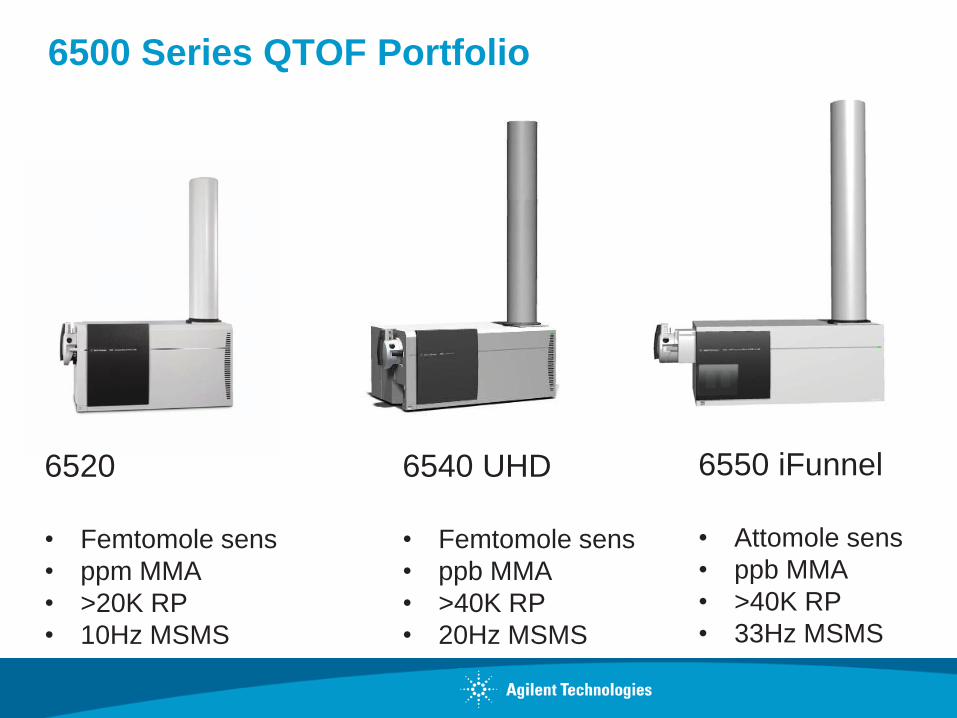
6500 Series QTOF Portfolio
6520 • Femtomole sens • ppm MMA • >20K RP • 10Hz MSMS
6540 UHD • Femtomole sens • ppb MMA • >40K RP • 20Hz MSMS
6550 iFunnel • Attomole sens • ppb MMA • >40K RP • 33Hz MSMS

Thank you !