aging and health in america
DESCRIPTION
ÂTRANSCRIPT

National Center for Chronic Disease Prevention and Health Promotion Division of Population Health

The State of Aging and Health in America 2013 is the sixth volume of a series that presents a snapshot of the health and aging landscape in the United States or another region of the world. This series presents the most current information and statistics, often specifically commissioned for the report, on the health of older adults. The State of Aging and Health in America 2013 focuses on the health of adults aged 65 years or older in the United States and was supported by the Centers for Disease Control and Prevention.
Suggested Citation: Centers for Disease Control and Prevention. The State of Aging and Health in America 2013. Atlanta, GA: Centers for Disease Control and Prevention, US Dept of Health and Human Services; 2013.
PDF and interactive version available at www.cdc.gov/aging.
Web site addresses of nonfederal organizations are provided solely as a service to our readers. Provision of an address does not constitute an endorsement by the Centers for Disease Control and Prevention (CDC) or the federal government, and none should be inferred. CDC is not responsible for the content of other organizations’ Web pages.

Foreword “The State of Aging and Health in America 2013 is a valuable tool for states and communities to meet the health challenges of our aging population. There are proven tools to help prevent and limit the impact of both infectious and noninfectious diseases, and this report serves as a report card on how we are doing addressing health threats.”
—Thomas R. Frieden, MD, MPH, Director Centers for Disease Control and Prevention, U.S. Department of Health and Human Services

PAGE ii The State of Aging and Health in America 2013
Executive Summary
Twentieth-century advances in protecting and promoting health among older adults have provided many opportunities for overcoming the challenges of an aging society. The health indicators presented in The State of Aging and Health in America 2013 highlight these opportunities. By working to meet the goals for each of these key indicators, our nation can help to ensure that all of its citizens can look forward to living longer and living well.
The State of Aging and Health in America 2013 provides a snapshot of our nation’s progress in promoting prevention, improving the health and well-being of older adults, and reducing behaviors that contribute to premature death and disability. In addition, the report highlights mobility (referring to movement in all of its forms) and how optimal mobility is fundamental to healthy aging.
Demographic changes create an urgent needThe growth in the number and proportion of older adults is unprecedented in the history of the United States. Two factors—longer life spans and aging baby boomers—will combine to double the population of Americans aged 65 years or older during the next 25 years to about 72 million. By 2030, older adults will account for roughly 20% of the U.S. population.
Chronic conditions present a strong economic incentive for actionDuring the past century, a major shift occurred in the leading causes of death for all age groups, including older adults, from infectious diseases and acute illnesses to chronic diseases and degenerative illnesses. More than a quarter of all Americans and two out of every three older Americans have multiple chronic conditions, and treatment for this population accounts for 66% of the country’s health care budget.
The Report CardsThe National Report Card on Healthy Aging reports on 15 indicators of older adult health, 8 of which are identified in Healthy People 2020, the national health agenda of the U.S. Department of Health and Human Services. These 15 indicators are grouped into 4 areas: Health Status, Health Behaviors, Preventive Care and Screening, and Injuries. In addition, the report assigns a “met” or “not met” score to states on the basis of their attainment of Healthy People 2020 targets.
For most indicators, the Behavioral Risk Factor Surveillance System (BRFSS) is not the official data source for tracking Healthy People 2020 targets. Some of these targets are for all adults aged 18 or older, not just those aged 65 years or older. For this report, we use BRFSS data to report how well states are doing in meeting Healthy People 2020 targets for their older adult populations. Taken together, these indicators present a comprehensive picture of older adult health in the United States.
The United States has met six of the Healthy People 2020 targets in this report�� No leisure time physical activity in past month (31.4% vs. goal of 32.6%).
�� Obesity (24.5% vs. goal of 30.6%).�� Current smoking (8.4% vs. goal of 12%).�� Taking medications for high blood pressure (94.1% vs. goal of 77.4%).�� Mammograms within past 2 years (81.9% vs. goal of 70%).�� Colorectal cancer screenings (72.2 % vs. goal of 70%).

The State of Aging and Health in America 2013 PAGE iii
But improvement on the remaining Healthy People 2020 targets is needed�� Flu vaccine in past year (66.9% vs. goal of 90%).�� Ever had pneumonia vaccine (68.1% vs. goal of 90%).
�� Up to date on select preventive services (49.0% vs. goal of 50.9% for men; 49.0% vs. goal of 52.7% for women).
The State-by-State Report Card on Healthy Aging ranks all 50 states and the District of Columbia (DC) for each health indicator. Variation among states can be significant. For example, in Utah and Connecticut, 70.9% of older adults have retained most of their natural teeth (i.e., lost five or fewer teeth), whereas in West Virginia, this is true for only 33.4% of older adults.
Most states are well ahead of schedule on four health indicators for older adults.�� Obesity 50 states and DC met the 2020 target.�� Taking medications for high blood pressure 50 states and DC met the 2020 target.�� Mammography within past 2 years 50 states and DC met the 2020 target.�� Current smoking 49 states and DC met the 2020 target.
However, all states have significant work to do on other indicators for older adults.�� Flu vaccine in past year 0 states met the 2020 target.�� Ever had pneumonia vaccine 0 states met the 2020 target.
Opportunities for Enhancing Quality of LifeThe State of Aging and Health in America 2013 focuses on several areas of concern that, if effectively addressed, will significantly improve the quality of life for older adults.
MobilityMobility is fundamental to everyday life and central to an understanding of health and well-being among older populations. Impaired mobility is associated with a variety of adverse health outcomes. As the age of the U.S. population continues to increase, aging and public health professionals have a role to play in improving mobility for older adults. There are critical gaps in the assessment and measurement of mobility among older adults who live in the community, particularly those who have physical disabilities or cognitive impairments. By changing physical environments and creating unique integrated interventions across various disciplines, we can improve mobility for older adults.
Innovative Approaches Many states and communities have developed innovative ways to ensure that key information about the health of older adults is available to those who need it to plan programs, set priorities, and track trends. In response to the growing need for supportive communities that enhance mobility, this report highlights the efforts of the Atlanta Regional Commission’s (ARC’s) Area Agency on Aging and Hendersonville, N.C. ARC is creating a broad plan to transform neighborhoods, cities, and counties into places where people of all ages can live and Hendersonville has implemented the Walk Wise, Drive Smart program.
The State of Aging and Health in America 2013 highlights the need to maintain the progress made on several health indicators and increase our efforts to address other important health issues. This report shows that the key to improving the health and quality of life for all older adults living in the United States will be collaboration between multiple and diverse groups on national, state, and local levels. These groups will include the public, health care providers, government agencies, and community organizations.

PAGE iv The State of Aging and Health in America 2013
Calls to Action
The State of Aging and Health in America 2013 presents several calls to action intended to encourage individuals, professionals, and communities to take specific steps to improve the health and well-being of older adults. They include the following:
�� Developing a new Healthy Brain Initiative Road Map.
�� Addressing lesbian, gay, bisexual, and transgender (LGBT) aging and health issues.
�� Using data on physically unhealthy days to guide interventions.
�� Addressing mental distress among older adults.
�� Monitoring vaccination rates for shingles.

The State of Aging and Health in America 2013 PAGE v
An Introduction to the Health of Older Americans ..............................................................................................................................................................1
CALL TO ACTION » Developing a New Healthy Brain Initiative Road Map .........................................................................................7
CALL TO ACTION » Addressing Lesbian, Gay, Bisexual, and Transgender Aging and Health Issues ....................................................................................................................................................................................................................................................11
The National Report Card on Healthy Aging ..............................................................................................................................................................................15
CALL TO ACTION » Using Physically Unhealthy Days Data to Guide Interventions ...........................................................16
CALL TO ACTION » Addressing Mental Distress in Older Adults.....................................................................................................................17
CALL TO ACTION » Monitoring Vaccination Rates for Shingles.........................................................................................................................23
The State-by-State Report Card on Healthy Aging ...............................................................................................................................................................27
Spotlight: Mobility..............................................................................................................................................................................................................................................................35
Appendix .......................................................................................................................................................................................................................................................................................47
Acknowledgements........................................................................................................................................................................................................... Inside back cover
Contents

PAGE vi The State of Aging and Health in America 2013

The State of Aging and Health in America 2013 PAGE 1
An Introduction to the Health of Older Americans
U.S. Population Is AgingThe current growth in the number and proportion of older adults in the United States is unprecedented in our nation’s history. By 2050, it is anticipated that Americans aged 65 or older will number nearly 89 million people, or more than double the number of older adults in the United States in 2010.1
The rapid aging of the U.S. population is being driven by two realities: Americans are living longer lives than in previous decades and, given the post-World War II baby boom, there are proportionately more older adults than in previous generations. Many Americans are now living into their 70s, 80s, and beyond. The leading edge of the baby boomers reached age 65 in 2011, launching an unparalleled phenomenon in the United States. Since January 1, 2011, and each and every day for the next 20 years, roughly 10,000 Americans will celebrate their 65th birthdays.2 In 2030, when the last baby boomer turns 65, the demographic landscape of our nation will have changed significantly. One of every five Americans—about 72 million people—will be an older adult.3
The aging of our population has wide-ranging implications for virtually every facet of American society. At each point in the lifespan of baby boomers, the United States has felt and been changed by the impact of their numbers and needs—from booming sales in commercial baby food during the late 1940s, to the construction of thousands of new schools during the 1950s, to the housing construction boom of the 1970s and 1980s. The significant proportion of Americans represented by the baby boomers continues to exert its influence. In large measure, this influence will have its most profound effects on our nation’s public health, social services, and health care systems. Public health plays a key role in advocating for those in need, linking individuals and communities to available services, and promoting healthy aging because of its effects on personal, societal, cultural, economic, and environmental factors. The public health sector is ideally positioned to meet the growing needs and demands of a rapidly aging nation.4
U.S. Population Is Becoming More Racially and Ethnically DiverseAlong with the dramatic aging of the U.S. population during the next several decades will be significant increases in racial and ethnic diversity. Although young people in the United States currently reflect diversity more strikingly than their older counterparts, the racial and ethnic makeup of older adults is changing as well.
In 2010, 80% of adults aged 65 years or older in the United States were non-Hispanic white. By 2030, that percentage will have declined, and older non-Hispanic white adults will make up 71.2% of the population, whereas Hispanics will make up 12%, non-Hispanic blacks nearly 10.3%, and Asians 5.4%.5
By 2050, the racial and ethnic diversity of older U.S. adults will have changed even more profoundly. Older non-Hispanic white adults, long deemed the “majority population,” will account for only about 58% of the total population aged 65 or older, a decline of more than 20% from 2010. During the same

PAGE 2 The State of Aging and Health in America 2013
period, the proportion of older Hispanics will almost triple—from 7% in 2010 to nearly 20% in 2050. The proportion of older Asian-Americans will more than double during 2010–2050, from 3.3% to 8.5%, and the proportion of older African-Americans will increase from 8.3% to 11.2%.5
At all ages, the health status of Hispanics, Asian-Americans, African-Americans, and other minority population groups, such as American Indians/Alaska Natives and Native Hawaiians/Other Pacific Islanders, has long lagged behind that of non-Hispanic whites. For a variety of reasons, older adults in these groups may experience the effects of health disparities more than younger people. Language barriers, reduced access to health care, low socioeconomic status, and differing cultural norms can be major challenges to promoting health in an increasingly diverse older population.
Figure 1. U.S. population aged 65 years or older and diversity, 2010–2050
87%
9%4% 1%
7%
83%
11%6%
1%
12%
78%
12%9%
2%
20%
0%
10%
20%
30%
40%
50%
60%
70%
80%
90%
100%
Non-Hispanic White Non-Hispanic Black Asian American Indianor Alaska Native
Hispanic (any race)
Source: U.S. Census Bureau, 2008.
Popu
lati
on A
ged
65
or O
lder
2010 2030 2050

The State of Aging and Health in America 2013 PAGE 3
The Burden of Chronic Disease for Older Adults
Leading Causes of DeathDuring the twentieth century, effective public health strategies and advances in medical treatment contributed to a dramatic increase in average life expectancy in the United States. The 30-year gain in life expectancy within the span of a century had never before been achieved. Many of the diseases that claimed our ancestors—including tuberculosis, diarrhea and enteritis, and syphilis—are no longer the threats they once were. Although they may still present significant health challenges in the United States, these diseases are no longer the leading killers of American adults.
However, other diseases have continued to be leading causes of death every year since 1900. By 1910, heart disease became the leading cause of death every year except 1918–1920, when the influenza epidemic took its disastrous toll. Since 1938, cancer has held the second position every year.6
Heart disease and cancer pose their greatest risks as people age, as do other chronic diseases and conditions, such as stroke, chronic lower respiratory diseases, Alzheimer’s disease, and diabetes (Figure 2). Influenza and pneumonia also continue to contribute to deaths among older adults, despite the availability of effective vaccines.
Figure 2. Chronic conditions were the leading causes of death among U.S. adults aged 65 or older in 2007–2009
27.7%
22.1%
6.5%
6.4%
4.4%
2.8%
2.6%
27.6%
21.9%
7.0%
6.3%
4.6%
2.5%
2.6%
28.2%
23.1%
3.7%
7.0%
3.1% 4.7%
2.3%
27.6%
21.6%
4.2% 6.6%
2.9% 5.6%
3.0%
0%
5%
10%
15%
20%
25%
30%
Heart Disease Cancer Chronic LowerRespiratory Diseases
Stroke Alzheimer's Disease
Diabetes Influenza &Pneumonia
Source: CDC, National Center for Health Statistics. National Vital Statistics System, 2007−2009.
All races/ethinicities
White, non-Hispanic
Black, non-Hispanic
Hispanic
Popu
lati
on A
ged
65
or O
lder

PAGE 4 The State of Aging and Health in America 2013
Diminished Quality of Life and Loss of Independence The burden of chronic diseases encompasses a much broader spectrum of negative health consequences than death alone. People living with one or more chronic diseases often experience diminished quality of life, generally reflected by a long period of decline and disability associated with their disease.
Chronic diseases can affect a person’s ability to perform important and essential activities, both inside and outside the home. Initially, they may have trouble with the instrumental activities of daily living (IADLs), such as managing money, shopping, preparing meals, and taking medications as prescribed. As functional ability—physical, mental, or both—further declines, people may lose the ability to perform more basic activities, called activities of daily living (ADLs), such as taking care of personal hygiene, feeding themselves, getting dressed, and toileting.
The inability to perform daily activities can restrict people’s engagement in life and their enjoyment of family and friends. Lack of mobility in the community or at home significantly narrows an older person’s world and ability to do the things that bring enjoyment and meaning to life. Loss of the ability to care for oneself safely and appropriately means further loss of independence and can often lead to the need for care in an institutional setting.
The need for caregiving for older adults by formal, professional caregivers or by family members—and the need for long-term care services and supports—will increase sharply during the next several decades, given the effects of chronic diseases on an aging population.

The State of Aging and Health in America 2013 PAGE 5
Major Contributor to Health Care CostsThe nation’s expenditures for health care, already the highest among developed countries, are expected to rise considerably as chronic diseases affect growing numbers of older adults. Today, more than two-thirds of all health care costs are for treating chronic illnesses. Among health care costs for older Americans, 95% are for chronic diseases. The cost of providing health care for one person aged 65 or older is three to five times higher than the cost for someone younger than 65.7
By 2030, health care spending will increase by 25%,8 largely because the population will be older. This estimate does not take into account inflation and the higher costs of new technologies. Medicare spending is projected to increase from $555 billion in 2011 to $903 billion in 2020.9
Ways to Promote and Preserve the Health of Older Adults and Reduce CostsDeath and decline associated with the leading chronic diseases are often preventable or can be delayed. Multiple opportunities exist to promote and preserve the health of older adults. The challenge is to more broadly apply what we already know about reducing the risk of chronic disease. Death is unavoidable, but the prevalence of chronic illnesses and the decline and disability commonly associated with them can be reduced.
Although the risk of developing chronic diseases increases as a person ages, the root causes of many of these diseases often begin early in life. Practicing healthy behaviors from an early age and getting recommended screenings can substantially reduce a person’s risk of developing chronic diseases and associated disabilities. Research has shown that people who do not use tobacco, who get regular physical activity, and who eat a healthy diet significantly decrease their risk of developing heart disease, cancer, diabetes, and other chronic conditions.10
Unfortunately, current data on health-related behaviors among people aged 55–64 years do not indicate a positive future for the health of older Americans. If a meaningful decline in chronic diseases among older adults is to occur, adults at younger ages, as well as our nation’s children and adolescents, need to pursue health-promoting behaviors and get recommended preventive services. Communities can play a pivotal role in achieving this goal by making healthy choices easier and making changes to policies, systems, and environments that help Americans of all ages take charge of their health.
The risk of chronic disease increases with age, but growing
older does not have to mean becoming disabled. Effective
programs, such as disease self-management programs, help
people manage chronic diseases better and prevent or
delay associated conditions.

PAGE 6 The State of Aging and Health in America 2013
Addressing Challenges for People with Multiple Chronic ConditionsMore than a quarter of all Americans and two of three older Americans have multiple chronic conditions, and treatment for this population accounts for 66% of the country’s health care budget11 The nation’s health care system is largely designed to treat one disease or condition at a time, but many Americans have more than one, and often several, chronic conditions. For example, just 9.3% of adults with diabetes have only diabetes. Other common conditions include arthritis, asthma, chronic respiratory disease, heart disease, and high blood pressure.
People with chronic diseases may also have other health problems, such as substance use or addiction disorders, mental illness, dementia or other cognitive impairments, and developmental disabilities.11 The varied nature of these conditions leads to the need for multiple health care specialists, a variety of treatment regimens, and prescription medications that may not be compatible. People with multiple chronic conditions face an increased risk of conflicting medical advice, adverse drug effects, unnecessary and duplicative tests, and avoidable hospitalizations, all of which can further endanger their health. Figure 3 shows the rates of multiple chronic conditions among Medicare fee-for-service beneficiaries.
Figure 3. Multiple chronic conditions among Medicare fee-for-service beneficiaries, 2010
To address these risks, the U.S. Department of Health and Human Services developed a strategic framework11 to improve health outcomes for people with multiple chronic conditions. Federal agencies and key partners will use this framework to improve and coordinate care for people with multiple chronic conditions, make the best use of effective self-care strategies, and support research to fill knowledge gaps.
The State of Aging and Health in America 2013 PAGE 7
Call to Action
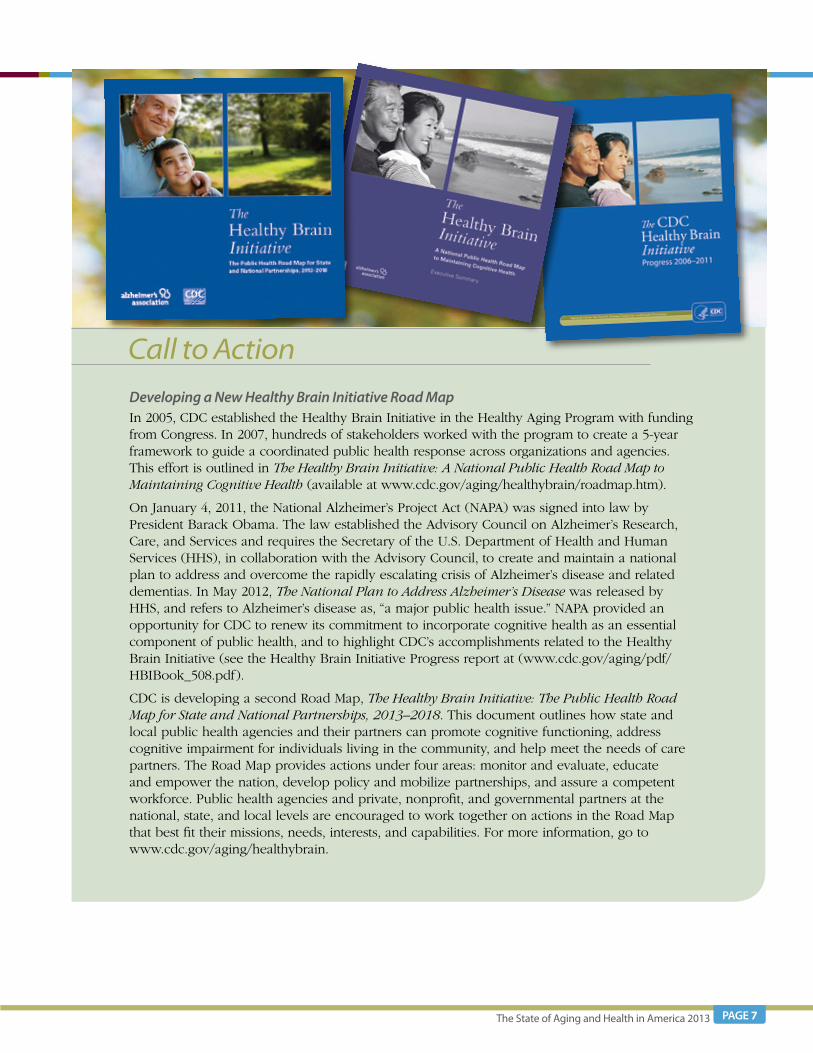
Developing a New Healthy Brain Initiative Road Map In 2005, CDC established the Healthy Brain Initiative in the Healthy Aging Program with funding from Congress. In 2007, hundreds of stakeholders worked with the program to create a 5-year framework to guide a coordinated public health response across organizations and agencies. This effort is outlined in The Healthy Brain Initiative: A National Public Health Road Map to Maintaining Cognitive Health (available at www.cdc.gov/aging/healthybrain/roadmap.htm).
On January 4, 2011, the National Alzheimer’s Project Act (NAPA) was signed into law by President Barack Obama. The law established the Advisory Council on Alzheimer’s Research, Care, and Services and requires the Secretary of the U.S. Department of Health and Human Services (HHS), in collaboration with the Advisory Council, to create and maintain a national plan to address and overcome the rapidly escalating crisis of Alzheimer’s disease and related dementias. In May 2012, The National Plan to Address Alzheimer’s Disease was released by HHS, and refers to Alzheimer’s disease as, “a major public health issue.” NAPA provided an opportunity for CDC to renew its commitment to incorporate cognitive health as an essential component of public health, and to highlight CDC’s accomplishments related to the Healthy Brain Initiative (see the Healthy Brain Initiative Progress report at (www.cdc.gov/aging/pdf/HBIBook_508.pdf).
CDC is developing a second Road Map, The Healthy Brain Initiative: The Public Health Road Map for State and National Partnerships, 2013–2018. This document outlines how state and local public health agencies and their partners can promote cognitive functioning, address cognitive impairment for individuals living in the community, and help meet the needs of care partners. The Road Map provides actions under four areas: monitor and evaluate, educate and empower the nation, develop policy and mobilize partnerships, and assure a competent workforce. Public health agencies and private, nonprofit, and governmental partners at the national, state, and local levels are encouraged to work together on actions in the Road Map that best fit their missions, needs, interests, and capabilities. For more information, go to www.cdc.gov/aging/healthybrain.

PAGE 8 The State of Aging and Health in America 2013
New Directions in Public Health for Older AmericansAs more and more Americans reach the age of 65, society is increasingly challenged to help them grow older with dignity and comfort. Meeting these challenges is critical to ensuring that baby boomers can look forward to their later years. Three key areas that public health professionals are beginning to address among older adults are binge drinking, emergency preparedness, and health literacy. These areas have long been the target of health care and aging services professionals.
Older Adults and Excessive Alcohol UseExcessive alcohol use, including binge drinking, accounts for more than 21,000 deaths among adults 65 or older each year in the United States.12 Binge drinking is defined as women consuming four or more drinks and men consuming five or more drinks on a single occasion. In 2006, excessive drinking cost the U.S. economy $223.5 billion, or $1.90 a drink.13 Excessive drinking increases a person’s risk of developing high blood pressure, liver disease, certain cancers, heart disease, stroke, and many other chronic health problems, as well as a person’s risk of car crashes, falls, and violence.14 Excessive alcohol use can also interact with prescription and over-the-counter medications and affect compliance with treatment protocols for chronic conditions, thus undermining the effective management of chronic diseases.15,16
In 2010, binge drinking was reported by one of six (38 million) U.S. adults. The prevalence of binge drinking was higher among adults aged 18–24 years (28.2%) and aged 25–34 years (27.9%) and decreased with increasing age to 3.8% among adults aged 65 or older (Figure 4). However, older adults who binge drank reported engaging in this behavior more frequently than their younger counterparts—an average of five to six times a month. They also reported consuming an average of about six drinks when they did, thereby increasing their risk of developing many health and social problems.17
CDC is assessing the public health effect of excessive drinking, including binge drinking. We are also working with states and communities to translate strategies for preventing excessive alcohol consumption recommended in The Guide to Community Preventive Services (Community Guide) into public health practice. These recommendations include increasing the price of alcohol, regulating the number and concentration of alcohol retailers in a community, holding alcohol retailers liable for harms resulting from illegal sales to underage or intoxicated persons, maintaining government controls of alcohol sales (avoiding privatization), using electronic screening and brief intervention for excessive alcohol use, and limiting the days and hours when alcohol is sold.18
CDC is also helping to increase screening and counseling for excessive alcohol use in clinical settings, as recommended for adults by the U.S. Preventive Services Task Force.19 Taken together, these prevention measures can help reduce excessive alcohol use and the many health and social harms related to it. They can also help the United States meet the Healthy People 2020 leading health indicator of reducing binge drinking among all U.S. adults.20

The State of Aging and Health in America 2013 PAGE 9
Figure 4. Binge Drinking Among U.S. Adults, 2010
4.2 4.2 4.14.7
5.5
0
2
4
6
Ave
rage
No.
of B
inge
Ep
isod
es p
er M
onth
28.2 27.9
19.2
13.3
3.8
0
10
20
30
18–2425–34
35–44
45–6465+
18–2425–34
35–44
45–6465+
Perc
enta
ge
Age groups (years)
Frequency of Binge Drinking Among Binge Drinkers Only
Prevalence of Binge Drinking Among All Adults
*Data from states (except South Dakota and Tennessee) and the District of Columbia.
Source: MMWR 2012;61:14-19. www.cdc.gov/mmwr/preview/mmwrhtml/mm6101a4.htm?s_cid=mm6101a4_e%0d%0a.
Using Data to Better Protect Vulnerable Older Adults in EmergenciesSome older adults may have difficulty keeping themselves safe and healthy during an emergency or natural disaster. Conditions such as impaired mobility, multiple chronic health conditions, or difficulty with memory may cause some older adults to need extra help planning for and dealing with situations such as hurricanes or floods. Emergencies and disasters can also disrupt the help that many older adults rely on for independent living, such as help from friends, family, and home-based medical care.21
To help states, communities, and partner organizations plan for the needs of older adults, CDC released Identifying Vulnerable Older Adults and Legal Preparedness Options for Increasing Their Protection During All-Hazards Emergencies: A Cross-Sector Guide for States and Communities. This guide presents practical strategies and legal options for protecting older adults during all-hazards emergencies. A key strategy in this guide is “characterizing the population.” This phrase means using community and state data about demographics, health status, medical conditions, service requirements, and other needs to paint a picture of the older adult population so their needs are properly considered in planning. Some of the key indicators in this report, such as disability, oral health, taking medicine for high blood pressure, and influenza and pneumococcal vaccinations, are particularly important when trying to understand the medical needs and health status of a community. This knowledge helps to ensure that appropriate medical equipment, pharmaceuticals, and preventive measures can be taken in a shelter environment, evacuation, or shelter-in-place event.21
To supplement this guide, CDC created a Web portal for both professionals and the public that includes resources, tools, and information related to all-hazards preparedness for older adults. For more information, go to www.cdc.gov/aging/emergency.

PAGE 10 The State of Aging and Health in America 2013
Improving Health Literacy Among Older Adults
Why Does Health Literacy Matter?Every day, people confront situations that involve life-changing decisions about their health. These decisions are made in places such as grocery and drug stores, workplaces, playgrounds, doctors’ offices, clinics and hospitals, and around the kitchen table. Obtaining, communicating, processing, and understanding health information and services are essential steps in making appropriate health decisions. However, research indicates that today’s health information is presented in ways that are not usable by most adults. Limited health literacy occurs when people cannot find and use the health information and services they need.
�� Nearly 9 of 10 adults have trouble using the everyday health information that is routinely available in our health care facilities, retail outlets, media, and communities.22
�� Among adult age groups, those aged 65 or older have the smallest percentage of people with proficient health literacy skills and the largest percentage with “below basic” health literacy skills.22
�� Without clear information and an understanding of the information’s importance, people are more likely to skip necessary medical tests, end up in the emergency room more often, and have a harder time managing chronic diseases such as diabetes or high blood pressure.23
What Is Health Literacy?Health literacy was defined by Healthy People 2010 as, “the degree to which individuals have the capacity to obtain, process, and understand basic health information and services needed to make appropriate health decisions.”24 Healthy People 2020 is tracking health literacy improvement, which is defined as how many health care providers make sure their instructions are easy for patients to understand.
How Can We Improve Health Literacy?Recent federal policy initiatives have brought health literacy to a tipping point.25 We are also more aware that the skills of individual patients are not the only important part of health literacy. This concept includes what health systems and professionals do to make health information and services understandable for everyone, regardless of their literacy skills.26 We can do much better in designing and presenting health information and services that people can use effectively. We can build our own health literacy skills and help others—such as community members, health professionals, and anyone who communicates about health—build their skills. Every organization involved in health information and services needs its own health literacy plan to improve its organizational practices.
To support this effort, CDC created new resources on its Health Literacy Web site to help health and other professionals communicate health messages more effectively with older adults and their caregivers. This Web site includes self-assessments, background information on health literacy, ways to improve materials, and links to resources about older adults and caregivers. The resources on this site will help you learn about health literacy issues, develop skills, create an action plan, and apply what you learn to create health information and services that truly make a positive difference in people’s lives. www.cdc.gov/healthliteracy/DevelopMaterials/Audiences/OlderAdults/index.html.
The State of Aging and Health in America 2013 PAGE 11
Call to Action
Addressing Lesbian, Gay, Bisexual, and Transgender (LGBT) Aging and Health Issues
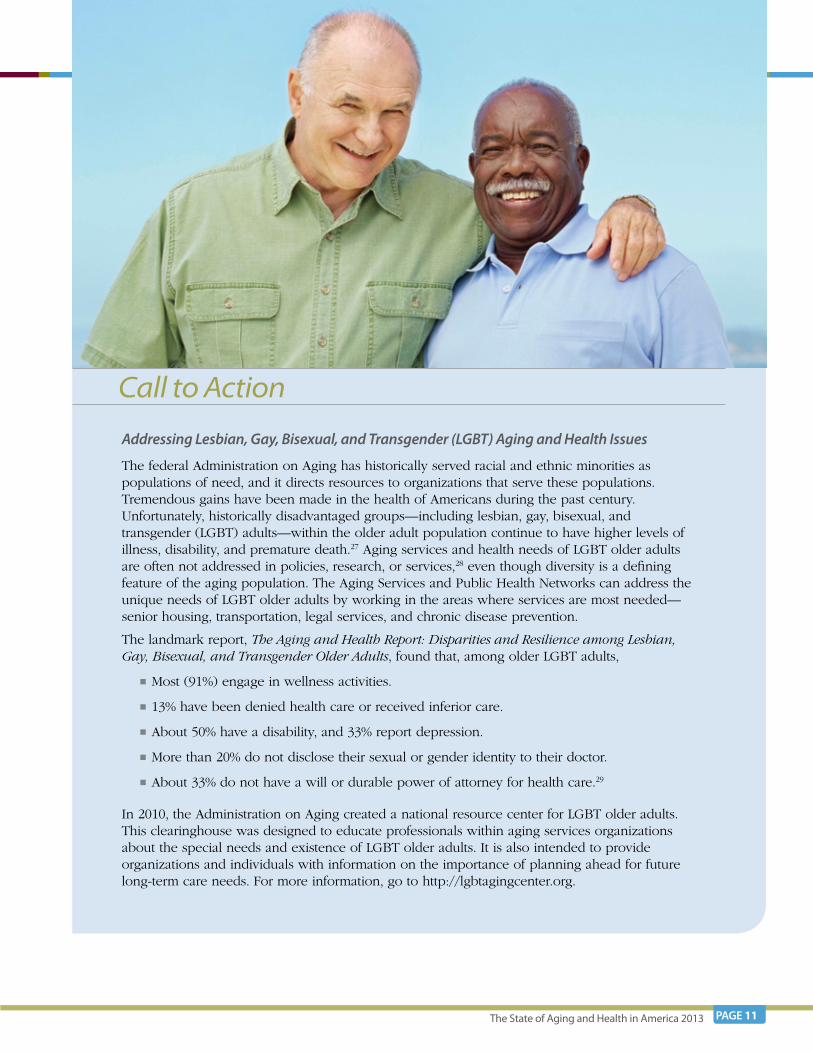
The federal Administration on Aging has historically served racial and ethnic minorities as populations of need, and it directs resources to organizations that serve these populations. Tremendous gains have been made in the health of Americans during the past century. Unfortunately, historically disadvantaged groups—including lesbian, gay, bisexual, and transgender (LGBT) adults—within the older adult population continue to have higher levels of illness, disability, and premature death.27 Aging services and health needs of LGBT older adults are often not addressed in policies, research, or services,28 even though diversity is a defining feature of the aging population. The Aging Services and Public Health Networks can address the unique needs of LGBT older adults by working in the areas where services are most needed—senior housing, transportation, legal services, and chronic disease prevention.
The landmark report, The Aging and Health Report: Disparities and Resilience among Lesbian, Gay, Bisexual, and Transgender Older Adults, found that, among older LGBT adults,
�� Most (91%) engage in wellness activities.
�� 13% have been denied health care or received inferior care.
�� About 50% have a disability, and 33% report depression.
�� More than 20% do not disclose their sexual or gender identity to their doctor.
�� About 33% do not have a will or durable power of attorney for health care.29
In 2010, the Administration on Aging created a national resource center for LGBT older adults. This clearinghouse was designed to educate professionals within aging services organizations about the special needs and existence of LGBT older adults. It is also intended to provide organizations and individuals with information on the importance of planning ahead for future long-term care needs. For more information, go to http://lgbtagingcenter.org.

PAGE 12 The State of Aging and Health in America 2013
References
1. US Census Bureau. National population projections. US Census Web site. http://www.census.gov/population/www/projections/summarytables.html.
2. Pew Research Center. Baby boomers retire. Pew Research Center Web site. http://pewresearch.org/databank/dailynumber/?NumberID=1150.
3. Wan H, Sengupta M, Velkoff VA, DeBarrow KA. 65+ in the United States: 2005 Current Population Reports. P23-209.Washington, DC: US Census Bureau; 2005. http://www.census/gov/prod/2006pubs/p23-209.pdf.
4. Holtzman D, Anderson LA. Aging and health in America: a tale from two boomers. Am J Public Health. 2012;102(3):392.
5. US Census Bureau. US Population Projections. US Census Bureau Web site. http://www.census.gov/population/www/projections/summarytables.html.
6. Centers for Disease Control and Prevention. Leading causes of death, 1900–1998. Centers for Disease Control and Prevention Web site. http://www.cdc.gov/nchs/data/dvs/lead1900_98.pdf.
7. Hoffman C, Rice D, Sung HY. Persons with chronic conditions: their prevalence and costs. JAMA. 1996;276(18):1473-1479.
8. Agency for Healthcare Research and Quality, Centers for Disease Control and Prevention. Physical activity and older Americans: benefits and strategies; Agency for Healthcare Research and Quality Web site. http://www.ahrq.gov/ppip/activity.htm.
9. Kaiser Family Foundation. Medicare spending and financing fact sheet. 2011. Kaiser Family Foundation Web site. http://www.kff.org/medicare/upload/7305-06.pdf.
10. Fries JD. Measuring and monitoring success in compressing morbidity. Ann Intern Med. 2003;139:455–459.
11. US Department of Health and Human Services. Multiple Chronic Conditions: A Strategic Framework—Optimum Health and Quality of Life for Individuals with Multiple Chronic Conditions. Washington, DC: US Dept of Health and Human Services; 2010. http://www.hhs.gov/ash/initiatives/mcc/mcc_framework.pdf.
12. Centers for Disease Control and Prevention. Alcohol-related disease impact (ARDI) software. Alcohol and Public Health Web site. http://www.cdc.gov/alcohol/ardi.htm.
13. Bouchery EE, Harwood HJ, Sacks JJ, Simon CJ, Brewer RD. Economic costs of excessive alcohol consumption in the United States, 2006. Am J Prev Med. 2011;41:516–524.
14. National Institute of Alcohol Abuse and Alcoholism. Tenth Special Report to the US Congress on Alcohol and Health. Bethesda, MD: National Institute of Health; 2000. http://pubs.niaaa.nih.gov/publications/10report/intro.pdf.
15. National Institute on Aging. Alcohol Use in Older People. Bethesda, MD: National Institute of Health; 2009. http://www.nia.nih.gov/health/publication/alcohol-use-older-people.
16. US Department of Agriculture, US Department of Health and Human Services. Chapter 3-foods and food components to reduce. In: Dietary Guidelines for Americans, 2010. 7th ed. Washington, DC: US Government Printing Office; 2010; 30–32. http://www.cnpp.usda.gov/Publications/DietaryGuidelines/2010/PolicyDoc/Chapter3.pdf.
17. Kanny D, Liu Y, Brewer RD, Garvin WS, Balluz L. Vital signs: binge drinking prevalence, frequency, and intensity among adults—United States, 2010. MMWR Morb Mortal Wkly Rep. 2012;61:14–19.
18. Task Force on Community Prevention Services. Preventing excessive alcohol consumption. The Guide to Community Preventive Services Web site. http://www.thecommunityguide.org/alcohol/index.html.

The State of Aging and Health in America 2013 PAGE 13
19. US Preventive Services Task Force. Screening and behavioral counseling interventions in primary care to reduce alcohol misuse: recommendation statement. US Preventive Services Task Force Web site. http://www.uspreventiveservicestaskforce.org/3rduspstf/alcohol/alcomisrs.htm.
20. US Department of Health and Human Services. Substance abuse. Healthy People 2020 Web site. http://healthypeople.gov/2020/LHI/substanceAbuse.aspx.
21. Centers for Disease Control and Prevention. Identifying Vulnerable Older Adults and Legal Options for Increasing Their Protection During All-Hazards Emergencies: A Cross-Sector Guide for States and Communities. Atlanta, GA: Centers for Disease Control and Prevention. US Dept of Health and Human Services; 2012.
22. Kutner M, Greenberg E, Jin Y, Paulsen C. The Health Literacy of America’s Adults: Results from the 2003 National Assessment of Adult Literacy. Washington, DC: National Center for Education Statistics, US Dept of Education, 2006. NCES publication 2006-483.
23. Rudd RE, Anderson JE, Oppenheimer S, Nath C. Health literacy: an update of public health and medical literature. In: Comings JP, Garner B, Smith C, eds. Review of Adult Learning and Literacy. Vol 7. Mahwah, NJ: Lawrence Erlbaum Associates; 2007.
24. US Department of Health and Human Services. Healthy People 2010. Washington, DC: US Government Printing Office; 2000.
25. Koh HK, Berwick DM, Clancy CM, et al. New federal policy Initiatives to boost health literacy can help the nation move beyond the cycle of costly ‘Crisis Care.’ Health Affairs. 2012;3(2):434-443.
26. US Department of Health and Human Services. National Action Plan to Improve Health Literacy. Washington, DC: Office of Disease Prevention and Health Promotion. US Dept of Health and Human Services; 2010.
27. Fredriksen-Goldsen K, Muraco A. Aging and sexual orientation: a 25-year review of the literature. Research on Aging. 2010;32(3):372–413.
28. Institute of Medicine. The Health of Lesbian, Gay, Bisexual, and Transgender People: Building a Foundation for Better Understanding. Washington, DC: The National Academies Press; 2011.
29. Fredriksen-Goldsen KI, Kim HJ, Emlet CA, et al. The Aging and Health Report: Disparities and Resilience among Lesbian, Gay, Bisexual, and Transgender Older Adults. Seattle, WA: Institute for Multigenerational Health; 2011.

PAGE 14 The State of Aging and Health in America 2013
This section reports on 15 indicators related to the health status of adults aged 65 years or older, health behaviors, preventive care and screening, and injuries. These indicators were chosen because they can be modified and they present a comprehensive picture of older adult health. Table 1 shows the most current data for the United States for each indicator and indicates whether the Healthy People 2020 target was met, if applicable. For most indicators, the Behavioral Risk Factor Surveillance System (BRFSS) is not the official data source for tracking the Healthy People 2020 targets. Some of these targets are for all adults aged 18 or older, not just those aged 65 or older. For this report, we use BRFSS data to report how well states are doing in meeting Healthy People 2020 targets for their older adult population. Some targets have been met, but there is always room for improvement. A detailed description of each indicator follows the report card, and a full description of Healthy People 2020 targets is in the Appendix.
Summary of FindingsThe United States has met six of the eight Healthy People 2020 targets for indicators in this report:
no leisure time physical activity, obesity, current smoking, medication for high blood pressure,
mammogram within past 2 years, and colorectal cancer screening.

The State of Aging and Health in America 2013 PAGE 15
The National Report Card on Healthy Aging
Table 1. The National Report Card on Healthy Aging: How Healthy Are Older Adults in the United States?
IndicatorData for Adults
Aged 65 or Older* Data YearHealthy People
2020 TargetScore Target
Met or Not Met†
Health Status1. Physically unhealthy days (mean number
of days in past month)5.4 2010 ‡ ‡
2. Frequent mental distress (%)§ 6.9 2010 ‡ ‡
3. Oral health: tooth retention (%)|| 59.6 2010 ‡ ‡
4. Disability (%)¶ 37.9 2010 ‡ ‡
Health Behaviors
5. No leisure-time physical activity in past month (%)
31.4 2010 32.6 Met
6. Eating fruits and vegetables daily: 2009 # #
Eating ≥2 fruits daily (%) Eating ≥3 vegetables daily (%)
41.8
29.67. Obesity (%) 24.3 2010 30.6 Met8. Current smoking (%) 8.3 2010 12.0 Met9. Medication for
high blood pressure (%)**
94.0 2009 77.4 Met
Preventive Care and Screening
10. Flu vaccine in past year (%) 66.9 2010 90.0 Not Met
11. Ever had pneumonia vaccine (%)
68.1 2010 90.0 Not Met
12. Mammogram within past 2 years (%)
82.9 2010 70.0 Met
13. Colorectal cancer screening (%) 73.1 2010 70.5 Met
14. Up-to-date on select preventive services (%)††
Men
Women
48.5
48.5
2010
2010
50.9
52.7
Not Met
Not Met
Injuries
15. Fall with injury within past year (%)
31.7 2010 ‡ ‡
Source: CDC, Behavioral Risk Factor Surveillance System, 2009–2010.
* Data for all Indicators were collected by CDC’s Behavioral Risk Factor Surveillance System (BRFSS) and depict the mean for all 50 states and the District of Columbia. See Appendix for a full description of the BRFSS.
† Score is based on attainment of Healthy People 2020 targets among the older adult population. Some targets are for all adults aged 18 or older, not just those aged 65 or older. This table only reports data for older adults. See Appendix for a full description of Healthy People 2020.
‡ Indicators 1, 2, 4, and 15 do not have Healthy People 2020 targets. § Frequent mental distress is defined as having had 14 or more mentally unhealthy days in the previous month. || Tooth retention is defined as the percentage of older adults who have lost 5 or fewer of their natural teeth.¶ Disability is defined on the basis of an affirmative response to either of the following two questions on the 2010 BRFSS Survey: “Are you limited
in any way in any activities because of physical, mental, or emotional problems?” or “Do you now have any health problem that requires you to use special equipment, such as a cane, a wheelchair, a special bed, or a special telephone?”
# Healthy People 2020 divides the nutrition targets into multiple categories of fruits and vegetables. See Appendix for a full description.** This indicator describes the percentage of people with diagnosed high blood pressure who are taking prescribed medication. The National
Health and Nutrition Examination Survey (NHANES) is used to officially track this indicator at the national level for adults aged 18 or older. For 2005–2008, NHANES data indicate that 70.4% of adults aged 18 or older and 79.4% adults aged 65 or older had high blood pressure and took prescribed medications.
†† For men, three services are included: flu vaccine in past year, ever had a pneumonia vaccine, and colorectal cancer screening. For women, these same three services are included, plus a mammogram within past 2 years.

PAGE 16 The State of Aging and Health in America 2013
Health Status Indicators
Indicator 1. Physically unhealthy days
�� CDC collects data on adults’ physically unhealthy days through the BRFSS. Respondents are asked how many of the previous 30 days they felt that their physical health (including physical illness and injury) was “not good.”
�� Older adults have the highest rates of poor physical health and activity limitation compared with other age groups.1
Call to Action Using Data on Physically Unhealthy Days to Guide Interventions
Older adults report many more physically unhealthy days than younger adults. Many of these unhealthy days are from pain, discomfort, and impairments associated with common chronic diseases and conditions that increase with age—such as arthritis, back and neck pain, diabetes, cardiovascular disease, and cancer.2,3 Older adults who meet physical activity guidelines are less likely to experience frequent physical distress, which is defined as 14 or more physically unhealthy days.4
By monitoring physically unhealthy days regularly, we can identify whether older adults are declining in physical functioning. This information can be used to develop effective community interventions for older adults with arthritis. Proven programs include EnhanceFitness (www.projectenhance.org), an exercise program that can increase strength, boost activity levels, and elevate mood5 and Walk with Ease (www.arthritis.org/walk-with-ease.php), a group walking program that can improve health outcomes and boost confidence in managing symptoms and being physically active.6
In addition, Active Living Every Day (ALED) (www.activeliving.info) is a group-based program developed to help people who are sedentary become and stay physically active.7
Programs such as these may help older adults maintain or improve their physical health status. For a description of system-based interventions, please see the “Spotlight: Mobility” section of this report (page 35).
Indicator 2. Frequent mental distress
�� The BRFSS also assesses general mental health status. Respondents are asked to report how many of the previous 30 days their mental health was not good because of stress, depression, or problems with emotions. Frequent mental distress is defined as having 14 or more days of poor mental health in the previous 30 days. This definition uses a 14-day minimum period because many health care providers and researchers use a similar duration of mental distress as a marker for clinical depression and anxiety disorders.
�� Older adults tend to have lower rates of frequent mental distress compared with other age groups (Figure 5).8

The State of Aging and Health in America 2013 PAGE 17
Call to Action Addressing Mental Distress in Older Adults
Some aspects of mental health improve with age. But many older adults still suffer with mental distress associated with limitations in daily activities, physical impairments, grief following loss of loved ones, caregiving or challenging living situations, or untreated mental illness such as depression or substance abuse. About 25% of adults aged 65 years or older have some type of mental health problem, such as a mood disorder not associated with normal aging.9 Although social ties are one of the strongest predictors of well-being, about 12% of adults aged 65 or older report that they “rarely” or “never” receive the social and emotional support they needed.10 Mental distress is a problem by itself, and it has been associated with unhealthy behaviors than can interfere with self-management and inhibit recovery from an illness. For example, older adults with frequent mental distress are less likely than those without frequent mental distress to be nonsmokers, to eat at least five fruits or vegetables daily, and to participate in moderate-to-vigorous physical activity during the average week.11
Health care providers and other service providers who have contact with older adults can help identify those with mental distress by regularly asking them if they have any stress, depression, or problems with their emotions. Health care providers can also help older adults recognize unusual increases in stress or sadness and help them understand that these symptoms may not be simply a “normal part of aging.”
On a population level, self-reports of mental distress should be monitored as an indicator of mental health problems among older populations. Evidence-based programs are available to help improve mental health among older adults. One example is IMPACT, a collaborative care program for older adults with major depression or dysthymic disorder. IMPACT resulted in at least a 50% reduction in depressive symptoms, less functional impairment, and better quality of life in older adults who participated in the program.12
Another intervention program, PEARLS, targets older adults with minor depression or dysthymia who are receiving social services from community agencies. PEARLS participants were three times more likely than those receiving usual care to report a significant reduction in their symptoms (43% vs. 15%) or complete elimination of their depression (36% vs. 12%).13 Participants also reported greater health-related quality of life improvements in functional and emotional well-being. Interventions such as these, as well as programs delivered by local area agencies that increase social support, may be effective in reducing symptoms of frequent mental distress in older adults.

PAGE 18 The State of Aging and Health in America 2013
Figure 5. Prevalence of frequent mental distress, by age, among U.S. adults, 2006–2010 U
.S. A
du
lts
Age groups (years)
Source: CDC. Health Related Quality of Life Web Site. Behavioral Risk Factor Surveillance System, 2006–2010.
11.5% 11.0% 10.7%11.7%
11.0%
6.9%6.3%
0.0%
2.0%
4.0%
6.0%
8.0%
10.0%
12.0%
14.0%
18–24 25–34 35–44 45–54 55–64 65–74 75+
Indicator 3. Oral health: tooth retention
�� The percentage of older adults who have retained their natural teeth (i.e., lost 5 or fewer teeth) has increased steadily over the past few decades. This trend is significant because the mouth reflects a person’s health and well-being throughout life.
�� Poor oral health may limit food choices and diminish the pleasure of eating, impair chewing efficiency, limit social contacts and intimacy, affect speech, cause pain, and detract from physical appearance. All of these problems can negatively affect a person’s health and well-being. Oral diseases can affect many aspects of general health, and some health conditions can, in turn, have an effect on oral health.
�� Older adults may have more difficulty accessing effective interventions to prevent and control oral disease than younger adults. Barriers include lack of insurance, physical limitations that make brushing teeth difficult, and lack of perceived need for oral health care.14
Indicator 4. Disability
�� In this report, disability is defined on the basis of an affirmative response to either of the following two questions on the 2010 BRFSS Survey: “Are you limited in any way in any activities because of physical, mental, or emotional problems?” or “Do you now have any health problem that requires you to use special equipment, such as a cane, a wheelchair, a special bed, or a special telephone?”
�� The chance of having a disability goes up with age, from less than 10% for people aged 15 years or younger to almost 75% for people aged 80 or older.
�� People with disabilities face many challenges related to mobility and accessibility.15

The State of Aging and Health in America 2013 PAGE 19
New Resource for Data on Disabilities
CDC created the Disability and Health Data System (DHDS) to help partners, researchers,
advocates, and the public assess the health and wellness of people with disabilities. The
DHDS provides access to state health and demographic data by disability status and level
of psychological distress. The DHDS also provides data on disability-associated health
care expenditures.
The data are available in several formats, including standard contrast and high-contrast
interactive maps and data tables that can be customized or downloaded. Users can easily
identify location-specific data for a single year, for multiple years, and by state, territorial,
division, regional, and national levels. For more information, go to http://dhds.cdc.gov.
Indicator 5. Physical activity
�� Regular physical activity is one of the most important things older adults can do for their health. Physical activity can prevent many of the health problems that may come with age. According to the 2008 Physical Activity Guidelines for Americans, older adults need to do two types of physical activity each week to improve health—aerobic and muscle-strengthening.16
�� Strong evidence shows that regular physical activity is safe and reduces the risk of falls among older adults. Older adults at risk of falling should do exercises that maintain or improve their balance. For best results, they should do these exercises at least 3 days a week from a program shown to reduce falls.
How Much Activity Do Older Adults Need?2 hours and 30 minutes (150 minutes) of moderate-intensity aerobic activity (i.e., brisk walking) every week and muscle-strengthening activities on 2 or more days a week that
work all major muscle groups (legs, hips, back, abdomen, chest, shoulders, and arms).
OR
1 hour and 15 minutes (75 minutes) of vigorous-intensity aerobic activity (i.e., jogging or running) every week and muscle-strengthening activities on 2 or more days a week that work all major muscle groups (legs, hips, back, abdomen, chest, shoulders, and
arms).
OR
An equivalent mix of moderate- and vigorous-intensity aerobic activity and muscle-strengthening activities on 2 or more days a week that work all major muscle groups
(legs, hips, back, abdomen, chest, shoulders, and arms).Source: CDC, Division of Nutrition, Physical Activity and Obesity, National Center for Chronic Disease Prevention and Health Promotion, 2011. www.cdc.gov/physicalactivity/everyone/guidelines/olderadults.html.

PAGE 20 The State of Aging and Health in America 2013
Indicator 6. Eating fruits and vegetables daily
�� Diets rich in fruits and vegetables may reduce the risk of some cancers and chronic diseases, such as diabetes and cardiovascular disease. Fruits and vegetables provide essential vitamins and minerals, fiber, and other substances that are important for good health.
�� A greater proportion of adults aged 65 years or older eat 5 or more fruits and vegetables daily compared with other age groups.17
Indicator 7. Obesity
�� Obesity is defined as having a body mass index (BMI) of 30 or higher. BMI is calculated by dividing a person’s weight in kilograms by his or her height in meters squared (kg/m2).
�� The BRFSS uses self-reported data about height and weight, which may lead to under estimating obesity in the United States. The National Health and Nutrition Examination Survey (NHANES), which takes body measurements, estimates the prevalence of obesity among older adults at 34.6%.18
�� Older adults can benefit from maintaining a healthy body weight. Obesity is a risk factor for many chronic conditions, including stroke, heart disease, cancer, and arthritis.19
�� The environment plays a role in helping to fight obesity. People may make decisions on the basis of their environment or community. For example, a person may choose not to walk to the store or to work because of a lack of sidewalks. Communities, homes, and workplaces can all influence people’s health decisions. Because of this influence, it is important to create environments in these locations that make it easier to be physically active and eat a healthy diet.
Indicator 8. Current smoking
�� Tobacco use remains the single largest preventable cause of disease, disability, and death in the United States.20
�� Although most older adults who were once regular smokers have quit, about 8.4% of adults aged 65 or older were still smoking cigarettes in 2010 (Table 1).
Monitoring State and Community Environmental Policies
CDC’s Division of Nutrition, Physical Activity, and Obesity has a policy monitoring
system accessible through an online database that allows users to search for state-
level legislation and regulations related to obesity, physical activity, and nutrition.
Topics such as access to healthy foods, farmers’ markets, fruits and vegetables, active
transit, parks and recreation, transportation, pedestrians, and walking in community
and medical settings can be researched by state and year. The database allows users
to track policies over time, as well as between states. To access the database, go to
http://apps.nccd.cdc.gov/DNPAOLeg.

The State of Aging and Health in America 2013 PAGE 21
Indicator 9. Taking medications for high blood pressure
�� This indicator describes the percentage of older adults with diagnosed high blood pressure who are taking medication to control this condition.
�� High blood pressure is a major risk factor for cardiovascular disease, the leading cause of illness and death among older adults.21 Of the almost 67 million Americans with high blood pressure, more than half do not have it under control.22
�� About 90% of Americans eat more sodium than is recommended, which can increase a person’s risk of high blood pressure. Places that produce, sell, or serve food can limit the amount of sodium in food products, provide information about sodium in foods, and stock lower sodium foods. People can choose to buy healthy food products, limit processed foods, and ask for lower sodium options.23
�� A team-based approach to health care can also help address high blood pressure. Health care systems can use electronic health records, encourage the use of 90-day refills, and consider having low or no co-pays for services. Health care providers, such as doctors, nurses, and pharmacists, can track their patients’ blood pressure, prescribe once-a-day medications, and give clear instructions on how to take blood pressure medications. Patients should take the initiative to monitor their blood pressure between medical visits, take medications as prescribed, tell their doctor about any side effects, and make lifestyle changes, such as eating a low-sodium diet, exercising, and stopping smoking.21
Indicator 10. Flu vaccine in past year
Indicator 11. Ever had pneumonia vaccine
�� Although both are largely preventable through vaccination, flu and pneumonia represent the 7th leading cause of death among U.S. adults aged 65 years or older.24
�� About 90% of seasonal flu-related deaths and more than 60% of seasonal, flu-related hospitalizations in the United States each year occur among people aged 65 years or older. This is because human immune defenses become weaker with age.25
�� Previous experience is the best predictor of whether an older adult receives these vaccinations. People are more likely to get a flu shot if they have gotten it in previous years. Older adults are more likely to get the pneumonia vaccine if they have gotten a flu shot in the past.26
Indicator 12. Mammogram within past 2 years
�� Almost half of all new cases and nearly two-thirds of deaths from breast cancer occur among women aged 65 years or older.30
�� Mammography is the best available method to detect breast cancer in its earliest, most treatable stage before it is big enough to feel or cause symptoms.31 Mammography screening every 2 years for women aged 65–74 has been shown to reduce deaths.32
�� Mammograms for women aged 65 or older are covered by Medicare, but BRFSS data show that many women are still not getting this preventive service.

PAGE 22 The State of Aging and Health in America 2013
Million Hearts: Prevention at Work
In 2011, HHS, the Centers for Medicare & Medicaid Services (CMS), and CDC launched
the Million Hearts campaign. This initiative seeks to prevent one million heart attacks and
strokes among Americans during the next 5 years. It also seeks to improve clinical care
by helping patients learn and follow their ABCS:
�� Appropriate Aspirin use for people at risk.
�� Blood pressure control.
�� Cholesterol management.�
�� Smoking cessation.
The Million Hearts campaign is also designed to reduce the number of people who need
cardiovascular treatment. To support this initiative, state, county, and local health officials
are encouraged to
�� PROMOTE smoke-free air policies, effective tobacco packaging labels, restricted tobacco advertising, and higher tobacco prices.
�� SUPPORT education programs, tobacco prevention incentives, wellness programs, recognition programs, and efforts to reduce sodium and eliminate trans fats in the food supply.
�� INCREASE awareness of heart disease and stroke and their risk factors.
�� BUILD local partnerships to enhance the effectiveness and efficiency of efforts to prevent heart attack and stroke.
For more information, go to http://millionhearts.hhs.gov/index.html.

The State of Aging and Health in America 2013 PAGE 23
Call to ActionMonitoring Vaccination Rates for Shingles
Shingles, also known as herpes zoster, is a disease that causes a painful skin rash. It can also lead to severe pain that can last for months or even years after the rash goes away, a condition known as post-herpetic neuralgia. Pain from shingles has been described as excruciating, aching, burning, stabbing, and shock-like. It can cause depression, anxiety, difficulty concentrating, loss of appetite, and weight loss. Shingles may interfere with activities of daily living, such as dressing, bathing, eating, cooking, shopping, and travel. To prevent shingles, CDC recommends that people aged 60 years or older receive a onetime vaccination.27
To date, only national data have been available to monitor the use of the shingles vaccine. In 2010, 14.4% of adults aged 60 or older reported receiving the vaccine, an increase from the 10% reported in 2009.28 Recognizing the need for state and selected MMSA (metropolitan and micropolitan statistical area) data, CDC created a question about shingles vaccination for the BRFSS survey. Since 2009, this question has been available as an optional module that states can use to ask about the receipt of shingles vaccination among adults aged 50 years or older. Five states used the question in 2009 and six states used it in 2010.29
Starting in 2014, the shingles vaccination question will be part of the BRFSS “core” questionnaire that all states use every 3 years. These data will allow states and MMSAs to monitor trends in vaccination rates and identify disparities. Program planners can use this information to identify problems so they can adopt corrective strategies.
Indicator 13. Colorectal cancer screening
�� This report identifies the percentage of older adults who have been screened for colorectal cancer by having a fecal occult blood test (FOBT) during the past year, a flexible sigmoidoscopy within 5 years and FOBT within 3 years, or a colonoscopy within 10 years.
�� Colorectal cancer almost always develops from precancerous polyps (abnormal growths) in the colon or rectum. Screening tests can find precancerous polyps so that they can be removed before they turn into cancer. They can also detect colorectal cancer early, when treatment works best.33
�� Two-thirds of all new cases of colorectal cancer are in people aged 65 or older.34

PAGE 24 The State of Aging and Health in America 2013
Indicator 14. Up-to-date on select preventive services
�� The “up-to-date” indicator presents a composite picture of the vaccination and screening behaviors of older adults. Indicators 10 through 13 measure the use of selected clinical preventive services that are covered by Medicare 35 and recommended for adults aged 65 years or older. Although each is essential independently, older adults need to access all of these services to protect their health.
�� For men, three services are included: flu vaccine in past year, ever had pneumonia vaccine, and colorectal cancer screening. For women, these same three services are included, plus a mammogram within the past 2 years..
�� This indicator is intended to provide a more meaningful and practical measure of the delivery of clinical preventive services in communities. This comprehensive measure could also enhance the ability of health departments and community groups to assess disparities in delivering preventive services, better assess progress toward measurable objectives, and identify best practices.36
Indicator 15. Falls resulting in injury
�� Each year, one of three adults aged 65 years or older falls. Falls can cause moderate to severe injuries, such as hip fractures and head traumas, and increase the risk of early death.37
�� Among older adults, falls are the leading cause of injury death. They are also the most common cause of nonfatal injuries and hospital admissions due to trauma.37
�� Many people who fall, even if they are not injured, develop a fear of falling. This fear may cause them to limit their activities—leading to reduced mobility and loss of physical fitness, which in turn increases their actual risk of falling.38

The State of Aging and Health in America 2013 PAGE 25
1. Centers for Disease Control and Prevention. Health related quality of life: nationwide trends. Centers for Disease Control and Prevention Web site. http://apps.nccd.cdc.gov/HRQOL/TrendV.asp?State=1&Category=3&Measure=2.
2. Centers for Disease Control and Prevention. Measuring healthy days. Atlanta, Georgia: 2000. Table 2. www.cdc.gov/hrgol/pdfs/mhd.pdf.
3. Centers for Disease Control and Prevention. Health-related quality of life surveillance—United States, 1993–2002. MMWR. 2005:54(No. SS-4).
4. Brown DW, Balluz LS, Heath GW. Associations between recommended levels of physical activity and health-related quality of life—findings from the 2001 Behavioral Risk Factor Surveillance System. Prev Med. 2003;37:520-528.
5. Wallace JI, Buchner DM, Grothus L. Implementation and effectiveness of a community-based health promotion program for older adults. J Gerontol. 1998;53A:M301-M306.
6. Callahan LF, Shreffler JH, Altpeter M, et al. Evaluation of group and self-directed formats of the Arthritis Foundation’s Walk With Ease program. Arthritis Care Res (Hoboken). 2001;63(8):1098-1107.
7. Dunn AL, Marcus BH, Kampert JB, Garcia ME, Kohl HW, Blair SN. Comparison of lifestyle and structured interventions to increase physical activity and cardiorespiratory fitness, a randomized trial. JAMA. 1999;281(4):327-334.
8. Centers for Disease Control and Prevention. Health Related Quality of Life Web site. http://apps.nccd.cdc.gov/HRQOL/TrendV.asp?State=1&Category=3&Measure=7.
9. Centers for Disease Control and Prevention, National Association of Chronic Disease Directors. The State of Mental Health and Aging in America Issue Brief 1: What Do the Data Tell Us? Atlanta, GA: National Association of Chronic Disease Directors; 2008.
10. McGuire LC, Strine TW, Okoro CA, Ahluwalia IB, Ford ES. Modifiable characteristics of a healthy lifestyle in U.S. older adults with or without frequent mental distress: 2003 Behavioral Risk Factor Surveillance System. Am J Geriatr Psychiatry. 2007;15:754-761.
11. Unützer J, Katon W, Callahan CM, et al. Collaborative care management of late-life depression in the primary care setting. JAMA. 2002;288:2836-2845.
12. Ciechanowski O, Wagner E, Schmaling K, et al. Community-integrated home-based depression treatment in older adults: a randomized controlled trial. JAMA. 2004;291:1569-1577.
13. Griffin SO, Jones JA, Brunson D, Griffin PM, Bailey WD. Burden of oral disease among older adults and implications for public health priorities. Am J Public Health. 2012;102(3):411-418.
14. US Department of Health and Human Services. The 2005 Surgeon General’s Call to Action to Improve the Health and Wellness of Persons with Disabilities: Calling You to Action. US Dept of Health and Human Services, Office of the Surgeon General; 2005.
15. Centers for Disease Control and Prevention. 2008 Physical Activity Guidelines for Americans: fact sheet for health professionals on physical activity guidelines for Americans. Centers for Disease Control and Prevention Web site. http://www.cdc.gov/nccdphp/dnpa/physical/pdf/PA_Fact_Sheet_OlderAdults.pdf.
16. Centers for Disease Control and Prevention. State-specific trends in fruit and vegetable consumption among adults—United States, 2000-2009. MMWR. 2010;59(35):1125-1130. http://www.cdc.gov/mmwr/preview/mmwrhtml/mm5935a1.htm?s_cid=mm5935a1_w#tab2.
17. Centers for Disease Control and Prevention. Health Data Interactive Web site. http://205.207.175.93/HDI/TableViewer/tableView.aspx?ReportId=76.
18. National Heart, Lung, and Blood Institute. Calculate your body mass index National Heart, Lung, and Blood Institute Web site. http://www.nhlbisupport.com/bmi.
References

PAGE 26 The State of Aging and Health in America 2013
20. Centers for Disease Control and Prevention. Current cigarette smoking among adults aged ≥18 Years United States, 2005–2010. Vital Signs. 2011;60(35).
21. Centers for Disease Control and Prevention. Natl Vital Stat Rep. 2012;60(4):7.
22. Centers for Disease Control and Prevention. Getting blood pressure under control: high blood pressure is out of contol for too many Americans. Centers for Disease Control and Prevention Web site. http://www.cdc.gov/features/vitalsigns/hypertension.
23. Centers for Disease Control and Prevention. Where’s the sodium? There’s too much sodium in many common foods. Centers for Disease Control and Prevention Web site. http://www.cdc.gov/vitalsigns/Sodium/index.html.
24. Centers for Disease Control and Prevention. National Vital Statistics System, 2007–2009. Centers for Disease Control and Prevention Web site. http://www.cdc.gov/nchs/hdi.htm.
25. Centers for Disease Control and Prevention. What you should do this flu season if you’re 65 years and older. http://www.cdc.gov/flu/about/disease/65over.htm.
26. Zimmerman RK, Santibanez TA, Fine MJ, et al. Barriers and facilitators of pneumococcal vaccination among the elderly. Vaccine. 2003;21:1510-1517.
27. Centers for Disease Control and Prevention. Protect yourself against shingles: get vaccinated. Centers for Disease Control and Prevention Web site. http://www.chronicdisease.org/resource/resmgr/healthy_aging_critical_issues_brief/ha_cib_shingles.pdf. Accessed January 10, 2013.
28. Centers for Disease Control and Prevention. Adult vaccination coverage—United States, 2010. MMWR Morb Mortal Wkly Rep. 2012; 61(04):66-72.
29. Centers for Disease Control and Prevention. Questionnaires. Behavioral Risk Factor Surveillance System Web site.http://apps.nccd.cdc.gov/BRFSSModules/ModByCat.asp?Yr=2010.
30. Mandelblatt J, Saha S, Teutsch S, et al. The cost-effectiveness of screening mammography beyond age 65 years: a systematic review for the U.S. Preventive Services Task Force. Ann Intern Med. 2003;139(1):835-842.
31. Centers for Disease Control and Prevention. Breast cancer screening. Centers for Disease Control and Prevention Web site. http://www.cdc.gov/cancer/breast/basic_info/screening.htm.
32. Nelson HD, Tyne K, Naik A, et al. Screening for breast cancer: an update for the U.S. Preventive Services Task Force. Ann Intern Med. 2009;151:727-737.
33. Centers for Disease Control and Prevention. Colorectal cancer screening. Centers for Disease Control and Prevention Web site. http://www.cdc.gov/cancer/colorectal/basic_info/screening.
34. US Preventive Services Task Force. Screening for colorectal cancer: recommendation statement. US Preventive Services Task Force Web site. http://www.uspreventiveservicestaskforce.org/uspstf08/colocancer/colors.htm.
35. Centers for Medicare & Medicaid Services. Prevention—General Information. Centers for Medicare & Medicaid Services Web site. https://www.cms.gov/Medicare/Prevention/PrevntionGenInfo/index.html.
36. Shenson D, Bolen J, Adams M, Seeff L, Blackman D. Are older adults up-to-date with cancer screening and vaccinations? Prev Chronic Dis. 2005;2(3):A04. http://www.cdc.gov/pcd/issues/2005/jul/05_0021.htm.
37. Centers for Disease Control and Prevention. Falls among older adults: an overview. Home and Recreational Safety Web site. http://www.cdc.gov/HomeandRecreationalSafety/Falls/adultfalls.html.
38. Vellas BJ, Wayne SJ, Romero LJ, Baumgartner RN, Garry PJ. Fear of falling and restriction of mobility in elderly fallers. Age Ageing. 1997;26:189-193.

The State of Aging and Health in America 2013 PAGE 27
The State-by-State Report Card on Healthy Aging
This section presents the State-by-State Report Card on Healthy Aging, which includes data on adults aged 65 years or older for all 50 states and D.C. Table 2 presents data for the highest and lowest ranked states and the number of states that met the Healthy People 2020 targets for older adults, where appropriate. For most indicators, the BRFSS is not the official data source for tracking Healthy People 2020 targets. Some of these targets are for all adults aged 18 years or older, not just those aged 65 or older. For this report, we use BRFSS data to report how well states are doing in meeting Healthy People 2020 targets for their older adult populations. A detailed description of each indicator follows the report card, and a full description of the Healthy People 2020 targets is in the Appendix.
Table 3 presents the most current data for each indicator by state and assigns a score to each state according to its performance relative to the other states.
SUMMARY OF FINDINGS:There is considerable variation among the states for each indicator, and mixed progress has been made since The State of Aging and Health in America 2007 was released. For example,
�� No states have met all targets.�� All states met the targets for obesity, taking medications for high blood pressure, and mammography
within past 2 years.�� No states met the targets for flu or pneumonia vaccinations.�� Variation among states can be significant. For example, in Utah and Connecticut, 70.9% of older adults have
retained most of their natural teeth, whereas in West Virginia, this is true for only 33.4% of older adults.

PAGE 28 The State of Aging and Health in America 2013
Table 2. State-by-State Report Card on Healthy Aging
Indicator Data Year*Healthy
People 2020 Target
No. of States Meeting Target† Range
Health Status1. Physically unhealthy days (mean number of days
in past month)2010 ‡ ‡ 4.0 6.9
2. Frequent mental distress (%)§ 2010 ‡ ‡ 3.9 10.53. Oral health: tooth retention (%)|| 2010 ‡ ‡ 33.4 70.94. Disability (%)¶ 2010 ‡ ‡ 30.2 46.5
Health Behaviors
5. No leisure-time physical activity in past month (%) 2010 32.6 25 23.2 39.8
6. Eating fruits and vegetables daily: # #
Eating ≥2 fruits daily (%) Eating ≥3 vegetables daily (%)
2010 25.8 51.3 21.2 39.1
7. Obesity (%) 2010 30.6 51 15.7 29.28. Current smoking (%) 2010 12.0 50 4.6 14.69. Medication for high blood pressure (%)** 2009 77.4 51 90.1 98.0
Preventive Care and Screening
10. Flu vaccine in past year (%) 2010 90.0 0 59.3 73.4
11. Ever had pneumonia vaccine (%) 2010 90.0 0 61.9 74.0
12. Mammogram within past 2 years (%) 2010 70.0 51 71.8 89.8
13. Colorectal cancer screening (%) 2010 70.5 18 57.1 77.8
14. Up-to-date on select preventive services (%)††
Men
Women
2010 50.9
52.7
15
12
37.0 55.1
37.9 56.1
Injuries15. Fall with injury within past year (%) 2010 ‡ ‡ 22.8 42.2
Source: CDC, Behavioral Risk Factor Surveillance System, 2009–2010. * Data for all indicators were collected for adults aged 65 years or older by CDC’s Behavioral Risk Factor Surveillance System (BRFSS). The BRFSS is not the
main data source for tracking Healthy People 2020 targets, but it is the source for the state data used in this report. See Appendix for a full description of the BRFSS.
† Includes all 50 states and the District of Columbia. Some targets are for all adults aged 18 or older, not just those aged 65 or older. This table only reports data for older adults. See Appendix for a full description of Healthy People 2020.
‡ Indicators 1, 2, 4, and 15 do not have Healthy People 2020 targets.§ Frequent mental distress is defined as having had 14 or more mentally unhealthy days in the previous month. || Tooth retention is defined as having lost 5 or fewer natural teeth. ¶ Disability is defined on the basis of an affirmative response to either of the following two questions on the 2010 BRFSS survey: “Are you limited in any
way in any activities because of physical, mental, or emotional problems?” or “Do you now have any health problem that requires you to use special equipment, such as a cane, a wheelchair, a special bed, or a special telephone?”
# Healthy People 2020 divides the nutrition target into multiple categories of fruits and vegetables. See Appendix for a full description.** Indicator 9 describes the percentage of people with diagnosed high blood pressure who are taking prescribed medication.††For men, three services are included: influenza vaccine in past year, ever had a pneumonia vaccine, and colorectal cancer screening. For women, these
same three services are included, plus a mammogram within past 2 years.

The State of Aging and Health in America 2013 PAGE 29
Table 3. State-by-State Report Card on Healthy AgingPhysically Unhealthy Days
(Mean number of days in past month) 2010Frequent Mental
Distress* (%) 2010Oral Health: Tooth
Retention* (%) 2010
Data† L CI‡ U CI Score§ Data† L CI‡ U CI Score§ Data† L CI‡ U CI Score§
Alabama 6.1 5.6 6.6 3 8.1 6.8 9.4 3 48.0 45.5 50.5 3Alaska 5.9 4.0 7.9 3 6.7 2.9 10.6 2 59.0 50.7 67.2 2Arizona 5.2 4.5 5.8 2 6.9 5.4 8.5 2 65.2 62.2 68.3 1Arkansas 6.0 5.4 6.6 3 8.1 6.5 9.7 3 49.8 46.9 52.7 3California 5.5 5.1 5.8 2 9.0 7.9 10.1 4 67.7 66.0 69.4 1Colorado 4.9 4.5 5.3 2 5.2 4.4 6.1 1 67.0 65.0 69.0 1Connecticut 4.9 4.4 5.4 2 5.6 4.5 6.7 2 70.9 68.5 73.3 1Delaware 5.3 4.7 5.9 2 6.3 4.8 7.8 2 56.1 53.1 59.2 2District of Columbia 4.7 4.1 5.4 1 6.4 4.7 8.0 2 63.7 60.4 67.0 1Florida 5.1 4.8 5.4 2 7.4 6.3 8.4 3 62.7 61.1 64.3 1Georgia 6.0 5.4 6.6 3 9.0 7.3 10.6 4 55.2 52.4 58.0 2Hawaii 4.0 3.5 4.4 1 4.0 2.8 5.3 1 69.2 66.6 71.9 1Idaho 5.6 5.2 6.1 3 6.2 5.1 7.3 2 63.3 61.1 65.5 1Illinois 5.4 4.9 6.0 2 6.0 4.4 7.5 2 59.2 56.2 62.1 2Indiana 5.4 5.0 5.9 2 6.6 5.6 7.5 2 55.6 53.5 57.7 2Iowa 4.7 4.3 5.1 1 3.9 3.1 4.7 1 62.1 59.8 64.4 1Kansas 4.6 4.2 5.0 1 5.9 4.9 6.8 2 59.7 57.7 61.6 2Kentucky 6.9 6.3 7.5 4 6.8 5.7 8.0 2 45.3 42.6 48.1 3Louisiana 6.5 5.9 7.0 4 9.1 7.6 10.6 4 48.5 46.1 51.0 3Maine 4.5 4.1 4.9 1 5.8 4.8 6.9 2 54.2 52.1 56.4 2Maryland 4.7 4.2 5.1 1 6.5 5.2 7.8 2 61.7 59.1 64.2 1Massachusetts 4.9 4.5 5.2 2 5.8 4.9 6.7 2 61.6 59.6 63.6 1Michigan 5.0 4.6 5.4 2 6.5 5.6 7.5 2 63.8 61.8 65.7 1Minnesota 4.8 4.3 5.4 2 4.2 3.2 5.3 1 68.4 65.9 71.0 1Mississippi 6.2 5.7 6.7 3 8.8 7.6 10.0 3 44.3 42.1 46.5 3Missouri 5.9 5.2 6.5 3 6.3 4.9 7.6 2 52.6 49.7 55.6 2Montana 5.3 4.8 5.8 2 6.7 5.5 7.9 2 61.9 59.6 64.3 1Nebraska 4.8 4.4 5.2 2 6.2 5.2 7.2 2 64.1 62.2 66.1 1Nevada 5.6 4.8 6.3 3 7.9 5.7 10.2 3 59.8 55.9 63.7 2New Hampshire 5.0 4.5 5.5 2 6.4 5.2 7.6 2 59.9 57.3 62.4 2New Jersey 5.2 4.8 5.7 2 7.6 6.4 8.9 3 59.0 56.8 61.2 2New Mexico 5.9 5.4 6.5 3 7.9 6.6 9.2 3 63.4 61.1 65.8 1New York 5.1 4.7 5.5 2 7.3 6.2 8.4 3 59.1 57.0 61.2 2North Carolina 5.8 5.3 6.3 3 7.1 5.8 8.4 2 51.7 49.5 53.9 3North Dakota 5.1 4.5 5.6 2 5.6 4.3 6.9 2 56.4 53.6 59.1 2Ohio 5.4 4.9 5.8 2 7.1 6.0 8.2 2 54.5 52.3 56.8 2Oklahoma 6.4 5.9 6.9 4 8.4 7.2 9.5 3 49.6 47.5 51.7 3Oregon 5.4 4.9 5.9 2 6.3 5.1 7.6 2 65.6 63.2 68.0 1Pennsylvania 5.3 4.9 5.6 2 5.9 5.1 6.8 2 54.1 52.1 56.0 2Rhode Island 5.0 4.5 5.4 2 7.0 5.8 8.3 2 57.6 55.2 60.1 2South Carolina 5.5 4.9 6.0 2 6.1 5.1 7.2 2 51.1 48.7 53.6 3South Dakota 4.3 3.8 4.8 1 4.4 3.4 5.5 1 54.9 52.4 57.4 2Tennessee 5.4 4.8 6.1 2 5.4 4.2 6.5 1 46.5 43.6 49.4 3Texas 5.9 5.5 6.3 3 6.6 5.6 7.6 2 61.3 59.2 63.4 2Utah 5.0 4.6 5.5 2 6.2 5.1 7.3 2 70.9 68.8 73.0 1Vermont 4.7 4.3 5.1 1 5.1 4.1 6.1 1 60.3 58.0 62.6 2Virginia 5.3 4.7 5.9 2 5.9 4.7 7.1 2 63.6 60.6 66.6 1Washington 4.8 4.5 5.1 2 5.3 4.7 6.0 1 68.1 66.8 69.5 1West Virginia 6.9 6.3 7.6 4 10.5 8.8 12.2 4 33.4 30.8 36.1 4Wisconsin 5.5 4.9 6.2 2 5.4 3.9 6.8 1 62.2 59.2 65.3 1Wyoming 5.3 4.8 5.8 2 5.6 4.5 6.7 2 62.0 59.7 64.4 1
* Defined in Table 2.† Data are for U.S. adults aged 65 years or older. ‡ A confidence interval (CI) describes the level of uncertainty of an estimate and specifies the range in which the true value is likely to fall. This
report uses a 95% level of significance, which means that 95% of the time, the true value falls within these boundaries. When comparing prevalence of variables across states or years, we recommend the use of confidence intervals. If the confidence intervals overlap, the difference is not statistically significant.
§ Scores are calculated as quartiles and show state performance relative to all other states. 1 = top 25%; 4 = bottom 25%. Source: CDC, Behavioral Risk Factor Surveillance System, 2009–2010. See Appendix for a full description of this data source.

PAGE 30 The State of Aging and Health in America 2013
Table 3. State-by-State Report Card on Healthy Aging (continued)
Disability* (%) 2010 No Leisure-Time Physical Activity (%) 2010
Eat Fruit 2 or More Times a Day (%) 2009
Eat Vegetables 3 or More Times a Day (%) 2009
Data† L CI‡ U CI Score§ Data† L CI‡ U CI Score§ Data† L CI‡ U CI Score§ Data† L CI‡ U CI Score§
Alabama 40.2 37.9 42.6 3 35.1 32.7 37.4 3 30.4 27.5 33.3 4 27.7 24.7 30.7 3Alaska 46.5 38.6 54.4 4 31.4 24.0 38.9 2 39.6 31.9 47.3 2 27.0 20.4 33.6 3Arizona 39.0 35.9 42.1 3 26.8 24.0 29.5 1 45.5 42.1 48.9 1 28.6 25.5 31.6 3Arkansas 44.1 41.2 46.9 4 37.3 34.5 40.1 4 32.4 29.4 35.3 3 32.5 29.4 35.5 2California 37.0 35.3 38.7 2 26.0 24.4 27.6 1 48.5 46.5 50.4 1 32.3 30.5 34.1 2Colorado 38.7 36.7 40.6 3 24.8 23.1 26.6 1 45.9 43.7 48.0 1 29.9 27.9 32.0 3Connecticut 32.9 30.5 35.3 1 29.5 27.1 31.8 2 49.0 46.3 51.7 1 32.3 29.8 34.9 2Delaware 39.0 36.0 42.0 3 29.9 27.2 32.7 2 39.6 36.2 43.0 2 27.3 24.1 30.4 3District of Columbia 35.6 32.5 38.8 2 26.4 23.4 29.3 1 51.3 47.8 54.8 1 33.8 30.5 37.2 2Florida 37.3 35.7 39.0 2 27.9 26.4 29.4 2 44.1 41.9 46.3 2 31.4 29.4 33.5 2Georgia 39.1 36.5 41.8 3 34.9 32.3 37.4 3 36.8 33.9 39.8 3 31.2 28.4 34.1 2Hawaii 30.2 27.6 32.7 1 23.2 20.8 25.7 1 42.5 39.6 45.4 2 31.7 28.9 34.4 2Idaho 40.7 38.5 43.0 3 31.0 28.9 33.2 2 40.9 38.0 43.7 2 31.3 28.6 34.0 2Illinois 37.2 34.4 40.0 2 34.3 31.6 37.1 3 44.8 42.1 47.6 2 26.3 23.9 28.7 3Indiana 36.2 34.2 38.2 2 34.6 32.6 36.5 3 37.5 35.2 39.8 3 26.0 23.9 28.2 3Iowa 35.1 32.8 37.3 2 34.7 32.5 37.0 3 40.9 38.4 43.3 2 27.4 25.1 29.7 3Kansas 40.1 38.1 42.0 3 31.0 29.2 32.9 2 35.0 33.7 36.4 3 31.0 29.7 32.3 2Kentucky 40.5 37.8 43.2 3 39.7 37.1 42.4 4 32.4 29.8 35.0 3 32.2 29.5 34.9 2Louisiana 39.7 37.3 42.1 3 35.9 33.6 38.2 4 33.0 30.8 35.2 3 21.2 19.3 23.0 4Maine 36.7 34.6 38.8 2 29.7 27.7 31.6 2 46.3 44.0 48.6 1 32.5 30.3 34.6 2Maryland 37.0 34.6 39.4 2 33.8 31.4 36.3 3 42.6 39.9 45.3 2 30.6 28.0 33.1 2Massachusetts 33.5 31.6 35.4 1 29.6 27.8 31.5 2 47.9 45.8 50.1 1 29.3 27.3 31.3 3Michigan 38.1 36.2 40.0 2 32.1 30.2 33.9 3 42.9 40.8 45.0 2 27.2 25.3 29.2 3Minnesota 34.4 31.8 37.0 2 31.4 28.9 34.0 2 43.3 40.8 45.8 2 27.1 24.8 29.4 3Mississippi 43.9 41.7 46.1 4 38.1 36.0 40.2 4 27.8 26.1 29.6 4 22.1 20.5 23.8 4Missouri 43.5 40.5 46.5 4 36.9 34.0 39.8 4 37.5 34.3 40.6 3 28.7 25.7 31.7 3Montana 40.8 38.4 43.2 3 32.8 30.5 35.1 3 43.5 41.0 45.9 2 29.6 27.4 31.9 3Nebraska 38.9 36.9 40.8 3 33.9 32.0 35.8 3 44.4 42.3 46.5 2 29.9 28.0 31.8 3Nevada 37.7 34.0 41.5 2 34.7 30.9 38.5 3 36.4 32.5 40.4 3 24.6 20.9 28.3 4New Hampshire 35.4 33.0 37.8 2 28.6 26.3 30.8 2 46.4 43.6 49.2 1 32.3 29.6 35.0 2New Jersey 33.2 31.1 35.2 1 35.0 32.9 37.2 3 47.7 45.4 50.1 1 28.6 26.4 30.8 3New Mexico 41.3 38.9 43.7 3 26.1 24.0 28.2 1 37.7 35.5 40.0 3 32.2 29.9 34.5 2New York 37.4 35.4 39.4 2 29.6 27.7 31.5 2 48.8 46.0 51.7 1 26.8 24.3 29.4 3North Carolina 39.7 37.6 41.8 3 31.9 29.9 33.9 3 33.7 31.4 35.9 3 29.1 27.0 31.3 3North Dakota 37.0 34.4 39.6 2 33.1 30.5 35.6 3 46.2 43.3 49.1 1 27.5 24.9 30.2 3Ohio 37.5 35.4 39.6 2 36.0 33.9 38.0 4 40.1 37.9 42.3 2 26.9 24.9 28.9 3Oklahoma 45.4 43.4 47.5 4 38.0 36.0 40.0 4 25.8 23.8 27.7 4 30.0 27.9 32.1 3Oregon 41.1 38.7 43.5 3 24.2 22.1 26.3 1 40.7 37.9 43.5 2 31.3 28.6 34.0 2Pennsylvania 35.8 34.0 37.7 2 34.1 32.3 35.9 3 44.4 42.1 46.7 2 26.8 24.7 28.8 3Rhode Island 36.2 33.8 38.6 2 34.8 32.4 37.1 3 45.3 42.6 48.0 1 31.9 29.3 34.5 2South Carolina 39.8 37.4 42.1 3 32.8 30.6 35.1 3 31.5 29.1 33.9 4 27.1 24.8 29.5 3South Dakota 39.5 37.1 41.9 3 32.0 29.7 34.3 3 42.9 40.4 45.4 2 27.0 24.7 29.3 3Tennessee 38.6 35.8 41.5 3 39.2 36.4 42.0 4 32.1 29.3 34.8 4 39.1 36.1 42.1 1Texas 37.4 35.4 39.4 2 32.9 31.0 34.8 3 36.7 34.2 39.3 3 32.3 29.7 35.0 2Utah 40.8 38.5 43.0 3 26.8 24.8 28.8 1 42.0 39.6 44.4 2 27.1 24.8 29.3 3Vermont 36.8 34.6 39.0 2 28.6 26.5 30.7 2 49.3 46.8 51.8 1 31.0 28.7 33.3 2Virginia 39.8 36.5 43.2 3 33.0 29.8 36.1 3 42.4 38.9 45.9 2 35.1 31.7 38.6 1Washington 42.7 41.2 44.1 4 23.3 22.0 24.5 1 42.3 40.8 43.8 2 32.2 30.7 33.6 2West Virginia 41.8 39.1 44.6 3 39.8 37.0 42.5 4 33.3 30.6 35.9 3 25.2 22.7 27.7 4Wisconsin 33.0 30.1 36.0 1 28.7 25.9 31.5 2 48.2 44.2 52.3 1 27.6 23.8 31.3 3Wyoming 39.0 36.6 41.3 3 33.0 30.7 35.3 3 41.8 39.3 44.4 2 30.0 27.6 32.4 3
* Defined in Table 2.† Data are for U.S. adults aged 65 years or older. ‡ A confidence interval (CI) describes the level of uncertainty of an estimate and specifies the range in which the true value is likely to fall. This report uses
a 95% level of significance, which means that 95% of the time, the true value falls within these boundaries. When comparing prevalence of variables across states or years, we recommend the use of confidence intervals. If the confidence intervals overlap, the difference is not statistically significant.
§ Scores are calculated as quartiles and show state performance relative to all other states. 1 = top 25%; 4 = bottom 25%. Source: CDC, Behavioral Risk Factor Surveillance System, 2009–2010. See Appendix for a full description of this data source.

The State of Aging and Health in America 2013 PAGE 31
Table 3. State-by-State Report Card on Healthy Aging (continued)
Obesity* (%) 2010 Current Smoker (%) 2010 Medication for High Blood Pressure* (%) 2010
Data† L CI‡ U CI Score§ Data† L CI‡ U CI Score§ Data† L CI‡ U CI Score§
Alabama 26.3 24.0 28.6 4 10.3 8.7 11.9 3 95.2 93.7 96.7 2Alaska 22.9 16.4 29.4 3 10.8 5.2 16.4 3 93.6 90.3 96.9 3
Arizona 21.5 18.9 24.2 2 8.9 7.0 10.8 2 90.7 88.0 93.4 4Arkansas 23.7 21.2 26.1 3 10.4 8.7 12.2 3 92.8 90.7 94.9 3California 21.0 19.6 22.5 2 6.1 5.2 7.0 1 92.0 90.7 93.3 4Colorado 18.2 16.6 19.8 1 8.2 7.0 9.4 2 92.7 91.1 94.3 3Connecticut 22.0 19.8 24.2 2 5.0 4.0 6.0 1 93.5 91.7 95.4 3Delaware 27.6 24.8 30.4 4 7.1 5.6 8.6 2 95.2 93.4 96.9 2District of Columbia 21.2 18.3 24.0 2 10.2 8.1 12.4 3 93.2 91.1 95.2 3Florida 22.2 20.8 23.7 2 8.4 7.5 9.3 2 94.4 93.0 95.8 2Georgia 25.1 22.7 27.5 3 10.7 9.0 12.4 3 95.4 93.9 97.0 2Hawaii 15.7 13.6 17.8 1 7.2 5.8 8.7 2 91.1 89.0 93.3 4Idaho 25.4 23.4 27.5 3 8.6 7.3 9.8 2 90.5 88.3 92.8 4Illinois 25.1 22.3 27.9 3 8.5 6.9 10.1 2 94.1 92.5 95.7 2Indiana 29.2 27.3 31.1 4 8.0 6.9 9.0 2 95.0 93.8 96.2 2Iowa 27.3 25.1 29.4 4 7.3 6.1 8.5 2 93.4 91.7 95.0 3Kansas 25.7 24.0 27.5 3 7.9 6.8 8.9 2 94.5 93.6 95.3 2Kentucky 27.0 24.7 29.4 4 10.7 9.1 12.2 3 94.1 92.4 95.7 2Louisiana 28.2 26.0 30.4 4 10.1 8.6 11.6 3 95.3 94.1 96.5 2Maine 24.3 22.5 26.2 3 7.6 6.6 8.7 2 93.0 91.6 94.4 3Maryland 24.5 22.2 26.7 3 8.3 6.9 9.7 2 95.6 94.3 96.9 2Massachusetts 22.9 21.1 24.6 3 7.6 6.6 8.6 2 94.9 93.6 96.2 2Michigan 27.3 25.5 29.1 4 8.0 7.0 9.1 2 93.5 92.3 94.8 3Minnesota 24.3 21.9 26.7 3 8.4 6.7 10.1 2 98.0 97.1 99.0 1Mississippi 27.3 25.2 29.3 4 9.2 7.9 10.4 2 96.1 95.2 96.9 1Missouri 26.3 23.6 29.0 4 9.9 8.1 11.6 3 95.2 93.6 96.7 2Montana 22.1 20.0 24.1 2 9.0 7.7 10.3 2 90.6 88.8 92.3 4Nebraska 24.0 22.2 25.7 3 7.7 6.6 8.9 2 94.6 93.4 95.9 2Nevada 21.8 18.3 25.2 2 14.6 11.9 17.3 4 93.6 91.4 95.8 3New Hampshire 23.5 21.3 25.7 3 7.8 6.4 9.1 2 93.1 91.2 95.0 3New Jersey 24.8 22.8 26.8 3 8.0 6.8 9.1 2 95.1 93.7 96.4 2New Mexico 20.3 18.3 22.3 2 9.6 8.1 11.0 2 90.1 88.2 91.9 4New York 22.2 20.4 24.0 2 7.5 6.4 8.5 2 94.3 92.9 95.7 2North Carolina 24.6 22.6 26.7 3 9.3 7.9 10.6 2 95.3 94.2 96.5 2North Dakota 24.5 22.1 26.8 3 9.2 7.7 10.8 2 95.9 94.5 97.3 2Ohio 27.0 25.0 29.0 4 10.3 9.0 11.6 3 94.1 92.8 95.4 2Oklahoma 26.1 24.2 28.0 4 10.9 9.6 12.2 3 94.0 92.6 95.3 3Oregon 25.1 22.9 27.3 3 8.1 6.7 9.5 2 93.6 91.9 95.4 3Pennsylvania 26.7 25.0 28.4 4 7.7 6.7 8.6 2 94.6 93.3 95.8 2Rhode Island 22.9 20.8 25.0 3 8.5 7.1 9.9 2 96.2 95.0 97.4 1South Carolina 26.0 23.9 28.2 4 8.1 6.5 9.6 2 95.9 94.7 97.1 2South Dakota 22.2 20.1 24.3 2 7.1 5.9 8.4 2 92.6 91.0 94.3 3Tennessee 24.7 22.3 27.1 3 9.2 7.5 10.9 2 95.3 93.6 97.1 2Texas 28.4 26.4 30.4 4 8.5 7.2 9.8 2 93.7 92.3 95.1 3Utah 24.9 22.9 27.0 3 4.6 3.6 5.5 1 91.5 89.7 93.2 4Vermont 23.4 21.5 25.4 3 5.8 4.8 6.8 1 91.0 89.2 92.8 4Virginia 23.7 20.6 26.7 3 8.5 6.8 10.2 2 95.0 93.2 96.8 2Washington 23.9 22.7 25.1 3 7.2 6.5 7.9 2 91.2 90.2 92.3 4West Virginia 25.9 23.4 28.4 4 10.8 9.1 12.5 3 96.0 94.6 97.4 1Wisconsin 24.0 21.3 26.7 3 6.7 5.2 8.3 1 95.0 93.1 97.0 2Wyoming 22.8 20.7 24.9 3 9.1 7.7 10.4 2 91.1 89.2 93.0 4
* Defined in Table 2.† Data are for U.S. adults aged 65 years or older. ‡ A confidence interval (CI) describes the level of uncertainty of an estimate and specifies the range in which the true value is likely to fall. This
report uses a 95% level of significance, which means that 95% of the time, the true value falls within these boundaries. When comparing prevalence of variables across states or years, we recommend the use of confidence intervals. If the confidence intervals overlap, the difference is not statistically significant.
§ Scores are calculated as quartiles and show state performance relative to all other states. 1 = top 25%; 4 = bottom 25%. Source: CDC, Behavioral Risk Factor Surveillance System, 2009–2010. See Appendix for a full description of this data source.
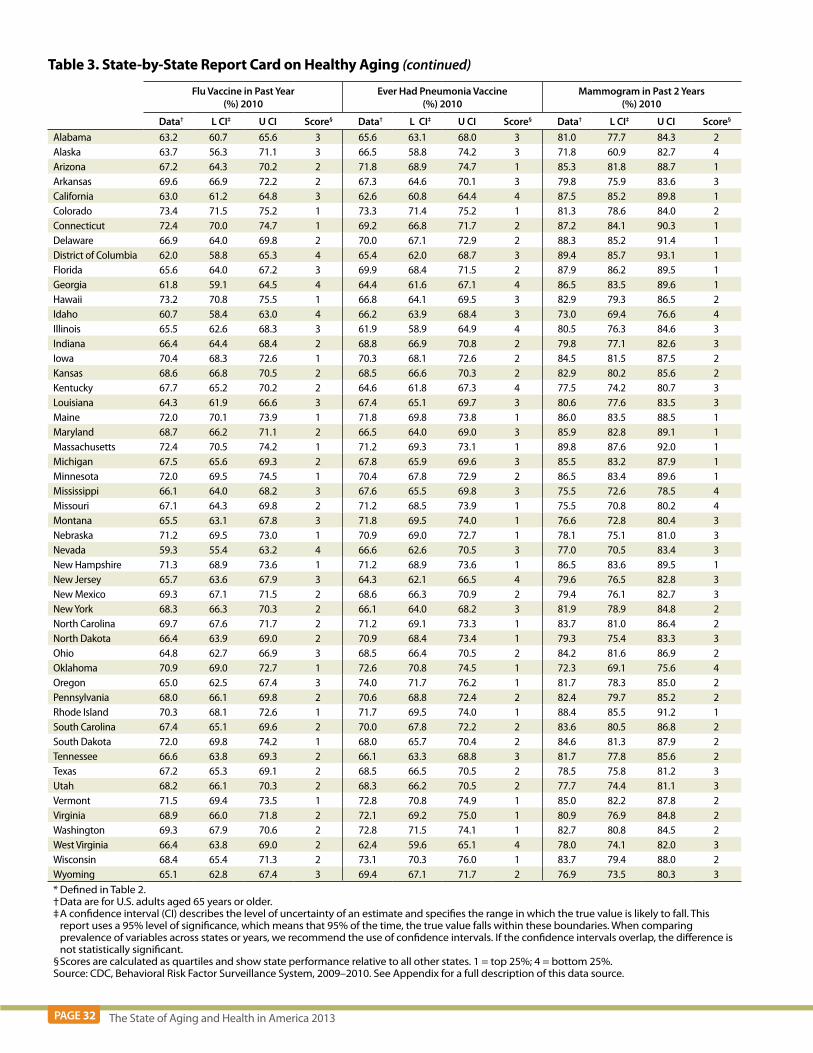
PAGE 32 The State of Aging and Health in America 2013
Table 3. State-by-State Report Card on Healthy Aging (continued)
Flu Vaccine in Past Year (%) 2010
Ever Had Pneumonia Vaccine (%) 2010
Mammogram in Past 2 Years (%) 2010
Data† L CI‡ U CI Score§ Data† L CI‡ U CI Score§ Data† L CI‡ U CI Score§
Alabama 63.2 60.7 65.6 3 65.6 63.1 68.0 3 81.0 77.7 84.3 2Alaska 63.7 56.3 71.1 3 66.5 58.8 74.2 3 71.8 60.9 82.7 4Arizona 67.2 64.3 70.2 2 71.8 68.9 74.7 1 85.3 81.8 88.7 1Arkansas 69.6 66.9 72.2 2 67.3 64.6 70.1 3 79.8 75.9 83.6 3California 63.0 61.2 64.8 3 62.6 60.8 64.4 4 87.5 85.2 89.8 1Colorado 73.4 71.5 75.2 1 73.3 71.4 75.2 1 81.3 78.6 84.0 2Connecticut 72.4 70.0 74.7 1 69.2 66.8 71.7 2 87.2 84.1 90.3 1Delaware 66.9 64.0 69.8 2 70.0 67.1 72.9 2 88.3 85.2 91.4 1District of Columbia 62.0 58.8 65.3 4 65.4 62.0 68.7 3 89.4 85.7 93.1 1Florida 65.6 64.0 67.2 3 69.9 68.4 71.5 2 87.9 86.2 89.5 1Georgia 61.8 59.1 64.5 4 64.4 61.6 67.1 4 86.5 83.5 89.6 1Hawaii 73.2 70.8 75.5 1 66.8 64.1 69.5 3 82.9 79.3 86.5 2Idaho 60.7 58.4 63.0 4 66.2 63.9 68.4 3 73.0 69.4 76.6 4Illinois 65.5 62.6 68.3 3 61.9 58.9 64.9 4 80.5 76.3 84.6 3Indiana 66.4 64.4 68.4 2 68.8 66.9 70.8 2 79.8 77.1 82.6 3Iowa 70.4 68.3 72.6 1 70.3 68.1 72.6 2 84.5 81.5 87.5 2Kansas 68.6 66.8 70.5 2 68.5 66.6 70.3 2 82.9 80.2 85.6 2Kentucky 67.7 65.2 70.2 2 64.6 61.8 67.3 4 77.5 74.2 80.7 3Louisiana 64.3 61.9 66.6 3 67.4 65.1 69.7 3 80.6 77.6 83.5 3Maine 72.0 70.1 73.9 1 71.8 69.8 73.8 1 86.0 83.5 88.5 1Maryland 68.7 66.2 71.1 2 66.5 64.0 69.0 3 85.9 82.8 89.1 1Massachusetts 72.4 70.5 74.2 1 71.2 69.3 73.1 1 89.8 87.6 92.0 1Michigan 67.5 65.6 69.3 2 67.8 65.9 69.6 3 85.5 83.2 87.9 1Minnesota 72.0 69.5 74.5 1 70.4 67.8 72.9 2 86.5 83.4 89.6 1Mississippi 66.1 64.0 68.2 3 67.6 65.5 69.8 3 75.5 72.6 78.5 4Missouri 67.1 64.3 69.8 2 71.2 68.5 73.9 1 75.5 70.8 80.2 4Montana 65.5 63.1 67.8 3 71.8 69.5 74.0 1 76.6 72.8 80.4 3Nebraska 71.2 69.5 73.0 1 70.9 69.0 72.7 1 78.1 75.1 81.0 3Nevada 59.3 55.4 63.2 4 66.6 62.6 70.5 3 77.0 70.5 83.4 3New Hampshire 71.3 68.9 73.6 1 71.2 68.9 73.6 1 86.5 83.6 89.5 1New Jersey 65.7 63.6 67.9 3 64.3 62.1 66.5 4 79.6 76.5 82.8 3New Mexico 69.3 67.1 71.5 2 68.6 66.3 70.9 2 79.4 76.1 82.7 3New York 68.3 66.3 70.3 2 66.1 64.0 68.2 3 81.9 78.9 84.8 2North Carolina 69.7 67.6 71.7 2 71.2 69.1 73.3 1 83.7 81.0 86.4 2North Dakota 66.4 63.9 69.0 2 70.9 68.4 73.4 1 79.3 75.4 83.3 3Ohio 64.8 62.7 66.9 3 68.5 66.4 70.5 2 84.2 81.6 86.9 2Oklahoma 70.9 69.0 72.7 1 72.6 70.8 74.5 1 72.3 69.1 75.6 4Oregon 65.0 62.5 67.4 3 74.0 71.7 76.2 1 81.7 78.3 85.0 2Pennsylvania 68.0 66.1 69.8 2 70.6 68.8 72.4 2 82.4 79.7 85.2 2Rhode Island 70.3 68.1 72.6 1 71.7 69.5 74.0 1 88.4 85.5 91.2 1South Carolina 67.4 65.1 69.6 2 70.0 67.8 72.2 2 83.6 80.5 86.8 2South Dakota 72.0 69.8 74.2 1 68.0 65.7 70.4 2 84.6 81.3 87.9 2Tennessee 66.6 63.8 69.3 2 66.1 63.3 68.8 3 81.7 77.8 85.6 2Texas 67.2 65.3 69.1 2 68.5 66.5 70.5 2 78.5 75.8 81.2 3Utah 68.2 66.1 70.3 2 68.3 66.2 70.5 2 77.7 74.4 81.1 3Vermont 71.5 69.4 73.5 1 72.8 70.8 74.9 1 85.0 82.2 87.8 2Virginia 68.9 66.0 71.8 2 72.1 69.2 75.0 1 80.9 76.9 84.8 2Washington 69.3 67.9 70.6 2 72.8 71.5 74.1 1 82.7 80.8 84.5 2West Virginia 66.4 63.8 69.0 2 62.4 59.6 65.1 4 78.0 74.1 82.0 3Wisconsin 68.4 65.4 71.3 2 73.1 70.3 76.0 1 83.7 79.4 88.0 2Wyoming 65.1 62.8 67.4 3 69.4 67.1 71.7 2 76.9 73.5 80.3 3* Defined in Table 2.† Data are for U.S. adults aged 65 years or older. ‡ A confidence interval (CI) describes the level of uncertainty of an estimate and specifies the range in which the true value is likely to fall. This
report uses a 95% level of significance, which means that 95% of the time, the true value falls within these boundaries. When comparing prevalence of variables across states or years, we recommend the use of confidence intervals. If the confidence intervals overlap, the difference is not statistically significant.
§ Scores are calculated as quartiles and show state performance relative to all other states. 1 = top 25%; 4 = bottom 25%. Source: CDC, Behavioral Risk Factor Surveillance System, 2009–2010. See Appendix for a full description of this data source.

The State of Aging and Health in America 2013 PAGE 33
Table 3. State-by-State Report Card on Healthy Aging (continued)
Colorectal Cancer Screening (%) 2010
Up-to-Date on Selected Preventive Services: Men* (%)
2010
Up-to-Date on Selected Preventive Services: Women*
(%) 2010
Fall With Injury Within Past Year (%) 2010
Data† L CI‡ U CI Score§ Data† L CI‡ U CI Score§ Data† L CI‡ U CI Score§ Data† L CI‡ U CI Score§
Alabama 70.2 67.3 73.1 3 46.8 42.2 51.3 2 42.2 39.3 45.2 4 31.9 26.2 37.6 2Alaska 68.4 58.9 78.0 3 37.0 23.6 50.3 4 46.6 36.0 57.2 3 31.3 12.0 50.6 2Arizona 74.6 71.0 78.2 2 49.0 43.8 54.3 2 52.4 48.4 56.3 1 26.3 19.8 32.7 1Arkansas 66.6 63.1 70.2 3 48.5 43.6 53.4 2 48.0 44.3 51.8 2 31.7 25.3 38.1 2California 73.1 70.6 75.5 2 42.1 39.1 45.1 3 44.3 42.0 46.6 3 30.8 26.8 34.8 2Colorado 74.5 72.1 76.8 2 53.7 50.2 57.3 1 55.2 52.5 58.0 1 32.2 27.1 37.2 2Connecticut 79.2 76.3 82.1 1 52.9 48.4 57.3 1 52.4 49.1 55.8 1 31.8 25.1 38.5 2Delaware 74.5 70.8 78.2 2 49.4 44.3 54.5 2 51.3 47.5 55.2 2 31.0 23.5 38.5 2District of Columbia 76.1 72.3 80.0 1 45.5 39.8 51.2 3 46.4 42.2 50.7 3 31.1 23.4 38.7 2Florida 77.7 75.7 79.8 1 52.4 49.7 55.2 1 50.6 48.5 52.8 2 34.6 30.6 38.5 3Georgia 73.6 70.5 76.8 2 39.9 35.1 44.6 4 45.6 42.2 49.1 3 36.5 30.1 42.8 3Hawaii 70.0 66.6 73.5 3 46.1 41.6 50.5 2 53.1 49.5 56.8 1 30.0 22.7 37.2 2Idaho 66.2 63.4 69.1 4 42.8 38.9 46.6 3 42.9 39.8 45.9 3 33.0 27.8 38.2 3Illinois 69.3 65.4 73.2 3 43.6 38.5 48.8 3 42.7 39.1 46.2 3 32.1 24.8 39.4 2Indiana 71.2 68.6 73.7 2 49.3 45.5 53.0 2 47.6 45.0 50.2 2 29.8 25.1 34.4 2Iowa 71.4 68.5 74.3 2 49.5 45.3 53.6 2 51.5 48.6 54.4 2 25.2 20.2 30.2 1Kansas 71.6 69.2 74.0 2 47.4 44.1 50.7 2 50.4 47.9 53.0 2 26.4 22.2 30.6 1Kentucky 71.3 68.2 74.4 2 46.5 41.4 51.5 2 45.0 41.7 48.3 3 35.9 30.0 41.8 3Louisiana 69.8 66.9 72.6 3 46.7 42.4 51.1 2 45.0 42.1 47.9 3 24.9 19.4 30.5 1Maine 80.0 77.8 82.2 1 51.3 47.7 55.0 1 55.1 52.3 57.9 1 30.3 25.4 35.2 2Maryland 78.5 75.6 81.5 1 46.1 41.7 50.5 2 52.3 49.0 55.6 1 31.3 25.2 37.5 2Massachusetts 78.1 75.7 80.5 1 53.2 49.5 56.9 1 53.8 51.1 56.4 1 34.6 29.2 40.0 3Michigan 77.5 75.3 79.7 1 46.9 43.5 50.3 2 50.4 47.9 52.9 2 30.0 25.4 34.5 2Minnesota 75.3 72.2 78.4 2 50.5 45.6 55.4 2 54.8 51.4 58.1 1 28.0 21.5 34.4 2Mississippi 65.1 62.3 67.8 4 47.9 43.8 51.9 2 46.1 43.4 48.7 3 28.6 23.9 33.3 2Missouri 69.5 65.9 73.1 3 51.3 46.1 56.6 1 49.0 45.2 52.8 2 25.3 19.2 31.4 1Montana 67.7 64.7 70.7 3 47.1 43.1 51.1 2 47.9 44.7 51.0 2 22.8 18.2 27.4 1Nebraska 70.5 68.0 73.0 3 51.9 48.3 55.4 1 51.1 48.6 53.6 2 27.9 23.5 32.2 2Nevada 61.9 57.1 66.7 4 44.7 38.6 50.8 3 37.9 32.7 43.0 4 34.8 23.9 45.6 3New Hampshire 79.0 76.4 81.7 1 51.3 46.9 55.6 1 54.7 51.4 58.0 1 33.0 26.8 39.1 3New Jersey 70.8 68.0 73.5 3 48.8 44.8 52.8 2 44.6 41.8 47.3 3 34.2 28.3 40.2 3New Mexico 67.4 64.4 70.4 3 47.6 43.5 51.7 2 48.6 45.4 51.8 2 42.2 36.4 47.9 4New York 76.9 74.4 79.5 1 50.2 46.4 54.0 2 48.3 45.6 50.9 2 37.8 32.6 43.1 4North Carolina 78.2 75.9 80.5 1 53.6 49.9 57.4 1 52.9 50.1 55.7 1 29.1 24.2 34.1 2North Dakota 69.7 66.3 73.2 3 49.9 45.0 54.8 2 49.1 45.7 52.5 2 27.4 21.0 33.9 1Ohio 70.8 68.1 73.4 3 44.9 41.1 48.8 3 48.5 45.8 51.3 2 33.9 28.9 39.0 3Oklahoma 62.9 60.3 65.6 4 50.2 46.6 53.8 2 47.6 45.0 50.2 2 30.6 26.1 35.2 2Oregon 73.2 70.1 76.2 2 49.6 45.3 53.9 2 50.2 47.0 53.4 2 34.0 27.9 40.1 3Pennsylvania 72.2 69.7 74.8 2 51.8 48.3 55.2 1 52.3 49.8 54.7 1 29.8 25.5 34.1 2Rhode Island 78.1 75.2 80.9 1 51.9 47.6 56.2 1 53.4 50.3 56.5 1 36.0 29.4 42.6 3South Carolina 75.3 72.7 78.0 2 52.1 48.1 56.0 1 48.3 45.0 51.5 2 38.1 32.0 44.3 4South Dakota 73.4 70.4 76.4 2 48.6 44.3 53.0 2 52.7 49.6 55.8 1 24.5 19.2 29.8 1Tennessee 70.2 66.7 73.6 3 49.1 43.8 54.4 2 40.7 37.4 44.0 4 28.7 21.2 36.3 2Texas 67.8 65.0 70.5 3 48.2 44.6 51.8 2 46.9 44.2 49.5 3 32.9 28.4 37.4 3Utah 75.0 72.4 77.6 2 46.6 42.8 50.4 2 48.4 45.5 51.4 2 26.8 22.0 31.6 1Vermont 78.0 75.5 80.4 1 53.3 49.4 57.2 1 56.1 53.2 59.1 1 28.9 23.8 33.9 2Virginia 74.3 70.9 77.8 2 55.1 49.8 60.4 1 49.7 45.6 53.8 2 35.6 27.5 43.6 3Washington 78.1 76.5 79.6 1 53.2 50.7 55.6 1 53.3 51.4 55.2 1 29.0 25.8 32.3 2West Virginia 62.9 59.4 66.4 4 46.1 41.4 50.8 2 39.0 35.5 42.4 4 35.8 28.5 43.1 3Wisconsin 76.6 73.1 80.2 1 49.4 44.0 54.9 2 55.2 51.1 59.2 1 23.6 16.6 30.7 1Wyoming 67.1 64.2 70.0 3 46.4 42.2 50.5 2 48.8 45.7 51.9 2 27.4 21.8 32.9 1* Defined in Table 2.† Data are for U.S. adults aged 65 years or older. ‡ A confidence interval (CI) describes the level of uncertainty of an estimate and specifies the range in which the true value is likely to fall. This report uses
a 95% level of significance, which means that 95% of the time, the true value falls within these boundaries. When comparing prevalence of variables across states or years, we recommend the use of confidence intervals. If the confidence intervals overlap, the difference is not statistically significant.
§ Scores are calculated as quartiles and show state performance relative to all other states. 1 = top 25%; 4 = bottom 25%. Source: CDC, Behavioral Risk Factor Surveillance System, 2009–2010. See Appendix for a full description of this data source.

PAGE 34 The State of Aging and Health in America 2013
Using Data for Action at the State and Local Levels
Florida Examines Its Older Adult PopulationIn 2010, the Florida Needs Assessment Survey was administered to 1,850 adults aged 60 years or older living in the state of Florida, through a cooperative effort of the Florida Department of Elder Affairs and the Bureau of Business and Economic Research at the University of Florida. The assessment covered demographics, living situation, self-care limitations, nutrition, housing, health care, emergency preparedness, transportation, social engagement and community factors, caregiving, information and assistance needs, volunteerism, and issues related to abuse, neglect, and exploitation. To ensure representation for groups that are traditionally hard to measure, oversampling was done among low-income, minority, and rural populations.
The assessment results are available at the state and Planning and Service Area (PSA) level to allow for maximum flexibility in using the data. The reports (available at http://elderaffairs.state.fl.us/doea/needs_assessment.php) provide an excellent example of how other states can proactively examine their older adult population to best serve their needs.
Source: Florida Department of Elder Affairs Web site. http://elderaffairs.state.fl.us/doea/needs_assessment.php.

The State of Aging and Health in America 2013 PAGE 35
Spotlight: Mobility
Mobility Impairment Increases Risk of IllnessMobility—the ability to move around effectively and safely in the environment—is fundamental to the health and well-being of older adults. Mobility has also been defined as “movement in all of its forms, including transferring from a bed to a chair, walking for leisure and the completion of daily tasks, engaging in other activities associated with work and play, exercising, driving a car, and using other forms of passenger transport.”1
For older adults, the effects of chronic conditions and geriatric syndromes can cause limitations in mobility (impaired mobility) that can lead to dependence in activities of daily living and other adverse outcomes.2 Impaired mobility is associated with several health problems, including depression, cardiovascular disease, cancer, and injuries secondary to falls and automobile crashes. These illnesses and injuries can lead to increased risk of death.1 Impaired mobility can also reduce a person’s access to goods and services and limit contact with friends and relatives.
Mobility restrictions have consequences for the health and well-being of older adults,
which often result in a cascade effect of continuing deterioration.
—CDC’s Healthy Aging Research Network

PAGE 36 The State of Aging and Health in America 2013
Figure 6. Percentage of Medicare enrollees aged 65 years or older who are unable to perform certain physical functions
Source: Federal Interagency Forum on Aging-Related Statistics. Older Americans 2010: Key Indicators of Well-Being.
10
31
14
7
1919
5
2
23
15
32
0
5
10
15
20
25
30
35
Stoop/kneel Reach overhead
Write Walk 2–3blocks
Lift 10 lbs. Any of these
Men Women
Perc
en
tag
e
Physical Activity and the Physical EnvironmentPrevious efforts to help people improve their mobility have focused on encouraging physical activity, such as walking. Social support interventions in community settings have focused on changing people’s behavior by building, strengthening, and maintaining social networks that provide supportive relationships for behavior change. The Community Guide (www.thecommunityguide.org) provides information on evidence-based programs and recommendations related to health interventions for behavior change. Table 4 provides examples of behavioral and social approaches to increasing physical activity.
Table 4. Recommended Interventions for Promoting Physical Activity
Approach Recommended Strategies Description of Strategies
Behavioral and Social Approaches
Individually adapted health behavior change programs.
Individually adapted health behavior change programs seek to increase physical activity by teaching people how to incorporate physical activity into their daily routines. Programs are tailored to each individual’s specific interests, preferences, and readiness for change.
Social interventions in community settings.
Social support interventions seek to change phy-sical activity behavior by building, strengthening, and maintaining social networks that provide supportive relationships for behavior change.
Source: Adapted from The Guide to Community Preventive Services, www.thecommunityguide.org.

The State of Aging and Health in America 2013 PAGE 37
Environmental and Policy ApproachesBecause walking is the most commonly reported form of physical activity among older adults, improving community environments to support walking is a promising approach to increase physical activity in this population.3 Research shows that modifying a community’s physical environment to ensure access to places to exercise and removing barriers to walking may increase the physical activity of older adults. Specific actions include building and repairing sidewalks.4 Recent research has shown that neighborhood environments that include built or physical (place-oriented) and social (people-oriented) components are associated with health status and health behaviors.5 Table 5 provides examples of environmental approaches to increasing physical activity.
Table 5. The Guide to Community Preventive Services: Recommendations Summary of Environmental Interventions for Promoting Physical Activity
Approach Recommended Strategies Description of Strategies
Environmental Approaches
Community-scale and urban design land-use policies
Environmental approaches are designed to provide opportunities, support, and cues to help people be more physically active. They may involve
• The physical environment.
• Social networks.
• Organizational norms and policies.
• Laws.
Source: www.thecommunityguide.org/pa/environmental-policy/communitypolicies.html
Creation of or improved access to places for physical activity
Creation of or improving access to places for physical activity involves the efforts of employers, coalitions, agencies, and communities as they attempt to change the local environment to create opportunities for physical activity. Such changes include creating walking trails, building exercise facilities, or providing access to existing nearby facilities.
Source: www.thecommunityguide.org/pa/environmental-policy/communitypolicies.html
Street-scale urban design land-use policies
Street-scale urban design and land-use policies involve the efforts of urban planners, architects, engineers, developers, and public health professionals to change the physical environment of small geographic areas, generally limited to a few blocks, in ways that support physical activity.
Source: www.thecommunityguide.org/pa/environmentalpolicy/streetscale.html

PAGE 38 The State of Aging and Health in America 2013
Public Health Action and Environmental ChangeThe Health Impact Pyramid (Figure 7) illustrates approaches and strategies that support and promote mobility by enhancing our understanding of the multiple factors and interactions that can influence mobility.
Figure 7. A Framework for Public Health Action: The Health Impact Pyramid
The base of the pyramid shows the factors that can have the greatest influence on determinants of health. Identification of priority polices and environmental strategies for increasing mobility among
older adults starts here. The next level is contextual change, designed to create a healthier infrastructure. Examples include improvement to the built environment, such as designing communities to promote increased physical activity and enacting policies that encourage walking, bicycling, and public transit instead of driving.
Policies and environmental strategies designed to improve mobility can change physical and social environments in positive ways—much like other successful public health strategies, such as efforts to reduce smoking.6
The Community Guide is also a resource for evidence-based recommendations related to environmental change. The guide helps support other tools for public health references, such as Healthy People 2020. Because older adults may be more vulnerable to the influence of their residential environment, they tend to stay within their neighborhoods rather than travel outside them.7 Implementing recommended environmental and policy approaches may help to reduce barriers in residential and workplace environments, thus improving physical activity for older adults.
Public health action related to mobility and healthy aging starts with coordination of strategic action. Strategies related to transportation, neighborhood design and safety, housing, and healthy lifestyle play an important role in promoting mobility.8
Counselingand Education
Socioeconomic Factors
Changing the Context to Make Individuals’
Default Decisions Healthy
ClinicalInterventions
Long-LastingProtective
Interventions
Adapted from: Frieden TR. A framework for public health action; the health impact pyramid. Am J Public Health, 2010;100:590–5.

The State of Aging and Health in America 2013 PAGE 39
Regional Collaboration Makes for Lifelong CommunitiesThe Atlanta Regional Commission (ARC) Area Agency on Aging’s (AAA) Lifelong Communities initiative illustrates the importance of collaboration to support healthy aging.
In 2007, the ARC and the Carl Vinson Institute of the University of Georgia published a report called Older Adults in the Atlanta Region: Preference, Practices, and Potential of the 55+ Population.9 This report found that most older adults in the study area have been “aging in place” and living in the region an average of 37 years and that most hope to continue to age in place. The majority of people surveyed (64%) also stated that they would live in their current home as long as they could. For these older adults to attain this goal of not only aging, but also living in place, they will need communities that support mobility on every level, from walking to public transportation.
In response to the evidence of a growing need for supportive communities that enhance mobility, and recognizing that providing services alone cannot meet the needs of an aging population, the ARC created a broad plan to transform neighborhoods, cities, and counties into places where people of all ages can live throughout their lifetime. The ARC AAA developed the Lifelong Communities (LLC) initiative to set three new objectives for its programs and services: promote housing and transportation options, encourage healthy lifestyles, and expand access to services. Research has shown these three elements are essential components of age-friendly communities, and each contributes to older adults’ need for greater accessibility and mobility.
Research has also shown that most people outlive their ability to drive by 6 to 10 years.10
With up to a decade yet to live after turning in their keys, people need other options for getting around their communities. To address this need, the ARC is developing a coordinated human services transportation (HST) plan for the 18-county Atlanta region. The planning process is guided by the Human Services Transportation Advisory Committee, which includes representatives from various groups advocating for the needs of older adults. As part of this effort, the AAA developed a Senior Mobility Program in 2010 to expand transportation options for older adults throughout the 10-county region. The program is also helping the AAA address transportation needs at the community level as part of the LLC initiative. Since the program’s inception, the AAA has seen support and funding grow for local transportation voucher programs. The agency has also seen increased use of a walkability assessment tool and the creation of a senior carpool program at a senior center in Cobb County, Georgia.
To be able to take advantage of transportation options (including walking), people must have a certain level of personal mobility. One of the aims of the LLC initiative is to encourage healthy lifestyles by supporting older adults’ efforts to be physically active, eat healthy, and use preventive health services (e.g., medical exams, screenings). Recent studies link a lack of mobility or impaired mobility to an increase in other health problems, as well as a decrease in health-related quality of life.11
The ARC AAA works with a variety of partners to offer diverse, evidence-based programs that help older adults maintain or improve their ability to walk safely and independently. Examples include programs that improve access to places for physical activity, such as those that build community gardens, design streets to increase mobility, and promote land-use policies that foster affordable, mixed-use housing options.

PAGE 40 The State of Aging and Health in America 2013
Stepping Up to a More Walkable HendersonvilleAll residents should be able to walk safely in their communities, whether for physical activity, enjoyment, or simply to get where they want to go. For older adults, being able to walk not only promotes physical and mental well-being, but it also helps them to stay more connected to their communities. Any actions taken to improve pedestrian safety for this group will automatically benefit all residents.
Taking Action
To address this public health concern, community leaders in Hendersonville, North Carolina, came together to implement a pilot program called Walk Wise, Drive Smart. The goal of the program is to make neighborhoods in Hendersonville and surrounding areas more pedestrian-friendly for older adults. Hendersonville is an ideal testing ground for this program because more than 30% of residents are aged 65 years or older.
Walk Wise, Drive Smart is supported in part by the Healthy Aging Research Network (HAN), which is funded by the Healthy Aging Program and is part of a network of Prevention Research Centers that works with community partners across the country. The program is led by the University of North Carolina Highway Safety Research Center, the City of Hendersonville, and the Council on Aging for Henderson County.
These organizations have a well-established partnership that includes more than 75 other organizations, such as a senior center, local hospitals, a transportation group, an environmental and conservation organization, the county health department, local YMCA and AARP affiliates, and the Area Agency on Aging. The program also is an integral part of the Henderson County Livable and Senior Friendly Community Initiative, which serves more than 100,000 people throughout the county, and it is supported by the local business community.
To plan the Walk Wise, Drive Smart program, officials assessed walking conditions in 10 Hendersonville neighborhoods. They collected information with the HAN Environmental Audit Tool (www.prc-han.org/tools-environment#envaudit) and through a series of neighborhood meetings and interviews. The resulting data pointed to the need to provide walking programs for people at different levels of fitness and to improve pedestrian facilities

The State of Aging and Health in America 2013 PAGE 41
(e.g., sidewalks, crosswalks, traffic signals) to reduce walking hazards for older adults. The data also indicated a need to change the driving habits of residents to get them to slow down and yield to pedestrians.
To build community awareness and support for pedestrian safety, program officials
�� Developed pedestrian safety plans.
�� Conducted walking audits of individual neighborhoods.
�� Established neighborhood walking routes.
�� Upgraded pedestrian facilities on walking routes in selected neighborhoods.
�� Developed walking maps and materials on how to walk and drive safely.
�� Installed outdoor benches at strategic locations.
One innovative feature of the Walk Wise, Drive Smart program is that it provides incentives (e.g., coupons for prize drawings) to courteous drivers (e.g., those who yield to pedestrians in crosswalks). The program also has an easy-to-use Web site that posts current information about program-sponsored walks, hikes, and presentations on pedestrian safety, as well as other walking-related events that are free and open to the public.
During its initial implementation phase, the program regularly collected community feedback through surveys and interviews. This information was used to ensure that the program was meeting residents’ needs and interests.
Implications and Impact
Since the Walk Wise, Drive Smart program began in 2005, it has helped to educate city officials and residents in Hendersonville about pedestrian safety. It also has made it easier for city officials to plan and implement changes to the environment to improve local walkways and roadways.
For example, city officials focused on improving the safety and walkability of certain walking routes and designated them as “senior friendly.” They modified traffic patterns in some neighborhoods to reduce speeding drive-through traffic. They also collected data to identify specific problems that could increase the risk of injury for walkers, and this information was used to promote policy changes.
The Walk Wise, Drive Smart program in Hendersonville demonstrates the power of city officials and informed citizens to work together to make policy and environmental changes to make it easier for all residents, especially older adults, to walk safely in their communities. Residents embraced the value of walking and created many new opportunities for people of all ages and abilities to participate.
This program can serve as a model for other small to midsize communities across the United States. More information about the Walk Wise, Drive Smart program is available online at www.walk-wise.org.

PAGE 42 The State of Aging and Health in America 2013
DrivingIn 2009, there were 33 million licensed drivers aged 65 years or older in the United States.12 Driving helps older adults stay mobile and independent, but the risk of being injured or killed in a motor vehicle crash increases with age. An average of 500 older adults are injured every day in motor vehicle crashes.13
Older adults are at risk because
�� Starting at age 75, fatal crash rates increase per mile traveled. This is largely caused by older adults’ increased susceptibility to injury and medical complications, not their increased tendency to get into crashes. �� Age-related declines in vision and cognitive functioning (the ability to reason and remember), as well as physical changes, may affect some older adults’ driving abilities.14
Older adults can use several strategies to stay safe on the road. For example, they can exercise regularly to increase strength and flexibility, have their vision checked by an eye doctor at least once a year, wear corrective lenses or glasses as required, drive in good weather and daylight, and use roads that are well-lit and have intersections with left turn arrows. Communities can also ensure that their streets are safer or offer alternatives to driving.
Promote Alternatives: Complete Streets“Complete streets” are designed and operated to allow safe access for all users. The essential components of a complete street follow these principles:
�� A vision for all users, including pedestrians, motorists, bicyclists, and transit passengers of all ages and abilities. �� A design that can apply to new or retrofitted road projects and includes planning, operations, and maintenance for the right of way. It encourages street connectivity and can be adopted by all agencies to cover all roads. �� A design that uses the latest and best criteria and guidelines and complements the community. It also sets performance standards with measureable outcomes and steps to implement the policies associated with integration.15

The State of Aging and Health in America 2013 PAGE 43
State Examples of Complete Street Policies “…the roadway system of the Commonwealth should safely accommodate all users of the public right-of-way including: pedestrians, (including people requiring mobility aids); bicyclists; drivers and passengers of transit vehicles, trucks, automobiles, and motorcycles.”
— Massachusetts: Project Development and Design Guide
“The department of transportation and the county transportation departments shall adopt a complete streets policy that seeks to reasonably accommodate convenient access and mobility for all users of the public highways…including pedestrians, bicyclists, transit users, motorists, and persons of all ages and abilities.”
— Hawaii: Act 054
Source: National Complete Streets Coalition, www.completestreets.org/webdocs/policy/cs-state-policies.pdf
The Future of Smart Growth: Improving the Quality of Life for All Generations“Smart growth” is defined as development patterns that create attractive, distinctive, walkable communities that give people of varying age, income levels, and physical ability a range of safe, affordable, and convenient choices in where they live and how they get around.
According to the U.S. Environmental Protection Agency, “communities across the country are using creative strategies to develop in ways that preserve natural lands and critical environmental areas, protect water and air quality, and reuse already-developed land. They conserve resources by reinvesting in existing infrastructure and reclaiming historic buildings. By designing neighborhoods that have shops, offices, schools, churches, parks, and other amenities near homes, communities are giving their residents and visitors the option of walking, bicycling, taking public transportation, or driving as they go about their business. A range of different types of homes makes it possible for senior citizens to stay in their homes as they age, young people to afford their first home, and families at all stages in between to find a safe, attractive home they can afford. Through smart growth approaches that enhance neighborhoods and involve local residents in development decisions, these communities are creating vibrant places to live, work, and play. The high quality of life in these communities makes them economically competitive, creates business opportunities, and improves the local tax base.”16
Looking Ahead: A Framework for Mobility to Support Older AdultsThe role of states and their partners in promoting community approaches to mobility to support older adults is to help people in different disciplines work together to advance action and research. The National Association of Chronic Disease Directors, the Healthy Aging Research Network (HAN), and CDC’s Healthy Aging Program are working together to develop an agenda to promote mobility among older adults who live in the community. This project will allow partners to compare the views of a broad group of stakeholders, including content experts, practitioners, and decision makers across the nation. The resulting framework will identify priority strategic actions, and provide useful information for policy makers, funders, community planners, organizations vested in the well-being of older adults and healthy communities, and researchers who work on mobility.

PAGE 44 The State of Aging and Health in America 2013
The foundation for this project comes from the work of the HAN on environmental changes including an audit tool and protocol for assessing the walkability of streets and communities.
The HAN created an Environmental and Policy Change (EPC) Clearinghouse to help states work on collaborative projects. The resources in the clearinghouse were chosen for their relevance and usefulness to people working in the fields of aging and disability services, public health, planning, architecture, engineering, recreation, transportation, and health care.
The EPC Clearinghouse provides resources, tools, and strategies that support local efforts in environmental and policy change for healthy aging. Examples include tool kits, best practices, case studies, and process steps for engaging other stakeholders. Other resources include guidelines for working with decision makers at various levels of government and environmental and policy change information specific to older adults in the areas of walkability, livable communities, transportation, older pedestrians and drivers, access to healthy foods, universal design, and rural community issues. As of Spring 2013, the EPC clearinghouse resources have been integrated into the AARP Livable Communities Web site (www.aarp.org/livable), which highlights resources for community leaders to learn, plan, and act to create livable communities for all ages.
As the public health sector continues to collaborate with aging services to improve physical activity options at the individual level, we must look ahead to the following areas of mobility research and interventions:
�� Bringing together stakeholders in communities to ensure joint planning and collaborations that focus on environmental changes to support livable communities for all ages.
�� Addressing beliefs, motivations, and perceptions about mobility among individuals and families to help them overcome self-restricted mobility limitations or to effectively cope with the circumstances related to mobility restriction.
�� Modifying the environment through policy change to make the most of the available mobility options.
�� Providing appropriate assistive devices to enhance mobility inside and outside the home.17
A public health emphasis on aging, mobility, and quality of life is essential to improving people’s health across their lifespan.
Related ResourcesOlder Adults and Driving www.cdc.gov/Features/OlderDrivers
Complete Streets www.completestreets.org
Smart Growth www.smartgrowth.org
CDC-HAN Environmental Audit Tool www.prc-han.org/docs/HAN-audit-tool-protocol-090309.pdf
Environmental Policy Change Clearinghouse http://depts.washington.edu/hansite/drupal

The State of Aging and Health in America 2013 PAGE 45
1. Satariano WA, Guralnik JM, Jackson RJ, Marottoli RA, Phelan EA, Prohaska TR. Mobioity and aging: new directions for public health action. Am J Public Health. 2012;102(8):1508-1515.
2. Branch LG, Meng H, Guralnik JM. Disability and functional status. In: Prohaska T, Anderson LA, Binstock R, eds. Public Health for an Aging Society. Baltimore, MD: Johns Hopkins University Press; 2012.
3. Hoehner CM, Brennan Ramirex LK, Elliott MB, Handy SL, Brownson RC. Perceived and objective environmental measures and physical activity among urban adults. Am J Prev Med. 2005;28:105-116.
4. Wilcox S, Castro C, King AC, Houseman R, Brownson RC. Determinants of leisure-time physical activity in rural older and ethnically diverse women in the United States. J Epidemiol Communit Health. 2000;54:667-672.
5. Khan LK, Sobush K, Keener D, et al. Recommended community strategies and measurements to prevent obesity in the United States. MMWR Morb Mortal Wkly Rep. 2009;58:1-26.
6. Frieden TR. A framework for public health action: the health impact pyramid. Am J Public Health. 2010;100:590-595.
7. Glass TA, Balfour JL. Neighborhoods, aging, and functional limitations. In: Kawachi I, Berkman LF, eds. Neighborhoods and Health. New York, NY: Oxford University Press; 2003:303-334.
8. Hunter RH, Sykes K, Lowman SG, Duncan R, Satariano WA, Belza B. Environmental and policy change to support healthy aging. J Aging Soc Policy. 2011;23:(4):354-371.
9. Atlanta Regional Commission. Older Adults in the Atlanta Region: Preference, Practices and Potential of the 55+ Population. Atlanta, GA: Atlanta Regional Commission; 2007.
10. Foley DJ, Heimovitz HK, Guralnik J, Brock D. Driving life expectancy of persons aged 70 years and older in the United States. Am J Prev Med. 2002;92(8):1284-1289.
11. Groessl EJ, Kaplan RM, Rejeski WJ, et al. Health-related quality of life in older adults at risk for disability. Am J Prev Med. 2007;33(3):214-218.
12. US Department of Transportation, Federal Highway Administration. Highway statistics 2009. US Department of Transportation Web site. http://www.fhwa.dot.gov/policyinformation/statistics/2009/dl22.cfm.
13. US Department of Transportation, Federal Highway Administration. Traffic safety facts 2008. US Department of Transportation Web site. http://www-nrd.nhtsa.dot.gov/Pubs/811161.pdf.
14. Owsley C. Driver Capabilities in Transportation in an Aging Society: A Decade of Experience. Technical Papers and Reports from a Conference: Bethesda, MD; Nov. 7–9, 1999. Washington, DC: Transportation Research Board; 2004.
15. Smart Growth America. National Complete Streets Coalition. Policy elements. Smart Growth America Web site. http://www.smartgrowthamerica.org/complete-streets/changing-policy/policy-elements.
16. US Environmental Protection Agency. About smart growth. US Environmental Protection Agency Web site. http://www.epa.gov/smartgrowth/about_sg.htm#principles.
17. Prohaska TR, Anderson LA, Hooker SP, Hughes SL, Belza B. Mobility and aging: transference to transportation. J Aging Res. 2011. Epub 2011 Aug 15.
References


The State of Aging and Health in America 2013 PAGE 47
Appendix
Healthy People 2020 ObjectivesHealthy People 2020 is a set of 10-year national objectives for improving the health of all Americans. For the past 30 years, Healthy People 2020 objectives have been implemented to measure the impact of prevention activities, encourage collaborations across communities and sectors, and empower individuals to make informed health decisions. These objectives set specific targets to help guide states, communities, and professional organizations to identify, develop, and evaluate programs and policies that promote healthy aging. Healthy People 2020 objectives and targets were developed in consultation with a wide range of experts on the basis of the best available and most current scientific knowledge.
In this report, several of the indicators used to assess the health of adults aged 65 years or older are based on Healthy People 2020 targets. Some of these targets (i.e., no leisure-time physical activity, obesity, current smoking, taking medication for high blood pressure, mammogram within past 2 years, and colorectal cancer screening) are for age groups beyond just 65 years or older. For these targets, this report focuses on whether the older adult population met the general target. The Behavioral Risk Factor Surveillance System is not the official tracker for most Healthy People 2020 targets, but it provides state-level data that are the basis for this report.
Table 6. Report Indicators and Associated Healthy People 2020 Targets
Indicator Healthy People 2020 TargetHealth Status1. Physically unhealthy days No target specified.2. Frequent mental distress No target specified.3. Oral health: tooth retention (%) No target specified.4. Disability (%) No target specified.
Health Behaviors5. No leisure-time physical activity No more than 32.6% of adults aged 18 or older with no leisure-time physical activity.
6. Eating fruits and vegetables daily:
Eating ≥2 fruits daily (%) Eating ≥3 vegetables daily (%)
Healthy People 2020 tracks the overall increase in fruit and vegetable consumption, rather than separating it into two components.
7. Obesity (%) No more than 30.6% of adults aged 20 or older who are obese.8. Current smoking (%) No more than 12% of adults aged 18 or older who smoke.9. Taking medication for high blood pressure At least 77.4% of adults aged 18 or older with high blood pressure/hypertension
taking the prescribed medications to lower their blood pressure.
Preventive Care and Screening10. Flu vaccine in past year (%) At least 90% of adults aged 65 or older who had a flu shot within the past year.
11. Ever had pneumonia vaccine (%) At least 90% of adults aged 65 or older who had ever received a pneumonia vaccine.
12. Mammogram within past 2 years (%) At least 81.1% of women aged 50–74 have had a mammogram in the past 2 years.
13. Colorectal cancer screening (%) At least 70.5% of adults will receive a colorectal cancer screening based on the most recent guidelines.
14. Up-to-date on select preventive services (%)
Men
Women
At least 50.9% of men and 52.7% of women aged 65 years or older are up-to-date on a core set of clinical preventive services. For men, 3 services are included (flu vaccine in past year, ever had pnemonia vaccine, and colorectal cancer screening. For women, these same services are included, plus a mammogram within past 2 years.
Injuries15. Fall with injury within past year (%) No target specified.
Source: U.S. Department of Health and Human Services, www.healthypeople.gov.

PAGE 48 The State of Aging and Health in America 2013
Healthy People 2020 Older Adult Objectives
To better understand the determinants of healthy aging in various populations and settings, specific Healthy People 2020 measures related to older adults were defined, with the overall goal of improving their health, function and quality of life. Table 7 shows these measures.
Table 7. Healthy People 2020 Older Adult Objectives
Objective No.
Objective
OA-1 Increase the proportion of older adults who use the Welcome to Medicare benefit.
OA-2 Increase the proportion of older adults who are up-to-date on a core set of clinical preventive services.
OA-3 Increase the proportion of older adults with one or more chronic health conditions, and report confidence in managing their conditions.
OA-4 Increase the proportion of older adults who receive Diabetes Self-Management Benefits.
OA-5 Reduce the proportion of older adults who have moderate to severe functional limitations.
OA-6 Increase the proportion of older adults with reduced physical or cognitive function who engage in moderate or vigorous leisure-time physical activities.
OA-7 Increase the proportion of the health care workforce with geriatric certification.
OA-8 Reduce the proportion of noninstitutionalized older adults with disabilities with unmet need for long-term servicesand supports.
OA-9 Reduce the proportion of unpaid caregivers of older adults who report an unmet need for caregiver support services.
OA-10 Reduce the rate of pressure ulcer-related hospitalizations among older adults.
OA-11 Reduce the rate of emergency department visits caused by falls among older adults.
OA-12 Increase the number of states, the District of Columbia, and tribes that collect and make publicaly available information on the characteristics of victims, perpetrators, and cases of elder abuse, neglect, and exploitation.
Indicator Selection The indicators for The State of Aging and Health in America 2013 were modified and updated from previous versions of the report to reflect current public health priorities and available data. Two new indicators are included in the 2013 edition of the report: taking medication for high blood pressure, which replaces cholesterol checked within past 5 years, and fall with injury within the past year, which replaces hip fracture hospitalizations. All indicators were selected on the basis of their relative importance to older adult health, the availability of data for at least 35 states, and the ability to take action on the particular indicator.

The State of Aging and Health in America 2013 PAGE 49
Data Source
Behavioral Risk Factor Surveillance SystemThis report features data on key indicators of health and well-being for U.S. adults aged 65 years or older. These data are from CDC’s Behavioral Risk Factor Surveillance System (BRFSS). For more than 2 decades, BRFSS has helped states survey U.S. adults regarding a wide range of personal behaviors that affect their health. The BRFSS focuses primarily on physical activity, nutrition, tobacco use, and use of proven preventive services (such as cancer screenings), all of which can affect the rates of the nation’s leading health-related causes of death. BRFSS survey questions assess how many people engage in these and other health and risk behaviors, whether these behaviors are increasing over time, and which populations might be most at risk. The crucial information gathered through this state-based telephone survey system is used by national, state, and local public health agencies to monitor the need for and the effectiveness of various public health interventions.
Although the BRFSS is one of our most useful tools for assessing the health of the older adult population, it has a few limitations. First, it excludes people who do not have telephones or who live in institutions, such as nursing homes. Second, it may underrepresent people who are severely impaired because they lack the functional capacity required to participate in the survey. Third, all responses to the BRFSS are self-reported and, therefore, have not been confirmed by a health care provider.
Because BRFSS data are collected at the state level, the national data estimates provided in Table 1 are actually the mean data for the 50 states and the District of Columbia. The BRFSS is administered and supported by the CDC. For more information, visit www.cdc.gov/brfss.
PAGE 50 The State of Aging and Health in America 2013
Notes
_________________________________________________________________________________________________
_________________________________________________________________________________________________
_________________________________________________________________________________________________
_________________________________________________________________________________________________
_________________________________________________________________________________________________
_________________________________________________________________________________________________
_________________________________________________________________________________________________
_________________________________________________________________________________________________
_________________________________________________________________________________________________
_________________________________________________________________________________________________
_________________________________________________________________________________________________
_________________________________________________________________________________________________
_________________________________________________________________________________________________
_________________________________________________________________________________________________
_________________________________________________________________________________________________
_________________________________________________________________________________________________
_________________________________________________________________________________________________
_________________________________________________________________________________________________
_________________________________________________________________________________________________
_________________________________________________________________________________________________
_________________________________________________________________________________________________
_________________________________________________________________________________________________
_________________________________________________________________________________________________
_________________________________________________________________________________________________
_________________________________________________________________________________________________
_________________________________________________________________________________________________
_________________________________________________________________________________________________
_________________________________________________________________________________________________
_________________________________________________________________________________________________
_________________________________________________________________________________________________

Acknowledgements Contributors
Serena Weisner, MSAtlanta Regional Commission, Area Agency on Aging
Mary BlumbergAtlanta Regional Commission, Area Agency on Aging
Debra C. Nichols, MD, MPHU.S. Department of Health and Human Services
Centers for Disease Control and Prevention
Lynda A. Anderson, PhD
Angela Deokar, MPH
Carla Doan, MS
Andree Harris
Rosemarie Kobau, MPH, MAPP
Kristina Theis, MPH
Ann Dellinger, PhD
Pete Menzies, MA
Editorial and Graphic Support
Michael Weeks, MAPWCenters for Disease Control and Prevention
Peggy DanaCenters for Disease Control and Prevention
Advisory Board Members
William BensonHealth Benefits, ABCs
Cathie Berger, LCSWAtlanta Regional Commission, Area Agency on Aging
Eileen R. Daley, RN, MPHBlack Hawk County Health Department
Turner Goins, PhDOregon State University
Mary Leary, PhDEaster Seals Project ACTION
Carol McPhillips-Tangum, MPHNational Association of Chronic Disease Directors
Amy Slonim, PhDCDC-AARP Liaison
Pamela Van Zyl York, MPH, PhDMinnesota State Department of Health
Project Codirectors/Principal Writers
Jessica Gill, MPHCenters for Disease Control and Prevention
Maggie Moore, MPHCenters for Disease Control and Prevention
Consultant
Mary Adams, MS, MPHOn Target Health Data, LLC
