agrarian reforms in west bengal since 1977 -...
TRANSCRIPT

Agrarian Reforms in West Bengal since 1977: A Closer Look at Actual Facts
Anirban Dasgupta
Department of Economics
University of California, Riverside

1. Introduction
The case of agrarian reform in West Bengal has been discussed frequently in the
development literature (see Bardhan and Mookherjee 2002; Banerjee, Gertler and Ghatak
2002; Gazder and Sengupta 1997; Lieten 1996; Bose, Harris-White and Palmer-Jones
1999 among others). The novelty of a communist party led democratically elected
government implementing a program of land redistribution and tenancy reform and at the
same time holding on to power for an uninterrupted twenty eight years, does make an
interesting case study for development economists.
Most of the scholarly work on the reforms in West Bengal has dealt with their longer
run consequences. The possible effects of the reforms on agricultural productivity,
poverty reduction and social empowerment have been some of the issues discussed in all
the papers mentioned above. The present paper, however, has a different objective. It
tries to tease out from the scarce available data the extent to which the different aspects of
the reforms were successful in fulfilling their immediate goals1. It is important at the
outset to distinguish our objective as a limited one of understanding “What exactly
happened by way of reforms in West Bengal?” rather than the broader goal of asking
“What have been the long term consequences of agrarian reform in West Bengal?”(which
most of the writings on this subject have engaged in). We believe that our question is an
important one that needs to be answered in order to discuss the reform experience in
West Bengal in a meaningful way. Towards this end the rest of the paper is arranged in
the following way: Section 2 after this introduction presents a brief economic profile of
West Bengal and follows it up with a short description of agrarian reforms undertaken by
the Communist Party led Left Front Government in terms of its two major aspects,
tenancy reforms and land redistribution. Section 3 probes deeper into the tenancy reform
1 Data on the direct impact of the agrarian reform programs are rare. This is especially true given the limited coverage of the reforms (which makes aggregative figures for the state unreliable for studying the impact of reforms) and almost no comprehensive survey of the targeted population. The only state wide study on the direct beneficiaries of the reforms by Chakraborti (2003) is discussed in this paper.
1

programs and examines the effectiveness of the major provisions of the same. Section 4
examines the land redistribution or land reforms on the basis of changes in the
distribution of land over the period of the reforms. Section 5 provides a conclusion.
2. Agrarian Reforms and their Coverage
West Bengal is a state in eastern India with a population of about 80 million, of whom
27 percent (according to the 1999-2000 figures) are in poverty. The per capita income in
West Bengal is slightly less than the overall Indian average and was $2061 in 2001.The
state is still heavily dependent on agriculture. In 2001, 44 percent of the labor force was
engaged in agriculture, which accounted for 23 percent of state domestic product.
Agrarian reforms in rural West Bengal began in a big way2 with the inception of the Left
Front Government (LFG henceforth) led by the Communist Party of India (Marxist) in
1977. The reforms in West Bengal consisted of a limited program of redistributing
ceiling3 surplus land among rural landless/land poor households as well as a program of
tenurial reforms christened Operation Barga (OB), which through the process of official
registration of the sharecroppers or Bargadars sought to guarantee security of tenure and
a higher share of the produce for them. Additionally there was also a provision to enable
the sharecroppers to use their cultivated land as collateral to get credit from institutional
sources4.
According to the latest official data available (till September, 2003), 439,585 hectares
of land has been redistributed and 452,370 hectares of land has been recorded under the 2 Land reforms in the form of confiscation of ceiling surplus land and their redistribution has a history going back to previous governments in West Bengal. Especially important is the United Front Government between 1967 and 1969. Interestingly the CPI (M) was a member of this coalition government. 3 The current land ceiling in West Bengal is 5 hectares of irrigated land and 7 hectares of unirrigated land (see Bhaumik, 1993) 4 In this paper we will not discuss the effectiveness of institutional credit provision mainly due to the lack of adequate data. However, several accounts of the reforms (see Bandyopadhyay, 2003; Chakrabarti, 2003; Mishra and Rawal, 2002) talk about the gross inadequacy of institutional credit in agriculture for the entire period of the LFG regime.
2

OB program. They amount to respectively 8.21 percent and 8.45 percent of the net sown
area of the state under the two main planks of the agrarian reform program. The total
coverage in terms of area is a significant but modest 16.66 percent. In terms of the
number of beneficiaries, in the same time period, 21.16 percent of the agricultural
population(cultivators and agricultural laborers) in 2001 had received land due to the land
redistribution program while 11.68 percent have registered themselves as Bargadars as
part of the OB. Thus together a substantial 32.84 percent of the agricultural population
has been beneficiaries of the reform programs in the state (for district level figures on the
coverage of reforms see Appendix 1).
However there is an element of upward bias in the above figures considering that much
of the land redistributed in West Bengal precedes the Left Front government which came
in to power in 1977. Looking at Table 1 below, we can clearly see that the majority of the
land distributed so far (roughly 58 percent) was done before1977. Thus if we are
concerned with the Left Font instituted reforms, as we are here, merely 3.5 percent of the
net sown area have been redistributed and 13.6 percent of the agricultural population
have benefited from it. If we add this to the extent of tenancy reforms in the form of
Operation Barga we have a total coverage of about 12 percent of the net sown area and
25.3 percent of the agricultural population.
Table 1: Implementation of Land Ceiling Laws in West Bengal
Up to 1977
Between 1977 &
1983
Between 1983 &
1991
Between 1991 &
2003
Between 1977 &
2003
Up to 2003
No. of Beneficiary Households 984,032 472,443 537,141 750,799 1,760,383 2,744,415 Cropped Area Redistributed
(in Hectares) 253,556 56,849 59,380 69,800 186,029 439,585
Land Redistributed/Beneficiary (in Hectares) 0.26 0.12 0.11 0.09 0.11 0.16 Source: Calculated using Gazder and Sengupta (1997) and Economic Review, 2003-04.Govt. of West Bengal
3

In fact, to be precise, we need to make some adjustments to the Operation Barga figures
as well. As it is evident from official documents, the figures for the number of bargadars
recorded under the Operation Barga include sharecroppers registered under the provisions
of the West Bengal Land Reforms Act prior to the Left Front Government5. Though it is
hard to get any definite estimate of the number of sharecroppers recorded before OB,
combining several government documents we have estimated the number to be around
3,50,000 (see Table 2). This brings down the percentage of agricultural population
strictly covered by OB to about 9 and when added to the 13.6% land redistribution
beneficiaries we have a much lower estimate of 22.6% of the agricultural population who
have been directly affected by the reform measures of the Left Front. However, for all the
detailed figures we have presented here, it must be admitted that the benefits that tenancy
laws provided for registered sharecroppers in terms of security of tenure or higher crop
share were not likely to be realized before the Left Front assumed power and the OB
program was seriously initiated.
Table 2: Extent of Recording Sharecroppers in West Bengal
Time period Pre-Operation Barga
Operation Barga Sept 1978-Sept
2003
Total Up to September 2003
No. of Bargadars
Recorded 349,845 1,164,612 1,514,457
Source: Calculated using Bandyopadhyay (1980) and Table 5.1 in Chakraborti (2003)
3. Effect of Tenancy Reforms
Operation Barga (OB) is often referred to as a very successful program of tenurial
reforms in West Bengal (see Gazdar and Sengupta, 1997). Though some papers (for
5 It has been pointed out by several authors (for example, Bandyopadhyay (1980) and Bhaumik (1993)) that the tenurial reforms of the Left Front do not entail any new legislation but involves the first serious implementation of some of the existing legal provisions.
4

example Banerjee, Gertler and Ghatak, 2002) study the possible long term effect of the
OB on productivity, there is very little on the effectiveness of these reforms in meeting
their immediate objectives of providing security of tenure and higher crop share to the
Bargadars. One of the major constraints in the way of such a study is the scarcity of data
about the beneficiaries of OB. Until recently most of the papers would present case
studies covering specific areas of West Bengal and it was difficult to obtain a robust
result for the entire state even when the results of the case studies were combined. Very
recently the State Institute of Panchayats and Rural Development in West Bengal has
come out with a comprehensive study (Chakraborti, 2003) about the beneficiaries of
agrarian reforms. This study which was carried out in 2000, has a state wide
representative coverage like other aggregate government surveys but focuses specifically
on the part of the rural population who were direct beneficiaries of the land redistribution
program (Pattadars) and the OB (Bargadars). We will be using this study to discuss the
direct effect of the OB here and as a rough benchmark of the pre-reform situation of the
tenants we will be referring to Bardhan and Rudra (1983) which is also a reasonably
comprehensive study of the tenancy contracts (among other aspects of the agrarian
economy) in rural West Bengal that was undertaken in 1976. To supplement the above,
we will also use other case studies which look at the effectiveness of OB for a smaller
sample of villages in specific regions of West Bengal.
3.1 Security of Tenure
The first aspect that we will discuss is that of security of tenure. The threat of eviction
has historically been used by landlords against their tenants and one of the primary
objectives of OB was to provide tenants who were recorded with the government, with
security of tenure. There is no data available in the pre-reform period (up to 1977) which
relate directly with security of tenure. Bardhan and Rudra (1983) report from their field
survey in 1976 that 76 percent of the tenancy contracts had duration of one year and the
remaining 24 percent were valid for less than a year i.e. none of the tenancy contacts that
5

they came across were valid for more than a year. Thus, on paper, long term security of
tenure was absent in West Bengal. This is however not to deny the possibility of informal
understanding among the landlords and tenants whereby the same tenants were expected
to cultivate the same plot of land on a long term basis. But it must be accepted at the
same time that these informal understandings to the extent they prevailed in rural West
Bengal, did not entail any right for the tenant on the land that he tilled and he was entirely
dependent on the landlord to provide him with the land every year. OB sought to change
this situation by conferring legal rights of cultivation on the tenant. In the report prepared
by Chakraborti (2003) the issue of security of tenure has been evaluated in two ways.
First, we have a distribution of Bargadars according to their possession of the barga
land that they registered. On the state level, 85.6 percent of the Bargadars have held on to
their barga land while the remaining 14.4 percent have lost possession of the land due to
different reasons. The level of dispossession differs sharply across districts with more
than 30 percent of the Bargadars loosing possession of their land in Cooch Behar, South
Dinajpur, North Dinajpur and Jalpaiguri (all of which are agriculturally backward
districts in North Bengal). The incidence of dispossession is significantly less in Malda,
Purulia, Nadia and West Midnapore with the proportion of dispossessed Bargadars being
less than 10 percent. Interestingly, the majority of Bargadars who have lost their land
after registration have not been evicted from their land. In fact, only 24.1 percent of
dispossessed Bargadars (i.e. about 3.5 percent of the total Bargadars) have reported
eviction as the reason for losing their land. The incidence of eviction is considerably
above the state average in the erstwhile district of Midnapore (currently divided into East
and West Midnapore) and North Dinajpur. For 66 percent of the dispossessed Bargadars
the study has not reported any specific reason for dispossession but clubbed together all
of them under the ambiguous category of “Others”. Although a few of the possible
reasons figuring under this category (like surrender of Barga rights, natural causes like
diluvium as well as forcible dispossession by anyone other than the landlord) have been
mentioned in the report, there is no detail on the possible importance of each .
6

The report has also tried a second way of looking at security of tenure and that is by
examining the Bargadars’ own perception. About 74 percent of the Bargadars reported a
sense of security about their tenancy rights while the other 26 percent didn’t share this
sense of security. It is curious that although 85.6 percent of the Bargadars have held on to
their registered land by the time of the survey in 2000, only 74 percent actually felt
secure about their tenancy rights. Although individual perception may not always be
based on objective reality, a significant 10-12 percent difference that we encounter here
between the actual reality and the perceived sense of security may underscore a situation
where there is a real threat of losing their tenanted land on part of some of the Bargadars.
Also noticeable in the figures on perceived security, is the alarmingly high proportion of
Bargadars in some districts, who feel insecure about their rights as tenants. These districts
are Darjeeling (47 percent), Hoogly (48 percent), Jalpaiguri (47 percent) and North
Dinajpur (48 percent).
3.2 Changes in Crop Sharing Arrangements
Ensuring a higher share of produce for the sharecropper has been one of the important
provisions of the OB program. If implemented effectively, it is also the most directly
redistributive element of the program as it seeks to provide a higher percentage of the
crop to the tenant thereby reducing the proportion available to the landowner. According
to the West Bengal Land Reform Act (amended) which was the legal backbone of the
OB, Bargadars were entitled to 75 percent of the produced crop except in cases when the
landlord was providing all non-labor inputs. In such cases the tenant’s share was reduced
to 50 percent of the produce (Chakrabarti, 2003). It is clear from the legal provisions that
crop sharing is intricately linked with the arrangements regarding cost sharing in
production. Historically, cost sharing was a rare phenomenon in West Bengal with
tenants providing all the inputs in traditional agriculture. However since the 1970s, with
the advent of the so called “Green Revolution” technology, there emerged cost sharing
arrangements between the share cropper and the landlord regarding the “new” inputs like
7
HYV seeds, chemical fertilizers and pesticides (Rudra, 1981a, 1981b). Thus in 1976, we
see that 2/3(66.7 percent) of the tenancy contracts in rural West Bengal involve some
kind of cost sharing among the tenants and the landlords (Bardhan and Rudra, 1983). One
of the central criticisms against OB put forward by some economists (e.g.Rudra,
1981a,1981b) relate to the possible termination of the cost sharing arrangements in the
face of the legal stipulation of crop sharing that was part of OB. According to Rudra,
Bargadars may be worse off if crop sharing is absent, even if they receive the mandated
75 percent of the produce. This is because, financing the expensive inputs without the
landlord’s help may be impossible for the poor Bargadar which in turn can adversely
affect the productivity in his land and reduce his net income even with a higher
percentage of the total produce. In fact, it is easy to construct theoretical possibilities
whereby Bargadars may be worse off with a higher crop share in the absence of cost
sharing arrangements simply because the gain in terms of higher share is outweighed by
the loss in terms of higher input costs that he now has to bear alone. Thus to evaluate the
effectiveness of OB in terms of crop sharing we must look at cost sharing figures along
with the actual crop sharing data to ascertain if anything definite can be said about the
well being of the Bargadars.
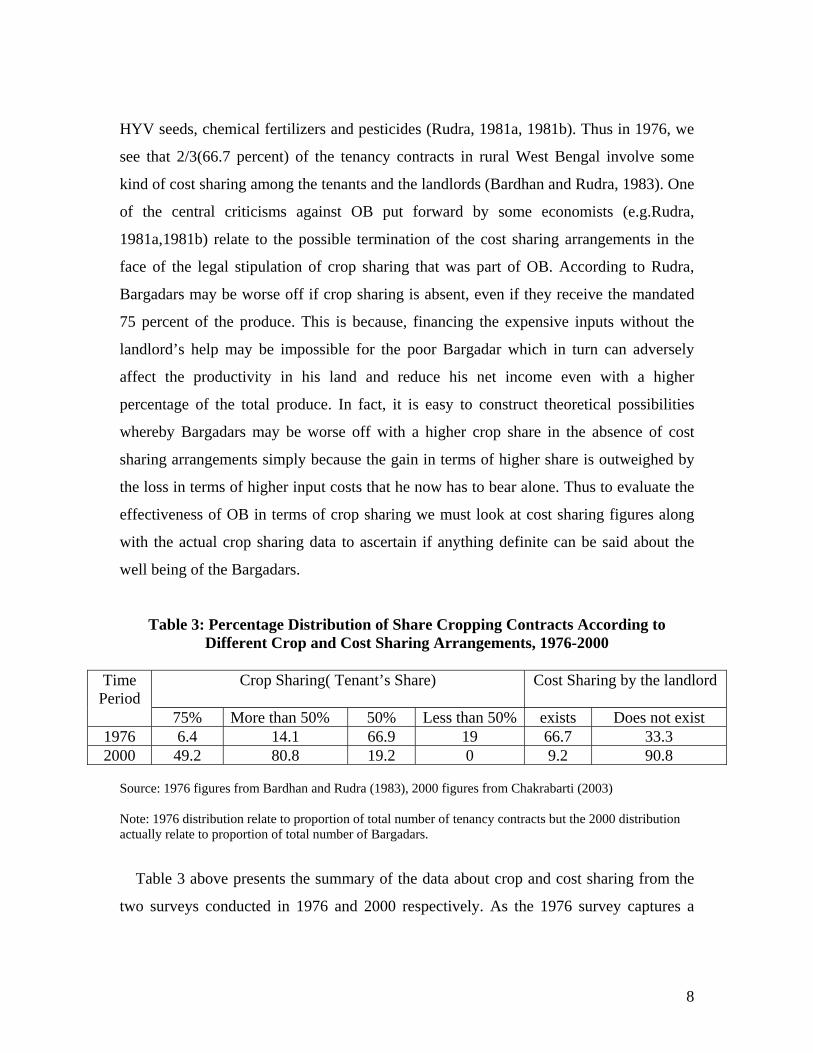
Table 3: Percentage Distribution of Share Cropping Contracts According to Different Crop and Cost Sharing Arrangements, 1976-2000
Crop Sharing( Tenant’s Share) Cost Sharing by the landlord
Time
Period 75% More than 50% 50% Less than 50% exists Does not exist
1976 6.4 14.1 66.9 19 66.7 33.3 2000 49.2 80.8 19.2 0 9.2 90.8
Source: 1976 figures from Bardhan and Rudra (1983), 2000 figures from Chakrabarti (2003)
Note: 1976 distribution relate to proportion of total number of tenancy contracts but the 2000 distribution actually relate to proportion of total number of Bargadars.
Table 3 above presents the summary of the data about crop and cost sharing from the
two surveys conducted in 1976 and 2000 respectively. As the 1976 survey captures a
8
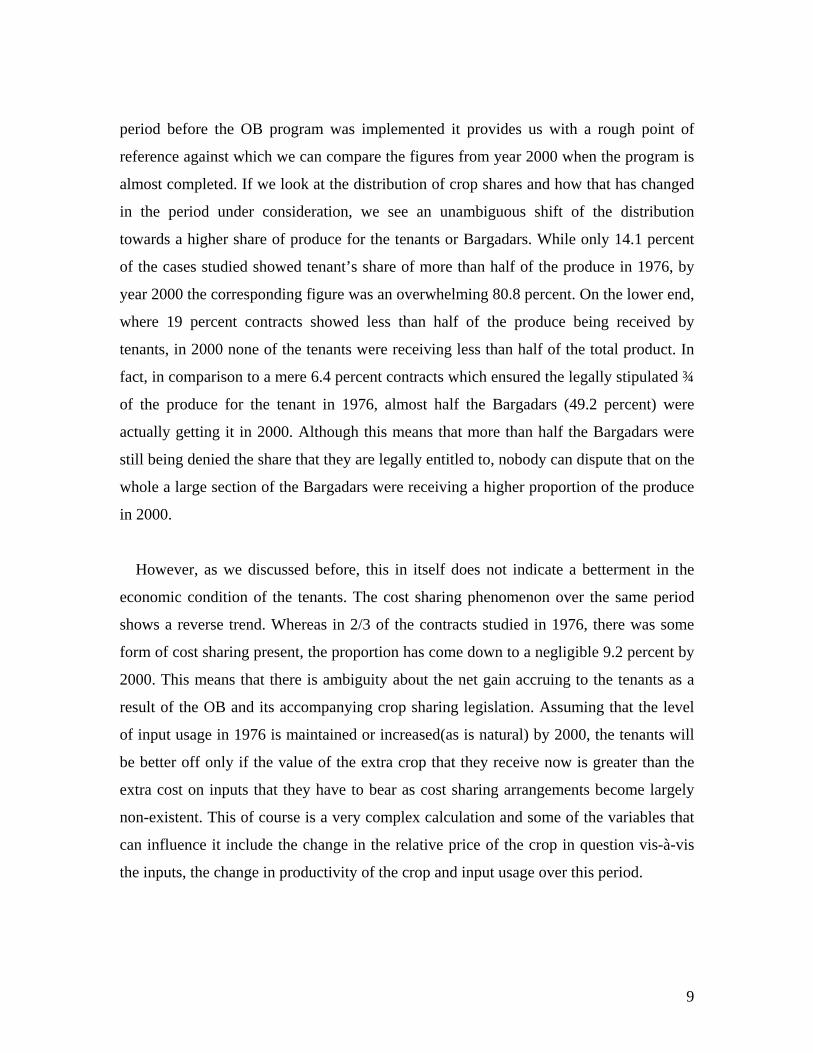
period before the OB program was implemented it provides us with a rough point of
reference against which we can compare the figures from year 2000 when the program is
almost completed. If we look at the distribution of crop shares and how that has changed
in the period under consideration, we see an unambiguous shift of the distribution
towards a higher share of produce for the tenants or Bargadars. While only 14.1 percent
of the cases studied showed tenant’s share of more than half of the produce in 1976, by
year 2000 the corresponding figure was an overwhelming 80.8 percent. On the lower end,
where 19 percent contracts showed less than half of the produce being received by
tenants, in 2000 none of the tenants were receiving less than half of the total product. In
fact, in comparison to a mere 6.4 percent contracts which ensured the legally stipulated ¾
of the produce for the tenant in 1976, almost half the Bargadars (49.2 percent) were
actually getting it in 2000. Although this means that more than half the Bargadars were
still being denied the share that they are legally entitled to, nobody can dispute that on the
whole a large section of the Bargadars were receiving a higher proportion of the produce
in 2000.
However, as we discussed before, this in itself does not indicate a betterment in the
economic condition of the tenants. The cost sharing phenomenon over the same period
shows a reverse trend. Whereas in 2/3 of the contracts studied in 1976, there was some
form of cost sharing present, the proportion has come down to a negligible 9.2 percent by
2000. This means that there is ambiguity about the net gain accruing to the tenants as a
result of the OB and its accompanying crop sharing legislation. Assuming that the level
of input usage in 1976 is maintained or increased(as is natural) by 2000, the tenants will
be better off only if the value of the extra crop that they receive now is greater than the
extra cost on inputs that they have to bear as cost sharing arrangements become largely
non-existent. This of course is a very complex calculation and some of the variables that
can influence it include the change in the relative price of the crop in question vis-à-vis
the inputs, the change in productivity of the crop and input usage over this period.
9

The earlier result is corroborated by the figures in Tables 4, 5 and 6. Table 4 refers to
the survey in 1976, tables 5 and 6 are results from case studies done in different areas of
West Bengal long after the OB legislations were enacted. We see that cost sharing has
been rare in cases where the tenant got more than 50 percent and this is true in both the
pre and post OB period. We also find that by and large, a higher proportion of tenants are
getting more than 50 percent of the total produce in the post OB years.
Table 4: Association between Crop Sharing and Cost Sharing in West Bengal, 1976
Cost Sharing Exists Cost sharing is absent Total
Tenant’s share less than 50% 98.5 0.5 99 (19)
Tenant’s Share equals 50% 69.4 30.6 100 (67)
Tenant’s share is more than 50% 10.4 89.6 100 (14)
Total 66.7 33.3 100 Source: Bardhan and Rudra (1983) Note: 1) The figures in brackets in tables 4, 5 and 6 are the percentages of the respective group of crop share in the total number of contracts. 2) The percentage figures in the first row don’t add up to 100. There is no obvious explanation for this provided in Bardhan and Rudra (1983).
Table 5: Association between Crop Sharing and Cost sharing in four Districts of South Bengal for Traditional Crop (Aman and Aus), 1993
Cost Sharing exists Cost Sharing is Absent Total
Tenant’s Share equals 50% 60.0 40.0 100
(43.5) Tenant’s Share is more than 50% 7.7 92.3 100
(56.5) Total 30.4 69.6 100
Source: Khasnobis (1994)
10

Table 6: Association between Crop Sharing and Cost sharing in Midnapore for Aman Paddy, 1986-87
Cost Sharing Exists Cost Sharing is Absent Total
Tenant’s Share equals 50% 24.2 75.8 100 (59.4)
Tenant’s Share is more than 50% 0 100 100 (40.6)
Total 14.4 85.6 100 Source: Bhaumik (1993)
Fortunately we have some sense of the value of output and the input costs over time
from the Cost of Cultivation surveys carried out by the Government of India for major
crops and for major Indian states (Government of India, 1991, 2000). Although these
surveys report results for average farms or cultivating units (and not for leased in units, as
would have been more appropriate for our purpose), we have used them to compare the
net gain of the Bargadars in two alternative scenarios: Case 1, when the tenant gets 75
percent of the total produce and pays the entire input costs and Case 2, when the tenant
gets 50 percent of the produce and the input costs are paid for entirely by the landlord.
We have included the cost of all non labor inputs listed in the surveys to calculate the
total input costs. The inputs considered are Seeds, Fertilizer, Manure, Insecticide and
Irrigation. In computing the total costs we have also included the interest on working
capital as it is likely to be a liability on the tenant in order to arrange for credit for
purchasing inputs. Also, we have constructed Case 2 as a sort of “best case scenario” for
the tenant where he does not have to share any cost if he gets 50 percent of the produce. It
is highly possible (and likely to be the case) that tenants do pay a part of the cost even
when they get to take only half of the produce for themselves. But our formulation allows
us to evaluate if Case 1, where the tenant gets 75 percent of the produce, is a better option
for the tenant even when Case 2 doesn’t involve any cost sharing. Net gain in each case is
defined simply as the difference between the share of produce received and the input
costs paid when both are expressed in value terms i.e. in Indian Rupees and calculated in
11

current prices. We have carried out the exercise for four different years starting with
1977-78, when the current LFG assumed power. We go up to 1996-97, which is the latest
year for which data are available. Lastly, the figures presented below pertain to the
cultivation of paddy which remains the most important crop in West Bengal agriculture
for the entire period under consideration.
Table 7: Net Gain of the Bargadars from Two Alternative Tenancy Contracts, 1977-78 to 1996-97
Year Net Gain in Case 1
(in Rs. per hectare) Net Gain in Case 2 (in Rs. per hectare)
Percentage difference of Case1 over Case 2
1977-78 1272.58 1057.72 20.31 1984-85 2688.37 2176.74 23.5 1991-92 5503.12 4833.3 13.86 1996-97 8819.1 7948.7 10.95
Source: Calculated from data provided in Government of India (1991, 2000)
As Table 7 shows, the contract underlying Case 1 consistently provides a higher net
gain for the Bargadar compared to Case 2. This means that given the input and output
prices as well as the productivity of paddy, a Bargadar is better off receiving 75% of the
produce even if he pays the entire cost of inputs. We must remind ourselves that the
above is true in comparison to Case 2 which provides the upper bound to the net gain of
the Bargadar in a situation of equal sharing of produce with some cost sharing (the most
commonly observed tenancy contract observed in the pre-OB period). This statement
may also be extended in the following way: to the extent that a much higher proportion of
Bargadars are receiving the stipulated 75 percent of produce in the post OB period (as we
have seen above, in 2000 almost half of the Bargadars are receiving this share compared
to only 6.4 percent in 1976), we may say that Bargadars are better off in this period.
It is interesting to note that the difference between the two contracts in terms of net
gain for the tenant has shrunk since the mid 80s. This is possibly a result of the higher
12

increases in the cost of input compared to the value of output. The ratio of the cost of
inputs to the value of output has increased from 14.84 percent in 1977-78 to 19.52
percent in 1996-97. Individually, the value of output has increased by a factor of 6.5
between 1977-78 and 1996-97 while the cost of inputs have increased 8.9 times during
the same period.
Before we finish our discussion on crop sharing, we would like to present a few
qualifications to the results in table 7. First, the statement that Bargadars are generally
better-off in the OB period does not preclude the possibility of the existence of some
Bargadars who are still receiving less than the stipulated 75 percent of the produce but
have to provide for some or all of the input costs in question. In fact in all the studies we
have referred to (Chakraborti, 2003; Bhaumik, 1993; Khasnobis, 1994), there is a
significant proportion of tenants who are not getting the stipulated share. According to
our exercise these tenants are worse off than those receiving 75 percent, even if they pay
no portion of the input costs. Our data tell us that a good proportion of these tenants who
get 50 percent of produce, do pay their entire input costs over and above higher crop
sharing burden. Though it is difficult to get a quantitative estimate of this group of
tenants, it is important to remember that they may not have gained in the OB period.
Second, from the figures we have presented above it seems that OB has been
instrumental in ensuring a better deal for the Bargadars who get the stipulated 75 percent
share of produce. If we assume (as we can, reasonably) that most of these Bargadars were
getting 50 percent of the produce (with or without any cost sharing from the landlords) in
the pre-OB period, the numbers above tell us that it would have been beneficial for the
landlords to hold on to that arrangement in the absence of any intervention (assuming that
the level of technological adoption and input prices would have been similar in the
absence of reforms) i.e. the traditional 50-50 arrangement in crop sharing would have
been retained if the tenants and the landlords were negotiating in the absence of any
external force and the landlords had their way. Therefore fact that almost half the
13
Bargadars in the state is getting 75 percent of the produce (Chakraborti, 2003) by 2000 is
entirely due to the OB legislations and its effective enforcement.
4. The Effect of Land Redistribution
As we have mentioned above, 186,029 hectares of land has been redistributed by the
LFG since 1977 to 1,760,383 beneficiaries. This amounts to roughly 3.5 percent of the
net sown area of the state distributed among 13.6 percent of the agricultural workers
(laborers and cultivators) of the state. Though it is not obvious if redistribution to this
limited extent is likely to cause any major change in the distribution of land holdings, we
examine the relevant data to check for any discernable change.
4.1 Changes in the Ownership Distribution of Land
The only source of data on ownership holdings is the National Sample Survey (NSS)
decennial surveys conducted since the early 50s. Though there have been minor changes
in the survey mechanism as well as the number of class sizes used for categorization over
the years, the data is largely comparable over time(Sharma,1995, Venkateswarlu,2003).
In this section we specifically focus on the last three rounds of household surveys (1971-
72, 1982 and 1991-92) which cover the relevant period for the LFG land redistribution
program.
Table 8 below shows the distribution of households and area owned in each class size.
We have also constructed the Lorenz curves (see below) based on the distribution of
ownership holdings. A readily observable trend in the distribution is the increasing
concentration of the households in the lower class sizes and an increase in the area held
by these households. The percentage of households owning less than 1 hectare has
increased from 77.62 in 1971-72 to 81.6 in 1982 and further to 85.88 in 1991-92. The
corresponding area held by these households also increased during this time from 27.28
14

percent in 1971-72 to 30.33 percent in 1982 and a substantially higher 41.3 percent in
1991-92. However concealed in these figures is the increasing trend of landlessness.
Going by the NSS figures, landlessness increased dramatically (by almost 80%) in the
70s and early 80s (till 1982) which includes the initial years of the LFG regime when
land redistribution was going on in full swing. In fact as we have mentioned before,
according to Government of West Bengal documents, 56,849 hectares of land was
distributed among 472,443 beneficiaries between 1977 and 1983. Going by the total
number of estimated households for 1982 in the NSS survey, this amounts to a substantial
6.1% of total households receiving land in the first six years of the LFG regime. On the
whole, the simultaneous occurrence of increasing landlessness and land redistribution are
contradictory results which are hard to reconcile.
Table 8: Percentage Distribution of Ownership Holdings in Rural West Bengal, 1971-72 to 1991-92
Year
1971-72 1982 1991-92
Class Size of Ownership Holdings
Percentage of
Households
Percentage of Area
Percentage of
Households
Percentage of Area
Percentage of
Households
Percentage of Area
Landless 9.78 - 17.21 - 10.98 - Sub-Marginal(0.01-
0.4 Htrs) 46.74 6.83 47.03 9.42 54.11 12.57
Marginal(0.4-1 Htr) 21.1 20.45 17.36 20.91 20.79 28.73 Small(1-2 Htrs) 12.65 25.68 11.5 28.77 9.48 28.11
Medium(2-4 Htrs) 9.01 39.27 6.62 36.7 4.5 28.55 Large(> 6 Htrs) 0.72 7.77 0.28 4.2 0.13 2.04
Total 100.00 100.00 100.00 100.00 100.00 100.00 Gini Ratio 0.67 0.70 0.67
Source: Sharma (1995) and NSS Report 399(1996). Gini ratios are calculated using the detailed distribution for each year.
Largely due to the increase in landlessness between 1971 and 1982, the inequality of land
distribution increased marginally between these years. This is evident from the slightly
15

higher value of the Gini ratio in 1982 in comparison to 1971 and also the corresponding
Lorenz distributions. The inequality reverted back to the original level of 1971 in the
latest survey for 1991 with a corresponding decrease in landlessness in comparison to
1982. Thus in the twenty years between 1971 and 1991 which covers the most effective
period of land reforms under the LFG, inequality in land distribution has remained the
same. This is true in spite of 116,229 hectares of land being redistributed between 1977
and 1991 among 1,009,584 beneficiary households.
Chart 1: Lorenz Curves for ownership Distribution of land in West Bengal 1971-72 to 1991-92
0
0.1
0.2
0.3
0.4
0.5
0.6
0.7
0.8
0.9
1
0 0.2 0.4 0.6 0.8 1
cummulative percentage of households
cum
mul
ativ
e pe
rcen
tage
of a
rea
owne
d
1971-7219821991-92line of equal distibution
In order to obtain a more disaggregated view of the concentration of land ownership and
its change over time, compared to the Gini Ratio, we calculate the Inter-Class
16

Concentration Ratio (ICCR) for each class size of ownership holdings. Following Chadha
(1986) we define ICCR in the following way:
ICCRi = (Proportion of total area held in class i) / (Proportion of total holdings in class i) ×100
In case of an equal distribution of land holdings across the class sizes, ICCR for each
class should be equal to 100. In case a size class owns more than its share compared to
the conditions of equal distribution, the ICCR for that class is greater than 100. The ICCR
is less than 100 when the reverse is true. We present the ICCR for the detailed ownership
distribution in West Bengal in table 9. The ownership holdings are divided into thirteen
class sizes and the ICCR values are calculated for each over three time periods 1971-72,
1982 and 1991-92.
Table 9: Inter-Class Concentration Ratio for Ownership Holdings
in Rural West Bengal 1971-72 to 1991-92
Year Class-Size(in Htrs) 1971-72 1982 1991-92
Landless - - - 0.002-0.20 6.75 9.73 11.73 0.20-0.40 45.71 52.33 64.98 0.40-0.50 62.14 79.55 95.04 0.50-1.0 107.33 134.65 156.67
1-2 203.08 250.17 296.52 2-3 341.64 439.51 521.32 3-4 486.46 632.89 720.49 4-5 637.50 813.16 942.55 5-6 788.37 993.94 1140 6-8 974.47 1218.75 1380 8-10 1240 1775 1675 10-12 1775 1842.86 -
Source: Calculated from NSS Surveys, various years.
17

It is evident that inequality has come down with respect to the lower class sizes (up to
.50 htrs) as their concentration ratios starting from less than 100 have increased over
time. However, this increase has not been as dramatic as may be expected in a situation
of comprehensive land reforms. The increase in concentration ratio has also been true for
the higher class sizes. In some of these cases, where there has been an actual decrease in
the percentage of households as well as the percentage of area held, a higher ICCR means
that the decrease in area held under the class size has been less (in percentage terms) than
the decrease in the number of households.
In order to check how the access to land has changed for an average household in each
class size we have calculated the average size of holdings per household for each class
size over time. The respective figures are presented below in table 10.
Table 10: Average Size of Ownership holding per Household (in hectares) from 1971-72 to 1991-92
Year Class-Size(in Htrs)
1971-72 1982 1991-92
0.002-0.20 0.047 0.054 0.054 0.20-0.40 0.319 0.289 0.299 0.40-0.50 0.434 0.439 0.438 0.50-1.0 0.750 0.742 0.721
1-2 1.419 1.379 1.364 2-3 2.387 2.425 2.397 3-4 3.406 3.485 3.321 4-5 4.439 4.484 4.373 5-6 5.467 5.500 5.402 6-8 6.767 6.685 6.452 8-10 8.880 9.212 8.559 10-12 10.5 10.803 -
Source: Calculated from NSS Surveys, various years.
It is of interest to look carefully at the two lowest class sizes which cover ownership
holdings smaller than 0.40 hectares and are likely to be held by the land reform
18

beneficiaries6. The average size of the smallest holdings seem to have gone up a little
(0.007 hectares) between 1971-72 and 1991-92 while it has gone down slightly in the
next higher class size over the same period. Together, there has been a marginal increase
in the average size for these two classes from 0.102 hectares in 1971-72 to 0.107 hectares
in 1991-92.
4.2 Changes in the Distribution of Operational Holdings
On the basis of our analysis of ownership holdings till now we found that there has not
been any significant equalizing effect of the land distribution program carried out by the
LFG. Since a major part of the agrarian reforms in West Bengal constituted of the
tenancy reform legislations it is instructive to look at the distribution of operational
holdings as well. Operational holdings are different from ownership holdings in that they
take into account the area leased in or leased out in addition to the area owned. Thus the
distribution of operational holdings is useful to capture the change in tenancy patterns, if
any, along with changes in ownership.
There are two major sources of information on operational holdings for West Bengal:
The five-yearly Agricultural Census published by the West Bengal government and the
decennial Survey of Landholdings done by the National Sample Survey Organization
(NSSO). In this section we will take a detailed look at the data provided by these two
agencies on the pattern of change in the distribution of operational holdings for rural
West Bengal.
Tables 11 below lays down the distribution of operational holdings from 1970-71 to
1995-96 (the latest period for which data is available) based on the Agricultural Census.
6 Land was redistributed under the provision that the total hand holding of each beneficiary had to be within 1 acre (roughly 0.40 hectares).
19

Table 11: Distribution of Operational Holdings according to Agricultural Census, 1970-71 to 1995-96
Year
1970-71 1976-77 1980-81 1985-86 1990-91 1995-96 Size Class
(in Htrs)
% of Holdings
% of Area
% of Holdings
% of Area
% of Holdings
% of Area
% of Holdings
% of Area
% of Holdings
% of Area
% of Holdings
% of Area
<1 59.97 21.5 66.5 27.25 69.69 29.16 70.97 31.27 73.83 36.5 76.42 42.93 1-2 22.33 25.7 20.55 28.54 19.55 31.21 19.09 31.07 17.62 29.95 16.81 29.06 2-4 13.23 28.9 18.36 27.09 8.84 25.26 8.39 24.5 7.28 22.45 5.83 18.73 4-10 4.38 19.2 2.55 13.25 1.9 10.71 1.53 8.61 1.26 7.52 0.92 5.66 >10 o.09 4.6 0.04 3.97 0.02 3.66 0.02 3.55 0.02 3.58 0.02 3.62 Gini Ratio
0.44 0.52
Source: Statistical Abstract of West Bengal, 2001-02. Gini ratio is calculated for the two years for which detailed distribution was available
Chart 2: Lorenz Curves for Operational Holdings in Rural West Bengal 1970-71 and 1995-96
1
0.9
0.8
0
0.1
0.2
0.3
0.4
0.5
0.6
0.7
Cum
ulat
ive
Perc
enta
ge o
f Are
a
1970-71 1995-96
0 0.1 0.2 0.3 0.4 0.5 0.6 0.7 0.8 0.9 1
Cumulative Percentage of Holdings
20
The census data gives a clear indication that the distribution of operational holdings
has become substantially more equal over the time period 1970-71 to 1995-96. The Gini
ratios and the Lorenz Curves constructed from the distribution of operational holdings
show that the degree of inequality has markedly come down between 1970-71 and 1995-
96 with the curve for 1970-71 clearly dominating that for 1995-96.
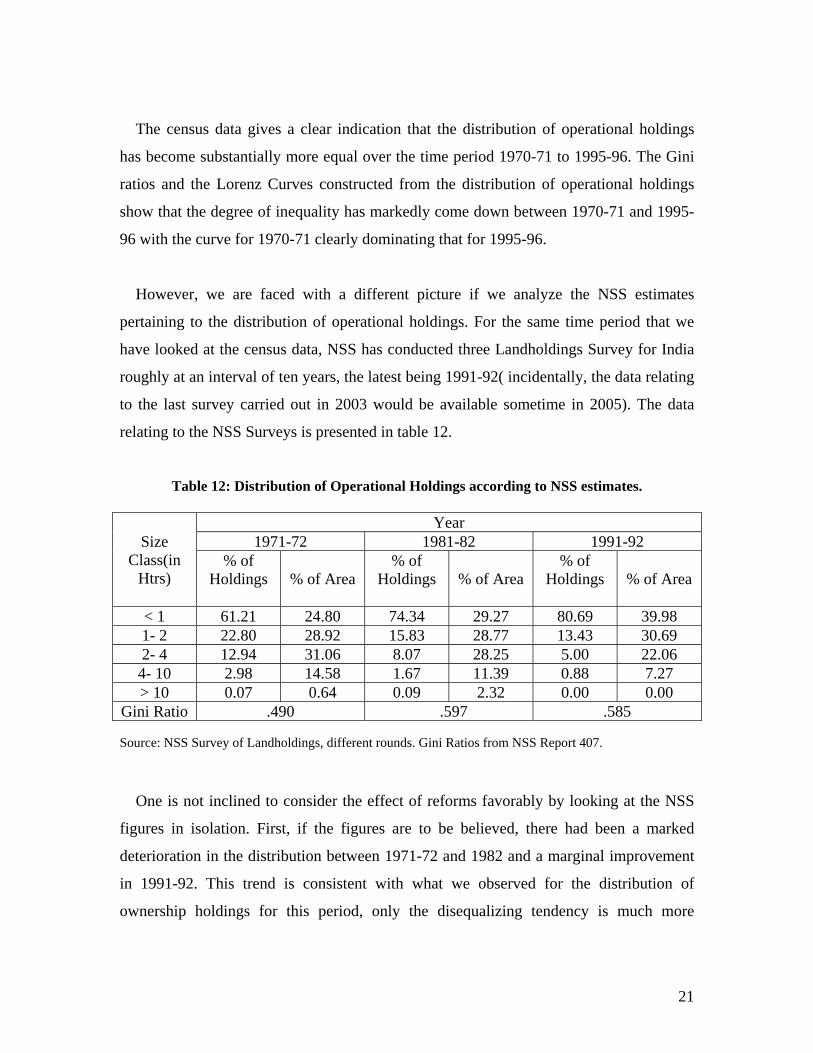
However, we are faced with a different picture if we analyze the NSS estimates
pertaining to the distribution of operational holdings. For the same time period that we
have looked at the census data, NSS has conducted three Landholdings Survey for India
roughly at an interval of ten years, the latest being 1991-92( incidentally, the data relating
to the last survey carried out in 2003 would be available sometime in 2005). The data
relating to the NSS Surveys is presented in table 12.
Table 12: Distribution of Operational Holdings according to NSS estimates.
Year 1971-72 1981-82 1991-92 Size
Class(in Htrs)
% of Holdings
% of Area
% of Holdings
% of Area
% of Holdings
% of Area
< 1 61.21 24.80 74.34 29.27 80.69 39.98 1- 2 22.80 28.92 15.83 28.77 13.43 30.69 2- 4 12.94 31.06 8.07 28.25 5.00 22.06 4- 10 2.98 14.58 1.67 11.39 0.88 7.27 > 10 0.07 0.64 0.09 2.32 0.00 0.00
Gini Ratio .490 .597 .585 Source: NSS Survey of Landholdings, different rounds. Gini Ratios from NSS Report 407.
One is not inclined to consider the effect of reforms favorably by looking at the NSS
figures in isolation. First, if the figures are to be believed, there had been a marked
deterioration in the distribution between 1971-72 and 1982 and a marginal improvement
in 1991-92. This trend is consistent with what we observed for the distribution of
ownership holdings for this period, only the disequalizing tendency is much more
21

prominent for the first period in this case with the Gini Ratio increasing from 0.490 to
0.595. Since the major difference between the two sets of distributions(ownership and
operational) can be traced back to the existence of tenancy in agriculture, we take a look
at the particulars about sharecropping which is the major form of tenancy in West
Bengal.
From the numbers in Table 13 below, it is evident that the incidence of sharecropping
has gone down drastically during the 1970s and early 80s. Curiously, this time period
includes the first four years of Operation Barga when the registration of sharecroppers
has been going on with full vigor. One of the obvious possibilities that can be conceived
of as an explanation of the situation is large scale eviction of sharecroppers at the advent
of the tenant registration program. However, there is no written record available to this
author which documents such a phenomenon of forcible eviction in the pre-reform
period. On the contrary we have reliable sources which inform that such eviction was
successfully prevented by the effective implementation of the tenancy reform programs
(Bandyopadhyay, 1980).
Table 13: Incidence of Sharecropping in rural West Bengal 1971-72 to 19991-92
Time Period % of holdings reporting share tenancy
% of area leased in under share tenancy
1971-72 30.64 17.34
1982 11.01 6.85 1991-92 8.51 4.83
Source: NSS Reports on Landholdings, various rounds.
Even though the tenancy reforms may not have been responsible for the increased
concentration in the distribution of operational holdings, it is evident form the data
presented that the tenancy reforms (which sought to affect the sharecroppers or Bargadars
positively) were being implemented in a period when the incidence of sharecropping was
falling sharply- a trend that has been maintained into the 1990s. This fact itself
22

underscores a major limitation of the OB program in spite of the impressive numbers of
Bargadars registered as part of it.
A further problem that stems from the figures on the distribution of operational
holdings is the incompatibility between the results from the two different sources. The
apparent trend towards a more equal distribution of land that is observable in the
Agricultural Census data (see Table 11) is exactly opposite to the nature of change that
becomes evident in the NSS data. However, if a choice has to be made between these two
sources of data on the basis of reliability, most researchers would vouch for the relative
accuracy of the NSS data in comparison to the Agricultural Census (see Sawant, 1990;
Sharma, 1995). This is because the Agricultural Census collects land distribution data
from existing land records which are often inaccurate and the data is compiled by the
officials of land records department who are expected to be less competent in designing
robust sampling techniques for more accurate estimation.
5. Conclusion
The major findings of this paper can be divided into two distinct sets in accordance
with the main elements of the agrarian reform program. First, with regards to the tenancy
reform measures, there is evidence that seating tenants may have benefited in the form of
higher crop shares in the post reform period. Under some specific assumptions, we have
shown that higher crop shares have translated into higher net income. However, the
record has not been perfect in ensuring security of tenure for the share croppers. Spread
across the different districts we have a significant proportion of tenants who have lost
possession of their land. The subjective perception of security by the tenants also indicate
that security of tenure have not been guaranteed universally across the state.
23

Second, the land redistribution undertaken by the LFG has been very limited in scope.
Although it involves a sizeable proportion of the population dependent on agriculture, the
amount of land redistributed has been meager. As a result the agrarian structure in rural
West Bengal has not witnessed any significant change compared to the pre-reform
period. Our analysis of ownership distribution of landholdings provides evidence that the
level of concentration in land ownership has remained almost unchanged in the one and
half decades since the resumption of land redistribution in 1977. The actual deterioration
in the distribution of operational holdings (if the NSS estimates are accepted) since the
LFG policies imply that the presence of tenancy has only managed to exacerbate the
inequality in the access to land.
In conclusion it may not be an exaggeration to claim that the potential benefits of
agrarian reforms have been largely exhausted in West Bengal by the start of the current
decade. The effect of tenancy reforms has been limited as the incidence of share cropping
is falling consistently. This proves that the provisions of the tenancy legislations and their
implementation have not been able to preserve the viability of share cropping in West
Bengal. The land redistribution program also has not been successful in creating a class
of independent peasant producers. With a very scarce supply of ceiling surplus land the
average size of land redistributed during the LFG regime is barely 0.11 hectares or about
a quarter of an acre. The fact that land reform beneficiaries have not been successful in
living off their land in the post reform period is borne out by the study done by
Chakrabarti (2003), which finds that more than 90 percent of new land recipients do not
find year long employment in their own land. The analogous figure for Bargadars is 83.5
percent. Most of these people end up joining the ranks of agricultural laborers who work
on others’ land for a wage rate7. There is no surprise thus, to find an unprecedented
increase in the number of agricultural laborers in the rural population of West Bengal. In
the 2001 census for the first time, the proportion of agricultural laborers in the rural
population outweigh that of cultivators who include independent peasants as well as long 7 Some of these cultivators may also find livelihood in the rural non farm sector. Recent figures do show a sharp increase in the level of rural non farm employment.
24

term tenants or Bargadars. This process of depeasantization is an important structural
change in the rural scene. It brings forth important questions about the future of
agriculture and the subsistence of the rural population. Unfortunately, the LFG agrarian
reforms fail to provide the answers to these questions.
References
Bandyopadhyay, D (1980):Land Reforms in West Bengal. Government of West Bengal, Calcutta. Bandyopadhyay, D (2003): Land Reforms and Agriculture: The West Bengal Experience, Economic and Political Weekly March 1. Banerjee, Abhijit, Gertler,Paul and Ghatak, Maitreesh (2002): Empowerment and Efficiency: Tenancy Reform in West Bengal, Journal of Political Economy, April 2002. Bardhan, Pranab and Rudra, Ashok (1983): Agrarian Relations in West Bengal: Result from Two Surveys. Somaiya Publications, Bombay. Bardhan, Pranab and Mookherjee, Dilip(2002): Political Economy of Land Reforms in West Bengal, 1978-98. mimeo, Boston University. Bhaumik, S.K. (1993): Tenancy Relations and Agrarian Development: A Study of West Bengal, Sage Publications, New Delhi. Bose, Sugata, Harriss-White, Barbara and Rogaly, Ben (1999): Sonar Bangla: Agricultural Growth and Agrarian Change in West Bengal and Bangladesh. Sage Publications, Delhi. Chadha, G. K.(1986): The State and Rural Economic Transformation: The Case of Punjab 1950-85. Sage Publications, New Delhi. Chakrabarti, Anil(2003): Beneficiaries of Land Reforms: The West Bengal Scenario. State Institute of Panchayats and Rural Development, Kalyani. Gazdar, Haris. and Sengupta, Sunil (1997): Agrarian Politics and Rural Development in West Bengal in Jean Dreze and Amartya Sen(ed.)Indian Development: Selected Regional Perspectives .pp 129-204. Oxford University Press, New Delhi.
25

Government of India (1991): Cost of Cultivation of Principal Crops in India. Department of Agriculture, New Delhi. Government of India(1996): Some Aspects of Household Ownership Holdings. Report no. 399, National Sample Survey Organization, New Delhi Government of India (1997): Some Aspects of Operational Holdings in India. Report no. 407, National Sample Survey Organization, New Delhi. Government of India (2000): Cost of Cultivation of Principal Crops in India. Department of Agriculture, New Delhi. Government of West Bengal: Agricultural Census, Department of Agriculture.Calcutta. various years. Government of West Bengal: Economic Review, Bureau of Applied economics and Statistics, Calcutta. various years. Government of West Bengal (2003): Statistical Abstract, 2001-02. Bureau of Applied Economics and Statistics, Calcutta. Khasnobis, Ratan(1994):Tenurial Conditions in West Bengal: Continuity and Change, Economic and Political Weekly, December 31. Lieten, G.K.(1996): Land Reforms at Centre Stage: The Evidence on West Bengal, Development and Change. Volume 27(1). Mishra, S.K. and Rawal, V. (2002):Agrarian Relations in Contemporary West Bengal and Tasks for the Left in V. K. Ramachandran and M. Swaminathan, (ed.) (2002): Agrarian Studies: Essays on Agrarian Relations in Less Developed Countries, Tulika Books, New Delhi. Rudra, Ashok. (1981 a): One Step Forwards, Two Steps Backward, Economic and Political Weekly, Review of Agriculture, June. (1981 b): Paschimbanger Bargadar. Kotha-Shilpo, Calcutta Sawant, S.D.(1990): Distribution of Land Holdings from the National Sample Survey, Indian Journal of Agricultural Economics. Volume XLV(2), April-June 1990. Sharma, H.R.(1995): Agrarian Relations in India: Patterns and Implications. Har-Anand Publications, New Delhi. Venkateswarlu, A.(2003): Pattern of Land Distribution and Tenancy in Rural Andhra Pradesh. Working Paper no. 51, Centre for Economic and Social Studies, Hyderabad.
26

Appendix
Table1: District wise Progress of the Agrarian Reform Programs in terms of Area
(up to September 2003)
Districts
Area of Land Re-distributed (in Htrs.)
Area Recorded
Under OB (in Htrs)
Net Sown Area
(in htrs.)
% of area under OB
% of area under re-distributi
on
% of area
under reform
Burdwan 24681 46830 469755 9.97 5.25 15.22 Birbhum 18587 46149 326852 14.12 5.69 19.81 Bankura 24975 27093 357140 7.59 6.99 14.58
Midnapore (E) 19915 21280 304637 6.99 6.54 13.52
Midnapore (W) 91425 30106 545258 5.52 16.77 22.29
Howrah 1869 10062 83126 12.10 2.25 14.35 Hoogly 5118 25292 223956 11.29 2.29 13.58
24 Parganas (N) 10074 19500 264381 7.38 3.81 11.19
24Parganas
(S) 29028 34327 380096 9.03 7.64 16.67 Nadia 8660 18860 310797 6.07 2.79 8.85
Murshi-dabad 18028 26923 406456 6.62 4.44 11.06
Dinajpur (N) 28973 9037 275213 3.28 10.53 13.81
Dinajpur (S) 19258 21634 194609 11.12 9.90 21.01
Malda 31122 31999 228485 14.00 13.62 27.63 Jalpaiguri 40189 39089 329846 11.85 12.18 24.03 Darjeeling 12575 7012 143108 4.90 8.79 13.69 Coochbihar 25675 33785 253539 13.33 10.13 23.45
Purulia 29433 3392 256942 1.32 11.46 12.78
West Bengal 439585 452370 5354196 8.45 8.21 16.66 Source: Calculated from Government of West Bengal documents.
27

Table1: District wise Progress of the Agrarian Reform Programs
in terms of Beneficiaries (up to September 2003)
Districts Land Reform
Beneficiaries
Bargadars Recorded under OB
Agricultural Workers= Cultivators
+Agricultural workers
Land Reform
Beneficiaries as % of
Agricultural Workers
OB Beneficiaries
as % of Agricultural
Workers
Agrarian Reform
Beneficiaries as % of
Agricultural Workers
Burdwan 207082 133293 1092247 18.96 12.20 31.16 Birbhum 148962 112798 676874 22.01 16.66 38.67 Bankura 164029 116492 943017 17.39 12.35 29.74
Midnapore(E) 206698 167785 Midnapore(W) 621450 136782
2252280 36.77 13.52 50.29
Howrah 25570 42754 217643 11.74 19.64 31.38 Hoogly 67979 113758 725750 9.37 15.67 25.04
24 Parganas(N)
119066 74055 698210 17.05 10.61 27.66
24 Parganas(S)
160929 113533 941326 17.10 12.06 29.16
Nadia 95276 64261 693318 13.74 9.27 23.01 Murshidabad 150503 85270 930265 16.18 9.17 25.35 Dinajpur(N) 147235 31942 647706 22.73 4.93 27.66 Dinajpur(S) 75812 71836 411516 18.42 17.46 35.88
Malda 153178 81693 689178 22.23 11.85 34.08 Jalpaiguri 129637 61333 495462 22.16 12.38 38.54 Darjeeling 51991 12879 140506 37.00 9.17 46.17 Coochbihar 128023 84799 647285 19.78 13.10 32.88
Purulia 90995 9194 758939 11.99 1.21 13.20 West Bengal 2,744,415 1,514,457 12964104 21.16 11.68 32.84
Source: Calculated from Government of West Bengal documents
28