agri trends 23 march 2018 · 2018-03-26 · development in brazil. ... 2,060 98 89 2,080 132 131...
TRANSCRIPT

Agri Trends 23 March 2018
Grain prices take a heavy blow due to brewing America-China trade war. President Donald Trump announced yesterday that the US would be imposing tariffs on approximately US$50 billion worth of Chinese imports. China had since then announced their list of items/products that may be taxed which is imported from the US including pork, apples and steel amongst other things. There’s been speculation over the past month that China would also impose import tariffs on US soybeans, if the US proceeded with this trade action. International grain prices have taken a heavy hit this morning because of this trade war threat.
Contents
Maize market trends .................................................................................................................................................... 1
Beef market trends ....................................................................................................................................................... 7
Sheep meat market trends ........................................................................................................................................... 9
Pork market trends ..................................................................................................................................................... 10
Wool market trends .................................................................................................................................................... 14
Cotton market trends ................................................................................................................................................. 15
Vegetables market trends .......................................................................................................................................... 17
Contact us at Absa AgriBusiness: [email protected] [email protected] [email protected] https://www.absa.co.za/business/sector-solutions/agribusiness/trends-and-reports/
Page 1 of 18
Maize market trends
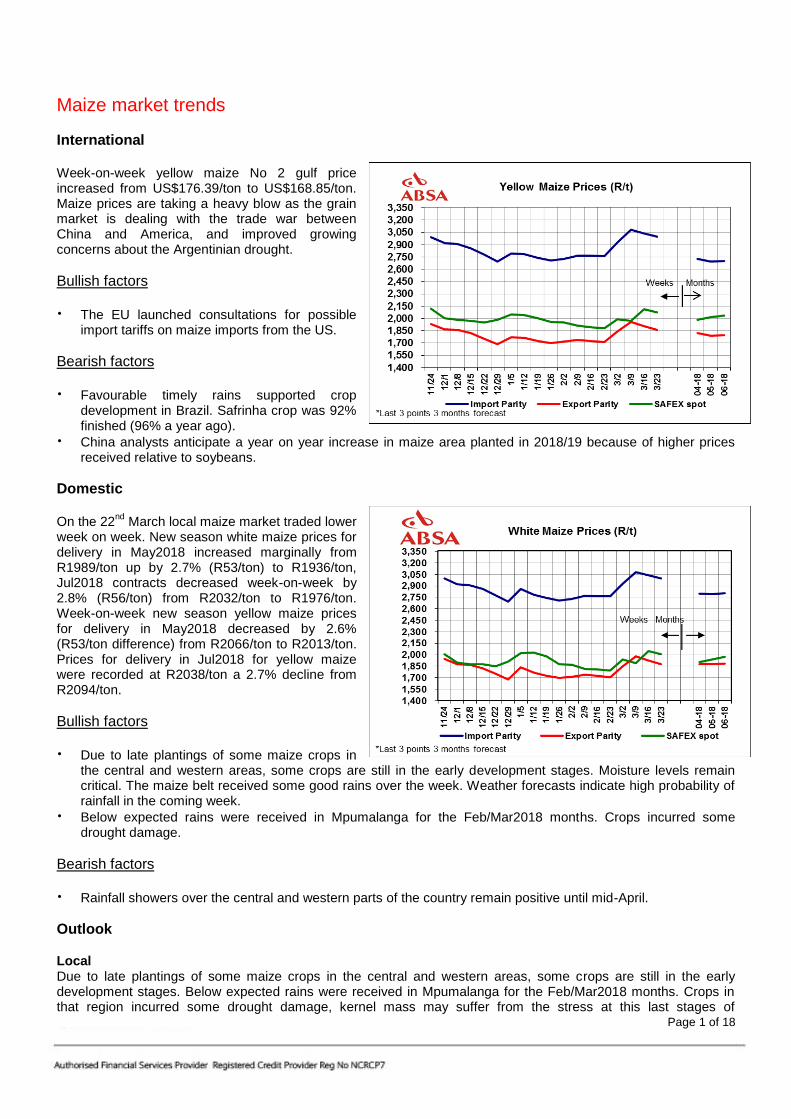
International Week-on-week yellow maize No 2 gulf price increased from US$176.39/ton to US$168.85/ton. Maize prices are taking a heavy blow as the grain market is dealing with the trade war between China and America, and improved growing concerns about the Argentinian drought.
Bullish factors The EU launched consultations for possible
import tariffs on maize imports from the US.
Bearish factors Favourable timely rains supported crop
development in Brazil. Safrinha crop was 92% finished (96% a year ago).
China analysts anticipate a year on year increase in maize area planted in 2018/19 because of higher prices received relative to soybeans.
Domestic On the 22
nd March local maize market traded lower
week on week. New season white maize prices for delivery in May2018 increased marginally from R1989/ton up by 2.7% (R53/ton) to R1936/ton, Jul2018 contracts decreased week-on-week by 2.8% (R56/ton) from R2032/ton to R1976/ton. Week-on-week new season yellow maize prices for delivery in May2018 decreased by 2.6% (R53/ton difference) from R2066/ton to R2013/ton. Prices for delivery in Jul2018 for yellow maize were recorded at R2038/ton a 2.7% decline from R2094/ton.
Bullish factors Due to late plantings of some maize crops in
the central and western areas, some crops are still in the early development stages. Moisture levels remain critical. The maize belt received some good rains over the week. Weather forecasts indicate high probability of rainfall in the coming week.
Below expected rains were received in Mpumalanga for the Feb/Mar2018 months. Crops incurred some drought damage.
Bearish factors Rainfall showers over the central and western parts of the country remain positive until mid-April.
Outlook
Local Due to late plantings of some maize crops in the central and western areas, some crops are still in the early development stages. Below expected rains were received in Mpumalanga for the Feb/Mar2018 months. Crops in that region incurred some drought damage, kernel mass may suffer from the stress at this last stages of

Page 2 of 18
development. The maize belt received some good rains throughout this week, and further rains anticipated for the next week. This will benefit crop development and aid in recovery. International Maize prices are taking a heavy blow as the grain market is dealing with the trade war between China and America.
Table 2: Weekly average white maize futures and estimated option prices
Yellow Maize Futures:
22 March 2018 May-18 Jul-18 Sep-18 Dec-18
CBOT ($/t) 148.02 151.27 153.73 156.68
SAFEX (R/t) 2013 2038 2090 2149
SAFEX (R/t)
Change week on week
(w/w)
-53 -56 -56 -51
May-18 Jul-18 Sep-18
Ask Put Call Ask Put Call Ask Put Call
2,060 98 89 2,080 132 131 2,140 167 157
2,020 58 49 2,040 92 91 2,100 127 117
1,980 18 9 2,000 52 51 2,060 87 77
White Maize Futures
22 March 2018
May-18 Jul-18 Sep-18 Dec-18
SAFEX (R/t) 1936 1976 2018 2088
SAFEX (R/t)
Change w/w
-53 -56 -69 -59
May-18 Jul-18 Sep-18
Ask Put Call Ask Put Call Ask Put Call
1,980 98 98 2,020 137 133 2,060 169 161
1,940 58 58 1,980 97 93 2,020 129 121
1,900 18 18 1,940 57 53 1,980 89 81

Page 3 of 18
Wheat market trends
International The weekly average old season HRW wheat Gulf price declined from US$188.59/ton to US$187.67/ton week on week. Weekly average SRW wheat price also declined from US$202.67/ton to US$191.87/ton week on week.
Bullish factors Bargain buying in the US kept US wheat
prices firm.
The latest crop condition report from the USDA showed huge volumes of wheat crop had deteriorated, therefore rated poor.
Bearish factors HRW crop prices plummeted on Monday
19th March on the CBOT, amid rains in Argentina (more rain expected) and rains in the US Plains ceased the drought concerns.
Global wheat production is expected to rise (5% in 2018) owing to favourable weather productions in some of the major producing countries like Russia, Canada and Australia.
Domestic On 22
nd March 2018, wheat prices for delivery in May2018 increased 2.3% (R85/ton) from R3740/ton to R3825/ton.
Jul2018 prices increased marginally by 2% (R75/ton) from R3743/ton to R3818/ton, week on week.
Bullish factors Planting season has not yet started. South Africa has been reducing area under wheat for the past 10 years,
making the country more dependent on imports. Weather forecasts indicate a potential late start of the rainy season. Possibly delayed until May or even later.
A weaker Rand (w/w) supported positive price movements as well as increased buying.
Bearish factors Local farmers expect more wheat to be produced for the new season because weather patterns are expected
to become favourable. The Western Cape is expected to receive some rains in the next 2 weeks.
The lower calculated tariff of R394.90/ton was triggered on the 13th February 2018 is still pending publication. Since then a new lower calculated tariff at R293.74/ton was triggered on the 20
th March 2018 which will have a
negative effect on the producers during their optimal planting time.
Outlook Local Weather patterns indicate possible rainfall in the 2
nd half of the month and into April. Weather will remain a key
factor as the industry is moving closer to planting season. Planting decisions will be made based on a more positive rainfall outlook to make up for the previous season’s crop losses.

Page 4 of 18
International Favourable weather prospects ahead of planting time in Russia and Ukraine, anticipated to lead to another good harvest from these areas. Due to heavy global supplies, prices are expected to trade sideways for the medium term, after rallying for weeks.
Wheat Futures
22 March 2018 May-18 Jul-18 Sep-18 Dec-18
CME ($/t) 173.43 179.31 187.12 193.46
SAFEX (R/t) 3825 3818 3800 3772
SAFEX (R/t) Change w/w
85 75 80 82
May-18 Jul-18 Sep-18
Ask Put Call Ask Put Call Ask Put Call
3,860 74 77 3,860 100 99 3,840 117 117
3,820 34 37 3,820 60 59 3,800 77 77
3,780 14 17 3,780 20 19 3,760 37 37

Page 5 of 18
Oilseeds market trends
International The weekly average USA soybean price declined week-on-week from US$393.06/ton to US$390.67/ton.US soya oil prices marginally increased from US$31.88/ton to US$32.01/ton and soymeal prices traded lower from US$376.86/ton to US$383.20/ton. La Nina has officially ended. No current threats of the phenomenon to develop this year. Normal weather anticipated to return from April to October.
Bullish factors Soybean:
World demand for US soybeans is set to increase. US soybeans export and crushings are anticipated to increase.
World soymeal export supplies are at a 4-year low of 64 million ton, because of drought induced soybean crop damage.
Argentina is anticipated to receive rains in the 2nd
half of March. If rains are not sufficient, the Argentinian soybean crop could fall below 39 million ton.
Sunflower:
2nd
half of 2017/18 world sunflower seed crop expected to contract due to crop reductions in Argentina and South Africa.
Egypt and Uzbekistan are the key growth markets so far this season.
Bearish factors Soybean:
Brazilian crop is expected to cushion the crop losses incurred in Argentina. The most severe drought had hit South America in 40 years, which damaged soybean and maize crops. The dryness persisted from Dec 2017 till the 1
st half of March 2018. Due to larger plantings in Brazil, the country’s soybean crop however is expected
to exceed even than the previous season’s bumper crop of 114 million tons. This means only a slight reduction in world soybean stocks.
Argentinian soybean crop can improve from current conditions from the anticipated rains in the 2nd
half of March. Late planted soybean crops can recover.
Higher global demand for US soybeans will likely lead to the increase of another large US soybean crop later in 2018 in order to meet world demand.
Other Oilseeds:
The production of the 9 other oilseeds (globally) is expected to increase to 220 million ton in 2017/18. Year on year increases are expected for cottonseed, groundnut, copra, palm kernel and rapeseed (increased in world stocks for the group).
Domestic On March 22
nd, new season sunflower seed prices (May2018) decreased marginally week on week by 1.9%
(R92/ton) from R4815/ton to R4723/ton. New season sunflowerseed prices (Jul2018) also decreased by 2.1% (R101/ton) from R4852/ton to R4751/ton. New season soybean prices declined week on week from (May2018) prices decreased by 1.2% (R54/ton) from R4618/ton to R4564/ton, while Jul2018 soybean prices also declined by 1.1% (R52/ton) from R4724/ton to R4672/ton.

Page 6 of 18
Bullish factors Due to very late plantings of some sunflower crops in the central and western areas plants will remain
vulnerable and susceptible to frost damage should it occur before mid-April, however the probability is low.
Should frost occur, this could have crucial impact on the size of the sunflower crop.
Bearish factors Favourable prospects for continuous rainfall in the next weeks set to benefit the soybean and sunflower crop
and aid recovery after the dry phase.
Sunflower and soybean seed prices weighed down by international lower soybean and sunflower seed prices due to better weather forecast around the South American soybean belt and US Plains.
Outlook Local Plants remain vulnerable and susceptible to frost damage should it occur before mid-April; however the probability is low. Soybean crushing margins remain relatively high, pushing demand for soybeans over sunflowerseed crushing. International La Nina has officially ended. No current threats of the phenomenon to develop this year. Normal weather anticipated to return from April to October. Late planted soybean crops may benefit from these rains and recover however, there’s still risk for too much rainfall could potentially lead to crop damage in South America. 2 Major rain events were anticipated for the soybean belt in South America from the 18 March till 24 March 2018.
Oilseeds Futures
22 March 2018 May-18 Jul-18 Sep-18 Dec-18
CBOT Soybeans (US$/t)** 378.37 382.41 378.83 378.55
CBOT Soy oil (US c/lb) 32.36 32.48 34.82 33.37
CBOT Soy cake meal (US$/t)*
404.40 407.03 401.87 397.47
SAFEX Soybean seed (R/t) 4564 4672 4777 4882
SAFEX Soybean seed (R/t) change w/w -54 -52 -53 -18
SAFEX Sunflower seed (R/t)
4723 4751 4912 5030
SAFEX Sunflower seed (R/t) change w/w -92 -101 -31 -42
May-18 Jul-18 Sep-18
Ask Put Call Ask Put Call Ask Put Call
4,760 92 94 4,800 133 129 4,960 148 144
4,720 52 54 4,760 93 89 4,920 108 104
4,680 12 14 4,720 53 49 4,880 68 54
*short ton
** Dec 2018 = Jan 2019

Page 7 of 18
Beef market trends
International New Zealand steers traded sideways over the past week at 5.56NZ$/kg and cows traded sideways at 4.43NZ$/kg compared to a week ago. In the US, beef prices for the week were mostly lower as follows: Topside traded 1.85% lower at $222.56/cwt. Rump was 0.68% lower at $343.93/cwt and strip loin was 3.46% higher at $667.75/cwt. Chuck traded 2.42% lower at $213.33/cwt. Brisket traded 2.44% lower at $289.30/cwt. The carcass equivalent price was 0.02% lower at $332.58cwt.
Bullish factors So far, demand for New Zealand beef
has supported prices beyond expectation.
But US beef exports remain strong. Beef exports in January set a record for the first month of the year, supporting the prospects for another record beef export volume in 2018.
Bearish factors Increasing US beef production looks set to challenge the beef market in coming months.
Larger volumes of beef cows have been offloaded recently as drought conditions plague many key US breeding regions.
Looking forward into coming months, fed cattle slaughter rates are also going to have a significant impact on production. Feedlot numbers are presently at their highest level since 2012.
Domestic Week on week, beef prices were mostly lower across the different classes. The average Class A price was the same this week at R46.90/kg. Class C prices were 0.20% lower at R41.90/kg. The average weaner calf price over the past week lost some ground and was 4.3% lower at R34.00/kg. There is an increase in weaner calves numbers, weighing on calve prices. Normally, the increased supply for weaner calves during the weaner calve season from March until May could weigh further on weaner calf prices. This will improve the price margin for feedlots. The average hide price over the past week lost some ground. The market remains soft across all the board due relatively strong ZAR strength. Prices for good Feedlot material are stable but a significant gap has opened for hides that don’t meet this quality standard. The average hide prices traded 0.62% lower w/w at R9.56/kg green. NB* Hide prices are determined by the average of the RMAA (Red Meat Abattoir Association) and independent companies.
Bullish factors Weather forecasts show that the probability for rain over the central to western parts of the country remains
positive until the middle of April 2018. Favourable rains improve soil moisture levels, veldt conditions and help with herd building process.
Increased uptake towards Easter may support prices.

Page 8 of 18
During January 2018, an estimated 188 737 head of cattle was slaughtered. This is 10% less cattle slaughtered compared to the same time a year ago, and 11% less head of cattle slaughtered compared to January 2016.
Bearish factors Weaner calf prices are under pressure due to an increase in the number of weaners in the market currently.
Normally, the increased supply for weaner calves during the weaner calve season from March until May could weigh further on weaner calf prices. This will improve the price margin for feedlots.
The lower maize prices therefore meant that the cost to feed is low, thereby encouraging fattening of cattle by capitalizing on the feed margin.
The new maize and soybean harvest exceeds expectations and will mean that it will take longer to consume the stock of maize and soybeans locally. Due to a poor rate of exports, carry stocks for old season maize by the end of April is large. Typically, exports in previous years have made a significant contribution to reducing maize stocks. Maize prices are trading low and expected to remain low in the medium term. The accumulating stocks will place downward pressure on maize prices for a longer term. Unfortunately, international maize prices are also low because the world stock for maize is also high. At this stage, we must prepare ourselves for a new season of maize to be delivered in a period that will be characterized by a strong Rand. A strong rand reduces the export price of maize.
Outlook
Internationally, increasing US beef production looks set to challenge the beef market in coming months. Locally, beef prices may strengthen moving forward on the back of expected increases in demand towards Easter.

Page 9 of 18
Sheep meat market trends
International New Zealand lamb prices traded sideways this week compared to last week. Lamb prices closed sideways at NZ$106.1/head for 15kg lamb. Lamb prices were sideways at NZ$148.6/head for 21kg lamb. Ewe prices traded sideways at NZ$101.3/head for a 21kg ewe. The import parity price for lamb was 0.4% higher at R67.28/kg, while the import parity price for mutton was 0.4% higher at R49.34/kg. Bullish factors Market demand for lamb overall
remains supported by continuing low supply.
China has re-entered the market following its New Year holiday on a firm note,
Bearish factors New Zealand Lamb slaughter rates are expected to slowly increase from this point, however, and exporters will
be watching carefully to see how increased supply is received in key markets.
The current high price levels are meeting resistance from some customers and may ease if supply lifts.
However, any downside is expected to be in-line with seasonal trends,
Domestic This week, lamb and mutton prices continued to lose some ground when compared to the previous week. Lamb and mutton prices were as follows: The national average Class A carcass lamb prices decreased by 2.2% to R69.10/kg and the average Class C carcass prices decreased by 4.1% to R54.59/kg. The average price for feeder lambs traded 4.9% lower at R38.50/kg. The average price for dorper skin is 4.5% lower at R32.22/skin and merinos were 3.2% lower at R87.63/skin. Bullish factors During January 2018, 284 934 head of sheep were slaughtered. This is 18% fewer head of sheep slaughtered
compared to the same time a year ago, and 20% less sheep slaughtered compared to January 2016. The decline of the slaughter numbers for sheep is far more than for cattle.
Improved uptake towards Easter
Bearish factors
According to weather forecasts, the probability for rain over the central to western parts of the country remains positive until the middle of April 2018. Favourable rains are welcome to improve soil moisture levels, veldt conditions and dam levels ahead of winter
Outlook Internationally, Market conditions do continue to support prices, with tight global supplies still giving some support to prices. Locally, Prices are currently following a downward trend. It can be expected that prices will start picking up towards Easter in line with increased consumer demand.

Page 10 of 18
Pork market trends
International The average weekly US pork prices were mostly lower over the past week. Carcass prices were 2.7% lower at US$73.02cwt, loin prices were 0.9% lower at US$73.46/cwt, rib prices were 0.1% higher at US$132.95cwt and ham was 6.8% lower at US$56.04/cwt.
Bullish factors Bloomberg has reported that
China is the world’s biggest pork producer, consumer and importer, and the country is planning a 25 percent tax on US pork imports, the Commerce Ministry said in a statement on Friday. China’s attack on US pork imports comes just hours after U.S. President Donald Trump ordered tariffs on a range of Chinese products from aerospace to machinery. The U.S. exports about a fifth of its pork production, and China -- the world’s largest consumer of the meat -- is among the largest buyers.
Bearish factors A rapid expansion of large hog farms in China has outpaced demand, driving down prices and slowing imports.
Chinese pig prices declined to their lowest in four years during the week that ended on the 9th of May. This is
due to concerns that a rapid expansion of large pig farms in China has outpaced slowing demand growth. A prolonged downturn could hit some less efficient producers, however, with major repercussions for the global grains sector. China buys 60 percent of the world’s soybeans to feed its livestock.
AHBD outlook Looking forwards, further downward pressure on global pork prices is likely. Increased production from the US, Canada and Brazil is anticipated this year, and the EU should also have greater supply availability. Unless demand can pick up, the global markets risk being oversupplied, resulting in downward price pressure.”
Large feed production and lower feed costs are to benefit production.
Domestic Average pork prices have shown a declining trend over the past two months. Seasonality, less demand, plentiful supplies, the buying power of consumers and the rand strength may have been some of the factors that have contributed. This week, pork prices were mostly lower. The latest average pork prices are as follows: The average porker prices are 2,3% lower at R26.37kg, while the average baconer prices are 3.4% lower at R24.59/kg. The average cutters prices were 5.0% higher at R25.4/kg and the average heavy baconer price was 3.3% higher at R24.79. The SAU price was 1.1% lower at R18.24/kg.
Bullish factors Pork remains a cheaper protein

Page 11 of 18
Bearish factors 238 510 pigs were slaughtered during January 2018. This was 4.5% higher compared to the same time a year
ago.
During January 2018, the average porker price increased by 6.43%, whilst the average Baconer price increased by 6.36% year on year. These higher prices may have created resistance from consumers.
Seasonality, less demand, plentiful supplies, the buying power of consumers and the rand strength may have been some of the factors that have contributed.
Outlook Internationally, China’s plans to increase tariffs against US pork imports may bring about changes to trade. Locally, there are plentiful supplies of pork in the market, which weigh on prices.

Page 12 of 18
Poultry market trends
International Poultry prices in the US were mostly higher over the past week. Whole bird prices were 5.41% higher at 99.04USc/lb. Breast traded 15.18% higher at 129.00USc/lb, while leg quarters traded sideways at 38.50USc/lb.
Bullish factors Asian Agribiz reports that China has
halted poultry imports over avian influenza outbreaks in Texas, France and Mexico, with findings of the H7N1 strain in a poultry farm in Hopkins Country, Texas; the H5N3 strain in Finestere Department, France; and the H7N3 strain in Mexico.
Possible return of avian influenza in the northern hemisphere this winter may impact global trade.
Bearish factors Prolonged favorable feeding environment. Large feed production and lower feed costs are beneficial to pork
production.
Domestic The average poultry prices over the past week were mostly lower. The average prices for frozen birds were 1.29% lower at R25.78/kg during the week. Whole fresh medium bird prices were 0.90% lower at R26.75/kg, while IQF prices were 0.09% higher at R24.85kg. Week on week, import parity prices increased in spite of slight strength in the South African Rand, but were supported by increases in international prices.
Bullish factors Improvement in demand towards of Easter
Bearish factors The Stats SA monthly prices for February 2018 show that consumer egg prices are showing some slight
recovery after following increasing trends in the past months. Egg prices for ½ dozen declined by 0.6%, to R16.40 whilst prices for 2.5 dozen declined by 1.2% to R62.97 during February 2018 when compared to January 2018.
Confirmation that the origin of the listeriosis outbreak has been linked to processed meats like polony may bring some uncertainty and limit some of the demand.
Low feed cost environment.
Maize prices are expected to remain subdued for the rest of 2018 because of the huge maize surplus in storage
Outlook Internationally, larger broiler supplies are expected to keep prices subdued, but developments in avian influenza will influence trade. Locally, poultry prices may gain support from improvement in demand towards of Easter.

Page 13 of 18
Livestock prices (R/kg) week 22 Mar 2018
Beef
Mutton
Pork
Poultry
% Cur-rent week
Prior week
% Cur-rent week
Prior week
% Cur-rent week
Prior week
% Cur-rent week
Prior week
Class A/ Porker/ Fresh birds
0 46.90 46.91 -2.2 69.10 70.69 -2.3 26.37 27.01 -0.90 26.75 27.00
Class C/ Baconer/ Frozen birds
-0.20 41.90 41.99 -4.1 54.59 56.90 -3.4 24.59 25.46 -1.29 25.78 26.12
Contract/Baconer/ IQF
0 48.10 48.10 -3.0 69.65 71.77 -2.9 25.48 26.23 0.09 24.85 24.83
Import parity price
0.41 66.67 66.39 0.4 49.34 49.14 -2.5 28.8 29.6 -0.2 18.3 18.3
Weaner calves/ Feeder lambs
-4.3 34.00 35.54 -4.9 38.50 40.50 - -
Specific imports: Beef trimmings 80vl/b/ Mutton shoulders/Loin b/in/ chicken leg 1/4
-3.31 48.25 49.90 0 57.70 57.70 0.3 39.80 39.70 1.49 23.80 23.45

Page 14 of 18
Wool market trends
International The Australian wool market gained some ground this week. The Australian wool market prices averaged lower this week and closed 1.54% lower at Au1778c/kg at the recent auction.
Bullish factors The Australian wool prices gained
momentum this week on the back of a surge in demand, lower supplies and favourable foreign exchange rate.
The next 2 Australian auctions are expected to have about 47 000 bales each. Volumes will be expected to decline moderately, because the season will heading towards its seasonal quiet time.
Bearish factors The high and rising wool prices have encouraged producers to shear their sheep and deliver as quickly as
possible into the market. In some cases, producers are reported to be shearing earlier than usual to take advantage of these high prices
Domestic There was no auction the past week. The last auction was on the 14th of March 2018. Domestic wool market prices decreased and the merino indicator was 1.89% lower to close at R177.02 (clean) at the sale.
Bullish factors Demand for wool remains strong.
Wool supplies are low.
The market is driven by the growth in demand, notably from China, but also from Europe.
The drought has affected South Africa's production and according to Cape Wools' accumulative report, wool receipts up to 9 February were down 9,5 per cent on the corresponding period last season.
Bearish factors Analysts do caution that some degree of a downward correction is to be expected.
Outlook Internationally, a firming tendency in prices on the better wools (the better prepared clips took the best possible money out of the buyers at the Australian auctions) and increases in buying intent from exporters witnessed at the close this week may be a sign of recovery. Locally, the South African wool market is positive, driven by strong demand and low supplies.

Page 15 of 18
Cotton market trends
International Cotton prices traded remained unchanged over the past week and closed at US80.48c/lb.
Bullish factors Australian cotton plantings were notably
reduced. India’s production estimate was also reduced because of insect infestation. With that in mind, the global cotton seed production estimate is lower than the February 2018 estimate (from 43.5 million ton in February to 43.1 million ton).
Bearish factors US cotton prices have grown by more
than 20% since late 2017. The increases in prices have caused competition for land use with other crops. The US cotton area is set to increase/expand by 5-6% in 2018, the highest level it’s been in 12 years. The
Domestic The derived SA cotton prices traded 0.35% higher to close at R24.18/kg. The increases in prices were due to increases in international prices, and the weakness in the South African Rand. The 2nd estimate for the 2017/18 production year indicates a cotton crop of 195 530 lint bales for the RSA, an increase of 152% over the previous season and 3% up from last month’s estimate. Renewed interest in cotton production and favourable prices are reasons the industry deem to have supported the production growth.
Outlook Internationally, the area under cotton is expected to enlarge further in 2018/19 in the major producing countries. The upward production trend is driven by rapid growth in cotton fibre consumption and rising prices in 2017/18. Locally, the world market and exchange rate movement may continue to affect the domestic market prices.

Page 16 of 18
Fibres market trends Week ended 23 March 2018
Wool prices % SA prices (c/kg)
% Australian prices (SA c/kg)
%
Australian future May 2018 (AU$/kg)
% Australian future Jul 2018 (AU$/kg)
Wool market indicator
17702 0.00 16251 - -
19μ micron 19244 0.60 18780 2.08 19.60 2.67 19.20
21μ micron 17337 0.40 17320 2.33 17.60 4.88 17.20
Cotton prices 16 March 2018
SA derived cotton (R/kg)
New York A Index (US$/kg)
New York future May 2018 (US$/kg)
New York future Jul 2018 (US$/kg)
Cotton prices 0.35 24.19 0.70 2.05 -1.9 1.84 -1.1 1.84

Page 17 of 18
Vegetables market trends There are talks that the Botswana government is again considering closing their border for the following crops: Potatoes, Carrots, Tomatoes, Green peppers and Cauliflower. Normally Botswana and Namibia close their borders when their domestic production of agricultural products is harvest ready. It usually supports domestic (Botswana in this case) product prices and prevents the import of cheaper more competitive agricultural products from South Africa and other countries. Thus it protects the local producer (Botswana producers in this case) until such time that the harvested products are sold in the domestic market and imports are needed again. Such protectionism behaviour may hamper export opportunity for the SA producer and lead to higher volumes available in the market, therefore supressing prices.
Potato prices & volumes higher week on week. Week on week deliveries were higher (17% week on week) at the Top 5 FPM, however prices increased marginally by 3% irregardless of the higher stocks. Prices are expected to remain trading at R30/bag–R35/bag for the next week as the Easter season is drawing closer.
Pepper prices down owing to poor buying power. Pepper prices decreased by 13% week on week. This follows a 16% increase in volumes delivered to the FPMs. Prices are expected to pick up during the next week because of the Easter holidays and month-end seasonal demand incline. Tomato prices plummet week on week Lack of demand week on week, lead to build up of product on the FPM’s floors this week. Prices declined by approximately 30% in response to a 36% volume increase.
Week ending
23 March
2018
Difference
in weekly
prices (R/t)
This week’s
Average
Price (R/t)
Previous
week’s
Average
Price (R/t)
Difference
in weekly
volumes
This week’s
Total
Volumes (t)
Previous week’s
Total
Volumes (t)
Cabbages 0% 2012 2010 12% 1860 1662 Carrots 6% 4796 4528 26% 2403 1914 Onions 1% 5066 5008 25% 6981 5600
Potatoes 3% 3558 3438 17% 15953 13587 Tomatoes -29% 5694 8068 36% 5047 3708 Peppers -13% 7232 8340 16% 947 813
Disclaimer: Although everything has been done to ensure the accuracy of the information, Absa Bank takes no responsibility for actions
or losses that might occur due to the use of this information.