agricultural tire footprint shape correlation to treads ... · agricultural tire footprint shape...
TRANSCRIPT
International Conference: September 15-17, 2008 Ragusa - Italy
“Innovation Technology to Empower Safety, Health and Welfare in Agriculture and Agro-food Systems”
Agricultural tire footprint shape correlation to treads penetration in
different soils
Romano E., Cutini M., Bisaglia C.
Agriculture Research Council. CRA-ING
Via Milano, 43 – 24047 Treviglio (BG), ITALY.
Tel 0039 0363 49603, Fax 0039 0363 49603, [email protected]
Abstract Aim of this work is looking for a correlation between footprint and soil penetration volume of
treads in agricultural tires.
Three tyres of different dimensions, fitted on the same tractor with different pressures and loads
(N=not ballasted; Z=ballasted) were tested for defining the area of the single footprint shape (SF
and SaF), of the multiple footprint shape (MF) and the volume of tyre in soil (V).
Footprints were obtained on rigid surface (SF and MF) and on soils (SaF: sand) with different
penetration resistance (soil cone penetrometer value).
Contact area and void area (SF BW) were determined by a software that reads the footprint as
an array of pixels in which black pixels and white pixels were distinguished. Volume of treads
was measured from plaster mould.
The correlation between tires’ footprint surface and volume of penetrated treads has been
studied. Soil properties have effects on values but don’t have influence on trend in test
conditions. Volume of penetration is due mainly to the surface in which treads lean. In the same
surface results are influenced by ballast and by inflation pressure. Like in previous study, the
use of the ellipse method on image from sand doesn’t allow to obtain high correlation with rigid
surface, so this application, that with the volume could give the effective interaction between tire
and soil, need more studies. The high correlation between data by volume on soil and data by
multi-footprints give the possibility to read the interaction tire-surface by two different way.
Keywords: contact area, compaction, sand.
Introduction In the manufacture of agricultural tires, tread design has particular significance on soil
compaction, road behaviour and soil penetration. The problems of stressed soil after tire
passages have been studied and pointed out. This effect depends by soil characteristics,
vertical load on tyres and by the total pressure on the soil. Heavy vehicles running on soft,
moist soils cause huge deflections of soil surface, which are irreversible and immediate after
the first pass of a vehicle (Pytka et al., 2005).
The measure of the tyre contact area on rigid surface has always been a reference for
properties on soil and on road even if not faithfully representative of its real behaviour
(Placckett, 1984). A procedure for defining the total area, the contact area and the void area
has been pointed out from CRA-ING of Treviglio. Beside, footprint on rigid surface is not
always sufficient to define the real behaviour on field. Aim of this work is looking for a
correlation between footprint and penetration volume of treads in the soil.
Materials and methods Tests have been conducted in Treviglio (BG) at the CRA – ING Research Laboratory
during the last year. Three tyres of different dimensions (T1= 420/85R28, T2= 540/65R28,
International Conference: September 15-17, 2008 Ragusa - Italy
“Innovation Technology to Empower Safety, Health and Welfare in Agriculture and Agro-food Systems”
T3=420/70R30) were fitted on the same tractor to tested in four different conditions. The
experimental plan considered two inflation pressures (p1= 100 kPa and p2= 160 kPa) and two
configuration of the tractor (CZ= with and NZ= without loads).
The tyres were fitted, in succession, on the rear axle of a 4WD agricultural tractor
(tab.1).
Table 1. Tractor setting used in the tests
Tractor mass (kg) Tractor setting
Front Rear Total
Not ballasted 1455 1810 3265
Ballasted 795 3440 4235
To obtain results about the four kind of contact area and the two kind of volume, the
method consisted in placing the tyre on the rear axle of the tractor and applying static loads to
obtain a deflection “footprint” on different surfaces. To prepare the tire to the single or
multiple footprint on paper, treads were painted and placed on a contrasting surface such that
a high contrast image of the deflected tread pattern was produced. To print the contact area on
a sheet of paper set on the rigid surface the part of contact of the treads was covered with ink.
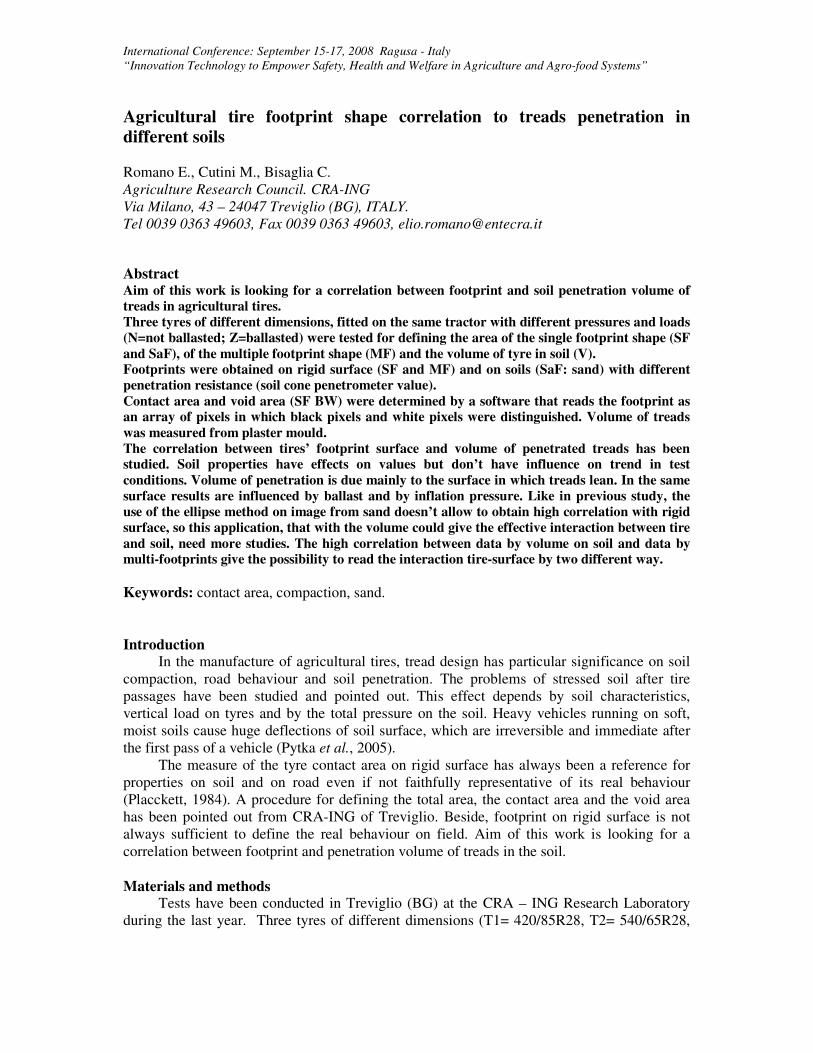
The footprint image (figure 1) was generated by statically loading the tyre on an
appropriate surface, but for the multiple imprint (figure 2) the tyre was rotated in 5 different
position in order to fill all the potential area that the tyre would cover. The footprint on the
sand (figure 3), was obtained by means of single imprints.
Figure 1. Single
footprint shape
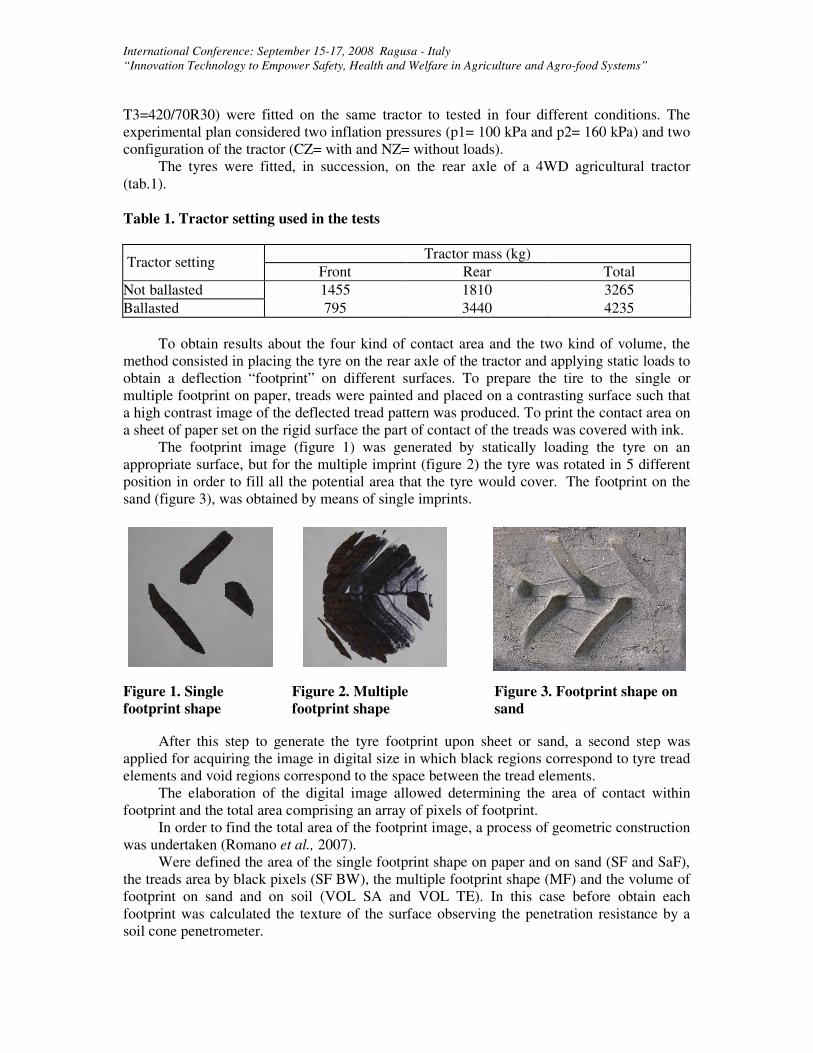
Figure 2. Multiple
footprint shape
Figure 3. Footprint shape on
sand
After this step to generate the tyre footprint upon sheet or sand, a second step was
applied for acquiring the image in digital size in which black regions correspond to tyre tread
elements and void regions correspond to the space between the tread elements.
The elaboration of the digital image allowed determining the area of contact within
footprint and the total area comprising an array of pixels of footprint.
In order to find the total area of the footprint image, a process of geometric construction
was undertaken (Romano et al., 2007).
Were defined the area of the single footprint shape on paper and on sand (SF and SaF),
the treads area by black pixels (SF BW), the multiple footprint shape (MF) and the volume of
footprint on sand and on soil (VOL SA and VOL TE). In this case before obtain each
footprint was calculated the texture of the surface observing the penetration resistance by a
soil cone penetrometer.
International Conference: September 15-17, 2008 Ragusa - Italy
“Innovation Technology to Empower Safety, Health and Welfare in Agriculture and Agro-food Systems”
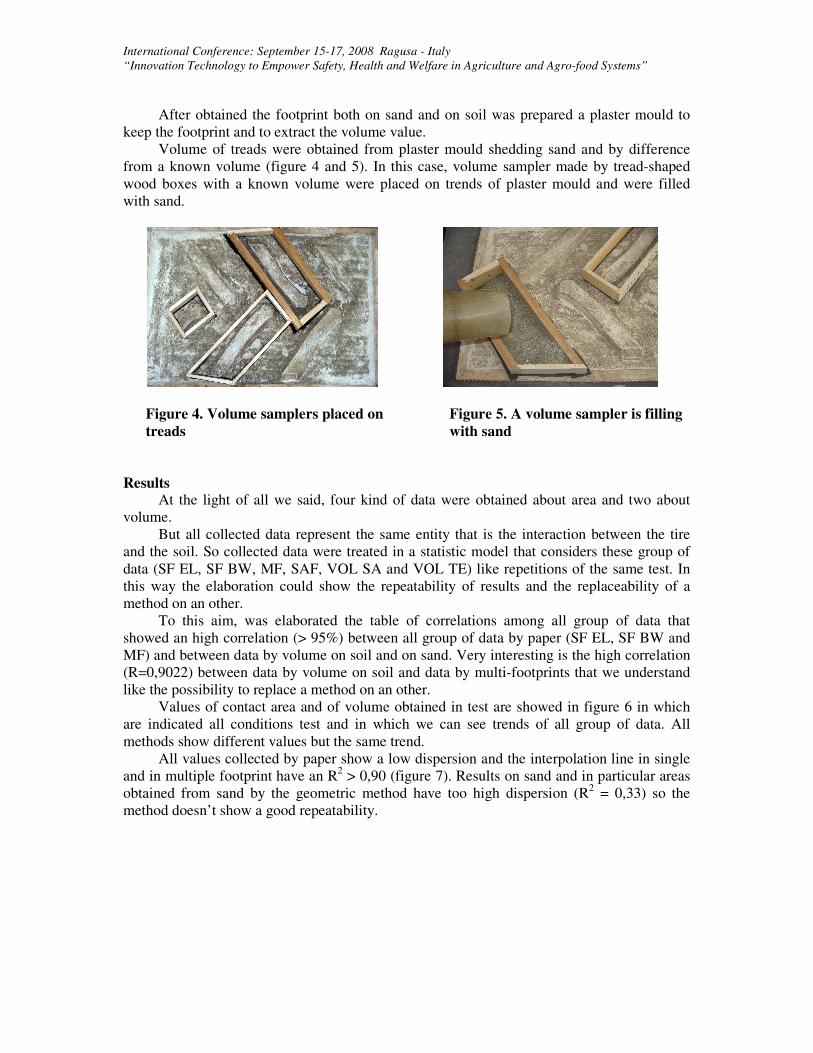
After obtained the footprint both on sand and on soil was prepared a plaster mould to
keep the footprint and to extract the volume value.
Volume of treads were obtained from plaster mould shedding sand and by difference
from a known volume (figure 4 and 5). In this case, volume sampler made by tread-shaped
wood boxes with a known volume were placed on trends of plaster mould and were filled
with sand.
Figure 4. Volume samplers placed on
treads
Figure 5. A volume sampler is filling
with sand
Results At the light of all we said, four kind of data were obtained about area and two about
volume.
But all collected data represent the same entity that is the interaction between the tire
and the soil. So collected data were treated in a statistic model that considers these group of
data (SF EL, SF BW, MF, SAF, VOL SA and VOL TE) like repetitions of the same test. In
this way the elaboration could show the repeatability of results and the replaceability of a
method on an other.
To this aim, was elaborated the table of correlations among all group of data that
showed an high correlation (> 95%) between all group of data by paper (SF EL, SF BW and
MF) and between data by volume on soil and on sand. Very interesting is the high correlation
(R=0,9022) between data by volume on soil and data by multi-footprints that we understand
like the possibility to replace a method on an other.
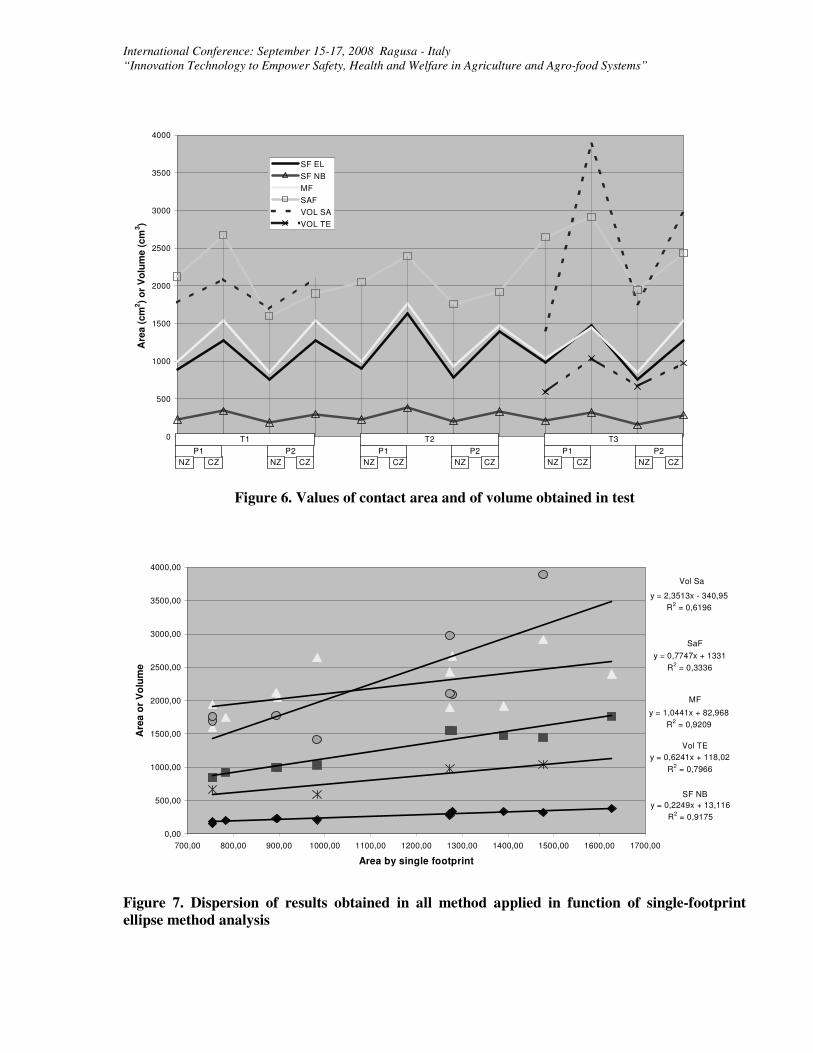
Values of contact area and of volume obtained in test are showed in figure 6 in which
are indicated all conditions test and in which we can see trends of all group of data. All
methods show different values but the same trend.
All values collected by paper show a low dispersion and the interpolation line in single
and in multiple footprint have an R2 > 0,90 (figure 7). Results on sand and in particular areas
obtained from sand by the geometric method have too high dispersion (R2 = 0,33) so the
method doesn’t show a good repeatability.
International Conference: September 15-17, 2008 Ragusa - Italy
“Innovation Technology to Empower Safety, Health and Welfare in Agriculture and Agro-food Systems”
Figure 6. Values of contact area and of volume obtained in test
Figure 7. Dispersion of results obtained in all method applied in function of single-footprint
ellipse method analysis
y = 0,7747x + 1331
R2 = 0,3336
y = 2,3513x - 340,95
R2 = 0,6196
y = 0,2249x + 13,116
R2 = 0,9175
y = 0,6241x + 118,02
R2 = 0,7966
y = 1,0441x + 82,968
R2 = 0,9209
0,00
500,00
1000,00
1500,00
2000,00
2500,00
3000,00
3500,00
4000,00
700,00 800,00 900,00 1000,00 1100,00 1200,00 1300,00 1400,00 1500,00 1600,00 1700,00
Area by single footprint
Are
a o
r V
olu
me
SaF
Vol Sa
Vol TE
SF NB
MF
0
500
1000
1500
2000
2500
3000
3500
4000A
rea
(c
m2)
or
Vo
lum
e (
cm
3)
SF EL
SF NB
MF
SAF
VOL SA
VOL TE
CZ
P1
T1
P2
CZNZNZ CZ
P1
T2
P2
CZNZNZ CZ
P1
T3
P2
CZNZNZ
International Conference: September 15-17, 2008 Ragusa - Italy
“Innovation Technology to Empower Safety, Health and Welfare in Agriculture and Agro-food Systems”
The Analysis of Variance to evaluate main effects and interaction among factors in
tests, showed an high influence on results by inflation pressure (p<0,001) and the loads of
tractor (p<0,001). However the dimension and the method didn’t have influence on tests. Any
interaction between factors didn’t appear by this analysis.
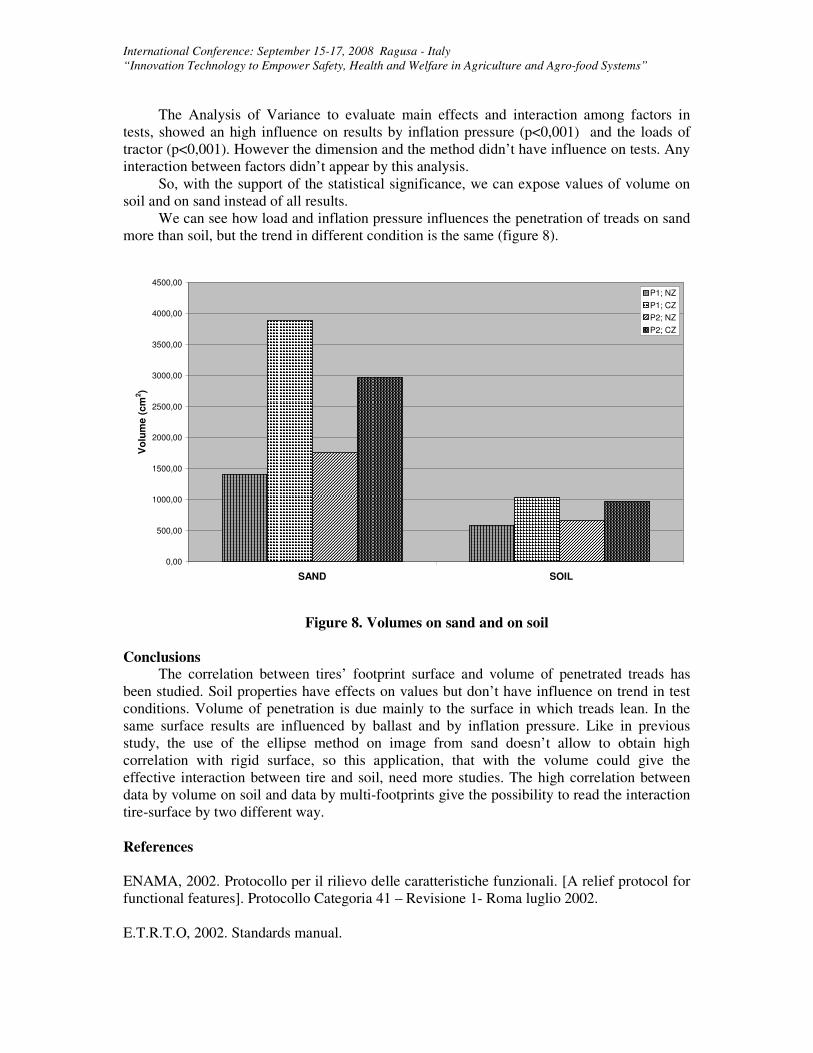
So, with the support of the statistical significance, we can expose values of volume on
soil and on sand instead of all results.
We can see how load and inflation pressure influences the penetration of treads on sand
more than soil, but the trend in different condition is the same (figure 8).
Figure 8. Volumes on sand and on soil
Conclusions The correlation between tires’ footprint surface and volume of penetrated treads has
been studied. Soil properties have effects on values but don’t have influence on trend in test
conditions. Volume of penetration is due mainly to the surface in which treads lean. In the
same surface results are influenced by ballast and by inflation pressure. Like in previous
study, the use of the ellipse method on image from sand doesn’t allow to obtain high
correlation with rigid surface, so this application, that with the volume could give the
effective interaction between tire and soil, need more studies. The high correlation between
data by volume on soil and data by multi-footprints give the possibility to read the interaction
tire-surface by two different way.
References
ENAMA, 2002. Protocollo per il rilievo delle caratteristiche funzionali. [A relief protocol for
functional features]. Protocollo Categoria 41 – Revisione 1- Roma luglio 2002.
E.T.R.T.O, 2002. Standards manual.
0,00
500,00
1000,00
1500,00
2000,00
2500,00
3000,00
3500,00
4000,00
4500,00
SAND SOIL
Vo
lum
e (
cm
2)
P1; NZ
P1; CZ
P2; NZ
P2; CZ
International Conference: September 15-17, 2008 Ragusa - Italy
“Innovation Technology to Empower Safety, Health and Welfare in Agriculture and Agro-food Systems”
Febo P., Pessina D., Pipitone F., 1997. Un impianto per la misura dell’area di contatto dei
pneumatici agricoli: prime prove comparative. [A contact area measure system for
agricultural tyre: first comparative tests]. Atti del congresso AIIA, Ancona, 37-48.
Febo P., Pessina D., Vallone M., 2003. Soil-Tyre/Track interaction. A review of the last ten
years of studies from the soil compaction point of view. Riv. Di Ing. Agr., 3, 55-68.
Grecenko, Alexandr, 1995. Tyre footprint area on hard ground computed from catalogue
values. Journal of Terramechanics, 32(6), 325-333.
Jacke H., Ebel A., 2006. Pressure distribution under forestry tyres. Landtechnik, 4, 188-189.
Jankowska K., Krzyzynski T., Domscheit A., 2006. Vision-based analysis of the tyre footprint
shape.
Keller T., 2005. A Model for the Prediction of the Contact Area and the Distribution of
Vertical Stress below Agricultural Tyres Readily Available Tyre Parameters. Biosystems
Engeneering, 92(1), 85-96.
Pytka J., Dabrowski J., Zajac M., Tarkowski P., 2005. Effects of reduced inflation pressure
and vehicle loading on off-road traction and soil stress and deformation state. Journal of
Terramechanics, 43, 469-485.
Raper R.L., 2005. Agricultural traffic impacts on soil. Journal of Terramechanics, 42(3-4),
259-280.
Ronai D., Shmulvich I., 1995. Tyre footprint characteristics as a funtion of soil properties and
tyre operations. Journal of Terramechanics, 32(8), 311-323.
Romano E., Cutini M., Bisaglia C., 2007. Proposal for a simplified image analysis method
focused on agricultural tyre footprint shape assessment. XXXII CIOSTA-CIGR Section V
Conference, Nitra, Slovakia 17-19 September 2007, II, 570-577.
Shreiber M., Brinkmann C., Schlotter V., 2003. Investigations on Straining Point from
Resulting Forces in the Tread Contact Patch. Landtechnik, 5, 298-299.
Stumpf H. W., 2001. Linking evaluation of subjective tyre tests on the road with objectively
measured data. Int. Journal of Automotive Tec., 2, 1, 17-23.
Wilson P.B., 1994. Method and apparatus for video imaging of tyre ground contact patch. US
Patent 5347588.