agriculture and pesticide use in central and eastern europe
TRANSCRIPT

Facts & Figures
Agriculture and Pesticide Use inCentral and Eastern Europe
..................................................
Hamburg, 2004
Germany


Facts & Figures
Agriculture and Pesticide Use inCentral and Eastern Europe
..................................................
Hamburg, 2004
Germany

Pesticide Action Network (PAN)
Founded in 1982, the Pesticide Action Network is an international coalition of over 600 citi-zens groups in more than 60 countries, working to oppose the misuse of pesticides and to promote sustainable agriculture and ecologically sound pest management.
PAN Germany was established in 1984 as part of this global network and has continually been involved in initiatives to reduce the use of hazardous pesticides and to promote sus-tainable pest management systems on national, European and global levels.
Acknowledgements
Funds for this project were made available by the Rausing Trust (United Kingdom). This support is gratefully acknowledged.
Impressum © Pestizid Aktions-Netzwerk e.V. (PAN Germany)
Nernstweg 32, D-22765 Hamburg, Germany
Tel.: 49 (0) 40-39 91 91 00
Fax: 49 (0) 40-390 75 20
email: [email protected]
Homepage: www.pan-germany.org
2004
ISBN: 3-9809392-7-8
Proofreading: Liz Grundy
Editors: Lars Neumeister & Susanne Smolka
Contributing Authors:
Ewa Hajduk (PKE - Polish Ecological Club, City of Gliwice Chapter, Poland)
Ferenc Laszó (CES - Center for Environmental Studies Foundation, Hungary)
Sebastjana Klepec & Lea Cirnski (Echo, Slovenia)
Svetlana Nikolova (Association Agrolink, Bulgaria)
Daniel Lesinsky (CEPA, Friends of the Earth, Slovakia)
Borivoj Sarapatka & Jiri Urban (Palacký University & Pro-Bio, Czech Republic)
Lars Neumeister (PAN Germany, Germany)
Cover: © Lars Neumeister
© 2004 by Pesticide Action Network Germany. Permission is granted to reproduce any and all portions of this report, provided the publisher, title and author are acknowledged.
Pesticide Use and Agriculture – Facts and Figures
.......................................... Pesticide Action Network Germany 3
Table of Contents 1 Introduction...................................................................................................................... 5
2 Agriculture in Central and Eastern European Countries................................................. 6
2.1 Farming Structure............................................................................................................ 7
2.2 Agricultural Production .................................................................................................. 11
3 Evaluation of Registered Pesticides .............................................................................19
4 Pesticide Use ................................................................................................................22
5 Monitoring of Pesticide Residues..................................................................................29
6 Pesticide Relevant Legislation ......................................................................................37
7 Sources .........................................................................................................................43

Pesticide Use and Agriculture – Facts and Figures
.......................................... 4 Pesticide Action Network Germany
List of Tables Table 1 Key features of agriculture in EU-15 and CEE-10 countries .............................................6 Table 2 Farm Structure Bulgaria in 1999/2000...............................................................................8 Table 3 Farm Structures in the Czech Republic in 2000................................................................8 Table 4 Farm Structures in Hungary in 2000..................................................................................9 Table 5 Farm Structures in Poland 1996 and 2000 in comparison ............................................. 10 Table 6 Farm Structures in Slovakia in 2001............................................................................... 10 Table 7 Utilized agricultural area and number of farm holdings in Slovenia by size
in the 2000 and 2003 ..................................................................................................... 11 Table 8 Share of the Average Value of Production (1998-1999) - Bulgaria ................................ 12 Table 9 Acreage, yield and production of the major cultivated crops in the Czech Republic
in 2001 ............................................................................................................................ 12 Table 10 Crop production in Hungary 2002................................................................................... 14 Table 11 Agricultural land in Slovakia - 2001(Mill ha) ................................................................... 15 Table 12 Crops on arable land in Slovakia - 2001......................................................................... 15 Table 13 Agricultural land usage by farm type in Slovenia in 2000............................................... 16 Table 14 Arable land usage by farm type in Slovenia in 2000 ...................................................... 16 Table 15 Harvested area, yield and production of major cultivated crops in 2002 in Slovenia ..... 16 Table 16 Number of organic farms in Slovenia ............................................................................. 17 Table 17 Pesticide use (formulated product) by region and use type in Bulgaria 2000-2002....... 23 Table 18 Total pesticide use and intensity by crop 2002............................................................... 24 Table 19 Hectare treated by pesticides in Hungary 2000.............................................................. 26 Table 20 Treated areas by farm type and use type in Hungary 2000 ........................................... 26 Table 21 Treated area by land use type and farm type................................................................. 26 Table 22 Pesticide residue in apples (mg/kg) in 2001 – Czech Republic ..................................... 30 Table 23 Pesticide residues in foods in Hungary in 2000 (%)....................................................... 31 Table 24 Pesticide residues in drinking water in Hungary in 2000................................................ 31 Table 25 Pesticide residues measured in foodstuffs, Slovakia - VUP 2003.................................. 32 Table 26 Pesticide residues in Slovakian water 2000-2003.......................................................... 33 Table 27 EU legislation on plant protection products and complying national legislation in the
Czech Republic............................................................................................................... 38
List of Figures Figure 1 Percentage of farm holdings smaller than 50 ha and their share of agricultural land
(2000/2001)........................................................................................................................7 Figure 2 Pesticide Usage in Bulgaria (kg formulated product) 2000-2002................................... 22 Figure 3 Pesticide use by co-operatives and corporations in Hungary 1995-2002
(tonnes formulated product)............................................................................................ 25 Figure 4 Pesticide intensity (kg ai/ha) in Poland 1991-2002......................................................... 27 Figure 5 Pesticide Use in Slovakia (tons AI) 1991-2001 .............................................................. 28 Figure 6 Intensity of Pesticide Use in Slovakia 1991-2002 (kg/ha) .............................................. 28 Figure 7 Pesticides – wholesale on the Slovene market (kg of active ingredient) 1997-2002 ..... 29 Figure 8 Results of monitoring pesticide residues in Slovenian foodstuffs in year 2001.............. 35 Figure 9 Results of monitoring pesticide residues in agricultural products in the year 2001........ 35
Pesticide Use and Agriculture – Facts and Figures
.......................................... Pesticide Action Network Germany 5
PAN Germany’s Publications: This brochure is part of PAN Ger-many’s Project on NGO capacity building in Central and Eastern European Countries (CEEC). A series of publications about pes-ticides in Hungary, Poland, Slo-venia and the Czech Republic were published in 2003. These four publications focus on the evaluation of authorised pesti-cides regarding their human and environmental toxicity. More information on pesticide regu-lation in the European Union and a critical review can be found in PAN Germany’s Pesticide Action Handbook. The brochure Moving towards Pesticide Reduction …realising Best Agricultural Practice in Central and Eastern Europe pre-sents an overview of different con-cepts such as GAP and ICM, and indicates the steps necessary to move farmers away from ‘bad prac-tices’ to good and best practices. Both publications are also available in Russian and Polish. Separate publications on the PIC and POPs Convention were pub-lished by PAN Germany in English, German and Russian. All publica-tions are available at:
www.pan-germany.org
1 Introduction
Dependence on synthetic pesticides is one of the most adverse aspects of intensive agriculture. In Western Europe pesticide dependency has lead to negative impacts on health and environment but also on farm economy.
The political change in Central and Eastern Europe (CEE) 15 years ago had a deep impact on agricul-ture. In the transition period, the agricultural pro-duction declined dramatically and use of pesticides dropped significantly. The EU accession in 2004 and 2007 will also have a strong influence on agri-cultural structures and production in Central and Eastern European countries. Currently, agriculture in the CEE-10 countries, including the candidate countries Bulgaria and Romania, is characterized by a high share of employment, low input of pesti-cides and fertilizers and lower yield compared to the EU-15 countries (see table 1).
There is much fear that traditional means of farm-ing in CEE will be replaced by industrial farming systems with a high dependency on agrochemical usage with all the negative side effects. On the other hand, the EU accession offers the countries possibilities to support organic agriculture, maintain extensive farming and ensures ecologically sound and socially just rural development.
Within the scope of the Common Agricultural Pol-icy (CAP) the EU will distribute about € 13 billion in subsidies among the 10 new member states (in-cluding Cyprus and Malta) until 2006, in order to support agricultural and rural development.
Time will tell how governments and farmers in the new member states will use these oppor-tunities.
This publication provides an overview of available information on agricultural structures and food production, as well as the pesticide use in plant protection and pesticide monitoring data, in Central and Eastern Europe countries. The overview focuses on the five largest new member states and neighbouring countries to the EU-15: Poland, Slovenia, Slovakia, Hungary and the Czech Republic. It is also includes the candidate country Bulgaria, which is scheduled to join the EU in 2007. It also provides an overview of the relevant pesticide legal framework of these countries.

Pesticide Use and Agriculture – Facts and Figures
.......................................... 6 Pesticide Action Network Germany
The publication allows the comparison of the “facts & figures” of these CEE countries to enable analysis of the similarities and differences. It also can be used as a reference to the state-of-the-art and to trace and monitor future developments. The data collection was based upon national reports prepared by non-governmental organisation (NGOs) in the countries. Beside this publication, a series of fact sheets were published, which summarize the information country-related and provide suggestions for possible NGO action. The fact sheets are available in English and national languages as hard copies or as downloads under www.pan-germany.org and at the partner CEE-NGOs.
Table 1 Key features of agriculture in EU-15 and CEE-10 countries
Parameter EU-15 CEE-101
Agricultural employment (thousands of people; 2000) 7,100 8,900Share of agriculture in total employment (%; 2000) 4.3 21.4Utilised agricultural area (thousands of ha2) 130,000 59,000Share of agricultural area in total area (%; 2000) 40.2 54.6Share of organically farmed land in agricultural area (%; 2002) 3.8 0.85Cereal yield (tons/ha; average for 2000-03) 5.5 3.0Use of pesticides (kg of active ingredients/ha; 2001) 2.3 0.6Use of nitrogen fertiliser (kg/ha; 2002) 63 361 Bulgaria, Czech Republic, Estonia, Hungary, Latvia, Lithuania, Poland, Rumania, Slovakia, Slovenia Source: Friends of the Earth (2004): EU Enlargement and Agriculture: Risk and Opportunities
2 Agriculture in Central and Eastern European Countries
The political change in Central and Eastern European (CEE) countries 15 years ago had a deep impact on agriculture. The centrally planned economies broke down and market economy developed. In this transition period the agricultural production declined drastically and use of inputs dropped significantly.
State collective farms and industry collapsed and were privatised. Millions of small farms were established and in many CEE countries the average farm size is below 10 ha. The often semi-subsistent economies relieved state budgets and prevented starvation and hun-ger on a larger scale.
In many CEE countries agriculture plays a major role. In Bulgaria for example, the gross value added of agriculture amounted to € 2,054 million in 2000, with agriculture’s contribu-tion to total national GDP being equivalent to around 16% (compared to 2 % in the EU-15 and 4.5 % for the 10 new MS and the two candidate countries), reflecting the continued importance of agriculture.
In 1998 about 795,000 people worked in agriculture, fishing and forestry in Bulgaria, corre-sponding to 26.2 % of total employment. The average in the 10 new MS and the two candi-date countries was 22 % and for the EU-15 it was 4.3 % at the same time (EC, 2000a).

Pesticide Use and Agriculture – Facts and Figures
.......................................... Pesticide Action Network Germany 7
2.1 Farming Structure
During the transition period, land reforms and privatisations of collective and state farms lead to a tremendous change in the transition countries. Million of very small farms culti-vated by individual persons, but also big corporations, were established. In the Czech Re-public and the Republic of Slovakia for example, larger farmers dominate. 76% and 83% of the agricultural land, respectively, is now cultivated by farmers with holdings of over or about 500 ha. In Bulgaria 1 % of the farmers cultivate 80 % of the land on holdings with an average size of about 500 ha, but there are also some 755 000 individual farmers working on average on 0.9 ha. Figure 1 shows the distribution for four countries, the next chapters show the farming structure in the selected countries in detail.
0102030405060708090
100
CzechRepublic
Hungary Poland Slovakia Slovenia
%
% of holdings % of land
Figure 1 Percentage of farm holdings smaller than 50 ha and their share of agricultural land
(2000/2001) Bu lga r i a In the 1990’s Bulgarian agriculture was transformed from an industry based upon huge agro-industrial complexes into a sector based upon private individual farmers, co-operatives and farming companies. Over 95% of all agricultural land is now in private ownership. How-ever, there is a huge division within the structure of the private farming sector. Almost 74% of the land is run by a small number of big private trade (1% of all) or cooperative entrepre-neurships, mainly producers of grain or industrial crops. The average utilized agricultural area (UAA) of the cooperative land is around 600 ha. At the same time the vast majority of farmers (99% of all) produce to meet their own needs.

Pesticide Use and Agriculture – Facts and Figures
.......................................... 8 Pesticide Action Network Germany
Table 2 Farm Structure Bulgaria in 1999/2000
Type of farm Number of farms
in % of
total
Area in ‘000
ha
% of total
Average size in ha
Not registered individual persons 755 300 99 708 20 0.9 Private holdings not included 36 200 5 226 6 6.2 Juridcial entities 5 400 1 2 893 80 535.7 Cooperatives not included 3 125 0.4 2 218 62 709.8 Total 760 700 100 3 601 100 4.7
Source: Farm Structures in Bulgaria in 1999/2000, Bulletin N14, Bulgarian Ministry of Agriculture
Czech Repub l i c Unlike other countries in transition, agriculture in the Czech Republic is not characterized by small scale farming.
The current structure of farms is the result of the privatisation program, including a land reform, which was implemented between 1992 and 1994, the de-collectivisation of coopera-tives and the privatisation of state farms. The privatisation method very much shaped the outcome. Three cases have to be distinguished with regard to ownership of land:
a) land that was expropriated and became state property;
b) land that was collectivised (formal ownership had been kept) and
c) land that became the new property of collective farms (this is actually very rare).
The average holding belonging to a natural person consists of about 18 ha of cultivated farm land, 5.9 cattle and 7.2 pigs. The workforce is on average 0.5 persons with farming as their major occupation and 1.4 persons with farming as a subsidiary or seasonal occupa-tion. The much larger holdings with a legal form cultivate on average 886 ha of farmland and keep 414 cattle and 1,017 pigs. The employment here is 42.8 persons on a permanent basis and 10.4 persons on a subsidiary or seasonal occupation basis (EC, 2002).
Table 3 Farm Structures in the Czech Republic in 2000
Size Number of holdings
% of total number of holdings
Hectares of agricultural land
% of ha
<10 ha 41 012 72.6 90 259 2.510-50 ha 9 724 17.2 209 213 5.7
50-100 ha 1 844 3.3 128 596 3.5100-500 ha 2 007 3.6 444 410 12.2
> 500 ha 1 900 3.4 2 770 691 76.1Total 56 487 3 643 168
Source: Agrocensus 2000

Pesticide Use and Agriculture – Facts and Figures
.......................................... Pesticide Action Network Germany 9
Hungary The economic and social changes of the nineties have radically transformed the organisa-tional and ownership structures of agriculture in Hungary. Due to the changes in the owner-ship structure, 86% to 88% of arable land (and 41% of forests) is now privately owned.
Between 1990 and 2000 the number of agricultural organisations increased more than twelve-fold. The dominant type of business is the one without a legal personality (general partnerships, deposit companies and private enterprises) with a 76% ratio.
Agriculture is characterised by a high number of small holdings and also by the dominance of very large farms. 96% of the enterprises employ less than 20 persons, while the share of organisations with over 250 persons does amounts to less than 1%. Large scale enter-prises (> 1000 hectares) covers more than 46% of agricultural area.
Table 4 Farm Structures in Hungary in 2000
Size Number of holdings
% of total number Hectares % of ha Average
size in ha<10 ha 874 808 94.05 869 576 14.21 1.0
10-50 ha 45 009 4.84 929 789 15.20 20.750-100 ha 5 212 0.56 358 746 5.86 68.8
100-300 ha 3 311 0.36 567 524 9.28 171.4300-500 ha 549 0.06 225 885 3.69 411.4
500-1000 ha 440 0.05 322 777 5.28 733.61000-5000 ha 781 0.08 1 528 453 24.98 1957.0
5000-10000 ha 33 0.00 202 316 3.31 6130.810000- ha 30 0.00 1 113 097 18.19 37103.2
Total 930 173 100.00 6 118 163 100.00 6.6
Source: Central Statistics Office, General Agricultural Census, 2000 (Farm: household with some agricultural activity, as defined in the Hungarian Law on Statistics)
Po l a n d Polish agriculture differs from agriculture in European Union and post communist -countries. Due to numerous historical circumstances, it is also diversified from the West to the East and from the South to the North of Poland. There are prosperous regions with fer-tile soils and a high level of intensive agricultural production.
The number of people employed in the agricultural economy, hunting and forestry is 2.742.000 people (18.9%) in total, referring to the overall employment in the year 2000. On the other hand, the percentage of unemployed people living in rural areas was 43.7% in 2000. At the same time, the average percentage of unemployed people in Poland was 15% (all data in this paragraph are taken from the Ministry of Agriculture and Rural Develop-ment).
In the West and in the North farms are usually bigger compared to the ones in the South and in the East. In the year 2000 the average acreage of a polish farm was 9.6 hectares (with 8.5 ha of arable land), compared to an average acreage of 18.4 hectares in the EU (in the year 1999).

Pesticide Use and Agriculture – Facts and Figures
.......................................... 10 Pesticide Action Network Germany
Table 5 Farm Structures in Poland 1996 and 2000 in comparison
Size of holdings (ha) No. of holdings (‘000) Arable land of the holdings ha (‘000)
1996 2000 1996 20001 - 2 462 448 651 6452 - 3 282 270 690 6513-5 386 345 1 509 1 336
5-10 521 448 3 713 3 18310-15 217 185 2 631 2 24615-20 89 83 1 530 1 44220-30 56 62 1 323 1 47830-50 19 27 719 997
50 and more 9 12 1 493 1 532Total 2041 1880 14 259 13 510
Source: Ministry of Agriculture and Rural Development
S lo v ak ia Similar to the Czech Republic, the farming structure in Slovakia is dominated by large corporate farms. Almost 83% of the land is cultivated by 1 075 larger farms with areas over 500 ha. On the other hand, there are some 32 000 farmers with areas below 10 ha. Table 6 Farm Structures in Slovakia in 2001
Size Number of holdings
% of total number of holdings
Hectares of agri-cultural land % of ha
<10 ha 32 304 88.8 60 598 2.510-50 ha 1 829 5.0 64 882 2.7
50-100 ha 486 1.3 43 101 1.8100-500 ha 704 1.9 249 736 10.2
> 500 ha 1 075 3.0 2 020 533 82.8Total 36 398 2 438 850
Source: Farm Structure Census 2001, Slovakia
S lo v en ia Farming in Slovenia is characterized by its small holdings. The average size of agricultural holding is about 6.2 ha and only 15% of them are larger than 10 ha. Over 77 000 small and mostly part-time private family farms that own at least about 94% of agricultural land, pro-duce 75% of the total agricultural output. The remaining 6% are cultivated by large agricul-tural companies (MAFF 2001a).
84% of agricultural holdings are smaller than 10 ha and they own 53% of agricultural land. 96% of agricultural holdings are smaller than 20 ha. 80% of agricultural land is owned by holdings that are smaller than 20 ha. Small scale farming results in lower competitiveness of Slovene agriculture in comparison to that of Europe. This is also the reason why almost 50% of farms also obtain income from non-agricultural activities (MAFF 2001a).
The average size of agricultural holdings is increasing; in the year 2000 it was 5.6 ha and in 2003 it was 6.2 ha. In 2000, the average size of agricultural enterprise was 288 ha. Despite

Pesticide Use and Agriculture – Facts and Figures
.......................................... Pesticide Action Network Germany 11
the decrease in the amount of agricultural land in Slovenia, yields are increasing due to higher intensity of agricultural production (MESPA 2001a, p. 2).
Table 7 Utilized agricultural area and number of farm holdings in Slovenia by size in the 2000 and 2003
Farm Size Number ofholdings
% of total number of holdings Area (ha) % of ha
< 1 ha 5 403 7.00 3 049 0.631 – 3 ha 22 219 28.80 43 092 8.963 – 5 ha 16 777 21.75 65 713 13.66
5 – 10 ha 20 631 26.74 145 157 30.1810 – 20 ha 9 695 12.57 130 261 27.0820 – 50 ha 2 202 2.85 59 859 12.44
50 – 100 ha 148 0.19 9 586 1.99> 100 ha 71 0.09 24 317 5.06
Total 77 146 100 481 034 100
Source: Statistical Office of the Republic of Slovenia (2003b)
2.2 Agricultural Production Until 1989, the agricultural production in the CEE countries showed similar yields to West-ern Europe. After the political change, subsidies for fertilizers and pesticides were abol-ished, land was privatized and thousand of small holdings were established. In conse-quence, the agricultural production decreased significantly. In 1998 yields were still 30-50 percent lower in comparison with the European Union (Pouliquen, 2001) . Bulgaria With regard to trade, Bulgaria is one of the few Candidate Countries with a positive agricul-tural trade balance. Trade in agricultural products accounts for 10.5 % of total national ex-ports and 6.2 % of total imports. While total trade is mainly with the EU-15 (accounting for 49 % of Bulgarian exports and 44 % of its imports over the period 1997-2000), agricultural trade with the EU accounted for a more limited share of 33 % of Bulgarian agricultural ex-ports and 42 % of its agricultural imports over the same period.
Although much decreased in size, livestock production still dominates over crop production, which has also fallen heavily during the transition process.
In 1992, an area of around 3.2 million ha was planted with crops. This crop area was re-duced to around 2.6 million ha by the year 2000, mainly driven by reductions in the areas planted with wheat, barley and maize, although the overall crop area is expected to have increased again in 2001 to around 2.8 million ha. The main crops in Bulgaria, in terms of the area planted, are wheat, maize, barley, sunflower and fruit (EC, 2002a).

Pesticide Use and Agriculture – Facts and Figures
.......................................... 12 Pesticide Action Network Germany
Table 8 Share of the Average Value of Production (1998-1999) - Bulgaria
Products in % of total Cereals 12.0%
• Wheat 6.1% • Barley 1.4% • Maize 4.1% • Oat 0.1% • Rye 0.1% • Other cereals 0.1%
Sunflower seeds 3.0% Vegetables 14.7% Potatoes 3.4% Fruits 6.7% Milk 12.5% Beef 5.6% Pork 16.7% Eggs 3.0% Poultry 4.2% Sheep meat 5.5%
Source: Eurostat
Czech Republic Agricultural land represents 54,2% of the total land area in the Czech Republic. In 2001 less favourable areas were precisely described and they account for 60,3% of agricultural land.
The Czech Republic has a negative agricultural trade balance. Agricultural trade accounts for 4.4 % of total exports and 5.7 % of total imports. While total trade is mainly with the EU (more than 60 % of all trade), agricultural trade with the EU has a more limited share of 48.4 % of Czech imports and only 36.4 % of Czech exports. The highest proportion of agri-cultural exports goes to other CEECs.
Table 9 Acreage, yield and production of the major cultivated crops in the Czech Republic in 2001
Crop Harvested Area (´000 ha)
Yield (t/ha) Production (´000 t)
Cereals together 1 623.6 4.52 7 337.6 Wheat 923.2 4.85 4 476.1 Rye 40.1 3.72 149.3 Barley 495.1 3.97 1965.6 Oats 47.8 2.85 136.4 Maize 61.9 6.60 408.7 Legumes together 37.2 2.46 91.4 Potatoes together 54.1 20.88 1 130.5 Sugar beet 77.7 45.41 3 529.0 Fodder root crops 6.0 36.73 219.4 Oilseed crops together 432.3 2.50 1078.8

Pesticide Use and Agriculture – Facts and Figures
.......................................... Pesticide Action Network Germany 13
Table 9 Acreage, yield and production of the major cultivated crops in the Czech Republic in 2001
Crop Harvested Area (´000 ha)
Yield (t/ha) Production (´000 t)
Rape 343.0 2.84 973.3 Poppy 33.2 0.64 21.3 Flax (stems) 6.6 2.70 17.7 Annual fodder crops 288.7 28.46 8 216.5 Perennial fodder crops (hay) 373.5 6.02 2 250.0 Vegetables 26.0 16.2 421.2 Hops 6.1 1.09 6.6 Grapevine 11.3 6.04 68.3 Perennial meadows 656.6 3.27 2 148.3 Pastures 283.6 2.37 671.7 Fruits together 30.6 9.69 296.3 Source: Ministry of Agriculture - Statistics, 2002
Hungary
In the year 2000, agriculture contributed 4.2% to the gross added value, while in 1990 it had amounted to 14.5%. Its share of the gross domestic product (GDP) decreased from 12.5% to 3.7% between 1990 and 2000. The sector was also unable to maintain its excellent for-eign trade position. Agriculture and food industry had a share of 23.1% in 1990, 8% in 2000 and 7.5% in 2001 in total exports.
Among the productive sectors it is only the export of food products that has maintained a positive trade balance, although there have been fluctuations depending on the commodity stock. Taking into consideration the tendencies of the 1990s, agriculture plays a very impor-tant role in the trade balance.
The share of agriculture and food industry in exports still exceeds the corresponding indica-tors of the EU (6.2% in 2000) and most of the accession countries. The proportion of im-ports of agricultural and food industry products within total imports, is the lowest in Hungary (3.4% in 2000) compared to the EU Member States (5.7% in 2000) and the accession countries. The trade balance of Hungary with regard to agricultural and food industry prod-ucts is positive (HUF 403 039 million in 2001). The self-subsistence rate of Hungarian agri-culture is 120%.
The employment rate in agriculture dropped significantly, from 17.5% in 1990 (955 thousand people) to 6.3% in 2001 (243.4 thousand people). According to the General Agri-cultural Census (GAC) in 2000, 20.3% of the total population, that is, 23.7% of the working age population, is engaged in some agricultural activity (as a hobby, complementary, sub-sistence or of a main employment character). This means that agriculture is outgrowing its economic framework. It plays a considerable role in preserving the rural values and devel-oping the rural areas, in shaping the rural community, in the subsistence of the non-agricultural rural population and in reducing social problems and regional disparities (EC, 2002c).
Table 10 shows the area planted with major crops in Hungary and the yields in 2002.

Pesticide Use and Agriculture – Facts and Figures
.......................................... 14 Pesticide Action Network Germany
Table 10 Crop production in Hungary 2002
Denomination Area (1000 hectares)
Share of agricul-tural area (%)
Total production (1000 tons) Yields (t/ha)
Cereals 2 975 50.7 11 630 -• wheata) 1 112 18.9 3 896 3.51• maize 1 238 21.2 6 087 5.07
Tobacco 5.4 0.1 11.3 2.01Sunflower 421 7.2 779 1.86Potatoes 34 0.6 745 19.58Lucerne hay 161 2.7 700 4.51Vegetablesb) 114.6c) 2.0 1 850 -Grass 1 063 18.1 - -Source: Hungarian Central Statistical Office a) with durum-wheat; b) on arable land; c) harvested area
Poland Agriculture plays still an important role in the Polish economy. However, during the last decade a decreasing share of farming in the GDP has been observed (in 1988 – 11.8% of GDP, in 1994 - 6.4% of GDP and 2001 only 3.3%).
Cereals and potatoes are the most cultivated plants in Poland. Cereals with corn make up about 70.3% of the total area. The crop yields of cereals are quite low: about 2.83 t/ha. Po-land is the second largest producer of potatoes in Europe with crop yields of 19.4 t/ha in 2000, which accounts about for 10.1% of the total plant production in Poland. Some of the potatoes are processed into potato starch, but they are mainly used for human consumption and livestock feeding. Rapeseed and sugar beets are the other two important crops in Po-land. Vegetable production accounts for 2% of the total production and it takes up 250 100 ha. The main products are: cabbage, cauliflowers, onions, carrots, red beets, cucumbers and tomatoes.
Slovakia From a total area of 4.9 million hectares, utilised agricultural area (UAA) represents 2.44 million hectares or 49.8 % of the total territory, this being equivalent to 4.2 % of the total for the 10 new MS and the two candidate countries. Arable land represents around 60 % of UAA, while pastures and meadows account for approximately 35 %. This distribution of agricultural area has remained fairly stable since 1994.
In Slovakia the gross value added of agriculture amounted to € 560 million in 2000 (equal to 3 % of that of the 10 new MS and the two candidate countries, but only 0.3 % of that of the EU-15). Agriculture’s contribution to total national GDP was equivalent to around 4.5 % (compared to 2 % in the EU-15), reflecting the industry- and service-oriented nature of Slo-vakia’s economy. The contribution of agriculture to national GDP is declining (in 1995 agri-culture contributed around 5.7 % of GDP).
The most important partners in terms of agricultural trade are other CEECs (particularly the Czech Republic), with trade with other CEECs accounting for around 59 % of Slovakia’s agricultural exports averaged over the years 1997 to 2000, and 41 % of Slovakia’s agricul-

Pesticide Use and Agriculture – Facts and Figures
.......................................... Pesticide Action Network Germany 15
tural imports. The EU-15 is the second most important agricultural trade partner, accounting for 23 % of Slovakia’s agricultural exports and almost 39 % of its imports over the same period.
The most important crops by area used are wheat, barley, maize and the oilseeds rapeseed and sunflower. While cereals remain the most important crops, accounting for the clear majority of crop area, the oilseeds area has increased in importance over the 1994-2001 period and accounts for the majority of the slight increase in overall crop area over this pe-riod.
Table 11 Agricultural land in Slovakia – 2001 (Mill ha)
Agricultural Land Usage Area Arable land 1 441 Meadows and pasture land 874 Gardens 77 Vineyards 27 Orchards 18 Hop-fields 1 Agriculture land 2 439
Source: Statistical Yearbook
Table 12 Crops on arable land in Slovakia - 2001
Crop Area Cereals 713 597 Fodder crops 174 659 Maize 137 065 Rape 105 292 Green maize 101 836 Sunflower 62 968 Field vegetables 44 768 Sugar beet 30 902 Potatoes 23 580 Pulses 16 102 Soya 6 430 Other 5 022 Feeding root-crops 4 535 Poppy seeds 2 113 Tobacco 1 235 Total 1 430 104 Source: Statistical Yearbook
Pesticide Use and Agriculture – Facts and Figures
.......................................... 16 Pesticide Action Network Germany
Slovenia
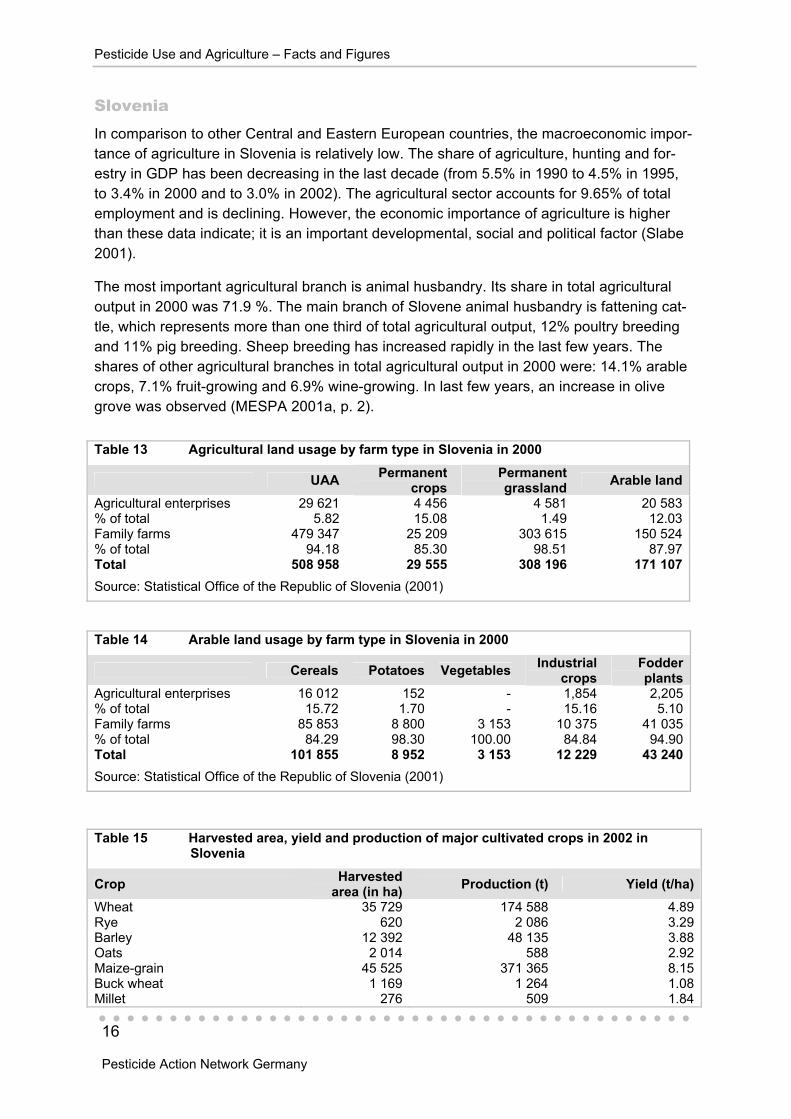
In comparison to other Central and Eastern European countries, the macroeconomic impor-tance of agriculture in Slovenia is relatively low. The share of agriculture, hunting and for-estry in GDP has been decreasing in the last decade (from 5.5% in 1990 to 4.5% in 1995, to 3.4% in 2000 and to 3.0% in 2002). The agricultural sector accounts for 9.65% of total employment and is declining. However, the economic importance of agriculture is higher than these data indicate; it is an important developmental, social and political factor (Slabe 2001).
The most important agricultural branch is animal husbandry. Its share in total agricultural output in 2000 was 71.9 %. The main branch of Slovene animal husbandry is fattening cat-tle, which represents more than one third of total agricultural output, 12% poultry breeding and 11% pig breeding. Sheep breeding has increased rapidly in the last few years. The shares of other agricultural branches in total agricultural output in 2000 were: 14.1% arable crops, 7.1% fruit-growing and 6.9% wine-growing. In last few years, an increase in olive grove was observed (MESPA 2001a, p. 2).
Table 13 Agricultural land usage by farm type in Slovenia in 2000
UAA Permanent crops
Permanent grassland Arable land
Agricultural enterprises 29 621 4 456 4 581 20 583% of total 5.82 15.08 1.49 12.03Family farms 479 347 25 209 303 615 150 524% of total 94.18 85.30 98.51 87.97Total 508 958 29 555 308 196 171 107Source: Statistical Office of the Republic of Slovenia (2001)
Table 14 Arable land usage by farm type in Slovenia in 2000
Cereals Potatoes Vegetables Industrial crops
Fodder plants
Agricultural enterprises 16 012 152 - 1,854 2,205% of total 15.72 1.70 - 15.16 5.10Family farms 85 853 8 800 3 153 10 375 41 035% of total 84.29 98.30 100.00 84.84 94.90Total 101 855 8 952 3 153 12 229 43 240Source: Statistical Office of the Republic of Slovenia (2001)
Table 15 Harvested area, yield and production of major cultivated crops in 2002 in Slovenia
Crop Harvested area (in ha) Production (t) Yield (t/ha)
Wheat 35 729 174 588 4.89Rye 620 2 086 3.29Barley 12 392 48 135 3.88Oats 2 014 588 2.92Maize-grain 45 525 371 365 8.15Buck wheat 1 169 1 264 1.08Millet 276 509 1.84
Pesticide Use and Agriculture – Facts and Figures
.......................................... Pesticide Action Network Germany 17
Table 15 Harvested area, yield and production of major cultivated crops in 2002 in Slovenia
Crop Harvested area (in ha) Production (t) Yield (t/ha)
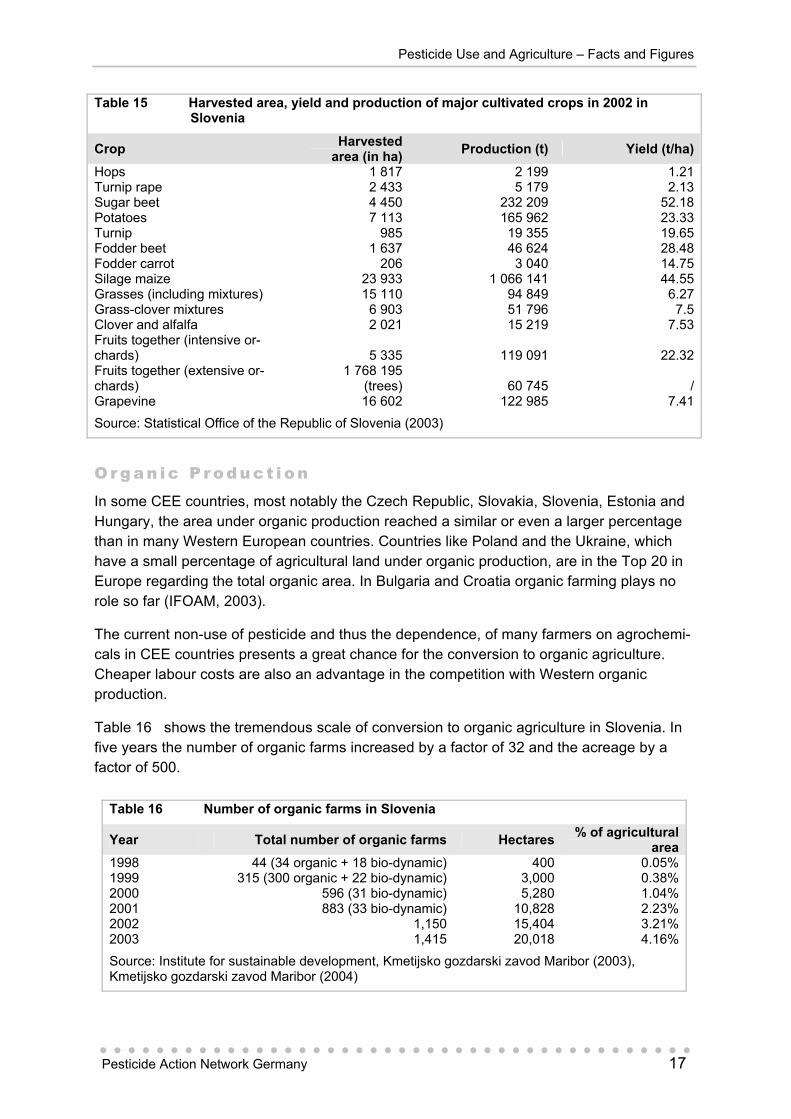
Hops 1 817 2 199 1.21Turnip rape 2 433 5 179 2.13Sugar beet 4 450 232 209 52.18Potatoes 7 113 165 962 23.33Turnip 985 19 355 19.65Fodder beet 1 637 46 624 28.48Fodder carrot 206 3 040 14.75Silage maize 23 933 1 066 141 44.55Grasses (including mixtures) 15 110 94 849 6.27Grass-clover mixtures 6 903 51 796 7.5Clover and alfalfa 2 021 15 219 7.53Fruits together (intensive or-chards)
5 335 119 091 22.32
Fruits together (extensive or-chards)
1 768 195 (trees) 60 745 /
Grapevine 16 602 122 985 7.41Source: Statistical Office of the Republic of Slovenia (2003)
O rgan ic P roduc t i on In some CEE countries, most notably the Czech Republic, Slovakia, Slovenia, Estonia and Hungary, the area under organic production reached a similar or even a larger percentage than in many Western European countries. Countries like Poland and the Ukraine, which have a small percentage of agricultural land under organic production, are in the Top 20 in Europe regarding the total organic area. In Bulgaria and Croatia organic farming plays no role so far (IFOAM, 2003).
The current non-use of pesticide and thus the dependence, of many farmers on agrochemi-cals in CEE countries presents a great chance for the conversion to organic agriculture. Cheaper labour costs are also an advantage in the competition with Western organic production.
Table 16 shows the tremendous scale of conversion to organic agriculture in Slovenia. In five years the number of organic farms increased by a factor of 32 and the acreage by a factor of 500.
Table 16 Number of organic farms in Slovenia
Year Total number of organic farms Hectares % of agricultural area
1998 44 (34 organic + 18 bio-dynamic) 400 0.05%1999 315 (300 organic + 22 bio-dynamic) 3,000 0.38%2000 596 (31 bio-dynamic) 5,280 1.04%2001 883 (33 bio-dynamic) 10,828 2.23%2002 1,150 15,404 3.21%2003 1,415 20,018 4.16%Source: Institute for sustainable development, Kmetijsko gozdarski zavod Maribor (2003), Kmetijsko gozdarski zavod Maribor (2004)

Pesticide Use and Agriculture – Facts and Figures
.......................................... 18 Pesticide Action Network Germany
While some CEE countries are export-oriented and have a small domestic market, others such as Slovenia, sell all products on the domestic market and even import organic prod-ucts.
Pesticide Use and Agriculture – Facts and Figures
.......................................... Pesticide Action Network Germany 19
3 Evaluation of Registered Pesticides
In 2003 PAN Germany published four country reports with the title: “Pesticides in Central and Eastern European Countries - Usage, Registration, Identification and Evaluation, Part 1: Poland, Part 2: Hungary, Part 3: Czech Republic, Part 4: Slovenia.
The overall objective of these reports was to give national NGO information on pesticide classifications and regulatory instruments. The goal of the individual reports was
• to characterise the pesticide active ingredients authorized in the individual countries by use type and chemical class,
• to reflect their regulatory status in the European Union and globally, • to evaluate the pesticide active ingredients regarding their human and environmental
toxicity, • to determine their potential as water and food contaminants, • to list regulations addressing pesticides.
The four reports contain lists of all registered active ingredients, their regulatory status and their toxicity classification according to the World Health Organisation (WHO), the European Union, the International Agency for Research on Cancer (IARC), the U.S. Environmental Protection Agency (U.S. EPA) and Cornell University.
Poland
In the year 2001, some 385 pesticide active ingredients, plant growth regulators and other substances used in crop protection were registered in Poland. The evaluation of these sub-stances according to international classifications showed that:
• 7 substances are priority substances or candidates according to the European Water Framework Directive;
• 2 are PIC pesticides; • 154 of the ingredients authorised in Poland are classified by the European Union: 23
as very toxic, 31 as toxic, 69 as harmful and 15 as irritant; • 210 of the ingredients authorised in Poland are classified by the WHO: 4 as
extremely hazardous, 16 as highly hazardous, 40 as moderately hazardous, 57 as slightly hazardous and 102 as unlikely to present hazard in normal use;
• 32 of the ingredients authorised in Poland are cholinesterase inhibitors (ChE); • 121 ingredients authorised in Poland are classified as “Dangerous for the
Environment” and 111 have been assigned the Symbol “N;” • 18 of the ingredients authorised in Poland cause concern for humans due to possible
carcinogenic effects and have been placed in the carcinogenicity category 3 by the EU;
• 4 cause concern for humans, owing to possible mutagenic effects and have been placed in the mutagenicity category 3
• 5 may cause harm to the unborn child and 10 present possible risks of harm to the unborn child.
Pesticide Use and Agriculture – Facts and Figures
.......................................... 20 Pesticide Action Network Germany
With accession to the European Union in 2004 and in compliance with EU Directive 91/414, EC authorisation for 60 active ingredients expired in Poland.
Hungary
In the year 2000, some 360 pesticide active ingredients, plant growth regulators and other substances used in crop protection were registered in Hungary. The evaluation of these substances according to international classifications shows that:
• 7 substances are priority substances according to the European Water Framework Directive;
• 5 are PIC pesticides or PIC candidates; • 7 are extremely hazardous, 15 are highly hazardous, 57 are moderately hazardous,
57 are slightly hazardous and 110 are unlikely to present hazard in normal use, according to the WHO;
• 25 are very toxic, 34 are toxic, 87 are harmful and 19 are irritant according to the European Union;
• 39 of the ingredients authorised in Hungary are cholinesterase inhibitors (ChE); • of the 25 ingredients authorised in Hungary, which are evaluated by the IARC, 7 are
possibly carcinogenic to humans and 18 are considered as not classifiable as carcinogenic to humans;
• 17 of the ingredients authorised in Hungary cause concern for humans due to possible carcinogenic effects and have been placed in the carcinogenicity category 3 by the EU.
• 1 may cause heritable genetic damage; • 10 cause concern for humans owing to possible mutagenic effects and have been
placed into the mutagenicity category 3; and 5 may cause harm to the unborn child and 10 present possible risks of harm to the unborn child
• 141 ingredients authorised in Hungary are classified as “Dangerous for the Environment” and 136 have been assigned the Symbol “N”.
With accession to the European Union in 2004 and in compliance with EU Directive 91/414, EC authorization for 69 active ingredients expired in Hungary.
Czech Republic
In the year 2002, some 340 pesticide active ingredients, plant growth regulators and other substances used in crop protection were registered in the Czech Republic. The evaluation of these substances according to international classifications shows that:
• 131 of the ingredients authorized in the Czech Republic and evaluated are classified by the European Union: 12 as very toxic, 25 as toxic, 70 as harmful and 11 as irritant;
• 19 of the ingredients authorised in the Czech Republic are cholinesterase inhibitors (ChE);
• 18 of the ingredients authorised in the Czech Republic are evaluated by the IARC: 7 as possibly carcinogenic to humans. 11 are considered as not classifiable as carcinogenic to humans;
Pesticide Use and Agriculture – Facts and Figures
.......................................... Pesticide Action Network Germany 21
• 14 of the ingredients authorised in the Czech Republic cause concern for humans due to possible carcinogenic effects and have been placed in the carcinogenicity category 3 by the EU.
• 7 cause concern for humans owing to possible mutagenic effects and have been placed into the mutagenicity category 3;
• 1 is placed in the mutagenicity category 2 and should be regarded as though it were • mutagenic to humans; • 4 may cause harm to the unborn child and 8 represent possible risks of harm to the
unborn child and 4 pose the risk of impaired fertility; • 110 ingredients authorised in the Czech Republic are classified as “Dangerous for
the Environment” and 102 have been assigned with the Symbol “N;” • 191 of the ingredients authorized in the Czech Republic are classified by the WHO: 4
as extremely hazardous, 7 as highly hazardous, 34 as moderately hazardous, 47 as slightly hazardous and 99 as unlikely to represent a hazard in normal use;
• 5 are PIC pesticides or PIC Candidates; • 7 substances are priority substances or candidates according to the European Water
Framework Directive.
With accession to the European Union in 2004 and in compliance with EU Directive 91/414, EC authorisation for 38 active ingredients expired in the Czech Republic.
Slovenia
In the year 2000, some 240 pesticide active ingredients, plant growth regulators and other substances used in crop protection were registered in Slovenia. The evaluation of these substances according to international classifications showed that:
• 99 ingredients authorised in 2000 in Slovenia are classified as “Dangerous for the Environment” and 83 have been assigned the Symbol “N”;
• 17 of the ingredients authorised in Slovenia cause concern for humans due to possible carcinogenic effects and have been placed in the carcinogenicity category 3 by the EU.
• 6 cause concern for humans owing to possible mutagenic effects and have been placed in the mutagenicity category 3.
• 3 may cause harm to the unborn child, • 7 present possible risks of harm to the unborn child, 2 may impair fertility, • 2 present possible risk of impaired fertility and 1 may cause harm to breast-fed
babies. • 23 of the ingredients authorised in Slovenia are evaluated by the IARC: • 7 as possibly carcinogenic to humans. 16 are considered as not classifiable as
carcinogenic to humans; • 128 of the ingredients authorised in Slovenia are classified by the European Union:
18 as very toxic, 22 as toxic, 63 as harmful and 11 as irritant; • 26 of the ingredients authorized in Slovenia are cholinesterase inhibitors (ChE); • 11 substances are priority substances according to the European Water Framework
Directive; • 4 are PIC pesticides or PIC candidates.
Pesticide Use and Agriculture – Facts and Figures
.......................................... 22 Pesticide Action Network Germany
With accession to the European Union in 2004 and in compliance with EU Directive 91/414, EC authorization for 31 active ingredients expired in Slovenia.
4 Pesticide Use
Pesticide use data are available in Slovakia and the Czech Republic, more detailed pesti-cides sales data are available in Slovenia and Hungary. In Bulgaria the National Service for Plant Protection requests pesticide use information from cooperatives and other farmers.
Data indicate that pesticide intensity in the CEE countries is considered to be low compared to Western European countries, but the impact of pesticide use on health and the environ-ment may be higher. Improper use (“bad practices”) and trade in illegal, often unlabelled, pesticides endangers the well being of farmers and their natural environment. Data on the scale of illegal trade are not available and data on residues in food, soil and water are often not available to make an adequate judgement possible.
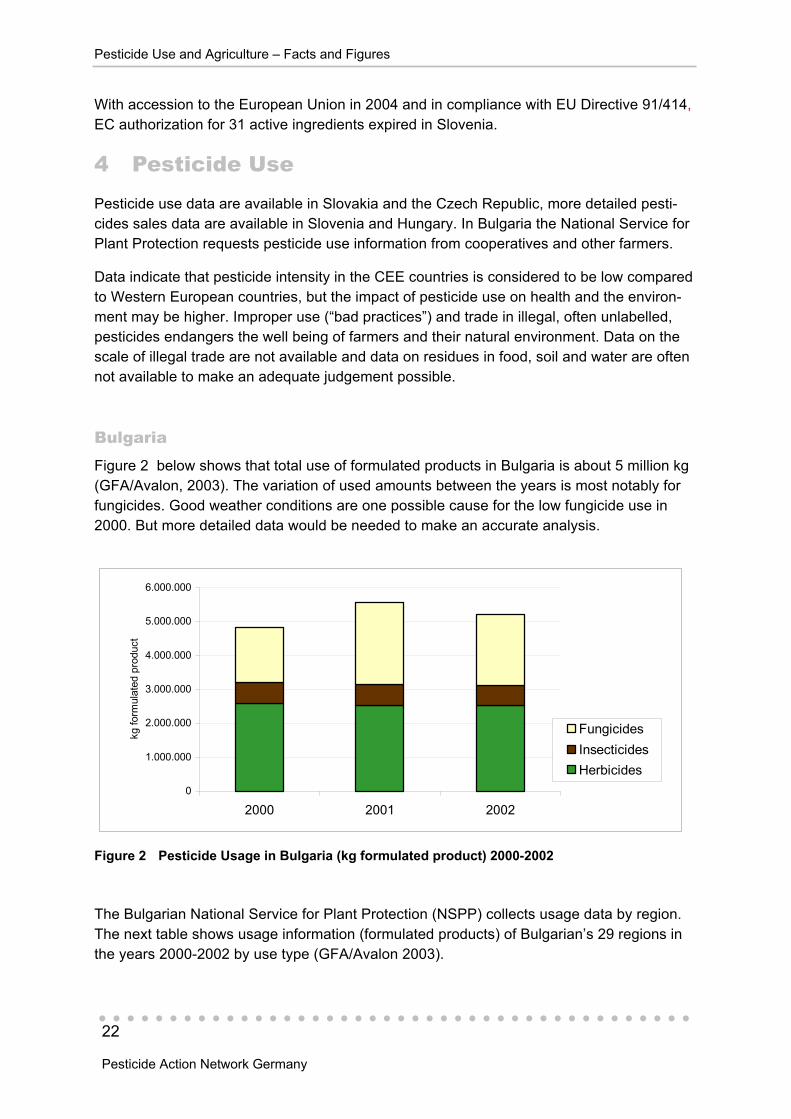
Bulgaria Figure 2 below shows that total use of formulated products in Bulgaria is about 5 million kg (GFA/Avalon, 2003). The variation of used amounts between the years is most notably for fungicides. Good weather conditions are one possible cause for the low fungicide use in 2000. But more detailed data would be needed to make an accurate analysis.
0
1.000.000
2.000.000
3.000.000
4.000.000
5.000.000
6.000.000
2000 2001 2002
kg fo
rmul
ated
pro
duct
FungicidesInsecticidesHerbicides
Figure 2 Pesticide Usage in Bulgaria (kg formulated product) 2000-2002
The Bulgarian National Service for Plant Protection (NSPP) collects usage data by region. The next table shows usage information (formulated products) of Bulgarian’s 29 regions in the years 2000-2002 by use type (GFA/Avalon 2003).

Pesticide Use and Agriculture – Facts and Figures
.......................................... Pesticide Action Network Germany 23
Table 17 Pesticide use (formulated product) by region and use type in Bulgaria 2000-2002
Herbicides Insecticides Fungicides NSPP Regions 2000 2001 2002 2000 2001 2002 2000 2001 2002
Dobrich 486 000 495 000 489 000 79 000 89 000 85 000 129 000 135 000 133 000
Bourgas 147 000 136 000 186 000 23 000 22 000 29 000 321 000 296 000 340 000
Silistra 168 000 162 100 164 300 48 000 53 200 46 800 43 000 41 400 44 200
Rousse 116 751 110 483 154 030 14 315 17 060 25 909 23 228 19 765 42 474
Pleven 188 613 157 690 146 860 35 297 34 268 36 475 60 113 58 825 53 940
Varna 165 500 157 200 142 500 6 400 5 900 5 150 187 500 167 300 154 200
Shoumen 125 300 137 500 132 400 2 010 2 200 1 960 12 700 13 500 14 300
Plovdiv 135 200 120 900 128 300 117 300 111 500 114 400 113 720 110 500 111 000
Vratza 97 685 123 782 104 662 27 371 25 056 10 287 85 719 105 780 136 439
Stara Zagora 139 200 112 400 104 200 19 800 17 900 15 300 67 500 65 800 61 500
Veliko Tarnovo 56 820 52 600 96 100 5 300 6 000 17 970 29 300 32 000 26 500
Razgrad 166 889 154 388 83 732 24 550 12 320 7 793 8 898 24 300 20 697
Yambol 64 600 91 715 81 617 15 200 19 050 14 946 50 100 41 360 50 325
Sliven 113 400 91 200 79 300 14 000 12 300 9 400 102 100 75 500 69 000
Targovishte 74 650 63 000 70 824 2 840 2 260 4 215 36 440 39 650 38 422
Pazardjik 70 000 56 700 61 000 82 000 60 500 58 200 120 000 896 000 496 000
Haskovo 27 820 29 100 52 800 15 100 15 900 16 500 72 340 75 280 76 300
Vidin 31 680 48 760 43 750 4 520 5 080 6 300 12 350 13 120 14 200
Sofia-region 47 150 43 370 42 700 4 520 5 200 3 900 6 100 9 150 7 500
Montana 68 700 56 224 38 600 7 100 6 365 6 200 45 779 65 150 37 500
Lovetch 42 422 40 773 31 610 9 973 8 900 3 600 20 174 20 832 15 687
Pernik 12 490 27 328 28 450 3 272 1 928 1 586 1 642 8 557 10 173
Blagoevgrad 15 400 21 605 27 320 21 750 32 360 27 870 23 500 60 800 75 500
Gabrovo 19 800 19 215 22 500 510 1 612 362 1 610 1 920 1 122
Smolyan 3 000 3 500 7 600 11 310 10 043 12 945 13 400 24 810 34 400
Kustendil 8 477 9 258 7 325 6 626 6 025 5 982 11 458 18 208 18 683
Sofia-town 5 390 5 530 6 980 122 120 106 2 428 2 530 2 825
Kardjali 200 287 930 9 067 18 230 9 030 8 442 8 930 10 237 TOTAL in 1000 kg 2 598 2 528 2 535 610 602 577 1 610 2 432 2 096
Source: GFA/Avalon, 2003

Pesticide Use and Agriculture – Facts and Figures
.......................................... 24 Pesticide Action Network Germany
Czech Republic
In the Czech Republic farmers with farms larger than 10 ha are required to report their pes-ticide use. Only 27.4% of all farms are larger than 10 ha, but they do cultivate 97.,5% of the agricultural land.
The annual report published by the State Phytosanitary Administration also contains infor-mation on the hectares infested with individual pest organisms by crop, as well as on the use of pesticides by toxicity classification and crop. The annual report however, does not contain information on trends over time or application rate by crop.
The data recently published contain the data set for the year 2002. In 2002 some 4.7 million kilogram active ingredients were reported to be applied in the Czech Republic.
Sales data by the Czech Crop Protection Association are only available for 2001 and report a number of 4.35 million kilogram for the year 20011. Reported usage in 2001 was 4.39 tonnes. The difference is most likely due to the fact that farmers used stocks or that not all sales in the Czech Republic are reported to the Czech Crop Protection Association.
Table 18 Total pesticide use and intensity by crop 2002
Arable Crops Kg Pesticide Use Hectares Kg/haCereals 1 802 406 1 623 600 1,11Fodder crops 33 148 668 200 0,05Legumes (pulses) 57 694 37 200 1,55Maize 490 222 61 900 7,92Other arable crops* 488 053 472 100 1,03Potatoes 228 618 54 100 4,23Rape 777 412 343 000 2,27Sugar beet 294 172 77 700 3,79Total sum arable crops 4 171 725 3 337 800 1,25Specialty Crops Kg Pesticide Use Hectares Kg/haGrapevine 151 714 11 300 13,43Hops 163 709 6 100 26,84Orchards 141 766 30 600 4,63Vegetables 51 441 26 000 1,98Total sum specialty crops 508 630 74 000 6,87Pasture and Meadows Kg Pesticide Use Hectares Kg/haMeadows n.a. 656 600 n.a. Pasture land n.a. 283 600 n.a. Total sum pasture and meadows n.a. 940 200 n.a.
Total agricultural land 4 680 355 4 352 000 1,08
Source: State Phytosanitary Service
Over the last years, there has been a steady increase in the usage of pesticides in the Czech Republic; in 1993 reported usage was about 3 500 tonnes. This increase is owed to
1 Personal communication with Ivan Dostal, ECPA, Czech Crop Protection Association

Pesticide Use and Agriculture – Facts and Figures
.......................................... Pesticide Action Network Germany 25
the fact that after the political change in 1989, pesticide usage in the Czech Republic dropped significantly and is now recovering.
The highest total use is associated with the cultivation of cereals, while the highest intensity is associated with the cultivation of hops.
Hungary Hungary is one of very few countries, which maintains a sales reporting system based upon retail sales. Pesticide sales data are collected twice a year from wholesalers and local dis-tributors.
These have to submit data on the sales in kg, as well as on the monetary amount, on the basis of individual formulated pesticide products. Sales data are publicly available in an aggregated format.
Pesticide use data are also available for farm types. The next figure shows the use of pesti-cides by co-operatives and corporations in Hungary 1995-2002. The graph shows no clear trend and an analysis is even harder, due to the fact that the number of co-operatives and corporations slightly decreased in Hungary during the same time span.
0
2.000
4.000
6.000
8.000
10.000
12.000
14.000
16.000
18.000
1995 1996 1997 1998 1999 2000 2001 2002
tonn
es fo
rmul
ated
pro
duct
Figure 3 Pesticide use by co-operatives and corporations in Hungary 1995-2002
(tonnes formulated product)
Table 19 and Table 20 show areas treated in Hungary with pesticides by land use type and farm type respectively. It was not indicated whether multiple applications are included in these numbers.

Pesticide Use and Agriculture – Facts and Figures
.......................................... 26 Pesticide Action Network Germany
Table 19 Hectare treated by pesticides in Hungary 2000
Treated field area (ha) Land use categories Herbicides Insecticides Fungicides Other pesticidesArable land 1 459 700 486 078 559 835 211 701 Orchard 9 856 14 240 14 678 5 389 Vineyard 5 499 6 333 7 042 3 125 Fishpond 9 - - 10 Grassland 761 6 100 235 Others 4 414 4 952 226 462 Total 1 480 239 511 609 581 881 220 922 Source: Environmental statistical data of Hungary 2000 p. 162
.
Table 20 Treated areas by farm type and use type in Hungary 2000
Field type by: Treated field area (ha) Herbicides Insecticides Fungicides Other
Pesticides Corporations 997 788 390 859 477 287 179 883 Arable land 977 766 366 377 456 807 170 801 Orchards 9 736 13 390 13 693 5 707 Viticulture 4 812 5 961 6 260 2 657 Meadow 1 142 37 - 202 Fish pond 1 25 10 68 Others 4 331 5 069 517 448 Co-operatives 504 656 164 250 207 714 88 805 Arable land 502 681 161 540 204 950 87 560 Orchards 931 1 501 1 532 400 Viticulture 969 1 158 1 183 794 Meadow 69 - - - Fish pond - - - - Others 6 51 49 51
Table 21 Treated area by land use type and farm type
Area 2001Treated ha by corporations
2001
Treated ha by co-operatives
2001
Total trea-ted area
(ha) Arable land 4 516 000 1 971 751 956 731 2 928 482 Orchards 97 400 42 526 4 364 46 890 Viticulture 83 500 19 690 4 104 23 794
Table 21 shows the treated area of farmland under production by co-operatives and corpo-rations in 2001. It was not indicated whether multiple applications are included in these numbers (GFA/Avalon 2003).
Poland
In 2002, a new system of monitoring the use of pesticides came into force in Poland. The system was created based on the British example and is much more detailed than the pre-

Pesticide Use and Agriculture – Facts and Figures
.......................................... Pesticide Action Network Germany 27
vious one. It is a four-year cycle of monitoring the 10 most important Polish crops: potatoes, cereals, legumes, sugar beets, oil plants, fibre plants, corn, vegetables, strawberries and orchards.
In 2002, the use of PPP on potato plantations was monitored and gave very interesting results. Inspectors collected approx. 7500 questionnaires - every farmer is obliged to record and keep evidence of measures which gave the base for this analysis. The average use was 3,5 kg/ha (of active ingredient). The research also showed how Poland is divided in terms of pesticide use - the very high amount of pesticide products in the western part of Poland was about 6 kg/ha and in the eastern part very low, about 1,5 kg/ha.
The previously collected data for all crops show much a lower pesticide use: 0,5-0,6 kg of active ingredient per ha. The problem with comparison with data collected in 2002 is that the previous monitoring system was very different to the new one and was based rather on selling data then real application rate – questionnaires were not obligatory for farmers. It means that it was less precise than the new one.
On account of the new monitoring strategy, a detailed overview about the pesticide use in Poland will be available when the four-year cycle ends in 2006.
The average application of pesticides per hectare in Poland during the last ten years – ac-cording to the data provided by Central Statistics Office – is presented in Figure 4 .
0
0,1
0,2
0,3
0,4
0,5
0,6
0,7
1991 1992 1993 1994 1995 1996 1997 1998 1999 2000 2001
kg a
i/ha
kg of active ingredientper ha
Figure 4 Pesticide intensity (kg ai/ha) in Poland 1991-2002
The most important crops in Poland are cereals, which means that the use of pesticides for these crops plays the most significant role in plant protection in Poland. We can estimate what the monitoring of pesticide use on cereals will look like in the year 2004 and this would give an idea of the overall picture. The monitoring of potatoes done in 2003 showed that fungicides were most important with a share of 86% applied active ingredient.
Slovakia
Similar to the Czech Republic, farmers in Slovakia with holdings over 10 ha are required to report pesticide use data.

Pesticide Use and Agriculture – Facts and Figures
.......................................... 28 Pesticide Action Network Germany
Overall usage data are shown in the next figure. Figure 5 shows that usage between 1997 and 2001 was around 3 500 tonnes active ingredients per year. Only in 1999 was usage below 3.000 tons. Data for 2000 were not provided.
0
500
1000
1500
2000
2500
3000
3500
4000
4500
5000
1991 1992 1993 1994 1995 1996 1997 1998 1999 2001
tonn
es
Pesticide Use (t)
Figure 5 Pesticide Use in Slovakia (tons AI) 1991-2001
The intensity of pesticide use is presented in Figure 6 below. In 1996, 1997, 1998 and 2001 around 1.5 kg/ha pesticide were applied on average. In 1999 intensity was lower. Data for 2000 were not provided (GFA/Avalon 2003).
0
0,5
1
1,5
2
2,5
1991 1992 1993 1994 1995 1996 1997 1998 1999 2001
kg a
i/ha
Pesticide Use (kg ai/ha)
Figure 6 Intensity of Pesticide Use in Slovakia 1991-2002 (kg/ha)
Slovenia
Data on wholesale of pesticides in Slovenia were taken from the Statistical office of the Republic of Slovenia, which obtains it from the Administration of the Republic of Slovenia for Plant Protection and Seeds. Data for the period from 2000 till 2002 are expressed in quantities of active ingredients in pesticides. These data include quantities available to farmers as well as quantities available to users outside agriculture (maintenance of railway

Pesticide Use and Agriculture – Facts and Figures
.......................................... Pesticide Action Network Germany 29
and road corridors, sports and municipal areas, usage for protection of food in warehouses, production outside agriculture holdings) (Statistical Office of the Republic of Slovenia, 2003).
0
200.000
400.000
600.000
800.000
1.000.000
1.200.000
1.400.000
1.600.000
1.800.000
1997 1998 1999 2000 2001 2002
kg a
ctiv
e in
gred
ient
OtherHerbicidesFungicidesInsecticides
Figure 7 Pesticides – wholesale on the Slovene market (kg of active ingredient) 1997-2002
5 Monitoring of Pesticide Residues
While pesticide use or sales data are available in the five selected countries, good monitor-ing data are hardly available. Chemical analyses and the necessary equipment are expen-sive and many countries did not invest in monitoring and control of pesticides, so far. Food and water are usually only tested for a small number of pesticides and data are often not available to the public. According to EU regulations, countries must regularly monitor pesti-cide residues in food. The new Member States and the candidate countries are lacking behind with the implementation of these regulations and more funds are needed to support this sector. Therefore data for Bulgaria were not submitted.
Czech Republic
The Czech Agriculture and Food Inspection Authority (CAFIA) belongs to the Ministry of Agriculture of the Czech Republic and is responsible for foodstuff monitoring.
The cardinal directive is a law about foodstuff No. 110/1997 Coll. and its executive notices. The control of extraneous substance limits is provided for by notice No. 53/2002 Coll. Aro-matic Substances Control notice No. 52/2002 Coll. issued by the Ministry of Health of the Czech Republic. Certain kinds of pesticides are monitored permanently (examples in the table) besides those which could have been present.
Animal products are under supervision of the State Veterinary Administration of the Czech Republic in accordance with law No. 166/1999 Coll. on veterinary care.

Pesticide Use and Agriculture – Facts and Figures
.......................................... 30 Pesticide Action Network Germany
The majority of legal directives of the Czech Republic already approximate directives of the Europe Union. Regulations are fully accepted and Directives are transposed.
Public relations of CAFIA have been founded which provide information in accordance with law No. 106/1999 Coll.. Topical problems are released by news media and annual reports about activities are accessible. Additional information is available at web site www.czpi.cz
CAFIA inspectors carried out 22 122 inspections during 2001. 12 219 inspections were completed in the retail network, 8 080 in production, 1 704 in stocks and 119 of them in other places. CAFIA regularly monitors more than 100 active ingredients and metabolites related to fungicides and insecticides both from the category of organochlorines and or-ganophosphates and some of the other pesticide categories. The residues of a pesticide are monitored in the following commodities: potatoes, apples, cabbage, flour, bread, rice, childrens nourishment and citrus. The pesticides based on bromide (methyl bromide) used for stock protection (fumigation) were monitored in tea, spice, cocoa powder, dried fruit and nuts.
7 positive results of pesticide residues were found during 2001 in citrus. The active phenyl-phenol (o-fenylfenol) were found in four cases and brompropylate, chlorpyrifos and methi-dathion were analysed in one sample.
Apples were the commodity with the greatest number of detected pesticide residues in 2001 (Table 22 ) and imported apples from Spain and Argentina exceeded the maximum residue limits (MRL).
Table 22 Pesticide residue in apples (mg/kg) in 2001 – Czech Republic
Name of active ingredient Detections Detections
up to MRLDetections up to MRL
(%)Detections above MRL
Detections above MRL
(%)Aazinphos-methyl 11 2 18,18 2 18,18Aifenthrin 4 1 25 1 25Brompropylate 11 1 9,09 0 0Captan 11 2 18,18 0 0Diazinon 11 1 9,09 0 0Dithiocarbamate (sum) 11 2 18,18 0 0Phosalon 11 1 9,09 0 0Procymidon 11 1 9,09 1 9,09
Source: CAFIA – statistics 2001
Dithiocarbamates were detected in apples, potatoes and more especially in cabbage. The pesticides were often found in nine cabbage samples out of twelve, respectively in 75% of samples.

Pesticide Use and Agriculture – Facts and Figures
.......................................... Pesticide Action Network Germany 31
Hungary
Table 23 shows the detected pesticide residues in food.
Table 23 Pesticide residues in foods in Hungary in 2000 (%)
Domestic food (sample 2.171)
Imported food (sample 1.424)
No measurable residues 60 54 Residues below the limit 35 45 Residues above the limit 1 1 Residues of non-authorized pesticides 4 - Total 100 100
In 60 % of the examined home produced foods there were no measurable residues and in 35 % residues were below the limit. Only in 1 % were the residues above limit. In 4 % of all cases non-authorized pesticides were detected. Altogether, some 40% of the samples con-tained pesticide residues, which is about the same scale as in the EU 15 (EC,2003).
Pesticide residues in imported foods were higher than in domestically produced foods. In the imported foods, the residues of POPs are significantly higher than in the domestically produced products. As imported foods are bought to a much greater extent degree in Bu-dapest than in other parts of Hungary, the contamination of people living in Budapest is higher than in the rural areas of the country.
Pesticide residues in drinking water
Pesticide residues in surface and ground water have been monitored regularly in Hungary since 1976. Pesticide residues are monitored within the framework of the National Environ-mental Health Program. In 2000, 64 sampling points along rivers, small creeks and canals were selected from each main agricultural area. Table 24 Pesticide residues in drinking water in Hungary in 2000
Name of active ingredient
Number of occurences
Above the EU limit
Maximal concentration
Diazion 14 2 0.33 Forat 4 0 0.01 Antrazin 5 3 5.70 Prometrin 1 1 3.22 Terbutrin 1 0 0.05 2.4-D 4 1 0.27 Dichlorprop 3 0 0.07 MCPA 5 1 0.68
A basic set of 21 pesticides were checked in 62 samples. Eight pesticides were found and in eight cases the EU limits were exceeded.
The Plant Protection Institute conducted water monitoring in 12 counties and with 6 water suppliers. Altogether, in 3 years (2000-2002) 14 substances were sampled 346 times in 90 locations. Survey results showed that in over 90% of the collected water samples detect-able levels of pesticides were found. Atrazine was detected in 44%, Diazinion in 65%, Ace-tochlor in 31%, Prometryn in 18% and Terbutryn in 3% of the samples. Trifluralin, carbofu-ran, metribuzin, phorate and fenoxycarb were also tested but not detected in any of the samples.

Pesticide Use and Agriculture – Facts and Figures
.......................................... 32 Pesticide Action Network Germany
Slovakia
Control of pesticides and pesticides residues in Slovakia is quite complicated. At least 10 national institutions belonging to 3 ministries (Agriculture, Environment and Health) plus regional branches, are responsible for the monitoring and control of pesticides and pesti-cide residues. Competences differ depending on the observed environment: air, water, soil, food/feed, biota (plants/animals) and humans.
With regard to monitoring pesticide residues in food, the responsible official body is the Institute for Food Research (Výskumný ústav potravinársky). There are two sources of in-formation on pesticide residues in food: 1. the regular monitoring scheme based upon a representative “food basket”, and 2. official control of domestic and imported food and fod-der.
In July 2003, data from the monitoring of food residues were presented by the Slovak Minis-try of agricultural. 3853 samples were analyzed: 73% from animal production, and only 15,5% from plant production, 6,8% vegetables and 0,2% fruits. The monitoring showed that pesticide residues did not exceed the allowed limits in analyzed products. However, these results are not representative. The proportion of food and vegetables is very small and only 39 different pesticides were analyzed. The reason for the insufficient monitoring is mainly in lack of finances, but Slovakia is responsible for providing safe food, an applied “polluters pay principle” and must build up an appropriate system of monitoring.
In 2003, the official food and fodder control detected 54 different kinds of pesticides in 13165 domestic samples. 62 different pesticides were detected in 7734 imported product samples. In 16 cases residues exceeded the maximal residues limit.
Table 25 Pesticide residues measured in foodstuffs, Slovakia - VUP 2003
Pesticides Number
of samples
Above detection
limit
Above-detec-
tion limit (%)
Above MRL
Above MRL
(%)
Over MRL in 2003
Domestic products Bromadiolon 1 0 0 1 100 Meat products
Cypermethrin 400 3 0.8 1 0.3 Cerals and oil products
Fenvalerate 304 0 0 2 0.7 Other food Chlordane 401 6 1.5 7 1.7 Fruits and f. products All samples 13 165 761 5.8 11 0.08 Over MRL in 2003 Imported products Beta HCH 549 4 0.7 1 0.2 Milk and m.products Cypermethrin 158 2 1.3 1 0.6 Other food Endosulfan 146 2 1.4 1 0.7 Other food Orto-fenylfenol 38 8 21.1 1 2.6 Fruits and f.products Procymidone 162 4 2.5 1 0.6 Other food All samples 7 734 311 4.0 5 1.6

Pesticide Use and Agriculture – Facts and Figures
.......................................... Pesticide Action Network Germany 33
Pesticide residues in water are regularly controlled by the Slovak Hydrometeorological Insti-tute (SHMU), the Department for Ground Water and the Department for Surface Water Quality.
Concerning ground water, pesticide residues have been analysed twice a year since 1982, but since 1997 only once a year (because of finances). From 1997 on, only 9 different pes-ticides were analysed.
Table 26 Pesticide residues in Slovakian water 2000-20032
2000 2001 2003 PV NL PV NL PV NL
Surface water 42 0 25 0 26 0 Ground water 1 119 1 672 11 935 0 Drinking water 331 0 578 1 994 4 Total 1 492 1 1 275 12 1 955 4 PV-number of samples; NL-sample with pesticide concentr. over MRL
Occurrence of pesticide residues in ground water decreased after 1992. However, in the last four years 12 samples of ground water and 5 samples of drinking water showed pesti-cide levels exceeding the MRL.
Surface water is controlled by the SHMU regularly within the “National monitoring of water quality in Slovakia”, but also via “Controls of water quality” by the SHMU, randomly or in-dicatively by the Slovak Environmental Inspection (SIZP) if there is suspicion of contamina-tion. With regard to regular monitoring – about 60 places in Slovakia were monitored in 2003. Places were chosen depending on agriculture activities in the region, samples were taken 2-6 times a year and at each place between 6 and 28 different pesticides were con-trolled. Methodology of pesticides measurement run in line with Slovak technical norm - STN 757221; atrazine and simazine were measured in all 4 basins in the country. All meth-odology, standards and monitoring of water quality will reach full accordance with EU legis-lation after 1st July 2004, as the new “Water law” approved by Slovak parliament in 15th May 2004 comes into force.
Annual reports summarising all water quality parameters can be found in each county’s and regional magistracy as well as at most universities. On the web page of the SHMU partial information from the two latest reports can always be found.
Impact evaluation on water quality and ecosystems of different/new pesticides is the re-sponsibility of the Water Research Institute.
Slovenia
Pesticide and residue monitoring is pursued by two bodies: the Ministry of Health (Institute of Public Health of the Republic of Slovenia and Institute of Public Health Maribor – Institute for Environmental Protection) and the Ministry of Agriculture, Forestry and Food (Agricul-tural Institute of Slovenia and Slovenian veterinary administration) (Ministry of Health 2002).
The agricultural Institute of Slovenia has been monitoring the contamination of agricultural products with residues of plant protection products as part of professional projects in agri-culture since 1987 (Ministry of Health 2002).
2 in 2002 there was no positive finding
Pesticide Use and Agriculture – Facts and Figures
.......................................... 34 Pesticide Action Network Germany
The monitoring of the pesticide residues in foodstuffs performed in year 2001 took place in cities all over Slovenia with more than 10,000 inhabitants. Samples have been taken from representative market places. The monitoring was performed by inspectors from the Minis-try of Health (Ministry of Health 2002).
The surveillance sampling was performed in the areas of Celje, Koper, Nova Gorica, Novo Mesto, Murska Sobota, Maribor and Ljubljana by inspectors from the Ministry of Agriculture, forestry and food. The sampling was carried out during the harvest when the pre-harvest interval for pesticide use had expired (Ministry of Health 2002).
Every year the Agricultural Institute of Slovenia follows the concentrations of pesticide resi-dues in samples of potato, lettuce and apples (Ministry of Health 2002). A selection of the other agricultural products is harmonized with EU directives every year.
Residues of 45 different substances were determined in the laboratory using three different methods: multi residual method for the determination of 43 substances (organochlorinated, organophosphate and pyrethoids), method for the determination of dithiocarbamate group (maneb, mankozeb, metiram, propineb and zineb, the sum was expressed as carbon disul-fide) and method for the determination of thiabendazole (benomil and carbendazim ex-pressed as carbendazim) (Ministry of Health 2002).
The monitoring of pesticide residues in the year 2001 produced the following results (Ministry of Health 2002):
168 samples of foodstuffs (milk, potato, lettuce, tomato, wheat, apples and strawberries) and 151 samples of agricultural products (potato, lettuce, tomato, wheat, barley, apples and strawberries) were taken in the year 2001. Altogether there were 6,027 analyses of different pesticides in foodstuffs and 6,795 analyses of different pesticides in agricultural products.
Results of monitoring show that 58.9% samples of foodstuffs and 72.8% samples of agricul-tural products did not contain pesticide residues. Presence of pesticide residues up to ma-ximum residue limits (MRLs) was determined in 69 samples of foodstuffs (41.1%) and in 33 samples of agricultural products (21.9%). MRLs were exceeded in 1% of foodstuff (1 sample, bread) and in 5% of agricultural products (8 samples, lettuce and potato) (Ministry of Health 2002).
Slovene results are comparable to the EU monitoring results. All fifteen Member states and the EFTA States who signed the EEA agreement, monitored pesticides residues in food-stuffs of plant origin. Overall, some 46,000 samples were analyzed for, on average, 145 different pesticides. About 93% of samples analyzed in 2001 were fresh (incl. frozen) fruit, vegetables and cereals, about 7% were processed products. In 37% of the fruit, vegetable, cereal samples and processed products, residues of pesticides at or below the maximum residue limit (national or EC-MRL) were detected. In 3.6% of all samples, residues above the MRL (national or EC-MRL) were found. 60% of the samples contained no pesticide residues. When only fresh products are considered, the percentage of cases where the MRL was exceeded increased to 3.9% instead of 3.6% and the percentage of samples without residues was 59% (EC, 2002).

Pesticide Use and Agriculture – Facts and Figures
.......................................... Pesticide Action Network Germany 35
58%
41%
1%
Samples without pesticide residues
Presence of pesticide residue in allowed limits
Exceeded maximum residue limit
Figure 8 Results of monitoring pesticide residues in Slovenian foodstuffs in year 2001 Source: Ministry of Health (2002).
73%
22%
5%
Samples without pesticide residues
Presence of pesticide residue in allowed limits
Exceeded maximum residue limit
Figure 9 Results of monitoring pesticide residues in agricultural products in the year 2001 Source: Ministry of Health (2002).
Monitoring pesticide residues in drinking water and in drinking water sources is similarly complemented by monitoring the quality of ground water, spring and surface waters in Slo-venia. This field is within the competence of the Ministry of the Environment, Spatial Plan-ning and Energy (Environmental Agency). The environmental agency cooperates with the Institute of Public Health of the Republic of Slovenia, Institute of Public Health Maribor – Institute for Environmental Protection, Institute of Public Health Novo Mesto and National Institute for Biology. Monitoring of water quality includes:
• monitoring of groundwater quality, • monitoring of wells,

Pesticide Use and Agriculture – Facts and Figures
.......................................... 36 Pesticide Action Network Germany
• monitoring of surface water, • monitoring of lakes, and • monitoring of the sea.
In 2003 water, was analyzed for the following pesticides: metalochlor, simazine, propazine, prometryn, bromacil, atrazine (desetilatrazine and desizopropilatrazine), acetochlor, di-chlobenil (2,6 dichlobenzamid), alachlor, ciazine, metalaksil, sebutilazin, terbutilazin and terbutrin (MESPA 2003).
Samples of water were taken twice in the year 2003 (before pesticide use) from wells ap-proximate 1 meter below the ground water level (MESPA 2003).
The maximum residue limit for atrazine (and desethyl-atrazine) was exceeded in all four sampling places on “Dravsko polje”, “Ptujsko polje”, “Spodnja Savinjska dolina” and “dolina Bolske”. The presence of atrazine and desetil-atrazine within allowed limits was determined in “Prekmurje”, “Mursko polje”, “Sorško polje” and “Kranjsko polje” (MESPA 2003).

Pesticide Use and Agriculture – Facts and Figures
.......................................... Pesticide Action Network Germany 37
6 Pesticide Relevant Legislation
With their accession to the EU, the new MS were obliged to comply with EU legislation. Therefore, legislation in the new MS is newly developed. In many cases regulation is more progressive than in the former EU 15 countries. Many new CEE MS for example, require farmers to keep spray records (Poland, Czech Republic, Slovakia) or even to report their usage (Czech Republic, Slovakia).
However, implementation and control of the legislation is very weak in most countries. Famers often don’t know the legal requirements and governmental agencies have no ca-pacity to disseminate information and to control compliance.
A pesticide inventory conducted for the UNDP/GEF Danube Regional Project looked at pesticide use in 11 Eastern European Danube countries3
and found a number ‘bad pesti-cide practices’ in this region (GFA Terra/Avalon, 2003). At a PAN Germany workshop, which took place in March 2004, a representative of a CEE NGO confirmed that most of the farmers in their countries do not comply with the legal requirements.
The next list was created to help NGOs find relevant legislation in their countries.
Bulgaria
Plant Protection Law (State Journal No 91, 10 October 1997 amended by Acts of 15 Octo-ber 1999 and of 09 November 2001 (State Journal No 90, 1999 and 96, 2001)
Ordinance No1 of the Ministry of Agriculture and Forestry (MAF) of 27 May 1998 on Phyto-sanitary Control, (State Journal 82, 17 July 1998) amended by Acts of 19 October 1999 (91, 1999), of 22 January 2002 (State Journal 8, 2002)
Ordinance No 11 of the MAF of 10 April 2001 on potato brown rot disease caused by Ral-stonia Slanacearum (Smith) Yabuuchi et al., (State Journal 40, 20 April 2001) amended by Acts of 22 January 2002 (State Journal 8, 2002)
Ordinance No19 of the MAF of 02 July 2001 on potato ring rot caused by Clavibacter Mi-chiganensis (Smith) Davis et al., ssp.sepedonicus (Spieckermann et Kotthoff) Davis et al. of (State Journal 62, 13 July 2001) amended by Acts of 22 January 2002 (State Journal 8, 2002)
Ordinance No 20 of the MAF of 02 July 2001 on potato wart disease caused by synchytrium endobioticum (schilb.) of (State Journal 65, 24 July 2001) amended by Acts of 22 January 2002 (State Journal 8, 2002)
Ordinance No 38 of the MAF of 08 November 2001 on the fight against carnation leaf-rollers of (State Journal 98, 16 November 2001) amended by Acts of 22 January 2002 (State Journal 8, 2002). Ordinance No 39 of the MAF of 08 November 2001 on fight against
3 Czech Republic, Slovakia, Hungary, Slovenia, Croatia, Bosnia & Herzegovina, Serbia & Montenegro, Bulgaria, Rumania, Moldova, Ukraine

Pesticide Use and Agriculture – Facts and Figures
.......................................... 38 Pesticide Action Network Germany
potato cyst eelworms of (State Journal 99, 20 November 2001) amended by Acts of 22 January 2002 (State Journal 8, 2002)
Ordinance of the MAF on Plant Protection Products Authorization Adopted by Council of Ministers Decree No. 213 of September 16, 2002. (State Journal No. 93 of October 1, 2002), in force from 01 January 2004.
Ordinance No. 37 of the MAF of September 26, 2002 on Biological Testing for Efficiency and Residues of Plant Protection Products and Official Recognition of individual and legal bodies (State Journal No. 95 of October 10, 2002).
Ordinance of the MAF on the conditions and the order for labelling of plant protection prod-ucts. In force from 01 January 2004 (State Journal No 54 of 13 June 2003).
Ordinance of the MAF for authorization of plant protection products on the market. In force from 01 January 2004 (State Journal No 93 of 01 October 2002, amended by the State Journal 31 December 2003), in force from 01 January 2005.
Czech Republic
Table 27 EU legislation on plant protection products and complying national legislation in the Czech Republic
EU legislation on plant protection products National legislation in force 91/414/EEC (Placing of pesticide products on the market) Act 147/1996 (consol. 36/2002);
Decree 91/2002 99/45/EC Classification packaging and labeling of danger ous prep.)
Act 157/1998 (as amended)
79/117/EEC (Prohibiting marketing and use of pesticide products containing certain active sub. ces)
Act 147/1996 (consol. 36/2002); Decree 91/2002
76/769/EEC (Restriction on certain dangerous substances and preparations)
Act 157/1998 (as amended)
67/548/EEC (On the classification, packaging and labelling of dangerous substances)
Act 157/1998 (as amended)
Farmers who use plant protection products (for the purpose of enterprise) are obliged to meet following requirements:
• To keep records of the use of plant protection products (Act No. 147/1996 – Article 29; Decree 91/2000 – Article 15);
• Equipment for application has to be registered (recorded in the central register) and tested once every two years at least. Act No. 147/1996 – Articles 35, 36, 37; Decree 91/2000 – Articles 21 / 29);
• Complete special training for the use of plant protection products.
Within the SPA, IPM and GPPP instructions are combined and published in “Instructions for plant protection“ and in “Methods of prognosis and warning“. The SPA makes prognoses of the occurrence of some pests and diseases.

Pesticide Use and Agriculture – Facts and Figures
.......................................... Pesticide Action Network Germany 39
The desirable reduction of the use of chemicals in agriculture has been addressed and supported by the subsidiary program of the Ministry of Agriculture “Biological Pest Control to Supersede Chemical Treatment“ (No. 3.a.).
Hungary
Act No. 35 of 2000 Act on Plant Protection
Act LV 1994 on cultivated land, Hungarian Official Journal, No. 69, pp. 2533-2596.
Hungarian Official Journal. 1995a. Act LIII 1995 on general regulations for the protection of the environment, Hungarian Official Journal, No. 52, pp. 2780-2799.
Act LVI 1995 on the product fee for environmental protection, and on this fee with respect to certain products, Hungarian Official Journal, No. 53, pp. 2828-2833.
Act LVII 1995 on water management, Hungarian Official Journal, No. 53, pp. 2833-2846.
Act LIII 1996 on the protection of nature, Hungarian Official Journal, No. 53, pp. 3305-3325.
National Assembly Resolution 83/1997 (26. IX.) on the National Environmental Protection Programme, Hungarian Official Journal, No. 82, pp. 5816-5846
Governmental Decree 123/1997 (18. VII.) on the protection of currently used water bases, potential water bases and water infrastructure serving the supply of potable water, Hungar-ian Official Journal, No. 65, pp. 4738-4755
Poland
Act of 12 July 1995 on protection of cultivated plants amended by Act of 16 February 2001 (Journal of Laws, No 22, 248)
Decree of the Ministry of Agriculture and Food Economy of 10 January 1991 (Journal of Laws No 14, 64) on safety and hygiene rules at applying and storing pesticides and mineral and artificial fertilisers in agriculture.
Decree of the Ministry of Agriculture and Food Economy of 12 March, 1996 concerning detailed principles of granting authorisation of plant protection products to be placed on the market, amended by the Decree of 5 March, 2002 (Journal of Laws, No 24, 250).
Decree of the Minister of Health of 15 April 1997 concerning maximum residue limits for chemicals used in protection, transportation and storage of food and plants (Journal of Laws, No 43, 273). Amendment of this Decree is in the final stage of legislative procedure.
Decree of the Minister of Agriculture and Rural Development of 11 February 1999 on de-tailed principles of the inspection of plant protection equipment (Journal of Laws, No 20, 175), amended by the Decree of 15 March 2001 (Journal of Laws, No 30, 349).
Decree of the Minister of Agriculture and Food Economy of 20 September, 2001 concerning detailed demands from a training unit (Journal of Laws No 114, 1222).

Pesticide Use and Agriculture – Facts and Figures
.......................................... 40 Pesticide Action Network Germany
Decree of the Minister of Agriculture and Rural Development of 4 October 2001 on techni-cal requirements for sprayers (Journal of Laws, No 121, 1303).
Decree of the Minister of Agriculture and Rural Development of 15 November 2001 on the inspection of sprayers (Journal of Laws, No 137, 1544).
Polish Standard of 19 April 1999. PN-C-04657 Plant Protection Products. Packing, Storage and Transport.
Handbook of Plant Protection. Principles of safety and efficacious use of methods and plant protection products. edited by the Plant Protection Institute, Poznan, 1994.
Slovakia
Decree of the Ministry of Agriculture of the Slovak Republic No. 23322/3/2001-100 of 21st January 2001 laying down details concerning plant protection products.
The Decree addresses the following:
• keeping of records on the applied amount(s) use and the method(s) of application of plant protection products (hereinafter referred to as „the product(s)“) and the method of their application;
• testing and appraisal of the active substances and the products, their authorisation, including the lists of the permitted and prohibited active substances as listed in Annex 1 and Annex 2 respectively of the Decree;
• taking over testing the results of the biological efficacy of the products; • the use, packing, commercial storage and import of products, including retail
packagings thereof; • the supervision of the active substances and the conformity of the authorised
products; • the required qualification and registration of natural persons and legal persons
complying with the requirements for placing products on the market and the issuance of certificates on professional qualifications.
Slovenia
The most important law regarding pesticides is the Act on Plant Protection Products (11/2001) from 2001, amended by the Act from 2003 (110/2003). The Act on Plant Protec-tion Products summarizes European law in this field and implements systems of registra-tion, trade, use and control over pesticides in a similar way to the EU (MAFF 2002). Its sub-ject is plant protection in general, trade and control over pesticides, pesticide product regis-tration and authorization process, trade and usage of pesticides, management of register of pesticide products, recording data and keeping records referring to pesticides and technical requirements about equipment for application of pesticides. It gives obligations and authori-sation to several institutions and obligations to farmers. It includes list of decrees and regu-lations that are in force concerning the field of pesticides.

Pesticide Use and Agriculture – Facts and Figures
.......................................... Pesticide Action Network Germany 41
Production of pesticides, trade with substances needed for production of pesticides, good laboratory practice, control and classification, packing and labelling of pesticides is regu-lated by regulations on chemicals.
Pesticides waste and waste packaging is regulated by regulation on environment protec-tion. The field of pesticides covers two sub-fields, authorisation process, trade and usage of pesticides and inspection of pesticide residues in foodstuffs of plant origin.
According to Article 24 of Act on Plant Protection Products, the authorisation for every pes-ticide product can be given for a maximum ten years, depending on the proposal of the commission. Authorisation can be prolonged several times but every time for the period of a maximum of ten years.
List of Slovene Legislation: 1. Act on Plant Protection Products (11/2000, 110/2003) with sub-act regulations (field of registration, trade and usage of PPP and residues of pesticides in plants):
• Rules on the responsibilities of users of plant protection products (62/2003): (Article 3: user has to respect principles of good agricultural practice, environmental protection, integrated plant protection and other procedures that ensure the lowest possible usage of PPP. He has to take into account instructions about correct usage, instructions of usage near waters, keep records of the use of PPP (article 8), and respect instructions on how to store PPP (article 9).
• Rules on professional training and assessment of knowledge in phytomedicine (36/2002) (sellers of pesticide products and users of pesticide products have to complete special training and pass an exam on how to use pesticide products. After passing the exam, users of pesticide products have to attend a one day training every three years in order to prolong validity of their certificate for the next three years).
• Rules concerning treatment of storage of plant protection products after cessation of registration (59/2003)
• Rules on the labelling of plant protection products (67/2001, 43/2002) (Every PP in trade and use has to be labelled and packed according to regulations on classification, packing and labelling of dangerous substances and preparations)
• Order concerning the prohibition or restriction of marketing and/or use of plant protection products containing certain active substances (105/2001)
• Rules concerning the contents and mode of keeping the register of certified types that have been the subject of successful or unsuccessful regular control (68/1995)
• Rules concerning the granting of the conformity certificate of application techniques for plant protection products (37/2001, 80/2001, 80/2002, 117/2002)
• Rules concerning the conditions to be met by natural and legal persons for placing plant protection products on the market (68/2002)
• Rules on authorisations for plant protection products (36/2003) • Rules on limit values of pesticide residues in/on foodstuffs and agricultural products
(73/2003) (These rules determine the limit values of pesticide residues in/on foodstuff of plant and animal origin and agricultural products, procedures of sampling and analysis of samples in order to find out whether there is accordance with limit values of pesticide residues).
• Decree on monitoring of pesticides in foodstuffs and agricultural products (13/1999)

Pesticide Use and Agriculture – Facts and Figures
.......................................... 42 Pesticide Action Network Germany
2. Act Regulating the Sanitary Suitability of Foodstuffs, Products and Materials Coming into Contact with Foodstuffs (52/2000, 42/2002)
This Act determines conditions that have to be fulfilled by foodstuffs, additives for food-stuffs, products and materials that come into contact with foodstuffs, that they are sanitari-ally suitable. It also regulates sanitary control over their production and trade in order to protect human health, monitoring sanitary suitability of foodstuffs, products and materials that come into contact with foodstuffs.
3. Chemicals Act with sub-act regulations (classification and labeling of PPP) (36/1999, 11/2001, 65/2003, 110/2003) This Act regulates trade with chemicals, determines measures for human health and envi-ronment protection from the harmful effects of chemicals and prescribes obligations that have to be met by individuals and companies who produce chemicals, sell them or use them.
• Rules on placing biocides on the market (38/2000, 81/2003) • Rules on the classification, packaging and labeling of dangerous substances, Rules
on the classification, packaging and labeling of dangerous preparations (101/2002, 22/2003)
4. Plant Health Act (45/2001) 5. Agriculture Act (54/2000, 55/2003):
• Rules on organic production and processing of agricultural products and/or foods (31/2001, 52/2003)
• Code of good agricultural practice in plant protection (Ministry of Agriculture, 2000) • Decree on more detailed measures on good agricultural practice (81/2002)

Pesticide Use and Agriculture – Facts and Figures
.......................................... Pesticide Action Network Germany 43
7 Sources
Bulgaria Balinova, A. (1998): Environmental risk from point sources of pesticide in the soil. In: Agricultural Science 4, 51-54. Sofia.
EC (2002a): Agricultural Situation in the Candidate Countries Country Report on Bulgaria, European Commission, Directorate-General for Agriculture, Brussels
GFA Terra/Avalon (2003): Inventory of Agricultural Pesticides Use in the Danube River Basin Coun-tries. Draft Report, UNDP/GEF Danube Regional Project: ˛Policies for the control of agricultural point and non-point sources of pollution˛ and "Pilot project on agricultural pollution reduction˛ (Project Outputs 1.2 and 1.3), unpublished, Hamburg
UNDP (2004): National Human Development Report 2003 (2004) Rural Regions: Overcoming Devel-opment Disparities, United Nations Development Programme
Czech Republic
EC (2002b): Agricultural Situation in the Candidate Countries Country Report on the Czech Republic, European Commission, Directorate-General for Agriculture, Brussels
PAN Germany (2003): Pesticides Registered in Eastern European Countries, Usage, Registration, Identification and Evaluation, Part 3: Czech Republic (124 p.) by L. Neumeister & B. Sarapatka a.o., Pestizid Aktions-Netzwerk e.V. (PAN Germany), Hamburg
Hungary
EC (2002c): Agricultural Situation in the Candidate Countries Country Report on Hungary, European Commission, Directorate-General for Agriculture, Brussels
EC (2003): Monitoring of Pesticide Residues in Products of Plant Origin in the European Union, Nor-way, Iceland and Liechtenstein 2001 Report (SANCO/20/02 final), European Commission, Health and Consumer Protection Directorate-General, Brussels
GFA Terra/Avalon (2003): Inventory of Agricultural Pesticides Use in the Danube River Basin Coun-tries. Draft Report, UNDP/GEF Danube Regional Project: ˛Policies for the control of agricultural point and non-point sources of pollution˛ and "Pilot project on agricultural pollution reduction˛ (Project Outputs 1.2 and 1.3), unpublished, Hamburg
PAN Germany (2003): Pesticides Registered in Eastern European Countries, Identification and Evaluation, Part 2: Hungary (117 p.) by L. Neumeister, Pestizid Aktions-Netzwerk e.V. (PAN Ger-many), Hamburg
Szekasc, A., Ernst, A. Juracsek, J, Darvas, B.(2003): Monitoring Water Polluting Pesticides in Hun-gary, Presentation at the 7th International HCH and Pesticides Forum in Kyiv, Ukraine, June 5th-7th 2003
Poland
PAN Germany (2003): Pesticides Registered in Eastern European Countries, Usage, Registration, Identification and Evaluation, Part 1: Poland (119 p.) by L. Neumeister & E. Hajduk, Pestizid Aktions-Netzwerk e.V. (PAN Germany), Hamburg
Slovakia Ministry of Agriculture (2004): Sector operational program – Agriculture and Rural development
Ministry for Environmental Protection (2004): Report on the state of Environment in 2003

Pesticide Use and Agriculture – Facts and Figures
.......................................... 44 Pesticide Action Network Germany
Ministry of Agriculture (2003): Green report 2002
Janovicek D, Interview on ecological agriculture in Slovakia, Ekotrend, August 2003
GFA Terra/Avalon (2003): Inventory of Agricultural Pesticides Use in the Danube River Basin Coun-tries. Draft Report, UNDP/GEF Danube Regional Project: ˛Policies for the control of agricultural point and non-point sources of pollution˛ and "Pilot project on agricultural pollution reduction˛ (Project Out-puts 1.2 and 1.3), unpublished, Hamburg
Lesinsky, D (2004): Personal consultation with director of Department for plant protection, UKSUP – Mr. Ing. F.Hrdinom in 20th May 2004 and additional communication with Mr.Ing S.Barok
Lesinsky,D (2004): Personal consultation with Ms. Ing. Matusova from Department for Plant Food, SVPU in 21st May 2004
Lesinsky,D (2004): Personal consultations with Ms. Ing. D.Salgovicova from Department for evalua-tion of food contaminants, VUP in 20th May 2004
Lesinsky,D (2004): Pesticide residues measured in food-stuff in consumer basket, Slovakia - VUP 2003; elaborated from VUP report – “Control of food contaminants in 2003”, May 2004 editor – Salgo-vicova (VUP), Hudakova(SVPS SR), Matusova(SVPS SR), Slovinska (VUVH)
Lesinsky,D (2004): PRe in food basket in 2003; elaborated from VUP report – “Monitoring of food and feed contaminants, 2002 report”, May 2003, editor – Salgovicova (VUP) at al.
Lesinsky,D (2004): Personal consultations with Ms.Ing. Luptakova from Department for Ground Water Quality at Slovak Hydrometeorologic Institute
Lesinsky,D (2004): Personal consultations with Ms.Ing. Domenyova and Ms. Ing.Vancova from De-partment for Surface Water Quality at Slovak Hydrometeorologic Institute
Ministry of Environment (2003): Inventory control of POPs in Slovakia; Final – technical report No 2, part 2, April 2003
Ministry of Environment (2003): Monitoring of POPs in Slovakia; Final – technical report, No 2, part 1, April 2003
Salgovicova D, Krizova S, Svetlikova A, (2004): Trends in DDT contamination in Slovakia, poster presentation, Slovak Food Research Institute - VUP
Uhnak J, Szokolay A,(2003): Analysis of the monitoring and control system of pesticides residues in fruit and vegetables in SR, done for Greenpeace Slovakia in 2004
Slovenia European Commission. (2002). National Monitoring programmes 2001. Available: http://europa.eu.int/comm/food/fs/inspections/fnaoi/reports/annual_eu/monrep_2001_sum_en.pdf [16.1.2004].
Eurostat 2002. (2002). Statistics in focus Agriculture and Fisheries theme 5 No 19/2002, Agricultural Price trends of eleven Candidate Countries as a whole keep pace with the EU Member States. Luxembourg.
Fito-info. (2003). Available: http://www.bf.uni-lj.si/ag/fito/ [5.12.2003].
GIS – Goričko informativna stran. (2003). Nas kmetje ogrožajo? Kdo nas pa prehranjuje?. Available: http://www.goricko.net/article.php?story=20031216145610619&mode=print [15.1.2004].
HCH Forum (2001). HCH Forum: Technical Summary of the 6th International HCH & Pesticide Fo-rum, Poznan, Poland, 20-22 March 2001.
Pesticide Use and Agriculture – Facts and Figures
.......................................... Pesticide Action Network Germany 45
IMAD – Institute for Macro-Economic Analysis and Development. (2000). Economical mirror for year 2000 (No. 7/VII), Agriculture – Pesticide use. Ljubljana. IMAD.
Kmetijsko gozdarski zavod Maribor. (2003). Available: http://www.kmetzav-mb.si/eko/stran2_3.htm [7.12.2003].
Kmetijsko gozdarski zavod Maribor. Personnal communication. January 2004.
Komat, Anton and Gorazd, Pretnar. (2003). Available: http://www.dostje.org/Eko/voda1.htm [15.1.2004].
MAFF – Ministry of Agriculture, Forestry and Food of the Republic of Slovenia. (2001a). Agri-environmental programme. Available: http://www.gov.si/mkgp/slo/skop/slovenija_in_slovensko_kmetijstvo/2_3.html [7.12.2003].
MAFF – Ministry of Agriculture, Forestry and Food of the Republic of Slovenia. (2001b). Fitofar-macevtska sredstva – strokovne naloge. Available: http://www.gov.si/mkgp/slo/doc/FFS_stroknaloge.doc [14.12.2003].
MAFF – Ministry of Agriculture, Forestry and Food of the Republic of Slovenia. 2002.
Available: http://www.gov.si/mkgp/slo/uvr_ffs.php [14.12.2003].
MAFF - Ministry of Agriculture, Forestry and Food of the Republic of Slovenia, The Administration of the Republic of Slovenia for Plant Protection and Seeds. Personnal communication. December 2003.
MAFF – Ministry of Agriculture, Forestry and Food of the Republic of Slovenia, Phytosanitary admini-stration. Personnal communication. January 2004.
MESPA – Ministry of Environment, Spatial Planning and Energy. (2001a). Report on environment – agriculture.
MESPA – Ministry of Environment, Spatial Planning and Energy. (2001b). Report on environment – chemicals.
MESPA - Ministry of Environment, Spatial Planning and Energy. (2003). Report on ground water monitoring which are endangered because of pesticide use.
Ministry of Health. (2002). Statement of Minister of Health and Minister of Agriculture, Forestry and Food about monitoring pesticide residues in foodstuffs and agricultural products for year 2001. Avail-able: http://www2.gov.si/mz/mz-splet.nsf [December 2003].
Official gazette RS. (2003). Register of laws-agriculture. Available: http://zakonodaja.gov.si/ [14.12.2003].
Popovič, Snežana. (2002). Slovensko kmetijstvo in EU, Pregled pogajanj za pristop k EU na področju kmetijstva. Available: http://www.gov.si/mkgp/slo/doc/Rezultati_pogajanj_kmetijstvo.doc. [10.12.2003].
Slabe, Anamarija. (2001). Organic farming in Slovenia. Available: http://www.organic-europe.net/country_reports/slovenia/default.asp [8.12.2003].
Statistical Office of the Republic of Slovenia (2000). Statistical Yearbook of the Republic of Slovenia 2001. Available: http://www.stat.si/eng/pub.asp [7.12.2003].
Statistical Office of the Republic of Slovenia (2001). Statistical Yearbook of the Republic of Slovenia 2001. Available: http://www.stat.si/eng/pub.asp [7.12.2003].
Statistical Office of the Republic of Slovenia (2002). Statistical Yearbook of the Republic of Slovenia 2002. Available: http://www.stat.si/eng/pub.asp [7.12.2003].
Statistical Office of the Republic of Slovenia. (2003). Statistical Yearbook of the Republic of Slovene 2003. Available: http://www.stat.si/eng/pub.asp [7.12.2003].

Pesticide Use and Agriculture – Facts and Figures
.......................................... 46 Pesticide Action Network Germany
Statisticall Office of the Republic of Slovenia. (2003b). Rapid reports. Available: http://www.stat.si/eng/pub_statinf.asp [7.12.2003].
Others
IFOAM (2003) The World of Organic Agriculture 2003 – Statistics and Future Prospects. 5th, revised edition, International Federation of Organic Agriculture Movements (IFOAM), Tholey Theley
Pouliquen, A. (2001): Competitiveness and farm incomes in the CEEC Agri-Food Sector: Implications before and after accession for EU markets and policies. Institut National de la Recherche Agronomi-que (INRA), Dijon
PAN Germany (2004): Moving towards Pesticide Reduction …realising Best Agricultural Practise in Central and Eastern European Countries by L. Neumeister, Pestizid Aktions-Netzwerk e.V. (PAN Germany), Hamburg