agriculture and rural development - peri.punjab.gov.pk 3 agriculture and rura… · agriculture and...
TRANSCRIPT


Agriculture and Rural Development
3.0 Introduction
�e agriculture sector continues to be the mainstay of Punjab’s economy and makes a substantial contribution to the province’s economic growth and prosperity. �e sector, comprising of crops, livestock and dairy, is responsible for 19.82 percent of the country’s overall GDP and is the largest employer in the country, absorbing 42.3 percent of the total popu-lation1 (Ministry of Finance). It also a�ords a large share in total export earnings from manufactured products, such as textiles that constitute 60 percent of the country’s total exports (Pakistan Economic Survey, 2015-16). Due to the agrari-an topography of the province and its large rural population (an estimated 66 percent of Punjab’s population according to the Punjab Development Statistics of 2016) growth in the agriculture sector is a necessary precursor both for the economic growth in the province and for rural development2 (Bureau of Statistics Punjab). Punjab’s agriculture sector assumes national strategic importance as well since the surplus generated in the region is vital for national food security. Even though agriculture has always been crucial to Punjab’s economy, recent performance of the sector has not been encouraging. Between 2010 and 2015, per hectare yield of wheat in Punjab has dropped, whereas the yields of rice and cotton have not shown any signi�cant improvement (Punjab Development Statistics, 2016). As compared to 2014-15, all crop subsectors in Pakistan (important crops, other crops and cotton ginning) registered negative growth rates in 2015-2016 whereas the textile sector, which constitutes majority of the country’s exports, registered a negative growth rate of 8.2 percent in 2016 as compared to the preceding �scal year (Pakistan Economic Survey, 2015). �is re�ects poor performance in Punjab’s agriculture sector, that had a production share of more than 50 percent in all major crops (with that of wheat being 76.9 percent and of cotton being 73.6 percent in 2015). �e total cropped area in Punjab has also dropped between 2004-05 and 2013-14.
�e sector’s lagging performance re�ects gaps in production e�ciency and the lack of a facilitative agricultural market. �e Government of Punjab is actively involved in multiple initiatives aimed at increasing productivity as well as produc-tion in the sector, such as improvements in seed quality, plant protection and research expansion. In this chapter, we will speci�cally examine the Kissan Package, introduced in September 2015, focusing on the bene�ts of �nancial inclusion to productivity in a sector prone to the vagaries of sudden price shocks. SMART agriculture is another initiative of the Punjab government that intends to use Information Communication Technology (ICT) to spur innovation and improvements in the agriculture sector.
Improvements in the agriculture sector and rural development go hand in hand; existing backward and forward linkages in the agriculture sector ensure that promoting growth in the sector has the largest impact on rural poverty. At the same time, targeting development programs towards the rural population also feeds back into improved agricultural perfor-mance. Rural development, through steps such as provision of public goods and services, helps increase rural welfare by facilitating income growth and overall accessibility to basic amenities. �e government of Punjab is taking several initia-tives, with a special focus on the least developed areas of the region, to minimize regional disparities and ultimately allevi-ate poverty. �ese include the provision of tangible services such as the provision of clean drinking water through the Clean Drinking Water for All (CDWA) project and the elimination of sewage ponds from villages. At the same time, the government is also promoting social mobilization and community led development through expanding the Punjab Rural Support Program.
Punjab plays a dominant role in virtually all sectors of Pakistan’s economy. �e data (Figure 2), however, shows a jump in the provincial share relative to reported national Gross Domestic Product (GDP) in the two latest years. �is results from the addition of communication’s value added at the provincial level. Following on from the devolution, communi-cations have been provincialized for collection of revenues and taxes since 2013. Consequently, the accounting data re�ects provincial �gures from 2014 under this head (these �gures were not available at provincial level before this date). In addition, Figure 3 shows that performance of Punjab’s economy moves in tandem with the national economy. �e growth rate of just over 5 percent per annum in the most recent period 2015-16 is the highest ever since the low of 1.5 percent per annum in 2008. �is performance is still short of the 8 percent per annum target set in the Growth Strategy 2014. However, it is pertinent to mention that the target set in the Growth Strategy 2014 relied on the assumption of
1These statistics have been borrowed from the Pakistan Economic Survey 2015.Ministry of Finance, Government of Pakistan, (2015). Pakistan Economic Survey 2015-16.2Bureau of Statistics Punjab, Government of the Punjab. (2016). Punjab Development Statistics. Retrieved from https://bos.punjab.gov.pk/system/�les/Dev-2016.pdf
zero energy de�cit which is expected to be achieved by 2018. Moreover, the key macro-economic policy levers such as interest rates, exchange rates and taxation lie in the domain of the federal government and thus restricts what the prov-ince can or cannot achieve in terms of economic performance.
In what follows, we will �rst look at some of the key statistics of the agriculture sector and its performance over the past decade. We will then move towards a rigorous analysis of the existing e�ciency gaps in agriculture where we estimate an e�ciency frontier for all major crops and the actual crop e�ciency and performance are discussed against that bench-mark. We will then discuss the current agricultural pricing policy and market reforms proposed by the government. �e chapter will conclude by policy recommendations aimed at strengthening the performance of the agriculture sector and bolstering rural development.
P U N J A B ECONOMIC | REPORT
69

According to the Punjab Development Statistics of 2016, about 62 percent of the total area of the province is currently being utilized for agricultural activities, with 53 percent of the area sown and 9 percent fallow. �e total cultivated area in 2013-2014 was 12,667 thousand hectares, a marginal increase from the total cultivated area in 2004-2005 which was 12,489 thousand hectares. Punjab bears a large share of the total area cultivated for all major crops in Pakistan (Figure 1) and contributes more than 50 percent of the total volume produced of all major crops (Figure 2), indicating that reforms aimed at improving Punjab’s agricultural growth are crucial for advancing the country’s overall agricultural sector perfor-mance.
Sargodha leads as the division with the highest degree of land utilization, but there are no substantial di�erences in land utilization across divisions, indicating a spatially even usage of land across the province (Figure 3).
Punjab plays a dominant role in virtually all sectors of Pakistan’s economy. �e data (Figure 2), however, shows a jump in the provincial share relative to reported national Gross Domestic Product (GDP) in the two latest years. �is results from the addition of communication’s value added at the provincial level. Following on from the devolution, communi-cations have been provincialized for collection of revenues and taxes since 2013. Consequently, the accounting data re�ects provincial �gures from 2014 under this head (these �gures were not available at provincial level before this date). In addition, Figure 3 shows that performance of Punjab’s economy moves in tandem with the national economy. �e growth rate of just over 5 percent per annum in the most recent period 2015-16 is the highest ever since the low of 1.5 percent per annum in 2008. �is performance is still short of the 8 percent per annum target set in the Growth Strategy 2014. However, it is pertinent to mention that the target set in the Growth Strategy 2014 relied on the assumption of
zero energy de�cit which is expected to be achieved by 2018. Moreover, the key macro-economic policy levers such as interest rates, exchange rates and taxation lie in the domain of the federal government and thus restricts what the prov-ince can or cannot achieve in terms of economic performance.
In what follows, we will �rst look at some of the key statistics of the agriculture sector and its performance over the past decade. We will then move towards a rigorous analysis of the existing e�ciency gaps in agriculture where we estimate an e�ciency frontier for all major crops and the actual crop e�ciency and performance are discussed against that bench-mark. We will then discuss the current agricultural pricing policy and market reforms proposed by the government. �e chapter will conclude by policy recommendations aimed at strengthening the performance of the agriculture sector and bolstering rural development.
3.1 Key Statistics of the Agriculture Sector
0
2000
4000
6000
8000
10000
Wheat C on Rice Sugarcane Maize
Thou
sand
Hec
tare
s
Pakistan Punjab
Figure 1: Area under Cul�va�on by Crop: Pakistan & Punjab
Figure 2: Crop yields over �me (Punjab)
Source: Punjab Development Sta�s�cs, 2016
0100200300400500600700
0102030405060
1985
-86
1986
-87
1987
-88
1988
-89
1989
-90
1990
-91
1991
-92
1992
-93
1993
-94
1994
-95
1995
-96
1996
-97
1997
-98
1998
-99
1999
-00
2000
-01
2001
-02
2002
-03
2003
-04
2004
-05
2005
-06
2006
-07
2007
-08
2008
-09
2009
-10
2010
-11
2011
-12
2012
-13
2013
-14
Yield
of Su
garc
ane (
40 K
g/Ac
re)
Yield
sof W
heat
, Rice
,Con
,an
d M
aize
(40 K
g/Ac
re)
Wheat Rice Co n Maize Sugarcane
Source: Agriculture Sta�s�cs (Various Issues)
P U N J A B ECONOMIC | REPORT
70

Figure 3: Land U�liza�on by Division in Punjab (2014-15)
Figure 4: Produc�on of Major Crops: Pakistan & Punjab
Source: Punjab Development Sta�s�cs, 2016-17
0
500
1000
1500
2000
2500
Thou
sand
Hec
tare
s
Net Sown Current Fallow
0
10000
20000
30000
40000
50000
60000
70000
Wheat C on ('000 bales) Rice Sugarcane Maize
Thou
sand
Tonn
es
Pakistan Punjab
Source: Punjab Development Sta�s�cs, 2016
Figure5: Yields of Major Crops
P U N J A B ECONOMIC | REPORT
71

Source: Punjab Development Sta�s�cs, 2016
Figure 6: Cropped Area by Crop in Punjab (2014-15)
P U N J A B ECONOMIC | REPORT
72

�e yield for major crops in Pakistan (and Punjab) is below 50 percent of the progressive farmer’s yield. Progressive farm-ers usually have a history of �xed investments in capital, more capacity and experience of expanding productive activity. In addition, there is an active engagement with the end-market for produce, and a disposition to innovation through adopting and responding to technology.
3.1.1 Key Trends in the Agriculture Sector
Source: IFPRI, 2016
Figure 7: Mode of Irriga�on in the Punjab (2014-15)
Figure 8: Na�onal Average as a Share of Progressive farmer yield for Major Crops
Source: Punjab Development Sta�s�cs, 2016
P U N J A B ECONOMIC | REPORT
73

In addition to this, yields for major crops in Punjab lag behind yields for the same crops in comparable countries.
Low crop yields, amongst other factors, has resulted in Pakistan going from being a leader in Total Factor Productivity growth amongst comparative agricultural countries to lagging behind Bangladesh, India and Vietnam amongst others.
Concurrently, trends show that farm fragmentation has increased, with the percentage of farms with a total landholding size of less than 2 hectares going up. �is appears to have been due to a decrease in the percentage of farms with a landholding size of 2-5 hectares, 5-10 hectares, 10-20 hectares and 20-60 hectares with no corresponding increase being registered in large farms (landholding size of 60 hectares or more).
Table 1 : Comparison of yields across countries
Wheat Paddy rice Maize Sugarcane Co n Pulses
Yields in t/ha
Punjab 3.2 2.1 2.9 50 2.2 0.8
India 4 3.5 2.9 63.9 1.2
China 4.8 5.5 5.3 70.6 3.5 1.7
Vietnam 6.7 4Source: , 2016.IFPR I
Vietnam
3We didn’t �nd more recent numbers for TFP growth for these countries.
Source: IFPRI, 2016
Source: IFPRI, 2016 and Punjab Development Sta�s�cs, 2016.
Figure 9: TFP Growth3 in Agriculture
P U N J A B ECONOMIC | REPORT
74

�e gross value added of the agriculture sector as a whole and of its subsectors has also not shown any substantial increase in the past decade, with there being a decrease in value added by crops in the last year.
�e dismal performance of the agricultural sector exists even though costs of inputs has not increased substantially over time, due to a large part to input subsidies put in place by the government. Agricultural subsidies add up to almost $1.4 billion in a year, being 3.5 times as large as the amount allocated to development expenditure on agriculture. Due to these subsidies, the retail prices of Urea and DAP fertilizers have fallen by 25 percent and 22 percent respectively, from 2015-16 to 2016-17 (Pakistan Economic Survey, 2016-17). In addition to these two major fertilizers, there is also a decrease in the prices of other fertilizers. �e fall in fertilizer prices due to the impact of government subsidies must have increased fertilizer consumption, or reduced the cost of fertilizers for farmers at any given level of consumption.
0
2005
-06
2006
-07
2007
-08
2008
-09
2009
-10
2010
-11
2011
-12
2012
-13
2013
-14
2014
-15
2015
-16
Rupe
esin
mill
ion
0
100000
200000
300000
400000
500000
600000
700000
800000
900000
1000000
Crops Co on Ginning Livestock Fishing Forestry Total
Figure 10: Farm Size Over the Years
Source: IFPRI, 2016 and Punjab Development Sta�s�cs, 2016.
Source: Punjab Regional Accounts Data, 2016.
Figure 11: Gross Value Addi�on by Agricultural Sub-Sectors Over Time
P U N J A B ECONOMIC | REPORT
75

Figures 12-16 below show that there has been a noticeable decline in the cost of pesticides and the cost of water inputs (including water drawn speci�cally through tube wells), since there has been no manifest increase in the cost of fertilizer between 2005-2006 and 2015-2016.
Source: Punjab Regional Accounts Data, 2016.
0
500
1000
1500
2000
2500
3000
3500
0
10000
20000
30000
40000
50000
60000
2005
-06
2006
-07
2007
-08
2008
-09
2009
-10
2010
-11
2011
-12
2012
-13
2013
-14
2014
-15
2015
-16
000N
/Ton
s
Rupe
esin
mill
ion
Fe lizer for major crops in Million Rs. Fe lizer for minor crops in Million Rs.
Fertlizer cons on in Punjab in 000N/Tons
2
Source: Punjab Regional Accounts Data, 2016.
Source: Punjab Regional Accounts Data, 2016.
Figure 12: Cost and Consump�on of Fer�lizer in the Punjab Over Time
Figure 13: Cost of Pes�cides Over Time
P U N J A B ECONOMIC | REPORT
76

Figure 14: Cost of Tubewell Water in The Punjab Over Time
4Please note that there was a decrease in diesel price index (2007-08=100) from 257.74 in 2012-13 to 157.60 in 2015-16 and an increase in the price index of electricity from 226.10 in 2012-13 to 293.22 in 2015-16. While the number of electricity generated tube wells witnessed an average annual increase of more than 8% as opposed to only less than 1% increase in the number of diesel generated tube wells. The opposing change in energy prices and increasing number of electricity generated tube wells may be the reason for the cost of tube well water remaining constant during the 2012-13 to 2015-16.
�e cost of tube well water has also remained constant over the past four years, re�ecting fuel price subsidies provided by the government.4 �ese government’s subsidies have subsequently either lowered or maintained input prices for farmers. Even though lack of increase in the cost of water has increased the total area irrigated by tube wells in Punjab over the same period, expected increases in crop productivity, yield and gross value added have not materialized.
Source: Punjab Regional Accounts Data, 2016.
Source: Punjab Regional Accounts Data, 2016.
Figure 15: Cost of Water in The Punjab Over TIme
P U N J A B ECONOMIC | REPORT
77

In the next section, we look at productivity and e�ciency gaps to analyse whether crop production in Punjab is reaching its e�ciency potential.
Agricultural production in Punjab has increased only by 8 percent in the last six years. �is increase has been mainly attributed to the increased production of major crops, whereas the share of major crops of Punjab has increased from 58 percent in 2009-10 to 65 percent in 2014-15 (Government of Punjab, 2016). However, minor crop production share has dropped in the same proportion within the same period.
Minor crops can be categorized based on their perishability. Relatively less perishable commodities can be stored for a longer time and can help in times of de�cits in supplies, thus, facing less price �uctuations. Whereas, the more perishable items cannot be stored for longer periods and hence the market faces a greater price �uctuation. �ese perishable crops are also categorized as cash crops. �e major cause of this price �uctuation can be explained by the Cobweb Cycle. Most farmers do not have perfect information about the future so they generally form their price expectations about future prices based on the current market prices of these crops. Like any individual, when farmers see the price of a crop to be high in today’s time period they expect that the price will be high in future period too, thus, decide to produce that crop in greater amount for the next time period which leads to a surplus of that crop in the coming period. When there is a surplus in the market, the price of the crop falls below the expected price of the farmers. Similarly, when the price of a crop is low, farmers form expectations about the price to be low in the coming period as well and reduce the production of the crop which leads to de�cit of the crop in the coming season and hence the price of the crop gets increased. �is Cobweb cycle of forming price expectations continues, leading to price instability in the goods market for perishables.
It is generally believed that shifting to cash crop production reduces poverty in the rural economy. Cash crops are often more perishable and experience more price uncertainty. As a result, farmers growing cash crops are at higher risk. It is believed that this risk deters the farmers from growing the high-return cash crops. Previously, when de�cits were experi-enced in the markets, perishable commodities were imported from India which �lled the de�cit gap and stabilized the market prices of perishables items. �is trade policy resulted signi�cant drop in domestic supplies mainly through decreased modern tunnel growing in the country. However, recently trade restrictions were imposed resulting price volatility once again.
�e government’s intervention to stabilize the market prices would be “welfare enhancing” by increasing supplies of these perishable minor crops. Currently, prices of these commodities are being controlled using the district administration which is not a sustainable solution. Instead, it is important that the government makes the farmers more informed about the future outlook on supply/demand and price expectations at macro level. Media and cell phone awareness campaigns can play an important role in achieving higher welfare levels by getting more stable market outcomes. Moreover, there is also a need for improved supply chains and modern storage facilities which will lead to better and longer storage time for
3.1.2 Minor Crops
Source: Punjab Regional Accounts Data, 2016.
Figure 16: Area Irrigated by Tubewells in Punjab Over Time
P U N J A B ECONOMIC | REPORT
78

Government of Punjab (2015a), “Punjab Sector Developmental Plan 2014-2024 Drinking Water, Sanitation and Hygiene”, Planning and Development Department , Government of Punjab, Lahore Government of Punjab (2015b), “Punjab Agriculture Sector Plan 2015”, Agriculture Department, Government of Punjab, Lahore.5Avila, A. F. D., & Evenson, R. E. (2010). Total factor productivity growth in agriculture: the role of technological capital. Handbook of agricultural economics, 4, 3769-3822.6Aigner, D., Lovell, C. K., & Schmidt, P. (1977). Formulation and estimation of stochastic frontier production function models. journal Journal of Econometrics, 6(1), 21-37.7Meeusen, W., & van Den Broeck, J. (1977). E�ciency estimation from Cobb-Douglas production functions with composed error. Interna-tional economic review, 435-444.
Availability of water for irrigation is a major concern in agricultural production in Pakistan and other countries around the world. Pakistan has one of the largest irrigation systems in the world with more than �fty million acres of irrigated land, �fty-six thousand kilometres of main canals, and more than one million tube-wells. Pakistan currently has only 1050 meters/capita availability of water and is categorized as high-water stress country (Government of Punjab, 2015a). Furthermore, on average, Pakistan receives 154 MAF of surface water annually from Indus River and its tributaries, 104.73 MAF is diverted for irrigation from which most of the water �ows into the sea (Government of Punjab, 2015a). In Punjab, more than 75 percent of the arable land is watered directly or indirectly through canal system. Farmers in Punjab are only being charged an average Rs 135/acre for canal water to irrigate their farms (Government of Punjab, 2015b). As a result of the current pricing policies of water, most of the farmers are using �ood irrigation technology to irrigate their crops. �e use of this ine�cient �ood irrigation technology along with the unregulated pumping of ground water is causing rapid depletion of water resources.
Low water charges for canal irrigation, limited water storage capacity, and excessive-use of groundwater are the major challenges for the policy makers in Pakistan. �erefore, an appropriate pricing strategy for canal water and regulated extraction of groundwater is required to address the problem of water scarcity and water use e�ciency in the country. An appropriate pricing strategy is needed to motivate the farmers in using water more sensibly to help improve allocative e�ciency in water use. Moreover, with the introduction of improved technology such as sprinkle and drip irrigation systems, farmers can use less water in a more productive way. Also, an improved water reservoir system is required in the country.
In addition to the district rankings presented in the Chapter Appendix that detail which areas were the most and least e�cient in terms of crop production, it is also interesting to understand the overall trends in e�ciency and the gaps from the potential e�ciency frontier.
For all major crops, e�ciency �gures have not improved signi�cantly in the past couple of years and on average, they hover around 80 percent. Maize has the highest production e�ciency at 82 percent whereas cotton production is the least e�cient (of the �ve major crops discussed) at 62 percent. �e production e�ciency for both rice and wheat in 2016 was 79 percent, whereas it was 72 percent for sugarcane.
�ese �gures exhibit that farmers were unable to utilize the full potential of the inputs made available to them. �ere are three kinds of productivity gaps that exist:
�is section will analyze and account for productivity and yield gaps in Punjab since the year 2007, and highlight the factors responsible for performance dips in the agriculture sector. �e framework of analysis for calculating yield gaps shall be similar to the one by Avila and Evenson (2010)5 and adopted in the previous report, in which three types of yield gaps shall be identi�ed and calculated for di�erent commodities (Avila & Evenson). �e empirical framework employed in this report involves a stochastic production frontier �rst introduced by Aigner et al. (1977)6 and Meeusen and Van den Broeck (1977)7 , which postulates the existence of technical ine�ciency in the production process. �is approach uses the concept of a frontier that depicts the maximum output obtainable from given inputs, where technical ine�ciency of a farm is estimated by deviations from the frontier.
3.1.3 Water Issue
3.2 Productivity and technical e�ciency analysis and capacity gaps
3.2.1 Is Production E�cient?
these commodities.
P U N J A B ECONOMIC | REPORT
79

P U N J A B ECONOMIC | REPORT
80
• Gap between the production frontier (unrealized potential output) and the realized output;• Gap between realized output in Punjab and that in comparable regions. Figure 9 shows that wheat, rice,cotton, sugarcane and maize yields in Pakistan are all lower than crop yields in India, China and Vietnam. Pakistan has also had a lower Total Factor Productivity growth compared to Bangladesh, India, China and Vietnam during 2002-2011;• Gap between production and progressive farmer yields (Figure 8). Yields in Pakistan are reaching only 50 percent of the progressive farmer yields (based on best farmer practices).
�ese e�ciency gaps can be attributed to input mix distortions created by the changes in input prices. Low prices of nitrogen-based fertilizers, for example, discourage farmers from using phosphate and potassium-based fertilizers: instead of using the mix that would be most e�cient for production, they use the mix as directed by input pricing. Subsequently, crop production does not take place at the frontier because the given resources are not being utilized in the best possible combination.
Although ine�ciency estimates indicate that there is still some room for improvement, these e�ciency �gures are not alarming. For almost all crops, production is occurring at 80 percent of the potential. �is indicates that further improve-ments in the agricultural sector would also require a shifting out of the production frontier itself: the determinants of this frontier would include improvements in input quality which include better seeds and better availability of water and fertilizer. �ese improvements cannot come only from agricultural subsidies that have resulted in low input costs, but from investments in agricultural innovation and integrated markets. In particular, directed e�orts at improving research and development are necessary to push out the production frontier. With improved variety of seeds and other inputs, and with the employment of progressive farming practices based on e�cient input combinations, it is possible to increase productivity and TFP growth in the future.

8The government no longer interferes in the market of rice, either through setting prices or through government procurement.
In the next section, we will review the current agricultural pricing policy and speak more about facilitative markets that are required to spur growth in Punjab’s agriculture sector.
�e agriculture sector holds strategic importance for the government of Pakistan since it must maintain food security while satisfying the urban consumer. �is has resulted in the food price dilemma, whereby commodity prices need to be high enough to incentivize production but low at the retail end to subsidize the urban consumer. Agricultural price controls are also intended to safeguard the farmers against sudden movements in international commodity prices; in order to do this, the government maintains the procurement price of wheat8 within a preannounced band, only partially transferring the e�ect of international prices to the domestic farmer and consumer.
Intervention in the wheat market occurs through the setting of a domestic procurement price. �e timing of the procure-ment price and its discrepancy from the international price are crucial for determining how the local market adjusts. It is important that the wheat price is announced before the wheat crop is sown to e�ect supply; in 2008, government announced price increases too late for it to have any e�ect on the year’s harvest of wheat. Furthermore, historically, the
3.3 Agriculture Pricing Policy, Integrated Markets and Financial Inclusion
Figure 17: Efficency of Wheat, Rice and Co�on-2010
P U N J A B ECONOMIC | REPORT
81

9Prikodhko, Dmitry and Zrilyi, Oleksandra. (2013). “Review of the Wheat Sector and Grain Storage Issues,” FAO and World Bank Coopera-tive Program.10Bureau of Statistics Punjab, Government of the Punjab. (2015). Punjab Development Statistics. Retrieved from https://bos.pun-jab.gov.pk/system/�les/Dev-2015.pdf
Table 2 lists the main government agencies responsible for wheat procurement in Pakistan. In addition to this, provincial agencies also partake in the procurement and storage of wheat. In April 2017, Punjab’s cabinet approved the wheat procurement policy for the year. �e government has set a target of purchasing 4 million metric ton wheat at the rate of Rs 1,300 per 40kg. �is evidence supports the continued active intervention of the government in wheat and other commodity markets in the agriculture sector.
�e government is the main buyer of almost two-thirds of farmers’ wheat production (they retain about one-third of their production for seed and household food consumption) with wheat procurement volumes often reaching 25 percent to 30 percent of total wheat production (Prikhodko and Zrilyi, 2013)9. �is high level of state procurement of wheat leaves little room for private sector trade and investment in the post- harvest supply chain.
Wheat procurement is �nanced largely by commercial banks that do not see lending to the government for procurement purposes as a risky enterprise, since the loans are backed by governmental guarantee. United Bank, National Bank, Muslim Commercial Bank, Habib Bank and Allied Bank (the top �ve �nanciers) decreased their total share of commodi-ty �nancing from 85 percent in June 2009 to 75 percent in September 2011. �e Food Department of the Government of Punjab borrows 37 percent to 48 percent of all the credit required for �nancing commodity purchases. �e Govern-ment of Punjab is followed by PASSCO, TCP and the Food Department of Sindh as other leading government borrow-ers (Prikhodko and Zrilyi, 2013). High interest rates constitute a signi�cant cost item in government wheat procure-ment, adding 11 percent (PKR 3,279/tonne) to the costs of purchasing wheat. To reduce government losses to zero, the government either needs to reduce the procurement price by about 16 percent or to increase its release price by 15 percent.
Punjab’s total wheat production in 2014-2015 was at about 19 million tonnes (Punjab Development Statistics, 2015)10, compared to the potential of 32 million to 38 million tonnes according to FAO estimates based on attainable yields of irrigated wheat in high-input farming systems in speci�c agro-ecological zones (Prikhodko and Zrilyi, 2013). �is lagging performance indicates that improving yields requires not only a focus on better input practices, but also on liber-alizing markets and encouraging public private partnerships.
procurement price of wheat has been set below the international price (particularly during the 2007-2008 food crisis, when a shortage in the international wheat crop caused international wheat prices to skyrocket). �is discrepancy induc-es further distortions in the domestic wheat market by encouraging farmers to hoard their wheat supplies or to illegally export them to Afghanistan. �e shortage resulting from large quantities of wheat export leads to price increases in the domestic market and has a considerable impact on food price in�ation.
After the food crisis of 2007-2008 passed, the government of Pakistan continued to maintain a high procurement price for wheat, which was signi�cantly higher than the international price; in January 2012, this was about $325/ tonne compared to the international price of $275/tonne. �e positive price discrepancy encouraged wheat imports and e�ect-ed sales of domestic produce.
Other than price support, both the provincial and federal governments are deeply involved in the procurement, handling and storage of wheat.
Table 2: Main Government Agencies and Mechanisms for Wheat Procurement in Pakistan, 2008
P U N J A B ECONOMIC | REPORT
82

3.3.1 Wheat Marketing and Engaging the Private Sector
3.3.2 Price Distortions and its e�ect on Crop Choice
11Burki, Abid and Khan, Mushtaq. (2005). “Wheat Marketing Reforms: Marketing Margins and Food Security in Pakistan,” Paper present-ed in South Asia Regional Conference of International Association of Agricultural Economists and IFPRI.
Ensuring pro�tability for the private sector in the market for wheat procurement and storage depends on high post-har-vest prices. In a paper on wheat marketing, Burki and Khan (2005)11 built an intra-year pricing model of wheat, assum-ing that wheat (a soft commodity) can only be stored intra-year and not across years. �e model develops an arbitrage condition, according to which private market pro�tability is positive only if the expected post-harvest price of wheat is higher than the sum of the opportunity cost of money committed to buying wheat at harvest time and the cost of storing wheat. More formally,
Simply put, the equation above indicates that expected post-harvest price must be greater than or equal to the sum of harvest price of wheat; per unit opportunity cost of committing money for wheat storage; and per unit storage cost. If we assume that the entry and exit in the storage market is free then the equality condition will hold in the arbitrage equa-tion above.
For the expected post-harvest price to be high, it is necessary that the government does not �x low release prices (often lower than the import price). Price controls work as a disincentive for private storage �rms to step in and bear the cost of storage. Although annual quotas have been introduced for wheat storage, these quotas alone do not ensure private market pro�tability in grain storage.
�is arbitrage condition has the following implications for government policy:• Government policies should not be announced in haste. Due to the absence of a second player, private market ing �rms made abnormal pro�ts in the early reform period which had an adverse e�ect on food security. Ideally, competition among private �rms should bring abnormal pro�ts to zero – this will ensure that the engagement of the private sector lowers government costs of procurement, while safe guarding government’s objective of food security;• Selling of strategic reserves at subsidized price serves as a major disincentive to �our mills to enter in the private storage market. �erefore, the government needs to gradually increase the release price relative to the procure ment price so that the incentives are present for millers to stay in the storage demand;• Ban on intra- and inter-provincial movement of wheat con�icts with the dual objective of food security and farm income stabilization. �is policy goes against the interests of wheat farmers because excess supply in wheat surplus provinces pushes harvest price down. Such a policy is also harmful for the interests of consumers in wheat de�cit provinces as it pushes price upward.
Price distortions also in�uence crop choice and diversi�cation, due to their e�ect on returns to family labour. �e calcu-lation of returns or pro�ts in agriculture adjust the conventional pro�t equation for the transfer earnings of a farmer. Whereas conventionally, pro�ts are calculated as:i.e. the di�erence between total revenue and total cost, for our calculation, returns to family farms, RFF, shall be de�ned as follows: RFF = TR – TVC – R
Where TR is total revenue, TVC is total variable cost and R denotes opportunity cost on �xed capital (or transfer earnings). �e equation above appreciates that farmers’ pro�t maximizing decision relies on pro�ts being calculated after
�e following outline proposed steps that the government of Punjab can take to create conducive markets in agriculture, particularly in the case of wheat:• Existing private grain elevators being utilized for other commodities may also be utilized for wheat, with the govern-ment o�ering long-term contracts for elevator utilization;• Use of �exible wheat storage options like silo bags until more permanent storage options can be constructed and utilized;• Innovative approaches for collateralized lending mechanisms could help expand post-harvest �nancing for producers, traders, processors and other agribusinesses (Baldwin, Bryla and Langenbucher, 2006).
π = TR – TC
P U N J A B ECONOMIC | REPORT
83

3.3.3 The Case of Targeted Subsidies - Kissan Package
In September 2016, the government announced a “Kissan Package” intending to lend �nancial relief to the small farmer. �e relief package is targeted to the poor farmers having 5 acres or less of land, so that they can purchase quality seeds and manure for increased production. Under the program, cash support amounting to a total of 32 billion is aimed to bene�t 1.6 million farmers. �e relief would be provided through interest-free loans to poor farmers for the 2016-2017 Rabi and Kharif harvests. During February 2017, the �rst tranche of funds was to be distributed to eligible farmers but the program found that it was di�cult to identify eligible farmers who were either landless or had small landholdings. �is led to a registration drive which may have bene�cial e�ects in the long-run for rolling out other �nancial inclusion packages for small farm-ers.Key features of the Kissan package are as follows:
• �e loan comprises a �ve-year-package aimed at facilitating 70 percent new borrowers either having small hold ings or those working as tenants. However, 30 percent of farmers are already availing the facility but in order to avail this facility they must have a clean credit history.• �e government intends to provide Rs. 25,000 per acre for Rabi crop and Rs.40,000 per acre for Kharif crop with three installments on seasonal basis;• After the third year, farmers will pay markup at 4 percent for the third year, 8 percent for the fourth year and 12 percent for the �fth year;• �e process includes a potential bene�ciary approaching a tehsil land record centre, where an o�cial uploads the required documents onto the Punjab Information Technology Board’s (PITB) e-portal. �e documents can then be accessed by two designated government banks: Zarai Taraqiati Bank and National Bank of Pakistan, and three PFIs: Akhuwat, Tameer Bank and National Rural Support Programme that analyse the documents and approach the bene�ciary for the loan approval process. Once the loan is approved, the tehsil land record centre o�cials are responsible for uploading land ownership/tenancy documents onto the e-portal.
including transfer earnings as a cost. Hence, if farmers enjoy pro�tability, i.e. as long as returns on family farms are great-er than the reservation wage, farmers continue operations. �ey only quit when returns go below their reservation wage, regardless of the economic pro�ts being earned in the conventional sense. Tables 6 and 7 in the Chapter Appendix calcu-late both conventional pro�ts as well as returns to family labour.
Government intervention in price a�ects returns to farmers, and thereby a�ects their cropping choice. Maize, rice and cotton are the major crops that usually register an exportable surplus. �e government cannot intervene with support prices for these crops due to their exportable surpluses as this policy would not be �scally feasible for Pakistan. Instead, an alternative short run policy which would be �scally feasible is to provide targeted input subsidies. However, due to food security concerns, Government does intervene in the wheat and sugarcane market with support prices and mini-mum prices, respectively. When international prices of wheat and sugarcane fall (as in 2016), domestic prices do not fall as much due to the Government’s support price policy. Farmers, with a preference for income stabilization, are more inclined to invest in wheat and sugarcane crops, resulting in signi�cant exportable surpluses even though traditionally these crops do not create any exportable surplus. When the price o�ered at harvest is low (due to shifts in international prices) but the cost at sowing is not low, permanent interventions through support price are not a sustainable solution. Instead, this phenomenon of international price drops should be addressed by temporary relief including short-term nput price policies and targeted subsidies towards wheat farmers – the Kissan package discussed below is one such exam-ple of a targeted subsidy that bases eligibility based on farmer’s owned acreage.
�e tables 6 and 7 (see Chapter Appendix) show a per acre comparison of costs of individual inputs, total costs, total revenues, returns to family labour, and pro�ts of �ve major crops in 2005-06, 2015-16, and 2016-17. �e costs and returns in 2005-06 come from a LUMS survey which covered 800 farms representing all farm sizes and all districts in Punjab. �e data in 2015-16 and 2016-17 come from a representative sample of Punjab collected by the Crop Reporting Department of the government of the Punjab. �e data clearly show that the cost of production either increased or stayed constant during the last ten years while the pro�tability and returns to family labour generally declined in the case of maize, rice and cotton between 2005-06 and 2015-16 with a slight recovery in 2016-17. A more alarming situation was observed for cotton and maize where pro�tability and returns to family labour were negative. In the case of wheat and sugarcane, where Government provides price supports, the pro�tability has either increased or stayed constant during this time. �ese results are quite consistent with our prior expectations.
P U N J A B ECONOMIC | REPORT
84

3.4 The 18th Amendment and Agriculture in Punjab
3.5 Agriculture in Punjab and Trade
12The Benazir Income Support Program is a federally administered targeted unconditional cash transfer to poor women, begun in 2007-2008.13Agriculture Department, Government of Punjab, 2016.14Pakistan Economic Survey, 2015-2016.
�e eighteenth amendment was passed unanimously by the parliament in April 2010, according to which �fteen minis-tries from the concurrent Legislative List were devolved to the provinces, with a convergent enhancement in the prov-ince’s �scal powers. Accordingly, the Food and Agriculture Ministry was also devolved to the provinces, with the powers of taxing agricultural income also falling under provincial purview. �e Punjab provincial government is now responsible for the rollout of targeted and across-the-board subsidies. Under this new role, the Punjab government has initiated the Kissan package and has also introduced fertilizer and water subsidies that have lowered input costs post 2011. �e cost of water, the cost of tube well irrigation and the cost of pesticides are reduced dramatically post devolution (Figures 13, 14 and 15).
�e overall production of wheat has risen post 2011, but there have been no signi�cant improvements in total factor productivity. �is points towards the need for the adoption of SMART agriculture, as elaborated below. �e total level of government intervention in the wheat market has risen post devolution in 2011, with the total level at USD 754 million in 2012. �is high level of intervention creates room for rent seeking, which has motivated the Punjab govern-ment to seek public-private partnerships in the promotion of better agricultural practices. Liberalization of agricultural markets is foremost in this matter, yet the concern remains muddied as the devolution did not result in the reallocation of PASSCO (Pakistan Agricultural Storage and Services Corporation) to the provincial level.
�e subject of seed testing and seed certi�cation has been reallocated from the Ministry of Food and Agriculture to the Ministry of Science and Technology, while PASSCO has been transferred to the Ministry of Commerce and then moved to the Ministry of Food Security. �e Punjab government demanded that the aerial survey should remain with the department of plant protection, whereas, seed testing and seed certi�cation should be devolved to the provinces and the Pakistan Agricultural Storage and Services Corporation (PASSCO) should also be transferred to the Punjab government, as food and agriculture fall under the provincial government.
Almost 80 percent of Pakistan’s total exports originate from agriculture directly and indirectly through forward linkages to agro-based industries (e.g., textiles), with Punjab’s share in it at almost 60 percent.13 In 2014-15, Pakistan’s major exports include cotton manufactures (54.9 percent), leather and leather manufactures (5.1 percent) and rice (8.8 percent). During 2015-2016, exports within the food group declined by 11.6 percent, with rice exports declining by 12.3 percent in value despite an increase in total production volume of almost 7.6 percent.14 Partially, this drop in export volume can be attributed to the drop in world demand during the same period. However, there has also been a drop in export shares with speci�c countries, such as with China, whose export share has dropped from 10 percent in 2014 to 8 percent in 2016, while the import share from China has improved from 17 percent in 2014 to 27 percent in 2016. �e food group also constitutes about 12 percent of the total import bill.
An important caveat in Punjab’s agricultural sector performance is the lack of investment in the value addition of commodities. Valdes (2013) suggests that introducing an incentive framework, which emphasizes that trade and price policies can direct the allocation of land, labour and water to higher valued uses by altering returns on infrastructure and other investments. �e government’s historical intervention in the pricing, procurement and storage of agricultural commodities, along with the presence of import tari�s on input commodities result in negative e�ective rates of protec-tion, reducing the incentive to shift towards high value-added production.
During the past two decades, the crop sub-sector has declined from 65 percent in 1990-1991 of agricultural value added to 42 percent in 2010-2011. Livestock’s share has increased from 30 percent to 50 percent on an average over the same
`
�e Punjab Government has recently launched a registration drive for small farmers who face di�culties in accessing tenancy documents from landowners. Considering a previous similar registration drive launched by the Benazir Income Support Program (BISP)12, it is encouraging to see that such an initiative will facilitate small farmers towards �nancial inclusion. Although the package may be criticized for not being accessible to the poorest of the poor due to illiteracy concerns, the government’s performance with BISP has shown that such hurdles can eventually be overcome, leading bene�ciaries to enjoy not only from the targeted program but also from other �nancial opportunities
P U N J A B ECONOMIC | REPORT
85

3.5.1 Future Opportunities for Trade in Agriculture: The China-Pakistan Economic Corridor (CPEC)
15Punjab Development Statistics, 2017
�e China-Pakistan Economic Corridor is a collaboration of infrastructure projects being constructed in Pakistan, with the objective of developing an economic land belt along the original Silk Road route. It includes provisions for coopera-tion in the agriculture sector, including cooperation in management of water resources, livestock, and other �elds of agriculture. �is presents a unique opportunity for Punjab, not only to bene�t from investments in agricultural infra-structure, but also to exploit the potential for trade with China.
�e current Long-Term Plan for cooperation in agriculture includes the following focused areas:
• Planting and Breeding: Agricultural modernization along the corridor; guiding agricultural mechanization and scale production; demonstration projects in Punjab of improved varieties to improve productivity;• Agricultural Products Processing: Introducing modern agricultural product processing equipment and f acilities; an agricultural industry cluster could be built around Islamabad and Lahore to create a processing base which satis�es international standards• Storage and Transportation of Agricultural Products: Warehousing and logistics facilities in Islamabad and Lahore to form a warehousing and logistics network system connecting cities and covering the area along the corridor; • Infrastructure Construction: An agricultural mechanization demonstration and leasing centre in Punjab to promote drip irrigation under plastic �lm and other water-saving agricultural techniques, and protected cultiva tion for the development of facility agriculture;• Epidemic disease prevention and control: A plant and animal disease prevention and control system should be established in Faisalabad and Lahore to reinforce R&D in view of the current cotton leaf roll virus and other plant viral diseases.
While CPEC focuses on the infrastructural development and technological exchange, Punjab government has three overriding objectives: to develop enhanced productivity, encourage farmer-centric service delivery and foster private-sec-tor led growth. �ese objectives can be met by pushing the sector to exploit trade opportunities with China, a country that has about $1 trillion of food consumption and has surpassed USA in becoming the largest food importer in the world (International Growth Centre, 2017). Figure 18, below shows that the world is already making use of this oppor-tunity by having increased their food exports to China in the recent years. Agricultural and food imports, however, have a major limiting factor: that of distance. Pakistan can bene�t from its location by exploiting the distance advantage, particularly in the export of food and agricultural commodities. �e top six categories of Pakistan’s exports to China in 2015 were all sourced in agriculture, with the highest value of exports being in cereals, followed by beverages, spirits and vinegar; edible fruit and nuts or citrus fruit; lac, gum, resins and other vegetable extracts; residue from food industries including prepared animal fodder. Even though Pakistan’s structure of trade with China is heavily dependent on agricul-ture, there have been a few missed opportunities.
period in Punjab 15. �e growth rate of the agricultural sector has declined, with a noticeable decline in the crop sub-sec-tor despite high international prices. �is low growth may in part be due to the government’s distortionary trade regime. A process of trade liberalization was started by the government in 1996, which by 2003 resulted in the elimination of quantitative restrictions and government procurement of commodities, as well as a lower of tari�s. However, in 2006, exemptions were reintroduced, particularly for speci�c commodities including wheat, sugarcane and rice. Along with these exemptions, Statutory Regulatory Orders (SROs) were also introduced, that could be used to create exemptions (sometimes full) for some tari�s and to increase others (Valdes, 2013).
P U N J A B ECONOMIC | REPORT
86

Pakistan’s rice exports to China rose in 2012, but have since then petered o�, even though there was an increase in world exports between 2012 and 2014.
Figure 18:China Agriculture Imports by Supplying Country: 2000-13
Figure 19:Pakistan’s Rice Exports
P U N J A B ECONOMIC | REPORT
87
Source: USDA, Economic Research Service Analysis of Chine’s Customs Sta�s�cs Reported By The Global Trade Atlas (2014)
Source: Interna�onal Growth Center, 2017
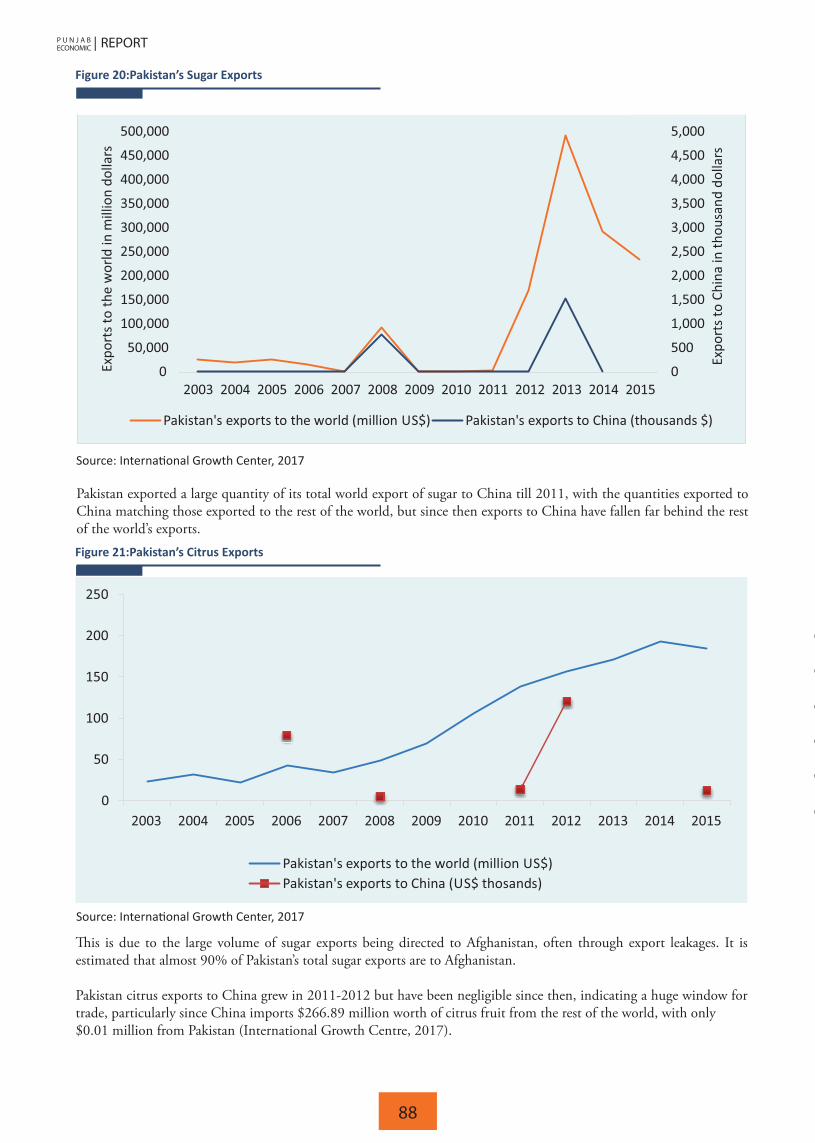
�is is due to the large volume of sugar exports being directed to Afghanistan, often through export leakages. It is estimated that almost 90% of Pakistan’s total sugar exports are to Afghanistan.
Pakistan citrus exports to China grew in 2011-2012 but have been negligible since then, indicating a huge window for trade, particularly since China imports $266.89 million worth of citrus fruit from the rest of the world, with only$0.01 million from Pakistan (International Growth Centre, 2017).
Pakistan exported a large quantity of its total world export of sugar to China till 2011, with the quantities exported to China matching those exported to the rest of the world, but since then exports to China have fallen far behind the rest of the world’s exports.
Figure 20:Pakistan’s Sugar Exports
Figure 21:Pakistan’s Citrus Exports
P U N J A B ECONOMIC | REPORT
88
Source: Interna�onal Growth Center, 2017
Source: Interna�onal Growth Center, 2017

16Mustafa, Khalid and Ahmad, Sarfaraz. (2003). “Barriers against Agricultural Exports from Pakistan: The Role of WTO Sanitary and Phytosanitary Agreement,” The Pakistan Devel- opment Review, 42:4. pp 487-510.
�e case for guavas and mangoes is similar, with exports to China falling o� after 2012. Again, China imports almost$260.01 million worth of guavas, mangoes and mangosteens from the rest of the world and only $0.01 million in this category from Pakistan. Pakistan’s total exports in this category are almost $184 million, UAE being its largest export partner.
�e government of Punjab can leverage the opportunities presented by CPEC by focusing on the following areas:
Examining and negotiating existing tari� structures with China, and ensuring that they are at least at par with those faced by other countries and trade associations such as ASEAN; Evaluating non-tari� barriers including Sanitary and Phytosanitary (SPS) requirements imposed on goods sourced in Pakistan; Addressing existing market distortions that adversely a�ect both the volume and direction of trade and encouraging market based reforms in the agriculture sector; Using CPEC cooperation and technical expertise to improve infrastructure networks, particularly those focusing on irrigation, water supply and post-harvest storage and marketing; Institutionalizing public-private partnerships, especially in the area of post-harvest storage, handling and marketing; Incentivizing exports through informational interventions (an alternate to direct price and quantity-based inter ventions).
�e alleged excessive use of pesticides has obstructed Pakistani agricultural products from being exported to destination countries since they do not meet hygiene standards stipulated by the WTO. �is category of restrictions, labelled Sanitary and Phytosanitary (SPS) measures pose a signi�cant challenge for Punjab’s agricultural exports. While quality accreditation bodies exist in the country, it is necessary to synchronize their quality control measures with those expected by the WTO. According to Mustafa and Ahmad (2003)16, “e�ectively targeted and appropriate technical assistance and greater regional co-operation between Pakistan and other developing countries in South Asia should be accorded priority in these initiatives” (see Table below).
3.5.2 Meeting WTO Standards
Figure 22:Pakistan’s Exports in Guavas, Mangoes and Mangosteens
P U N J A B ECONOMIC | REPORT
89
•
Source: Interna�onal Growth Center, 2017

17Siddiqui, Rehana; Samad, Ghulam; Nasir, Muhammad and Jalil, Ha�z Hanzla. (2012) “The Impact of Climate Change on Major Agricul-tural Crops: Evidence from Punjab, Paki- stan,” Pakistan Institute of Development Economics.
According to Punjab Board of Investment and Technology (PBIT), the government signed a Memorandum of Under-standing with USAID with a focus towards promoting Punjab as a desirable destination for investment in agriculture. �e objective of the MoU is to encourage investment and job creation in the Livestock, Dairy and Horticulture subsec-tors, while stimulating the business environment in the province that can also overcome challenges in trade. �is will be carried out through the USAID funded Punjab Enabling Environment Project which is a �ve year, $15 million project.
With its focus on forging public-private partnerships and illuminating trade and investment areas for both domestic and international investors, the project can be helpful in developing trade with China via CPEC. With all e�orts now promoting market-based reforms instead of interventionist policies, it can be hoped that a less distortionary trade regime will emerge for Punjab’s agricultural sector.
3.5.3 Memorandum of Understanding with USAID
Extreme temperatures and a changing global climate have serious implications for the future of agriculture in Punjab. Changing climate a�ects both cropping patterns as well as crop productivity through changes in temperatures and precipitation levels. A recent study by Siddiqui et al (2012)17 �nds that the impact of climate change is statistically signi�-cant (over crop productivity and climate data for Punjab from 1980-2008) and that it di�ers by type of crop, by the crop-ping stage and by district. �e study’s estimates show that increasing temperatures have a non- negative impact on wheat production, but have a negative impact on the production of rice, cotton and sugarcane. In most cases, increase in temperature has a positive impact on production up till a certain optimal temperature (27 degrees Celsius in the case of rice), after which the impact turns negative. Furthermore, precipitation’s impact on the production of rice is almost negli-gible since most rice agriculture in Pakistan is supported by irrigation. �e optimal precipitations for the �rst two stages of wheat production are 111 mm and 84.50 mm respectively. �at is, beyond these optimal limits, further precipitation will adversely a�ect plant fruition. Both precipitation and temperature levels do not in�uence the wheat crop in the third stage. In the case of cotton, the results indicate that a one-degree centigrade deviation of temperature from the maximum required level (which is 32 degrees Celsius) during the whole period, reduces the production of cotton by 42.33 thousand bales. Similarly, a one- millimetere deviation of precipitation from the maximum required level (which 40 mm) reduces the production of cotton by 0.50 thousand bales. �is is a signi�cant loss in the production of cotton due to change in
3.6 Climate Change and Agriculture in Punjab
Table 3: Steps Needed to Meet the SPS Challenges
P U N J A B ECONOMIC | REPORT
90
Source: Mustafa, 2003.

�e livestock sector contributes around 11.39 percent to the gross domestic product (GDP) and about 56.3 percent to agricultural value added of Pakistan (Ministry of Finance, GoP)18. Gross value addition of the livestock sector has increased from Rs.778 billion in 2013-14 to Rs.801 billion in 2014-15, which translates to 3 percent in the value added of the livestock sector. Punjab’s share in the total number of Pakistan’s livestock is substantial; almost 54.8 percent of Pakistan’s cattle and 68.3 percent of the country’s bu�aloes are accounted for by Punjab. About 45.5 percent of all house-holds in Punjab own some form of livestock as an asset, and this percentage rises to 62.5 percent for rural households in the province (Multiple Indicator Cluster Survey for Punjab, 2014)19. Small, non- corporate dairy producers who earn incomes on a daily or weekly basis, dominate the livestock sector.
Compared to 2000, Punjab experienced a growth in the number of all types of livestock, with inter-census growth rates of cattle at 54 percent, cattle at 22 percent and goats at 27 percent.
3.7 Livestock and Dairy Sector
Table 4: Total Number of Livestock in Pakistan (in million), 2010-11 & 2016-17
Figure 23: Number of Livestock
the climate variables. For sugarcane, the most important and vulnerable stage is third or vegetative stage of production, when an initial increase in temperature causes increase in productivity which may be possibly the optimal temperature ranged from 28-38 degrees Celsius in this stage.
Although these studies have their statistical limitations, they have shown that climate change has real and adverse impli-cations for the future of agriculture in Punjab. �e government’s continued e�orts in collecting better climate- related data and crop data can assist better studies to estimate the impact of climatic changes. Subsequently, awareness about these climatic patterns and the changes that they may require in cropping patterns, seed type and quality as well as irriga-tion practices, should be communicated to farmers. Subsidies such as the “Kissan package”, may be made contingent on the farmers attending information sessions where such knowledge is made accessible. Another concern is the impact of agriculture itself, on climate: deforestation for agriculture and the use of methane and nitrate fertilizers may lead to further environmental degradation and worsening temperatures. Fertilizer subsidy policies and farmer usage should also be informed by its subsequent climatic impact.
18Pakistan Economic Survey 2016-1719Bureau of Statistics, Government of The Punjab. (2014). The Multiple Indicator Cluster Survey (MICS) Punjab. Retrieved from http://-bos.gop.pk/mics2014
P U N J A B ECONOMIC | REPORT
91
Source: Punjab Development Sta�s�cs, 2015.
Source: Punjab Development Sta�s�cs, 2015, Pakistan Economy Survey, 2016-17.

�is growth rate was experienced across the entire province, with almost all divisions experiencing growth rates for cattle and goats.
Figure 24: Ca�le by Division Over Time in Punjab
Figure 25: Buffaloes by Division Over Time in Punjab
Figure 26: Goats by Division Over Time in Punjab
P U N J A B ECONOMIC | REPORT
92
Source: Punjab Development Sta�s�cs, 2015.
Source: Punjab Development Sta�s�cs, 2015.
Source: Punjab Development Sta�s�cs, 2015.

20USAID (2009). Pakistan’s Food and Agricultural Systems. http://pdf.usaid.gov/pdf_docs/Pnado507.pdf21http://www.pndpunjab.gov.pk/system/�les/ADP%202014-15%20LIVESTOCK.pdf
At the same time, selling milk to the milk processing industry has been a popular choice 10 years ago, but this pattern has changed since dairy farms who sell milk to the milk processing industry has declined by 14 percentage points over the two survey rounds, which should be a matter of concern for the processing industry (Burki and Khan, 2016). Despite growth in the number of livestock, per animal productivity has not increased by much. Due to the lack of a recent livestock census (the last one was conducted in 2006), productivity measures are dated. However, the LUMS survey (2014) further documents that returns to small farms have dropped and that incentives to sell to milk processing indus-tries have dropped signi�cantly.
�e poultry sub-sector in Punjab is small but has su�ered some set backs in recent years, mostly due to increase in costs of maintenance and power shortages. Around 2009, the industry experienced incredible growth in response to a 20 percent increase in demand for Pakistani poultry at home and in Afghanistan. Modern farming techniques have been employed, including environmentally controlled houses. However, a government ban on exporting poultry to Afghani-stan in 2010 resulted in the shutting down of poultry farms, with the total number declining from 25,000 to 22,500 in Punjab. High prices of poultry feed, electricity shortages and the inability to combat widespread poultry diseases have discouraged farmers from diversifying into this sub-sector. �ere is very little value addition in the industry. Most poultry are slaughtered in open and unhygienic markets. Other areas for expansion include frozen poultry, already exported to Pakistan’s neighbours from France and Brazil; however, Pakistan’s cost structure makes the industry uncompetitive, regionally and globally.20
Currently, the Punjab Government is focusing on the following objectives for its livestock sector21 (Planning and Devel-opment Department, Government of Punjab, 2017):• Promote per animal productivity rather than increasing livestock numbers by appropriate measures to improve the genetic potential;• Encourage the livestock farmers, to adopt improved methods of animal husbandry by demonstrating greater e�ciency and better returns as compared to traditional methods;• Divert focus to enhance the quantity and nutritional quality of feed and fodder supplies and its processing;• Transforming of livestock business from subsistence to the commercial venture;• Reformulate regulatory regime to attract private investment; and• Involve community organizations and joint ventures with foreign investors in the �eld of livestock production.
Table 5: Change in Distribu�on of Sample Dairy Farms by Mode of Selling Milk
P U N J A B ECONOMIC | REPORT
93
Source: LUMS Survey of Dairy Households in Rural Punjab, 2005 and 2014.

�e Livestock and Dairy Development Department, Government of the Punjab has taken several vital initiatives for the uplift of Livestock sector in Punjab. Some of these initiatives included: 1st Livestock and Dairy Development Policy, Paradigm Shift (From Curative to Preventive), Livestock Breeding Act (2014) and Establishment of Livestock Breeding Services Authority, Mobile Hospitals, Dispensaries, Labs and Bikes, Poverty Alleviation Scheme, Mass Vaccination Cam-paigns, 9211 Virtual Governance System, Punjab Animal Food Stu� and Compound Feed Act (2016) and Crackdown against Spurious Khalbanola, Save the Calf / Calf fattening Scheme, Community Facilitator Project, Duck Distribution, Capacity Building Training of L & DD Sta�, Ostrich Farming and Revitalizing of Disease Diagnosis and Surveillance setup in Punjab and among others include Rehabilitation and Mechanization of Government livestock farms.
�e Initiatives regarding Mobile Veterinary Dispensaries (MVDs) and Mass Vaccination Campaigns have protected livestock animals against diseases, which has led to increased milk and meat production along with improves health of the animals. �e Poverty Alleviation Scheme aimed at improving the economic status of the women in the villages of Punjab through involvement in productive livestock activities. Under the scheme poor women were provided with heifers, sheep/ goats and poultry.
In 2015-2016, the Punjab Government allocated 1.79 percent of its annual development program fund towards the livestock sector, which was a 2.6 percent decline from the previous year. It is evident that the Government focuses more on the crop sub-sector than on livestock and dairy. With the increase in demand for milk and milk products and the potential for export o�ered by the China-Pakistan Economic Corridor, the Punjab Government should focus on strength-ening farmer-to-market linkages and on ensuring a steady �ow of supply from farmers to the milk processing industries.
�e maintenance of land records in Punjab was historically managed by the Board of Revenue, responsible for the collec-tion of taxes on land. Land records were kept in cloth bags by patwaris, who were the lowest-level administrative tax o�cers in the province. Any restructuring of land, sales or rental process had to be whetted by the patwaris, a label that has almost become synonymous with corruption. In addition to corruption, making land rights secure and easily trans-ferable is crucial for expanding land markets in the province. Lack of access to land records, tenants’ insecurity, disputes over land rights and an unequal distribution of land have been crucial hindrances to rural and agricultural development in Punjab. Further, the long-winded process of accessing land records through patwaris, which could take as long as two months and several bribes, has also isolated women from their rightful share of land holdings. Unfair divisions of land in inheritance has disadvantaged women who were unable to privately access land records.
�e Land Records Management Information System (LRMIS), launched in March 2016, is a landmark project of the government of the Punjab that has transferred the cloth-based records to a digital system, making them accessible to owners at a small fee. �e Project has been rolled out in all 36 districts of Punjab and has successfully tested linkages between the land records system and the deeds registration system. It has successfully reduced transaction time from 2 months to around 45 minutes, with land record services now being provided on an automated basis through 150 Tehsil Centres. While the Board of Revenue provides direction to the implementation of LRMIS at the provincial level, local district level data is being collected through the establishment of about 150 Arazi Record Centres. For data validity and completion, scanned images of village maps (masawi) are available in the database in the service centre to identify the piece of land. At the same time, all records are also available with the patwari whose help can still be summoned before approaching the service centre.
In Punjab, the LRMIS will help tackle the high transaction costs and di�culties associated with the previous system of land records, that imposed signi�cant harm to land owners (particularly the poor who had smaller land holdings and less access to information). �is made them especially vulnerable to the predatory behaviour of middlemen and a�ected the liquidity of family assets as a whole. Obstructions in recording and transferring land, which is also a form of capital, a�ected the potential income that could be generated from that land through rent, cultivation, sale or access to credit. Well-de�ned land rights are crucial for productive development and factor market functioning. �ey also have signi�cant empowering e�ects, particularly for women to whom the succession law can now be easily applied.
As a whole, LRMIS is not only an initiative to digitize land records, but also an example of a technology based interven-tion that can directly address social exclusion and women integration. With the one-year transition phase of the project almost complete, it can be hoped that the patwari culture and its attendant corruption will decline in the future. A recent agreement of the Punjab government with the Bank of Punjab to open a counter in the service centres will further improve LRMIS.
3.8 Land Record Computerization - LRMIS
P U N J A B ECONOMIC | REPORT
94

�e road to economic development for a province like Punjab, where around 68 percent of the population is classi�ed as living in rural areas, depends on policies focused on rural development. �e agriculture sector, de�ned broadly to include the crop, livestock, forestry and �sheries subsectors, employs almost 51 percent of the rural workforce in Punjab; therefore, policies focused on raising farm incomes have a direct impact on rural incomes. Further, rural development also encompasses increasing these areas’ accessibility to urban centres, reducing their need to travel out of town for neces-sities including health and education, improving their infrastructure through the provision of electricity and gas while expanding opportunities for non-farm employment.
3.9 Rural Development in Punjab
Educational attainment continues to be a challenge for rural Punjab, with an estimated 54.6 percent of people being literate compared to 62 percent in urban areas. Less than half of all females in rural areas are literate (44.6 percent) while around 65 percent of all males have obtained some form of education. It is important to note here, that not only are these numbers estimates based o� the 1998 census �gures, they also mask the quality of education provided in rural areas. Simple literacy ratios are insu�cient to compare the gradations of educational attainment present in the province, with rural areas losing out due to single teacher and ghost schools, which su�er from unstable attendance and functionality. �e primary school Net Attendance Rate in rural areas was 54 percent in 2014, compared to 68 percent for urban areas of Punjab (Punjab MICS, 2014).
Health institutions in rural areas have not registered any signi�cant improvement, with Rural Health Centres increasing only marginally from 337 in 2012 to 350 in 2015, and the number of Basic Health Units decreasing by 36 units between 2012 and 2015 (Punjab Development Statistics, 2016). Child mortality indicators are heavily skewed in rural areas, with under-5 mortality rate at 105 per 1,000 births compared to 69 per 1,000 births in urban areas and infant mortality rate at 83 per 1,000 births compared to 57 per 1,000 births in urban areas.
�e agriculture sector provides the largest source of employment in the rural areas. However, skewed ownership struc-tures have limited income generation opportunities for rural workers. Only 41.1 percent of rural households exhibit any form of land ownership (this does not comment upon the actual size of the landholding), and 62.5 percent of the house-holds’ own livestock. According to the Agriculture Census of 2010, 68 percent of owned farms in Punjab have an area of 5 acres or less and 75 percent of owner cum tenant farms have an area of 12.5 acres or less.
Households that identify as non-agricultural, comprise 50 percent of all rural households in Punjab, with 27.5 percent of the agricultural households being mainly livestock households and 72.5 percent being farm households. Non-agricul-tural labour is an important source of income for rural households, with 33 percent of all rural households citing it as a source of income. �is is true both for agricultural and non-agricultural households; nearly 27 percent of agricultural households draw income from non-agricultural labour. �e largest proportion of non-agricultural households (38.7 percent) cite non-agricultural labour as a source of income.
Rural area development should be two-pronged: focusing on improving the existing infrastructure thereby facilitating the current structure of the sector to generate higher incomes and diversifying the sources of income available to the rural sector by investing in education and non-farm related production activities.
3.9.1 Rural Development Indicators
�e Punjab Rural Support Program (PRSP), initiated by the Government of Punjab, uses a community-led approach to poverty alleviation in the province. Community driven development programs, encourage group mobilization and active participation by community members to improve their wellbeing. Social mobilization is incentivized through the provi-sion of skills, the need to provide social capital for credit creation, and the introduction of voting to choose local capital and public works projects. Such a process is meant to better identify local level priorities and sustain a process of diversi-�ed growth of economic, human and natural resources at both the household and the village level.
Currently, the PRSP is running initiatives focused on health, education and access to credit. For their primary and reproductive health initiative, they have partnered with the Punjab Poverty Alleviation Fund for up-scaling and increas-ing the number of basic health units and paramedical sta�. �eir education initiative builds on community partnership: they received an Rs. 81 million development grant from the Education Department to set up 300 Community Primary
3.9.2 Key Policy Initiatives and the Provision of Public Goods
P U N J A B ECONOMIC | REPORT
95

22Communication and Works Department, Government of the Punjab
Evidence-based research has shown that community led development has a signi�cant impact on household level devel-opment indicators; the World Bank is engaged in multiple education and health related programs that are modelled on engaging community members to play leadership roles in development initiatives. However, addressing rural poverty requires more than just community engagement. To facilitate the functioning of agricultural and non-agricultural land and labour markets, the government needs to initiate market reforms while investing in infrastructural projects.
Market reforms should include reforms to restructure land ownership amongst the poor since small landholdings and exploitative tenancy contracts are amongst the proximate determinants of household level rural poverty. �ere is also a need to develop infrastructure that generates a demand for non-agricultural labour. Diversifying away from agricultural livelihoods allows rural households to guard against sudden income shocks that are a hallmark of the agriculture sector, to achieve year-around employment opportunities and to acquire skills more pertinent to value- added production. �e development of infrastructure has taken a strong hit, particularly from the energy shortage in the province that has set back previous e�orts to improve rural electri�cation. Farm to market road mileage in Punjab has increased by around percent by 2017.22 �e development of these roads is central for satisfactory transportation of agricultural commodities including fresh produce.
Improving educational attainment, provision of health services, construction of infrastructure and the involvement of the community in spearheading these development initiatives, is necessary to push forward an impactful provincial rural development strategy. Whereas agricultural pricing policies and reforms pertinent to farm households are crucial, it is also necessary to focus on developing markets for non-agricultural labour to e�ectively tackle rural poverty in Punjab.
Initiatives that the government has undertaken to push the agriculture sector in this direction include the farmer-targeted subsidies through the Kissan card, encouragement of the private sector to participate in wheat procurement by announc-ing that wheat procurement will be brought down to 1 million tonnes from 5 million tones and encouraging the use of ICT based solutions by �oating interest-free loans to poor farmers disbursed through an online portal.
3.9.3 Addressing Rural Poverty and the Way Forward
�e Punjab Growth Strategy aims for inclusive development, encouraging the agriculture sector to adopt information communication technology (ICT) for farmer-centric service delivery, enhance productivity and promote private sector led growth. �e paradigm shifts that comprise Punjab’s vision are highlighted in the table below:
3.10 Next Steps: Towards Agricultural Innovation and SMART Agriculture
Schools. �ese schools are intended to be run by Village Education Committees composed of village members responsi-ble for the administration and �nancial handling of school accounts. �eir second education initiative provides support for public schools whereby management of public schools has been transferred to NGOs for better functioning. �e PRSP is also co-running an interest-free loan program to provide access to credit for the rural poor; this program is also run in collaboration with the Punjab Poverty Alleviation Fund.Other initiatives being undertaken by Local Government and Community Development in Punjab include:
• Elimination of sewage ponds from villages;• Establishment of Cattle Market Management Companies to improve the livestock trading environment and to discourage extortion and corruption. Nine companies in each division have been established; and• Clean Drinking Water for All initiative whereby 307 water �ltration plants have been installed;• Khadim-e-Punjab Rural Roads program.
Table 6: Paradigm Shi�s in Punjab’s Vision for Agriculture
P U N J A B ECONOMIC | REPORT
96

Figure 27 above shows that agricultural loans disbursed by the �ve big commercial banks have registered a substantial increase compared to only a slight increase in loans disbursed by the Zarai Taraqiati Bank Ltd. �is trend indicates the increasing importance of the private market in bolstering Punjab’s agriculture sector. It is important to note that Punjab’s economic climate is still marked by security challenges. Improving public private partnerships in the context of a security state can be undertaken with the government acting as a middleman. �is is the case in the introduction of cash grant and loan programs like BISP and the Kissan package as they reduce the risk for commercial banks by pitting the government as a guarantor. At the same time, development is not an objective for commercial banks which may lead to errors in disbursement (as the government disburses to the bank with the bank disbursing to the bene�ciary). While the use of technology for registration, identi�cation and authentication will slowly become a default requirement in a security state like Pakistan, steps need to be taken to ensure that poor and illiterate farmers are adequately educated to fully utilize these programs.
An increasingly liberal market structure, a cap on commodity prices and �nancial inclusion for farmers are the steps needed to push crop yields towards the e�ciency frontier and to push the frontier to new limits.
Short term �xes that have been proposed under the Asian Development Bank’s Formulation Strategy 2017-2018 include:
• Completion, consolidation & operationalization of key projects;• Increasing focus on PPPs with government investments acting as a catalyst;• Special Development Programme targeted towards the poorest districts;• Enhance focus on private sector development & regulatory reform;• Increased focus on population issues, income generation & skills;• Innovation & research to inform service delivery projects;• Stronger alignment to attain Sustainable Development Goal commitments; and• ring discipline to the ADP process – departmental performance management and project prioritization matrix.
Given the sector’s yield and productivity performance, it appears that input subsidies that have signi�cantly brought down input costs have not substantially improved either crop yield or crop acreage. Instead, innovative solutions focusing on engaging the farmers and facilitating private markets are needed. It is encouraging that the roll-out of BISP (although not directly related to agriculture but targeting a large rural population in Pakistan) has already introduced a technologi-cally diverse system of �nancial inclusion. �e introduction of the Kissan package and the Kissan card will further the same inclusion, bridging the gap between commercial banks and credit starved farmers. It will also induce competition that might introduce competitive loan rates even when the Kissan package is rolled back later.Figure 27: Disbursement of Agricultural Loans
P U N J A B ECONOMIC | REPORT
97
Source: Punjab Development Sta�s�cs, 2016

Let us assume that the crop production technology be represented as a function:
Yi = f (Xi, β) evi-ui
Where Y is the output of crop per acre on the ith farm, Xi is the vector of inputs and β is the vector of parameters estimat-ed as a result of running this model. �e stochastic error term is decomposed into two parts: v and u. �e former represents random variation in output due to factors that are exogenous to the farm whereas the latter, a positive random variable, captures farm speci�c ine�ciency re�ecting the gap between the farm’s actual output and the potentially realiz-able e�cient output. �is means that if u=0, then the farm is producing at the frontier and is achieving the maximum level of e�ciency.
A two-stage procedure is adopted to carry out this estimation. In the �rst stage, the farm-speci�c stochastic frontier is estimated. Subsequently, in the second stage, technical ine�ciency (X-ine�ciency) e�ects are regressed on a vector of e�ciency determinants as well as on farm characteristics that can potentially a�ect the ine�ciency of a farm.
We do this simultaneously using the FRONTIER Software and follow the model of technical ine�ciency e�ects for cross sectional data introduced by Battese and Coelli (1993, 1995).
�e technical ine�ciency e�ects are assumed to be a linear function of explanatory variables given by:
In sum, Y is the crop output or yield obtained from a farm in per acre terms, X represents the inputs employed in the production of that output (these can be continuous or dummy variables), U represents the technical ine�ciency, Z represents variables that are potential determinants of ine�ciency and ε is an unobservable random variable obtained by the truncation of normal distribution with mean zero and variance σ2.
�e input vector, X, includes the same variables for each crop. �ese include the (log of ) quantity of seed, urea, DAP, other fertilizer, and the number of times water is given to the crop. We further include three dummy inputs: whether or not pesticide/weedicide sprays were applied, whether or not the crop was a�ected by a disease attack and whether or not gobber (cow dung) was used as a fertilizer. In the second stage, district and farm level characteristics were included as determinants of ine�ciency. �ese variables, captured by vector Z, include dummy variables for seed type (home and certi�ed), soil type (chikny, sandy and kalrathy), treatment of seed (treated and untreated), and the mode of irrigation (canal, tube well, mix and nil) for each district. In addition, district level control variables such as the number of reported crimes, the literacy rate and road density are also included in the model.
�e results indicate that Gujranwala was the most e�cient in wheat production in 2013, Pakpattan was the most e�cient in 2014, Sheikhupura was the most e�cient in 2015 and Lodhran was the most e�cient in 2016. On the other hand, Khushab was the least e�cient in 2013, 2014 and 2016 (Chapter Appendix, Table 1).
In cotton production, results show that Rajanpur was the most e�cient in both 2013 and 2014, while during 2016 Bhawalnagar was the most e�cient, followed closely by Rajanpur and Vehari. Meanwhile, Chiniot was the least e�cient in 2014 and 2015, and Bhakkar was least e�cient in 2016 (Chapter Appendix, Table 2).
For sugarcane production, DG Khan was most e�cient in 2014, whereas Rahim Yar Khan was most e�cient in 2015 as well as in 2016. On the other hand, Khushab was least e�cient in 2014, Sialkot was the least e�cient in 2015 and Narowal was the least e�cient in 2016 (Chapter Appendix, Table 3).
Meanwhile, for rice production, DG Khan was the most e�cient for all three years, whereas Mianwali was least e�cient
3.11 ANNEXURE
Estimation Strategy of E�ciency Analysis in Agriculture Sector
P U N J A B ECONOMIC | REPORT
98

in 2014, Jhelum in 2015, and Gujrat in 2016 (Chapter Appendix, Table 4).
Lastly, for maize production, Jhelum was the most e�cient in 2014 and 2015 whereas Okara assumed this position in 2016. On the other hand, Islamabad was least e�cient in 2014, Multan in 2015 and Rawalpindi in 2016 (Appendix, Table 5).
P U N J A B ECONOMIC | REPORT
99

P U N J A B ECONOMIC | REPORT
100

2014
P U N J A B ECONOMIC | REPORT
101

P U N J A B ECONOMIC | REPORT
102

P U N J A B ECONOMIC | REPORT
103

Note: Returns to family are calculated by subtrac�ng all input costs excluding the implicit cost of family labour.
Table 7: REAL PER ACRE INPUT COSTS, RETURNS TO FAMILY LABOR, AND PROFITS FOR MAJOR CROPS IN PUNJAB(IN PKR AT 2005-06 PRICE USING GDP DEFLATOR)
P U N J A B ECONOMIC | REPORT
104

Figure A.1: Means Efficency for Sugarcane and Maize
P U N J A B ECONOMIC | REPORT
105
