agriculture, forestry and fishing sector
TRANSCRIPT

Agriculture, Forestry and Fishing Sector Statistical Bulletin First Quarter of 2021 1
Agriculture, Forestry and Fishing SectorStatistical Bulletin - First Quarter 2021
Namibia Statistics Agency
Namibia Statistics Agency

AgencyAgency
“Leveraging on partnerships and innovative technologies, to produce and disseminate relevant, quality, timely statistics and spatial data that are �t-for-purpose in accordance with international standards and best practice”
Mission Statement
Vision Statement“Be a high performance institution in quality statistics delivery”
IntegrityExcellent PerformanceAccuracyTeam WorkAccountabilityTransparency
Core Values
Agriculture, Forestry and Fishing Sector Statistical Bulletin First Quarter of 20214
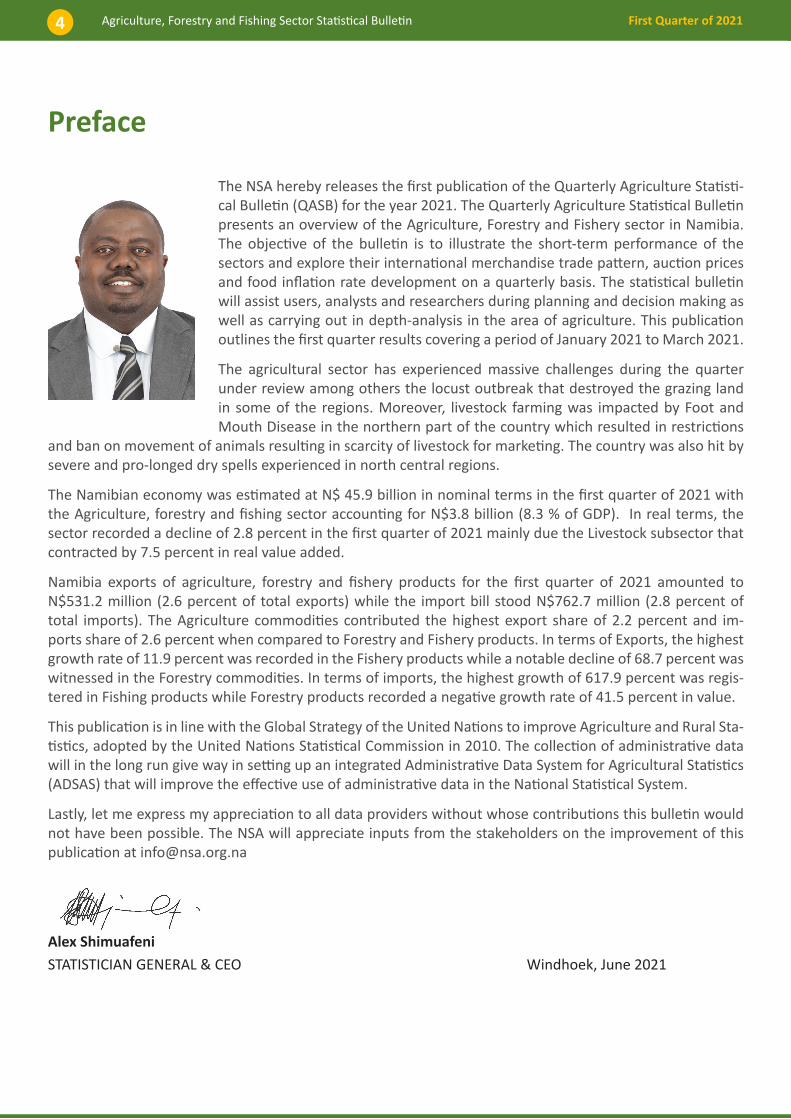
Preface
The NSA hereby releases the first publication of the Quarterly Agriculture Statisti-cal Bulletin (QASB) for the year 2021. The Quarterly Agriculture Statistical Bulletin presents an overview of the Agriculture, Forestry and Fishery sector in Namibia. The objective of the bulletin is to illustrate the short-term performance of the sectors and explore their international merchandise trade pattern, auction prices and food inflation rate development on a quarterly basis. The statistical bulletin will assist users, analysts and researchers during planning and decision making as well as carrying out in depth-analysis in the area of agriculture. This publication outlines the first quarter results covering a period of January 2021 to March 2021.
The agricultural sector has experienced massive challenges during the quarter under review among others the locust outbreak that destroyed the grazing land in some of the regions. Moreover, livestock farming was impacted by Foot and Mouth Disease in the northern part of the country which resulted in restrictions
and ban on movement of animals resulting in scarcity of livestock for marketing. The country was also hit by severe and pro-longed dry spells experienced in north central regions.
The Namibian economy was estimated at N$ 45.9 billion in nominal terms in the first quarter of 2021 with the Agriculture, forestry and fishing sector accounting for N$3.8 billion (8.3 % of GDP). In real terms, the sector recorded a decline of 2.8 percent in the first quarter of 2021 mainly due the Livestock subsector that contracted by 7.5 percent in real value added.
Namibia exports of agriculture, forestry and fishery products for the first quarter of 2021 amounted to N$531.2 million (2.6 percent of total exports) while the import bill stood N$762.7 million (2.8 percent of total imports). The Agriculture commodities contributed the highest export share of 2.2 percent and im-ports share of 2.6 percent when compared to Forestry and Fishery products. In terms of Exports, the highest growth rate of 11.9 percent was recorded in the Fishery products while a notable decline of 68.7 percent was witnessed in the Forestry commodities. In terms of imports, the highest growth of 617.9 percent was regis-tered in Fishing products while Forestry products recorded a negative growth rate of 41.5 percent in value.
This publication is in line with the Global Strategy of the United Nations to improve Agriculture and Rural Sta-tistics, adopted by the United Nations Statistical Commission in 2010. The collection of administrative data will in the long run give way in setting up an integrated Administrative Data System for Agricultural Statistics (ADSAS) that will improve the effective use of administrative data in the National Statistical System.
Lastly, let me express my appreciation to all data providers without whose contributions this bulletin would not have been possible. The NSA will appreciate inputs from the stakeholders on the improvement of this publication at [email protected]
Alex Shimuafeni
STATISTICIAN GENERAL & CEO Windhoek, June 2021

Agriculture, Forestry and Fishing Sector Statistical Bulletin First Quarter of 2021 5
Contents
Preface ......................................................................................................................................................... 4
1. Introduction ......................................................................................................................................... 7
2. Agriculture, Forestry, Fishing and Economic Development ................................................................ 8
2.1. Agriculture, Forestry and Fishing Value Added ............................................................................... 8
2.2. Contribution of Agriculture, Forestry and Fishing Sector to GDP ...................................................8
2.3. External Trade of Agriculture, Forestry and Fishing products ........................................................9
3. Trade of Agricultural Commodities ................................................................................................... 10
4. Inputs in the Agriculture sector ......................................................................................................... 12
Exports and Imports of Fertilizers and Pesticides ................................................................................. 13
Exports and Imports of Animal Feeds ................................................................................................... 13
5. Outputs in the Agriculture sector ...................................................................................................... 14
Exports and Imports of Meat and Meat Products ................................................................................ 15
6. Auction Prices for Livestock in the South of Veterinary Cordon Fence (S-VCF) ...............................17
Cattles .................................................................................................................................................... 17
Goats ...................................................................................................................................................... 17
Sheep ..................................................................................................................................................... 18
7. Forestry .............................................................................................................................................. 19
7.1. Export and Import of Forestry and logging products .................................................................... 19
7.2. Wood Charcoal ............................................................................................................................... 21
8. Fish and other fishing products ......................................................................................................... 23
8.1. Fish Landings .............................................................................................................................. 23
8.2. Exports and Imports of Fish and other fishing products ...........................................................23
Export and Import of Prepared and Preserved Fish, Crustaceans, Molluscs and Aquatic Invertebrates 26
9. Food and Non-Alcoholic beverages Inflation .................................................................................... 28
Food Inflation ......................................................................................................................................... 28
10. Technical Note ................................................................................................................................ 30
10.1. Methodology.............................................................................................................................. 30
10.2. Classifications and Standards .................................................................................................... 30
10.3. Acronyms ................................................................................................................................... 30
10.4. Definitions .................................................................................................................................. 31
11. Statistical Tables ............................................................................................................................. 32

Agriculture, Forestry and Fishing Sector Statistical Bulletin First Quarter of 20216
List of Tables
Table 1: Agriculture, Forestry and Fishing value added at Constant Prices-growth rates .........................8
Table 2: Export and Imports of products by Subsectors ............................................................................. 9
Table 3: Trade by Partners for Agricultural commodities- Percentage Share ...........................................12
Table 4: Main Trade Partners for Fertilizers and Pesticides - % Share for Q1:2021 ..................................13
Table 5: Top trade partners for Animal Feeds-Percentage share .............................................................. 14
Table 6: Top Trade Partners for Wood Charcoal- Percentage Share .........................................................22
Table 7: Landings of Quota Species ........................................................................................................... 23
Table 8: Imported Fish and other fishing products - N$ million ............................................................... 25
Table 9: Import of Prepared and Preserved Fish, Crustaceans, Molluscs and Aquatic Invertebrates .....27
List of FiguresFigure 1: Share of Agriculture, Forestry and Fishing to GDP – Percentage Share .........................................8
Figure 2: Agricultural exported commodities - growth rates in percent .....................................................10
Figure 3: Agricultural imported commodities - growth rates in percent ....................................................11
Figure 4: Exports and Imports of Fertilizers and Pesticides- growth rates in percent .................................13
Figure 5: Animal Feeds Imports and Exports- N$ million ............................................................................ 14
Figure 6: Export of ‘Meat and Meat Products’ by country of destination - Percentage share 2021Q1 ......15
Figure 7: Imports of Meat and Meat Products’ by country of destination- percentage share, 2021Q1 ...16
Figure 8: Auction Prices of Cattles - per Kilogram ...................................................................................... 17
Figure 9: Auction Price for Goats per Kg ..................................................................................................... 18
Figure 10: Sheep Auction Price - per Kilogram ........................................................................................... 18
Figure 11: Export of Forestry and logging products – N$ million ............................................................... 19
Figure 12: Export of Forestry and logging products by country of destination - percentage share ...........20
Figure 13: Import of Forestry and logging products – N$ million ............................................................20
Figure 14: Import markets for Forestry and logging products - percentage share .....................................21
Figure 15: Exports and imports of Wood Charcoal ..................................................................................... 21
Figure 16: Exported Fish and other fishing products –N$ million ..............................................................24
Figure 17: Export of Fish and other fishing products by country of destination – percentage share .........24
Figure 18: Import market of Fish and other fishing products- percentage share .......................................25
Figure 19: Export of Prepared and Preserved Fish, Crustaceans, Molluscs and Aquatic Invertebrates- N$ Million 26
Figure 20: Export of Prepared and Preserved Fish, Crustaceans, Molluscs and Aquatic Invertebrates by Destination - Percentage share ........................................................................................................................................ 27
Figure 21: Inflation rate for ‘All item’ and ‘food and non-alcoholic beverages’ ..........................................28
Figure 22: Inflation rate for food items - percentage................................................................................. 29

Agriculture, Forestry and Fishing Sector Statistical Bulletin First Quarter of 2021 7
1. IntroductionThe Agriculture sector is the backbone of the Namibian economy and has over the years been one of the significant sectors that has contributed to the economy. The sector remains the engine due to its nature of creating source of income, food security, foreign earnings and provision of raw material to the manufacturing industry. The sector has been characterized by up and down performances as a result of but not limited to Natural Disasters (Floods & Draughts), wild animal conflicts and pests as well capital constraints. Despite a recent sluggish growth, the sector remains central to the lives of the majority of the population, contributing directly and indirectly to their livelihoods.
According to the Preliminary National Accounts 2020, the Agriculture, Forestry and Fishing Sector contrib-uted an average of 7.6 percent to GDP over the last eight (8) years. Despite the low contribution to GDP, the sector is the biggest employer with 167 242 out of 725 742 (23.0%) employed person in Namibia, thus accounting for 23 percent of the labour force (Namibia Labour Force Survey of 2018). This is associated with the labour intensive nature of the sector.
The agricultural sector has been experiencing massive challenges overtime such as the locust outbreak which destroys the grazing land. For quarter one of 2021 the locust outbreak was reported in January 2021 in some parts of the country. Furthermore, the livestock subsector was impacted by the Foot and Mouth Disease (FMD) which resulted in restrictions and a ban on movement of animals within Kavango East, Kavango West, Ohangwena, Oshikoto and Kunene, Oshana, Omusati regions and Tsumkwe constituency in the Otjozondjupa region. The existence FMD was confirmed in the northern region of Kavango East at the end of September 2020 and continues to prevail in quarter one of 2021. Moreover, the country was also hit by severe and pro-longed dry spells experienced in North central regions (Ohangwena, Oshana, Omusati, Oshikoto), Kunene, and Erongo region.
The results in this publication are presented in tables and graphs with growth rates, values and numbers of different estimates. Hyphen (-) observed in Tables represents a value of Zero (0) while a zero (0.0) represents insignificant values.
Section 2 of the report presents the economic development in Agriculture, Forestry and Fishing sector in terms of value added as well as international trade of the three subsectors. Section 3 zooms into agricultural trade and its trading partners, followed by Section 4 inputs in the agriculture sector. Section 5 presents the output of agricultural sector followed by Section 6 of livestock auction prices. Section 7 zooms into forestry trade as well as their trading partners, whereas Section 8 analyse Fish and other fishing products with the trading partners. The last section of the bulletin, Section 9 presents inflation, followed by statistical tables, respectively.

Agriculture, Forestry and Fishing Sector Statistical Bulletin First Quarter of 20218
2. Agriculture, Forestry, Fishing and Economic Development
2.1. Agriculture, Forestry and Fishing Value Added
In the quarter under review, the Namibian economy declined by 6.5 percent compared to a decline of 2.5 percent recorded in the corresponding quarter of 2020 (Table 1). The value added for Agriculture, Forestry and Fishing sector registered a decline of 2.8 percent from a steeper reduction of 6.2 percent recorded in quarter one of 2020. The decline in the sector was mainly reflected in the Livestock farming that declined by 7.5 percent better off when compared to a decline of 15.0 percent, recorded in the corresponding quarter of 2020. The Fishing subsector also recorded a decline 0.5 percent, better off when compared to flat growth recorded in quarter one of 2020. However, the Crop farming performed better, registering a growth of 1.8 percent in real value added as opposed to an increase of 1.4 that was registered in the same period of 2020.
Table 1: Agriculture, Forestry and Fishing value added at Constant Prices-growth rates
2021Q1 Q2 Q3 Q4 Q1
Livestock farming -15.0 -23.4 -8.7 14.8 -7.5Crop Farming 1.4 308.0 3.0 3.6 1.8Forestry 8.1 -17.4 -9.6 -5.0 1.7Fishing -1.0 -16.3 -14.2 -5.1 -0.5Agriculture, Fishing and Forestry -6.2 32.5 -11.2 2.7 -2.8GDP -2.5 -11.4 -11.9 -5.9 -6.5
Sub-Sectors2020
Source: NSA
2.2. Contribution of Agriculture, Forestry and Fishing Sector to GDP
During the period under review, the GDP level at current prices stood at N$45.8 billion compared to N$45.3 billion in the same quarter of 2020. The contribution of Agriculture, Forestry and Fishing sector to GDP ex-panded in the first quarter of 2021, accounting for 8.3 percent compared to a share of 6.6 percent recorded in the corresponding quarter of the preceding year. At sub-sector level, the highest contribution was re-corded in Livestock farming with a share of 4.9 percent, followed by Fishing with 2.6 percent, while Forestry recorded the least contribution to GDP of 0.3 percent (Figure 1).
2.9 3.7 3.9 3.6
4.9
0.4
6.8
0.4
3.0
0.4 0.3 0.2 0.3 0.3 0.3
2.9 2.8 2.3 2.1
2.6
6.6
13.5
6.8
9.0 8.3
Q1 Q2 Q3 Q4 Q1
2020 2021
-
2.0
4.0
6.0
8.0
10.0
12.0
14.0
16.0
Perc
ent
Livestock farming Crop Farming Forestry Fishing Agriculture, Fishing and Forestry
Figure 1: Share of Agriculture, Forestry and Fishing to GDP – Percentage ShareSource: NSA
Agriculture, Forestry and Fishing Sector Statistical Bulletin First Quarter of 2021 9
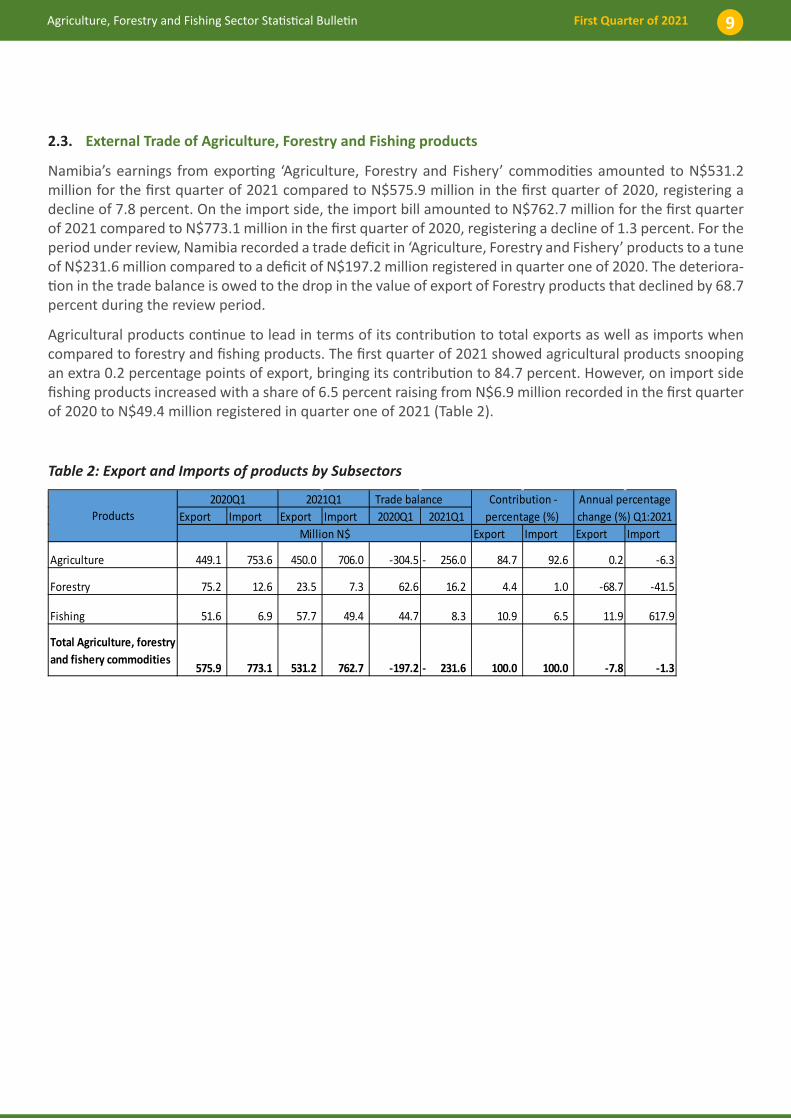
2.3. External Trade of Agriculture, Forestry and Fishing products
Namibia’s earnings from exporting ‘Agriculture, Forestry and Fishery’ commodities amounted to N$531.2 million for the first quarter of 2021 compared to N$575.9 million in the first quarter of 2020, registering a decline of 7.8 percent. On the import side, the import bill amounted to N$762.7 million for the first quarter of 2021 compared to N$773.1 million in the first quarter of 2020, registering a decline of 1.3 percent. For the period under review, Namibia recorded a trade deficit in ‘Agriculture, Forestry and Fishery’ products to a tune of N$231.6 million compared to a deficit of N$197.2 million registered in quarter one of 2020. The deteriora-tion in the trade balance is owed to the drop in the value of export of Forestry products that declined by 68.7 percent during the review period.
Agricultural products continue to lead in terms of its contribution to total exports as well as imports when compared to forestry and fishing products. The first quarter of 2021 showed agricultural products snooping an extra 0.2 percentage points of export, bringing its contribution to 84.7 percent. However, on import side fishing products increased with a share of 6.5 percent raising from N$6.9 million recorded in the first quarter of 2020 to N$49.4 million registered in quarter one of 2021 (Table 2).
Table 2: Export and Imports of products by Subsectors
Trade balanceExport Import Export Import 2020Q1 2021Q1
Export Import Export Import
Agriculture 449.1 753.6 450.0 706.0 -304.5 256.0- 84.7 92.6 0.2 -6.3
Forestry 75.2 12.6 23.5 7.3 62.6 16.2 4.4 1.0 -68.7 -41.5
Fishing 51.6 6.9 57.7 49.4 44.7 8.3 10.9 6.5 11.9 617.9
Total Agriculture, forestry and fishery commodities
575.9 773.1 531.2 762.7 -197.2 231.6- 100.0 100.0 -7.8 -1.3
Million N$Products
2020Q1 Annual percentage change (%) Q1:2021
2021Q1 Contribution - percentage (%)

Agriculture, Forestry and Fishing Sector Statistical Bulletin First Quarter of 202110
3. Trade of Agricultural Commodities
The value for agriculture commodities exported in the first quarter of 2021 amounted to N$450.0 million decoding into a growth of 0.2 percent compared to a decline of 24.0 percent recorded in the corresponding quarter of 2020 (Figure 2). ‘Live animals’ was the top exported agricultural commodity, recording N$266.1 million, this signifies a contraction of 27.7 percent year on year when compared to a decline of 23.9 percent recorded in the same period of 2020. The annual decline was mainly exacerbated by a drop in cattle exports. ‘Live animals’ exports where mainly destined to South Africa accounting for 97.0 percent of ‘Live animals’ exported during the quarter under review.
The export of ‘Fruits and nuts’ stood in second place with N$166.7 million, decoding into a triple digit growth of 201.4 percent year on year from a decline of 23.0 percent recorded in quarter one of 2020. The huge growth was largely attributable to an increase in grapes exported. South Africa dominated the ‘fruits and nuts’ export market with a share of 20.4 percent, followed by the Netherlands, United Kingdoms and Germa-ny recording 19.5 percent, 18.7 percent and 14.7 percent, accordingly.
Q1 Q2 Q3 Q4 Q12020 2021
Fruits and nuts -23.0 -51.4 3.3 6.4 201.4
Live animals -23.9 -62.5 -24.6 -14.5 -27.7Total Agricultural Commodities -24.0 -60.5 -18.1 -0.5 0.2
-100.0
-50.0
0.0
50.0
100.0
150.0
200.0
250.0
PERC
ENT
Figure 2: Agricultural exported commodities - growth rates in percent
Source: NSA

Agriculture, Forestry and Fishing Sector Statistical Bulletin First Quarter of 2021 11
On the supply side, Namibia imported agricultural commodities worth N$706.0 million during the quarter under review. The imports declined by 6.3 percent year on year compared to the double digit growth of 32.9 percent registered in the same period of 2020 (Figure 3).
Cereals recorded the largest value worth N$389.9 million, a contraction of 13.2 percent year on year while a double digit growth of 53.6 was registered in quarter one of 2020. During the quarter under review, ‘Fruits and nuts’ and ‘Stimulant, spice and aromatic crops’ stood second and third with import valued at N$81.0 and N$63.9, respectively. Vegetables imported recorded a value of N$55.2 million, denoting a growth of 2.1 percent from a growth of 0.3 percent recorded in the quarter one of 2020.
53.6
7.0
-53.
0
1.4
-13.
2
7.2
-11.
0
0.1
-18.
8
-7.3
0.3
-0.7
-9.6
-22.
7
2.15.
5
-10.
0
-25.
3
7.2
-7.3
2.6
-6.2
10.8
21.1
4.6
70.4
47.1
60.7
37.5
46.3
32.9
1.1
-33.
0
-0.4
-6.3
-60.0
-40.0
-20.0
0.0
20.0
40.0
60.0
80.0
Q 1 Q 2 Q 3 Q 4 Q 1
2 0 2 0 2 0 2 1
PERC
ENT
Cereals Fruits and nuts
Vegetables Stimulant, spice and aromatic crops
Edible roots and tubers with high starch or inulin content Raw milk
Total Agricultural Commodities
Figure 3: Agricultural imported commodities - growth rates in percent
Source: NSA
In relation to the trade market for the agricultural commodities, South Africa was the leading trade partner for both imports and exports accounting for 65.7 percent and 78.8 percent, respectively, during the quarter under review (Table 3).

Agriculture, Forestry and Fishing Sector Statistical Bulletin First Quarter of 202112
Table 3: Trade by Partners for Agricultural commodities- Percentage Share
Export MarketsQ1: 2021
Import MarketsQ1: 2021
Percentage Share % Percentage Share %South Africa 65.7 South Africa 78.8Netherlands 7.2 Russia 15.9United Kingdom 7.1 Other 5.3Germany 6.1 Other 13.9
Total 100.0 Total 100.0

Agriculture, Forestry and Fishing Sector Statistical Bulletin First Quarter of 2021 13
4. Inputs in the Agriculture sector
Exports and Imports of Fertilizers and Pesticides
The export of ‘Fertilizers and pesticides’ amounted to N$13.2 million in the first quarter of 2021, translating into a triple digit growth of 138.2 percent better off when compared to a growth of 0.6 percent recorded in quarter one of 2020. Angola was the main export market with N$5.1 million (38.7% share) of total ‘fertilizers and pesticides’ (Figure 4). The year on year increase is largely attributable to the rise in exports of ‘Excreta of animals useful for manure/fertilizer and fuel preparation’.
While, the import of ‘Fertilizers and pesticides’ during the quarter under review amounted to N$192.3 mil-lion. This is an accelerated growth of 19.8 percent from a decline of 7.5 percent recorded in the correspond-ing quarter of 2020. This are mainly import of ammonium nitrate. The import of ‘Fertilizers and Pesticides’ was mainly sourced from South Africa accounting for 95.4 percent of total imports (Table 4).
0.6
-52.0-65.9
27.1
138.2
-7.5 -3.4 -0.2
29.019.8
-100.0
-50.0
0.0
50.0
100.0
150.0
Q1 Q2 Q3 Q4 Q1
2020 2021
PERC
ENT
Export Import
Figure 4: Exports and Imports of Fertilizers and Pesticides- growth rates in percentSource: NSA
Table 4: Main Trade Partners for Fertilizers and Pesticides - % Share for Q1:2021
Export MarketsQuarter one, 2021
Import MarketsQuarter one, 2021
Percent Share Percent ShareAngola 38.7 South Africa 95.4
South Africa 25.1 Russian Federation 3.4
France 22.8 United States of America 0.3
Belgium 11.4 Netherlands 0.2
Other 2.1 Other 0.7
Total 100.0 Total 100.0
Agriculture, Forestry and Fishing Sector Statistical Bulletin First Quarter of 202114
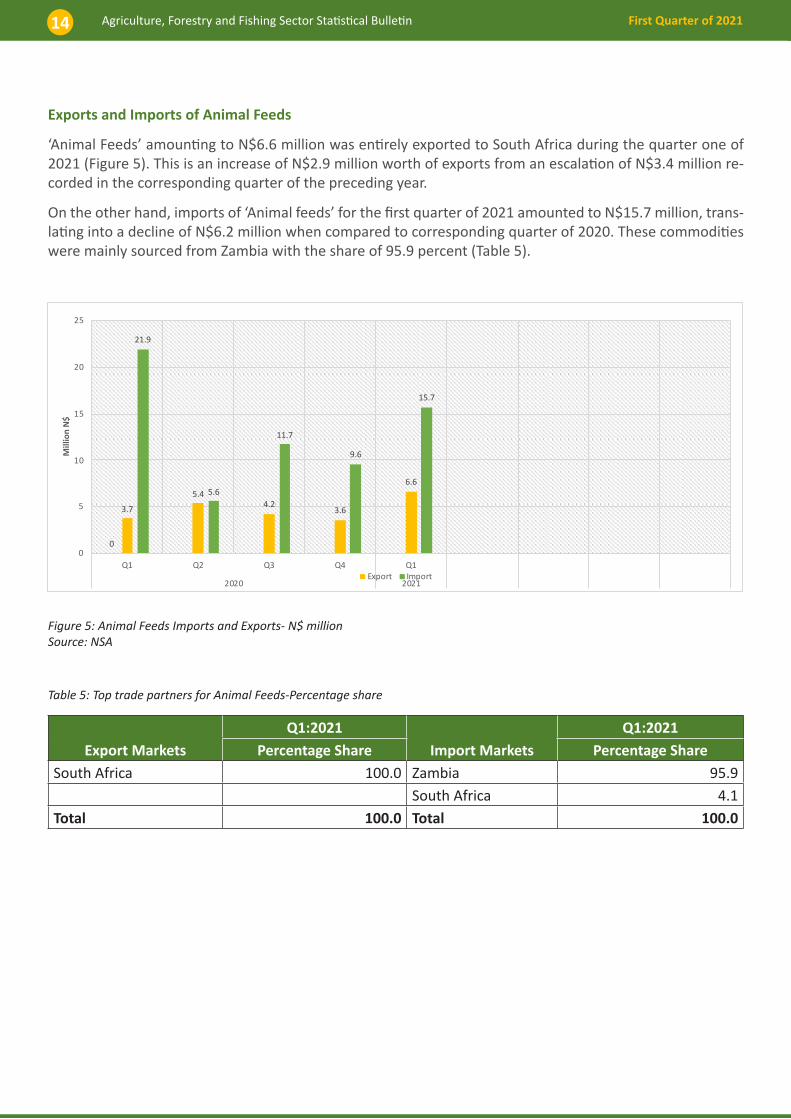
Exports and Imports of Animal Feeds
‘Animal Feeds’ amounting to N$6.6 million was entirely exported to South Africa during the quarter one of 2021 (Figure 5). This is an increase of N$2.9 million worth of exports from an escalation of N$3.4 million re-corded in the corresponding quarter of the preceding year.
On the other hand, imports of ‘Animal feeds’ for the first quarter of 2021 amounted to N$15.7 million, trans-lating into a decline of N$6.2 million when compared to corresponding quarter of 2020. These commodities were mainly sourced from Zambia with the share of 95.9 percent (Table 5).
0
3.7
5.44.2
3.6
6.6
21.9
5.6
11.7
9.6
15.7
0
5
10
15
20
25
Q1 Q2 Q3 Q4 Q1
2020 2021
Mill
ion
N$
Export Import
Figure 5: Animal Feeds Imports and Exports- N$ million Source: NSA
Table 5: Top trade partners for Animal Feeds-Percentage share
Export MarketsQ1:2021
Import MarketsQ1:2021
Percentage Share Percentage ShareSouth Africa 100.0 Zambia 95.9 South Africa 4.1Total 100.0 Total 100.0

Agriculture, Forestry and Fishing Sector Statistical Bulletin First Quarter of 2021 15
5. Outputs in the Agriculture sector
Exports and Imports of Meat and Meat Products
For the period under review, Namibia exported Meat and meat products amounting to N$208.0 (Table I) mil-lion translating into a double digit growth of 23.5 percent from a decline of 36.5 percent recorded in the cor-responding quarter of 2020. The increase was mainly attributed to the export of ‘Meat of that increased by 57.2 percent. In the first quarter of 2021, Meat of chicken accounted for 73 percent of meat and meat prod-ucts exported, this was followed by Meat of cattle (37.4%), Meat of pigs (5.9%) and Meat of sheep (3.7%).
The export of ‘Meat and meat products’ were mainly destined to the Democratic Republic of Congo with 70.1 percent share, followed by United Kingdom with 7.7 percent share whereas South Africa accounted for 7.5 percent share (Figure 6).
Democratic Republic of Congo, 70.1
United Kingdom, 7.7
South Africa, 7.5
Other, 14.8
Figure 6: Export of ‘Meat and Meat Products’ by country of destination - Percentage share 2021Q1Source: NSA
While on the demand side, Namibia imported ‘Meat and meat products’ was valued at N$229.2 million (Ta-ble J) during the quarter under review, down by 3.0 percent when compared to a positive performance of 0.5 percent recorded during the corresponding quarter of 2020 In the first quarter of 2021, Meat of chicken imported stood at N$121.9 million accounted for 53.2 percent of Meat and meat products imported, this was followed by Prepared dishes and meals based on meat (19.2%), Meat of pigs (39.7%), Meat of cattle (14.3%)

Agriculture, Forestry and Fishing Sector Statistical Bulletin First Quarter of 202116
and Sausages and similar products of meat (7.4%).
In the quarter under review the ‘Meat and Meat Products’ were mainly sourced from South Africa which accounted for 42.4 percent of the total, followed by Brazil with 19.6 percent share and United States of America with 11.1 percent share (Figure 7).
South Africa42%
Brazil20%
United States of America11%
Poland6%
Spain6%
Other15%
Figure 7: Imports of Meat and Meat Products’ by country of destination- percentage share, 2021Q1Source: NSA

Agriculture, Forestry and Fishing Sector Statistical Bulletin First Quarter of 2021 17
6. Auction Prices for Livestock in the South of Veterinary Cordon Fence (S-VCF)
Cattles
During the quarter under review, the average auction price for Weaners stood at N$41.66 per Kg up by 23.1 percent from the corresponding quarter of 2020 (Figure 8). A similar trend was also observed in the prices for Tollies that averaged at N$40.72 per Kg, translating into an increment of 17.7 percent year on year. While for Lean cows the average prices stood at N$26.33 per Kg, up by 35.5 percent when compared to the same period a year earlier.
33.8
3
31.4
7 34.4
6
40.3
4
41.6
6
34.6
1
31.7
9 34.7
6
39.6
9
40.7
2
26.0
2
25.8
0
27.0
1 30.8
2 33.3
7
24.9
3
22.4
3
24.0
1
28.3
4 32.2
3
24.0
6
22.1
1
23.5
4
28.1
0 31.2
6
19.4
2
18.7
2
20.1
0 23.5
3 26.3
3
24.6
3
21.5
4
23.5
7
27.9
0 31.4
3
Q 1 Q 2 Q 3 Q 4 Q 1
2 0 2 0 2 0 2 1
PRIC
E PE
R KI
LOGR
AM
Weaners Tolly Stores Slaughter SlaughterHeifers Cow Lean Cow Fat
Figure 8: Auction Prices of Cattles - per KilogramSource: Meat Board of Namibia
Goats
The highest average auction price per Kg was for Goat Lamb recording N$37.50, followed by Goat Kapater N$34.55, which went up by 10.9 percent and 8.1 percent during the quarter under review, respectively. Goat Ram recorded the lowest auction price of N$29.84 per kilogram in the quarter under review. There was no price recorded for ‘Goat Ewe & Lamb’ since it was not auctioned during quarter one of 2021 (Figure 9).

Agriculture, Forestry and Fishing Sector Statistical Bulletin First Quarter of 202118
33.8
0
32.2
4
40.6
1
44.9
4
37.5
0
31.9
5
28.6
0
33.3
7
41.4
8
34.5
5
25.4
3
30.1
5 33.3
7 37.0
1
33.5
8
27.0
4
31.8
0
24.5
3
23.7
0
29.8
4
Q 1 Q 2 Q 3 Q 4 Q 1
2 0 2 0 2 0 2 1
PRIC
E PE
R KI
LOGR
AM
Goat Lamb Goat Kapater Goat Ewe Goat Ewe & Lamb Goat Ram
Figure 9: Auction Price for Goats per KgSource: Meat Board of Namibia
Sheep
The Sheep Lamb Dorper registered the highest auction price of N$36.39 during the first quarter of 2021, up by 11.5 percent from quarter one of 2020. The Sheep Castrate Dorper recorded the second highest price of N$36.17 per Kg, an increase of 18.1 percent on an annual basis (Figure 10). The Sheep Ram Dorper recorded the lowest auction price of N$29.15 per Kg whereas, there was no auction price recorded for Sheep Ewe & Lamb Dorper since it was not auctioned during the quarter under review.
The overall year on year increase in auction prices of sheep is attributable to the effect of small stock mar-keting scheme that discouraged export of sheep driving farmers out of sheep framing and consequently reducing supply of sheep.
32.6
3
33.3
8 37.2
4
36.2
5
36.3
9
30.6
2
31.1
5
34.6
5
36.4
8
36.1
7
23.7
1 26.8
8
31.9
1
32.4
7
35.7
0
27.9
8
28.1
3
24.4
4
24.8
9
29.1
5
Q 1 Q 2 Q 3 Q 4 Q 1
2 0 2 0 2 0 2 1
PRIC
E PE
R KI
LOGR
AM
Sheep Lamb Dorper Sheep Castrate Dorper Sheep Ewe Dorper Sheep Ewe & Lamb Dorper Sheep Ram Dorper
Figure 10: Sheep Auction Price - per KilogramSource: Meat Board of Namibia

Agriculture, Forestry and Fishing Sector Statistical Bulletin First Quarter of 2021 19
7. Forestry
7.1. Export and Import of Forestry and logging products
During the first quarter of 2021, export earnings from forestry commodities were valued at N$23.5 million, which represents a decline of 68.7 percent compared to an increase of 574.2 percent registered in the cor-responding quarter of 2020. The contraction observed was predominantly due to the decrease in exports of ‘Other’ forestry commodities which registered a drop of 94.2 percent and ‘Logs of non-coniferous wood’ which declined by 82.7 percent.
During the quarter under review, ‘Logs of non-coniferous wood’ recorded the highest export value of N$ 11.9 million followed by ‘Fuel wood of coniferous wood’ with a value of N$ 11.6 million. While the category ‘Other’ registered a combined value of N$ 49.4 thousand, representing a share of 0.2 percent of export of forestry products (Figure 11).
68.7
12.8
12.1
12.1
11.9
5.7 8.
7
8.1
15.6
11.6
0.8
0.1
0.0
0.0
0.0
-
10.0
20.0
30.0
40.0
50.0
60.0
70.0
80.0
2 0 2 0 2 0 2 1
MIL
LIO
N N
$
Logs of non-coniferous wood Fuel wood of coniferous wood Other Total Exports
Figure 11: Export of Forestry and logging products – N$ million Source: NSA
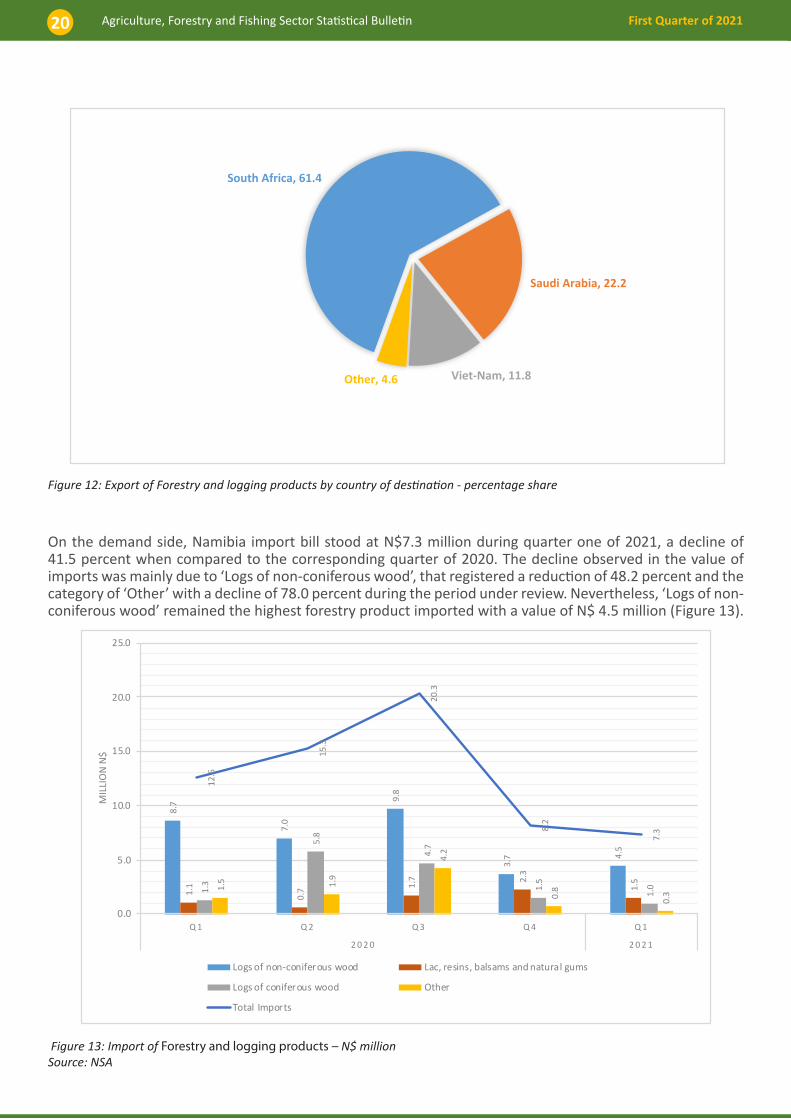
South Africa continued to be Namibia’s main export destination for forestry commodities representing 61.4 percent of export of forestry products during the first quarter of 2021. Saudi Arabia received the second larg-est share of 22.2 percent, while Vietnam in third place with a share of 11.8 percent Other countries recorded a combined share of 4.6 percent (Figure 12).
Agriculture, Forestry and Fishing Sector Statistical Bulletin First Quarter of 202120
South Africa, 61.4
Saudi Arabia, 22.2
Viet-Nam, 11.8Other, 4.6
Figure 12: Export of Forestry and logging products by country of destination - percentage share
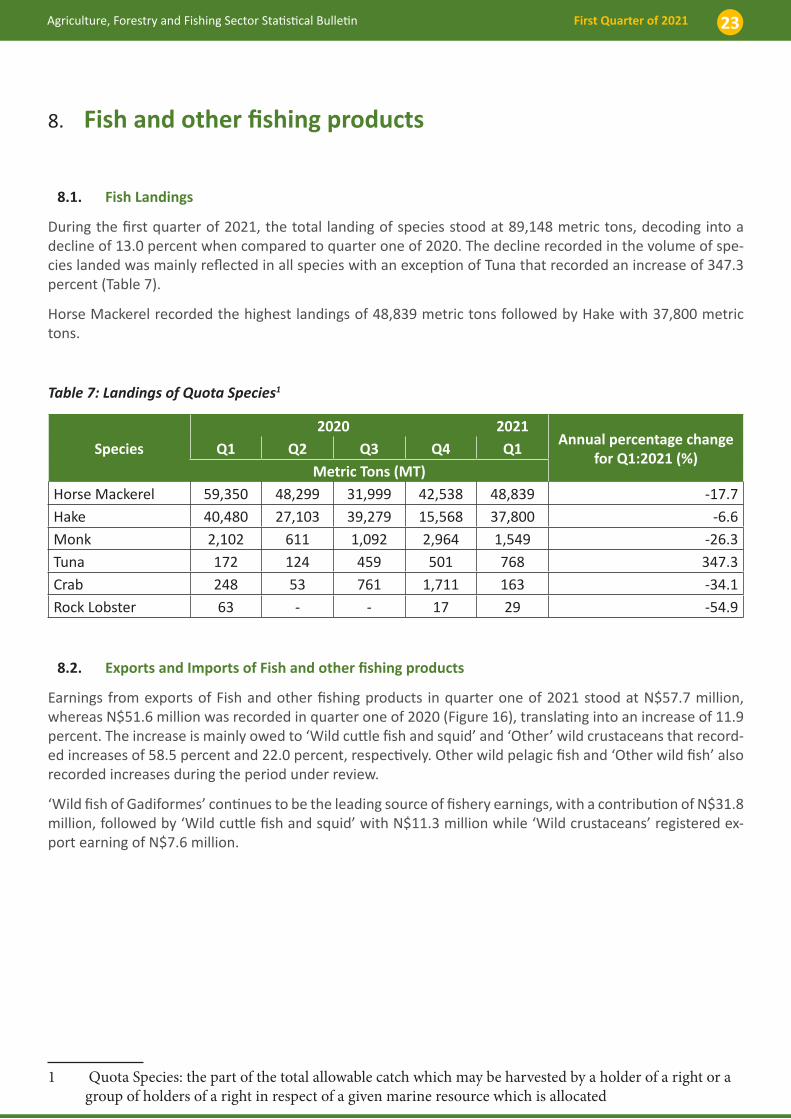
On the demand side, Namibia import bill stood at N$7.3 million during quarter one of 2021, a decline of 41.5 percent when compared to the corresponding quarter of 2020. The decline observed in the value of imports was mainly due to ‘Logs of non-coniferous wood’, that registered a reduction of 48.2 percent and the category of ‘Other’ with a decline of 78.0 percent during the period under review. Nevertheless, ‘Logs of non-coniferous wood’ remained the highest forestry product imported with a value of N$ 4.5 million (Figure 13).
8.7
7.0
9.8
3.7 4.
5
1.1
0.7 1.
7 2.3
1.5
1.3
5.8
4.7
1.5
1.01.
5 1.9
4.2
0.8
0.3
12.6
15.3
20.3
8.2
7.3
0.0
5.0
10.0
15.0
20.0
25.0
Q 1 Q 2 Q 3 Q 4 Q 1
2 0 2 0 2 0 2 1
MIL
LIO
N N
$
Logs of non-coniferous wood Lac, resins, balsams and natural gums
Logs of coniferous wood Other
Total Imports
Figure 13: Import of Forestry and logging products – N$ million Source: NSA

Agriculture, Forestry and Fishing Sector Statistical Bulletin First Quarter of 2021 21
South Africa continued to be the main source of Forestry products during the period under review accounting for 77.0 percent of all imported Forestry products, followed by Zambia with 14.4 percent and 8.2 percent from Eswatini (Figure 14).
South Africa, 77.0
Zambia, 14.4
Eswatini , 8.2Others, 0.4
Figure 14: Import markets for Forestry and logging products - percentage share
7.2. Wood Charcoal
Exports of Wood Charcoal continued to be on an upward trend during quarter one of 2021, increasing by 25.2 percent to N$ 232.3 million when compared to quarter one of 2020, while imports declined by 72.4 percent to N$0.3 million during the same period (Figure 15).
0.0
50.0
100.0
150.0
200.0
250.0
Export Import Export Import Export Import Export Import Export Import
Q1 Q2 Q3 Q4 Q1
2020 2021
185.5
1.0
203.4
0.3
203.4
0.2
233.2
0.2
232.3
0.3
Figure 15: Exports and imports of Wood Charcoal
Germany was the main export market for charcoal products with a share of 25.6 percent followed by United Kingdom (18.5%) and South Africa (12.9%) while, other countries recorded a combined share of 31.0 percent (Table 6). On the other hand, Namibia sourced all her needs for wood charcoal from South Africa.

Agriculture, Forestry and Fishing Sector Statistical Bulletin First Quarter of 202122
Table 6: Top Trade Partners for Wood Charcoal- Percentage Share
Export Markets
Q1: 2021
Import Markets
Q1: 2021
Percentage Share % Percentage Share %
Germany 25.6 South Africa 100.0United Kingdom 18.5 South Africa 12.9 Netherlands 12.0 Others 31.0 Total 100.0 Total 100.0
Agriculture, Forestry and Fishing Sector Statistical Bulletin First Quarter of 2021 23
8. Fish and other fishing products
8.1. Fish Landings
During the first quarter of 2021, the total landing of species stood at 89,148 metric tons, decoding into a decline of 13.0 percent when compared to quarter one of 2020. The decline recorded in the volume of spe-cies landed was mainly reflected in all species with an exception of Tuna that recorded an increase of 347.3 percent (Table 7).
Horse Mackerel recorded the highest landings of 48,839 metric tons followed by Hake with 37,800 metric tons.
Table 7: Landings of Quota Species1
Species2020 2021
Annual percentage change for Q1:2021 (%)
Q1 Q2 Q3 Q4 Q1Metric Tons (MT)
Horse Mackerel 59,350 48,299 31,999 42,538 48,839 -17.7Hake 40,480 27,103 39,279 15,568 37,800 -6.6Monk 2,102 611 1,092 2,964 1,549 -26.3Tuna 172 124 459 501 768 347.3Crab 248 53 761 1,711 163 -34.1Rock Lobster 63 - - 17 29 -54.9
8.2. Exports and Imports of Fish and other fishing products
Earnings from exports of Fish and other fishing products in quarter one of 2021 stood at N$57.7 million, whereas N$51.6 million was recorded in quarter one of 2020 (Figure 16), translating into an increase of 11.9 percent. The increase is mainly owed to ‘Wild cuttle fish and squid’ and ‘Other’ wild crustaceans that record-ed increases of 58.5 percent and 22.0 percent, respectively. Other wild pelagic fish and ‘Other wild fish’ also recorded increases during the period under review.
‘Wild fish of Gadiformes’ continues to be the leading source of fishery earnings, with a contribution of N$31.8 million, followed by ‘Wild cuttle fish and squid’ with N$11.3 million while ‘Wild crustaceans’ registered ex-port earning of N$7.6 million.
1 Quota Species: the part of the total allowable catch which may be harvested by a holder of a right or a group of holders of a right in respect of a given marine resource which is allocated

Agriculture, Forestry and Fishing Sector Statistical Bulletin First Quarter of 202124
Q1 Q2 Q3 Q4 Q12020 2021
Wild fish of Gadiformes 35.0 7.0 20.7 18.1 31.8Wild cuttle fish and squid 7.1 6.4 2.2 2.6 11.3Other wild crustaceans 6.2 1.4 13.0 9.3 7.6Other wild pelagic fish 0.2 0.9 2.0 1.8 3.5Other wild fish 0.0 0.0 0.0 0.0 1.7Other 3.1 3.6 4.5 0.7 1.7Total 51.6 19.3 42.4 32.5 57.7
0.010.020.030.040.050.060.070.0
MIL
LIO
N N
$
Figure 16: Exported Fish and other fishing products –N$ million
During the quarter under review, Spain was the main receiver of the Namibian fish and other fishing prod-ucts accounting for 53.5 percent of total exports of fishery products. However, when compared to the same quarter of 2020, the share of exports to Spain declined by 7.3 percent. South Africa received the second larg-est share of 25.2 percent followed by Hong Kong (7.0%), China (5.7%), Zambia (4.6%) and ‘Other countries’ recorded a combined share of 4.1 percent (Figure 17).
Spain, 53.5
South Africa, 25.2
Hong Kong , 7.0
China, 5.7
Zambia, 4.6Others, 4.1
Figure 17: Export of Fish and other fishing products by country of destination – percentage shareSource: NSA
On the demand side, for the quarter under review, Namibia imported fish and other fish products to a value of N$49.4 million compared to N$6.9 million recorded in the first quarter of 2020. The increase in imports was mainly due to the increases recorded in the ‘Wild cuttle fish and squid’, recording an increase of N$45.1

Agriculture, Forestry and Fishing Sector Statistical Bulletin First Quarter of 2021 25
million and ‘Wild flatfish’ up by N$2.6 million. Conversely, ‘Other’ types of fishery commodities registered declines of N$5.1 million (Table 8).
Table 8: Imported Fish and other fishing products - N$ million
Fish and other fish products 2020 2021 Q1 Q2 Q3 Q4 Q1
Wild cuttle fish and squid 0.0 1.2 0.0 63.6 45.1Wild flatfish 0.0 0.0 0.1 0.1 2.6Other 6.8 2.0 4.4 3.1 1.7Total 6.9 3.3 4.5 66.8 49.4
In terms of the source market for Namibia of ‘Fish and other fishing products’, Spain was the main source market accounting for 71.4 percent of the total imports of fish for the first quarter of 2021, while Falkland Island was the second largest source market with a share of 15.3 percent (Figure 18). It is of interest to note that Spain is both the lead export and import market for Namibia in the period under review.
Spain72%
Falkland Islands (Malvinas)
15%
South Africa8%
Other5%
Figure 18: Import market of Fish and other fishing products- percentage share
Export and Import of Prepared and Preserved Fish, Crustaceans, Molluscs and Aquatic Invertebrates
Namibia’s export of ‘Prepared and preserved Fish’, Crustaceans, Molluscs and Aquatic Invertebrates’ for
Agriculture, Forestry and Fishing Sector Statistical Bulletin First Quarter of 202126
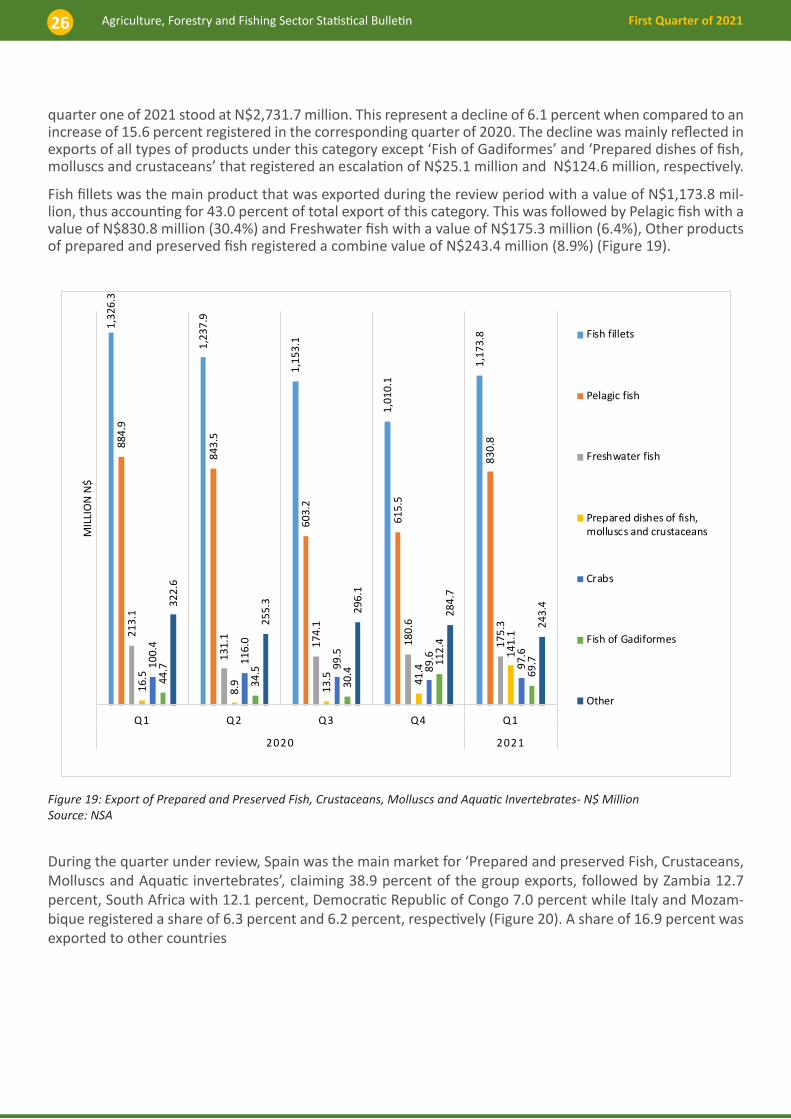
quarter one of 2021 stood at N$2,731.7 million. This represent a decline of 6.1 percent when compared to an increase of 15.6 percent registered in the corresponding quarter of 2020. The decline was mainly reflected in exports of all types of products under this category except ‘Fish of Gadiformes’ and ‘Prepared dishes of fish, molluscs and crustaceans’ that registered an escalation of N$25.1 million and N$124.6 million, respectively.
Fish fillets was the main product that was exported during the review period with a value of N$1,173.8 mil-lion, thus accounting for 43.0 percent of total export of this category. This was followed by Pelagic fish with a value of N$830.8 million (30.4%) and Freshwater fish with a value of N$175.3 million (6.4%), Other products of prepared and preserved fish registered a combine value of N$243.4 million (8.9%) (Figure 19).
1,32
6.3
1,23
7.9
1,15
3.1
1,01
0.1
1,17
3.8
884.
9
843.
5
603.
2
615.
5
830.
8
213.
1
131.
1
174.
1
180.
6
175.
3
16.5
8.9 13.5
41.4
141.
1
100.
4
116.
0
99.5
89.6
97.6
44.7
34.5
30.4
112.
4
69.7
322.
6
255.
3
296.
1
284.
7
243.
4
Q1 Q2 Q3 Q4 Q1
2020 2021
MIL
LIO
N N
$
Fish fillets
Pelagic fish
Freshwater fish
Prepared dishes of fish,molluscs and crustaceans
Crabs
Fish of Gadiformes
Other
Figure 19: Export of Prepared and Preserved Fish, Crustaceans, Molluscs and Aquatic Invertebrates- N$ Million Source: NSA
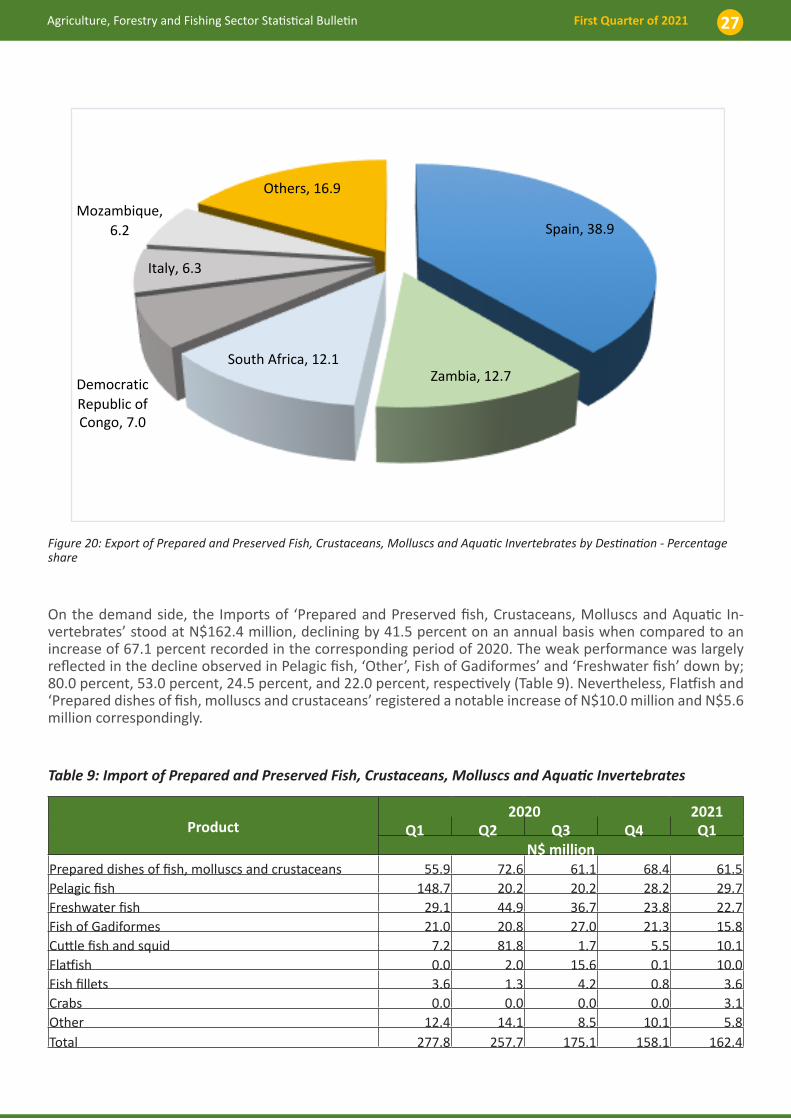
During the quarter under review, Spain was the main market for ‘Prepared and preserved Fish, Crustaceans, Molluscs and Aquatic invertebrates’, claiming 38.9 percent of the group exports, followed by Zambia 12.7 percent, South Africa with 12.1 percent, Democratic Republic of Congo 7.0 percent while Italy and Mozam-bique registered a share of 6.3 percent and 6.2 percent, respectively (Figure 20). A share of 16.9 percent was exported to other countries
Agriculture, Forestry and Fishing Sector Statistical Bulletin First Quarter of 2021 27
Spain, 38.9
Zambia, 12.7South Africa, 12.1
Democratic Republic of Congo, 7.0
Italy, 6.3
Mozambique, 6.2
Others, 16.9
Figure 20: Export of Prepared and Preserved Fish, Crustaceans, Molluscs and Aquatic Invertebrates by Destination - Percentage share
On the demand side, the Imports of ‘Prepared and Preserved fish, Crustaceans, Molluscs and Aquatic In-vertebrates’ stood at N$162.4 million, declining by 41.5 percent on an annual basis when compared to an increase of 67.1 percent recorded in the corresponding period of 2020. The weak performance was largely reflected in the decline observed in Pelagic fish, ‘Other’, Fish of Gadiformes’ and ‘Freshwater fish’ down by; 80.0 percent, 53.0 percent, 24.5 percent, and 22.0 percent, respectively (Table 9). Nevertheless, Flatfish and ‘Prepared dishes of fish, molluscs and crustaceans’ registered a notable increase of N$10.0 million and N$5.6 million correspondingly.
Table 9: Import of Prepared and Preserved Fish, Crustaceans, Molluscs and Aquatic Invertebrates
Product2020 2021
Q1 Q2 Q3 Q4 Q1N$ million
Prepared dishes of fish, molluscs and crustaceans 55.9 72.6 61.1 68.4 61.5Pelagic fish 148.7 20.2 20.2 28.2 29.7Freshwater fish 29.1 44.9 36.7 23.8 22.7Fish of Gadiformes 21.0 20.8 27.0 21.3 15.8Cuttle fish and squid 7.2 81.8 1.7 5.5 10.1Flatfish 0.0 2.0 15.6 0.1 10.0Fish fillets 3.6 1.3 4.2 0.8 3.6Crabs 0.0 0.0 0.0 0.0 3.1Other 12.4 14.1 8.5 10.1 5.8Total 277.8 257.7 175.1 158.1 162.4
Agriculture, Forestry and Fishing Sector Statistical Bulletin First Quarter of 202128
9. Food and Non-Alcoholic beverages Inflation
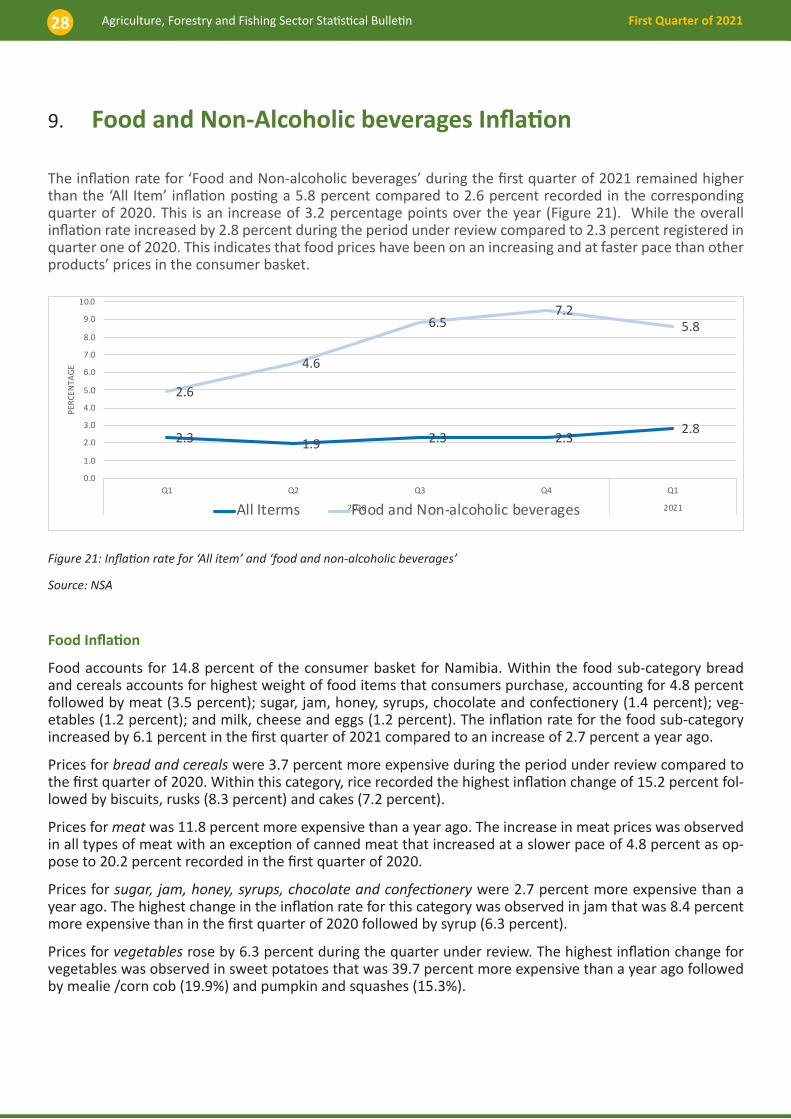
The inflation rate for ‘Food and Non-alcoholic beverages’ during the first quarter of 2021 remained higher than the ‘All Item’ inflation posting a 5.8 percent compared to 2.6 percent recorded in the corresponding quarter of 2020. This is an increase of 3.2 percentage points over the year (Figure 21). While the overall inflation rate increased by 2.8 percent during the period under review compared to 2.3 percent registered in quarter one of 2020. This indicates that food prices have been on an increasing and at faster pace than other products’ prices in the consumer basket.
2.3 1.9 2.3 2.32.8
2.6
4.6
6.57.2
5.8
0.0
1.0
2.0
3.0
4.0
5.0
6.0
7.0
8.0
9.0
10.0
Q1 Q2 Q3 Q4 Q1
2020 2021
PERC
ENTA
GE
All Iterms Food and Non-alcoholic beverages
Figure 21: Inflation rate for ‘All item’ and ‘food and non-alcoholic beverages’
Source: NSA
Food Inflation
Food accounts for 14.8 percent of the consumer basket for Namibia. Within the food sub-category bread and cereals accounts for highest weight of food items that consumers purchase, accounting for 4.8 percent followed by meat (3.5 percent); sugar, jam, honey, syrups, chocolate and confectionery (1.4 percent); veg-etables (1.2 percent); and milk, cheese and eggs (1.2 percent). The inflation rate for the food sub-category increased by 6.1 percent in the first quarter of 2021 compared to an increase of 2.7 percent a year ago.
Prices for bread and cereals were 3.7 percent more expensive during the period under review compared to the first quarter of 2020. Within this category, rice recorded the highest inflation change of 15.2 percent fol-lowed by biscuits, rusks (8.3 percent) and cakes (7.2 percent).
Prices for meat was 11.8 percent more expensive than a year ago. The increase in meat prices was observed in all types of meat with an exception of canned meat that increased at a slower pace of 4.8 percent as op-pose to 20.2 percent recorded in the first quarter of 2020.
Prices for sugar, jam, honey, syrups, chocolate and confectionery were 2.7 percent more expensive than a year ago. The highest change in the inflation rate for this category was observed in jam that was 8.4 percent more expensive than in the first quarter of 2020 followed by syrup (6.3 percent).
Prices for vegetables rose by 6.3 percent during the quarter under review. The highest inflation change for vegetables was observed in sweet potatoes that was 39.7 percent more expensive than a year ago followed by mealie /corn cob (19.9%) and pumpkin and squashes (15.3%).

Agriculture, Forestry and Fishing Sector Statistical Bulletin First Quarter of 2021 29
Prices for milk, cheese and eggs were 2.2 percent more expensive than a year ago. The highest price change for this category was observed in baby milk powdered that was 7.3 percent more expensive than a year ago followed by fresh milk, long life milk (4.4%) and preserved milk (4.4%).
During the quarter under review, Fruits registered the highest change in prices, with prices increasing by 12.1 percent (Figure 22). Within this category, avocados recorded the highest inflation rate of 37.8 percent during the first quarter of 2021 followed by citrus fruits (20.2%) and water melons (14.9%).
-2.0
0.0
2.04.0
6.0
8.010.0
12.0
14.0
16.018.0
Q1 Q2 Q3 Q4 Q1
2020 2021
Perc
enta
ge
Bread and cereals
Meat
Fish
Milk, cheese and eggs
Oils and fats
Fruit
Vegetables including potatoes and other tubers
Sugar, jam, honey, syrups, chocolate andconfectionery
Other Food products
All Food Items
Figure 22: Inflation rate for food items - percentage
Source: NSA
Agriculture, Forestry and Fishing Sector Statistical Bulletin First Quarter of 202130
10. Technical Note
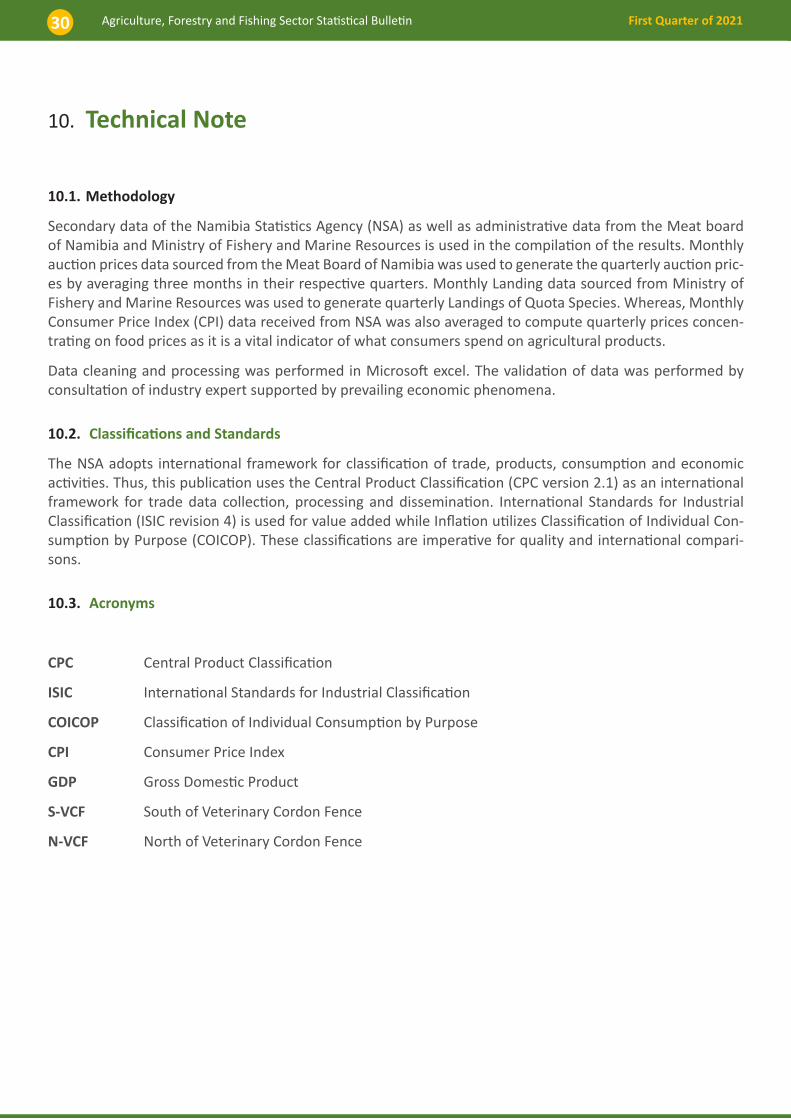
10.1. Methodology
Secondary data of the Namibia Statistics Agency (NSA) as well as administrative data from the Meat board of Namibia and Ministry of Fishery and Marine Resources is used in the compilation of the results. Monthly auction prices data sourced from the Meat Board of Namibia was used to generate the quarterly auction pric-es by averaging three months in their respective quarters. Monthly Landing data sourced from Ministry of Fishery and Marine Resources was used to generate quarterly Landings of Quota Species. Whereas, Monthly Consumer Price Index (CPI) data received from NSA was also averaged to compute quarterly prices concen-trating on food prices as it is a vital indicator of what consumers spend on agricultural products.
Data cleaning and processing was performed in Microsoft excel. The validation of data was performed by consultation of industry expert supported by prevailing economic phenomena.
10.2. Classifications and Standards
The NSA adopts international framework for classification of trade, products, consumption and economic activities. Thus, this publication uses the Central Product Classification (CPC version 2.1) as an international framework for trade data collection, processing and dissemination. International Standards for Industrial Classification (ISIC revision 4) is used for value added while Inflation utilizes Classification of Individual Con-sumption by Purpose (COICOP). These classifications are imperative for quality and international compari-sons.
10.3. Acronyms
CPC Central Product Classification
ISIC International Standards for Industrial Classification
COICOP Classification of Individual Consumption by Purpose
CPI Consumer Price Index
GDP Gross Domestic Product
S-VCF South of Veterinary Cordon Fence
N-VCF North of Veterinary Cordon Fence

Agriculture, Forestry and Fishing Sector Statistical Bulletin First Quarter of 2021 31
11. Definitions
CPC The CPC presents categories for all products that can be the object of do-mestic or International transactions or that can be entered into stocks.
Agricultural Commodities Include products of horticulture and market gardening as well as live animals and their products excluding meat and other manufactured products.
Forestry Commodities Includes wood in rough, and non-wood forestry products. It excludes manu-factured forestry products.
Fishery Commodities It includes lives fish not for human consumption, live fish or chilled for human consumption, live Crustaceans fresh or chilled, live Molluscs fresh or chilled, other live aquatic invertebrates, fresh or chilled, and other aquatic plants and animals. It excludes manufactured products such as processed fish.
Animal Feeds Includes bran and other residues from the working of cereals or legumes; vegetable materials and vegetable waste, vegetable residues and by-products, whether or not in the form of pellets, of a kind used in animal feeding.
Fertilizers and Pesticides Includes Mineral or chemical fertilizers, nitrogenous/ phosphatic/ potassic and other fertilizer used in
Meat and Meat products The group included manufactured and processed meat.
Prepared and preserved fish-
crustaceans, molluscs and-
other aquatic invertebrates It includes processed fishery products as defined under fishery commodities.
Livestock Auction Prices Is the biding price that is accepted by the seller of a livestock.
Prepared dishes and meals- based on meat: Comprises of ready-made (i.e. prepared, seasoned and cooked) meals and dishes with meat, meat offal or blood as the main ingredient.

Agriculture, Forestry and Fishing Sector Statistical Bulletin First Quarter of 202132
12. Statistical Tables
Table A: Export of Agricultural, Forestry and Fishery Commodities – N$ million
Year Quarter Agriculture Forestry Fishing Total Agriculture, Forestry and Fishery Commodities
2017
1 443 5 68 516
2 748 7 45 801
3 944 10 16 970
4 1130 9 28 1166
2018
1 854 8 33 894
2 754 11 33 798
3 910 13 54 977
4 1248 17 53 1318
2019
1 591 11 74 676
2 845 18 56 920
3 638 17 45 700
4 1243 14 44 1301
2020
1 449 75 52 576
2 334 22 19 375
3 523 20 42 585
4 1237 28 33 1297
2021 1 450 24 58 531
Agriculture, Forestry and Fishing Sector Statistical Bulletin First Quarter of 2021 33
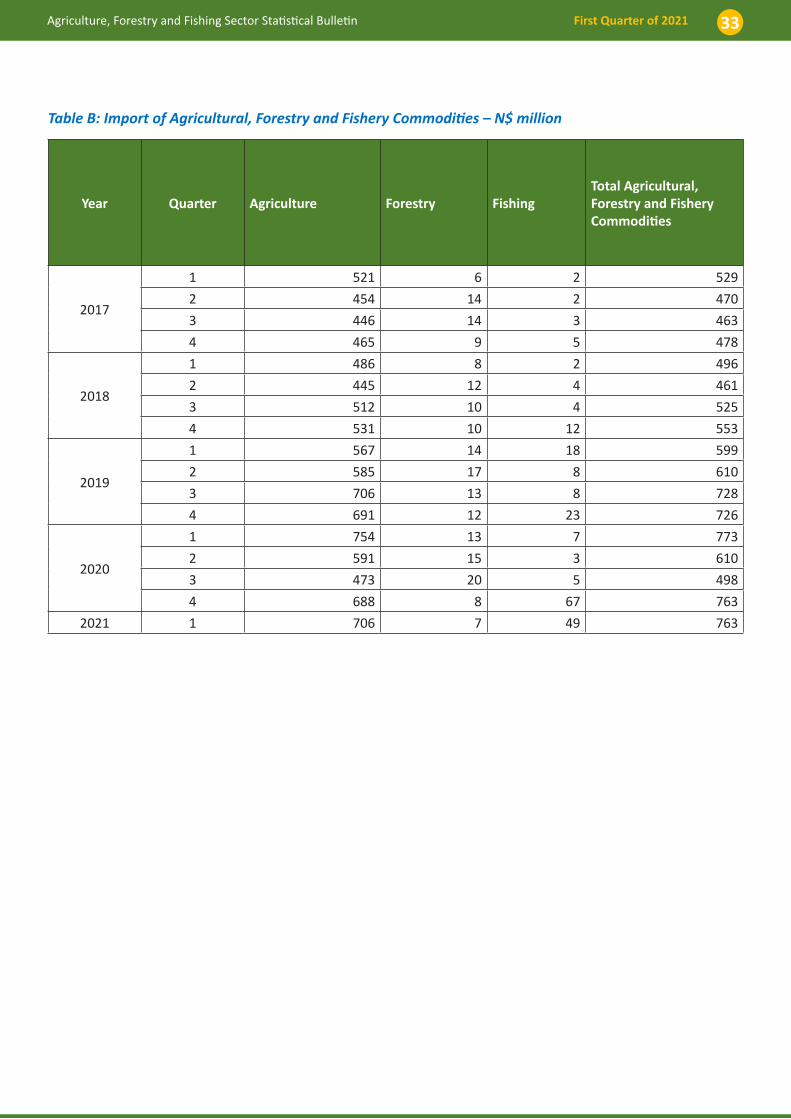
Table B: Import of Agricultural, Forestry and Fishery Commodities – N$ million
Year Quarter Agriculture Forestry Fishing Total Agricultural, Forestry and Fishery Commodities
2017
1 521 6 2 529
2 454 14 2 470
3 446 14 3 463
4 465 9 5 478
2018
1 486 8 2 496
2 445 12 4 461
3 512 10 4 525
4 531 10 12 553
2019
1 567 14 18 599
2 585 17 8 610
3 706 13 8 728
4 691 12 23 726
2020
1 754 13 7 773
2 591 15 3 610
3 473 20 5 498
4 688 8 67 763
2021 1 706 7 49 763

Agriculture, Forestry and Fishing Sector Statistical Bulletin First Quarter of 202134
Table C: Export of Agricultural Commodities – N$ million
Year Quarter Cereals
Edible roots and tubers with high starch or in-ulin content
Eggs of hens or other birds in shell, fresh
Trees and other plants, live; bulbs, roots and the like; cut flowers and ornamental foliage
Fruits and nuts
Live ani-mals
Oilseeds and oleagi-nous fruits
2017
1 0.1 1.6 - 12.2 25.4 391.0 0.4
2 0.4 1.6 0.0 5.2 24.6 691.9 1.6
3 0.0 2.0 0.0 20.3 3.2 875.8 2.5
4 0.0 0.0 0.0 11.3 486.6 584.5 0.6
2018
1 0.1 1.6 0.0 12.3 68.6 731.2 1.4
2 0.0 0.7 0.0 12.2 43.4 674.8 0.6
3 0.5 1.7 0.0 20.5 12.3 795.8 2.1
4 0.0 0.2 0.0 13.3 615.4 566.3 0.1
2019
1 0.0 0.2 0.0 11.0 71.9 484.1 0.0
2 0.3 2.5 0.4 18.8 56.8 725.4 0.5
3 0.2 1.7 0.8 27.5 12.7 547.8 -
4 1.6 0.0 0.0 28.2 794.5 371.5 0.0
2020
1 0.2 0.0 0.0 14.8 55.3 368.3 0.0
2 0.7 0.3 - 13.4 27.6 272.3 0.8
3 0.1 1.7 0.2 18.0 13.1 413.2 2.5
4 1.0 0.2 0.3 21.7 845.5 317.5 0.1
2021 1 1.4 0.4 0.0 8.5 166.7 266.1 0.0

Agriculture, Forestry and Fishing Sector Statistical Bulletin First Quarter of 2021 35
Table C: Export of Agricultural Commodities – N$ million (Cont…)
Year Qua-rter
Pulses (dried legumi-nous veg-etables)
Raw milk
Reproduc-tive ma-terials of animals
Stimulant, spice and aromatic crops
Sugar crops
Vegetables Other animal products
Total Ag-ricultural Commodi-ties
2017 1 -
-
0.1 0.3
0.0
0.9 10.8
442.8
2 0.0
0.0
0.0 0.1
-
7.3 15.6
748.5
3 0.0
0.0
0.2 0.1
0.0
28.9 11.3
944.3
4 0.0
0.0
0.3 0.9
0.0
31.6 13.7
1,129.6
2018 1 -
0.0
0.9 0.3
0.0
4.5 32.7
853.5
2 0.0
0.0
0.0 0.1
-
9.2 13.4
754.4
3 -
0.0
0.1 0.9
-
54.6 21.7
910.1
4 0.0
0.0
0.4 0.3
-
38.6 13.8
1,248.5
2019 1 0.0
0.0
0.0 0.1
0.0
4.6 18.9
590.9
2 0.1
0.0
0.0 0.6
0.0
22.8 17.1
845.5
3 -
0.0
0.4 0.5
0.0
30.0 16.7
638.3
4 0.0
0.0
1.4 0.2
-
37.1 8.5
1,243.0
2020 1 0.0
0.0
0.0 0.1
0.0
6.1 4.3
449.1
2 0.0
0.0
0.6 0.1
-
18.2 0.5
334.4
3 0.0
0.0
3.3 0.1
0.0
56.7 13.5
522.5
4 0.0
0.0
1.0 1.2
0.0
47.6 0.5
1,236.7
2021 1 0.0
0.0
0.1 1.3
0.0
4.8 0.5
450.0

Agriculture, Forestry and Fishing Sector Statistical Bulletin First Quarter of 202136
Table D: Import of Agricultural Commodities – N$ million
YearQuar-
terCereals
Edible roots and tubers with high
starch or in-ulin content
Eggs of hens or other birds in shell, fresh
Trees and oth-er plants, live;
bulbs, roots and the like; cut flowers
and ornamen-tal foliage
Fruits and nuts
Live ani-mals
Oilseeds and oleagi-nous fruits
2017
1 261.1 38.3 1.7 15.6 69.5
10.7 0.9
2 187.9 23.1 4.3 16.0 58.2
31.2 1.4
3 121.2 43.0 1.4 34.7 68.9
28.5 2.7
4 149.3 48.2 0.3 14.4 83.5
18.4 2.6
2018
1 215.4 31.4 0.2 14.2 73.2
11.3 1.3
2 178.5 31.7 2.1 15.7 69.0
14.5 1.4
3 206.7 40.2 4.6 29.7 74.7
17.1 0.8
4 233.9 35.9 0.1 15.5 85.5
25.1 0.9
2019
1 292.3 41.9 0.2 14.6 82.2
5.2 1.2
2 292.5 35.5 0.4 29.8 80.8
4.4 2.2
3 365.5 36.2 0.8 55.6 88.0
7.6 4.7
4 373.7 38.2 0.1 26.8 99.8
6.7 2.0
2020
1 449.0 43.0 0.0 15.7 88.1
10.8 0.8
2 313.0 33.2 0.0 14.3 71.8
7.3 0.7
3 171.7 40.1 0.1 30.0 88.1
6.7 0.8
4 378.8 46.3 0.9 18.4 81.0
11.5 3.4
20211 390 45 0 12 82
19 1

Agriculture, Forestry and Fishing Sector Statistical Bulletin First Quarter of 2021 37
Table D: Import of Agricultural Commodities – N$ million (Cont…)
YearQuar-
ter
Pulses (dried le-guminous
vegeta-bles)
Raw milk
Repro-ductive
materials of ani-mals
Stim-ulant,
spice and aromatic
crops
Sugar crops
Vegeta-bles
Other animal prod-ucts
Total Ag-ricultural Commod-
ities
2017
1 2.8 16.9
0.3 50.5
0.1 45.4
7.2
520.8
2 2.9 17.9
0.2 63.5
0.1 42.4
4.6
453.6
3 3.1 22.8
0.2 70.1
0.2 31.2
17.9
445.9
4 3.2 16.5
0.2 65.2
0.2 43.0
19.6
464.6
2018
1 1.6 17.9
0.2 49.9
0.0 54.0
15.2
485.9
2 2.9 13.8
0.3 67.0
0.1 43.4
4.5
444.9
3 2.5 14.4
0.3 78.8
1.8 36.3
4.0
512.0
4 3.6 13.6
0.2 67.2
0.1 46.8
2.9
531.3
2019
1 2.6 15.7
1.4 53.5
0.0 53.9
2.7
567.2
2 3.0 16.5
0.2 64.1
0.1 47.3
8.3
585.0
3 2.4 17.7
0.2 82.2
0.1 41.1
4.4
706.4
4 5.8 24.8
0.2 59.6
0.0 43.5
10.0
691.3
2020
1 5.0 26.8
0.4 56.4
0.0 54.1
3.4
753.6
2 18.1 24.2 - 57.7
0.1 47.0
3.9
591.4
3 2.8 28.5
0.1 61.4
0.1 37.1
5.8
473.1
4 3.0 34.1
0.3 63.9
0.1 33.6
13.0
688.3
20211 4
39
0 52
0 55
6
706.0
Agriculture, Forestry and Fishing Sector Statistical Bulletin First Quarter of 202138
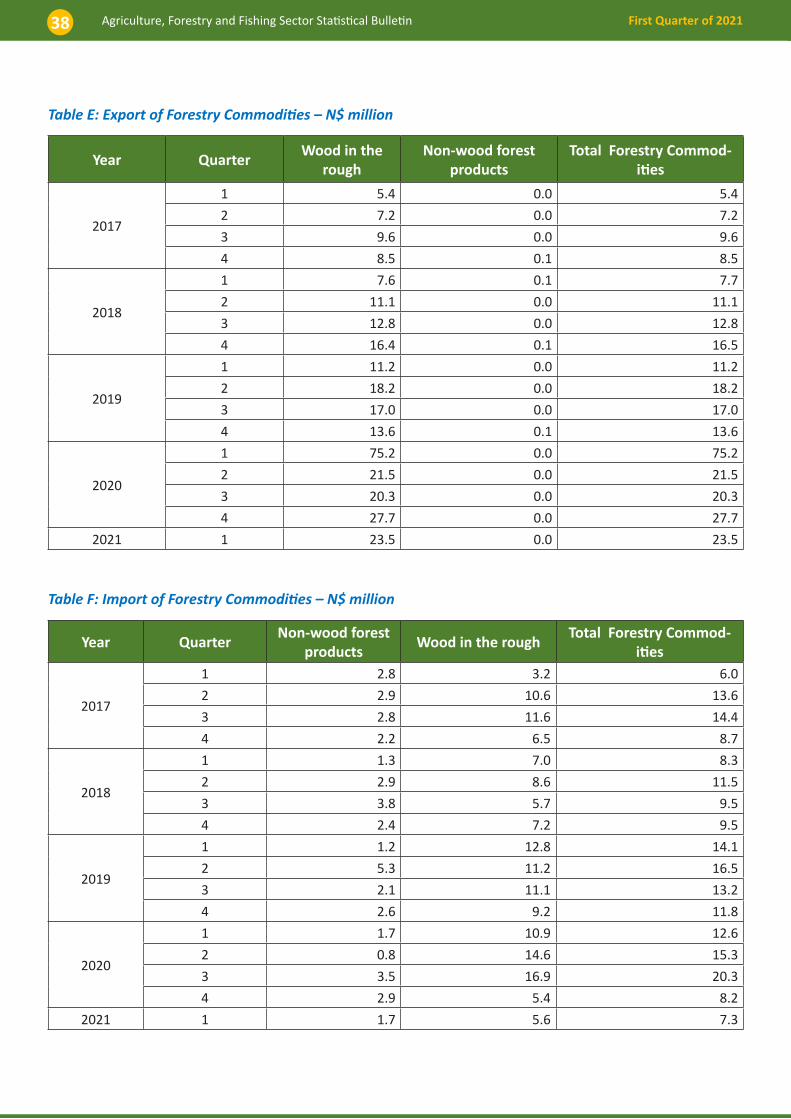
Table E: Export of Forestry Commodities – N$ million
Year QuarterWood in the
roughNon-wood forest
productsTotal Forestry Commod-
ities
2017
1 5.4 0.0 5.4
2 7.2 0.0 7.2
3 9.6 0.0 9.6
4 8.5 0.1 8.5
2018
1 7.6 0.1 7.7
2 11.1 0.0 11.1
3 12.8 0.0 12.8
4 16.4 0.1 16.5
2019
1 11.2 0.0 11.2
2 18.2 0.0 18.2
3 17.0 0.0 17.0
4 13.6 0.1 13.6
2020
1 75.2 0.0 75.2
2 21.5 0.0 21.5
3 20.3 0.0 20.3
4 27.7 0.0 27.7
2021 1 23.5 0.0 23.5
Table F: Import of Forestry Commodities – N$ million
Year QuarterNon-wood forest
productsWood in the rough
Total Forestry Commod-ities
2017
1 2.8 3.2 6.0
2 2.9 10.6 13.6
3 2.8 11.6 14.4
4 2.2 6.5 8.7
2018
1 1.3 7.0 8.3
2 2.9 8.6 11.5
3 3.8 5.7 9.5
4 2.4 7.2 9.5
2019
1 1.2 12.8 14.1
2 5.3 11.2 16.5
3 2.1 11.1 13.2
4 2.6 9.2 11.8
2020
1 1.7 10.9 12.6
2 0.8 14.6 15.3
3 3.5 16.9 20.3
4 2.9 5.4 8.2
2021 1 1.7 5.6 7.3
Agriculture, Forestry and Fishing Sector Statistical Bulletin First Quarter of 2021 39
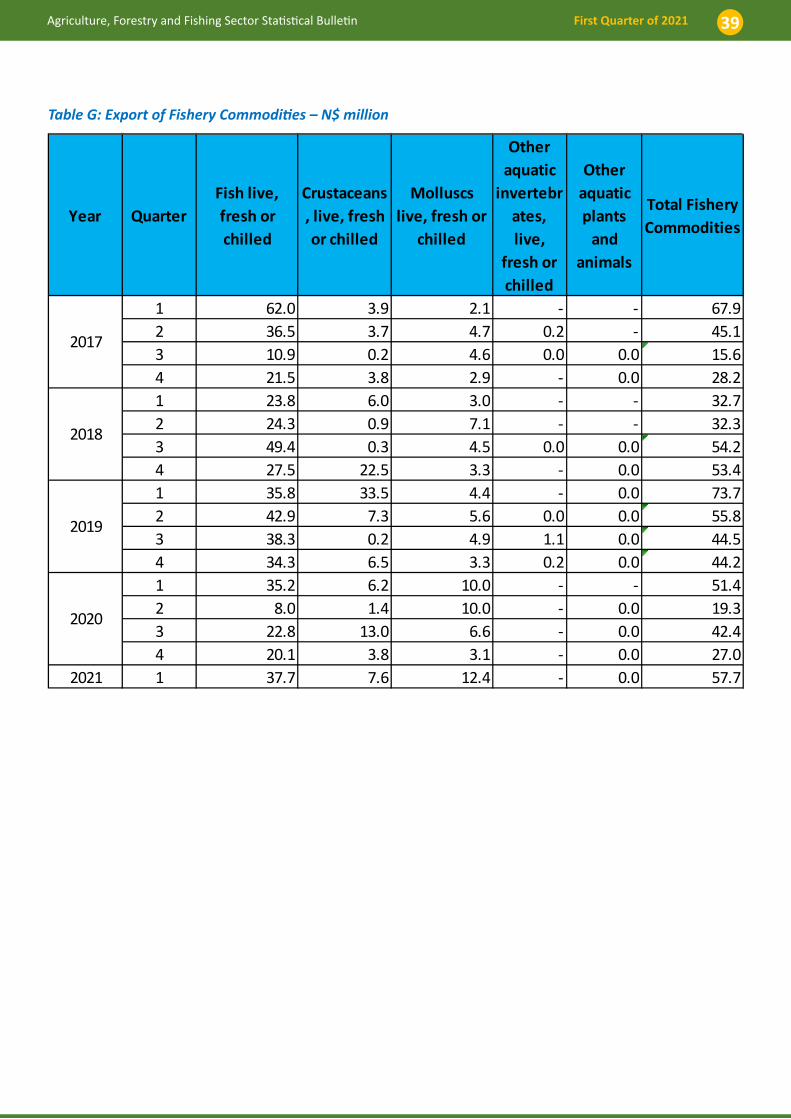
Table G: Export of Fishery Commodities – N$ million
Year QuarterFish live, fresh or chilled
Crustaceans, live, fresh or chilled
Molluscs live, fresh or
chilled
Other aquatic
invertebrates, live,
fresh or chilled
Other aquatic plants
and animals
Total Fishery Commodities
1 62.0 3.9 2.1 - - 67.92 36.5 3.7 4.7 0.2 - 45.13 10.9 0.2 4.6 0.0 0.0 15.64 21.5 3.8 2.9 - 0.0 28.21 23.8 6.0 3.0 - - 32.72 24.3 0.9 7.1 - - 32.33 49.4 0.3 4.5 0.0 0.0 54.24 27.5 22.5 3.3 - 0.0 53.41 35.8 33.5 4.4 - 0.0 73.72 42.9 7.3 5.6 0.0 0.0 55.83 38.3 0.2 4.9 1.1 0.0 44.54 34.3 6.5 3.3 0.2 0.0 44.21 35.2 6.2 10.0 - - 51.42 8.0 1.4 10.0 - 0.0 19.33 22.8 13.0 6.6 - 0.0 42.44 20.1 3.8 3.1 - 0.0 27.0
2021 1 37.7 7.6 12.4 - 0.0 57.7
2017
2018
2019
2020

Agriculture, Forestry and Fishing Sector Statistical Bulletin First Quarter of 202140
Table H: Import of Fishery Commodities – N$ million
Year Quar-ter
Crustaceans, live, fresh or
chilled
Fish live, fresh or chilled for human con-
sumption
Fish, live, not for human
consumption
Molluscs live, fresh or chilled
Other aquatic plants
and ani-mals
Total Imports of Fishery
Commodities
2017 1 0.0 1.8 0.2 0.1 0.1 2.2
2 0.0 2.0 0.2 0.2 0.0 2.5
3 0.1 2.5 0.2 0.3 0.0 3.0
4 0.0 4.0 0.3 0.7 0.0 5.1
2018 1 0.0 1.3 0.2 0.6 0.0 2.2
2 0.2 2.4 0.2 1.4 0.0 4.2
3 0.8 1.9 0.2 0.8 0.0 3.7
4 2.0 2.2 0.2 7.6 0.0 12.0
2019 1 0.6 3.9 0.1 12.8 0.0 17.6
2 0.4 4.6 0.2 3.0 0.0 8.2
3 1.3 6.5 0.1 0.5 0.0 8.4
4 0.5 4.4 0.1 17.8 0.0 22.8
2020 1 2.0 4.6 0.2 0.1 0.0 6.9
2 0.3 1.7 0.1 1.2 0.0 3.3
3 0.2 4.1 0.1 0.1 0.0 4.5
4 0.3 1.6 0.3 64.6 0.0 66.8
2021 1 0 4 0 45 0 49

Agriculture, Forestry and Fishing Sector Statistical Bulletin First Quarter of 2021 41
Table I: Export of Selected Manufacturing Commodities – N$ million
Year Quar-ter
Meat and meat products
Prepared and preserved fish,
crustaceans, mol-luscs and other aquatic inverte-
brates
Animal Feeds
Fertilizers and pesti-
cides
Wood Char-coal
Total Selected Manufacturing Commodities
2017 1 193.2 2 510.8 0
5.5
77.0 2 587.8
2 309.3 2 242.4 0
2.5
85.6 2 328.1
3 392.6 2 387.2 - 8.8
80.3 2 467.5
4 267.3 2 084.8 - 6.3
99.0 2 183.8
2018 1 225.5 25 56.0 0
5.2
69.8 2 625.8
2 351.5 2 723.9 1
7.0
106.0 2 829.9
3 266.4 2 749.4 2
8.7
122.6 2 872.0
4 275.1 2 125.8 1
9.8
126.8 2 252.6
2019 1 265.1 2 515.8 0
5.5
137.0 2 652.8
2 447.4 2 754.1 - 4.8
154.0 2 908.1
3 519.8 2 670.5 - 14.7
202.4 2 872.9
4 304.2 2 495.7 - 11.0
169.3 2 665.0
2020 1 168.4 2 908.6 4
5.5
185.5 3 094.1
2 276.3 2 627.1 5
2.3
203.4 2 830.5
3 295.4 2 370.0 4
5.0
203.4 2 573.4
4 243.7 2 334.3 4
14.0
233.2 2 567.5
2021 1 208.0 2 731.7 7
13.2
232.3 2 964.0

Agriculture, Forestry and Fishing Sector Statistical Bulletin First Quarter of 202142
Table J: Import of Selected Manufacturing Commodities – N$ million
Year QuarterMeat
and meat products
Prepared and preserved fish,
crustaceans, molluscs and other aquatic invertebrates
Animal Feeds
Fertilizers and pesti-
cides
Wood Charcoal
Total Selected Manufacturing Commodities
2017
1 168.2 153.9 12.1 162.3 0.4 153.9
2 174.4 191.5 18.4 190.1 0.9 191.5
3 272.5 128.8 16.4 213.6 0.2 128.8
4 242.9 166.7 13.1 242.8 0.4 166.7
2018
1 188.6 197.6 14.4 197.2 0.2 197.6
2 211.3 245.1 11.4 189.5 0.5 245.1
3 206.4 129.6 15.7 204.1 0.2 129.6
4 271.2 223.7 18.5 269.9 0.5 223.7
2019
1 235.0 166.7 39.4 173.6 0.2 166.7
2 315.5 227.5 55.8 142.5 0.1 227.5
3 194.7 166.4 40.2 171.7 0.2 166.4
4 213.4 179.8 29.1 181.3 0.7 179.8
2020
1 236.3 278.5 21.9 160.5 1.0 278.5
2 261.4 257.7 5.6 137.7 0.3 257.7
3 386.2 175.1 11.7 171.4 0.2 175.1
4 297.9 158.1 9.6 233.8 0.2 158.1
2021 1 229.2 162.4 15.7 192.3 0.3 162.4

Agriculture, Forestry and Fishing SectorStatistical Bulletin - First Quarter 2021
Namibia Statistics Agency
Namibia Statistics Agency