agriculture – pathways to prosperity in asia and the pacific
TRANSCRIPT
Agriculture – Pathways toProsperity in Asia and the Pacific
ASIA AND THE PACIFIC DIVISION
March 2011
Agriculture-Pathways toProsperity in Asia and the
Pacific
Asia and the Pacific DivisionInternational Fund for Agricultural Development
March 2011
ii
Acknowledgements
This report was prepared under the overall supervision and guidance of Ganesh Thapa, RegionalEconomist, Asia and the Pacific Division of IFAD and Raghav Gaiha, Professor, University of Delhi.It was prepared by a team of researchers comprising Prem Vashishtha, Simrit Kaur and NidhiKaicker. The views expressed are personal and not necessarily of the organisation that sponsored thisstudy. This report has benefitted from the support, guidance and advice of Thomas Elhaut, Director,Asia and the Pacific Division and from the comments of the participants in a Divisional Seminar inthe Asia and the Pacific Division. Raghbendra Jha and Chitra Deshpande offered detailed commentson an earlier version that enriched the analysis. Raj Bhatia, Sundeep Vaid and Nicolas Syed madevaluable contributions to the statistical analysis. Valentina Camaleonte provided editorial assistance.
iii
CONTENTS
List of Illustrations ..................................................................................................................................v
Executive summary................................................................................................................................vi
Chapter 1: Introduction ...........................................................................................................................1
1.1. What’s new for rural economies and agriculture?........................................................................3
1.1.1. Food Price Surge and the Poor ..............................................................................................3
1.2. The changing context for rural poverty reduction........................................................................4
1.3. Innovative Approaches to Rural Poverty Reduction....................................................................5
1.3.1. Diversification of Agriculture and Labour Productivity .......................................................6
1.3.2. Smallholders and Supermarkets ............................................................................................6
1.3.3. Transfer of Agriculture Labour to Other Sectors ..................................................................7
1.3.4. Non-Farm Income and Rural Poverty ...................................................................................7
1.4. Financial Crisis, Poverty and Hunger ..........................................................................................8
1.5. Key Messages ............................................................................................................................10
Chapter 2: The state of rural poverty today...........................................................................................11
2.1. Measuring rural poverty and hunger ..........................................................................................11
2.1.1. Rural share of total poverty.................................................................................................11
2.1.2. Rural Poverty Incidence ......................................................................................................11
2.1.3. Number of Rural Poor .........................................................................................................12
2.1.4. Undernourishment...............................................................................................................13
2.2. The livelihoods of poor rural households...................................................................................14
2.2.1. What do the rural households do? .......................................................................................14
2.2.2. Moving in and out of poverty..............................................................................................15
2.3. Multidimensionality of Poverty .................................................................................................17
2.3.1. Rural women .......................................................................................................................18
2.3.2. Children and Youth .............................................................................................................21
2.3.3. Indigenous Peoples..............................................................................................................23
2.4. Equity – Efficiency Trade-Offs..................................................................................................25
2.5. Key messages .............................................................................................................................25
Chapter 3: The Importance of Addressing Risk....................................................................................26
3.1. Introduction................................................................................................................................26
3.2. How risks and shocks affect poverty dynamics .........................................................................26
3.3. Some of the Key Risks for Poor Rural People Today................................................................27
3.3.1. Personal and Household Level Risks: Ill Health.................................................................27
3.3.2. Natural Disasters .................................................................................................................28
3.3.3. Land Tenure Insecurity .......................................................................................................30
3.3.4. Market Related Risks: Rising Food Prices and Volatility...................................................34
3.3.5. The State as a Source of Risk..............................................................................................38
iv
3.4. Some Institutional Responses to Risk ........................................................................................38
3.4.1. Community-Level Support and Access to Financial Institutions........................................38
3.4.2. Social Protection .................................................................................................................40
3.5. Key Messages ............................................................................................................................41
Chapter 4: Agricultural markets for increased income .........................................................................42
4.1. Introduction................................................................................................................................42
4.2. Why Agricultural Markets Matter to Rural Poor? .....................................................................42
4.3. How Markets have Changed in the Past Few Decades? ............................................................44
4.3.1. Threat to Smallholder Participation ....................................................................................45
4.3.2. Opportunities and Challenges .............................................................................................45
4.4. Key Market Factors for Poor Rural People ................................................................................46
4.5. How the Emergence of Pro-poor Agricultural Markets can be supported? ...............................48
4.5.1. Role of Government, NGOs and Donors ............................................................................50
4.6. Key Messages ............................................................................................................................50
Chapter 5: Sustainable Intensification of Agriculture...........................................................................52
5.1. Introduction................................................................................................................................52
5.2. Agricultural Technology and Smallholders ...............................................................................52
5.2.1. Sub-Sectors .........................................................................................................................53
5.2.2. Biotechnology in Agriculture..............................................................................................54
5.3. Enhancing Agricultural Productivity Today – Some Key Challenges.......................................54
5.3.1. Concerns about Sustainability.............................................................................................55
5.3.2. Climate Change...................................................................................................................55
5.4. An Emerging Agenda for Sustainable Agricultural Intensification ...........................................57
5.5. Moving the Agenda Forward: Policy and Institutional Conditions ...........................................58
5.5.1. Making Intensification Sustainable .....................................................................................60
5.5.2. Enhancing Productivity in Areas with Significant Potential ...............................................60
5.5.3. Collaboration of International Agencies, NGOs and National Governments .....................61
5.6. Key Messages ............................................................................................................................61
Chapter 6: Creating Opportunities in the Rural Non-Farm Economy...................................................62
6.1. Introduction................................................................................................................................62
6.2. The Rural Non-farm Economy...................................................................................................62
6.2.1. Composition, Characteristics and Importance to Rural People...........................................62
6.2.2. RNFE, Poverty and Inequality ............................................................................................64
6.3. What drives the rural non-farm economy?.................................................................................65
6.4. Policies to promote the Rural Non-farm Economy....................................................................67
6.5. Key Messages ............................................................................................................................69
Chapter 7: What needs to be done and how? ........................................................................................70
7.1. Addressing major challenges and creating opportunities for tomorrow’s generation ................70
7.2. Four cross-cutting issues ............................................................................................................73
v
7.3. Supporting this agenda: the role of national stakeholders..........................................................74
7.4. Supporting this agenda: the role of international development agencies ...................................75
Bibliography..........................................................................................................................................77
LIST OF ILLUSTRATIONS
Table 1: Profile of the Sub-Regions in Asia and the Pacific...................................................................2Table 2: Growth Rates of Monthly Wages in Asia and the Pacific Region, 2000-2009.......................10Table 3: Dynamics of Poverty in Selected Asia-Pacific Countries.......................................................16Table 4: Multidimensional Poverty.......................................................................................................18Table 5: Women’s Empowerment (Per Cent of Women Having a Say in Key Life Transitions) ........19Table 6: Ratio of Female Wage Rate to Male Wage Rate in Selected Asia-Pacific Countries ............21Table 7: Number, Frequency and Mortality of Natural Disasters by Sub-Region in Asia and thePacific....................................................................................................................................................29Table 8: Overview of Foreign Land Investments in South East Asia from 2006-2009 ........................31
**********************************************************************************
Figure 1: Trends in Rural Population....................................................................................................11Figure 2: Rural Share of Total Poverty….. ..........................................................................................12Figure 3: Rural Poverty Incidence…………………………………………………………………….12Figure 4: Number of Rural Poor (people living on less than $1.25 a day) ...........................................13Figure 5: Prevalence of Underweight and Rural - Urban Disparities ...................................................13Figure 6: Number and Share of Small Farms in Selected Countries in Asia and the Pacific Region ...33Figure 7: Volatility and Growth of Food Prices in Selected Asia-Pacific Countries (1998-2008) .......34Figure 8: Food-Energy Price Nexus......................................................................................................36Figure 9: Marketing Costs for Rice in Cambodia, 2002 (Riels per kilogram of paddy rice) ................43Figure 10: Market Access (Share of Rural Population) by Income Group in Different FarmingSystems in East Asia and the Pacific ....................................................................................................44Figure 11: Sources of income and participation in RNFE by expenditure quintile in Selected Countriesin Asia and the Pacific Region ..............................................................................................................63
**********************************************************************************
Box 1: Impact of food price crisis in Greater Mekong ...........................................................................4Box 2: Financial Crisis and Poverty in Cambodia ..................................................................................9Box 3: Interregional variations in Poverty in Nepal .............................................................................12Box 4: Determinants of Rural Poverty in Laos and Cambodia .............................................................14Box 5: Smallholders and Occupational Diversification in India...........................................................15Box 6: Gender Disparities.....................................................................................................................20Box 7: Creating opportunities for rural youth: Projects and Programmes in Asia and the PacificRegion ...................................................................................................................................................23Box 8: Natural Disasters in Cambodia..................................................................................................29Box 9: Land Concessions in Rural Cambodia ......................................................................................32Box 10: Food Price Hike and Coping Strategies: A Case Study of Nepal............................................37Box 11: Linking Smallholders to Value Chains....................................................................................49Box 12: Options in Emission Reduction...............................................................................................56Box 13: Agricultural R&D....................................................................................................................57Box 14: Township and Village Enterprises (TVEs) in China ...............................................................68Box 15: Political Economy of Agricultural Policy Reforms.................................................................73
vi
EXECUTIVE SUMMARY
In Asia, 70 per cent of the poor live in rural areas. Although every region of Asia has madeconsiderable progress in reduction of rural poverty in the last decade, the problem remains acute. Theproblem has been exacerbated due to the Triple-F (food, fuel and financial) crises and this has mademeeting of MDG 1 of halving extreme poverty by 2015 more challenging. While a considerablenumber of rural households are chronically poor, there are many more who move in and out ofpoverty. From a policy perspective, it is important to distinguish between the transient andpersistently poor households, as the latter require massive transfers sustained over long periods.Moreover, poverty is a multi-dimensional concept and must not be viewed only in terms of incomedeprivation. In several parts of Asia and elsewhere, rural poverty is also reflected in several inter-locking non-income deprivations in education, health and sanitation, among others. Further, withinrural societies, women, youth and indigenous people are often disproportionately affected bydisadvantages that tend to make mobility out of poverty even harder.
What causes income poverty? Despite wide-ranging diversities, many poor rural people in Asia andthe Pacific Region are either landless or own a limited piece of land, possess large families, lackeducation and have limited access to markets, credit and technology. A stylized fact about ruralpoverty is that the poorer rural households derive the highest proportion of their incomes fromfarming and agricultural labour, while the better-off households derive the most from non-farmactivities. In addition, lack of market information, business and negotiating experience and collectiveorganisations deprive them of the power to compete on equal terms in the marketplace.
Poverty, however, is not just a matter of deprivation but also of vulnerability to exogenous shocks.Shocks can trap people in poverty by eroding their assets and capabilities to a point that they areunable to accumulate enough to move out of poverty. These shocks include natural disasters, climatechange, pest outbreaks (e.g. avian influenza), vulnerability to food price fluctuations, illness, anddeath. The region is also highly vulnerable to fluctuations in energy prices due to its high dependenceon fossil fuels. This worsens food insecurity. Rural communities and households have a range ofmechanisms for coping with downturns. As risk-coping mechanisms, households generally resort toselling productive assets, borrowing, depleting savings, migrating, and reducing expenditure on food,healthcare and education (notably affecting women and children). Although segments of ruralpopulation have developed relatively strong risk-management and risk-coping strategies, vulnerabilityremains high. Some parts of the region (e.g. Afghanistan, Sri Lanka, Nepal, Bangladesh, andPakistan) are also affected by instability and conflict, or have recently recovered from conflict. Thepolicy emphasis has to go beyond augmenting incomes to risk mitigation and coping.
Volatile food prices pose a threat to the rural poor. Domestic food prices have been less volatile inAsia and the Pacific due to more stable supplies and regulated markets (for instance, in India,Indonesia and Bangladesh). However, some of the poorest countries (e.g. Cambodia) experiencedsevere hardships. In general, there are six domains to be taken into account to reduce food pricevolatility: addressing supply-side constraints (e.g. policies that support access to credit); managementof and control over natural resources; and access to research and extension services; supply-management and price stabilization policies; safety net programmes; value-addition for agriculturalproducts: redressing price information gaps and asymmetries; and provision of storage facilitiescombined with access to credit for smallholder farmers.
Agriculture contributes substantially to GDP growth and poverty reduction. Simulations show thatAsia and the Pacific Region as a whole would need a 56 per cent increase in agricultural ODA, a 28per cent increase in agricultural expenditure, a 23 per cent increase in fertilizer use, or a 24 per centincrease in agricultural investment in 2007-13 for achieving MDG 1 (at US$2 poverty line) overhistorical trends (but with varying sub-regional requirements). So the prospects of achieving MDG1are not so daunting. Strategic options in farm and non-farm transformation are elaborated below.
vii
Since the rural poor depend on agriculture for their livelihoods, any policy that aims to reduce ruralpoverty has to focus on agricultural intensification and diversification that are both market-orientedand sustainable.
There is a shift from the traditional supply chains characterised by many traders and intermediariesand face-to-face interactions between agents, towards chains with fewer links and more impersonaldealings. Supermarket chains offer better deals to farmers, higher prices and greater certainty ofselling the produce, along with credit and technical assistance in certain cases. However, farmers arealso obliged to meet stringent quality requirements and adhere to food safety standards. Supermarketsprefer dealing with few large farmers rather than many small farmers. Organising small farmers is achallenge. Further, in response to changes in dietary habits and lifestyle, and liberalization of retailtrade, supermarkets with global links are emerging fast. Smallholders’ participation in supplychain/supermarkets can be made profitable if the government plays the role of not only providingpublic goods (infrastructure, food safety standards, and favourable environment for enforcingcontracts) but also a proactive role in collaboration with forward looking private players in providinginputs and transferring technology to smallholders. These initiatives, combined with suitable tradenegotiations, can be helpful in overcoming the threats that global trade poses to smallholders.
Small farmers face several challenges, such as high transaction costs in accessing inputs, credit andmarketing facilities. Specifically, it is difficult for them to access high-value crops even though theyare labour intensive and more suited for their size. This is because of highly volatile prices and highmarket risks associated with high-value agricultural commodities. Further, in recent years, agriculturalfunding has shifted from public to private research. This change has grave consequences for smallfarmers as private research companies lack incentives to address small farmers’ concerns.
The emerging agenda for sustainable development in this region must focus on making agricultureless risky for smallholders; and conserving the environment and raising productivity. Thedevelopment of modern varieties, evolution of GMOs, adoption of conservation agriculture, all needserious efforts by several agencies. Further, at the local level, efforts are required by governmentagencies, extension agents, and local leaders to take innovative approaches to the people.
Both rising demand for and rising prices of food have created attractive investment opportunities inthe agricultural sector, especially in large farms. However, the large farm advantage is due to marketfailure (e.g. credit), institutional gaps (e.g. weak extension services) and policy distortion (e.g.minimum support prices). Elimination of such biases against smallholders would enhance theircompetitiveness. State interventions and collective action by producers’ organisations would make asignificant difference.
Secure land rights can increase incentives for investments and secure tenure can increase land valuessubstantially. In addition, such security reduces conflicts, assures availability of collateral, improvesthe bargaining power of the poor and helps in poverty reduction. However, policy interventions toensure the same must be carefully designed to ensure equity without upsetting local customs, as in thecase of indigenous peoples. The market for rentals also enhances the opportunity for landless labourto cultivate and make a transition towards owning such land.
Often traditional land systems fail to recognize women’s rights. The first concern is that womenshould have either joint ownership of land with their spouses, or a joint right to its disposal. Secondly,women must be able to maintain their land rights after the death of their spouses. Gender and landrights in South Asia matter for poverty reduction.
The looming threat of climate change raises serious concerns. Under the different scenarios in theIPCC Special Report on Emission Scenarios (SRES), the global mean surface temperature is expectedto rise, as also the sea level. Freshwater availability in many parts of Asia is expected to decrease by2050. South, East and South East Asia will be at the greatest risk due to expected flooding. In areas of
viii
mid-to-high latitudes, productivity is projected to increase slightly with temperature increasesbetween 1-3°C (depending on the crop), and then decrease in some regions. In regions of low latitude,crop productivity is projected to decrease for even small increases in local temperature. While thesearch for effective mitigation mechanisms continues, it must be combined with adaptation. Thelatter, of course, deserves greater attention than it has received.
Strategies of adaptation by smallholders raise specific concerns. They are likely to suffer impacts ofclimate change that are locally specific and hard to predict. The variety of crop and livestock speciesproduced by them, and the importance of non-market relations will increase the complexity both ofthe impacts and the subsequent adaptations, relative to commercial farms with more restricted rangesof crops.
As part of diversification of rural livelihoods, and a pathway out of poverty, the rural non-farmeconomy (RNFE) has considerable potential. For most of the countries of Asia and the Pacific, ruralhouseholds receive substantial income from non-farm activities. With constraints on farm expansionand continuing growth of rural population, development of RNFE has a major role to play in anypoverty reducing strategy. The direct impact of rural non-farm earnings on static indicators of ruralpoverty is confirmed in most cases. Also, RNFE performs an important safety net role, preventinghouseholds from falling into poverty when faced with shocks. The indirect effects of rural non-farmemployment, through labour market tightening and rising real wage rates, remain substantial. Theavailability of human, financial and physical capital is a major determinant of participation in non-farm activities. Policy biases and inequity in access to markets and credit need to be remedied. Rapidgrowth of agriculture has historically played an important role in promoting RNFE. In addition,improved infrastructure, vicinity to towns, globalization and urbanization have also opened up newopportunities for the growth of RNFE.
For supporting and implementing these policies, effective governance that ensures more inclusivegrowth is crucial. Democratization, civil society participation, decentralization, transparency,accountability and corruption control hold great potential for strengthening governance. Effectivepolicies to reduce poverty should include measures that enhance poor peoples’ access to assets such asland, water, education and health. This requires significant public investments, well-defined propertyrights, and effective land administration.
An ideal set of policies would have all these attributes, but, unfortunately, we do not live in an idealworld. Governments have to constantly balance the demands of market-oriented reforms that requireless state intervention with the state’s obligation to ensure that no citizen remains wretchedly poor.For instance, the government needs to create well-defined property rights, which would then enableindigenous peoples to transform their customary rights into legal ones. An imaginative approach toredistribution of land (e.g. through, for example, efficient land and rental markets) is imperative. Thiswill not undermine large-scale investment in agriculture. However, the political feasibility of thesereforms is not self-evident.
In order to generate pro-poor and sustainable rural growth, it is important for policy makers to addressfour cross-cutting issues. Strengthening individual capabilities: Developing skills and knowledge of poor rural people
(especially women, youth, disadvantaged social groups and smallholders) is crucial for bringingdynamism and innovation in agriculture and making it more productive and sustainable. Astronger focus on investing in education beyond primary level and enhancing accessibility andvalue of vocational skills to rural poor is necessary.
Improving the risk management capacity of poor rural people: This requires better access toeducation, promoting gender equity, strengthening insurance provision for the poor andvulnerable, encouraging micro-finance programmes, accelerating investments in agriculturalresearch and development, and providing effective safety nets and nutritional improvement inrural areas.
ix
Strengthening collective capabilities: Membership based organisations have a key role to play inhelping the rural poor mitigate risks and market their produce. Such organisations includewomen’s saving clubs, producers’ organisations and farmers’ field schools. Micro-finance hasplayed a crucial role in providing access to credit for households without formal collateral, thuscontributing to poverty reduction and women’s empowerment.
Improving the rural environment: In order to improve the rural environment, the focus should beon three areas: provision of physical infrastructure; widening provision of rural services(education, healthcare, insurance and financial services); and improving governance.
Good policies and governance are crucial to address rural poverty. The national government has theprime responsibility to push agriculture on the development agenda and to create a favourableenvironment through macroeconomic and political stability, and the rule of law. Governments have animportant role to play in regulation, provision of public goods, investments in infrastructure andR&D, provision of credit facilities and markets, defining property rights, enforcement of rules anddevelopment of institutions.
Despite pervasive market failures, there is a crucial role for the private sector. Coordinated actions ofpublic, private and civil society can help mitigate risks that smallholders face, reduce transaction costsand create incentives for private investment in critical services in agriculture.
NGOs have a crucial role to play in generating bottom-up demands. Collective action, throughproducer organisations and self-help groups, can help achieve economies of scale in input supply,access to markets and finance, and management of common property resources. They can also be aneffective way to impart training and increase awareness.
On the international front, to usher in the welfare impacts of trade liberalisation, the Doha round oftrade negotiations must urgently be concluded, particularly to eliminate distortions, such as US cottonsubsidies that work against the interests of poor countries.
Rural development’s visibility has increased on the global agenda. To a large extent, the triple F(food, fuel, financial) crises have been responsible for this. In recent years, the internationaldevelopment community has taken a number of initiatives that demonstrate its commitment topromote rural development. Some of these are delineated below: The Comprehensive Framework forAction was set up to address the threats and opportunities from the food price crisis and adopt policiesthat would prevent such a crisis from occurring in the future. The 2009 L’Aquila Food SecurityInitiative is committed to reverse the decline in ODA and national financing to agriculture and topartner with vulnerable countries to help them develop and implement their own food securitystrategies. The objectives of the Global Forum for Agricultural Research are alleviation of ruralpoverty, food security and sustainable natural resource management. The Global Forum for RuralAdvisory Services provides rural advisory services with the goal of reducing hunger and poverty. TheConsultative Group on International Agricultural Research contributes to food security, povertyeradication, and sustainable development. The aim of the Pacific Island Extension Summit, 2009 is tooffer an efficient and effective extension service to transform the agriculture and forestry sectors forthe Pacific economies.
To sum up, each country must have policies in place to spur growth in the rural sector, enhance foodsecurity and overcome poverty. The successes and policy lessons learnt point to five majorchallenges. First, sustained increase in agricultural productivity is required, especially amongsmallholders, with a focus on the youth, women, other disadvantaged social groups and indigenouspeoples. Second, food price volatility, other market risks, and natural disasters could play havoc withthe well-being and lives of rural populations. Policies that mitigate such risks and enable thevulnerable to cope with them deserve careful scrutiny and coordinated implementation. Third,integration of smallholders into high-value chains calls for proactive role of national governments inlaying down food safety standards and producers’ associations in implementing them and innegotiating marketing arrangements. Fourth, climate change poses grave threats to human well-being.
x
Despite a weakening of the appetite for capping carbon emissions, both mitigation and adaptation arenecessary. While the search for emission reductions widens, much greater emphasis to adaptation –especially by smallholders – than given in the past is imperative. Fifth, strong farm-non-farm linkagesmust be fostered so that their complementarity is fully exploited in pursuit of sustained povertyreduction.
While the prospects of sustainable agricultural growth and poverty reduction may seem daunting tomany, the strategy charted here is one of hope and optimism.
CHAPTER 1: INTRODUCTION
About seventy per cent of the poor live in rural areas and depend on agriculture for their livelihood.Declining rates of poverty reduction between 1998 and 2008, and a diminution in the natural resourcebase (land and water) of agriculture, have raised doubts about the capacity of the agricultural sector tohelp lift the rural poor from a poverty trap. More recently (2006-09), the rise in food prices, and, inquick succession, the global financial crisis have adversely affected the poor and other segments ofthe population. Although some estimates of the effects of these crises on the poor – especially of thefood price crisis – are alarmist, research findings offer some grounds for optimism1. A combination ofmeasures such as exploitation of untapped yield potential of major cereal crops, judicious use ofnatural resources (land & water), and implementation of appropriate policies and institutional reformcan create a dynamic agricultural sector capable of substantially raising incomes of the rural poor2.
The Chapter scheme is as follows. Chapter 1 delineates the changes in the global and regional contextof poverty reduction focusing on the food price crisis of 2007-08 and the risk of a repetition, andimpact of the financial crisis that followed in its wake, with the sub-regional profile as the backdrop.Chapter 2 deals with measurement of poverty, its various manifestations, and trends over time. Ofparticular importance here is a disaggregation of poverty by ethnicity, gender and age. Chapter 3highlights another perspective on poverty with risks and vulnerability as the central theme. Central tothis report, however, are the prospects of smallholder farming becoming more prosperous and theconstraints that are likely to impede this process. Chapter 4 emphasizes the structural transformationof agricultural markets and integration of smallholders into them. The strategies needed to helpsmallholders to raise yields and to diversify into high-value chains call for higher investments andpublic expenditure in agriculture. Chapter 5 discusses broad magnitudes of investment, publicexpenditure and ODA in agriculture consistent with MDG 1 for individual countries and the sub-regions. This then sets the stage for strategic issues from the perspective of smallholders and policiesdesigned to promote intensification of agriculture. A major concern is sustainability of intensificationin the context of climate change and whether smallholders face greater risk of failure to adapt. Issuesrelating to integration of smallholders into the high-value chain through intermediation andinternalisations are explored3. Of particular interest are the rural producer associations in facilitatingintegration of smallholders. Chapter 6 examines the prospects of diversification both within andoutside agriculture. Specifically, the report throws new light on rural non-farm employment as apathway out of poverty. A case is made for development of technical and vocational skills inpromoting capabilities of the youth to access expanding opportunities in both farm and non-farmsectors in rural and urban areas. Strengthening of rural infrastructure is another priority in promotingnon-farm business opportunities. In the concluding Chapter, from a longer-term perspective, prioritiesin the transformation of agriculture and non-farm activities are discussed. Key elements of four cross-cutting themes are identified: strengthening individual capabilities, collective capabilities, improvingrisk management capacity of the poor, and improving the rural environment. A vision of how differentstakeholders, including local communities, NGOs, national governments, international developmentagencies and donors could collaborate and support the agenda for promoting smallholder farming andnew opportunities in the non-farm sector for tomorrow’s generation is delineated. While thechallenges are daunting, past successes in this region in dealing with the scourge of poverty andhunger are grounds for optimism.
To put the discussion in perspective, let us consider the sub-regional profile of Asia and the PacificRegion in terms of selected indicators.
1 For a review of the evidence, see Thapa et al., 2009.2 WDR, 2008.3 ‘Intermediation’ refers to steps such as laying down of food safety standards by the national government, helpby private agencies in implementing them, creation of rural infrastructure by public and/or public-privatecollaboration; and suppliers making provisions of inputs and/or extension service to smallholders.‘Internalization’ refers to negotiation about production and marketing arrangements with supermarkets orsuppliers (Gaiha and Thapa, 2007).

2
Table 1: Profile of the Sub-Regions in Asia and the Pacific
Rural Share ofTotal
Population(%)
FemaleParticipationRate (% offemales)
Undernourishment(% of population)
Per CapitaIncome
(Constant2000 USD)
Agri. valueadded (% of
GDP)
MerchandiseTrade (% of
GDP)
GINICoefficient
2000-04
2005-09
2000-04
2005-09
2000-04
2005-09
2000-04
2005-09
2000-04
2005-09
2000-04
2005-09
2000-04
2005-09
East Asia 61.9 57.4 63.6 63.2 10.5 10.4 1100 1806 13.9 11.0 46.5 58.3 NA 40.8
South Asia 70.5 69.1 38.5 41.7 19.5 20.9 531 698 20.5 17.2 27.1 36.5 35.3 NA
CentralAsia
58.3 58.0 56.5 58.5 18.1 11.1 793 1131 19.5 14.0 70.6 74.1 31.5 NA
South EastAsia
59.0 54.7 61.4 61.2 17.4 13.6 1035 1255 13.3 13.2 101.7 101.4 36.5 NA
PacificIslands
81.4 81.6 50.8 50.9 1.6 1.4 916 944 27.6 26.9 82.8 91.3 NA NA
Asia -Pacific
65.2 62.3 52.7 53.8 15.6 15.6 836 1212 15.7 13.0 52.3 60.6 21.7 20.1
Source: World Bank (World Development Indicators).The figures for Female Participation Rate for Pacific Islands include only Fiji, Papua New Guinea, Samoa,Solomon Islands, Tonga and Vanuatu.The figures for undernourishment for South Asia exclude Afghanistan and Bhutan; and for Pacific Islands onlyFiji, Papua New Guinea, Samoa, Solomon Islands and Vanuatu.The figures for per capita income for East Asia exclude Korea DPR, and for South Asia exclude Afghanistan.The figures for Agricultural Value Added (% of GDP) exclude Korea (DPR), Afghanistan, Myanmar, MarshallIslands and Micronesia.The figures for Merchandise Trade (% of GDP) exclude Korea (DPR), Afghanistan, Myanmar and Timor Leste.The inequality indices of consumption expenditure distribution (Gini) exclude Korea (DPR), Afghanistan,Turkmenistan, Brunei Darussalam, Myanmar. The Gini coefficients for Pacific Island countries are notavailable.
For each of the sub-regions, the proportion of people living in rural areas declined, except in PacificIslands where the proportion increased only marginally between 2000-04 and 2004-05. The declinewas more pronounced in East Asia and South East Asia, and only marginal in case of Central Asiaand South Asia. Although the rural share of total population remains high in the sub-regions of Asiaand the Pacific, and predominantly agricultural in nature, the contribution of agricultural value addedto GDP is low, and declined marginally between 2000-04 and 2005-09 for South East Asia andPacific Island, and, more significantly in East, South and Central Asia. Despite the global downturn,each of the sub-regions witnessed a substantial increase in the per-capita income between 2000-04and 2005-09. The increase was greater for East Asia (64 per cent) and Central Asia (43 per cent), andlesser for South Asia (31 per cent) and South East Asia (21 per cent). The per capita income in thePacific Islands increased only by 3 per cent. Despite the growth, the per capita income for South Asiaremains low and has the highest rate of undernourishment in the region. Moreover, the proportion ofundernourished has also increased in the period under study. East Asia, despite the highest per capitaincome, has a large proportion of undernourished population, and is also characterized by highincome inequalities, as measured by the GINI coefficient. The proportion of undernourished in totalpopulation is very small for the Pacific Islands. Central Asia and South East Asia have made progressin reducing the proportion of undernourished, although the prevalence remains high. What adds to theconcern is the deprivation of certain groups such as women, youth and indigenous people who facedisproportionate impacts of poverty. Towards mitigation of their persistent and acute deprivation,empowerment of women, establishment of youth organisations and inclusion of indigenouspopulations in the growth process are key. The female participation rates in all the sub-regions are lowand have decreased, although slightly, in East Asia and South East Asia. The increase in other sub-regions is small. Female participation rate in South Asia is only 40 per cent, the lowest in the sub-region. Some of the economies of this region, particularly those in South East Asia and Pacific Islandsare heavily dependent on trade. While the share of trade in GDP is small for South Asia, it is moderate
3
for East Asia and Central Asia. All sub-regions recorded an increase in the share of merchandise tradein GDP.
1.1. WHAT’S NEW FOR RURAL ECONOMIES AND AGRICULTURE?
1.1.1. FOOD PRICE SURGE AND THE POORAn increase in food prices adversely affects the poor since they spend a large proportion of theirincome on food items. In response, the poor tend to take some of these remedial actions: switchingover to less nutritious and cheaper diets, cutting down on their children’s (especially girls) foodintake, and reducing expenditure on non-food items such as the health and education of children. Inextreme situations, the poor are also forced to sell their assets such as livestock. FAO estimates that in2009, about 100 million more people were propelled into the category of the hungry, as compared to2003, and most of them belonged to Asia and the Pacific Region where 640 million poor reside4.
Although food prices have been increasing since 2000, they increased at a fast pace between 2006 and2007-08 when prices of major cereals surged very rapidly. The countries of Asia and the PacificRegion experienced varying spikes in these prices5. These spikes have been due to a combination ofboth short-term (such as droughts, trade restrictions, and speculation and hoarding) and long-termfactors (such as declining productivity, inadequate investments in infrastructure and linkages withother commodity markets such as energy markets)6.
The nature and magnitude of impact of food and energy price hike varied across countries in thisRegion, with two common features: (i) it affected the price of major staple foodgrains, viz., rice andwheat; and (ii) it increased producer prices more than consumer prices. The effect of increase in foodprices on GDP is considerable. For instance, a 50 per cent rise in food price decreases the GDP ofAsia and the Pacific Region by 1.05 per cent. A combined shock of a 60 per cent rise in food and fuelprices decreases GDP by 1.41 per cent7. Therefore, the issue of food security should be a priority forthe developing economies of Asia and the Pacific.
A recent study of countries in the Greater Mekong Sub-Region offers a rich and insightful analysis ofhow food producers, consumers and wage labourers were affected by the food price crisis. These arebriefly reviewed in Box 1.
4 FAO, 2010.5 For a detailed discussion, refer to the section on 3.3.4. Market Related Risks: Rising Food Prices andVolatility, page 3.6 For details, refer to chapter 3.7 ADB, 2008.
4
Box 1: Impact of food price crisis in Greater Mekong
Rice accounts for large shares of agricultural value added in these countries – ranging from 38 percent in Lao PDR to 60 per cent in Cambodia. Total production in the four countries (Cambodia, LaoPDR, Thailand and Vietnam) was as much as 13 per cent of Asia’s production and 11 per cent of theworld’s in 2009. It is not just a major source of income for large segments of the rural population butalso a key export commodity – especially in Thailand and Vietnam. Moreover, it is the staple food inthis sub-region. So the steep rise in its price in 2007-08 had large welfare reducing effects. Domesticrice prices rose sharply in Cambodia during the food crisis. On average, producer prices rose by 57per cent between November, 2007, and June, 2008. But this varied considerably across provinces –from a low increase of 5 per cent in Siem Reap to a high of 186 per cent in Preah Vihear. In sharpcontrast, a few provinces (e.g. Takeo) witnessed a slight decline. Retail prices also rose sharply with amarked variation across different provinces. By contrast, the domestic rice market in Lao PDR wasrelatively stable. In five major provincial markets, rice prices rose moderately, between July andDecember in 2007-08. Also, there were small price differentials across provinces. Vietnam, however,recorded extreme volatility during the food crisis – in Cantho and Hanoi, for example, paddy pricesrose by well over 60 per cent in January-June, 2008, and then fell by over 20 per cent in Cantho andby about 8 per cent in Hanoi in July-December, 2008.
Although these economies have grown rapidly, the incidence of poverty remains high. Using thepoverty line of 41.25 cents per day (2005 PPP), the headcount indices are 40.2 per cent in Cambodia,44 per cent in Lao PDR and 21.5 per cent in Vietnam.
Estimates suggest that large reductions in rice consumption occurred as a result of higher retail prices,ranging from about 11 per cent in Lao PDR to about 43 per cent in Cambodia and Vietnam. A 50 percent higher rice price is associated with a three percentage point increase in the headcount index inVietnam and a 2.5 percentage point increase in Cambodia.
Some illustrative evidence also points to favourable effects on rice producers. Average annualproduction increased by about 7 per cent in Cambodia, 6 per cent in Lao PDR and 3 per cent inVietnam. However, higher revenues were offset by higher input costs. Farmers incurred higher costsbecause of higher fertiliser prices. A combined price index for all inputs in Vietnam, in fact, rose by30 per cent between 2007-09, while combined price index for farm products increased by 17 per cent.
As the landless rely on daily wages for their subsistence, real wage movements during the crisis are ofconsiderable importance in assessing the poverty effects. In Cambodia, for example, in terms of therice wage equivalent, the average wages during the crisis were lower. In rural coastal region, the dailyrice wage equivalent fell from 4.67 kg in June, 2007, to 3.84 kg in June, 2008; and in the rural plains,it fell from 5.75 kg to 4.77 kg; and in rural Cambodia as a whole, from 5.09 kg to 4.43 kg. For thosesurviving at bare subsistence, such reductions imply substantial welfare loss.
Sombilla et al., 2010.
1.2. THE CHANGING CONTEXT FOR RURAL POVERTY REDUCTION
With the food, fuel and financial crises occurring in quick succession, exposure to shocks thatenhance food insecurity and vulnerability has risen. Responses to these systemic changes has takendiverse forms: substantially higher private investments in agriculture induced by favourable marketconditions, international competition for access to land, protectionist policies designed to protectdomestic consumers against sharp spikes in domestic prices of food staples (e.g. rice), increases in
5
subsidies to agriculture motivated by concerns for food self-sufficiency, and expansion of socialsafety nets to protect the poor against food price volatility8.
Some key questions from this perspective are: Is the capacity of agriculture to reduce poverty changing?
o Agriculture plays at least three roles. As growth in agricultural productivity canstimulate faster economic growth, it tends to make this growth more “pro-poor” and itcan provide the food supplies needed to reduce hunger. Available evidence confirmsthe role of agricultural growth in poverty alleviation9. For the Asia and the Pacificregion, the elasticity of the head-count ratio of poverty with respect to agriculturalgrowth is -1.18 (at $2 a day poverty line) and -2.73 (at $1.25 a day poverty line)10.For Laos, the (absolute) poverty elasticity with respect to agricultural value added (-.70) was much larger than that with respect to GDP (-.46). Moreover, over the period1992-2007, the poverty elasticity with respect to agricultural value added (as well aswith respect to GDP) became much larger11. For Cambodia, the (absolute value of)the poverty elasticity with respect to agricultural value added was much larger thanthat of GDP in 2007 (-.73 and -.51, respectively). As in the case of Lao PDR, the(absolute values of) these elasticities rose significantly over the period 1997-200712.
How to manage food price volatility and ensure food security?o In the wake of the food price surge in 2007-08, and some evidence of rising food
prices in recent months, there are growing apprehensions of food insecurity.Destabilisation of climate patterns, protectionist policies, upsurge in energy prices,and investment funds seeking speculative gains in commodity prices have rekindledfears of extreme food price volatility. At the national level, careful attention needs tobe given to measures to reduce the size of price shocks, to manage risk ex-anterelative to price shocks, and to cope with risk ex-post.
Is the discourse between large-small farms changing?o Attractive investment opportunities have opened up in agriculture, leading to large-
scale investments and competition for land (e.g. rubber plantations in Cambodia,palm oil production in Indonesia, cereals in Kazakhstan)13. New sources of economiesof scale have emerged, as a result of technical change (zero tillage andbiotechnology), new markets (contracts with supermarket chains for large continuousand uniform deliveries) and institutional changes (e.g. access to internationalfinance). Elimination of biases against smallholders would enhance theircompetitiveness. State interventions and collective action by producers’ organisationswould make a significant difference.
How to ensure that smallholders have access to technology and high-value chains?o Of particular significance is incomplete access to information. The rapid spread of
cellular phones, for example, makes it easier to access such services as mobilebanking, information on market prices and technological advice from experts. But itis vital to adapt these services to local needs14.
1.3. INNOVATIVE APPROACHES TO RURAL POVERTY REDUCTION
Innovative approaches that may contribute to reducing poverty in the rural sector are associated with(i) diversification of agriculture to horticulture, aquaculture and livestock production, (ii) emergenceof supermarkets with global supply chain, the penetration of latter being much higher in South East
8 Byerlee et al., 2010.9 Refer to Chapter 5 for a detailed discussion.10 Imai et al, 2011c.11 For details, see Gaiha and Annim, 2010.12 For details, see Gaiha and Azam (2011, in preparation).13 For details, see Deininger and Byerlee, 2010.14 Byerlee et al, 2010.
6
Asia than in South Asia and China; (iii) contrary to the dominant view, the prescription that labourforce must move out of agriculture needs qualification in view of agriculture becoming an attractiveoption for investment and expansion of markets for not just staples but also high-value items; and (iv)creation of linkages between the farm and non-farm sector, and increase in the proportion of non-farmincome to rural household income.
1.3.1. DIVERSIFICATION OF AGRICULTURE AND LABOUR PRODUCTIVITY
Per capita food consumption in developing countries has shifted from cereals to high-value productssuch as meat, vegetable oils and milk. The demand for oil crops is growing for human and feedconsumption. Aquaculture as part of the food-production sector is one of the components whosedemand is increasing significantly and its production happens to be concentrated mainly in thedeveloping world, with China accounting for 67 per cent of production. The annual growth inproduction of fruits and vegetables has been significant (5-6 per cent) in the period 1990 – 2005 forAsia-Pacific countries: Laos, China, Sri Lanka and the Philippines. The average annual growth rate ofmeat production is also high for the same period: China (9.3 per cent) and Vietnam (5.6 per cent)15.Apart from the crop sector, livestock and aquaculture are important sources of protein to helpovercome undernourishment. Fish and its processing activity are capable of generating considerableemployment at more competitive wage rates than those available in agricultural activities. Empiricalevidence from Bangladesh and Vietnam shows that majority of workers in such activities are womenand their wages, although low, are higher than wages in agriculture. At the regional or sub-nationallevel, certain agro-climatic zones may offer potential for promoting high-value agriculture. Thepotential may have remained unexploited due to unfavourable conditions such as poor infrastructure,lack of extension services, credit facilities and access to markets. In such cases, concerted efforts arerequired to tap this potential.
1.3.2. SMALLHOLDERS AND SUPERMARKETS
In response to changes in dietary habits and life styles, and with the liberalization of retail trade andthe entry of foreign direct investment (FDI) in Asia-Pacific countries, supermarkets with global linkshave emerged, particularly in South East Asia. The penetration of supermarkets in 2002 crossed 51per cent in Malaysia, 27 per cent in Thailand and 27 per cent in the Philippines. By 2015, it is likely torise to 61 per cent, 48 per cent and 36 per cent, respectively. China, by 2015, is expected to have thehighest coverage (62 per cent). South Asia, by contrast, has experienced low supermarket penetrationwith the level not likely to exceed 10 per cent by 201516. This may be attributed to slowerurbanisation and lower growth in incomes, combined with late entry of supermarkets in this region.
High inequality of land distribution and declining average farm size (especially in South Asia) posethe question: would the spread of supermarkets with global links help smallholders in generating moreincome and profits? The answer is that supermarkets offer both opportunities and obstacles. The mainobstacle is that the supply chain imposes prohibitive costs on smallholders who often live in regionswith poor infrastructure, weak credit and input support and outdated technology. ‘Intermediation’ and‘internalization’ would enable the smallholders to overcome this problem. This would requiregovernment to provide public goods (infrastructure, food safety standards and favourable environmentfor enforcing contracts) and facilitate collaboration with forward looking private players in providinginputs and transferring technology to smallholders. Producers’ associations would also help improvequality and marketing of produce.
While growth of urbanisation and rising incomes fuelled the growth of a diversified agricultural sectorand integration into high-value chains linked to supermarkets in some parts of Asia and the PacificRegion, following the food crisis, there is evidence of erosion of trust in markets allocating foodsupplies in countries worst affected, and heightened concerns for self-sufficiency in food staples. Such
15 World Bank, 2008.16 Gaiha and Thapa, 2007.
7
concerns (reflected in protectionist policies towards rice in particular) run the risk of slowing downdiversification of agriculture.
1.3.3. TRANSFER OF AGRICULTURE LABOUR TO OTHER SECTORS
Recent decades (1991-2008) have witnessed a decline in the share of agriculture and significantincreases in the share of industries and associated reduction in rural poverty (e.g. China, Indonesiaand Vietnam). By contrast, Bangladesh and India demonstrate that a reduction in the share ofagriculture value added accompanied by an increased share of value added of the services sector inGDP has not succeeded in significantly reducing rural poverty. It suggests that the process of movingfrom agriculture to services perhaps needs to be mediated by industry. Unlike in China and Vietnam,the linkage between agricultural (rural) and industry (mainly around urban centres) remained weak inmajor South Asian countries. South Asia’s movement from an agriculture-based economy to atransforming economy occurred without the rapid transfer of agricultural labour to industry. The ruralpoor seem to have moved from agriculture to the service industry which is seemingly concentrated inand around urban and peri-urban centres. A conclusion drawn from such evidence is that labour mustmove out of agriculture and employment opportunities need to expand elsewhere to absorb it17. It is,however, problematic to rely on large labour transfers out of agriculture when investmentopportunities are expanding in agriculture and markets are growing for not just food staples but alsofor high-value food (e.g. vegetables, fruit, and livestock products).
1.3.4. NON-FARM INCOME AND RURAL POVERTY
It is now well recognized that rural economies are not purely agricultural and that farm householdsacross the developing world earn an increasing share of their income from non-farm activities. Onaverage, rural non-farm income (RNFY) constitutes roughly 50 per cent of rural household income inAsia and the Pacific Region. Availability of human, financial and physical capital is a majordeterminant of participation in non-farm activities. Due to paucity of such capital, the poorhouseholds often remain confined to the low-productivity non-farm activities, which offer fewpathways out of poverty. Meanwhile, richer and more educated households often find more lucrativenon-farm opportunities. Likewise, gender, caste and social status also determine the chances ofparticipation of being engaged in more lucrative non-farm jobs. In general, women and disadvantagedsocial groups have limited access to the most lucrative rural non-farm activities.
From a longer-term perspective, it is also acknowledged that agriculture per se cannot be a way out ofpoverty for all rural people. With constraints on farm expansion and continuing growth of ruralpopulation, greater attention is thus being given to non-farm activities in mitigating poverty18.However, the poverty implications of promoting rural non-farm activities (RNFA) are notstraightforward. For a clear understanding, policymakers will have to understand the rural farmhouseholds’ motives for diversification into RNFE. While the well-to-do farm households generallyundertake diversification for accumulation objectives, the not-so-wealthy ones seek diversificationinto non-farm activities to manage risks, cope with shocks, or escape from stagnant agriculture. In thelatter case, the poor household adds the equivalent of subsistence level non-farm income to a poorfarm income base. Under these circumstances, growth in RNFE leads to poverty reduction. If to thedirect effect of RNFE is added the indirect effect through a tightening of the labour market and aconsequent rise in wage rates, the poverty reduction is substantial.19
17 See, for example, WDR 2008, and Byerlee et al., 2010, among others.18 For details, refer to chapter 6.19 For recent analyses of the Indian experience, see Gaiha and Imai, 2007, and Kaur et al., 2010.
8
1.4. FINANCIAL CRISIS, POVERTY AND HUNGER
The recent financial crisis got manifested in Asia and the Pacific Region in terms of slowdown ofGDP growth rate during 2008 and 2009 in all major economies, including China and India; slackeningof export growth due to shrinking demand in the developed economies of the west for export items ofthe developing countries; and financial institutions, mainly banks, becoming more risk averse andreducing channelling of their funds to small (particularly, micro) financial institutions.
Financial sector development impacts undernourishment in different ways. First, savings and credithelp consumption smoothing when there are income or other shocks. Second, access to financialservices eases the financing of productive investment in, say, agricultural equipment, thereby raisingyields and incomes of smallholders, and reducing undernourishment. Third, there may be anadditional benefit to low income households – especially those without access to financial services –as higher yields translate into higher food output and lower prices. Thus private credit may reducesubstantially undernourishment through higher GDP and/or agricultural productivity, in general, andhigher livestock, crop and cereal yields, in particular20.
From this perspective, the effects of the contraction of the global economy that followed the unfoldingof the financial crisis in 2008-2009 are summarized briefly. These findings are based on an analysis ofa panel of 9 Asian countries21. Although emerging Asian countries (notably China and India)recovered quickly and helped prevent a global recession, the effects of credit contraction anddeceleration of growth in Asia and the Pacific Region were in a few cases severe22. The resultssuggest that finance contributes to both GDP and agricultural productivity growth, reduction inundernutrition/hunger, and a reduction in income inequality.
Cambodia’s experience during the financial crisis is illuminating (Box 2).
20 Following FAO estimates, undernutrition is measured as proportion of undernourished in a population.21 Imai et al., 2009.22 There are measurement and analytical issues in analyzing the relationship between finance and growth that areoutside the scope of this Report. Briefly, finance could be measured in terms of private credit as share of GDPor share of financial system deposits in GDP. Analytically, there is a two-way causality between finance andgrowth. For details of how these measurement and analytical issues are addressed, see Imai et al., 2009.
9
Box 2: Financial Crisis and Poverty in Cambodia
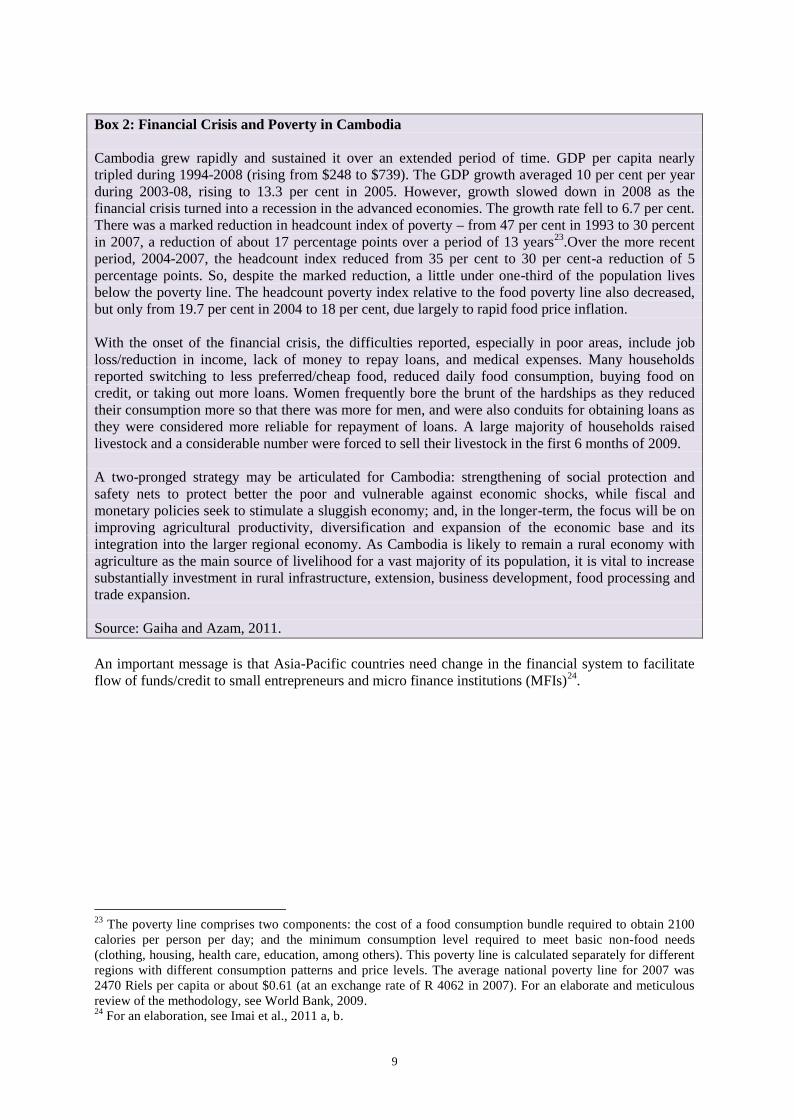
Cambodia grew rapidly and sustained it over an extended period of time. GDP per capita nearlytripled during 1994-2008 (rising from $248 to $739). The GDP growth averaged 10 per cent per yearduring 2003-08, rising to 13.3 per cent in 2005. However, growth slowed down in 2008 as thefinancial crisis turned into a recession in the advanced economies. The growth rate fell to 6.7 per cent.There was a marked reduction in headcount index of poverty – from 47 per cent in 1993 to 30 percentin 2007, a reduction of about 17 percentage points over a period of 13 years23.Over the more recentperiod, 2004-2007, the headcount index reduced from 35 per cent to 30 per cent-a reduction of 5percentage points. So, despite the marked reduction, a little under one-third of the population livesbelow the poverty line. The headcount poverty index relative to the food poverty line also decreased,but only from 19.7 per cent in 2004 to 18 per cent, due largely to rapid food price inflation.
With the onset of the financial crisis, the difficulties reported, especially in poor areas, include jobloss/reduction in income, lack of money to repay loans, and medical expenses. Many householdsreported switching to less preferred/cheap food, reduced daily food consumption, buying food oncredit, or taking out more loans. Women frequently bore the brunt of the hardships as they reducedtheir consumption more so that there was more for men, and were also conduits for obtaining loans asthey were considered more reliable for repayment of loans. A large majority of households raisedlivestock and a considerable number were forced to sell their livestock in the first 6 months of 2009.
A two-pronged strategy may be articulated for Cambodia: strengthening of social protection andsafety nets to protect better the poor and vulnerable against economic shocks, while fiscal andmonetary policies seek to stimulate a sluggish economy; and, in the longer-term, the focus will be onimproving agricultural productivity, diversification and expansion of the economic base and itsintegration into the larger regional economy. As Cambodia is likely to remain a rural economy withagriculture as the main source of livelihood for a vast majority of its population, it is vital to increasesubstantially investment in rural infrastructure, extension, business development, food processing andtrade expansion.
Source: Gaiha and Azam, 2011.
An important message is that Asia-Pacific countries need change in the financial system to facilitateflow of funds/credit to small entrepreneurs and micro finance institutions (MFIs)24.
23 The poverty line comprises two components: the cost of a food consumption bundle required to obtain 2100calories per person per day; and the minimum consumption level required to meet basic non-food needs(clothing, housing, health care, education, among others). This poverty line is calculated separately for differentregions with different consumption patterns and price levels. The average national poverty line for 2007 was2470 Riels per capita or about $0.61 (at an exchange rate of R 4062 in 2007). For an elaborate and meticulousreview of the methodology, see World Bank, 2009.24 For an elaboration, see Imai et al., 2011 a, b.
10
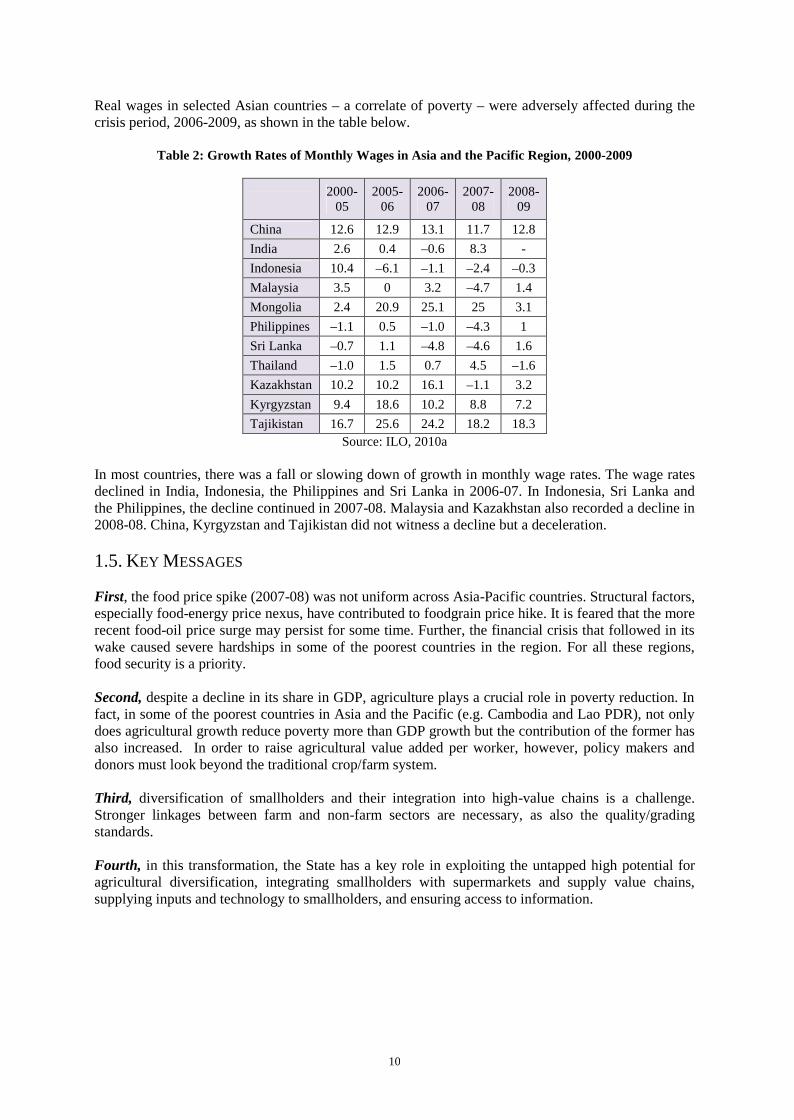
Real wages in selected Asian countries – a correlate of poverty – were adversely affected during thecrisis period, 2006-2009, as shown in the table below.
Table 2: Growth Rates of Monthly Wages in Asia and the Pacific Region, 2000-2009
2000-05
2005-06
2006-07
2007-08
2008-09
China 12.6 12.9 13.1 11.7 12.8
India 2.6 0.4 –0.6 8.3 -
Indonesia 10.4 –6.1 –1.1 –2.4 –0.3
Malaysia 3.5 0 3.2 –4.7 1.4
Mongolia 2.4 20.9 25.1 25 3.1
Philippines –1.1 0.5 –1.0 –4.3 1
Sri Lanka –0.7 1.1 –4.8 –4.6 1.6
Thailand –1.0 1.5 0.7 4.5 –1.6
Kazakhstan 10.2 10.2 16.1 –1.1 3.2
Kyrgyzstan 9.4 18.6 10.2 8.8 7.2
Tajikistan 16.7 25.6 24.2 18.2 18.3Source: ILO, 2010a
In most countries, there was a fall or slowing down of growth in monthly wage rates. The wage ratesdeclined in India, Indonesia, the Philippines and Sri Lanka in 2006-07. In Indonesia, Sri Lanka andthe Philippines, the decline continued in 2007-08. Malaysia and Kazakhstan also recorded a decline in2008-08. China, Kyrgyzstan and Tajikistan did not witness a decline but a deceleration.
1.5. KEY MESSAGES
First, the food price spike (2007-08) was not uniform across Asia-Pacific countries. Structural factors,especially food-energy price nexus, have contributed to foodgrain price hike. It is feared that the morerecent food-oil price surge may persist for some time. Further, the financial crisis that followed in itswake caused severe hardships in some of the poorest countries in the region. For all these regions,food security is a priority.
Second, despite a decline in its share in GDP, agriculture plays a crucial role in poverty reduction. Infact, in some of the poorest countries in Asia and the Pacific (e.g. Cambodia and Lao PDR), not onlydoes agricultural growth reduce poverty more than GDP growth but the contribution of the former hasalso increased. In order to raise agricultural value added per worker, however, policy makers anddonors must look beyond the traditional crop/farm system.
Third, diversification of smallholders and their integration into high-value chains is a challenge.Stronger linkages between farm and non-farm sectors are necessary, as also the quality/gradingstandards.
Fourth, in this transformation, the State has a key role in exploiting the untapped high potential foragricultural diversification, integrating smallholders with supermarkets and supply value chains,supplying inputs and technology to smallholders, and ensuring access to information.
11
CHAPTER 2: THE STATE OF RURAL POVERTY TODAY
2.1. MEASURING RURAL POVERTY AND HUNGER
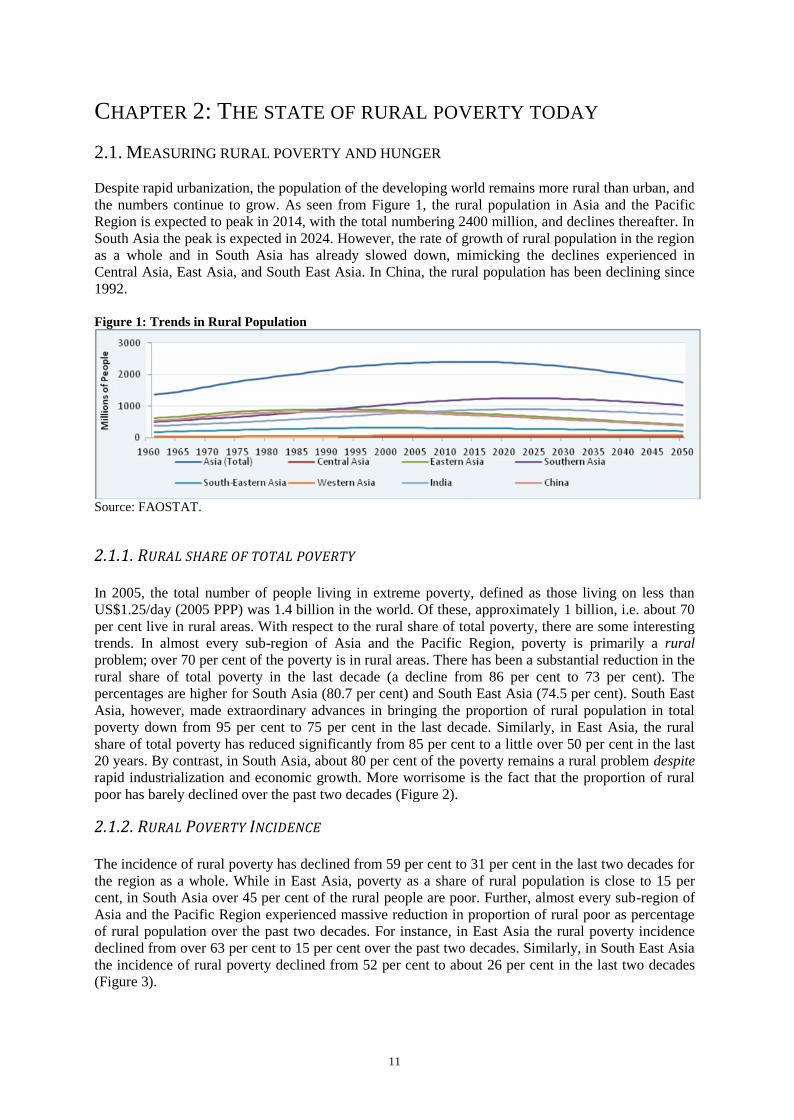
Despite rapid urbanization, the population of the developing world remains more rural than urban, andthe numbers continue to grow. As seen from Figure 1, the rural population in Asia and the PacificRegion is expected to peak in 2014, with the total numbering 2400 million, and declines thereafter. InSouth Asia the peak is expected in 2024. However, the rate of growth of rural population in the regionas a whole and in South Asia has already slowed down, mimicking the declines experienced inCentral Asia, East Asia, and South East Asia. In China, the rural population has been declining since1992.
Figure 1: Trends in Rural Population
Source: FAOSTAT.
2.1.1. RURAL SHARE OF TOTAL POVERTY
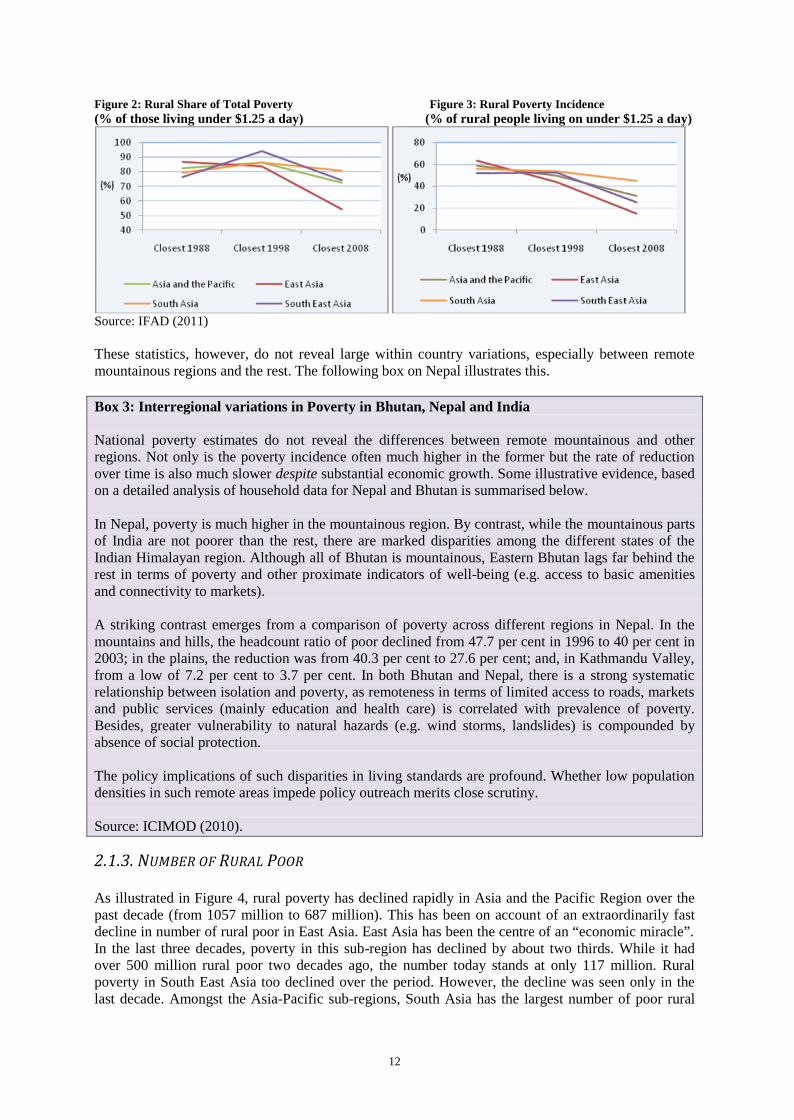
In 2005, the total number of people living in extreme poverty, defined as those living on less thanUS$1.25/day (2005 PPP) was 1.4 billion in the world. Of these, approximately 1 billion, i.e. about 70per cent live in rural areas. With respect to the rural share of total poverty, there are some interestingtrends. In almost every sub-region of Asia and the Pacific Region, poverty is primarily a ruralproblem; over 70 per cent of the poverty is in rural areas. There has been a substantial reduction in therural share of total poverty in the last decade (a decline from 86 per cent to 73 per cent). Thepercentages are higher for South Asia (80.7 per cent) and South East Asia (74.5 per cent). South EastAsia, however, made extraordinary advances in bringing the proportion of rural population in totalpoverty down from 95 per cent to 75 per cent in the last decade. Similarly, in East Asia, the ruralshare of total poverty has reduced significantly from 85 per cent to a little over 50 per cent in the last20 years. By contrast, in South Asia, about 80 per cent of the poverty remains a rural problem despiterapid industrialization and economic growth. More worrisome is the fact that the proportion of ruralpoor has barely declined over the past two decades (Figure 2).
2.1.2. RURAL POVERTY INCIDENCE
The incidence of rural poverty has declined from 59 per cent to 31 per cent in the last two decades forthe region as a whole. While in East Asia, poverty as a share of rural population is close to 15 percent, in South Asia over 45 per cent of the rural people are poor. Further, almost every sub-region ofAsia and the Pacific Region experienced massive reduction in proportion of rural poor as percentageof rural population over the past two decades. For instance, in East Asia the rural poverty incidencedeclined from over 63 per cent to 15 per cent over the past two decades. Similarly, in South East Asiathe incidence of rural poverty declined from 52 per cent to about 26 per cent in the last two decades(Figure 3).
12
Figure 2: Rural Share of Total Poverty Figure 3: Rural Poverty Incidence(% of those living under $1.25 a day) (% of rural people living on under $1.25 a day)
Source: IFAD (2011)
These statistics, however, do not reveal large within country variations, especially between remotemountainous regions and the rest. The following box on Nepal illustrates this.
Box 3: Interregional variations in Poverty in Bhutan, Nepal and India
National poverty estimates do not reveal the differences between remote mountainous and otherregions. Not only is the poverty incidence often much higher in the former but the rate of reductionover time is also much slower despite substantial economic growth. Some illustrative evidence, basedon a detailed analysis of household data for Nepal and Bhutan is summarised below.
In Nepal, poverty is much higher in the mountainous region. By contrast, while the mountainous partsof India are not poorer than the rest, there are marked disparities among the different states of theIndian Himalayan region. Although all of Bhutan is mountainous, Eastern Bhutan lags far behind therest in terms of poverty and other proximate indicators of well-being (e.g. access to basic amenitiesand connectivity to markets).
A striking contrast emerges from a comparison of poverty across different regions in Nepal. In themountains and hills, the headcount ratio of poor declined from 47.7 per cent in 1996 to 40 per cent in2003; in the plains, the reduction was from 40.3 per cent to 27.6 per cent; and, in Kathmandu Valley,from a low of 7.2 per cent to 3.7 per cent. In both Bhutan and Nepal, there is a strong systematicrelationship between isolation and poverty, as remoteness in terms of limited access to roads, marketsand public services (mainly education and health care) is correlated with prevalence of poverty.Besides, greater vulnerability to natural hazards (e.g. wind storms, landslides) is compounded byabsence of social protection.
The policy implications of such disparities in living standards are profound. Whether low populationdensities in such remote areas impede policy outreach merits close scrutiny.
Source: ICIMOD (2010).
2.1.3. NUMBER OF RURAL POOR
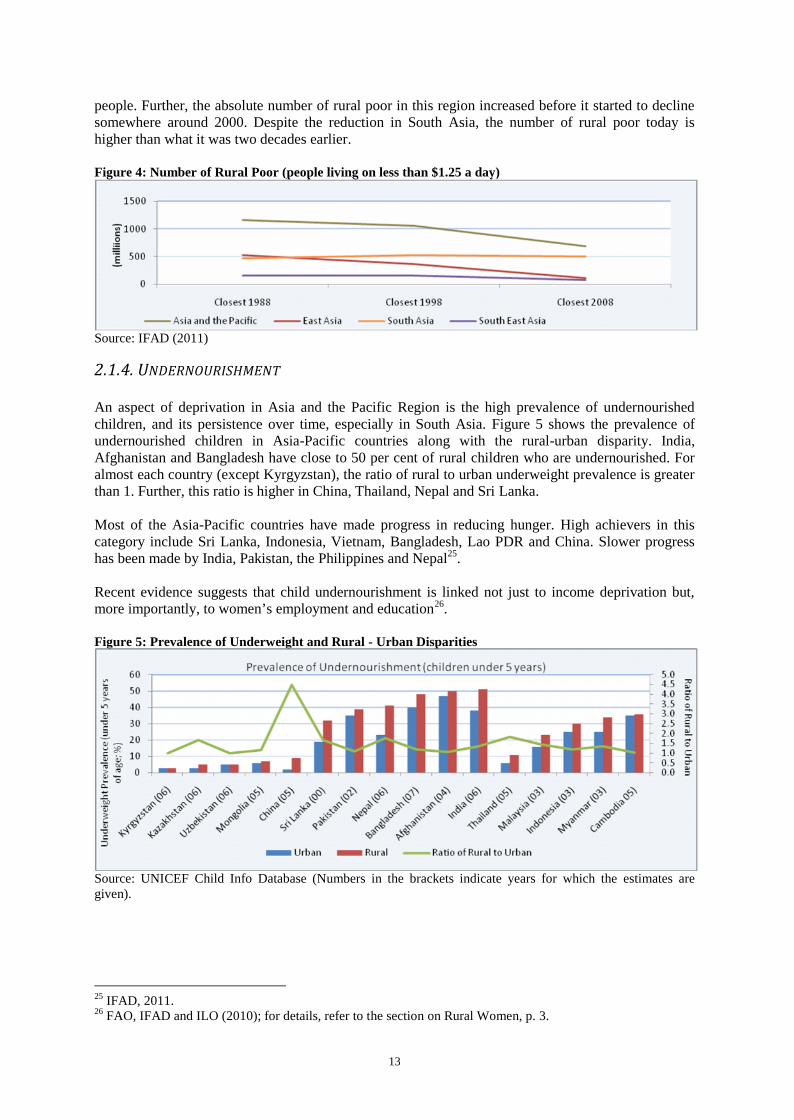
As illustrated in Figure 4, rural poverty has declined rapidly in Asia and the Pacific Region over thepast decade (from 1057 million to 687 million). This has been on account of an extraordinarily fastdecline in number of rural poor in East Asia. East Asia has been the centre of an “economic miracle”.In the last three decades, poverty in this sub-region has declined by about two thirds. While it hadover 500 million rural poor two decades ago, the number today stands at only 117 million. Ruralpoverty in South East Asia too declined over the period. However, the decline was seen only in thelast decade. Amongst the Asia-Pacific sub-regions, South Asia has the largest number of poor rural
13
people. Further, the absolute number of rural poor in this region increased before it started to declinesomewhere around 2000. Despite the reduction in South Asia, the number of rural poor today ishigher than what it was two decades earlier.
Figure 4: Number of Rural Poor (people living on less than $1.25 a day)
Source: IFAD (2011)
2.1.4. UNDERNOURISHMENT
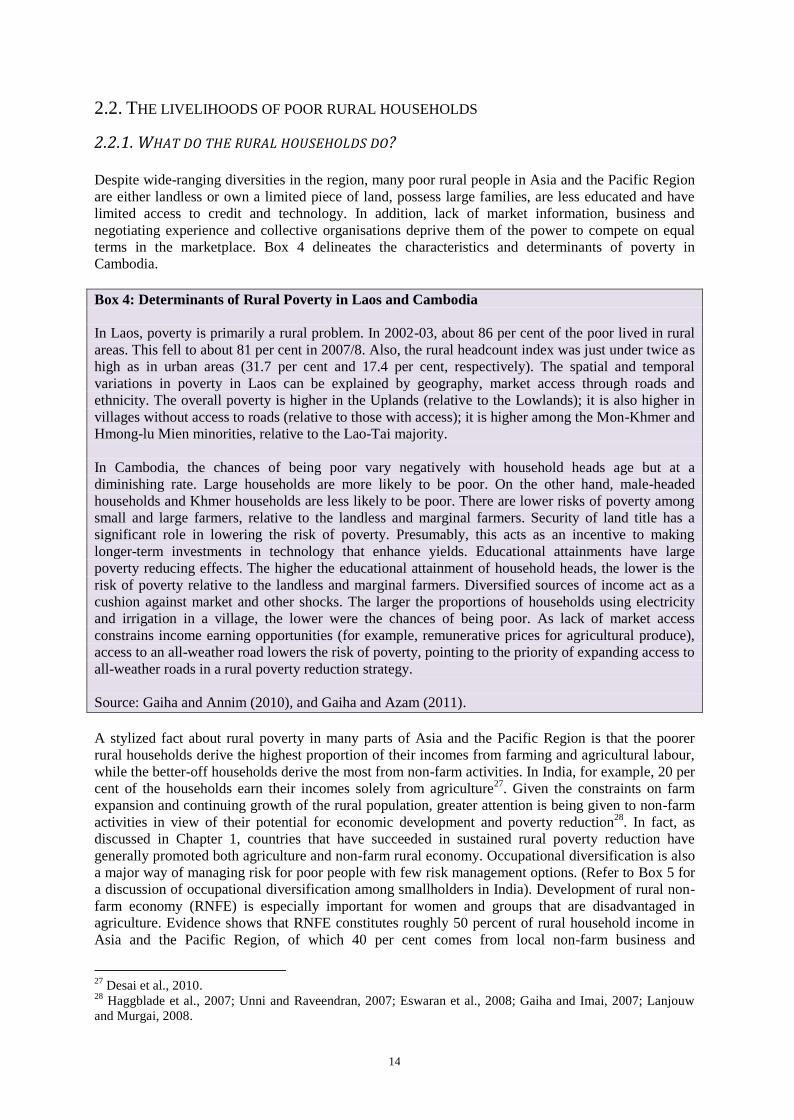
An aspect of deprivation in Asia and the Pacific Region is the high prevalence of undernourishedchildren, and its persistence over time, especially in South Asia. Figure 5 shows the prevalence ofundernourished children in Asia-Pacific countries along with the rural-urban disparity. India,Afghanistan and Bangladesh have close to 50 per cent of rural children who are undernourished. Foralmost each country (except Kyrgyzstan), the ratio of rural to urban underweight prevalence is greaterthan 1. Further, this ratio is higher in China, Thailand, Nepal and Sri Lanka.
Most of the Asia-Pacific countries have made progress in reducing hunger. High achievers in thiscategory include Sri Lanka, Indonesia, Vietnam, Bangladesh, Lao PDR and China. Slower progresshas been made by India, Pakistan, the Philippines and Nepal25.
Recent evidence suggests that child undernourishment is linked not just to income deprivation but,more importantly, to women’s employment and education26.
Figure 5: Prevalence of Underweight and Rural - Urban Disparities
Source: UNICEF Child Info Database (Numbers in the brackets indicate years for which the estimates aregiven).
25 IFAD, 2011.26 FAO, IFAD and ILO (2010); for details, refer to the section on Rural Women, p. 3.
14
2.2. THE LIVELIHOODS OF POOR RURAL HOUSEHOLDS
2.2.1. WHAT DO THE RURAL HOUSEHOLDS DO?
Despite wide-ranging diversities in the region, many poor rural people in Asia and the Pacific Regionare either landless or own a limited piece of land, possess large families, are less educated and havelimited access to credit and technology. In addition, lack of market information, business andnegotiating experience and collective organisations deprive them of the power to compete on equalterms in the marketplace. Box 4 delineates the characteristics and determinants of poverty inCambodia.
Box 4: Determinants of Rural Poverty in Laos and Cambodia
In Laos, poverty is primarily a rural problem. In 2002-03, about 86 per cent of the poor lived in ruralareas. This fell to about 81 per cent in 2007/8. Also, the rural headcount index was just under twice ashigh as in urban areas (31.7 per cent and 17.4 per cent, respectively). The spatial and temporalvariations in poverty in Laos can be explained by geography, market access through roads andethnicity. The overall poverty is higher in the Uplands (relative to the Lowlands); it is also higher invillages without access to roads (relative to those with access); it is higher among the Mon-Khmer andHmong-lu Mien minorities, relative to the Lao-Tai majority.
In Cambodia, the chances of being poor vary negatively with household heads age but at adiminishing rate. Large households are more likely to be poor. On the other hand, male-headedhouseholds and Khmer households are less likely to be poor. There are lower risks of poverty amongsmall and large farmers, relative to the landless and marginal farmers. Security of land title has asignificant role in lowering the risk of poverty. Presumably, this acts as an incentive to makinglonger-term investments in technology that enhance yields. Educational attainments have largepoverty reducing effects. The higher the educational attainment of household heads, the lower is therisk of poverty relative to the landless and marginal farmers. Diversified sources of income act as acushion against market and other shocks. The larger the proportions of households using electricityand irrigation in a village, the lower were the chances of being poor. As lack of market accessconstrains income earning opportunities (for example, remunerative prices for agricultural produce),access to an all-weather road lowers the risk of poverty, pointing to the priority of expanding access toall-weather roads in a rural poverty reduction strategy.
Source: Gaiha and Annim (2010), and Gaiha and Azam (2011).
A stylized fact about rural poverty in many parts of Asia and the Pacific Region is that the poorerrural households derive the highest proportion of their incomes from farming and agricultural labour,while the better-off households derive the most from non-farm activities. In India, for example, 20 percent of the households earn their incomes solely from agriculture27. Given the constraints on farmexpansion and continuing growth of the rural population, greater attention is being given to non-farmactivities in view of their potential for economic development and poverty reduction28. In fact, asdiscussed in Chapter 1, countries that have succeeded in sustained rural poverty reduction havegenerally promoted both agriculture and non-farm rural economy. Occupational diversification is alsoa major way of managing risk for poor people with few risk management options. (Refer to Box 5 fora discussion of occupational diversification among smallholders in India). Development of rural non-farm economy (RNFE) is especially important for women and groups that are disadvantaged inagriculture. Evidence shows that RNFE constitutes roughly 50 percent of rural household income inAsia and the Pacific Region, of which 40 per cent comes from local non-farm business and
27 Desai et al., 2010.28 Haggblade et al., 2007; Unni and Raveendran, 2007; Eswaran et al., 2008; Gaiha and Imai, 2007; Lanjouwand Murgai, 2008.
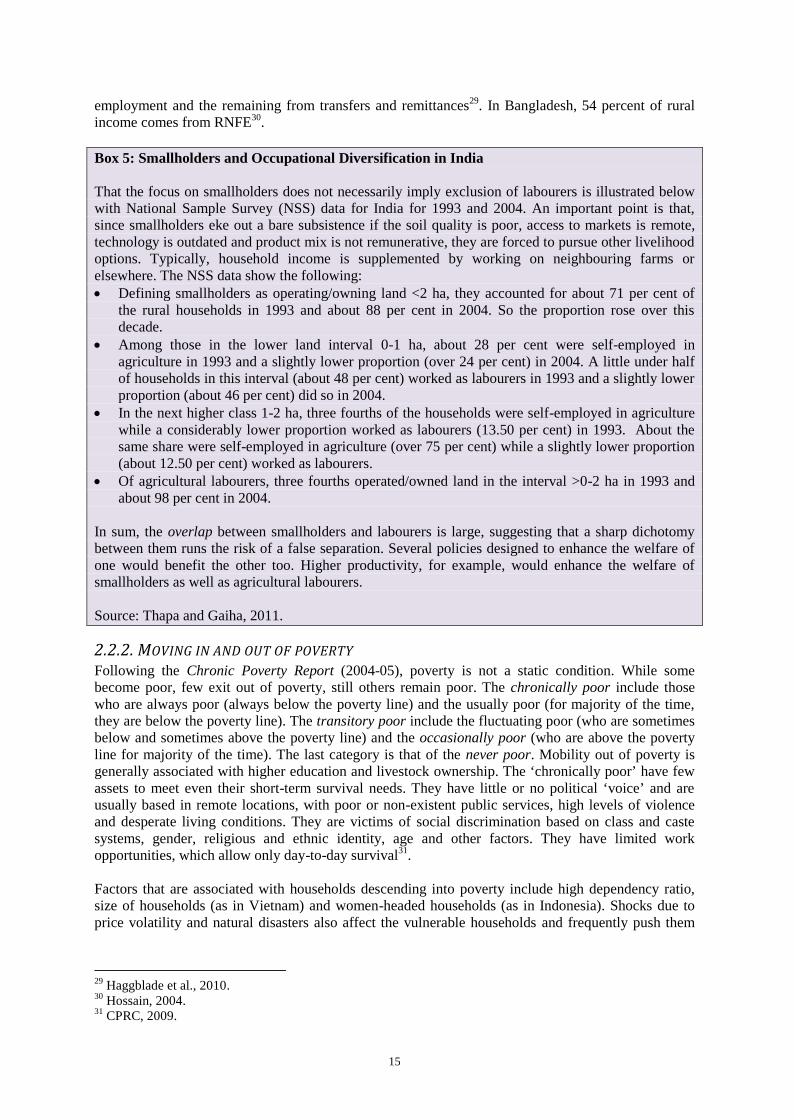
15
employment and the remaining from transfers and remittances29. In Bangladesh, 54 percent of ruralincome comes from RNFE30.
Box 5: Smallholders and Occupational Diversification in India
That the focus on smallholders does not necessarily imply exclusion of labourers is illustrated belowwith National Sample Survey (NSS) data for India for 1993 and 2004. An important point is that,since smallholders eke out a bare subsistence if the soil quality is poor, access to markets is remote,technology is outdated and product mix is not remunerative, they are forced to pursue other livelihoodoptions. Typically, household income is supplemented by working on neighbouring farms orelsewhere. The NSS data show the following: Defining smallholders as operating/owning land <2 ha, they accounted for about 71 per cent of
the rural households in 1993 and about 88 per cent in 2004. So the proportion rose over thisdecade.
Among those in the lower land interval 0-1 ha, about 28 per cent were self-employed inagriculture in 1993 and a slightly lower proportion (over 24 per cent) in 2004. A little under halfof households in this interval (about 48 per cent) worked as labourers in 1993 and a slightly lowerproportion (about 46 per cent) did so in 2004.
In the next higher class 1-2 ha, three fourths of the households were self-employed in agriculturewhile a considerably lower proportion worked as labourers (13.50 per cent) in 1993. About thesame share were self-employed in agriculture (over 75 per cent) while a slightly lower proportion(about 12.50 per cent) worked as labourers.
Of agricultural labourers, three fourths operated/owned land in the interval >0-2 ha in 1993 andabout 98 per cent in 2004.
In sum, the overlap between smallholders and labourers is large, suggesting that a sharp dichotomybetween them runs the risk of a false separation. Several policies designed to enhance the welfare ofone would benefit the other too. Higher productivity, for example, would enhance the welfare ofsmallholders as well as agricultural labourers.
Source: Thapa and Gaiha, 2011.
2.2.2. MOVING IN AND OUT OF POVERTYFollowing the Chronic Poverty Report (2004-05), poverty is not a static condition. While somebecome poor, few exit out of poverty, still others remain poor. The chronically poor include thosewho are always poor (always below the poverty line) and the usually poor (for majority of the time,they are below the poverty line). The transitory poor include the fluctuating poor (who are sometimesbelow and sometimes above the poverty line) and the occasionally poor (who are above the povertyline for majority of the time). The last category is that of the never poor. Mobility out of poverty isgenerally associated with higher education and livestock ownership. The ‘chronically poor’ have fewassets to meet even their short-term survival needs. They have little or no political ‘voice’ and areusually based in remote locations, with poor or non-existent public services, high levels of violenceand desperate living conditions. They are victims of social discrimination based on class and castesystems, gender, religious and ethnic identity, age and other factors. They have limited workopportunities, which allow only day-to-day survival31.
Factors that are associated with households descending into poverty include high dependency ratio,size of households (as in Vietnam) and women-headed households (as in Indonesia). Shocks due toprice volatility and natural disasters also affect the vulnerable households and frequently push them
29 Haggblade et al., 2010.30 Hossain, 2004.31 CPRC, 2009.
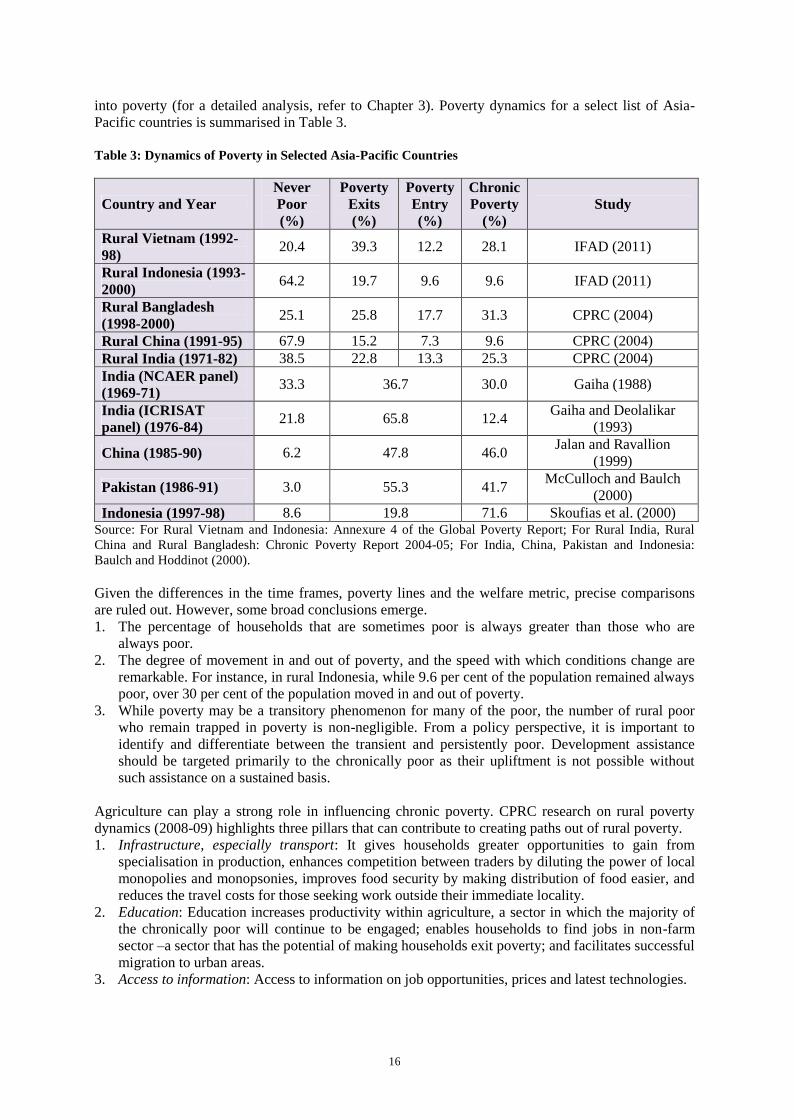
16
into poverty (for a detailed analysis, refer to Chapter 3). Poverty dynamics for a select list of Asia-Pacific countries is summarised in Table 3.
Table 3: Dynamics of Poverty in Selected Asia-Pacific Countries
Country and YearNeverPoor(%)
PovertyExits(%)
PovertyEntry(%)
ChronicPoverty
(%)Study
Rural Vietnam (1992-98)
20.4 39.3 12.2 28.1 IFAD (2011)
Rural Indonesia (1993-2000)
64.2 19.7 9.6 9.6 IFAD (2011)
Rural Bangladesh(1998-2000)
25.1 25.8 17.7 31.3 CPRC (2004)
Rural China (1991-95) 67.9 15.2 7.3 9.6 CPRC (2004)Rural India (1971-82) 38.5 22.8 13.3 25.3 CPRC (2004)India (NCAER panel)(1969-71)
33.3 36.7 30.0 Gaiha (1988)
India (ICRISATpanel) (1976-84)
21.8 65.8 12.4Gaiha and Deolalikar
(1993)
China (1985-90) 6.2 47.8 46.0Jalan and Ravallion
(1999)
Pakistan (1986-91) 3.0 55.3 41.7McCulloch and Baulch
(2000)Indonesia (1997-98) 8.6 19.8 71.6 Skoufias et al. (2000)
Source: For Rural Vietnam and Indonesia: Annexure 4 of the Global Poverty Report; For Rural India, RuralChina and Rural Bangladesh: Chronic Poverty Report 2004-05; For India, China, Pakistan and Indonesia:Baulch and Hoddinot (2000).
Given the differences in the time frames, poverty lines and the welfare metric, precise comparisonsare ruled out. However, some broad conclusions emerge.1. The percentage of households that are sometimes poor is always greater than those who are
always poor.2. The degree of movement in and out of poverty, and the speed with which conditions change are
remarkable. For instance, in rural Indonesia, while 9.6 per cent of the population remained alwayspoor, over 30 per cent of the population moved in and out of poverty.
3. While poverty may be a transitory phenomenon for many of the poor, the number of rural poorwho remain trapped in poverty is non-negligible. From a policy perspective, it is important toidentify and differentiate between the transient and persistently poor. Development assistanceshould be targeted primarily to the chronically poor as their upliftment is not possible withoutsuch assistance on a sustained basis.
Agriculture can play a strong role in influencing chronic poverty. CPRC research on rural povertydynamics (2008-09) highlights three pillars that can contribute to creating paths out of rural poverty.1. Infrastructure, especially transport: It gives households greater opportunities to gain from
specialisation in production, enhances competition between traders by diluting the power of localmonopolies and monopsonies, improves food security by making distribution of food easier, andreduces the travel costs for those seeking work outside their immediate locality.
2. Education: Education increases productivity within agriculture, a sector in which the majority ofthe chronically poor will continue to be engaged; enables households to find jobs in non-farmsector –a sector that has the potential of making households exit poverty; and facilitates successfulmigration to urban areas.
3. Access to information: Access to information on job opportunities, prices and latest technologies.
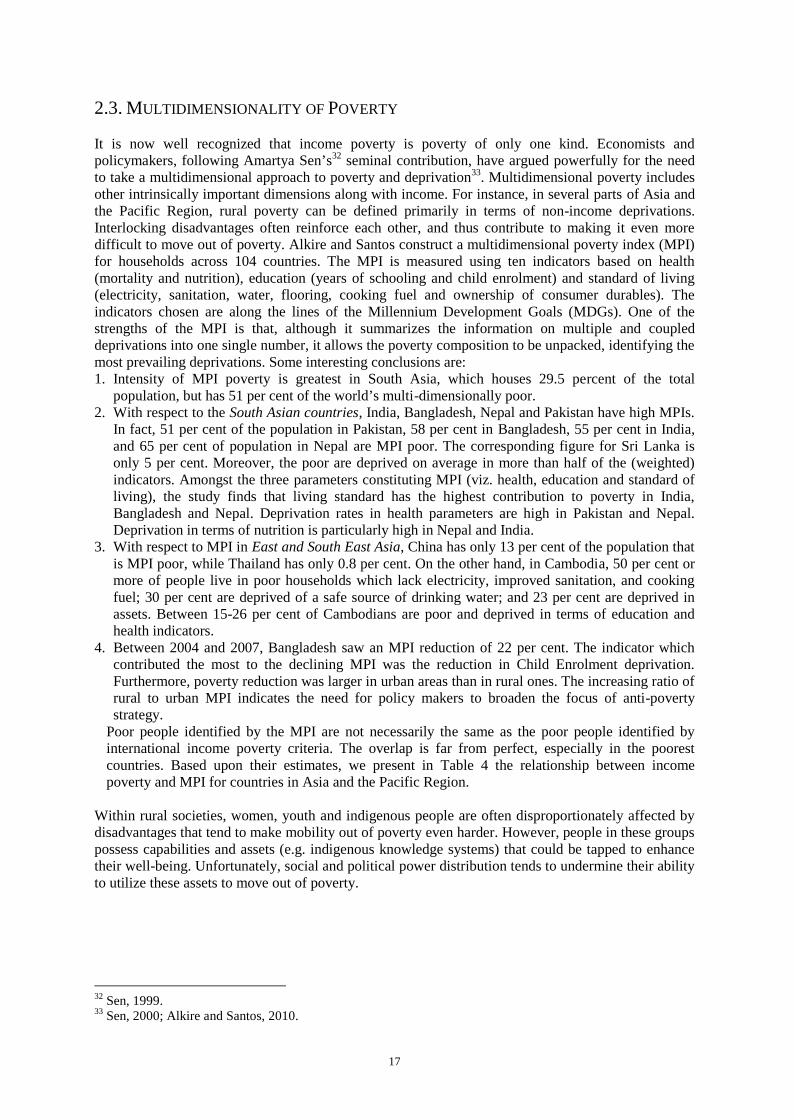
17
2.3. MULTIDIMENSIONALITY OF POVERTY
It is now well recognized that income poverty is poverty of only one kind. Economists andpolicymakers, following Amartya Sen’s32 seminal contribution, have argued powerfully for the needto take a multidimensional approach to poverty and deprivation33. Multidimensional poverty includesother intrinsically important dimensions along with income. For instance, in several parts of Asia andthe Pacific Region, rural poverty can be defined primarily in terms of non-income deprivations.Interlocking disadvantages often reinforce each other, and thus contribute to making it even moredifficult to move out of poverty. Alkire and Santos construct a multidimensional poverty index (MPI)for households across 104 countries. The MPI is measured using ten indicators based on health(mortality and nutrition), education (years of schooling and child enrolment) and standard of living(electricity, sanitation, water, flooring, cooking fuel and ownership of consumer durables). Theindicators chosen are along the lines of the Millennium Development Goals (MDGs). One of thestrengths of the MPI is that, although it summarizes the information on multiple and coupleddeprivations into one single number, it allows the poverty composition to be unpacked, identifying themost prevailing deprivations. Some interesting conclusions are:1. Intensity of MPI poverty is greatest in South Asia, which houses 29.5 percent of the total
population, but has 51 per cent of the world’s multi-dimensionally poor.2. With respect to the South Asian countries, India, Bangladesh, Nepal and Pakistan have high MPIs.
In fact, 51 per cent of the population in Pakistan, 58 per cent in Bangladesh, 55 per cent in India,and 65 per cent of population in Nepal are MPI poor. The corresponding figure for Sri Lanka isonly 5 per cent. Moreover, the poor are deprived on average in more than half of the (weighted)indicators. Amongst the three parameters constituting MPI (viz. health, education and standard ofliving), the study finds that living standard has the highest contribution to poverty in India,Bangladesh and Nepal. Deprivation rates in health parameters are high in Pakistan and Nepal.Deprivation in terms of nutrition is particularly high in Nepal and India.
3. With respect to MPI in East and South East Asia, China has only 13 per cent of the population thatis MPI poor, while Thailand has only 0.8 per cent. On the other hand, in Cambodia, 50 per cent ormore of people live in poor households which lack electricity, improved sanitation, and cookingfuel; 30 per cent are deprived of a safe source of drinking water; and 23 per cent are deprived inassets. Between 15-26 per cent of Cambodians are poor and deprived in terms of education andhealth indicators.
4. Between 2004 and 2007, Bangladesh saw an MPI reduction of 22 per cent. The indicator whichcontributed the most to the declining MPI was the reduction in Child Enrolment deprivation.Furthermore, poverty reduction was larger in urban areas than in rural ones. The increasing ratio ofrural to urban MPI indicates the need for policy makers to broaden the focus of anti-povertystrategy.
Poor people identified by the MPI are not necessarily the same as the poor people identified byinternational income poverty criteria. The overlap is far from perfect, especially in the poorestcountries. Based upon their estimates, we present in Table 4 the relationship between incomepoverty and MPI for countries in Asia and the Pacific Region.
Within rural societies, women, youth and indigenous people are often disproportionately affected bydisadvantages that tend to make mobility out of poverty even harder. However, people in these groupspossess capabilities and assets (e.g. indigenous knowledge systems) that could be tapped to enhancetheir well-being. Unfortunately, social and political power distribution tends to undermine their abilityto utilize these assets to move out of poverty.
32 Sen, 1999.33 Sen, 2000; Alkire and Santos, 2010.
18
Table 4: Multidimensional Poverty
Multidimensional PovertyLow MPI(0-0.03)
Medium MPI(0.03 – 0.25)
High MPI(0.25 and above)
IncomePoverty(<$1.25a day)
Low(0-0.1)*
Thailand,Kazakhstan
Indonesia -
Medium(0.1-0.25)*
Sri Lanka,Kyrgyzstan
China, Mongolia,Philippines, Vietnam,Tajikistan
Pakistan
High(0.25 and above)*
Uzbekistan -Cambodia, India,Laos, Nepal,Bangladesh
IncomePoverty(<$2 aday)
Low(0-0.2)*
Thailand,Kazakhstan
Turkey -
Medium(0.2-0.6)*
Sri Lanka,Kyrgyzstan
China, Philippines,Vietnam, Indonesia,Mongolia, Tajikistan
-
High(0.6 and above)*
Uzbekistan -Pakistan, Cambodia,India, Laos, Nepal,Bangladesh
* Denotes the proportion of population below the poverty line.Source: Based on Alkire and Santos (2010).
2.3.1. RURAL WOMEN
Although there is evidence of rising rates of female-headed households, gender-blind statistics make itdifficult to substantiate the claim that the number of women living in poverty is higher than that ofmen34. However, because of their weaker and conditional basis of their entitlements, women are morevulnerable to poverty and, once poor, have fewer options to escape from it. Also, because of genderdiscrimination in the household and the market, there is usually unequal distribution of resourcesleading to women experiencing a greater severity of poverty than men.
In many societies, women suffer disproportionately from the burden of poverty and are systematicallyexcluded from access to essential assets. They face gender disparities in education, nutrition,economic opportunities and wages. Improving the status of women and empowering them is thusimportant in addressing poverty broadly interpreted. Women’s empowerment needs to occur alongmultiple dimensions including economic, socio-cultural, familial/interpersonal, legal, political, andpsychological35. It provides important socioeconomic returns through reduced health and welfarecosts and lower fertility and maternal and infant mortality rates. Driven by the motivation to involvewomen in the development process and recognizing that women occupy the ranks of the poorest andthat they spend their earnings more on family welfare, governments, development practitioners anddonor agencies have focused on microfinance as a strategy capable of reaching and empoweringwomen36. A study of Small Enterprise Development Programme (SEDP) in Bangladesh found thatwomen’s contribution to the household contributed to the reduction in abuse and strengthened theirrelative position within an interdependent relationship with their husbands37. In Nepal, WorkingWomen’s Forum found that 40.9 percent of its members who had experienced domestic violencestopped it because of their personal empowerment, while 28.7 percent were able to stop it throughgroup action38. The World Bank39 has identified four key elements of empowerment to initiate
34 IDS, 2001.35 Malhotra et al., 2002.36 Kulkarni, 2010.37 Kabeer, 1998.38 Cheston and Kuhn, 2002.
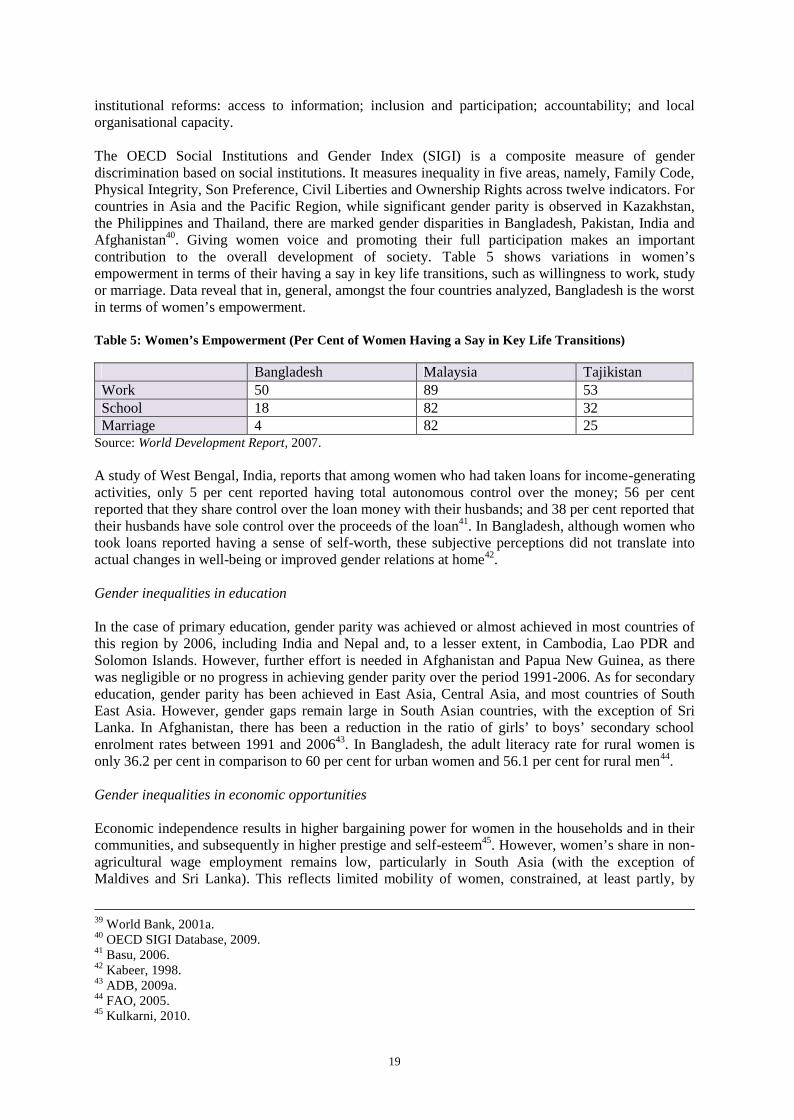
19
institutional reforms: access to information; inclusion and participation; accountability; and localorganisational capacity.
The OECD Social Institutions and Gender Index (SIGI) is a composite measure of genderdiscrimination based on social institutions. It measures inequality in five areas, namely, Family Code,Physical Integrity, Son Preference, Civil Liberties and Ownership Rights across twelve indicators. Forcountries in Asia and the Pacific Region, while significant gender parity is observed in Kazakhstan,the Philippines and Thailand, there are marked gender disparities in Bangladesh, Pakistan, India andAfghanistan40. Giving women voice and promoting their full participation makes an importantcontribution to the overall development of society. Table 5 shows variations in women’sempowerment in terms of their having a say in key life transitions, such as willingness to work, studyor marriage. Data reveal that in, general, amongst the four countries analyzed, Bangladesh is the worstin terms of women’s empowerment.
Table 5: Women’s Empowerment (Per Cent of Women Having a Say in Key Life Transitions)
Bangladesh Malaysia TajikistanWork 50 89 53School 18 82 32Marriage 4 82 25
Source: World Development Report, 2007.
A study of West Bengal, India, reports that among women who had taken loans for income-generatingactivities, only 5 per cent reported having total autonomous control over the money; 56 per centreported that they share control over the loan money with their husbands; and 38 per cent reported thattheir husbands have sole control over the proceeds of the loan41. In Bangladesh, although women whotook loans reported having a sense of self-worth, these subjective perceptions did not translate intoactual changes in well-being or improved gender relations at home42.
Gender inequalities in education
In the case of primary education, gender parity was achieved or almost achieved in most countries ofthis region by 2006, including India and Nepal and, to a lesser extent, in Cambodia, Lao PDR andSolomon Islands. However, further effort is needed in Afghanistan and Papua New Guinea, as therewas negligible or no progress in achieving gender parity over the period 1991-2006. As for secondaryeducation, gender parity has been achieved in East Asia, Central Asia, and most countries of SouthEast Asia. However, gender gaps remain large in South Asian countries, with the exception of SriLanka. In Afghanistan, there has been a reduction in the ratio of girls’ to boys’ secondary schoolenrolment rates between 1991 and 200643. In Bangladesh, the adult literacy rate for rural women isonly 36.2 per cent in comparison to 60 per cent for urban women and 56.1 per cent for rural men44.
Gender inequalities in economic opportunities
Economic independence results in higher bargaining power for women in the households and in theircommunities, and subsequently in higher prestige and self-esteem45. However, women’s share in non-agricultural wage employment remains low, particularly in South Asia (with the exception ofMaldives and Sri Lanka). This reflects limited mobility of women, constrained, at least partly, by
39 World Bank, 2001a.40 OECD SIGI Database, 2009.41 Basu, 2006.42 Kabeer, 1998.43 ADB, 2009a.44 FAO, 2005.45 Kulkarni, 2010.
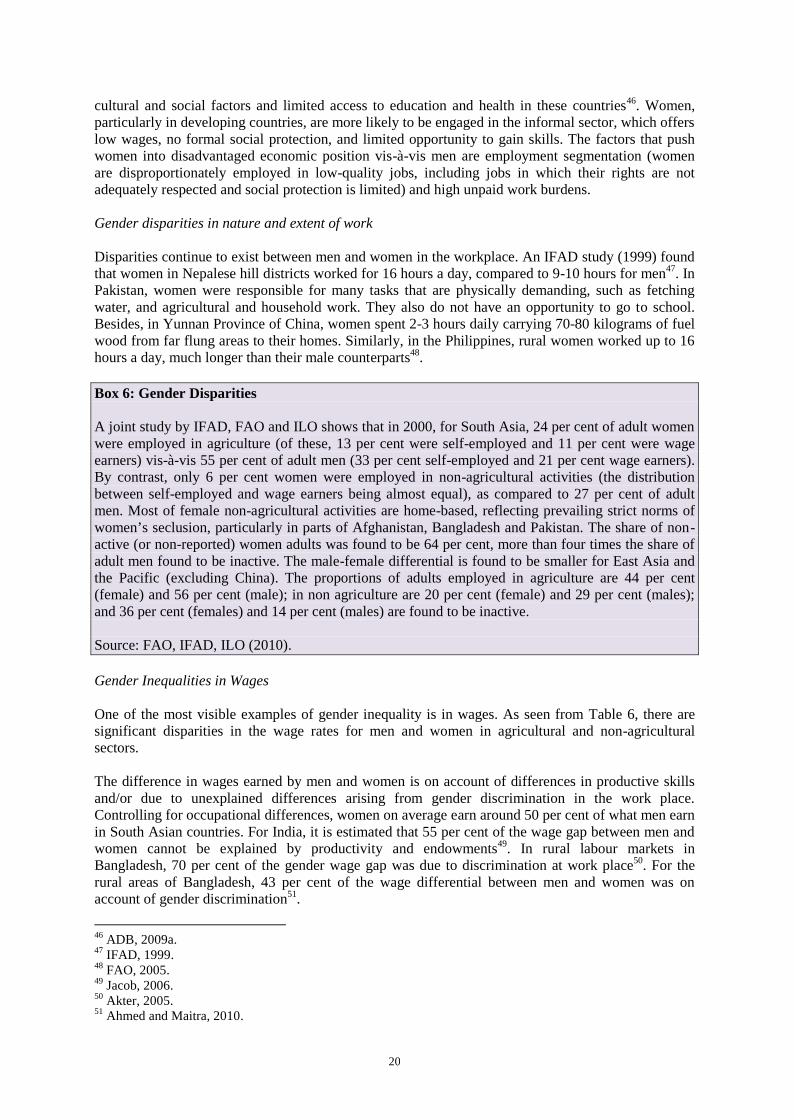
20
cultural and social factors and limited access to education and health in these countries46. Women,particularly in developing countries, are more likely to be engaged in the informal sector, which offerslow wages, no formal social protection, and limited opportunity to gain skills. The factors that pushwomen into disadvantaged economic position vis-à-vis men are employment segmentation (womenare disproportionately employed in low-quality jobs, including jobs in which their rights are notadequately respected and social protection is limited) and high unpaid work burdens.
Gender disparities in nature and extent of work
Disparities continue to exist between men and women in the workplace. An IFAD study (1999) foundthat women in Nepalese hill districts worked for 16 hours a day, compared to 9-10 hours for men47. InPakistan, women were responsible for many tasks that are physically demanding, such as fetchingwater, and agricultural and household work. They also do not have an opportunity to go to school.Besides, in Yunnan Province of China, women spent 2-3 hours daily carrying 70-80 kilograms of fuelwood from far flung areas to their homes. Similarly, in the Philippines, rural women worked up to 16hours a day, much longer than their male counterparts48.
Box 6: Gender Disparities
A joint study by IFAD, FAO and ILO shows that in 2000, for South Asia, 24 per cent of adult womenwere employed in agriculture (of these, 13 per cent were self-employed and 11 per cent were wageearners) vis-à-vis 55 per cent of adult men (33 per cent self-employed and 21 per cent wage earners).By contrast, only 6 per cent women were employed in non-agricultural activities (the distributionbetween self-employed and wage earners being almost equal), as compared to 27 per cent of adultmen. Most of female non-agricultural activities are home-based, reflecting prevailing strict norms ofwomen’s seclusion, particularly in parts of Afghanistan, Bangladesh and Pakistan. The share of non-active (or non-reported) women adults was found to be 64 per cent, more than four times the share ofadult men found to be inactive. The male-female differential is found to be smaller for East Asia andthe Pacific (excluding China). The proportions of adults employed in agriculture are 44 per cent(female) and 56 per cent (male); in non agriculture are 20 per cent (female) and 29 per cent (males);and 36 per cent (females) and 14 per cent (males) are found to be inactive.
Source: FAO, IFAD, ILO (2010).
Gender Inequalities in Wages
One of the most visible examples of gender inequality is in wages. As seen from Table 6, there aresignificant disparities in the wage rates for men and women in agricultural and non-agriculturalsectors.
The difference in wages earned by men and women is on account of differences in productive skillsand/or due to unexplained differences arising from gender discrimination in the work place.Controlling for occupational differences, women on average earn around 50 per cent of what men earnin South Asian countries. For India, it is estimated that 55 per cent of the wage gap between men andwomen cannot be explained by productivity and endowments49. In rural labour markets inBangladesh, 70 per cent of the gender wage gap was due to discrimination at work place50. For therural areas of Bangladesh, 43 per cent of the wage differential between men and women was onaccount of gender discrimination51.
46 ADB, 2009a.47 IFAD, 1999.48 FAO, 2005.49 Jacob, 2006.50 Akter, 2005.51 Ahmed and Maitra, 2010.
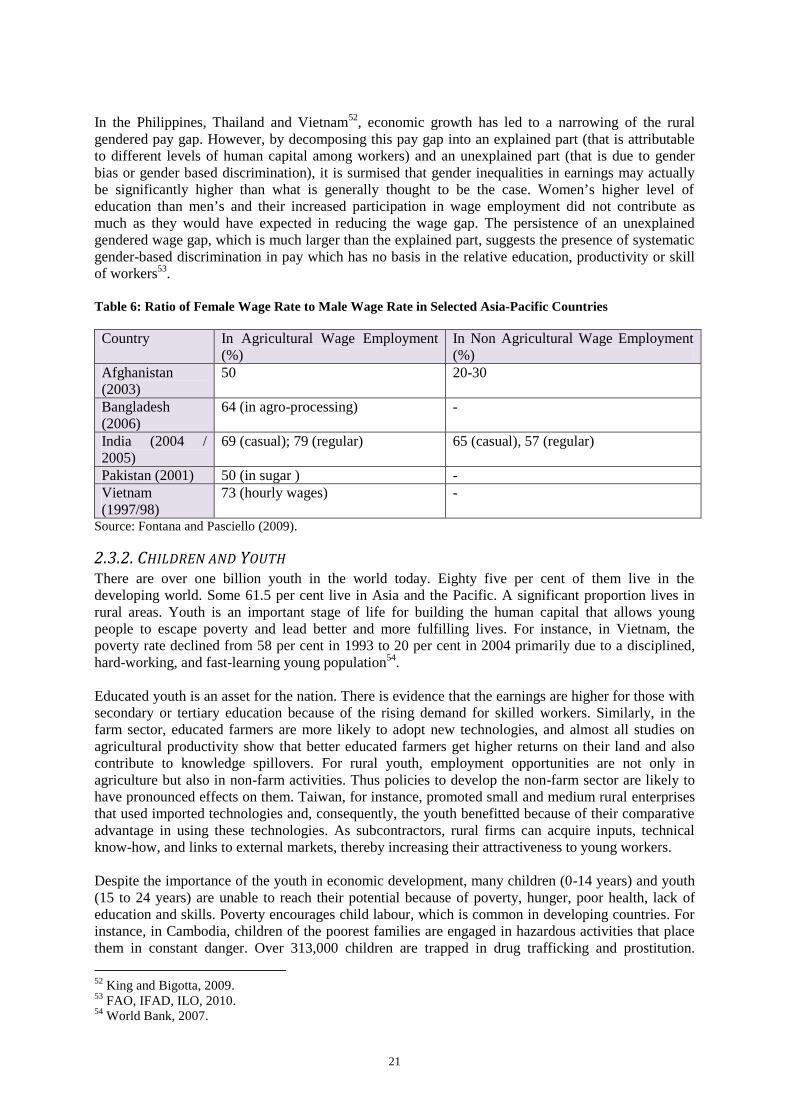
21
In the Philippines, Thailand and Vietnam52, economic growth has led to a narrowing of the ruralgendered pay gap. However, by decomposing this pay gap into an explained part (that is attributableto different levels of human capital among workers) and an unexplained part (that is due to genderbias or gender based discrimination), it is surmised that gender inequalities in earnings may actuallybe significantly higher than what is generally thought to be the case. Women’s higher level ofeducation than men’s and their increased participation in wage employment did not contribute asmuch as they would have expected in reducing the wage gap. The persistence of an unexplainedgendered wage gap, which is much larger than the explained part, suggests the presence of systematicgender-based discrimination in pay which has no basis in the relative education, productivity or skillof workers53.
Table 6: Ratio of Female Wage Rate to Male Wage Rate in Selected Asia-Pacific Countries
Country In Agricultural Wage Employment(%)
In Non Agricultural Wage Employment(%)
Afghanistan(2003)
50 20-30
Bangladesh(2006)
64 (in agro-processing) -
India (2004 /2005)
69 (casual); 79 (regular) 65 (casual), 57 (regular)
Pakistan (2001) 50 (in sugar ) -Vietnam(1997/98)
73 (hourly wages) -
Source: Fontana and Pasciello (2009).
2.3.2. CHILDREN AND YOUTHThere are over one billion youth in the world today. Eighty five per cent of them live in thedeveloping world. Some 61.5 per cent live in Asia and the Pacific. A significant proportion lives inrural areas. Youth is an important stage of life for building the human capital that allows youngpeople to escape poverty and lead better and more fulfilling lives. For instance, in Vietnam, thepoverty rate declined from 58 per cent in 1993 to 20 per cent in 2004 primarily due to a disciplined,hard-working, and fast-learning young population54.
Educated youth is an asset for the nation. There is evidence that the earnings are higher for those withsecondary or tertiary education because of the rising demand for skilled workers. Similarly, in thefarm sector, educated farmers are more likely to adopt new technologies, and almost all studies onagricultural productivity show that better educated farmers get higher returns on their land and alsocontribute to knowledge spillovers. For rural youth, employment opportunities are not only inagriculture but also in non-farm activities. Thus policies to develop the non-farm sector are likely tohave pronounced effects on them. Taiwan, for instance, promoted small and medium rural enterprisesthat used imported technologies and, consequently, the youth benefitted because of their comparativeadvantage in using these technologies. As subcontractors, rural firms can acquire inputs, technicalknow-how, and links to external markets, thereby increasing their attractiveness to young workers.
Despite the importance of the youth in economic development, many children (0-14 years) and youth(15 to 24 years) are unable to reach their potential because of poverty, hunger, poor health, lack ofeducation and skills. Poverty encourages child labour, which is common in developing countries. Forinstance, in Cambodia, children of the poorest families are engaged in hazardous activities that placethem in constant danger. Over 313,000 children are trapped in drug trafficking and prostitution.
52 King and Bigotta, 2009.53 FAO, IFAD, ILO, 2010.54 World Bank, 2007.
22
Others spend hours in salt fields, work in factories or load carts with bricks to meet the demands ofthe booming construction industry55. In India, over 300,000 children work in the carpet industry,many of them under conditions that amount to bonded labour. Further, gender bias makes life moredifficult for young women and girls.
A key to surmounting rural poverty is agricultural transformation. The challenge is for farm and non-farm sector to provide employment and higher incomes for the youth. Some of the steps that havebeen initiated to empower rural youth are:1. Youth organisations: They can be effective ways to empower and enable rural youth to participate
in the development of their communities. One such institution is the 4-H (Head, Heart, Hands andHealth). The Thanat Samakhee Club, a Thai 4-H youth organisation, established in May, 1973,has specific objectives to promote cooperation among youth of the Thanat sub-district, andprovide them opportunities to gain knowledge and skills in agriculture and home economics. TheClub has been successful in training the youth and coordinating production of asparagus andorganic baby corn in their region. Another successful youth group is the Tuga 4-H Club based inKalinga of the Cordillera Administrative Region of the Philippines. Set up in 1996, some of thelivelihood projects undertaken by its members are production of ducks, goats, poultry and swine,vegetable and ornamental gardening, rice farming, and candy processing. A national youthconsultative committee has been set up by the Malaysian government, which promotesrecognition of the value of youth participation and discusses issues relevant to young people.Japan incorporates agriculture education in the curricula of secondary schools, junior colleges anduniversities. Some of its farm youth training programmes are administered by the Rural YouthEducation Development Association (RYEDA).
2. Youth employment opportunities in rural areas: In order to improve employment prospects forrural youth, investment must be encouraged in agricultural extension services, which focus on theyoung. The Bharatiya Yuva Shakti Trust (BYST) in India is an example of an organisation thatprovides support, including micro-finance, for underprivileged youth and enables them to havethe opportunity to set up their business. Utilising technology for youth employment is equallyimportant. For example, low cost cellular phone technology has been used as the basis of theGrameen Village Pay Phone programme (VPP) in Bangladesh. In addition, low-cost technologysuch as cellular phones, and computers with internet access have been used by rural youth toestablish small kiosks, with low start-up costs, providing communication services in theircommunities. A project in India, called ‘Narrowing the digital divide’, is specifically aimed atimproving employment opportunities for the youth by providing access to and training in ICT.This project targets rural youth in remote areas. Another crucial aspect is training. The HumanResources Placement Services (HRPS) Division in the Department of Labour, Sri Lanka,monitors the labour market, maintains a database on the job market, and helps to match supplyand demand in job training and placement activities. ‘Telefood’ is an example of a campaign thatgenerates employment along with creating food security. It funds training in organic, bio-intensive farming for unemployed women and youth in Cotabato, in the Philippines. Thesewomen and youth increased crop yields while using less fertilizer and fewer pesticides. While theproduce provides food for the participants’ families, the surplus is sold by the participants.
Box 7 discusses more of such initiatives undertaken by IFAD to create opportunities for rural youth inAsia and the Pacific Region.
55 ILO, 2010
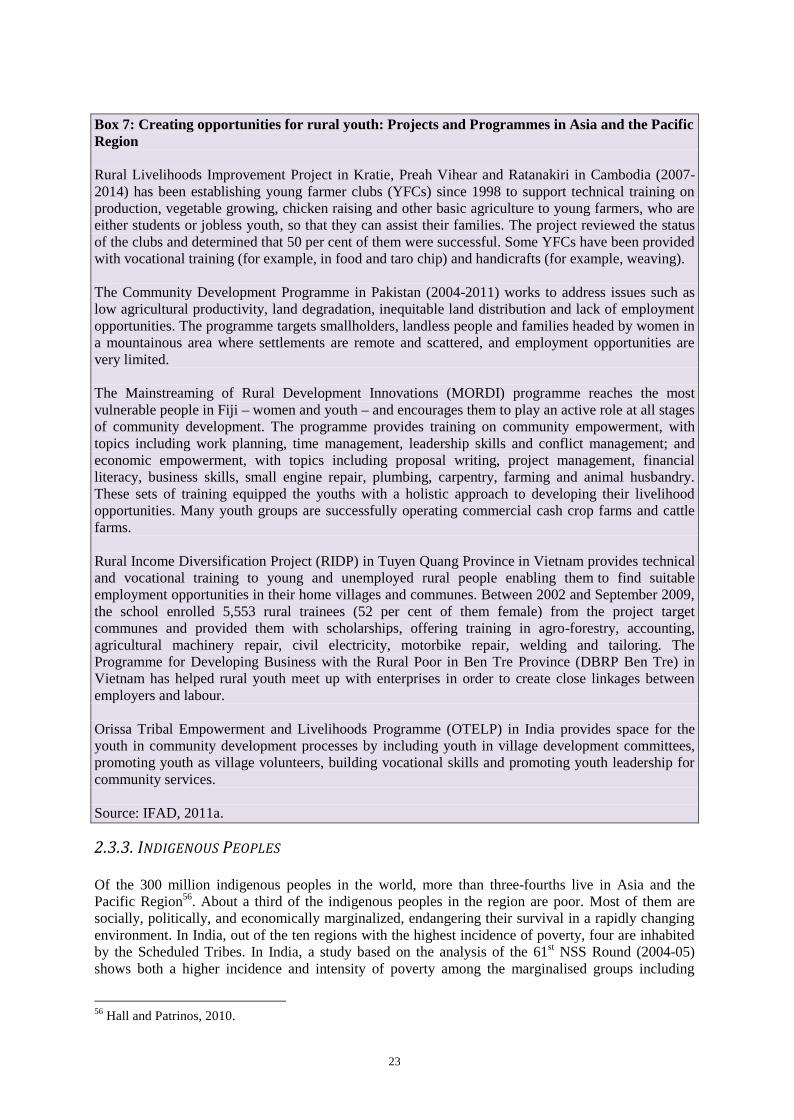
23
Box 7: Creating opportunities for rural youth: Projects and Programmes in Asia and the PacificRegion
Rural Livelihoods Improvement Project in Kratie, Preah Vihear and Ratanakiri in Cambodia (2007-2014) has been establishing young farmer clubs (YFCs) since 1998 to support technical training onproduction, vegetable growing, chicken raising and other basic agriculture to young farmers, who areeither students or jobless youth, so that they can assist their families. The project reviewed the statusof the clubs and determined that 50 per cent of them were successful. Some YFCs have been providedwith vocational training (for example, in food and taro chip) and handicrafts (for example, weaving).
The Community Development Programme in Pakistan (2004-2011) works to address issues such aslow agricultural productivity, land degradation, inequitable land distribution and lack of employmentopportunities. The programme targets smallholders, landless people and families headed by women ina mountainous area where settlements are remote and scattered, and employment opportunities arevery limited.
The Mainstreaming of Rural Development Innovations (MORDI) programme reaches the mostvulnerable people in Fiji – women and youth – and encourages them to play an active role at all stagesof community development. The programme provides training on community empowerment, withtopics including work planning, time management, leadership skills and conflict management; andeconomic empowerment, with topics including proposal writing, project management, financialliteracy, business skills, small engine repair, plumbing, carpentry, farming and animal husbandry.These sets of training equipped the youths with a holistic approach to developing their livelihoodopportunities. Many youth groups are successfully operating commercial cash crop farms and cattlefarms.
Rural Income Diversification Project (RIDP) in Tuyen Quang Province in Vietnam provides technicaland vocational training to young and unemployed rural people enabling them to find suitableemployment opportunities in their home villages and communes. Between 2002 and September 2009,the school enrolled 5,553 rural trainees (52 per cent of them female) from the project targetcommunes and provided them with scholarships, offering training in agro-forestry, accounting,agricultural machinery repair, civil electricity, motorbike repair, welding and tailoring. TheProgramme for Developing Business with the Rural Poor in Ben Tre Province (DBRP Ben Tre) inVietnam has helped rural youth meet up with enterprises in order to create close linkages betweenemployers and labour.
Orissa Tribal Empowerment and Livelihoods Programme (OTELP) in India provides space for theyouth in community development processes by including youth in village development committees,promoting youth as village volunteers, building vocational skills and promoting youth leadership forcommunity services.
Source: IFAD, 2011a.
2.3.3. INDIGENOUS PEOPLES
Of the 300 million indigenous peoples in the world, more than three-fourths live in Asia and thePacific Region56. About a third of the indigenous peoples in the region are poor. Most of them aresocially, politically, and economically marginalized, endangering their survival in a rapidly changingenvironment. In India, out of the ten regions with the highest incidence of poverty, four are inhabitedby the Scheduled Tribes. In India, a study based on the analysis of the 61st NSS Round (2004-05)shows both a higher incidence and intensity of poverty among the marginalised groups including
56 Hall and Patrinos, 2010.
24
Scheduled Castes and Scheduled Tribes. While the overall incidence of poverty in rural India wasabout 25 per cent, among the Scheduled Tribes and Scheduled Castes, about 44 per cent and 32 percent, respectively, of the households were poor. The incidence of poverty among others was 19 percent57. The causes for the same have been found to be poor quality of education, remote locations,limited access to markets and lack of decent physical and social infrastructure.
In China, members of more than 50 ethnic minority groups are concentrated in poor, remote andmountainous regions. They comprise less than 9 per cent of the total population, but represent about40 per cent of those in a state of absolute poverty. There are significant disparities in the livingstandards of ethnic minority groups in Vietnam. These groups represent 14 per cent of the population,but 29 per cent of the poor. Moreover, they remained trapped in poverty during a period of otherwisepro-poor growth. While the reduction in poverty headcount among the majority population was from54 to 31 per cent between 1993 and 1998, it only dropped from 86 to 75 per cent among theminorities58. In Bangladesh, for instance, most of the tribals live in the Chittagong hill tracts. With theconstruction of the Kaptai hydroelectric project, about 100,000 inhabitants were left homeless and54000 acres of land (representing 40 per cent of the land suitable for intensive cultivation) wassubmerged.
Indigenous people are very knowledgeable with respect to biodiversity and forest resources. Bymaking them co-owners of the forests, the goal of poverty reduction can be achieved along withsustainable development and environmental protection. The Orissa Tribal Development Project andthe Andhra Pradesh Tribal Development Project (India), which were supported by IFAD, provided forland titles to the tribals and these clearly defined property rights enabled improvements in naturalresource management. The IFAD-supported Oxbow Lakes Small Fisherman Project in Bangladeshand Hills Leasehold Forestry and Forage Development Project in Nepal aim at enhancing the accessof the poor to the Common Property Resources and improving their productivity. In India, theScheduled Tribes and Other Traditional Forest Dwellers (Recognition of Forest Rights) Act, 2006,ensures that the affected indigenous peoples are well informed, their consent is obtained, andsufficient compensation and relocation facilities are provided before they are physically oreconomically displaced to accommodate a development project.
In Bangladesh, the Smallholder Agricultural Improvement Project is improving the livelihoods oftribal communities (known as adivasis) living in the central part of the country. This marginalized andexcluded section of the society depends on agriculture for survival, but their livelihoods are highlyinsecure. Under the scheme, these people are provided technical training; and are introduced to newmethods of farming, and access to financial services. Such schemes have succeeded in revitalizinglocal livelihoods of the adivasis.
In the Philippines, indigenous people represent 17 per cent of the total population. Comprising anestimated 110 ethno linguistic groups, they embody an immense cultural wealth. Yet they live underthe constant threat of loss of their lands and access to forest resources. The Cordillera HighlandAgricultural Resource Management Project has been implemented with IFAD support to target thisindigenous population. The project successfully integrated the lapat local knowledge system for forestmanagement into its reforestation activities. This system, practised by the Tingguians' Masadiit tribein Abra, effectively regulates the harvesting and utilization of forest products, thereby protectingnatural resources. As a result of this pilot exercise the lapat system will become integrated intonational policy59.
57 Gaiha et al., 2007.58 CPRC, 2004.59 IFAD, 2006.
25
2.4. EQUITY – EFFICIENCY TRADE-OFFS
There is often a presumption that equity – or, as a special case, poverty reduction – involves a loss ofefficiency. Okun60, for example, famously described redistribution to be like carrying money from therich to the poor in a ‘leaky bucket’. Quite the contrary. There are many situations in which there areeither no trade-offs or they are exaggerated. One is the link between nutritional intake and workefficiency in situations of extreme poverty. A corollary of efficiency wage theory is that a moreegalitarian distribution of land, for example, reduces the malnourishment (and thus improving theemployability) of the currently unemployed, may lead to higher output in the economy. That suchpoverty-nutrition traps exist is confirmed empirically61. Another pervasive situation is that in whichredistributive policies promote growth by correcting market failures that affect the poor. Theseimperfections and the usually costly adjustments to them trap segments of the rural population inpoverty. Expanding credit enables the poor to invest in education and smallholders and artisans toexpand their scale of production, and thus climb out of poverty. Often and in different contexts,“….redistributive policies can increase a society’s aggregate potential for productive investment,innovation and human resource development”62.
2.5. KEY MESSAGES
First, in most of the sub-regions/countries of Asia and the Pacific Region, poverty is predominantlyrural. The onset of the Triple F crises (fuel, food and financial) has impeded progress towards MDG 1(i.e. halving extreme poverty by 2015). Despite high growth rates and urbanisation in recent years,poverty is likely to remain high in rural areas.
Second, while a large percentage of rural households is chronically poor, larger numbers move in andout of poverty (i.e. the transient poor). A failure to distinguish between the two may result in directingthe resources to those who are temporarily poor away from chronically poor. The latter need massiveand sustained transfers to break out of poverty.
Third, another manifestation of deprivation is child undernourishment which continues to bepervasive in several countries – especially in South Asia. Policies must be directed to not justmitigation of income deprivation, but, more importantly, to enhancing women’s economic status.
Fourth, rural poverty is a multidimensional phenomenon. Along with income, multidimensionalpoverty includes other intrinsically important dimensions such as lack of education, assets, limitedopportunities for economic advancement, among others. Rural women, youth and indigenous peoplesexperience such disadvantages disproportionately, making it harder for them to exit poverty, in allthese dimensions. This calls for a broader focus of anti-poverty strategies.
60 Okun, 1975.61 Jha et al. 2009.62 Bardhan, 2005, p. 1346.
26
CHAPTER 3: THE IMPORTANCE OF ADDRESSING RISK
3.1. INTRODUCTION
Poverty is not just a matter of deprivation but also of vulnerability to exogenous shocks (e.g. cropfailure, sharp fluctuations in commodity prices, earthquakes, floods, insect infestation, illness).Vulnerability is distinguishable from poverty in the sense that there exist those who are non-poor butvulnerable to poverty and those who are non-vulnerable but poor. However, as a measure ofdeprivation, vulnerability is more appealing as it takes into account not just fluctuating levels of livingbut also the resilience to shocks of subsets of households (e.g. the landless and smallholders). Shockscan trap people in poverty by eroding their assets and capabilities to a point that they are unable toaccumulate enough to move out of poverty. For instance, in Indonesia, poverty incidence was lowprior to the East Asian Crisis in 1997; however, the number of vulnerable was large as seen by themultitudes of households who became poor after the crisis63.
The empirical evidence points to the need for designing anti-poverty policies to address vulnerability,especially in rural areas where agricultural yields and revenues fluctuate a great deal due to changes inweather, floods, pest infestation, and market forces. Besides, different segments are exposed toidiosyncratic risks in the absence of easy access to medical care, drinking water, unhygienic livingconditions and limited opportunities for diversifying income sources64. These difficulties arecompounded by lack of financial intermediation and formal insurance; credit market imperfectionsand weak infrastructure. More specifically, if policymakers design poverty alleviation policies in thecurrent year on the basis of a poverty threshold of income in the previous year, the poor who receiveincome support may already have escaped from poverty and the non-poor who do not may haveslipped into poverty due to various unanticipated shocks (e.g. changes in relative crop prices).
This Chapter discusses several categories of risks and shocks and how they affect different segmentsof the population. For each set of risks, the hazards the poor face are explored, their strategies inmanaging risk outlined and public policy responses evaluated.
3.2. HOW RISKS AND SHOCKS AFFECT POVERTY DYNAMICS
Recent evidence for selected countries in the region illustrates not just the overlap between povertyand vulnerability to poverty but also their distinctness65.
In rural India, about 47 per cent were poor while nearly 75 per cent were vulnerable. As thecorrelation between poverty and vulnerability was high (0.52), it follows that there was some overlapbetween the two groups. The landless or small farmers were more vulnerable than large farmers.Although Vietnam witnessed a dramatic reduction in poverty with accelerated growth, the broadethnic and spatial contours of poverty have remained largely unchanged. In general, highervulnerability translates into poverty over time; vulnerability of the poor tends to perpetuate theirpoverty or generate poverty traps; while some manage to overcome their poverty despite beingvulnerable, their prospects of doing so are less likely than of remaining in poverty; and vulnerabilityof the non-poor propels them into poverty.
Landlessness and lack of education are associated with greater proneness to both poverty andvulnerability, as also lack of access to infrastructure; however, these associations vary with ethnicityand location.
63 Deolalikar et al., 2001.64 These risks may be micro or idiosyncratic.65 Gaiha and Imai (2009), Imai et al. (2010) and Jha et al. (2009, a, b, c).
27
In Timor Leste, while 34.7 per cent of the population are poor, 31.5 per cent of the population isvulnerable. In rural areas, however, the shares of poor and vulnerable were about equal. Moreimportantly, rural households are overrepresented among the poor and vulnerable. While 61 per centof the population is rural, 73 per cent of the poor live in rural areas, as do 87.4 per cent of thevulnerable.
In their transition to market-based economies since independence, the Central Asian countriesinitiated macroeconomic reforms. This led to economic recovery and greater price stability. However,these countries are still challenged by poverty and vulnerability to poverty. By and large, vulnerability(and poverty) in these countries are rural phenomena. In all countries studied rural households areover-represented among the poor and the vulnerable relative to their share in the population. Forinstance, in Kazakhstan, while 42.4 per cent of the population live in rural areas, 48.8 per cent of thepoor and 53.2 per cent of the vulnerable are rural. Similarly, in Kyrgyzstan, while 74.5 per cent of thepopulation are rural, 80.5 per cent of the poor live in rural areas, as do 82.9 per cent of those estimatedto be vulnerable.
Papua New Guinea (PNG) is a poor country among the Pacific island countries, with GDP per capitamuch lower than that of Fiji, Samoa, Tonga and Vanuatu. While 37.5 per cent of the population inPNG is observed to be poor, only 34.1 per cent of the population is vulnerable to poverty. Inter-regional differences in both poverty and vulnerability rates are large. Indeed, the fraction ofpopulation that is poor ranges from a low of 14.8 per cent in Papua to a high of 67.5 per cent inMomase. However, the fraction of population vulnerable to poverty ranges from a low of only 9.5 percent in Papua to a high of 67.8 per cent in Momase. Fiji is the richest among the Pacific islandcountries, with high GDP per capita, compared with the other countries in the region. The poverty ratein 2002 was 33.8 per cent, increasing from 25 per cent in 1991. The poverty rate overestimates thefraction of the population vulnerable to poverty. While 33.8 per cent of the population was observedto be poor, only 24.5 per cent of the population was vulnerable to poverty. Relative to their share inthe population, rural households were over-represented among the poor and the vulnerable. While43.9 per cent of the population lived in rural areas, 68.1 per cent of the poor and 88.3 per cent of thevulnerable were rural.
In sum, while there is overlap between poverty and vulnerability to poverty, with a diverse patternboth within and between countries studied here, a useful insight is that poverty and vulnerability aredistinct. Thus interventions designed to target the latter must differ from those designed for theformer. Specifically, more careful attention must be given to risk mitigation and coping in dealingwith vulnerability to poverty, especially in rural areas.
3.3. SOME OF THE KEY RISKS FOR POOR RURAL PEOPLE TODAY
3.3.1. PERSONAL AND HOUSEHOLD LEVEL RISKS: ILL HEALTH
Ill health is an important risk factor and source of shock for poor rural households. It is widelyrecognized that serious illness has significant adverse effects on a household’s labour supply andincome generation. The direct impact of illness can be short-term, mainly from the loss of workinghours of the sick person and for the household members taking care of the patient. The indirect impactis a long term one, as resources originally meant for productive activities, such as children’seducation, are spent on health care. In this way, serious illness may lead rural households to chronicpoverty. A study analyzing the prevalence and treatment of serious illness for eight Chinese provincesover the period 1987-2002 found that the annual per capita income of households affected by illnessdecreased by 5-6 per cent, with the negative effect sometimes continuing for over 15 years.66
66 Gao et al., 2006.
28
Researchers have found that morbidity is significantly higher for rural poor, females, older age groupsand less educated households67.
The outbreak of Avian Flu in a few countries in Asia and the Pacific Region in 2003 also severelyimpacted rural households – smallholders, semi-commercial and small-scale commercial farmers.Women, who had negligible access to assets and animals besides poultry, were severely affected.Studies on Bangladesh68 found that women poultry producers used their increased incomes to buymore food, send children to school and augment their assets. In order to avoid such hazards, there is aneed for more biosecure behaviour which includes avoiding farming of multiple species of animalswithin one farm unit, avoiding use of untreated chicken faeces as fertilizer or livestock feed, ensuringvaccination of live birds, and appropriate disposal of dying and dead birds.
Progress towards reducing ill health
While South East Asia and East Asia have made considerable progress in mitigating hunger andundernourishment, South Asia and West Asia continue to be laggards. The level of child mortality inSouth Asia, South East Asia and East Asia continues to be high, while the region also has a highincidence of maternal mortality. Some factors – attendance of deliveries by skilled health personneland more ante natal care – have reduced female mortality rates. However, poor women continue tosuffer neglect in these areas in South Asia. While less than 50 per cent of women in the pooresthouseholds received skilled care during pregnancy, more than 90 per cent of women in the wealthiesthouseholds received the same69.
Provision of safe drinking water and sanitation too remains a major challenge for Asia-Pacificcountries. Problems of contamination by naturally occurring inorganic arsenic, particularly inBangladesh and other parts of Southern Asia, or fluoride in China and India, have affected the safetyof water supplies.
A large proportion of people affected by HIV depend on agriculture. Fortunately, the spread of HIVhas stabilized in many regions due to increased awareness about the transmission of the disease. InVietnam, the percentage of young women aged 15-24 with comprehensive knowledge of HIVincreased from 25 per cent in 2000 to 44 per cent in 2007. In Cambodia, it increased from 37 per centto 50 per cent, and in Uzbekistan, from 3 per cent to 31 per cent70. Significant progress has occurredin the prevention and treatment of HIV induced malaria and tuberculosis.
3.3.2. NATURAL DISASTERS
Natural disasters such as floods, droughts, storms, earthquakes, volcanic eruptions and relatedTsunamis have grave consequences71. The after-effects are enormous in terms of lost lives, decline inincome, and physical damage to infrastructure and private assets. In the absence of insurance andfinancial markets, the rural households face even greater risks. While it is difficult to generalize, hereagain women often bear the brunt of such disasters. For instance, only one woman for every three mensurvived the December 2004 Tsunami in a district in Aceh (Indonesia). In two other districts, womenaccounted for 77 and 80 per cent of the deaths72. Women’s deaths also outnumbered men’s in the
67 Li et al., 2005; Yan et al., 2006; Ding et al., 2008.68 Nielsen, 1998.69 UN, 2010.70 UN, 2010.71 Extreme weather conditions pose a major threat to food and livelihood security in Asia and the Pacific region.For instance, 23 million hectares are drought prone representing one fifth of the rice growing area in the region(Pandey and Bhandari, 2009).72 Oxfam, 2005.
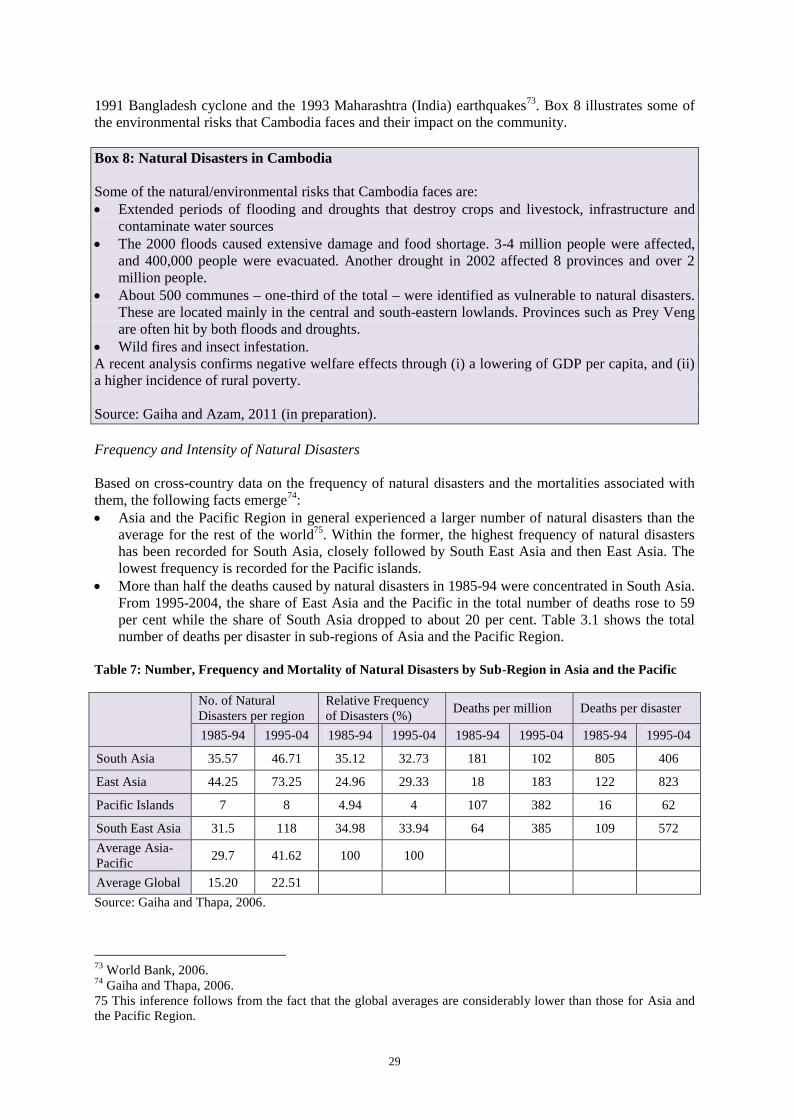
29
1991 Bangladesh cyclone and the 1993 Maharashtra (India) earthquakes73. Box 8 illustrates some ofthe environmental risks that Cambodia faces and their impact on the community.
Box 8: Natural Disasters in Cambodia
Some of the natural/environmental risks that Cambodia faces are: Extended periods of flooding and droughts that destroy crops and livestock, infrastructure and
contaminate water sources The 2000 floods caused extensive damage and food shortage. 3-4 million people were affected,
and 400,000 people were evacuated. Another drought in 2002 affected 8 provinces and over 2million people.
About 500 communes – one-third of the total – were identified as vulnerable to natural disasters.These are located mainly in the central and south-eastern lowlands. Provinces such as Prey Vengare often hit by both floods and droughts.
Wild fires and insect infestation.A recent analysis confirms negative welfare effects through (i) a lowering of GDP per capita, and (ii)a higher incidence of rural poverty.
Source: Gaiha and Azam, 2011 (in preparation).
Frequency and Intensity of Natural Disasters
Based on cross-country data on the frequency of natural disasters and the mortalities associated withthem, the following facts emerge74: Asia and the Pacific Region in general experienced a larger number of natural disasters than the
average for the rest of the world75. Within the former, the highest frequency of natural disastershas been recorded for South Asia, closely followed by South East Asia and then East Asia. Thelowest frequency is recorded for the Pacific islands.
More than half the deaths caused by natural disasters in 1985-94 were concentrated in South Asia.From 1995-2004, the share of East Asia and the Pacific in the total number of deaths rose to 59per cent while the share of South Asia dropped to about 20 per cent. Table 3.1 shows the totalnumber of deaths per disaster in sub-regions of Asia and the Pacific Region.
Table 7: Number, Frequency and Mortality of Natural Disasters by Sub-Region in Asia and the Pacific
No. of NaturalDisasters per region
Relative Frequencyof Disasters (%)
Deaths per million Deaths per disaster
1985-94 1995-04 1985-94 1995-04 1985-94 1995-04 1985-94 1995-04
South Asia 35.57 46.71 35.12 32.73 181 102 805 406
East Asia 44.25 73.25 24.96 29.33 18 183 122 823
Pacific Islands 7 8 4.94 4 107 382 16 62
South East Asia 31.5 118 34.98 33.94 64 385 109 572
Average Asia-Pacific
29.7 41.62 100 100
Average Global 15.20 22.51
Source: Gaiha and Thapa, 2006.
73 World Bank, 2006.74 Gaiha and Thapa, 2006.75 This inference follows from the fact that the global averages are considerably lower than those for Asia andthe Pacific Region.
30
Natural Disasters, Agricultural Investment, Productivity and Rural Poverty
Natural disasters affect household welfare in three distinct ways: loss of physical integrity, assets andincome. Disasters not only create instant havoc, but also have long lasting effects, by adverselyaffecting investment potential in agriculture and infrastructure. For instance, small reductions in thefrequency of natural disasters (i.e. 5 per cent) produced highly favourable effects on agriculturalinvestment in Pakistan, Korea and the Philippines. Further, small to moderate increases in agriculturalinvestments are likely to translate into higher agricultural productivity. Simulations show that a 5 percent increase in agricultural investment would stimulate a rise of about 7-8 per cent in agriculturalproductivity in Pakistan, the Philippines and Indonesia; and of about 6 per cent in Sri Lanka andKorea76. Given that investment in agriculture decreases after a natural disaster, rural poverty is likelyto increase after such an event. Examples include: In the wake of the financial crisis in East Asia in the last quarter of 1997, the Philippines economy
contracted. An additional factor was the worst drought in 30 years caused by the El Nino inSeptember, 1997. As a result, the incidence of poverty rose by 9 per cent, the depth of poverty by11 per cent, and the severity of poverty by 13 per cent77. However, not all households wereequally vulnerable to these shocks. While landownership made them more vulnerable to the ElNino shock, higher levels of education made them more susceptible to labour market shocks.
Bangladesh was hit by one of the worst floods in 1998. Severe damage to the aman monsoon ricecrop threatened the food security of several households. Lower consumption and a worsening ofthe health environment caused the nutritional status of children to deteriorate. Despite effectiveinterventions by the government, flood-victims suffered in the short-term through reducedconsumption and, in the medium-term, through higher indebtedness78.
The Indian Ocean Tsunami that struck more than a dozen countries in December, 2004, killedover 250,000 people. Millions more lost homes and livelihoods. The costs of the Tsunami havebeen massive –Indonesia suffered damages worth $2.9 billion and an initial reduction ineconomic activity of $1.53 billion.
3.3.3. LAND TENURE INSECURITY
Land Acquisition in Asia and the Pacific
One of the effects of the food crisis is the acquisition of farmland in developing countries by foreigninvestors, driven by the prospects of expanding agribusiness. In addition, urbanization and intensecompetition for agricultural land for setting up of industries has also aggravated the problem of landinsecurity for farmers, specially the smallholders79. While these acquisitions have the potential toinject investment into agriculture and rural areas in poor developing countries, they raise concernsabout the impact on poor local people, who risk losing access to and control over land on which theydepend. The problem is exacerbated when the smallholders whose land is acquired by foreigninvestors have no formal title to the land, but have been using it under customary tenurearrangements. Examples include: Cambodia has taken proactive steps to lure countries to invest in its farmlands. Qatar, United
Arab Emirates and BKK Partners, an Australian financial advisory firm, are some acquirers ofCambodian land.
Bahrain too signed an agreement with the Philippines government in 2009 whereby the latter willprovide 10,000 hectares of fertile land. A South Korean company has leased 94,000 hectares of
76 Gaiha and Thapa, 2006a.77 Datt and Hoogeveen, 2003.78 Del Ninno and Lundberg, 2005.79 For instance, the policy of promoting special economic zones (SEZs) in India has also led to land acquisition.Concerns have been expressed on the displacement of farmers by land acquisition, loss of fertile agriculturalland, a huge revenue loss to the exchequer and adverse consequences of uneven growth (Aggarwal, 2006, Gaihaet al., 2009).
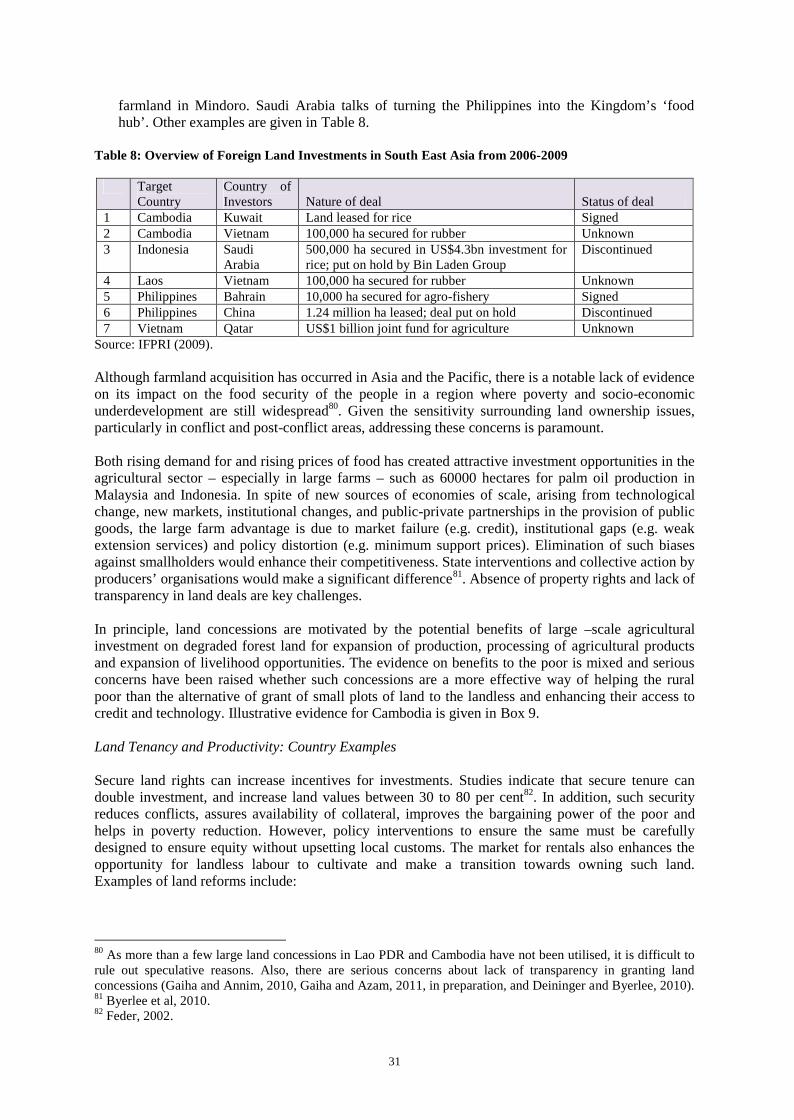
31
farmland in Mindoro. Saudi Arabia talks of turning the Philippines into the Kingdom’s ‘foodhub’. Other examples are given in Table 8.
Table 8: Overview of Foreign Land Investments in South East Asia from 2006-2009
TargetCountry
Country ofInvestors Nature of deal Status of deal
1 Cambodia Kuwait Land leased for rice Signed2 Cambodia Vietnam 100,000 ha secured for rubber Unknown3 Indonesia Saudi
Arabia500,000 ha secured in US$4.3bn investment forrice; put on hold by Bin Laden Group
Discontinued
4 Laos Vietnam 100,000 ha secured for rubber Unknown5 Philippines Bahrain 10,000 ha secured for agro-fishery Signed6 Philippines China 1.24 million ha leased; deal put on hold Discontinued7 Vietnam Qatar US$1 billion joint fund for agriculture Unknown
Source: IFPRI (2009).
Although farmland acquisition has occurred in Asia and the Pacific, there is a notable lack of evidenceon its impact on the food security of the people in a region where poverty and socio-economicunderdevelopment are still widespread80. Given the sensitivity surrounding land ownership issues,particularly in conflict and post-conflict areas, addressing these concerns is paramount.
Both rising demand for and rising prices of food has created attractive investment opportunities in theagricultural sector – especially in large farms – such as 60000 hectares for palm oil production inMalaysia and Indonesia. In spite of new sources of economies of scale, arising from technologicalchange, new markets, institutional changes, and public-private partnerships in the provision of publicgoods, the large farm advantage is due to market failure (e.g. credit), institutional gaps (e.g. weakextension services) and policy distortion (e.g. minimum support prices). Elimination of such biasesagainst smallholders would enhance their competitiveness. State interventions and collective action byproducers’ organisations would make a significant difference81. Absence of property rights and lack oftransparency in land deals are key challenges.
In principle, land concessions are motivated by the potential benefits of large –scale agriculturalinvestment on degraded forest land for expansion of production, processing of agricultural productsand expansion of livelihood opportunities. The evidence on benefits to the poor is mixed and seriousconcerns have been raised whether such concessions are a more effective way of helping the ruralpoor than the alternative of grant of small plots of land to the landless and enhancing their access tocredit and technology. Illustrative evidence for Cambodia is given in Box 9.
Land Tenancy and Productivity: Country Examples
Secure land rights can increase incentives for investments. Studies indicate that secure tenure candouble investment, and increase land values between 30 to 80 per cent82. In addition, such securityreduces conflicts, assures availability of collateral, improves the bargaining power of the poor andhelps in poverty reduction. However, policy interventions to ensure the same must be carefullydesigned to ensure equity without upsetting local customs. The market for rentals also enhances theopportunity for landless labour to cultivate and make a transition towards owning such land.Examples of land reforms include:
80 As more than a few large land concessions in Lao PDR and Cambodia have not been utilised, it is difficult torule out speculative reasons. Also, there are serious concerns about lack of transparency in granting landconcessions (Gaiha and Annim, 2010, Gaiha and Azam, 2011, in preparation, and Deininger and Byerlee, 2010).81 Byerlee et al, 2010.82 Feder, 2002.
32
China adopted the Household Responsibility System in 1978 which led to a surge in agriculturalproduction. Consequently, despite a decrease in the area used, agricultural output increased by 8.2per cent a year (2.7 percent in the pre-reform period).
Vietnam, Laos and Cambodia abandoned collectivization and framed new land laws. In Vietnam,for instance, under the Doi Moi reforms, agricultural collectives were converted to contract landto households in 198883. Land reforms, in addition to other market-oriented reforms, promotedentrepreneurship, agricultural investment and productivity. Tenancy reforms also created anactive land market in the country, with the proportion of households participating in landtransactions increasing from 3.8 per cent in 1993 to 15.5 per cent in 199884.
In India, tenancy and institutional reforms have been positively correlated with increases inagricultural growth and reduction in poverty, higher real wages, reduced landlessness andimproved social development85.
Box 9: Land Concessions in Rural Cambodia
In the case of Cambodia, the evidence on the benefits of land concessions to the poor is mixed andserious concerns have been raised whether such concessions are a more effective way of helping therural poor than the alternative of grant of small plots of land to the landless and enhancing their accessto credit and technology (CEA, November, 2009, Naron, 2009, and ADB, 2009). Going by the officialrecords, there are 60 companies that have been awarded economic land concessions, involving a totalland area of 1 million ha. Most of these are in non-flooded areas and degraded forests, and cover arange of crops such as rubber, palm oil, sugar cane, cashew, coffee, and forest plantations. Most ofthese land concessions are frequently disputed and remain unresolved for long periods, resulting inoverlapping land claims of local villagers and the affluent. These land disputes are a result of weakand patchy environmental impact assessment, inefficient implementation of business plans, fewerinstances of consultation with the local communities prior to the approvals, and, finally, the disruptionof traditional livelihoods of the disadvantaged indigenous groups living in remote areas.
The reservoir rice cultivation in the plains of the Tonle Sap Lake yielded substantial benefits to thelocal community – including the poor. In one district, the reservoir owners recorded high returnsamounting to 92 per cent of the reservoir investment cost in one year. On rented farms, the tenantsmade an attractive profit, $285 per ha. However, in late 2008-2009, as prices crashed, and yieldsdecreased, 80 per cent incurred large losses, $245 per ha. High fertiliser costs, rents and interest tobuy fertiliser were the main reasons why barely 10 per cent of the surveyed households had rented therice fields for the following year. In another case, for the investment project of Sofcin-KCD, land wascleared without prior notice resulting in conflicts and violence. Subsequently, the company agreed tooffer compensation, at the direction of the Land Conflict Resolution Committee, in both cash and landexchange. By contrast, the Dak Lal Company negotiated with land owners before developing the landfor rubber plantations (50 per cent agreed upon). On the villagers’ share of land (remaining 50 percent), the company developed the land and planted rubber trees, and trained them on how to take careof them. People can harvest the rubber latex in 7 years and sell it to the company at a guaranteed priceof 80 per cent of the international price. This model that allows large and small individual plantationsto coexist evoked enthusiastic support from the villagers.
These cases have important policy implications: (i) granted concession should not overlap with localpeople’s land; (ii) land reserves for exchange should be cultivable and not far from the village; (iii)better understanding of options offered and freedom to choose; and (iv) above all, monitoring andregulation of land concessions strictly in accordance with agricultural priorities.
Source: Gaiha and Azam, 2011, in preparation.
83 Kirk and Nguyen, 2009.84 Thapa, 2009.85 Srivastava, 2004, and Deininger et al., 2009.
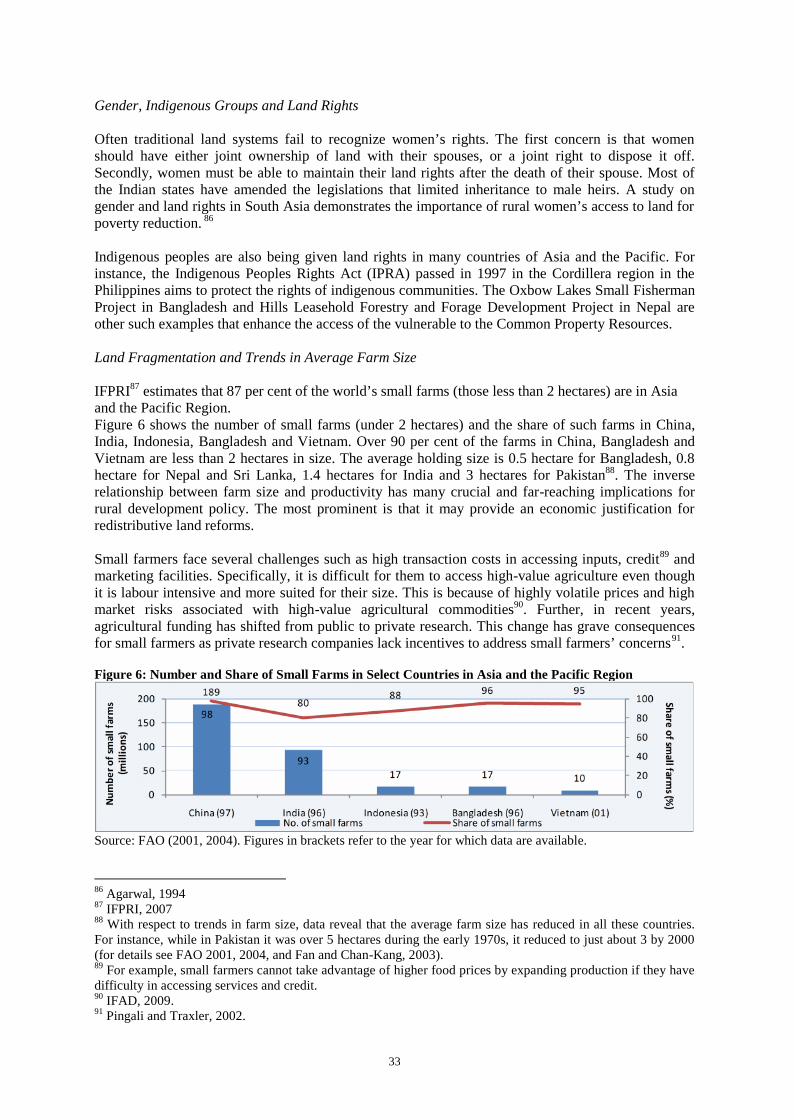
33
Gender, Indigenous Groups and Land Rights
Often traditional land systems fail to recognize women’s rights. The first concern is that womenshould have either joint ownership of land with their spouses, or a joint right to dispose it off.Secondly, women must be able to maintain their land rights after the death of their spouse. Most ofthe Indian states have amended the legislations that limited inheritance to male heirs. A study ongender and land rights in South Asia demonstrates the importance of rural women’s access to land forpoverty reduction. 86
Indigenous peoples are also being given land rights in many countries of Asia and the Pacific. Forinstance, the Indigenous Peoples Rights Act (IPRA) passed in 1997 in the Cordillera region in thePhilippines aims to protect the rights of indigenous communities. The Oxbow Lakes Small FishermanProject in Bangladesh and Hills Leasehold Forestry and Forage Development Project in Nepal areother such examples that enhance the access of the vulnerable to the Common Property Resources.
Land Fragmentation and Trends in Average Farm Size
IFPRI87 estimates that 87 per cent of the world’s small farms (those less than 2 hectares) are in Asiaand the Pacific Region.Figure 6 shows the number of small farms (under 2 hectares) and the share of such farms in China,India, Indonesia, Bangladesh and Vietnam. Over 90 per cent of the farms in China, Bangladesh andVietnam are less than 2 hectares in size. The average holding size is 0.5 hectare for Bangladesh, 0.8hectare for Nepal and Sri Lanka, 1.4 hectares for India and 3 hectares for Pakistan88. The inverserelationship between farm size and productivity has many crucial and far-reaching implications forrural development policy. The most prominent is that it may provide an economic justification forredistributive land reforms.
Small farmers face several challenges such as high transaction costs in accessing inputs, credit89 andmarketing facilities. Specifically, it is difficult for them to access high-value agriculture even thoughit is labour intensive and more suited for their size. This is because of highly volatile prices and highmarket risks associated with high-value agricultural commodities90. Further, in recent years,agricultural funding has shifted from public to private research. This change has grave consequencesfor small farmers as private research companies lack incentives to address small farmers’ concerns91.
Figure 6: Number and Share of Small Farms in Select Countries in Asia and the Pacific Region189
9317 17 10
9880
88 96 95
0
20
40
60
80
100
0
50
100
150
200
China (97) India (96) Indonesia (93) Bangladesh (96) Vietnam (01)
Share of sm
al l farm
s (%
)Nu
mb
er
of s
ma
l l f
arm
s(m
il l
ion
s )
No. of small farms Share of small farms
Source: FAO (2001, 2004). Figures in brackets refer to the year for which data are available.
86 Agarwal, 199487 IFPRI, 200788 With respect to trends in farm size, data reveal that the average farm size has reduced in all these countries.For instance, while in Pakistan it was over 5 hectares during the early 1970s, it reduced to just about 3 by 2000(for details see FAO 2001, 2004, and Fan and Chan-Kang, 2003).89 For example, small farmers cannot take advantage of higher food prices by expanding production if they havedifficulty in accessing services and credit.90 IFAD, 2009.91 Pingali and Traxler, 2002.
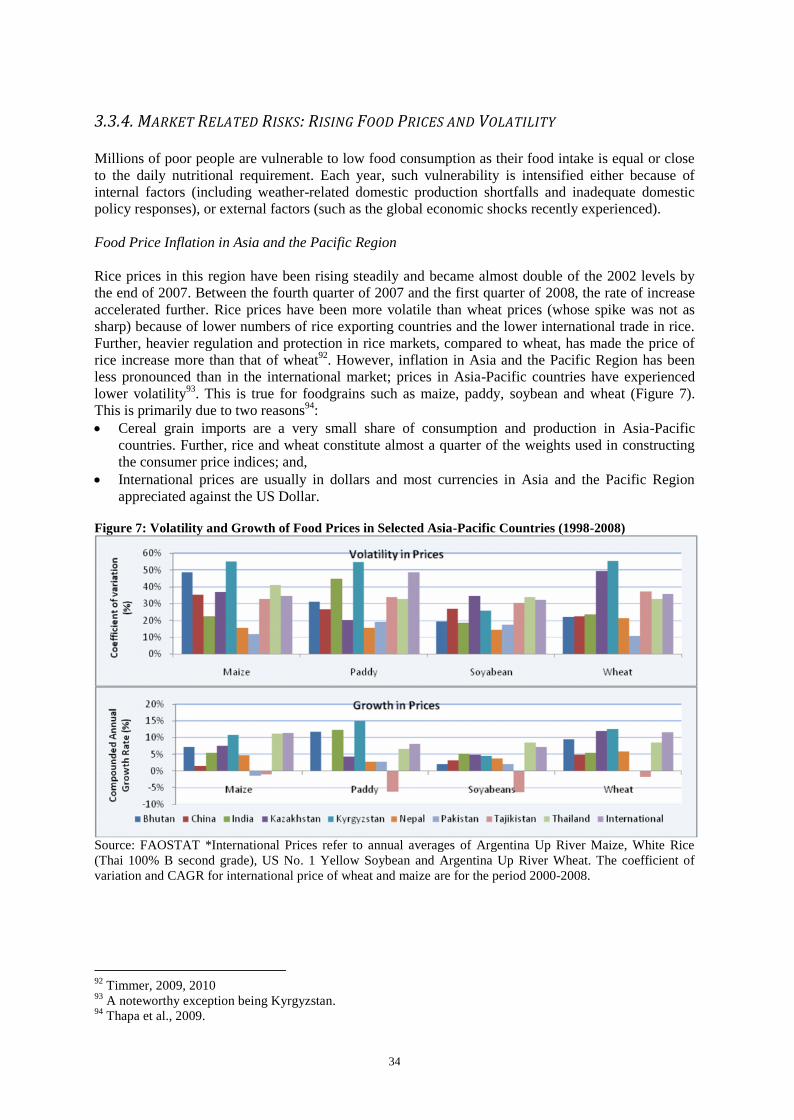
34
3.3.4. MARKET RELATED RISKS: RISING FOOD PRICES AND VOLATILITY
Millions of poor people are vulnerable to low food consumption as their food intake is equal or closeto the daily nutritional requirement. Each year, such vulnerability is intensified either because ofinternal factors (including weather-related domestic production shortfalls and inadequate domesticpolicy responses), or external factors (such as the global economic shocks recently experienced).
Food Price Inflation in Asia and the Pacific Region
Rice prices in this region have been rising steadily and became almost double of the 2002 levels bythe end of 2007. Between the fourth quarter of 2007 and the first quarter of 2008, the rate of increaseaccelerated further. Rice prices have been more volatile than wheat prices (whose spike was not assharp) because of lower numbers of rice exporting countries and the lower international trade in rice.Further, heavier regulation and protection in rice markets, compared to wheat, has made the price ofrice increase more than that of wheat92. However, inflation in Asia and the Pacific Region has beenless pronounced than in the international market; prices in Asia-Pacific countries have experiencedlower volatility93. This is true for foodgrains such as maize, paddy, soybean and wheat (Figure 7).This is primarily due to two reasons94: Cereal grain imports are a very small share of consumption and production in Asia-Pacific
countries. Further, rice and wheat constitute almost a quarter of the weights used in constructingthe consumer price indices; and,
International prices are usually in dollars and most currencies in Asia and the Pacific Regionappreciated against the US Dollar.
Figure 7: Volatility and Growth of Food Prices in Selected Asia-Pacific Countries (1998-2008)
Source: FAOSTAT *International Prices refer to annual averages of Argentina Up River Maize, White Rice(Thai 100% B second grade), US No. 1 Yellow Soybean and Argentina Up River Wheat. The coefficient ofvariation and CAGR for international price of wheat and maize are for the period 2000-2008.
92 Timmer, 2009, 201093 A noteworthy exception being Kyrgyzstan.94 Thapa et al., 2009.
35
Causes and ImpactCauses: Though rising food prices are associated with tightening supplies, other factors have alsobeen at work. One such factor is the deep integration between agricultural commodity markets andother markets in the world. For instance, rising crude oil prices have led to an increase in agricultureprices in two ways: rising inputs costs (such as oil-based fertilizers and transportation), and increaseddemand for agricultural crops for alternate energy sources such as biofuels95. Change in dietarypatterns towards high-value agricultural products, such as fruits, vegetable and dairy products, andmeat, has also caused agflation. For instance, from 1990-2006, China saw an increase in theconsumption of meat, fish and aquatic products, and fruits – especially in the rural areas. In India too,from 1990-2005, the consumption of oil crops, meat, fish, milk, fruits and vegetables increased96.Natural factors such as flooding in South Asia and outbreak of brown planthopper infestation inVietnam contributed to rising food prices. Speculation and hoarding further fuelled the price rise.
There is a high degree of correlation between food and oil prices, as can be seen from Figure 8. Theprices of food, cereals and dairy products are highly correlated with the oil prices. The relationshipbetween meat prices and oil prices, and between sugar and oil prices, is, however, found to be weak.The increases in oil prices in the last few months are a result of both shortages and rising demand,particularly from the industrial sector in China.
Food prices have been rising substantially the world over since July 2010. After the peak in prices in2008, good harvests helped the prices to fall back. However, adverse weather conditions in severalfood exporting countries affected supplies. The rise in prices is not the same for all food commoditiesand all regions. For instance, the price of rice has not risen by much, and those countries which do notrely heavily on food imports are not severely hit. The volatility in prices is also the result of localizedweather problems, for instance, onion prices soared in India in the past few months following theunseasonal heavy rains. The FAO also points towards the role of speculators in exaggerating the rallyin food prices. Commodity derivatives are seen as an important portfolio hedging instrument since thereturns in commodity sector are uncorrelated with the returns on other assets. This financialisation ofcommodities may not be a source of food inflation; however, it does play an important role in theshort term volatility in food prices. High oil prices, strong demand for crops from the biofuel sector,depleting stockpiles of foodgrains and lower production are also responsible for the food price surge.Protectionist policies adopted by many exporting nations and expansionary monetary policies havealso played a role in rising food prices. Moreover, as markets are increasingly integrated, economicshocks in international markets get transmitted to domestic markets quickly.
95 Timmer, 2009.96 IFPRI, 2007a.
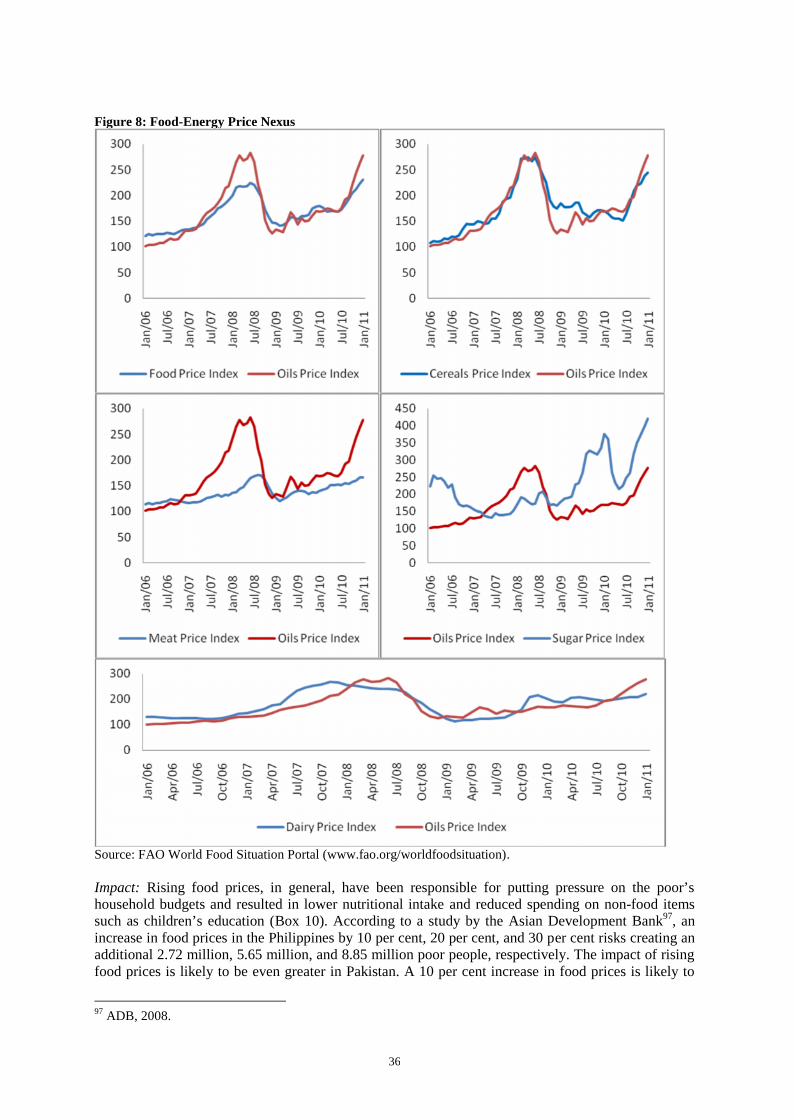
36
Figure 8: Food-Energy Price Nexus
Source: FAO World Food Situation Portal (www.fao.org/worldfoodsituation).
Impact: Rising food prices, in general, have been responsible for putting pressure on the poor’shousehold budgets and resulted in lower nutritional intake and reduced spending on non-food itemssuch as children’s education (Box 10). According to a study by the Asian Development Bank97, anincrease in food prices in the Philippines by 10 per cent, 20 per cent, and 30 per cent risks creating anadditional 2.72 million, 5.65 million, and 8.85 million poor people, respectively. The impact of risingfood prices is likely to be even greater in Pakistan. A 10 per cent increase in food prices is likely to
97 ADB, 2008.
37
result in an additional 7.05 million poor people. In case of a 20 per cent and 30 per cent increase, theincrement in the number of poor people would be 14.67 million and 21.96 million, respectively.However, the impact of rising food prices is rather uneven. It depends on the following98: whether the country is a net importer or exporter of food. Net importers are likely to face more
adverse consequences than net exporters of food; within countries, the poor are more likely to be impacted depending on the proportion of their
household expenditure on food; and whether the household is a net buyer or a net seller of food.
Box 10: Food Price Hike and Coping Strategies: A Case Study of Nepal
Food Price Hike: 2008 was a year marked by unprecedented food price increases across the country.At peak prices, that of rice increased by 24 per cent, of oil by 30 per cent, of wheat flour by 18 percent, and of musuro (lentil) by 40 per cent, compared to 2007. The official y-o-y inflation rate forfood and beverages was nearly 17 per cent (compared to 7.1 percent in 2007 and 9.5 per cent inIndia). The most affected group was 8 million Nepalese who were already living at or below thepoverty line. Going by the traders’ perception, banning of exports of non-basmati rice, wheat andlentils by India to Nepal was a significant factor (next only to fuel and transportation costs) that led tohigh prices. Natural disasters, including flooding and landslides in certain parts of Nepal blocked keymarket access roads. This increased prices in some districts and reduced prices in others. In addition,bandhs and strikes caused disruption in flow of foodgrains leading to high food prices. For example, a26 day transportation strike in the regional market of Dhangadi affected food supply to markets in theFar-West Hills and Mountains and resulted in complete depletion of stock in Sanfebagar market.Coping Strategies: With Nepalese households spending 67 per cent of their income on food, high foodprices shrank their food expenditure. In fact, for the extremely poor, the share of food expenditure waseven higher at 78 per cent. Understandably, changes in food prices led to altered consumptionpatterns. With over 80 per cent of households in Nepal being net consumers of agricultural produce,the increase in food prices impacted them adversely. 88 per cent of households experienced food priceincrease during the final quarter of 2008. For 78 per cent of the households purchasing food becamemore difficult. The most common coping strategies were: relying on less preferred foods (67 percent), reducing meal portions (29 per cent), reducing spending on non-food items (26 per cent), andreduced spending on food/ borrowing money for food purchasing (14 per cent). About 12 per cent ofthe households skipped food for a day!
Source: Abridged from WFP (2008), United Nations World Food Programme, Food SecurityMonitoring and Analysis System.
An interesting question that needs to be addressed is whether rising food prices are a threat to foodsecurity or an opportunity for smallholders? A study by Asian Development Bank99 shows that, forChina, the negative impact of food price inflation is dampened by the positive supply response in ruralareas. Since China is a net exporter of food, the households that depend on agriculture benefit fromthe rising global prices. The study confirms a decline in both poverty headcounts as well as Ginicoefficients of income inequality, as a result of food price rise. Another study by FAO100 shows that,as a result of a 10 per cent increase in the price of staple foods, urban consumers lose more than therural in Bangladesh, Pakistan and Vietnam. In Bangladesh, the average welfare of householdsspecializing in agricultural production increased by 1.7 per cent, while in Vietnam it increased by 2.3per cent. However, the poorest quintiles are the most affected in urban and rural areas. Even where therural households gain on average, the poorest continue to suffer a welfare loss.
98 Thapa et al., 2009.99 ADB, 2008a.100 FAO, 2008.
38
Policy responses to rising food prices
Various protective measures were taken by governments in response to increasing food prices. Forinstance, China eliminated export subsidies on foodgrains, Kazakhstan raised export taxes on wheat,Vietnam imposed quantitative restrictions on the export of wheat and India banned the export of non-basmati rice and wheat. On the other hand, food importing countries reduced tariffs, as in the case ofIndia (wheat), Indonesia (soybean and wheat) and Thailand (pork). These export restrictions andaggressive bidding for imports resulted in higher prices101. In addition, governments in these nationsintervened to protect consumers against the increase in food prices. In the Philippines, for instance,the fiscal cost of subsidized rice in 2008 is estimated to be P32.8 billion (with a purchase price ofP29.4/kg versus a selling price of P17.25/ kg). In 2008, Indonesia too budgeted an increase in foodsubsidies from Rp7.2 trillion to Rp19.8 trillion – an increase of 3 per cent of all governmentexpenditure102.
3.3.5. THE STATE AS A SOURCE OF RISK
A key source of vulnerability of the poor lies in the weak organisational design of publicadministration departments. In addition, lack of governance breeds corruption and inefficiency. TheForeign Policy and the Fund for Peace publishes the “failing state” index103. Out of the 177 countriesranked in 2007 Afghanistan was the 8th most failed state, Pakistan 12th, Bangladesh 16th, Nepal 21st,and Sri Lanka 25th.
In response to weak organisations of the state, several countries of Asia and the Pacific have adoptedpractices that use outside parties to help resolve disputes. Examples include: In Bangladesh, some NGOs have adopted the Ain-O-Salish Kendra to aid women and other
disadvantaged groups. Established in 1986, it investigates and monitors violations of law andhuman rights, including police torture, murder, violence against women and children, and deathsin garment factories.
The Cambodia Defenders Project, established in 1994, focuses on criminal defence andcommunity legal education. It collaborates with NGOs to provide legal services to women,especially in domestic violence cases. The Legal Aid Society of Cambodia works to increasepublic awareness of the law, while providing free legal services in criminal and civil cases. It isalso active in securing land rights for farmers who have been dislodged from their land bypowerful business interests104.
3.4. SOME INSTITUTIONAL RESPONSES TO RISK
To assist rural poor households to better manage risks, in addition to access to financial services theyneed the support of the community and from the state in the form of social protection.
3.4.1. COMMUNITY-LEVEL SUPPORT AND ACCESS TO FINANCIAL INSTITUTIONS
Rural poor households mitigate and manage risks by living in extended families, having cooperativelabour arrangements and/or by joining community-based poor people’s organisations. Communitylevel institutions have an important role to play in mitigating risks for rural people. India’s Self-Employed Women’s Association (SEWA) is one such institution which has successfully organisedwomen into unions, community-based organisations, self-help groups and cooperatives. It builds theirsolidarity and collective strength. Apart from providing economic opportunities for its members,
101 Thapa et al., 2009.102 ADB, 2008a.103 The index is based on twelve indicators (four social, two economic, and six political). While there is no hardand fast definition of a “failing state”, the index is nevertheless indicative of the extent of the state’s failure.Low rank means more failed.104 World Bank, 2001.
39
SEWA also provides social security services such as health care, child care, housing and insurance.The Bangladesh Rural Advancement Committee (BRAC) provides economic support to variousdisadvantaged groups – including the landless, women and fishermen – and assists them in education,health and family planning105. Another example is that of self-help groups in Narathiwat, Thailand,who manufacture batik and embroidered articles and, by fostering participation of all members,including women, have enhanced women’s status within the household and the community106.
Access to financial institutions also helps rural households in mitigating risks by getting credit, andsafeguarding and providing adequate return on their savings. In addition, financial institutions provideinsurance schemes covering life, health, accident and cattle. Microfinance is advocated and promotedby policy makers, development agencies, government officials and politicians as an effective anti-poverty intervention in the functions it performs and the potential it has to improve the livelihoods ofthe poor and the vulnerable107 and even empower them.
Microfinance contributes not only to poverty reduction and financial sustainability, but also to‘virtuous spirals’ of economic empowerment, increased well-being, and social and politicalempowerment of women, thereby addressing the goal of gender equity108. This may be identified andmeasured along various dimensions: impact on decision-making, self-confidence of women, theirstatus at home, domestic violence, their involvement in community, their political empowerment andrights109. For instance, in Nepal, women who participated in the MFI programme were able to makesmall purchases of necessary items such as groceries independently110. 68 per cent of womenexperienced an increase in their decision-making power in areas that were traditionally dominated bymen – family planning, daughter’s marriage, their schooling and buying and selling property111. In thePhilippines, women clients of Opportunity Microfinance Bank have gained leadership experience andconfidence as leaders of their Trust Banks and have been elected as leaders112. However, the negativeaspects of lending to women cannot be ignored. For instance, findings from Bangladesh showed that,although the benefits of loans accrued to men and other household members, the responsibility andaccountability for repaying the loans lay with the women clients, and this increased their stress anddependency113. Others have argued that such loans hardly pull women and their households out ofpoverty114 since women may often borrow from other sources to pay back loans, leading toindebtedness. When women borrow for themselves, they lack the means to repay because theygenerally invest in existing activities that are low profit and insecure115. Microfinance has beeneffective in increasing incomes and assets, although not in the poorest households. Women tend tospend income, when they do control it, on household consumption and ‘security-related assets’ suchas homestead land, whereas male borrowers are more likely to invest in further productiveactivities116.
To enhance the efficiency and sustainability of MFIs while ensuring gender equality andempowerment, it is important that women’s activities, strategies, priorities and challenges areunderstood and valued. There is a need to include women in designing plans through participatoryresearch programmes; integrate gender in core group mobilization for savings and credit; give accessto women in non-financial services such as involving them in the application process; recognize
105 However, local institutions can do little when shocks are macro in nature. In such cases, the governments anddonors need to give support to such organisations to address market and environment related risks.106 Kay, 2003.107 Kulkarni, 2010.108 Mayoux and Hartl, 2009.109 Cheston and Kuhn, 2002.110 Shreshtha, 1998.111 Ashe and Parott, 2002.112 Cheston and Kuhn, 2002.113 Kabeer, 1998; Goetz and Gupta, 1996; Rahman, 1999; Todd, 1996.114 Fisher and Sriram, 2002.115 Mayoux, 2006.116 Kabeer, 1998.
40
women’s talents and give them loans of amounts that would help them expand business and increaseits quality by enabling them to purchase superior equipment and materials; include women in valueand supply chains so as to promote markets for services used by women; and provide smaller loans,with quick returns and targeted for productive activity, and make savings and services available inlocations women frequently access.117
The critical factors for successful pro-poor interventions by financial institutions include adequatereach and coverage of the target group, availability of a large variety of services, low transactioncosts, continued access to services over a long period of time and sustainability of the institution withminimum support from non-users or tax payers. Examples include: Under P4K, a credit project for small farmers and fishermen in Indonesia, the very poor formed
around 50,000 small groups. They were provided credit from the government owned Bank RakyatIndonesia. However, the credit turned out to be inadequate and timely availability was notassured. Later, the women in marginal areas transformed these small groups into larger self-reliantsavings and credit associations. Similarly, The Centre for Agriculture and Rural Development(CARD) in the Philippines changed from an unsustainable credit NGO to a viable rural bank withrapidly growing outreach to very poor women.
In Pakistan, the Dir Area Support Project introduced a new system of Islamic Microfinance orMurabaha which was in line with Islamic banking principles. Instead of interest-based lendingwhich is prohibited under Islam, under a Murabaha, the bank and the customer enter into a salepurchase agreement.
In India, self-help groups are the backbone of microfinance services. The number of self-helpgroups linked to banks has increased from about 500 in the early 1990s to more than 3 million in2008118. In addition, some village self-help groups (SHGs) have also set up a fund that providesemergency loans for members to obtain health care services.
In Nepal, small farmer cooperatives offer tailor made agricultural and non agricultural loans,savings and insurance products to poor farmers. For instance, one cooperative in Anandvanextends rickshaw loans to the landless. Similarly, a cooperative in Bhumistan offers loans forpurchase of buffaloes.
The women’s development component of GTZ’s Tangail Infrastructure Development Project(TIDP) in Bangladesh has successfully enabled very poor and previously destitute women toincrease their livelihood security. Grameen Bank of Bangladesh has also played an important rolein mitigating risks of rural poor.
Weather index-based insurance is usually offered to small farmers through their cooperative, inputdealer, a microfinance institution or bank and can help mitigate the weather risks that they cannotmanage. Weather index insurance was first piloted in India in 2003. In the first five years of itsentry, the private sector has cumulatively covered more than 400000 farmers against a range ofweather risks. However, to widely expand index insurance, governments and donors need to playa proactive role119.
3.4.2. SOCIAL PROTECTION
Following the food price crisis and the global slowdown in the wake of the financial crisis, there isheightened interest by policy makers in new approaches and programmes to provide social protectionto the citizens. Examples of social protection are given below. The National Solidarity Programme is a community driven initiative in Afghanistan. Introduced
in 1993, it aims at empowering communities to take decisions and manage resources during theproject cycle. Community development councils are elected and decide on development projects.It has been successful in creating a mechanism of governance and decision-making at the locallevel. The National Emergency Employment Programme for Rural Access (NEEPRA) in
117 Mayoux and Hartl, 2009.118 IFAD, 2009a.119 IFAD and WFP, 2010.
41
Afghanistan helps supply jobs in road improvement. The main beneficiaries of the project are therural poor who receive access to basic services and rural employment. A similar programme isthat of Food for Work that provides food to Afghans while building or repairing communityassets, including roads, bridges, schools, reservoirs and irrigation systems120.
The conditional cash transfer schemes provide cash to poor households subject to fulfillingminimum requirements such as school attendance and participation in immunization programmes.The schemes induce the households to increase their consumption of merit goods. For instance,the Food for Education scheme, introduced in Bangladesh in 1993, intends to build long-termhuman capital among poor families by distributing free rice and rationed wheat monthly toencourage them to send their children to school121. This programme was later changed to thePrimary Education Stipend Programme where conditional cash transfers were provided tofamilies of school going children122.
The National Rural Employment Guarantee Scheme (NREGS) in India guarantees one hundreddays of employment in every financial year to adult members of any rural household willing to dounskilled manual work at the statutory minimum wage. India has also proposed a Right to FoodBill, which stipulates 35 kg of cereal (wheat or rice) at a highly subsidised price per month perfamily.
3.5. KEY MESSAGES
First, rural households in Asia and the Pacific Region face substantial idiosyncratic and covariantrisks, resulting in high income volatility. As a result, loss of livelihood or income and liquidation ofassets are often widespread.
Second, though developing countries bear the brunt of natural disasters, they are unable to insurethemselves against these. A challenge for development assistance is to combine speedy relief withreconstruction.
Third, although the effects of the food price crisis varied in this region, some of the poorest countrieswere the worst hit. Recent upsurge in food price and its synchronicity with energy price have raisedthe spectre of another crisis in the making. Corrective measures include supply augmentation, tradeexpansion and cushioning the poor against food price spikes.
Fourth, as a consequence of high food prices and rising demand for food, there has been aproliferation of large-scale acquisitions of farmland in Central Asia and South East Asia. Whetherintense competition for land will offer a long-term solution to food security remains debatable, as alsothe fate of smallholders. Elimination of biases against smallholders and protection of property rightsof indigenous peoples would enhance their welfare.
Fifth, addressing risks in the context of rural growth and poverty reduction requires a multi-prongedstrategy. Institutional responses to risks need to be strengthened by promoting community levelinstitutions; widening and deepening the reach of financial institutions; and providing socialprotection to the most vulnerable. When designed well and targeted effectively, theseinstitutions/programmes help poor households build resilience against risks and severe hardships.
120 UNICEF, 2009.121 Similarly, under the Dhanalakshmi scheme in India, cash transfers are given to a family of girl child onfulfilling conditions such as registration of birth, immunization, enrolment and retention at school.122 UNICEF, 2009.
42
CHAPTER 4: AGRICULTURAL MARKETS FOR INCREASED
INCOME
4.1. INTRODUCTION
Agricultural households operate both as producers and consumers. While many of them are ‘netbuyers’ of food and sellers of labour, some are producers and others perform more than one activity.All of them need access to markets in order to get high returns on their resources of land, labour andcapital, including human capital. Rural households with assets, non-farm income, and occupyingfavourable locations (irrigated regions with good infrastructure) have better access to markets thanthose who do not have one or more of these characteristics. When output prices rise, the latter are notable to take advantage either because they do not have enough surpluses to sell or easy access tomarket. The major issue, therefore, is how to make agricultural activities profitable for smallholdersand those located in unfavourable agro-climatic regions.
4.2. WHY AGRICULTURAL MARKETS MATTER TO RURAL POOR?
Recent developments such as liberalization of merchandise trade, volatile food and energy prices,climate change and importance attached to preservation of natural resources have imposed heavycosts, risk and uncertainty on the farming community of developing countries, especially thesmallholders who also suffer from financial exclusion. They face a number of constraints (such asvolatile prices and high market risk because of perishable nature of commodities, e.g. fruits andvegetables) and fragmented markets123 in accessing high-value agriculture even though it is labourintensive and more suited for them. Further, until recently, in view of the declining average size offarm holdings in the developing world of Asia and the Pacific, especially South Asia, farming was notan attractive commercial proposition for the rural youth. With the surge in food prices in 2007-08, andagain in recent months, agriculture has begun attracting large private investments.
An interesting feature of agricultural markets in developing countries is that multiplechannels/intermediaries exist between the farmer and the retailer. At each level of intermediary, costmark up is done for the activities they perform. The long list of intermediaries can be seen for themarketing system of rice in Cambodia (Figure 9) and the share of margin of profit accruing to each ofthe intermediaries. The vertical bar shows the price (farm gate price + activity cost + profit) atdifferent levels of intermediaries. The horizontal bars indicate the cost and profit for thecorresponding intermediary. The gap between the retail price and the farm gate price is as high asmore than 37 per cent, of which more than one-half is the component of profit that goes to differentintermediaries such as wholesaler (35 per cent), miller (28 per cent), retailer (25 per cent), transporter(11 per cent), and collector (1 per cent). The wholesalers and others in the chain of intermediariesmake good profits, mainly because of lack of competition among buyers. The intermediaries/tradershave limited access to credit and most of them run their business with own small working capital andbear risk in the process. Improving marketing efficiency would help reduce risk of intermediaries aswell as transaction cost, including transport cost.
123 Thapa, 2009.
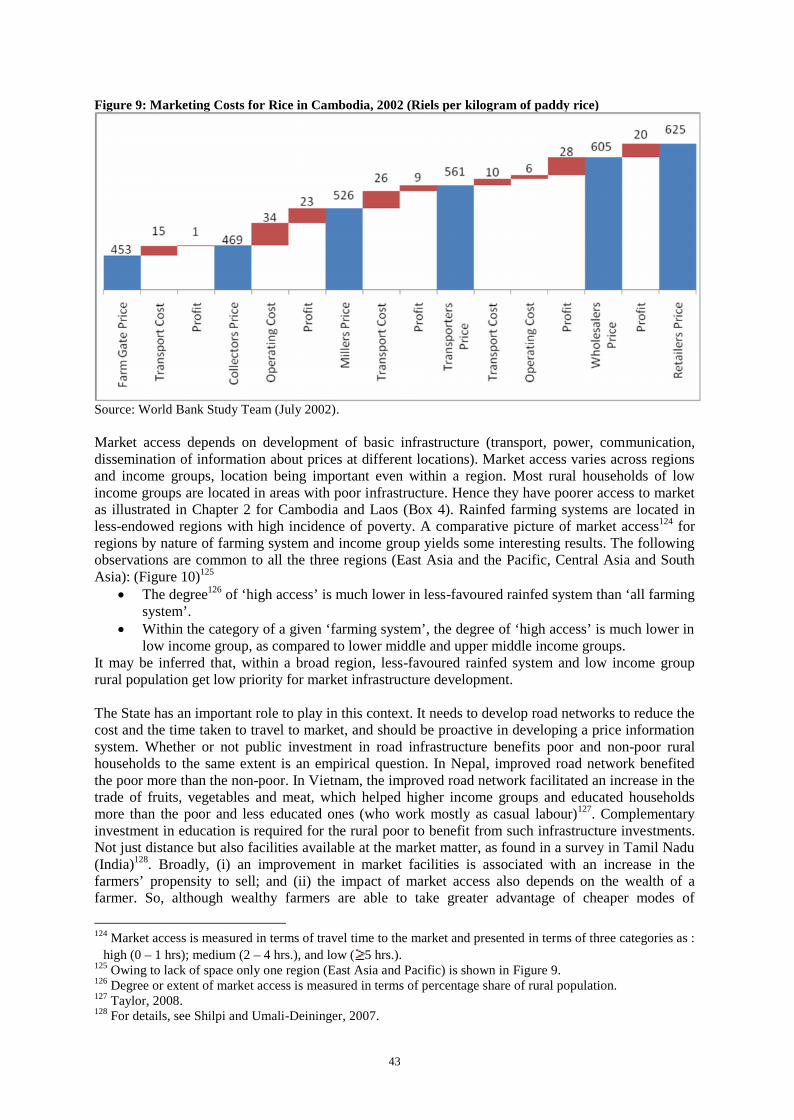
43
Figure 9: Marketing Costs for Rice in Cambodia, 2002 (Riels per kilogram of paddy rice)
Source: World Bank Study Team (July 2002).
Market access depends on development of basic infrastructure (transport, power, communication,dissemination of information about prices at different locations). Market access varies across regionsand income groups, location being important even within a region. Most rural households of lowincome groups are located in areas with poor infrastructure. Hence they have poorer access to marketas illustrated in Chapter 2 for Cambodia and Laos (Box 4). Rainfed farming systems are located inless-endowed regions with high incidence of poverty. A comparative picture of market access124 forregions by nature of farming system and income group yields some interesting results. The followingobservations are common to all the three regions (East Asia and the Pacific, Central Asia and SouthAsia): (Figure 10)125
The degree126 of ‘high access’ is much lower in less-favoured rainfed system than ‘all farmingsystem’.
Within the category of a given ‘farming system’, the degree of ‘high access’ is much lower inlow income group, as compared to lower middle and upper middle income groups.
It may be inferred that, within a broad region, less-favoured rainfed system and low income grouprural population get low priority for market infrastructure development.
The State has an important role to play in this context. It needs to develop road networks to reduce thecost and the time taken to travel to market, and should be proactive in developing a price informationsystem. Whether or not public investment in road infrastructure benefits poor and non-poor ruralhouseholds to the same extent is an empirical question. In Nepal, improved road network benefitedthe poor more than the non-poor. In Vietnam, the improved road network facilitated an increase in thetrade of fruits, vegetables and meat, which helped higher income groups and educated householdsmore than the poor and less educated ones (who work mostly as casual labour)127. Complementaryinvestment in education is required for the rural poor to benefit from such infrastructure investments.Not just distance but also facilities available at the market matter, as found in a survey in Tamil Nadu(India)128. Broadly, (i) an improvement in market facilities is associated with an increase in thefarmers’ propensity to sell; and (ii) the impact of market access also depends on the wealth of afarmer. So, although wealthy farmers are able to take greater advantage of cheaper modes of
124 Market access is measured in terms of travel time to the market and presented in terms of three categories as :high (0 – 1 hrs); medium (2 – 4 hrs.), and low ( 5 hrs.).
125 Owing to lack of space only one region (East Asia and Pacific) is shown in Figure 9.126 Degree or extent of market access is measured in terms of percentage share of rural population.127 Taylor, 2008.128 For details, see Shilpi and Umali-Deininger, 2007.
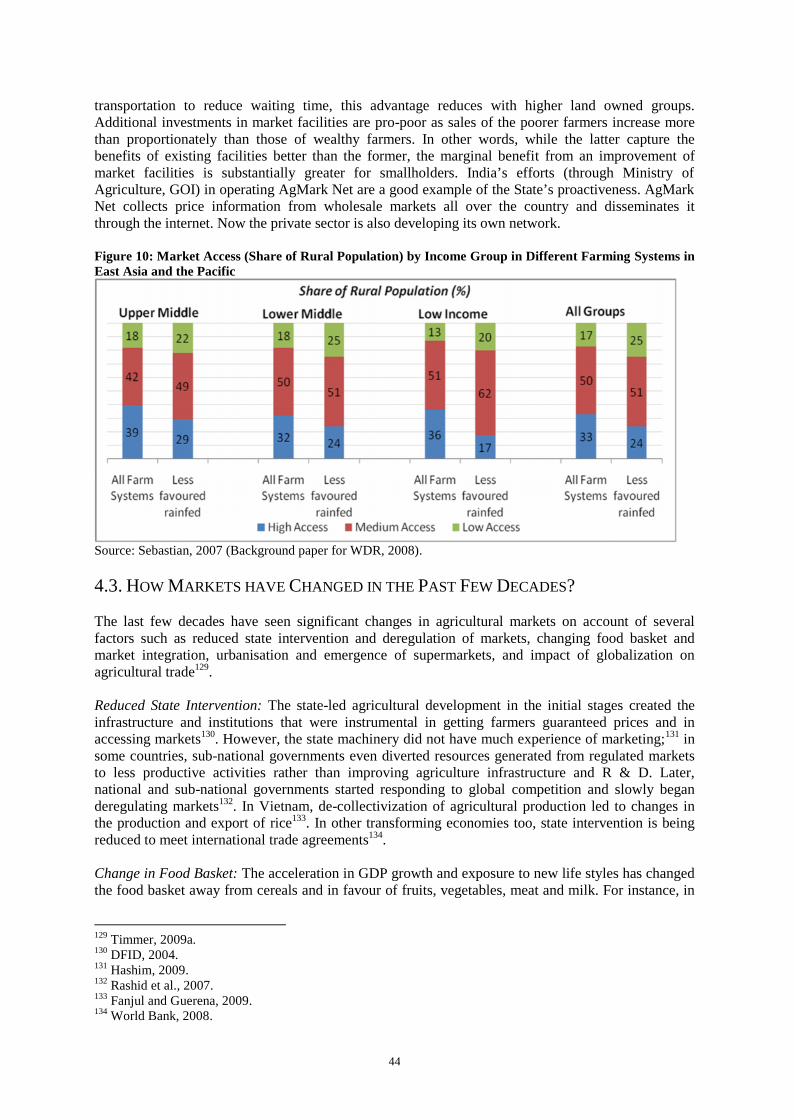
44
transportation to reduce waiting time, this advantage reduces with higher land owned groups.Additional investments in market facilities are pro-poor as sales of the poorer farmers increase morethan proportionately than those of wealthy farmers. In other words, while the latter capture thebenefits of existing facilities better than the former, the marginal benefit from an improvement ofmarket facilities is substantially greater for smallholders. India’s efforts (through Ministry ofAgriculture, GOI) in operating AgMark Net are a good example of the State’s proactiveness. AgMarkNet collects price information from wholesale markets all over the country and disseminates itthrough the internet. Now the private sector is also developing its own network.
Figure 10: Market Access (Share of Rural Population) by Income Group in Different Farming Systems inEast Asia and the Pacific
Source: Sebastian, 2007 (Background paper for WDR, 2008).
4.3. HOW MARKETS HAVE CHANGED IN THE PAST FEW DECADES?
The last few decades have seen significant changes in agricultural markets on account of severalfactors such as reduced state intervention and deregulation of markets, changing food basket andmarket integration, urbanisation and emergence of supermarkets, and impact of globalization onagricultural trade129.
Reduced State Intervention: The state-led agricultural development in the initial stages created theinfrastructure and institutions that were instrumental in getting farmers guaranteed prices and inaccessing markets130. However, the state machinery did not have much experience of marketing;131 insome countries, sub-national governments even diverted resources generated from regulated marketsto less productive activities rather than improving agriculture infrastructure and R & D. Later,national and sub-national governments started responding to global competition and slowly beganderegulating markets132. In Vietnam, de-collectivization of agricultural production led to changes inthe production and export of rice133. In other transforming economies too, state intervention is beingreduced to meet international trade agreements134.
Change in Food Basket: The acceleration in GDP growth and exposure to new life styles has changedthe food basket away from cereals and in favour of fruits, vegetables, meat and milk. For instance, in
129 Timmer, 2009a.130 DFID, 2004.131 Hashim, 2009.132 Rashid et al., 2007.133 Fanjul and Guerena, 2009.134 World Bank, 2008.
45
India, there is a marked increase in the consumption of animal fats, vegetable oils, sugar, potatoes andbread products and a decline in consumption of rice, pulses and other cereals135. In China, between1980 and 2005, the increase in cereals has been very small (1per cent), but a very substantial jump hastaken place in the consumption of fruits and vegetables (453 per cent) and milk (700 per cent)136.Poultry has become an important component of meat consumption, which would require much lessfeed than beef137.
Urbanisation and Emergence of Supermarkets: Increasing urbanization and female participation inwork force has increased demand for processed food. Supermarkets score over traditional retail storesin efficiently supplying processed food, and fruits and vegetables. However, such establishmentsexclude smallholders who have limited access to modern inputs and credit and favour a handful ofproducers who are able to meet the quality standards138. Smallholders who cannot meet the standardsof supermarkets still do business in the traditional market.
Impact of Globalization on Agricultural Trade: Two important factors have emerged from tradereforms and the liberalization of merchandise trade: (i) export demand for ‘tropical products’ (e.g.:tea, coffee, sugar and textiles) in the developed world has declined and that of high-value products(e.g.: fruits, vegetables and fish) has increased; (ii) the transforming economies of South Asia, EastAsia & the Pacific are likely to become net importers of foodgrains, which may threaten domesticfood security. Thus, international trade has thrown up two challenges: (a) whether smallholders wouldbe able to participate in the global supply chain of high-value products, and (b) whethersmallholders/‘net buyers’ of food would be able to maintain their food security?
4.3.1. THREAT TO SMALLHOLDER PARTICIPATION
Threats to smallholders would be reduced to the extent that (i) smallholders are able to participate inthe expanding domestic markets for high-value products. China, for instance, allows its smallholdersunder the household responsibility system to sell a part of their produce. These smallholders sell theirhorticulture produce to local supply chains dominated by small traders who supply to urbanmarkets,139 thus enabling them to take advantage of a growing domestic urban market. In cities,however, modern super markets are spreading fast in the north-west and south-west part of China140
and may curtail benefits to smallholders; and (ii) small producers are helped either by the global chainorganisation or domestic institutions to access the export market, as in Vietnam, where An GiangUniversity supported small producers of pangasius cat fish to supply to a large-scale processingfirm141. The state has an important role to play in the integration of smallholders in a rapidlytransforming agricultural sector. It must encourage producers’ associations, cooperatives andcontracting firms that provide inputs, technical advice and credit to smallholders.
4.3.2. OPPORTUNITIES AND CHALLENGES
Market and Trade Integration: Farmers in a region would be able to benefit from trade liberalizationif they are producing an “internationally competitive commodity” (i.e., no positive protection is beingprovided by the government). Otherwise, they would be losers as in the case of poor farmers in WestChina142. There are two ways for the smallholders/poor farmers to escape from this situation: (i)diversify to crops which are not internationally competitive or raise the efficiency of production (i.e.
135 Kulkarni and Gaiha, 2010; Kaicker et al., 2011.136 IFAD, 2011.137 One kg of meat production in the form of beef requires 10 kg of feed in comparison to only 2-3 kg for
poultry production (WDR, 2008).138 Gaiha and Thapa, 2007.139 Large holders do not exist in China due to the vary nature of the tenure system.140 Gaiha and Thapa, 2007.141 IFAD, 2011.142 Taylor, 2008.
46
raise yields substantially at lower costs through new and innovative resource saving on current cropsto make them internationally competitive). This requires huge investment, R&D and skills for whichthe State’s help is crucial; and (ii) farmers should be able to take advantage of a huge domesticmarket, as in China and India. This requires that the domestic markets function efficiently with lowtransaction cost. In this case too, the state’s role is of prime importance. In fact, the role of the statehas evolved from being primarily a producer and a distributor, to creating an enabling environmentfor markets to function efficiently, to invest and encourage R&D, and to provide other public goods.
Exploiting Niche Markets: Constraints to enhancing agricultural productivity due to diminishingreturns to conventional technology and natural resource degradation has made it imperative to look atalternate agricultural technologies, including low external input and sustainable agriculture, organicagriculture and biotechnology. In South East Asia and Pacific regions, 60000 farms spread over600000 hectares produced certified organic products in 2002, which increased to 90000 farms, spreadover 3.8 million hectares by 2005-06143. Whether or not organic farming survives on its own dependson its profitability after the initial years. Two contrasting examples are available from India. InMaharashtra, the initial cost of production of organic cotton was just half the cost of intensiveconventional production, but, subsequently, the cost of organic cotton rose. If sufficient marketmargins are not available, organic cotton production will not be profitable. The case is just theopposite for valley rice and cane whose cultivation will survive even if the market margin is lowgiven high volumes.
The Asia and Pacific experience offers three types of models: (i) large farms producing organicproducts and supported by the private sector and government (Chinese model); (ii) small farmersproducing for the domestic market and supported by NGOs (India model); and (iii) a combination ofthe two (Thailand model) 144. This kind of activity is also being undertaken by several big corporatehouses as part of their corporate social responsibility (CSR).
4.4. KEY MARKET FACTORS FOR POOR RURAL PEOPLE
Producers’ Organisations/Association: The major benefit of producers’ organisations is that theyoffer services to members at low cost, including bulk purchase of inputs, transportation, negotiationwith companies, obtaining credit from financial institutions and enforcement of contracts. Producers’organisations have a good chance of success if the members share common economic interests and arecommitted to enhancing them. Governance is a major issue in such organisations; homogenousmembership profiles and commonality of interests increase the efficiency of the organisation. Forinstance, the Indian Dairy Cooperatives network comprises 12 million members, including landlesslabourers and women, and produces 22 per cent of India’s milk supply145. In China, a group of smallscale growers, aided by the local government formed the Ruoheng watermelon cooperative, whichthen sold directly to wholesalers, retailers and supermarkets. Due to its timely delivery, quality, andmarketing success, the cooperative’s membership increased from 29 to 152, and its farmed areaincreased from 0.2 hectare in 1992 to thousands of hectares in 2005146. In Sri Lanka, the MA’STropical Food Company assists small farmers to organize into groups, streamlines their operationsand logistics, provides training and access to markets, and thus enables them to become part of thehigh-value spice chain.147 A challenge is to achieve discipline in collective action for the producers’organisations to meet the terms of the contract and at the same time ensure that members resist thetemptation of side-sales, particularly when prices are rising and local markets exist for the contractedproduct148.
143 Pender, 2008.144 Pender, 2008.145 Valdes et al., 2010.146 World Bank, 2008.147 Taylor, 2008.148 Byerleee et al., 2010.
47
Infrastructure & Information: Investment in rural roads for connectivity with markets yields highreturns in terms of raising incomes of farmers and in reducing rural poverty. Urban-rural linkagesthrough transport facilities reduce urban-rural wage disparities. In fact, high transportation costs arethe largest source of marketing margins for foodgrains in Bangladesh and Indonesia149. In Vietnam,the development of roads has played an important role in market development and increased thevariety of goods available to consumers. The efficient use of ICT drastically brings down the cost ofinformation and dissemination of knowledge. Information on the spatial differences in prices ofagricultural commodities or weather conditions, passed on to farmers through mobile phone/SMS isextremely useful and cost effective – SEWA (India) performs this service for women, and ITC’s e-choupal (India) uses SMS to inform small producers. Thai Fresh Limited (Thailand) providesextension services to small farmers under contract farming, Bali Fresh (Indonesia) trains a group ofpoor women in literacy and book keeping, and MA’S Topical Food Company (Sri Lanka) impartsknowledge on spice farming through extension agents.
Contract Farming: It is being practised mostly by large agri-business firms but the coverage offarmers has been rather low. Contract farming allows farmers to obtain/deliverpredetermined/negotiated quantities at specific prices and of specific quality within a specified timeframe. Such contractors/firms normally bring a package of services to the farmers, including creditsupport, input supply, and technical knowledge. Guaranteed prices insulate producers/farmers fromvolatility in market prices. Contract farming is practised in many Asia-Pacific countries, particularlythe Philippines and Thailand. The Export-Import Bank of Thailand, for instance, has been involved infinancing such projects. In Nepal, a rural-urban partnership programme connects farmers withmarketing centres. In Thailand's San Sai district, a farmers' group has found a lucrative market for itsdried longans in China. Critical concerns of contract farming include the exclusion of small farmerscaused by the fact that big agri-business firms prefer to work with a small number of large farmersrather than with large numbers of smallholders150. Another important aspect of contract farming is indesigning contracts to make provision for (or create incentives for) investment in high qualityproducts. Some NGO’s hold an enviable track record in working with smallholders and agri-businessfirms to facilitate such investments. Two issues, however, cannot be overlooked. (i) Commercialpartner, often with monopsony power, may renege on the contractual agreement once the crop isready for delivery, offering a lower price or imposing higher quality standards. (ii) Sustaining thecontractual arrangements over a longer period than stipulated.151
Financial Services for Market Participation: As discussed in Chapter 3, access to financialinstitutions helps rural households in mitigating risks by getting credit and safeguarding and providingadequate return on their savings. In addition, financial institutions provide a variety of other servicessuch as insurance and physical assets as collateral. Physical assets as collateral provide flexibility andhelp reduce transaction costs. This process has an additional advantage in terms of reducing costthrough bulk purchase resulting in shortening the steps in the value chain.
Global Corporate Sector in Agricultural Value Chain: The corporate sector can assist smallholders incapturing market opportunities by providing technical and industrial training to farmers. Some largefirms have adopted such a role as part of corporate social responsibility (CSR). Another approach is toinstitutionalize CSR by laying down strict codes and standards for their products. The CSR model,however, does not take care of the difficulty of small processors who fail to cope with strictstandardization. It also does not necessarily ensure decent work conditions in the agricultural valuechain. A newer model has emerged recently – ‘innovative business driven initiative’. For instance, theBusiness Alliance against Chronic Hunger, set up in 2006, promotes initiatives to improve local foodproduction and engage smallholders in market activities152. Large agribusiness firms have facilitatedthe integration of small farmers into high-value markets, as in the case of Normin Veggies in the
149 Fanjul and Guerena, 2009.150 Fanjul and Guerena, 2009.151 See Byerlee et al., 2010.152 IFAD, 2011.
48
Philippines. The private sector has experienced a major boost all along the value chain, most of it inthe context of a steady concentration process. Food manufacturers (such as Unilever, Nestle andKraft) are entering higher-value added activities associated with brand and product innovation, whilefood processors (such as Cargill and ADM) have emerged to fill in the space left behind in primaryand secondary processing. In India, the hyper-retailer Carrefour is developing sustainable models ofprocurement in vulnerable eco-regions and building capacity in areas such as food safety153.Thesedevelopments have thrown up two types of challenges: (i) developmental (corporate taxation,employment generation, wage); and (ii) regulatory (corporate working needs to be consistent withlegal and regulatory requirements).
Labour Opportunity in Agricultural Value Chain: So far, the major concern has been the involvementof smallholders in value chain. Another matter that needs to be highlighted is the employment ofworkers in the value chain in certain associated activities such as transportation, processing andtrading. In the example of Horticulture Development Programme (India) cited below, considerableemployment has been created to meet the labour demand of fruit orchard operation. Employment hasalso increased in the complementary areas of transport, storages and packing. The opportunitiesoffered by the value chain depend on its nature and the labour requirements in production andprocessing. Product markets have undergone restructuring. Some who work as small contractors in theearlier stage may become wage earners in the new phase of the production process. In other cases,labour, including migrants employed by large companies, do not have formal contracts, and hence arenot protected from violations by their employers.
Here again, the State has a role to play in upgrading agricultural labour markets by providing training,ensuring greater workplace security, and reducing health hazards. In many poor countries, workerswaste time and energy in moving from farm to farm to seek jobs, which results in inefficiencies inlabour markets. Better labour management can help reduce inefficiencies.
4.5. HOW THE EMERGENCE OF PRO-POOR AGRICULTURAL MARKETS CAN BE
SUPPORTED?
A few points are fundamental to the benefit of poor/smallholders to capture the emergingopportunities in the chain. These include identification of value chains where smallholders havecomparative advantage; reduction in the number of steps in the value chain and minimizing of riskand transaction costs within these steps; identification of beneficiaries at every step in the value chainto find measures to enhance the share and power of smallholders, and identification of initiatives andinvestment with significant impact on participation and benefits to the smallholders. Box 11 reviewsIFAD initiatives in Asia and the Pacific Region to integrate smallholders into the agricultural valuechain.
153 Fanjul and Guerena, 2009.
49
Box 11: Linking Smallholders to Value Chains
The Rural Enterprise Development (RED) component of the IFAD-supported Market InfrastructureDevelopment Project in Charland Regions (MIDPCR), Bangladesh, identifies market opportunitiesand value addition to the products, and helps build capacity of the small char producers so that theywill link to market and economic opportunities in the fish sub-sector. By establishing collection points(CPs) at the centre of a village, at the intersection of roads or within the existing weekly market whereproducts such as beans, milk and fish are gathered for wholesale, they meet the prime need offingerling producers, fingerling traders and fish producing farmers. In the Shantirhat bazaar, thecollection point has brought together 25 fingerling producers, 55-60 fingerling traders and more than250 fish-producing farmers to transact business (compared to 10 fingerling producers, 10 fingerlingtraders and 150 fish-producing farmers before the CP was established). Average sales from the CP areTk 50,000-60,000 (US$ 723-868) per day, which is significantly higher than the sales of Tk 12,000-15,000 (US$ 173-217) per day before the CP was created.
The Nature’s way cooperative in Fiji assists producers, including small-scale farmers, and othersinvolved in the commodities pathway, and its activities have generated much foreign exchange for thegovernment and people of Fiji. Its governance structure and mode of operations have benefited otherPacific Island nations as well viz. Cook Islands, New Caledonia, Samoa, Tonga and Vanuatu.
The IFAD-supported Livelihood Improvement Project for Himalayas in Meghalaya, India (2004-2012), has been working to capture the niche market in turmeric and help enhance the incomes ofpoor rural farmers. With a view to enable them to have more control over value addition and therebyearn higher income, the project facilitated a farmers’ federation, called ‘Laskein Federation for self-help groups’ (LIFE). Recently, the federation set up a processing unit for value addition of turmeric sothat high-quality turmeric is available in the market. The establishment of the processing unit hascreated opportunities for the farmers to obtain a better value for their own product and to negotiatewith market forces like ITC for bulk supply to cater to the needs of the pharmaceutical industry.
The IFAD-supported Rural Livelihood Improvement Programme in the Attapeu Province, Laos(2006-2014), is seeking to reach 6,200 poor rural households in Phouvong, Saysettha and Xansaidistricts. To develop the vegetable value chain, the programme (RLIP) undertook a number ofinterventions: strengthening village administrative committees, strengthening the delivery ofextension services, formation and capacity building of vegetable production groups, securing accessto land, strengthening the delivery of financial services, ensuring access to necessary inputs,improving access to irrigation facilities, enabling the flow of information, facilitating market access,and increasing access to higher-value markets.
The Local Livelihood Programme ensures increased access to economic opportunities by poorfarmers and producers in hill and mountain areas in Nepal, as also in some new economically viableand socially acceptable livelihood options along the North-South road corridors. The target groupswere provided with a wide range of market-led enterprise options matching their environment andresources. Besides these, small rural infrastructure, such as micro-irrigation schemes, collectioncentres and cooperative buildings, were developed. As a result, significant positive changes in thelivelihoods took place: enhanced food security, increased farm income, grassroots institution-building,reduced outmigration, increased local employment opportunities and enhanced social status.
Source: IFAD, 2010.
A gender perspective is necessary while viewing the changing market structure and emergingopportunities. Certain traditional farming practices give women an advantage over men and allow foreasy organic certification. In Indonesia, Bali Fresh, a private company has brought poor womentogether, rented land for them to cultivate fruits and vegetables, arranged to supply seedlings and
50
provide extension services and marketing support to ensure quality and quantity. It has also set up arevolving fund with outside aid for purchasing inputs and to train women in book-keeping. Havingtaken these steps, the company has established links to supply fresh produce by the women’s group tohotel, restaurant and export market. Women who had no earlier experience of farming now earn twiceas much as the minimum wage rate154. In China, with the growing demand for high-value horticulturecommodities, new opportunities have been opened for poor women.
4.5.1. ROLE OF GOVERNMENT, NGOS AND DONORS
As discussed in earlier Chapters, the government is expected to play a proactive role in creatinginfrastructure and enabling policies and regulatory measures to reduce market risk for smallholders.Such policies need reorientation to expand the rural financial system and encourage privateinvestment in channels that seek greater participation of and benefit to smallholders. Governmentsneed to negotiate in regional and international fora to safeguard their interests. This calls for aregionally differentiated strategy both for sub-national development and trade negotiations. Forinstance, in Maharashtra (India), besides material inputs and wage subsidy, the government played acrucial role in upgrading the Pune-Mumbai expressway, airports and port facilities. The good qualityinfrastructure facilitated competitiveness of horticultural and other products in the domestic andinternational markets.
NGOs have an important role to play in several areas, such as providing assistance to evolvestandards, and bridging gaps/building trust as honest brokers between different parties – smallholders,private sector and government. Donors can support public-private partnerships. While NGOs anddonors should play the role of a catalyst, they cannot substitute for the private sector. NGOs areeffective in imparting training, generating awareness of credit facilities and dealing with banking andnon-banking organisations. The private sector can be instrumental in promoting reforms throughpublic-private dialogue155.
4.6. KEY MESSAGES
First, the smallholders and the poor face disadvantages in accessing markets due to weak assetposition, lack of knowledge, high transaction costs of entry, and poor location. Addressing these risksand overcoming barriers are critical for smallholders to seize opportunities offered by expandingmarkets.
Second, agricultural markets have undergone significant changes in the past few decades for multiplereasons: reduced state intervention, growing urban markets, emergence of supermarkets and changingfood basket. Restructured markets may involve higher entry costs and risks of exclusion forsmallholders.
Third, the global trade is a potential threat when smallholders face high entry costs to the value chaindue to asymmetries of power, information and skills. Governments need to strengthen infrastructuresupport, enable access to information and technologies and promote smallholder comparativeadvantage in emerging high-value chains.
Fourth, Contract farming can reduce the risk of price volatility and build confidence with agri-business firms provided enforcement mechanisms are in place. Governments can intermediate throughfood safety standards while producers’ organisations can play an important role in price negotiations
154 Pender, 2008.155 See, for example, Working Group on Agriculture and Agri-business in the Government-Private Sector Forumin Cambodia..
51
and in getting better access to financial services. Successes are many but need replication on a largerscale.
Fifth, public-private partnerships are conducive to infrastructure development, financial services andimparting knowledge and skills to smallholders. NGOs and donors could help exploit synergiesamong public authorities, private sector and smallholders in these partnerships.
52
CHAPTER 5: SUSTAINABLE INTENSIFICATION OF
AGRICULTURE
5.1. INTRODUCTION
The world population is expected to be about 9.1 billion in 2050. With increasing urbanization andhigh income levels, food production must increase by 70 per cent to meet the food demand in 2050156.Since the scope for net increase in arable land is highly limited (especially in Asia and the PacificRegion), 90 per cent of this additional food requirement has to be met through increases in yields inareas with intensive agriculture157. Availability of fresh water resources for food production isdeclining fast and may worsen due to climate change. Since South Asia, and East Asia and the Pacificare slated to experience food deficits in domestic production and increased dependence on foodimports by 2030, the pressure to maintain food security would be reflected in intensive exploitation ofnatural resources (land, water, forestry and fish production). Most poor in these sub-regions arelocated in ecologically fragile environments that are already experiencing further deterioration. Ifagriculture is to provide a pathway to exit poverty, utmost attention should be paid to thesustainability of natural resources used in the intensification of agriculture158.
5.2. AGRICULTURAL TECHNOLOGY AND SMALLHOLDERS
Availability of arable land per person in Asia and the Pacific Region is just one-fifth of the rest of theworld. The miniscule average size of landholdings means that agriculture cannot advance without newtechnology being available to smallholders. Initially (late 1960s and early 1970s), the green revolutiontechnology (modern varieties of seeds accompanied by complementary inputs) was adopted by largefarmers, and, after a lag, smallholders too gained from new technology as complementary inputs(credit, fertilizer extension services) were made available through proactive state policy. This story isparticularly relevant to South Asia.
In the 1960s, a break-through in agricultural technology occurred due to the evolution of semi-dwarfvarieties of wheat and rice in many parts of Asia and the Pacific Region. These varieties transformedstagnant agriculture (low input-low output) into dynamic agriculture (high input-high output).Initially, the use of modern varieties was confined to irrigated areas, and bypassed the rainfed anddryland areas and minor crops such as pulses, coarse grains and oilseeds. In South Asia, irrigatedagriculture accounts for 40 per cent of harvested area, as compared to 29 to 30 per cent in EastAsia159. In the late 1960s, modern varieties of rice were used only in 2 per cent and 5 per cent ofharvested area in South Asia and South East Asia, respectively, but rose to 70 per cent in both sub-regions by the end of the late 1990s160. The increase (80 per cent) in use of modern variety of maizehas also been significant161. Similarly, the use of modern variety of sorghum in China reached a veryhigh level (98 per cent), as compared to India (69 per cent) and Pakistan (20 per cent) in the late1990s162. In the Indian context, it is not a small achievement as sorghum is grown mainly in water-scarce areas. The use of inorganic fertilizer – more conspicuous in South East Asia than in South Asia– increased the yields of different crops. The increase in fertilizer use has been phenomenal in Asia
156 This is net of biofuel demand.157 Most of the increase in arable land would come from Sub-Saharan Africa and Latin America; World Summiton Food Security, 2009.158 Sustainable intensification is being used in the broad sense that high level of productivity already achieved isfurther enhanced, or at least maintained with restoration of soil fertility and substantial improvement in wateruse efficiency, without causing harm to biodiversity and human / animal health.159 World Bank, 2008.160 Hossain et al., 2003.161 Morris et al., 2003.162 Deb and Bantilan, 2003.
53
and the Pacific Region, rising from 6 kg/ha in 1961-63 to 143 kg/ha in 2002-04163. The overall yieldof cereals has been much higher in East Asia & Pacific than in South Asia. The contribution ofmodern improved varieties of rice to yield increase was about 50 per cent in China (1975-1990) and53 per cent in the Punjab province of Pakistan164. Total factor productivity (TFP)165 grew at the rate of1 to 2 per cent per annum across Asia-Pacific countries. In China and India, TFP’s contribution tooutput growth was about 50 per cent since 1960; and about 30 to 40 per cent in Indonesia andThailand166.
TFP performance in developing countries is strongly correlated with national investments in“technology capital”-a measure of a country’s ability to develop and extend improved technology tofarmers. Countries that failed in this respect lagged behind others. So there is a case for higherspending on agricultural research. However, there are long time lags between research investmentsand productivity growth.
Another important insight relates to supply response to higher food prices. The slowdown in growthrate of agricultural capital formation was in part a consequence of a long spell of unfavourable pricesfacing producers, resulting in capital moving out of agriculture. The incentives offered by spirallingfood prices are likely to accelerate agricultural growth and dampen food price inflation167.
5.2.1. SUB-SECTORS
Within the agricultural sector, sub-sectors comprising livestock and fisheries have made considerableprogress. The countries which have done reasonably well in these sub-sectors are listed below:
Poultry &Pigproduction
China, Vietnam and Thailand increased production by 200 per cent during the1990s. The share of these countries in global production was almost 33 per centand 50 per cent in chicken and pig production, respectively, in 2001168.
Dairyproduction
India and Pakistan are the traditional milk producers in the region. India alsoaccounts for 15 per cent of world milk production. Dairy Production quite oftenis a part of the mixed farming system.
Fisheries China, Bangladesh and Vietnam are prominent in aquaculture, with Chinaaccounting for 67 per cent of world’s aquaculture production.
Source: Compiled from various sources including WDI 2010 and IFAD, 2011.
Attention may be drawn to the factors leading to high production of some of the high-value products(Chapter 4). It may be added that in China, fishery exports doubled during the 1990s but these werenot more than 8 per cent of the total production for that decade. Domestic demand, rather thanexports, fuelled an increase in production169. For instance, milk production in India increased becauseof a shift in the composition of food away from cereals. Changes in technology and the sale ofcommercial production in poultry have adversely affected household production in Cambodia, Laos,
163 World Bank, 2008.164 World Bank, 2008.165 Total factor productivity (TFP) refers to the increase in yields controlling for the effects of inputs. Theprimary driver of total factor productivity is technological improvement.166 Much of recent literature draws attention to slowing cereal yields (WDR, 2008). Combined yield of rice,wheat and maize in developing countries grew at 2 per cent per annum during 1970-90 and about 1 per cent perannum during 1990-2007. But this is not sufficient to argue that agricultural productivity growth deceleratedsharply. One major limitation of this measure is that it lumps together a wide range of intensification processes.The TFP growth analysis, however, points to a different story. In developing regions, productivity growthaccelerated in the 1980s and in the subsequent decades. Input growth slowed but remained positive. Chinasustained exceptionally high TFP growth rates since the 1980s. Few other countries and sub-regions in Asia-Pacific also performed well (Fuglie, 2010).167 For details, see Fuglie (2010).168 IFAD, 2011.169 Gulati et al., 2007.
54
Vietnam and Indonesia. This may have reduced production for self-consumption. The artisanal fisherytoo experienced a setback due to the advent of destocking and commercial fishery.
5.2.2. BIOTECHNOLOGY IN AGRICULTURE
The first generation advances in biotechnology have created good opportunities for smallholders. Theproducts of these technologies (such as hybrid varieties of rice and wheat) became popular and couldbe adopted easily. One of the successful cases based on tissue culture often cited is that of disease-freesweet potato which was planted on 500,000 hectares owned by smallholders in Shandong Province ofChina. The yield increased by 30 to 40 per cent. Another biotechnology helped eradicate rinderpestdisease in cattle170. The produce of second generation advances in biotechnology, particularlygenetically modified organisms (GMOs), such as Bt Cotton, has been widely adopted in China andIndia171; by 2009, 7 million farmers in China and 5.6 million in India are reported to have planted it172.Bt cotton leads to cost reduction due to (i) decline in yield loss caused by pest attack; and (ii)reduction in use of pesticides. Other important Bt crops are maize (particularly in the Philippines) and,to a lesser extent, rice. Bt varieties are available for soya and rapeseed too but are yet to gainacceptability. Since GMOs are controversial due to uncertain effects on the environment and health,many countries are still hesitant to accept them. For example, Malaysia and Thailand are still debatingthe pros and cons of adopting GMOs.
Some of the big challenges for GMOs are: (i) developing varieties that can perform well underconditions of drought, flood, heat and salinity; (ii) strengthening bio-safety assessment; and (iii)making smallholders aware of the risks and benefits of GMOs. These enormous tasks need substantialfinances and scientific talent, and public-private collaboration173.
One of the areas of concern is the gap in yields between what is achievable (experiment-based) andthe actual. One reason is the lack of availability as well as effectiveness of extension services to thefarmer. In many countries, notably India, in the post-green revolution phase, the system of stateagricultural extension services almost collapsed. This void has not been filled by the private sector.Another reason is the lack of availability of certified and genuine quality of seeds. In many cases,private seed companies supply seeds to farmers, particularly in high potential areas. The governmenthas an important role to play in supplying seeds to farmers in remote areas, and in monitoring thequality of seeds supplied by the private sector.
5.3. ENHANCING AGRICULTURAL PRODUCTIVITY TODAY – SOME KEY
CHALLENGES
Recent evidence suggests a slowdown in productivity growth in cereal crops such as rice and wheat inmajor irrigated areas of Asia such as the Indo-Gangetic plain and East Asia. For example, rice yieldgrowth in irrigated areas of Asia declined from 2.31 per cent per annum in 1970-90 to 0.79 per cent in1990-2000. The major reasons for this decline in yield growth include: the displacement of cereals onbetter lands by more profitable crops; diminishing returns to modern varieties when irrigation andfertilizer use are already at high levels; and the recent low price of cereals relative to input costs,making additional intensification less profitable (Hazell, 2009)174.A breakthrough in yields is requiredto meet the target increase in food production to maintain food security. Some of the features that mayhave caused stagnation in yields are inadequate public investment in infrastructure and agriculturalresearch, soil degradation due to intensive agriculture, overexploitation of ground water resources,
170 World Bank, 2008.171 IAASTD, 2009.172 IFAD, 2011.173 Pender, 2008.174 As noted earlier, while yield growth rates are of some significance, TFP growth rates that allow for differentintensification processes are more interesting. But these have not been computed for individual crops.
55
and inefficient management of surface irrigation. Breakthroughs in new varieties of rice and wheatenabling a significant thrust to productivity are not on the horizon for the second phase of the greenrevolution in Asia-Pacific countries.
5.3.1. CONCERNS ABOUT SUSTAINABILITY
A significant part (25 per cent) of arable land is already under arid conditions in less favoured areas inSouth East Asia and the Pacific (SEAP) sub-region. In some of the countries, it is much higher than25 per cent, as in China (34 per cent), Mongolia (65 per cent) and Pakistan (62 per cent). In India too,6.7 per cent of the land in less favoured areas is arid. Degradation of land adds to the crisis ofdeclining yields. In the SEAP sub-region, loss of top soil due to water and wind erosion is 15.7 percent and 5.4 per cent, respectively. The loss of grain production due to land degradation in China isestimated to be 60 per cent during 1985-1989, most of it caused by flooding, drought and soil erosion.Estimated annual cost of soil degradation is 7 per cent of GDP originating from agriculture in SouthAsia. For the SEAP sub-region as a whole, the estimated loss varies from 1 to 7 per cent of agricultureGDP. Water-logging is also an important cause of salinity in the SEAP sub-region, and has affectedabout 7 per cent of arable land. Heavy use of chemical fertilizers has led to contamination of groundwater. Another major concern for sustainability is the growing scarcity of water for agriculture,caused primarily by over-exploitation of ground water resources in the SEAP sub-region. In the NorthChina plains, the water table has fallen by one metre a year due to heavy dependence on tube wellirrigation. In southern India, the situation is extremely alarming since the ground water levels havedeclined by 25-30 metres in a decade175. The story is no different in India’s North West States ofPunjab, Haryana and West Uttar Pradesh – the seat of the green revolution – which contribute over 80per cent of the foodgrains in India.
Most of the over-exploitation of ground water is occurring due to faulty policies such as absence of orweak regulatory measures for use of ground water and public provision of cheap electricity and dieselin the form of heavy subsidies for drawing ground water176.
Increased production of livestock has contributed to pollution of water resources and is alsoresponsible for the overconsumption of water and rising demand for feed/ coarse cereals. The increasein meat production in China between 1994 and 2004 (i.e. from 45 million to 74 million tonnes) led torising demand for feedgrains. As a result, 70 per cent of the increased exports (the trade in soybeansdoubled in this period) of soybeans went to China177.
5.3.2. CLIMATE CHANGE
Asia and the Pacific Region encompasses a wide spectrum of farming agro-ecosystem – dry wheatproducing areas (Central Asia) and wet rice producing ones (South East Asia). The region is likely toface extreme weather conditions, including a higher probability of floods and droughts. Some of theadverse effects of climate change are:
Climate change (increased level of CO2 emissions, and soil erosion due to too much rainfall)would worsen land degradation. Ninety per cent of rainfed area in Asia and the Pacific Regionis already under cultivation. Its vulnerability would increase.
The rise in the average sea level may be about 40 cm at the end of the century. In such asituation, the worst affected parts of Asia and the Pacific Region would be Bangladesh, India,Pakistan, Myanmar, Sri Lanka, Indonesia, the Philippines, Thailand and Vietnam178.
175 Pender, 2008.176 Gulati and Narayanan, 2003.177 World Bank, 2008.178 Dependence on aquaculture in coastal areas is quite high in some of these countries (India (60%), Pakistan’sPunjab (40%) and China’s provinces of Shandong, Hunan, Beijing and Hubei (50%, 50%, 65% and 70%,respectively) (ADB, 2009).
56
Under the different scenarios described in the IPCC Special Report on Emission Scenarios(SRES), the global mean surface temperature is expected to rise from 1.8°C to 4.0°C by theyear 2100. The expected rise in the sea level is in the range of 0.18 – 0.59 metres. Due toclimate change, freshwater availability in many parts of Asia is expected to decrease by 2050.South, East and South East Asia will be at the greatest risk due to expected flooding. This willalso have impacts on morbidity and mortality due to diarrhoeal diseases associated withfloods. The following impacts on crop productivity may be expected: In areas of mid-to-highlatitudes, productivity is projected to increase slightly with temperature increases between 1-3°C (depending on the crop), and then decrease in some regions. In regions of low latitude,crop productivity is projected to decrease for even small increases in local temperature179.
The poor, smallholders, women and fisherfolk would be worst affected in the climate change scenario.
Box 12: Options in Emission Reduction
Apart from fossilised carbon, there are other greenhouse gasses, other atmospheric pollutants, and theeffects of cutting down of forests that contribute equally to global warming. Controlling these is apromising option for three reasons. (i) Since the emission of carbon dioxide is a fundamental part oftoday’s industrial structure, there is enormous resistance to cutting it. HFC-134a is a gas with variousindustrial uses that delivers more than 1000 times more warming than carbon dioxide, mass for mass.Cutting its use is easier as it is peripheral to industrial life and substitutes are easier to find. (ii) Thebenefits of reducing carbon-dioxide emissions may seem distant. Reducing emissions of black carbon,given off by inefficient combustion in cooking fires and brick kilns, by contrast, offers rapid andsubstantial public health benefits. Cleaner ways of burning various fuels, for example, could not onlyslow down global warming but also prevent millions of death from smoke and disease. (iii) Reducingcarbon emissions is contingent on new international agreements that are both efficient and equitable.But these considerations have proved a stumbling block in recent negotiations. Reduction of otherwarming agents, by contrast, could be accomplished within existing agreements (e.g. clean –airregulations). But these new climate actions do not replace the need for reducing carbon emissions
Source: The Economist, 19th February, 2011.
While the search for effective mitigation mechanisms continues, it must be combined with adaptation.The latter, of course, deserves greater attention than it has received. Since the “world’s appetite foremissions reductions has been revealed to be chronically weak”, it is imperative “to find ways ofadapting to many possible future climates”180.
Poor countries need assistance as they lack the financial resources, technical expertise and politicalinstitutions for such endeavours. Moreover, they are more vulnerable to the risks of climate change asthey depend more on agriculture that is so closely tied to weather. Crops are sensitive to changes inpatterns of rainfall and peak temperature, as also the pests and diseases that attack them.
Adaptation calls for not just expanded research into improved crop yields and tolerance oftemperature and water scarcity, but also research into management of pests, soil conservation, andcropping patterns that enhance their resilience181. There is also a case for weather insurance whichwill pay not when crops fail but when specific climatic events occur (e.g. rainfall below a set level).182
Strategies of adaptation by smallholders raise specific concerns. They are likely to suffer impacts ofclimate change that are locally specific and hard to predict. The variety of crop and livestock speciesproduced by them, and the importance of non-market relations will increase the complexity both of
179 IPCC, 2007.180 The Economist, 25th November, 2010.181 For details, see Gaiha and Mathur, 2010.182 For a review of weather-based insurance, see Gaiha and Thapa, 2007.
57
the impacts and the subsequent adaptations, relative to commercial farms with more restricted rangesof crops. While small farm sizes, low technology, low capitalisation and diverse non-climate stressors(e.g. population driven land fragmentation, limited access to markets) add to their vulnerability, theirexisting patterns of diversification away from agriculture and store of indigenous knowledge impartgreater resilience183.
5.4. AN EMERGING AGENDA FOR SUSTAINABLE AGRICULTURAL INTENSIFICATION
The major issues emerging from the earlier analysis are (a) making agriculture less risky for thesmallholders; and (b) conserving the environment and producing more with the given resources. Thequestion that policy makers and practitioners face is how it can be achieved. Recently, severalinitiatives have been taken at the international level, such as International Assessment of AgriculturalKnowledge, Science and Technology for Development (IAASTD) between 2002 & 2009, and theGlobal Conference on Agricultural Research for Development (GCARD), held in Montpellier,France, in 2010. These meetings have raised the importance of focusing agricultural research indeveloping countries on the needs of smallholders, keeping in view the tremendous diversity insmallholder cultivation. Three aspects are common in a broad approach to sustainable agriculture,viz., (a) improvement in water use efficiency; (b) improvement in organic matter; and (c) moreefficient pest and weed control “through in-field biodiversity and reduced pesticide use”184.
Box 13: Agricultural R&D
The green revolution testifies to the important role of agricultural R&D in enhancing productivity.Although spending on agricultural R&D in the Asia and the Pacific Region rose, it stagnated ordeclined in some countries. Examples include China where it fell from 0.57 per cent of agriculturalvalue added in the early 1960s to 0.4 per cent in 2000; in Thailand, it has stagnated around 0.4-0.5 percent since the 1970s, with a slight increase in recent years; and, in India, it rose markedly from 0.18per cent in the early 1980s to 0.34 per cent in 2000.
Reasons for slow growth of agricultural R&D lie in (i) limited participation of the private sector -private agricultural R&D was barely 8.1 per cent of the total in this region in 2000. Although this ishigher than the average for developing countries (6.3 per cent), it is considerably lower than that fordeveloped countries (54 per cent). The reasons underlying limited participation of the private sectorare issues related to patents, breeder rights and other forms of intellectual property. (ii) A secondcontributory factor is decline in donor support for agricultural R&D since the mid-1990s. (iii) Fiscalpressures have undermined public financing of agricultural R&D.
Whether revival of interest in agriculture will help reverse the decline in agricultural R&D is notborne out by more recent evidence.
Source: Adapted from ESCAP (2008).
Integrated Water Resource Management (IWRM) and Integrated Watershed Development andManagement (IWDM) hold promise to meet land and water challenges across sectors. IWRMpractised in Indonesia is an interesting case of planning and coordination at different levels: riverbasin, central and provincial governments, district level and water user association at the village level.At each level, the roles of these bodies are different and well-defined to manage the utilization ofwater for multiple purposes. The scheme, however, has some shortcomings – weak fiscal control at
183 Morton, 2007.184 IFAD, 2011.
58
the local level limits the options of management, and coordination also suffers due to weak linkagesbetween different administrative levels185.
Resource conservation coupled with increases in yields is part of the emerging agenda. Two examplesof resource conservation technology are noteworthy: application/adoption of System of RiceIntensification (SRI) and ‘zero tillage’ in rice-wheat system. The basic technique of SRI recommendsplanting rice seedling at younger stages, keeping wide space for the growth of roots and canopy, andkeeping soils moist rather than full of water. In Cambodia, farmers have reported savings in water,fertilizers and pesticides, and increases (100 per cent) in yields186. In India, recent experiments indifferent states (sub-national level) have shown savings in water of 22 to 49 per cent (on average 40per cent), savings in seed quantity and even labour. Experiments in Bihar (India) show that femalelabour is partly replacing male labour at the seed planting stage187. Another landmark in resourceconservation technology is ‘zero tillage’ developed at the initiative of Rice-Wheat Consortium ofIndo-Gangetic Plain of South Asia. This process involves planting of wheat immediately after rice tocapture the residual moisture from the preceding crop. It results in increases in yields, reduction incosts, savings in water usage, and improvement in biological properties of the soil188.
Simple adaptation measures like ‘zero tillage’, innovative designing of treadle pump189, and microdrip irrigation190 are effective measures in saving natural resources. Biotechnology has a significantrole to play in developing crop adaptation to heat, drought, and salinity, and in developing insect anddisease resistant varieties. MAHYCO has collaborated with government organisations for Bt cotton inIndia. Syngenta, a Swiss company, is collaborating with national organisations in China, Bangladeshand the Philippines to develop bio-fortified rice. Since rising temperatures are going to adverselyaffect the yield of livestock, additional research is also required into high yielding and heat tolerantbreeds of livestock. Hence, there is an urgent need for the public sector to allocate substantialresources for research in biotechnology. All countries have a collective responsibility to push theagenda for agricultural adaptation and mitigation strategies for incorporation in the globalnegotiations on climate change. Asia-Pacific countries should press for creation of reasonableincentive mechanisms to pursue innovative technologies and management systems. In addition, thesecountries should insist that the international agriculture research organisations reorient priority tofocus on research that directly benefits the poor and the smallholders.
5.5. MOVING THE AGENDA FORWARD: POLICY AND INSTITUTIONAL CONDITIONS
What the strategies of intensification and diversification imply in terms of agricultural investment andODA to accomplish MDG 1 of halving poverty in Asia and the Pacific Region is examined below,based on a detailed assessment carried out in Asia and the Pacific Division (IFAD)191. Variousscenarios are considered using two poverty thresholds: $1.25 per day and $2 per day. The results thusobtained involve different assumptions about individual and joint effects of agricultural expenditure,ODA and investment. A summary of the key findings is given below.
Agriculture contributes substantially to GDP growth. A 1 per cent growth in agriculturalvalue added per capita results in a GDP (per capita) growth rate of 2.13 per cent.
Elasticity of the head-count ratio of poverty ($2 per day) with respect to GDP is about (-.60),and its (absolute) value is more than twice as high (-1.28) for the headcount ratio at $1.25.These elasticities imply a substantial trickle down effect of GDP growth on the poor –especially the extremely poor ($1.25 per day).
185 Tyler and Fajber, 2009.186 IFAD, 2011.187 A personal communication of his unpublished findings by Prof. B.C. Barah.188 World Bank, 2008.189 Treadle pump is designed by International Development Enterprises of India. It reduces CO2 emissions190 Micro drip irrigation on average saves 54 per cent of water and 39 per cent of electricity compared to floodirrigation.191 For details, see Imai et al. (2011c).
59
The effect, however, of agricultural growth on poverty is far more substantial-the elasticitiesare (-1.18 for $2 poverty and -2.73 for $1.25 poverty).
Simulations show that Asia and the Pacific Region as a whole would need a 56 per centincrease in agricultural ODA in 2007-13 for achieving MDG 1 (US$2 poverty) (or a 16 percent increase for US$1.25 poverty): a 28 per cent increase in agricultural expenditure forUS$2 poverty (or an 8 per cent increase for US$1.25 poverty); a 23 per cent increase infertilizer use (or no increase for US$1.25 poverty), or a 24 per cent increase in agriculturalinvestment for US$2 and US$1.25 poverty ratios (but with varying sub-regionalrequirements) over and above the historical trends in the period 2007-2013 or 14.
There are considerable sub-regional variations in the amount of agricultural ODA,expenditure, fertilizers and investments required to meet MDG 1, at US$2 a day, by 2015. Forinstance, South Asia (or South East Asia) would need only a 5 per cent (or 8 per cent)increase in annual growth rate of agricultural ODA, 2 per cent (or 4 per cent) increase inannual growth rate of agricultural expenditure, 3 per cent (or 4 per cent) increase in annualgrowth rate of fertilizer, or 2 per cent (or 3 per cent) increase in annual agriculturalinvestment in 2007-13 over and above the baseline scenario192. The Pacific (confined toPapua New Guinea) and Central Asia would need larger increases in most of these factors193.
Aggregation of the simulation results for individual countries by income reveals that lowincome countries with low level of governance or institutional quality, or with low ease ofdoing business would need larger increase in agricultural ODA, expenditure or investment toachieve MDG1 at both US$2 and US$1.25 per day.
In sum, (i) agriculture is important not just for economic growth but also for poverty reduction194; and(ii) increases in agricultural ODA, expenditure, investment and fertilizer (as a proxy for technology)tend to reduce poverty. So both national governments and donors have important roles in acceleratingagricultural growth and poverty reduction.
Two aspects are of prime importance: upscaling successful agricultural practices, and prioritizingsustainable intensification approaches and integrating them with agricultural technology in the localcontext. While carrying the agenda forward, it is important not to lose sight of the fact that mosteconomies in Asia and the Pacific Region belong to the category of ‘transforming economies’ withdiverse agro-climatic conditions, holding size, extent of depletion of natural resources (soil, water),inter-regional (sub-national) disparities in agricultural development and governance structure (notonly at the central/federal but also at the sub-national level). It is known that South Asia and East Asiaare going to face a serious food crisis beyond 2015, and that the effect of the green revolution isalready dwindling along with the depletion of the natural resource base. Less-favoured areas need toreceive attention in policy matters, especially in the context of threat to agriculture due to climatechange and/or globalization of agricultural trade.
192 Note that figures within parentheses refer to South East Asia.193 Note, for example, that the Pacific is represented by Papua New Guinea which is not a typical country forthis sub-region.194 In an important new contribution, Christiansen et al. (2010) offer a decomposition of agriculture’scontribution to poverty reduction, based on a cross-country analysis. Among other things, this helps understandwhy despite a fall in agriculture’s share in GDP, it has a vital role in reducing extreme poverty. Arguing that therelative contribution of a sector to poverty reduction depends on four factors: its direct growth component, itsindirect growth component, the participation of the poor in the growth of this sector, and the size of this sectorin the overall economy, they demonstrate that growth in agriculture is especially beneficial for the poorest. A 1per cent increase in agricultural value added per capita reduces $1-day poverty gap squared by at least 5 timesthan a 1 per cent increase in GDP per capita outside agriculture, despite being substantially smaller than the non-agricultural sector. When it comes to $1-day head-count poverty, agriculture is up to 3.2 times better at reducingpoverty than non-agriculture, when accounting for differences in sector size, with the advantage diminishing ascountries become richer (and inequality increases). Across poverty measures, the poverty reducing potential ofnon-agriculture reduces substantially when extractive industries contribute a sizeable share of GDP.
60
5.5.1. MAKING INTENSIFICATION SUSTAINABLE
Two aspects are most crucial: restoration of soil fertility and judicious use of water. Successfulexperiment of ‘zero tillage’ in the Indo-Gangetic plain of India needs to be vigorously extended tosimilar agro-climatic conditions in other parts of South Asia, notably Pakistan. System of RiceIntensification (SRI) is also being practised in many parts of Asia and the Pacific Region. SRI holdspromise, especially where ground water table has gone down fast and the traditional practice ofapplying too much water in paddy cultivation is continuing. Both the examples of ‘zero tillage’ andSRI can be pursued in some of the low productivity areas also. However, it has not caught therequisite attention of policy makers. Extension of both these measures would be helpful to raiseproductivity and save resources in low productivity areas.
Excessive and/or unbalanced use of chemical fertilizers without caring for proper application ofmicronutrients in intensive agriculture is not only causing damage to soil fertility and water qualitybut also making wasteful use of subsidy on fertilizer and pesticide in some of the countries of Asiaand the Pacific Region. The green revolution areas of India are examples of areas that overusechemical fertilizer and pesticides, and the situation is not very different in the Punjab province ofPakistan. To a large extent, the policy of providing heavy subsidy on urea induced overuse ofnitrogenous fertilizers. Recently, India has announced a policy of providing nutrient-based subsidy topromote a more balanced use of fertilizers.
Policies relating to output price and procurement of agricultural commodities are also instrumental inperpetuating a particular cropping pattern as part of intensive cultivation. Continuation of rice-wheatcombination in Indo-Gangetic plain is partly the result of minimum support price (MSP) and amassive state procurement of wheat and rice in India. Such a policy for more than two decades hasdiscouraged agricultural diversification in the areas of the green revolution.
5.5.2. ENHANCING PRODUCTIVITY IN AREAS WITH SIGNIFICANT POTENTIAL
One of the obstacles to the extension of green revolution technology is the state policy itself. Forexample, the output price and procurement policies and input subsidies (water, electricity andfertilizer) all favour the areas of intensive agriculture, particularly important for national foodsecurity. The national as well as sub-national governments need to pay attention to the reorientation ofprice and procurement policies that focus better on less favoured/low productivity areas. However,scaling down of input and output subsidies and their transfer to these areas is politically difficult195.Although empirical evidence is substantial, political constituency for such reform needs nurturing.
Application of Bt cotton by small farmers in areas not so abundant in water resources (ground as wellas surface water) has shown success in India and China. State policy has played an important role inensuring that Bt cotton’s benefits are tested prior to releasing it for use by the farmers. A similarapproach is needed for several other crops, such as maize and soybean. Special attention is requiredfor R&D in developing varieties for drought and flood prone areas. Focus on developing R&Dcapacity is an important step in all such cases.
Focus is also required on reducing intensification in livestock and its sub-sectors, on the one hand,and developing an integrated system of crops and livestock production, on the other. The first onewould reduce damage to the environment and the latter would enhance income and employment inlow productivity areas, especially for smallholders and women.
Significant potential exists to increase rice productivity among the 100 million farm households in theregion, who grow rice in four distinct unfavourable environments—upland systems, and drought-
195 Birner and Resnick, 2010; Rashid et al, 2007.
61
prone, submergence-prone, and salt-affected areas. Development of resilient varieties and appropriatecrop management practices can help increase yields in such ecosystems.
5.5.3. COLLABORATION OF INTERNATIONAL AGENCIES, NGOS AND NATIONALGOVERNMENTS
R&D activity, particularly in the frontier areas of biotechnology (developing transgenic varieties),requires both financial and human (scientific) resources. Developing Bt cotton, ‘zero tillage’ systemand SRI, are the examples of success stories of multi-agency collaboration. These successes call forproactive policy. Simultaneously, at the domestic level, both public and private resources need to bemobilized for R&D. Equally important is to work with local communities to take themessage/technology to smallholders. In order to make collaborative efforts a reality, it is important tohave a clear long-term vision, willingness to decentralize authority at different levels (national, sub-national and local), develop the necessary R&D infrastructure, and have openness to innovative(sometimes non conventional) ideas. A lack of one or more of these factors may jeopardize therequired collaborative efforts.
5.6. KEY MESSAGES
First, every effort to make agriculture sustainable must focus on smallholders if agriculture is tobecome a pathway out of poverty. All the sub-sectors (crop, animal husbandry, fisheries and forestry)need to be considered in an integrated fashion.
Second, agriculture contributes substantially to GDP growth and poverty reduction. Asia and thePacific Region as a whole would need a 56 per cent increase in agricultural ODA, a 28 per centincrease in agricultural expenditure, a 23 per cent increase in fertilizer use, or a 24 per cent increase inagricultural investment in 2007-13 for achieving MDG 1 (at US$2 poverty line) over historical trends(but with varying sub-regional requirements).
Third, advantages of R&D have accrued mainly to the favoured/irrigated areas. Larger investmentsare needed in technologies for less-favoured/low irrigated/low productivity areas. Diversion ofresources used in input and output subsidies – which do not serve the poor – to such investments isnecessary, if politically feasible.
Fourth, the emerging agenda for sustainable development in this region must focus on (a) makingagriculture less risky for smallholders; (b) conserving the environment and raising productivity; and(c) implementing the necessary adaptation and mitigation measures to counteract the adverse effectsof climate change, despite resistance to the latter on equity and efficiency grounds. Adaptation,however, deserves greater emphasis.
Fifth, scientific knowledge has the character of being transnational. The development of modernvarieties, evolution of GMOs, adoption of SRI and ‘Zero tillage’, all need serious efforts by severalagencies. Further, at the local level, efforts are required by government agencies, extension agents,and local leaders to take innovative approaches to the people.
62
CHAPTER 6: CREATING OPPORTUNITIES IN THE RURAL NON-FARM ECONOMY
6.1. INTRODUCTION
It is now well recognized that rural economies are not purely agricultural and that farm householdsacross the developing world earn an increasing share of their income from non-farm activities. It isalso acknowledged that agriculture per se cannot be a way out of poverty for all rural people. Withconstraints on farm expansion and continuing growth of rural population, greater attention is thusbeing given to non-farm activities196. For many rural households (especially for those who find part-time or seasonal employment in the non-farm sector), rural non-farm economy (RNFE) serves todiversify incomes and mitigate risks. Amid growing landlessness, poor households also depend onnon-farm earnings for their survival. In many situations, RNFE is of substantial importance to womenand the youth, who aspire to move beyond agriculture.
The RNFE consists of a wide range of activities whose character depends on local economicconditions. It covers everything, from low-return street-vending to qualified jobs in the formal ruralsector. It is thus not straightforward to identify the role of non-farm activities in economicdevelopment, as there is a great deal of diversity in their skill composition.
Two major factors that act as incentives for households to diversify into RNFE can be classified as‘demand-pull’ and ‘distress-push’. Pull factors include higher pay-offs from or lower risks in ruralnon-farm activities than those related to farm activities. Some of the push factors include a drop ofseasonal income from farming, a permanent drop in farming income or a decline in the average size ofland holdings. Empirical evidence shows that high initial stocks of human, financial and physicalcapital enables rich households to obtain skilled employment and purchase the necessary equipmentfor exploiting high return opportunities in RNFE197. As a result, these households earn returns that arefar greater than those earned by poor households. In India, for instance, while the ratio of non-farm toagricultural income is 4.5 to 1 for the average household, for the poor it is only 0.75 to 1198.
6.2. THE RURAL NON-FARM ECONOMY
6.2.1. COMPOSITION, CHARACTERISTICS AND IMPORTANCE TO RURAL PEOPLE
For most of the countries of Asia and the Pacific, rural households receive substantial incomes fromnon-farm activities. On average, rural non-farm income (RNFY) constitutes roughly 50 per cent ofrural household income in this region, varying from over 70 per cent for the Philippines and Sri Lankato below 40 per cent for China, India and Nepal. However, the significance of non-farm income overtime has varied between countries. For instance, while in the Philippines, the share of non-farmincome increased from 51 per cent to 77 per cent over the period 1994 to 1998, the same increased ata much slower rate in Pakistan. In Vietnam, on the other hand, the share remained more or less stableat about 40 per cent over the period 1998 to 2002.
Policy interest in RNFE arises not just because of its significance in generating incomes, but alsobecause of its increasing importance in creating employment, especially for rural women and the poor.Almost a quarter of Asia and Pacific women are employed full-time in RNFE. Women dominatemany of the low wage cottage industries. For example, 64 per cent of the women in Bangladesh work
196 Haggblade et al., 2007, 2010; Unni and Raveendran, 2007; Eswaran et al., 2008; Gaiha and Imai, 2007;Lanjouw and Murgai, 2008; Kaur et al., 2010.197 In addition, availability of infrastructure, such as roads and electricity, also enables diversification of ruralhouseholds into non-farm activities.198 Lanjouw and Shariff, 2004.
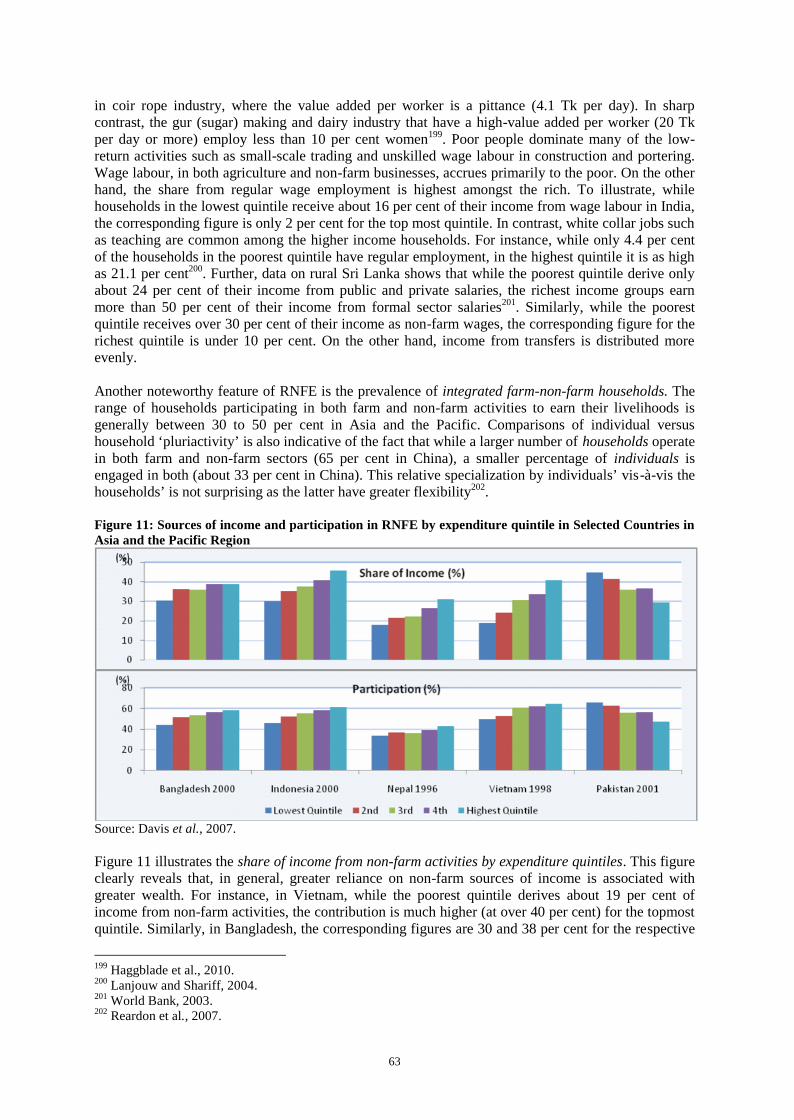
63
in coir rope industry, where the value added per worker is a pittance (4.1 Tk per day). In sharpcontrast, the gur (sugar) making and dairy industry that have a high-value added per worker (20 Tkper day or more) employ less than 10 per cent women199. Poor people dominate many of the low-return activities such as small-scale trading and unskilled wage labour in construction and portering.Wage labour, in both agriculture and non-farm businesses, accrues primarily to the poor. On the otherhand, the share from regular wage employment is highest amongst the rich. To illustrate, whilehouseholds in the lowest quintile receive about 16 per cent of their income from wage labour in India,the corresponding figure is only 2 per cent for the top most quintile. In contrast, white collar jobs suchas teaching are common among the higher income households. For instance, while only 4.4 per centof the households in the poorest quintile have regular employment, in the highest quintile it is as highas 21.1 per cent200. Further, data on rural Sri Lanka shows that while the poorest quintile derive onlyabout 24 per cent of their income from public and private salaries, the richest income groups earnmore than 50 per cent of their income from formal sector salaries201. Similarly, while the poorestquintile receives over 30 per cent of their income as non-farm wages, the corresponding figure for therichest quintile is under 10 per cent. On the other hand, income from transfers is distributed moreevenly.
Another noteworthy feature of RNFE is the prevalence of integrated farm-non-farm households. Therange of households participating in both farm and non-farm activities to earn their livelihoods isgenerally between 30 to 50 per cent in Asia and the Pacific. Comparisons of individual versushousehold ‘pluriactivity’ is also indicative of the fact that while a larger number of households operatein both farm and non-farm sectors (65 per cent in China), a smaller percentage of individuals isengaged in both (about 33 per cent in China). This relative specialization by individuals’ vis-à-vis thehouseholds’ is not surprising as the latter have greater flexibility202.
Figure 11: Sources of income and participation in RNFE by expenditure quintile in Selected Countries inAsia and the Pacific Region
Source: Davis et al., 2007.
Figure 11 illustrates the share of income from non-farm activities by expenditure quintiles. This figureclearly reveals that, in general, greater reliance on non-farm sources of income is associated withgreater wealth. For instance, in Vietnam, while the poorest quintile derives about 19 per cent ofincome from non-farm activities, the contribution is much higher (at over 40 per cent) for the topmostquintile. Similarly, in Bangladesh, the corresponding figures are 30 and 38 per cent for the respective
199 Haggblade et al., 2010.200 Lanjouw and Shariff, 2004.201 World Bank, 2003.202 Reardon et al., 2007.
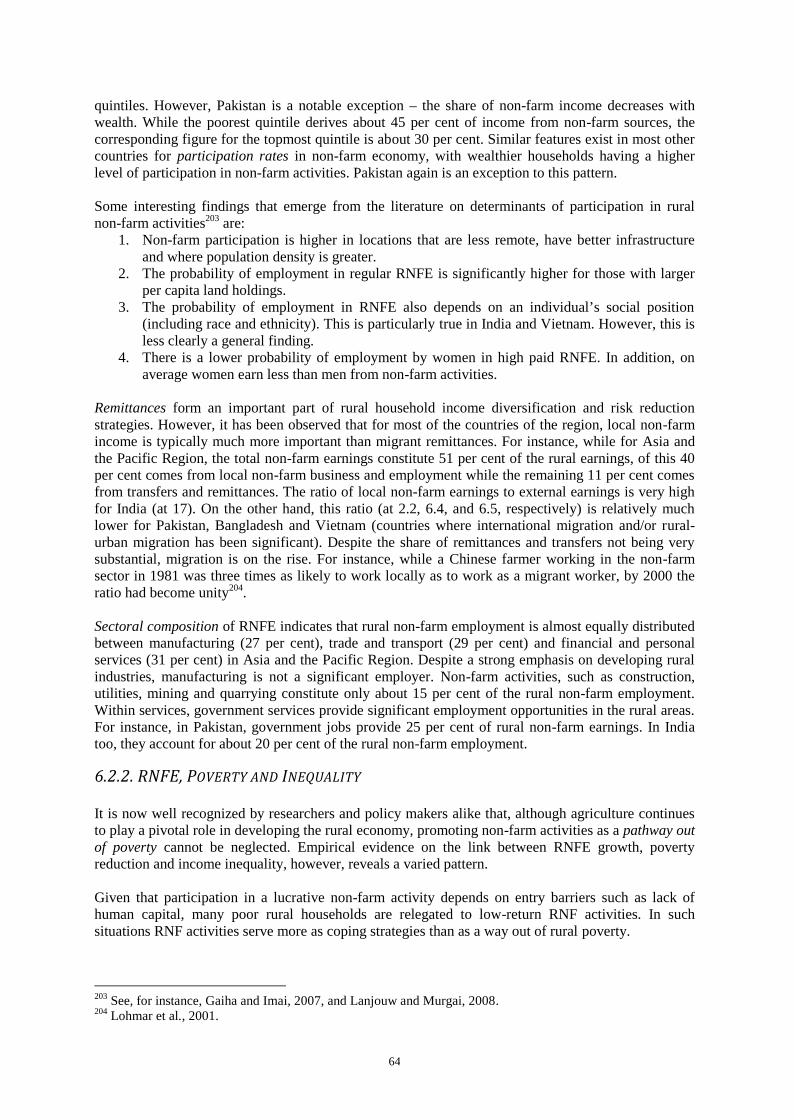
64
quintiles. However, Pakistan is a notable exception – the share of non-farm income decreases withwealth. While the poorest quintile derives about 45 per cent of income from non-farm sources, thecorresponding figure for the topmost quintile is about 30 per cent. Similar features exist in most othercountries for participation rates in non-farm economy, with wealthier households having a higherlevel of participation in non-farm activities. Pakistan again is an exception to this pattern.
Some interesting findings that emerge from the literature on determinants of participation in ruralnon-farm activities203 are:
1. Non-farm participation is higher in locations that are less remote, have better infrastructureand where population density is greater.
2. The probability of employment in regular RNFE is significantly higher for those with largerper capita land holdings.
3. The probability of employment in RNFE also depends on an individual’s social position(including race and ethnicity). This is particularly true in India and Vietnam. However, this isless clearly a general finding.
4. There is a lower probability of employment by women in high paid RNFE. In addition, onaverage women earn less than men from non-farm activities.
Remittances form an important part of rural household income diversification and risk reductionstrategies. However, it has been observed that for most of the countries of the region, local non-farmincome is typically much more important than migrant remittances. For instance, while for Asia andthe Pacific Region, the total non-farm earnings constitute 51 per cent of the rural earnings, of this 40per cent comes from local non-farm business and employment while the remaining 11 per cent comesfrom transfers and remittances. The ratio of local non-farm earnings to external earnings is very highfor India (at 17). On the other hand, this ratio (at 2.2, 6.4, and 6.5, respectively) is relatively muchlower for Pakistan, Bangladesh and Vietnam (countries where international migration and/or rural-urban migration has been significant). Despite the share of remittances and transfers not being verysubstantial, migration is on the rise. For instance, while a Chinese farmer working in the non-farmsector in 1981 was three times as likely to work locally as to work as a migrant worker, by 2000 theratio had become unity204.
Sectoral composition of RNFE indicates that rural non-farm employment is almost equally distributedbetween manufacturing (27 per cent), trade and transport (29 per cent) and financial and personalservices (31 per cent) in Asia and the Pacific Region. Despite a strong emphasis on developing ruralindustries, manufacturing is not a significant employer. Non-farm activities, such as construction,utilities, mining and quarrying constitute only about 15 per cent of the rural non-farm employment.Within services, government services provide significant employment opportunities in the rural areas.For instance, in Pakistan, government jobs provide 25 per cent of rural non-farm earnings. In Indiatoo, they account for about 20 per cent of the rural non-farm employment.
6.2.2. RNFE, POVERTY AND INEQUALITY
It is now well recognized by researchers and policy makers alike that, although agriculture continuesto play a pivotal role in developing the rural economy, promoting non-farm activities as a pathway outof poverty cannot be neglected. Empirical evidence on the link between RNFE growth, povertyreduction and income inequality, however, reveals a varied pattern.
Given that participation in a lucrative non-farm activity depends on entry barriers such as lack ofhuman capital, many poor rural households are relegated to low-return RNF activities. In suchsituations RNF activities serve more as coping strategies than as a way out of rural poverty.
203 See, for instance, Gaiha and Imai, 2007, and Lanjouw and Murgai, 2008.204 Lohmar et al., 2001.
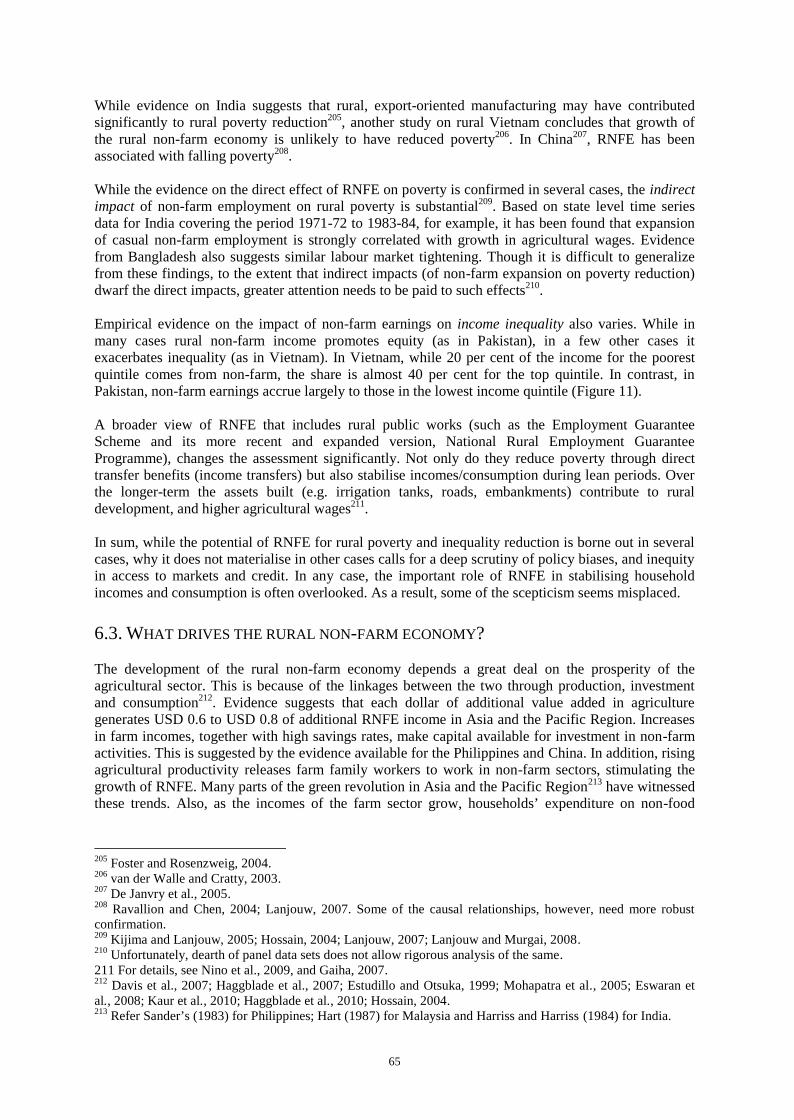
65
While evidence on India suggests that rural, export-oriented manufacturing may have contributedsignificantly to rural poverty reduction205, another study on rural Vietnam concludes that growth ofthe rural non-farm economy is unlikely to have reduced poverty206. In China207, RNFE has beenassociated with falling poverty208.
While the evidence on the direct effect of RNFE on poverty is confirmed in several cases, the indirectimpact of non-farm employment on rural poverty is substantial209. Based on state level time seriesdata for India covering the period 1971-72 to 1983-84, for example, it has been found that expansionof casual non-farm employment is strongly correlated with growth in agricultural wages. Evidencefrom Bangladesh also suggests similar labour market tightening. Though it is difficult to generalizefrom these findings, to the extent that indirect impacts (of non-farm expansion on poverty reduction)dwarf the direct impacts, greater attention needs to be paid to such effects210.
Empirical evidence on the impact of non-farm earnings on income inequality also varies. While inmany cases rural non-farm income promotes equity (as in Pakistan), in a few other cases itexacerbates inequality (as in Vietnam). In Vietnam, while 20 per cent of the income for the poorestquintile comes from non-farm, the share is almost 40 per cent for the top quintile. In contrast, inPakistan, non-farm earnings accrue largely to those in the lowest income quintile (Figure 11).
A broader view of RNFE that includes rural public works (such as the Employment GuaranteeScheme and its more recent and expanded version, National Rural Employment GuaranteeProgramme), changes the assessment significantly. Not only do they reduce poverty through directtransfer benefits (income transfers) but also stabilise incomes/consumption during lean periods. Overthe longer-term the assets built (e.g. irrigation tanks, roads, embankments) contribute to ruraldevelopment, and higher agricultural wages211.
In sum, while the potential of RNFE for rural poverty and inequality reduction is borne out in severalcases, why it does not materialise in other cases calls for a deep scrutiny of policy biases, and inequityin access to markets and credit. In any case, the important role of RNFE in stabilising householdincomes and consumption is often overlooked. As a result, some of the scepticism seems misplaced.
6.3. WHAT DRIVES THE RURAL NON-FARM ECONOMY?
The development of the rural non-farm economy depends a great deal on the prosperity of theagricultural sector. This is because of the linkages between the two through production, investmentand consumption212. Evidence suggests that each dollar of additional value added in agriculturegenerates USD 0.6 to USD 0.8 of additional RNFE income in Asia and the Pacific Region. Increasesin farm incomes, together with high savings rates, make capital available for investment in non-farmactivities. This is suggested by the evidence available for the Philippines and China. In addition, risingagricultural productivity releases farm family workers to work in non-farm sectors, stimulating thegrowth of RNFE. Many parts of the green revolution in Asia and the Pacific Region213 have witnessedthese trends. Also, as the incomes of the farm sector grow, households’ expenditure on non-food
205 Foster and Rosenzweig, 2004.206 van der Walle and Cratty, 2003.207 De Janvry et al., 2005.208 Ravallion and Chen, 2004; Lanjouw, 2007. Some of the causal relationships, however, need more robustconfirmation.209 Kijima and Lanjouw, 2005; Hossain, 2004; Lanjouw, 2007; Lanjouw and Murgai, 2008.210 Unfortunately, dearth of panel data sets does not allow rigorous analysis of the same.211 For details, see Nino et al., 2009, and Gaiha, 2007.212 Davis et al., 2007; Haggblade et al., 2007; Estudillo and Otsuka, 1999; Mohapatra et al., 2005; Eswaran etal., 2008; Kaur et al., 2010; Haggblade et al., 2010; Hossain, 2004.213 Refer Sander’s (1983) for Philippines; Hart (1987) for Malaysia and Harriss and Harriss (1984) for India.
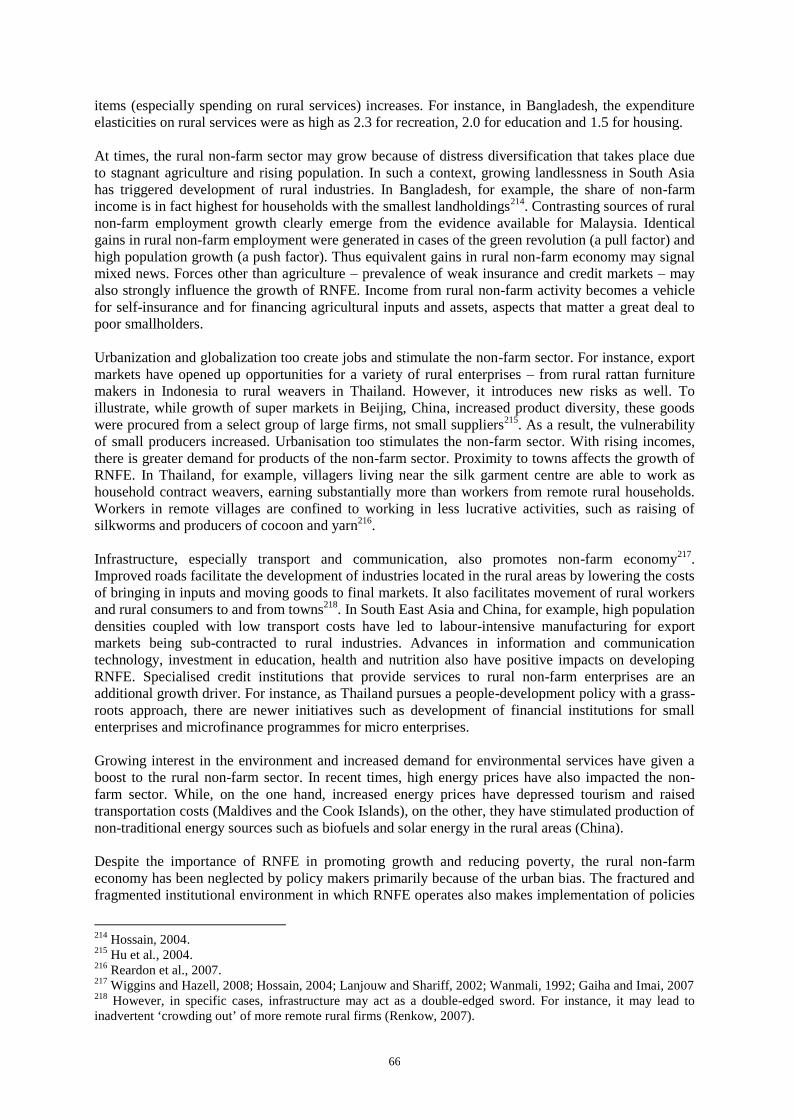
66
items (especially spending on rural services) increases. For instance, in Bangladesh, the expenditureelasticities on rural services were as high as 2.3 for recreation, 2.0 for education and 1.5 for housing.
At times, the rural non-farm sector may grow because of distress diversification that takes place dueto stagnant agriculture and rising population. In such a context, growing landlessness in South Asiahas triggered development of rural industries. In Bangladesh, for example, the share of non-farmincome is in fact highest for households with the smallest landholdings214. Contrasting sources of ruralnon-farm employment growth clearly emerge from the evidence available for Malaysia. Identicalgains in rural non-farm employment were generated in cases of the green revolution (a pull factor) andhigh population growth (a push factor). Thus equivalent gains in rural non-farm economy may signalmixed news. Forces other than agriculture – prevalence of weak insurance and credit markets – mayalso strongly influence the growth of RNFE. Income from rural non-farm activity becomes a vehiclefor self-insurance and for financing agricultural inputs and assets, aspects that matter a great deal topoor smallholders.
Urbanization and globalization too create jobs and stimulate the non-farm sector. For instance, exportmarkets have opened up opportunities for a variety of rural enterprises – from rural rattan furnituremakers in Indonesia to rural weavers in Thailand. However, it introduces new risks as well. Toillustrate, while growth of super markets in Beijing, China, increased product diversity, these goodswere procured from a select group of large firms, not small suppliers215. As a result, the vulnerabilityof small producers increased. Urbanisation too stimulates the non-farm sector. With rising incomes,there is greater demand for products of the non-farm sector. Proximity to towns affects the growth ofRNFE. In Thailand, for example, villagers living near the silk garment centre are able to work ashousehold contract weavers, earning substantially more than workers from remote rural households.Workers in remote villages are confined to working in less lucrative activities, such as raising ofsilkworms and producers of cocoon and yarn216.
Infrastructure, especially transport and communication, also promotes non-farm economy217.Improved roads facilitate the development of industries located in the rural areas by lowering the costsof bringing in inputs and moving goods to final markets. It also facilitates movement of rural workersand rural consumers to and from towns218. In South East Asia and China, for example, high populationdensities coupled with low transport costs have led to labour-intensive manufacturing for exportmarkets being sub-contracted to rural industries. Advances in information and communicationtechnology, investment in education, health and nutrition also have positive impacts on developingRNFE. Specialised credit institutions that provide services to rural non-farm enterprises are anadditional growth driver. For instance, as Thailand pursues a people-development policy with a grass-roots approach, there are newer initiatives such as development of financial institutions for smallenterprises and microfinance programmes for micro enterprises.
Growing interest in the environment and increased demand for environmental services have given aboost to the rural non-farm sector. In recent times, high energy prices have also impacted the non-farm sector. While, on the one hand, increased energy prices have depressed tourism and raisedtransportation costs (Maldives and the Cook Islands), on the other, they have stimulated production ofnon-traditional energy sources such as biofuels and solar energy in the rural areas (China).
Despite the importance of RNFE in promoting growth and reducing poverty, the rural non-farmeconomy has been neglected by policy makers primarily because of the urban bias. The fractured andfragmented institutional environment in which RNFE operates also makes implementation of policies
214 Hossain, 2004.215 Hu et al., 2004.216 Reardon et al., 2007.217 Wiggins and Hazell, 2008; Hossain, 2004; Lanjouw and Shariff, 2002; Wanmali, 1992; Gaiha and Imai, 2007218 However, in specific cases, infrastructure may act as a double-edged sword. For instance, it may lead toinadvertent ‘crowding out’ of more remote rural firms (Renkow, 2007).
67
difficult. Diversity and heterogeneity of RNFE compounds the problem. In addition, weak collectivepolitical voice of RNFE limits the pressures and incentives for politicians to respond. Such policyneglect towards RNFE needs to be reversed. Fortunately, many countries have realized this and arenow taking keen interest in promoting RNFE.
6.4. POLICIES TO PROMOTE THE RURAL NON-FARM ECONOMY
Often the growth of the RNFE is self-directed and driven by the increasing demand for its products.However, in many other cases, stringent policy measures, such as tight controls and protection, haveled to the development of this sector. The programmes to promote the rural non-farm economybroadly consist of promotion of small-scale industry, agribusiness and agricultural marketing, regionaldevelopment, public sector investment, and, macroeconomic policies targeted at rural areas219.
Governments specifically have an important role to play in the promotion of the rural non-farm sectoron both efficiency and equity grounds. They may directly influence the rural non-farm sector throughthe development of specially targeted rural infrastructure, such as roads, telecommunications,education, power and water, and by designing programmes that provide inputs, credit and training tohouseholds for the development of RNFE. The indirect measures consist of policies related to trade,tariffs and licensing, which impact industries and agricultural policies, such as investmentprogrammes. In Sri Lanka, for instance, trade liberalisation in the 1970s severely curtailed the ruralhandloom and pottery industry, while it benefited the rice-milling and construction industry that usedimported raw material220. Apart from governments, large private firms and not-for-profit institutionsalso promote rural non-farm activity. For instance, the private sector development wing of theCambodia Rehabilitation and Resettlement programme, which started in 1995, aimed to strengthenrural industries including small private manufacturing units, such as rice millers, brick makers andsmall-scale electricity manufacturers. In 2000, the private sector wing became an NGO,Entrepreneurship Development of Cambodia, and focuses on private sector and social capitaldevelopment in the rural areas.
The options for policymakers can be classified into three categories: Policies at the national level,such as creating a favourable business environment; policies at the regional level, such as provision ofphysical and social infrastructure that facilitate the development of efficient supply chains and factormarkets; and policies at the local level, such as training and facilitating migration that encouragehouseholds to undertake non-farm activities.
219 Haggblade et al., 2007.220 Osmani, 1987.
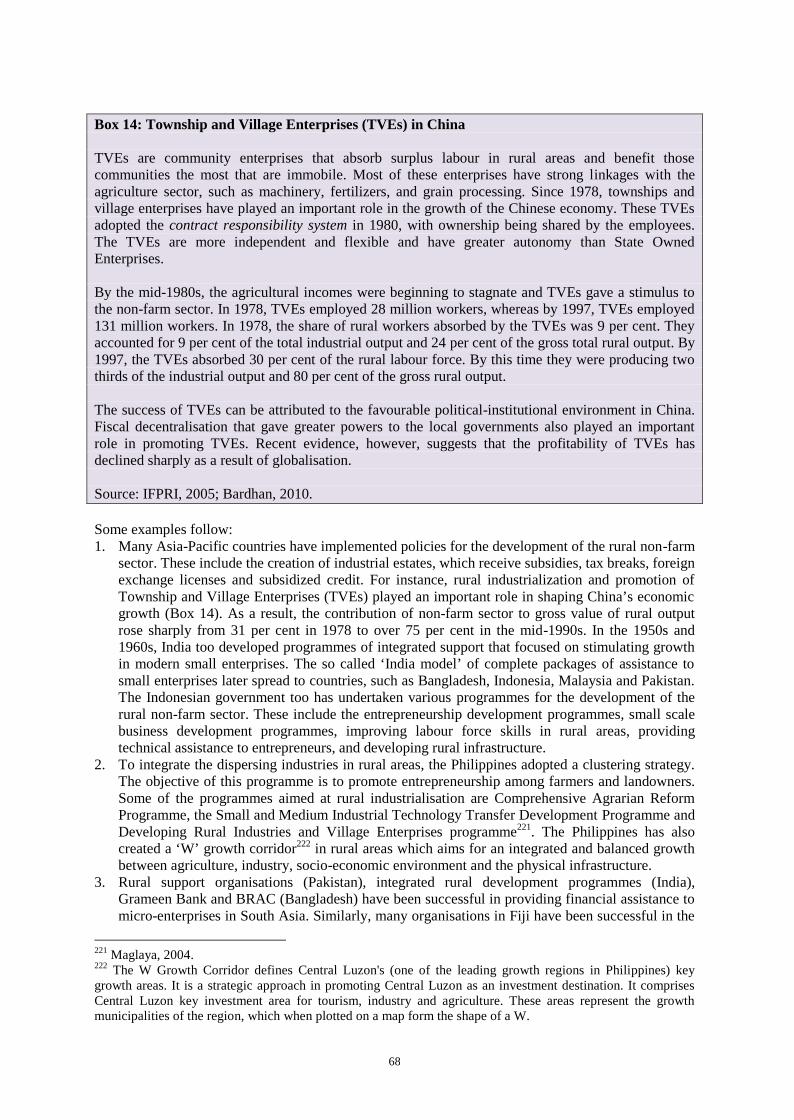
68
Box 14: Township and Village Enterprises (TVEs) in China
TVEs are community enterprises that absorb surplus labour in rural areas and benefit thosecommunities the most that are immobile. Most of these enterprises have strong linkages with theagriculture sector, such as machinery, fertilizers, and grain processing. Since 1978, townships andvillage enterprises have played an important role in the growth of the Chinese economy. These TVEsadopted the contract responsibility system in 1980, with ownership being shared by the employees.The TVEs are more independent and flexible and have greater autonomy than State OwnedEnterprises.
By the mid-1980s, the agricultural incomes were beginning to stagnate and TVEs gave a stimulus tothe non-farm sector. In 1978, TVEs employed 28 million workers, whereas by 1997, TVEs employed131 million workers. In 1978, the share of rural workers absorbed by the TVEs was 9 per cent. Theyaccounted for 9 per cent of the total industrial output and 24 per cent of the gross total rural output. By1997, the TVEs absorbed 30 per cent of the rural labour force. By this time they were producing twothirds of the industrial output and 80 per cent of the gross rural output.
The success of TVEs can be attributed to the favourable political-institutional environment in China.Fiscal decentralisation that gave greater powers to the local governments also played an importantrole in promoting TVEs. Recent evidence, however, suggests that the profitability of TVEs hasdeclined sharply as a result of globalisation.
Source: IFPRI, 2005; Bardhan, 2010.
Some examples follow:1. Many Asia-Pacific countries have implemented policies for the development of the rural non-farm
sector. These include the creation of industrial estates, which receive subsidies, tax breaks, foreignexchange licenses and subsidized credit. For instance, rural industrialization and promotion ofTownship and Village Enterprises (TVEs) played an important role in shaping China’s economicgrowth (Box 14). As a result, the contribution of non-farm sector to gross value of rural outputrose sharply from 31 per cent in 1978 to over 75 per cent in the mid-1990s. In the 1950s and1960s, India too developed programmes of integrated support that focused on stimulating growthin modern small enterprises. The so called ‘India model’ of complete packages of assistance tosmall enterprises later spread to countries, such as Bangladesh, Indonesia, Malaysia and Pakistan.The Indonesian government too has undertaken various programmes for the development of therural non-farm sector. These include the entrepreneurship development programmes, small scalebusiness development programmes, improving labour force skills in rural areas, providingtechnical assistance to entrepreneurs, and developing rural infrastructure.
2. To integrate the dispersing industries in rural areas, the Philippines adopted a clustering strategy.The objective of this programme is to promote entrepreneurship among farmers and landowners.Some of the programmes aimed at rural industrialisation are Comprehensive Agrarian ReformProgramme, the Small and Medium Industrial Technology Transfer Development Programme andDeveloping Rural Industries and Village Enterprises programme221. The Philippines has alsocreated a ‘W’ growth corridor222 in rural areas which aims for an integrated and balanced growthbetween agriculture, industry, socio-economic environment and the physical infrastructure.
3. Rural support organisations (Pakistan), integrated rural development programmes (India),Grameen Bank and BRAC (Bangladesh) have been successful in providing financial assistance tomicro-enterprises in South Asia. Similarly, many organisations in Fiji have been successful in the
221 Maglaya, 2004.222 The W Growth Corridor defines Central Luzon's (one of the leading growth regions in Philippines) keygrowth areas. It is a strategic approach in promoting Central Luzon as an investment destination. It comprisesCentral Luzon key investment area for tourism, industry and agriculture. These areas represent the growthmunicipalities of the region, which when plotted on a map form the shape of a W.
69
creation of jobs in rural areas, such as Small Business Advisory Unit (SBAU), Micro-FinanceDepartment, Ministry of Cooperatives, and Ministry of Women.
4. Donor funded programmes in Vietnam and China are focusing more on migrants to promoteRNFE. For instance, in China, the government relaxed its requirements for migrants who move tocities. In India too, Rajasthan introduced mobile ration cards for its migrants, while Orissa andMadhya Pradesh introduced improvements in the safety and efficiency of remittances223.
5. In Taiwan, rural electrification had a positive impact on the industrialisation of the rural sector. InChina, electrification led to better water management, improving agricultural yields and incomesand, because of the linkages between farm and non-farm sector, indirectly helped the rural non-farm economy. However, rural electrification had a negative impact on the Bangladesh riceprocessing industry by displacing labour, especially women who used indigenous, labourintensive methods224.
6. Education is a strong determinant of household participation and of the level of wage earned inRNF activities. In most Asia-Pacific countries, technical and vocational training is given dueimportance to meet the rapidly changing requirements at the global, regional and national levels.Development of technical and vocational skills has a crucial role to play in promoting capabilitiesof the youth to access opportunities in rural and urban areas. In Singapore and Korea, the trainingcontent is selected in a way such that it is relevant not only for the specific job but also fortransfer of jobs. Thailand encourages the private sector to provide technical and vocationaltraining (TVET). Bangladesh has introduced the National Skill Standards to improve the qualityof TVET. Public institutions play an important role in TVET in Malaysia where the entirecertification and standards process is coordinated by the National Vocational Training Council.Other examples of training initiatives include farmer field schools in the Philippines and Thailand,community polytechnics in India and 4HC clubs in Thailand225.
6.5. KEY MESSAGES
First, although agriculture will continue to play a pivotal role in developing the rural economy andreducing poverty, promoting non-farm activities as a pathway out of poverty cannot be neglected.
Second, the direct impact of rural non-farm earnings on static indicators of rural poverty is confirmed.Also, RNFE performs an important safety net role, preventing households from falling into povertywhen faced with shocks. Finally, the indirect effects of rural non-farm employment, through labourmarket tightening and rising real wage rates, remain substantial.
Third, availability of human, financial and physical capital is a major determinant of participation innon-farm activities. Due to paucity of such capital, poor households often remain confined to low-productivity non-farm activities, which offer few pathways out of poverty. By contrast, richer andmore educated households often find more lucrative non-farm opportunities. Likewise, gender, casteand social status also determine the chances of being engaged in more lucrative non-farm jobs. Ingeneral, women and disadvantaged social groups have limited access to the most lucrative rural non-farm activities. Policy biases and inequity in access to markets and credit need to be remedied.
Fourth, rapid growth of agriculture has historically played an important role in promoting RNFE. Inaddition, improved infrastructure, vicinity to towns, globalization and urbanization have opened upnew opportunities for the growth of RNFE. Linking rural areas to external engines of economicgrowth promotes development of RNFE. From a policy perspective, this implies acceleratedinvestments in agricultural research and development, rural education, and rural infrastructure(communications, transportation and electrification). These investments promote growth of highproductivity RNFE but also promote short-term commuting and migration, which, in turn, lead tonon-farm income growth, completing a “virtuous” circle.
223 Wiggins and Hazell, 2008.224 Choi, 2004.225 Atchoarena et al., 2003.
70
CHAPTER 7: WHAT NEEDS TO BE DONE AND HOW?
7.1. ADDRESSING MAJOR CHALLENGES AND CREATING OPPORTUNITIES FOR
TOMORROW’S GENERATION
Poverty is primarily a rural problem in Asia and the Pacific Region. While a large percentage of ruralhouseholds are chronically poor, still greater numbers move in and out of poverty (i.e. transient poor).Therefore, from a policy perspective, it is important to distinguish between the transient andpersistently poor households as the latter require massive transfers sustained over long periods.
The poor typically have low incomes, lack education, physical assets and access to opportunities foreconomic advancement. Such disadvantages are disproportionately more among rural women, theyouth, indigenous peoples and others living in remote mountainous locations.
Although almost every region of Asia and the Pacific experienced massive reduction in the proportionof rural poor over the past two decades, the incidence remains high. The onset of the Triple F crises(fuel, food and financial) has made meeting the MDG 1, (i.e. halving extreme poverty by 2015) agreater challenge. Climate change has exacerbated the problem. How to achieve sustainable growthand simultaneously reduce rural poverty is one of the toughest dilemmas faced by poor countries inthis region.
Agriculture contributes substantially to GDP growth and poverty reduction. Asia and the PacificRegion as a whole would need a 56 per cent increase in agricultural ODA, a 28 per cent increase inagricultural expenditure, a 23 per cent increase in fertilizer use, or a 24 per cent increase inagricultural investment in 2007-13 for achieving MDG 1 (at US$2 poverty line) over historical trends(but with varying sub-regional requirements). So the prospects of achieving MDG 1 are not sodaunting.
Since the rural poor depend on agriculture for their livelihoods, any policy that aims to reduce ruralpoverty has to focus on agricultural intensification and diversification that are both market-orientedand sustainable. A multi-pronged strategy involving simultaneous actions on several fronts is needed:addressing risks and vulnerability, addressing food price volatility, ensuring a favourable ruralinvestment climate, enabling access to agricultural markets, sustainable intensification anddiversification of smallholder farming, responding to climate change, and promoting the rural non-farm economy.
Addressing Risk and Vulnerability: Poverty is not just a matter of deprivation but also ofvulnerability to exogenous shocks. Shocks can trap people in poverty by eroding their assetsand capabilities to a point that they are unable to accumulate enough to move out of poverty.These shocks include natural disasters, climate change, pest outbreaks such as avianinfluenza, vulnerability to food price fluctuations, illness, and death. The region is also highlyvulnerable to fluctuations in energy prices due to its high dependence on fossil fuels. This hasconsiderable impact in terms of vulnerability to food insecurity. Rural communities andhouseholds have a range of mechanisms for coping with downturns. As risk-copingmechanisms, households generally resort to selling productive assets, borrowing, depletingsavings, migrating, and reducing expenditure on food, healthcare and education (notablyaffecting women and children). Although they have developed relatively strong risk-management and risk-coping strategies, vulnerability remains high. Some parts of the region(e.g. Afghanistan, Sri Lanka, Nepal, Bangladesh, and Pakistan) are also affected by instabilityand conflict, or have recently recovered from conflict.
Important policies that need to be strengthened on priority basis for mitigating risks andachieving inclusive rural development include accelerated investments in agricultural R&D
71
and physical and social infrastructure, encouraging development of financial institutions forsmall enterprises and micro-finance programmes for micro-enterprises, strengtheninginsurance interventions for the poor and vulnerable (e.g. index-based insurance such asweather insurance), promoting greater formal and technical education, and developingecosystems services through public-private cooperation for meeting the challenges of waterscarcity and climate change.
Addressing Food Price Volatility: Volatile food prices pose a threat to the rural poor.Domestic food prices have been less volatile in Asia and the Pacific due to more stablesupplies and regulated markets (for instance, in India, Indonesia and Bangladesh). However,some of the poorest countries (e.g. Cambodia) experienced severe hardships. In general, thereare six domains to be taken into account to reduce food price volatility: addressing supply-side constraints (e.g. policies that support access to credit); management of and control overnatural resources; and access to research and extension services; supply-management andprice stabilization policies; safety net programmes; value-addition for agricultural products:redressing price information gaps and asymmetries; and provision of storage facilitiescombined with access to credit for smallholder farmers.
Ensuring a favourable rural investment climate: Both rising demand for and rising prices offood have created attractive investment opportunities in the agricultural sector – especially inlarge farms. In spite of new sources of economies of scale, arising from technological change,new markets, institutional changes, and public-private partnerships in the provision of publicgoods, the large farm advantage is due to market failure (e.g. credit), institutional gaps (e.g.weak extension services) and policy distortion (e.g. minimum support prices). Elimination ofsuch biases against smallholders would enhance their competitiveness. State interventions andcollective action by producers’ organisations would make a significant difference. Absence ofproperty rights and lack of transparency in land deals are key challenges.
Secure land rights can increase incentives for investments. In addition, such security reducesconflicts, assures availability of collateral, improves the bargaining power of the poor andhelps in poverty reduction. However, policy interventions to ensure the same must becarefully designed to ensure equity without upsetting local customs, as in the case ofindigenous peoples. The market for rentals also enhances the opportunity for landless labourto cultivate and make a transition towards owning such land.
Often traditional land systems fail to recognize women’s rights. The first concern is thatwomen should have either joint ownership of land with their spouses, or a joint right to itsdisposal. Secondly, women must be able to maintain their land rights after the death of theirspouses. Gender and land rights in South Asia matter for poverty reduction.
Enabling access to Agricultural Markets: There is a shift from the traditional supply chainscharacterised by many traders and intermediaries and face-to-face interactions betweenagents, towards chains with fewer links and more impersonal dealings. Supermarket chainsoffer better deals to farmers, higher prices and greater certainty of selling the produce, alongwith credit and technical assistance in certain cases. However, farmers are also obliged tomeet stringent quality requirements and adhere to food safety standards. Supermarkets preferdealing with few large farmers rather than many small farmers. Organising small farmers is achallenge. Further, in response to changes in dietary habits and lifestyle, and liberalization ofretail trade, supermarkets with global links are emerging fast. Smallholders’ participation insupply chain/supermarkets can be made profitable if the government plays the role of not onlyproviding public goods (infrastructure, food safety standards, and favourable environment forenforcing contracts) but also a proactive role in collaboration with forward looking privateplayers in providing inputs and transferring technology to smallholders. These initiatives,combined with suitable trade negotiations can be helpful in overcoming the threats that global
72
trade poses to smallholders. The corporate sector can also help smallholders in capturingmarket opportunities in the changing scenario through technical and industrial training. Largeagribusiness firms can also facilitate the integration of small farmers into high qualitymarkets, as in the case of Normin Veggies in Philippines.
Sustainable Intensification and Diversification of Smallholder Farming: Small farmers faceseveral challenges such as high transaction costs in accessing inputs, credit and marketingfacilities. Specifically, it is difficult for them to access high-value crops even though they arelabour intensive and more suited for their size. This is because of highly volatile prices andhigh market risks associated with high-value agricultural commodities. Further, in recentyears, agricultural funding has shifted from public to private research. This change has graveconsequences for small farmers as private research companies lack incentives to address smallfarmers’ concerns.
The emerging agenda for sustainable development in this region must focus on makingagriculture less risky for smallholders; and conserving the environment and raisingproductivity. The development of modern varieties, evolution of GMOs, adoption of SRI and‘Zero tillage’, all need serious efforts by several agencies. Further, at the local level, effortsare required by government agencies, extension agents, and local leaders to take innovativeapproaches to the people.
Environment and Climate Change: Under the different scenarios in the IPCC Special Reporton Emission Scenarios (SRES), the global mean surface temperature is expected to rise, asalso the sea level. Freshwater availability in many parts of Asia is expected to decrease by2050. South, East and South East Asia will be at the greatest risk due to expected flooding.The following impacts on crop productivity may be expected: In areas of mid-to-highlatitudes, productivity is projected to increase slightly with temperature increases between 1-3°C (depending on the crop), and then decrease in some regions. In regions of low latitude,crop productivity is projected to decrease for even small increases in local temperature226.While the search for effective mitigation mechanisms continues, it must be combined withadaptation. The latter, of course, deserves greater attention than it has received.
Strategies of adaptation by smallholders raise specific concerns. They are likely to sufferimpacts of climate change that are locally specific and hard to predict. The variety of crop andlivestock species produced by them, and the importance of non-market relations will increasethe complexity both of the impacts and the subsequent adaptations, relative to commercialfarms with more restricted ranges of crops.
Promoting Non-farm Activities: For most of the countries of Asia and the Pacific, ruralhouseholds receive substantial income from non-farm activities. With constraints on farmexpansion and continuing growth of rural population, development of rural non-farmeconomy (RNFE) has a major role to play in any poverty reducing strategy. The direct impactof rural non-farm earnings on static indicators of rural poverty is confirmed in most cases.Also, RNFE performs an important safety net role, preventing households from falling intopoverty when faced with shocks. The indirect effects of rural non-farm employment, throughlabour market tightening and rising real wage rates, remain substantial. The availability ofhuman, financial and physical capital is a major determinant of participation in non-farmactivities. Policy biases and inequity in access to markets and credit need to be remedied.
Rapid growth of agriculture has historically played an important role in promoting RNFE. Inaddition, improved infrastructure, vicinity to towns, globalization and urbanization haveopened up new opportunities for the growth of RNFE. Linking rural areas to external enginesof economic growth promotes development of RNFE. Policy priorities include accelerated
226 IPCC, 2007.
73
investments in agricultural research and development, rural education, and rural infrastructure(communications, transportation and electrification). These investments promote growth ofhigh productivity RNFE, as also short-term commuting and migration, which, in turn, lead tonon-farm income growth, completing a “virtuous” circle.
For supporting and implementing these policies, effective governance that ensures more inclusivegrowth is crucial. Democratization, civil society participation, decentralization, transparency,accountability and corruption control hold great potential for strengthening governance. Effectivepolicies to reduce poverty should include measures that enhance poor peoples’ access to assets such asland, water, education and health. This requires significant public investments, well defined propertyrights, and effective land administration.
An ideal set of policies would have all these attributes, but, unfortunately, we do not live in an idealworld. Governments have to constantly balance the demands of market-oriented reforms that requireless state intervention with the state’s obligation to ensure that no citizen remains wretchedly poor.For instance, the government needs to create well-defined property rights, which would then enableindigenous peoples transform their customary rights into legal ones. However, these same propertyrights would also accrue to rich farmers with large landholdings, and an imaginative approach toovercoming their opposition to redistribution of land (e.g. through, for example, efficient land andrental markets) is imperative. A merit of this approach is that it will not undermine large-scaleinvestment in agriculture. However, the political feasibility of these reforms is not self evident (Box15).
Box 15: Political Economy of Agricultural Policy Reforms
Interest groups often block agricultural policy reforms that aim to benefit smallholders. As they arespatially dispersed, lack access to education, communication and transport infrastructure, they find itdifficult to defend their economic interests. By contrast, large farmers are not so constrained andpolitically better networked. Besides, there is a strong urban bias in policies as urban populations arecloser to the seat of political power.
Additional barriers to collective action that smallholder face include: (i) the food crops that theymostly produce are grown in the poorer and more remote regions where it is more difficult toorganise; (ii) not only agricultural policies that provide private goods, such as subsidised credit andinputs, are easier to implement than provision of public goods (e.g. roads) but also oftendisproportionately favour large farmers; (iii) the politically more influential large farmers block policyinstruments targeted to smallholders (e.g. size –differentiated input subsidies).
Although these subsidies have become a huge fiscal burden, the nexus of influential rich farmers andpoliticians remains a major impediment. As a result, public investment in agriculture suffers.
Sources: Adapted from Birner and Resnick (2010), Birner et al. (2010).
7.2. FOUR CROSS-CUTTING ISSUES
In order to generate pro-poor and sustainable rural growth, it is important to address four cross-cuttingissues. Each is discussed below:
1. Strengthening individual capabilities: Developing skills and knowledge of poor rural people(especially women, youth, disadvantaged social groups and smallholders) is crucial forbringing dynamism and innovation in agriculture and making it more prosperous andsustainable. It is also vital for promoting job opportunities in high paid RNFE, and for thosewho leave as migrants. This requires focusing on investing in education beyond primary leveland enhancing accessibility and value of vocational skills to the youth and women.
74
2. Improving the risk management capacity of poor rural people: Enhancing risk managementcapacity requires better access to education, promoting gender equality, strengtheninginsurance interventions for the poor and vulnerable, encouraging micro-finance programmes,accelerating investments in agricultural research and development and providing effectivesafety nets and nutritional improvement in rural areas.
3. Strengthening collective capabilities: Membership-based organisations have a key role to playin helping rural poor mitigate risks and market their produce. Such organisations includewomen’s saving clubs, producers’ organisations and farmers’ field schools. To promote theeffectiveness of such organisations, their financial, technical and managerial capabilities needto be strengthened. It must be ensured that these organisations do not exclude thedisadvantaged, benefiting only those with larger resources.
4. Improving the rural environment: In order to improve the rural environment, the focus shouldbe on three areas: provision of physical infrastructure; widening provision of rural services(education, healthcare, insurance and financial services); and improving governance. This willhelp not only in mitigating risks and reducing vulnerabilities of the rural poor, (e.g. associatedwith women’s drudgery), but will also enable newer opportunities for growth anddiversification. This will create a favourable environment for today’s rural youth andtomorrow’s generation to fulfil their aspirations.
7.3. SUPPORTING THIS AGENDA: THE ROLE OF NATIONAL STAKEHOLDERS
Good policies and governance are crucial to address rural poverty. The national government has theprime responsibility to push agriculture on the development agenda and to create a favourableenvironment through macroeconomic stability, political stability and the rule of law. Governmentshave an important role to play in regulation, provision of public goods, investments in infrastructureand R&D, provision of credit facilities and markets, defining property rights, enforcement of rules anddevelopment of institutions. The National Rural Employment Guarantee Act (NREGA) and Right toFood Bill in India, the National Emergency Employment Programme for Rural Access (NEEPRA)and Food for Work in Afghanistan, and the Household Responsibility System in China are some of theflagship programmes of national governments aimed at reducing vulnerability and poverty in ruralareas deploying both risk mitigation and risk coping strategies.
Despite pervasive market failures, there is a crucial role for the private sector. Coordinated actions ofpublic, private and civil society can help mitigate risks that smallholders face, reduce transaction costsand create incentives for private investment in critical services in agriculture. The private sector canalso carry forward reforms through public-private dialogues, as in the case of the Working Group onAgriculture and Agribusiness in Cambodia’s Government-Private Sector Forum. Moreover, theprivate sector can contribute to trade policy reforms, as in the case of the Philippines Task Force onthe World Trade Organisation Agreement on Agriculture Re-negotiations.
NGOs have a crucial role to play in generating bottom-up demands. Collective action, throughproducer organisations and self-help groups can help achieve economies of scale in input supply,access to markets and finance, and management of common property resources. They can also be aneffective way to impart training and increase awareness. Examples include Self-Help Groups in India,Zanzeras in Philippines offering community management of irrigation systems, and the Mobile-Ladyin Bangladesh providing water testing services to farmers and increasing awareness about variouscrops. Good governance needs to ensure that collective action does not exclude disadvantaged groupsfavouring only the elite.
On the international front, to usher in the welfare impacts of trade liberalisation, the Doha round oftrade negotiations must urgently be concluded, particularly to eliminate distortions, such as US cottonsubsidies that work against the interests of poor countries. When smallholders are net food buyers,liberalisation of import policies will be pro-poor. However, if many of the country’s households are
75
poor net sellers, they indeed will lose. Thus, programmes tailored to country-specific circumstanceswill be needed. Making agriculture more sustainable has to be a priority.
7.4. SUPPORTING THIS AGENDA: THE ROLE OF INTERNATIONAL DEVELOPMENT
AGENCIES
Rural development’s visibility has increased on the global agenda. To a large extent, the triple F(food, fuel, financial) crises have been responsible for this. In recent years, the internationaldevelopment community has taken a number of initiatives that demonstrate its commitment topromote rural development. Some of these are delineated below:
1. The Comprehensive Framework for Action (UN High Level Task Force on Global Food Crisis):The comprehensive framework for action was set up to address the threats and opportunities fromthe food price crisis and adopt policies that would prevent such a crisis from occurring in thefuture. The high level task force works with regional organisations such as Association of SouthEast Asian Nations (ASEAN) and regional multilateral banks to support agricultural developmentand provide social protection. UN agencies and Bretton Woods Institutions, including IFAD,FAO, World Food Programme (WFP) and Office for the Coordination of Humanitarian Affairs(OCHA), and the World Bank, have already enhanced funding and/ or appealed for funding toreduce vulnerability, boost agricultural production, and mitigate the impact of future food andenergy crises.
2. The 2009 L’Aquila Food Security Initiative: The global financial crisis, following on the foodcrisis, led to this initiative for sustainable global food security. It is also committed to reverse thedecline in ODA and national financing to agriculture. In pursuing food security, the L’Aquilainitiative partners with vulnerable countries to help them develop and implement their own foodsecurity strategies. However, as against a pledge by G8 of $22 billion for investment inagriculture, to date, barely $1.2 billion has been disbursed. But even if resource commitments arehonoured – unlikely with fiscal austerity looming large among the G8 – there is hardly anyconsensus on how to spend this amount227.
3. Global Forum for Agricultural Research: The three main objectives of the forum are: alleviationof rural poverty, food security and sustainable natural resource management. Two of its regionalnetworks in Asia and the Pacific are: APAARI – Asia-Pacific Association of AgriculturalResearch Institutions, and CACAARI – Central Asia and the Caucasus Association ofAgricultural Research Institutions. These fora connect agricultural research and innovationsystems with farmers and societies. For instance, the Asian Federation for InformationTechnology Associations (AFITA) emphasizes the use of advanced ICT and high qualityinformation in agriculture-based production.
4. Global Forum for Rural Advisory Services: Set up in 2010, the forum provides rural advisoryservices with the goal of reducing hunger and poverty. It aims to connect with Asia-PacificAssociation of Educators on Agriculture and Environment (APEAEN), the Philippines ExtensionNetwork, Inc. and the Caucasus Association of Agricultural Research Institutions (CACAARI) tofacilitate interaction and networking for individual, organisational, and institutional capacitystrengthening in Rural Advisory Services.
5. Consultative Group on International Agricultural Research (CGIAR): The Group contributes tofood security, poverty eradication, and sustainable development. It does so by fostering science-based agricultural growth in developing countries and by promoting sustainable agriculturaldevelopment. CG Centres work with national agricultural research systems in the region todevelop and test appropriate technologies in crops, livestock, water management, fisheries, andagro-forestry.
6. Pacific Island Extension Summit (PIEN): The aim of the Pacific Island Extension Summit, 2009 isto offer an efficient and effective extension service to transform the agriculture and forestry
227 Byerlee et al., 2010.
76
sectors for the Pacific economies. PIEN actively pursues opportunities for extension to engage inthe use of ICTs and the media to improve its outreach to its main clientele, the farmers.
To sum up, each country must have policies in place to spur growth in the rural sector, enhance foodsecurity and overcome poverty. The successes and policy lessons learnt point to five majorchallenges. First, sustained increase in agricultural productivity is required, especially amongsmallholders, with a focus on the youth, women, other disadvantaged social groups and indigenouspeoples. Second, food price volatility, other market risks, and natural disasters could play havoc withthe well-being and lives of rural populations. Policies that mitigate such risks and enable thevulnerable to cope with them deserve careful scrutiny and coordinated implementation. Third,integration of smallholders into high-value chains calls for proactive role of national governments inlaying down food safety standards and producers’ associations in implementing them and innegotiating marketing arrangements. Fourth, climate change poses grave threats to human well-being.Despite a weakening of the appetite for capping carbon emissions, both mitigation and adaptation arenecessary. While the search for emission reductions widens, much greater emphasis to adaptation –especially by smallholders – than given in the past is imperative. Fifth, strong farm-non-farm linkagesmust be fostered so that their complementarity is fully exploited in pursuit of sustained povertyreduction.
While the prospects of sustainable agricultural growth and poverty reduction may seem daunting tomany, the strategy charted here is one of hope and optimism.
77
BIBLIOGRAPHY
1. ADB (2008). Soaring food prices: response to the crisis. ADB: Manila.2. ADB (2008a). Food prices and inflation in developing Asia: Is poverty reduction coming to an
end? Asian Development Bank: Manila.3. ADB (2009). Building Climate Resilience in the Agricultural Sector of Asia and the Pacific.
ADB: Manila.4. ADB (2009a). Gender Inequality and Inclusive Growth in Developing Countries. Asian
Development Bank: Manila.5. ADB (2009b). Land and Cultural Survival - The Communal Land Rights of Indigenous Peoples in
Asia. Asian Development Bank: Manila.6. Agarwal, B. (1994). A field of one’s own: gender and land rights in South Asia. Cambridge South
Asian Studies, Cambridge University Press 1994.7. Aggarwal, A. (2006). Special Economic Zones: Revisiting the Policy Debate. Economic and
Political Weekly, November 2006.8. Ahmed, S. and P. Maitra (2010). Gender Wage Discrimination in Rural and Urban Labour
Markets of Bangladesh. Oxford Development Studies, 38: 1, 83 — 1129. Akter, S. (2005). Occupational segregation, and wage discrimination, and impact on poverty in
rural Bangladesh. The Journal of Development Areas, 39(1), pp. 15–39.10. Alkire, S. and M. Santos (2010). Acute Multidimensional Poverty: A New Index for Developing
Countries. OPHI Working Papers No. 38.11. Ashe, J. and L. Parrott (2002). PACT's Women's Empowerment Programme in Nepal: A Savings-
and Literacy-Led Alternative to Financial Building. Journal of Microfinance, 4(2), 137-162.12. Atchoarena, D., Wallace, I., Green, K. and C. Gomes (2003). Strategies and institutions for
promoting skills for rural development. in Atchoarena, David & Lavinia Gasperini (Eds), 2003,Education for rural development: towards new policy responses, FAO Roma and UNESCO Paris.
13. Basu, J.P. (2006). Microfinance and Women Empowerment: An Empirical Study with specialreference to West Bengal. Indira Gandhi Institute of Development Research.
14. Bardhan, P. (2005). Efficiency, Equity, and Poverty Alleviation: Policy Issues in Less DevelopedCountries, The Economic Journal, vol. 106, no. 438, pp. 1346-1356
15. Bardhan, P. (2010). Awakening Giants Feet of Clay: Assessing the Economic Rise of China andIndia. Princeton University Press.
16. Baulch, B. and J. Hoddinott (2000). Economic Mobility and Poverty Dynamics in DevelopingCountries. Journal of Development Studies, vol. 36.
17. Birner, R. and D. Resnick (2010). The Political Economy of Policies for Smallholder Agriculture.World Development, Vol. 38, No. 10, pp 1442-1452.
18. Birner, R., Gupta, S. and N. Sharma (2010). The Political Economy of Agricultural Policy Reformin India: The Case of Fertilizer Supply and Electricity Supply for Groundwater Irrigation.Research Monograph 163. Washington DC: International Food Policy Research Institute.
19. Byerlee, D., A. de Janvry and E. Sadoulet (2010) “Agriculture for Development-Revisited”,University of California, Berkeley, Conference on Agriculture for Development Revisited.
20. Cheston, S., and L. Kuhn (2002). Empowering women through microfinance. In Pathways out ofpoverty: Innovations in microfinance for the poorest families, comp. and ed. S. Daley-Harris, 167-228. Bloomfield, CT: Kumarian Press.
21. Choi, J. (2004). Policies and Measures for Promoting Rural Non-farm Employment. In Non-farmEmployment Opportunities in Rural Areas in Asia. Report of the APO Seminar on Non-farmEmployment Opportunities in Rural Areas, Philippines, 24–29 September 2001. Published byAsian Productivity Organisation: Tokyo, 2004.
22. Christiansen, L., L. Demery, and J. Kuhl (2010) “The (Evolving) Role of Agriculture in PovertyReduction: An Empirical Perspective”, Journal of Development Economics, forthcoming.
23. CPRC (Centre for Poverty Research) (2004). The Chronic Poverty Report 2004–05. Manchester:CPRC.
24. CPRC (Centre for Chronic Poverty Research) (2009). The Chronic Poverty Report 2008–09.Manchester: CPRC.
78
25. Datt, G. and H. Hoogeveen (2003). El Niño or El Peso? Crisis, Poverty and Income Distributionin the Philippines. World Development 31(7): 1103-1124.
26. Davis, B., Winters, P., Carletto, G., Covarrubias, K., Quinones, E., Zezza, A., Stamoulis, K.,Bonomi, G. and S. DiGuiseppe (2007). Rural Income Generating Activities: A Cross CountryComparison. Background paper to the World Development Report 2008.
27. Deininger, K., and D. Byerlee (2010) “The Rise of Large-Scale Farms in Land-AbundantDeveloping Countries: Does It Have a Future?”, University of California, Berkeley, Conferenceon Agriculture for Development Revisited.
28. Deininger, K., S. Jin and H. K. Nagarajan (2009) “Land Reforms, Poverty Reduction andEconomic Growth: Evidence from India”, mimeo.
29. de Janvry, A., Sadoulet, E. and N. Zhu (2005). The Role of Non-Farm Incomes in Reducing RuralPoverty and Inequality in China. UC Berkeley Department of Agricultural and ResourceEconomics, UCB. CUDARE Working Paper No. 1001.
30. Deb, U., and M. Bantilan (2003). Impacts of Genetic Improvement in Sorghum. In: Evenson, R.and D. Gollin, Crop Variety Improvement and Its Effect on Productivity: The Impact ofInternational Agricultural Research. Wallingford, United Kingdom: CABI Publishing.
31. Del Ninno, C. and M. Lundberg (2005). Treading water: The long-term impact of the 1998 floodon nutrition in Bangladesh. Economics and Human Biology, 3: 67-96.
32. Deolalikar, A., Brillantes, A., Gaiha, R., Pernia, E. and M. Racelis (2001). Poverty Reduction andthe Role of Institutions. Asian Development Bank: Manila.
33. Desai, S., Dubey, A., Joshi, B., Sen, M., Shariff, A. and R. Vanneman (2010). HumanDevelopment in India, Challenges for a Society in Transition. Oxford University Press, NewDelhi.
34. DFID (2004). Making Agricultural Markets Work for the Poor. Working Paper for the RenewableNatural Resources and Agriculture Team, DFID Policy Division.
35. Ding, S., Chen, Y., Feng, L. and Z. Li (2008). Prevalence of Illness and Household Ill HealthRisk Coping Strategies in Rural China: A Chinese literature review. Studies in HSO&P,Employment Opportunities in Rural Areas, Philippines, 24–29 September 2001. Published byAsian Productivity Organisation: Tokyo, 2004.
36. Economic and Social Commission for Asia and the Pacific (ESCAP, 2008) Asia and the Pacific2008: Sustaining Growth and Sharing Poverty, New Delhi: Academic Foundation
37. Estudillo, J. and K. Otsuka (1999). Green revolution, human capital and off farm employment:changing sources of income among farm households in Central Luzon, 1966-1994. EconomicDevelopment and Cultural Change, 47(3), 497-523.
38. Eswaran, M., Kotwal, A., Ramaswami, B. and W. Wadhwa (2008). How Does Poverty Decline?Suggestive Evidence from India, 1983–1999. Cambridge: MA, BREAD Policy Paper No. 014,February 2008.
39. Fan, S. and C. Chan-Kang (2003). Is small beautiful? Farm size, productivity and poverty inAsian agriculture. Plenary paper prepared for the 25th International Conference of AgriculturalEconomists, July 17, 2003, Durban, South Africa.
40. Fanjul, G. and A. Guerena (2009). Markets working for the rural poor. Background paper for theIFAD rural poverty report 2010.
41. FAO (2001). Supplement to the Report on the 1990 World Census of Agriculture. FAO: Rome.42. FAO (2004). World Census of Agriculture, 1980, 1990, 2000 rounds. FAO statistics division:
Rome.43. FAO (2005). Rural Women and Food Security in Asia and Pacific. FAO Asia-Pacific Division:
Bangkok.44. FAO (2008). Soaring Food Prices: Facts, Perspectives, Impacts and Actions Required. High
Level Conference on ‘World food security: The challenges of climate change and bioenergy’.Rome 3-5 June.
45. FAO (2010). The State of Food Insecurity in the World. FAO: Rome.46. FAO, IFAD and ILO (2010). Gender Dimensions of agricultural and rural employment:
differentiated pathways out of poverty. FAO, IFAD and ILO: Rome.47. FAOSTAT (2010). Website of October 2010. FAO: Rome
79
48. Feder, G. (2002). The Intricacies of Land Markets: Why the World Bank Succeeds in EconomicReform through Land Registration and Tenure Security. Paper presented at the Conference of theInternational Federation of Surveyors, April 19-26, 2002, Washington DC.
49. Fisher, T. and M.S. Sriram (2002). Introduction, Beyond Micro-credit Putting Development Backinto Micro-Finance, Vistaar Publications: New Delhi.
50. Fontana, M. and C. Pasciello (2009). Gender Dimensions of Rural and Agricultural Employment:Differentiated Pathways out of Poverty. Institute of Development Studies
51. Foster, A. and M. Rosenzweig (2004). Agricultural productivity growth, rural economic diversityand economic reforms: India, 1970– 2000. Economic Development and Cultural Change, 52(3),509–542.
52. Fuglie, K.O. (2010) “Total Factor Productivity in the Global Agricultural Economy: Evidencefrom FAO Data”, Chapter IV in The Shifting Patterns of Agricultural Production and ProductivityWorldwide, Ames, Iowa: The Midwest Agribusiness Trade Research and Information Centre.
53. Gaiha, R. (2007) “Employment Guarantee Scheme in the Indian State of Maharashtra”, in K.Basu (ed.) Oxford Companion to Economics in India, Oxford University Press, New Delhi..
54. Gaiha, R. and Thapa, G. (2006). Natural Disasters, Vulnerability and Mortalities – A CrossCountry Analysis.
55. Gaiha, R. and Thapa, G. (2006a). Natural Disasters, Agricultural Investment and Productivity inDeveloping Countries. IFAD: Rome.
56. Gaiha, R. and G. Thapa (2007). Supermarkets, Smallholders and Livelihood Prospects in SelectedAsian Countries. IFAD: Asia-Pacific Division. Occasional Paper.
57. Gaiha, R. and K. Imai (2007). Non Agricultural Employment and Poverty in India — An AnalysisBased on the 60th Round of NSS. Economics Discussion Paper EDP-0705, University ofManchester.
58. Gaiha, R. and K. Imai (2009) “Measuring Vulnerability and Poverty: Estimaters for Rural India”,in W. Naude, A. U. santos-Paulino and M. Mcgillivary (eds.) Vulnerability in DevelopingCountries, United Nations University Press, Tokyo.
59. Gaiha, R., and S. Annim (2010) “Agriculture, GDP and Prospects of MDG 1 in Lao PDR”,School of Economics Discussion Paper1012, University of Manchester, mimeo.
60. Gaiha, R. and S. Mathur (2010) Commentary on “Does Research Reduce Poverty? Assessing theImpacts of Policy-Oriented Research in Agriculture”, IDS Bulletin, vol. 41, no. 6.
61. Gaiha, R., and Md. Azam (2011)”Agriculture, GDP and Prospects MDGI: A Study of Cambodiain Transition”, APR, IFAD, in preparation.
62. Gaiha, R., Kaur, S. and V. Kulkarni (2009). Sviluppo e transformazioni sociali in India.Encyclopaedia treccani terzo millennio, Italy, 181-190.
63. Gaiha, R., Thapa, G., Imai, K. and V. Kulkarni (2007). Endowments, discrimination anddeprivation among ethnic groups in rural India. Economics Discussion Paper Series EDP 0722,University of Manchester.
64. Gao, MT., Gan, L., Xu, LX. and Y. Yao (2006). Health shocks, village governance, and farmers’long-term income capabilities: evidence from rural China. Chinese Journal of PopulationScience, 1: 21-32 [In Chinese].
65. Goetz, A., and R.S. Gupta (1996). Who Takes the Credit? Gender, Power, and Control over LoanUse in Rural Credit Programmes in Bangladesh. World Development 24, no. 1: 45–63.
66. Gulati, A. and S. Narayanan (2003). The Subsidy Syndrome in Indian Agriculture. OxfordUniversity Press.
67. Gulati, A., Minot, N., Delgado, C. and S. Bora (2007). Growth in high-value agriculture in Asiaand the emergence of vertical links with farmers. In: J. Swinnen (ed.), Global Supply Chains,Standards and the Poor. Wallingford: CABI Publishing. pp. 91-108
68. Haggblade, S., Hazell, P. and P. Dorosh (2007). Sectoral growth linkages between agricultureand the rural non-farm economy. In S. Haggblade, P. Hazell, & T. Reardon (Eds.), Transformingthe rural non-farm economy: Opportunities and threats in the developing world (pp. 141–182).Baltimore: Johns Hopkins University Press.
69. Haggblade, S., Hazell, P. and T. Reardon (2007). Transforming the Rural Non-farm Economy:Opportunities and Threats in the Developing World. Oxford University Press, New Delhi.
80
70. Haggblade, S., Hazell, P. and T. Reardon (2010). The Rural Non-farm Economy: Prospects forGrowth and Poverty Reduction. World Development. doi:10.1016/j.worlddev.2009.06.008.
71. Hall, G. and H. Patrinos. 2010. Indigenous Peoples, Poverty and Development, A study sponsoredby the World Bank.
72. Harriss, J. and B. Harriss (1984). Generative or Parasitic Urbanism? Some observations from therecent history of a South Indian market town. Journal of Development Studies, 20(3), 82-101.
73. Hart, G. (1987). The mechanization of Malaysian rice production: will petty producers survive?World Employment Programme research working paper, International Labour Office: Geneva.
74. Hashim, S. (2009). A perspective on agricultural marketing in India. Indian Journal ofAgricultural Marketing, Sep–Dec 2009, 23 (3), 1-9.
75. Hazell, P. 2009. The Asian Green Revolution. IFPRI Discussion Paper 00911, November 2009.Washington D.C.: IFPRI.
76. Hossain, M. (2004). Rural Non-farm Economy in Bangladesh: A View from Household Surveys.Centre for Policy Dialogue, Occasional Paper Series 40. Dhaka: Centre for Policy Dialogue.
77. Hossain, M., Gollin, D., Cabanilla, V., Cabrera, E., Johnson, N., Khush, G. and G. McLaren(2003). International Research and Genetic Improvement in Rice: Evidence from Asia and LatinAmerica. In: Evenson, R. and D. Gollin, Crop Variety Improvement and Its Effect onProductivity: The Impact of International Agricultural Research. Wallingford, United Kingdom:CABI Publishing.
78. Hu, D., Reardon, T., Rozelle, S., Timmer, P. and H. Wang (2004). The emergence ofsupermarkets with Chinese characteristics: Challenges and Opportunities for China’sagricultural development. Development Policy Review, 22(4), 557-586.
79. IAASTD (International Assessment of Agricultural Knowledge, Science and Technology forDevelopment) (2009). Summary for Decision Makers of the East and South Asia and the Pacific(ESAP) Report. Washington, DC: IAASTD.
80. ICIMOD (2010) Understanding Mountain Poverty in Bhutan, India and Nepal, Regional Report,mimeo.
81. IDS (Institute of Development Studies) (2001). Briefing Paper on the ‘Feminization of Poverty’Prepared by BRIDGE for the Swedish International Development Cooperation Agency (SIDA).Sussex, UK: IDS.
82. IFAD (1999). Factors that increase women’s work loads in Nepal. Gender and household foodsecurity (available at www.ifad.org/gender/learning/role/worklod/24.htm).
83. IFAD (2006). Indigenous people and ethnic minorities. Issue 10, May-June 2006.84. IFAD (2009). Food Price Volatility: How to help smallholder farmers manage risk and
uncertainty. Discussion paper prepared for the Round Table organized during the Thirty-secondsession of IFAD's Governing Council, 18 February 2009. IFAD: Rome.
85. IFAD (2009a). Rural Finance: Small amounts making a big difference. International Fund forAgricultural Development: Rome.
86. IFAD (2011). Rural Poverty Report 2011. IFAD: Rome.87. IFAD (2011a). Creating Opportunities for Rural Youth. Issue 35 (Jan-Feb 2011), IFAD: Rome88. IFAD (2010). Value Chains. Issue 31 (March – April 2010), IFAD: Rome89. Jacob, M. (2006). Changes in the wage gap of gender and caste groups in India.90. IFAD and WFP (2010). The Potential for Scale and Sustainability in Weather Index Insurance for
Agriculture and Rural Livelihoods. IFAD and WFP: Rome.91. IFPRI (2005). Rural Non-farm Development in China and India: The Role of Policies and
Institutions. Development Strategy and Governance Division Discussion Paper, IFPRI:Washington DC.
92. IFPRI (2007). The Future of small farms for poverty reduction and growth. International FoodPolicy Research Institute 2020 Discussion Paper 42, May 2007. Washington D.C.: IFPRI.
93. IFPRI (2007a). The World Food Situation: New Driving Forces and Required Actions.Washington DC: mimeo.
94. IFPRI (2009). Land Grabbing by Foreign Investors in Developing Countries: Risks andOpportunities. IFPRI Policy Brief 13, Washington DC.
81
95. ILO (2010). Child Labour in Cambodia: A New Direction. Available athttp://www.ilo.org/global/About_the_ILO/Media_and_public_information/Feature_stories/lang--en/WCMS_141489/index.htm. Accessed on October 4, 2010.
96. ILO (2010a). Global Wage Report 2010/11. ILO: Geneva97. Imai, K., Gaiha, R. and G. Thapa (2009). Finance, Growth, Inequality and Hunger in Asia:
Evidence from Country Panel Data in 1960-2006. Economics Discussion Paper Series, EDP-0813, December 2008, Revised in 2009, University of Manchester.
98. Imai, K., Gaiha, R. and W. Kang (2010). Vulnerability and poverty dynamics in Vietnam. AppliedEconomics, 1-16, forthcoming.
99. Imai, K., Gaiha, R., G. Thapa and S. Annim (2011 a) “Microfinance and Poverty-A MacroPerspective”, forthcoming.
100. Imai, K., Gaiha, R., G. Thapa and S. Annim, and A. Gupta (2011 b) “Performance of MFIs-AMacro and Institutional Perspective”, forthcoming.
101. Imai, K., Gaiha, R. and G. Thapa (2011c). Role of Agriculture in Achieving MDG 1 in Asiaand the Pacific Region. The University of Manchester Economics Discussion Paper Series, EDP –1104.
102. IPCC (2007). Climate Change 2007: Synthesis Report. IPCC: Valencia, Spain.103. Jha, R. and T. Dang (2009a) “Vulnerability and Poverty in Papua New Guinea”, Arndt-
Corden Department of Economics Working Paper no. 8 (Revised), Australian NationalUniversity.
104. Jha, R. and T. Dang (2009b) “Vulnerability and Poverty in Timor-Leste”, Arndt-CordenDepartment of Economics Working Paper no. 10 (Revised), Australian National University
105. Jha, R. and T. Dang (2009c) “Vulnerability and Poverty in Select Central Asian Countries”,European Journal of Comparative Economics, vol. 6, no. 1.
106. Jha, R., T. Dang and K. L. Sharma (2009) “Vulnerability to Poverty in Fiji”, InternationalJournal of Applied Econometrics and Quantitative Studies, vol.6.
107. Jha, R., R. Gaiha and A. Sharma (2009) Calorie and Micronutrient Deprivation and PovertyNutrition Traps in Rural India, World Development, vol. 37, no. 5.
108. Kabeer, N. (1998). Money Can’t Buy Me Love? Re-evaluating Gender, Credit andEmpowerment in Rural Bangladesh. IDS Discussion Paper 363. Brighton, England: Institute ofDevelopment Studies, University of Sussex.
109. Kaicker, N., Kulkarni, V. and R. Gaiha (2011). Dietary Transition in India: An AnalysisBased on NSS Data for 1993 and 2004. Faculty of Management Studies, University of Delhi,mimeo.
110. Kaur, S., Kulkarni, V., Gaiha, R. and M. Pandey (2010). Prospects of Non-farm Employmentand Welfare in Rural Areas. ASARC Working Paper 2010/05.
111. Kay, T. (2003). Empowering Women through Self-help Micro-credit Programmes. Genderand Development Section, Emerging Social Issues Division, ESCAP.
112. Kijima, Y. And P. Lanjouw (2005). Economic Diversification and Poverty in Rural India.Indian Journal of Labour Economics, 5 (1).
113. King, Dejardin A. and M. Bigotta (2009). Work, Income and Gender rural urban dimensions.ILO: Switzerland
114. Kirk, M. and T. Nguyen (2009). Land-tenure policy reforms: Decollectivisation and the DoiMoi system in Vietnam. IFPRI Discussion Paper. Washington, D.C.: International Food PolicyResearch Institute.
115. Kulkarni, V. (2010). Women’s Empowerment and Microfinance: An Asian Perspective Study.Background paper for the APR Report on Rural Poverty Report, IFAD, mimeo.
116. Kulkarni, V. and R. Gaiha (2010). Dietary Transition in India. Centre for the Advanced Studyof India, University of Pennsylvania.
117. Lanjouw, P. (2007). Does the Rural Non-farm Economy Contribute to Poverty Reduction?Chapter 3 in Haggblade, Hazell and Reardon, editors, Transforming the Rural Non-farmEconomy. Baltimore: Johns Hopkins University Press.
118. Lanjouw, P. and A. Shariff (2002). Rural non-farm employment in India: Access. Income andPoverty Impacts. National Council of Applied Economics Research (NCAER). Working Paper 81,New Delhi: NCAER.
82
119. Lanjouw, P. and A. Shariff (2004). Rural Non-Farm Employment in India: Access, Incomesand Poverty Impact. Economic and Political Weekly, 39(40), 4429–46.
120. Lanjouw, P. and R. Murgai (2008). Poverty Decline, Agricultural Wages, and Non-FarmEmployment in Rural India 1983–2004. Washington DC: The World Bank Policy ResearchWorking Paper 4858, March 2008.
121. Li, XR., Yi, Y., Feng, CQ., Tan, L. and JY. Zhang (2005). An analysis of chronic diseasesamong urban and rural residents of Sichuan province. Journal of Preventive MedicineInformation, 21, 2: 139-142 [In Chinese].
122. Lohmar, B., Rozelle, S. and C. Zhao (2001). The rise of rural to rural labour markets inChina. Asian Geographer, 20(1-2), 101-127.
123. Maglaya, Z. (2004). Rural Industrialization: The Philippine Experience. In Non-farmEmployment Opportunities in Rural Areas in Asia. Report of the APO Seminar on Non-farm
124. Malhotra, A., Schuler S., and C. Boender (2002). Measuring Women’s Empowerment as aVariable in International Development. Background Paper for World Bank Workshop on Povertyand Gender: New Perspectives.
125. Mayoux, L. and M. Hartl (2009). Gender and Rural Microfinance:: Reaching andEmpowering Women, Guide for Practitioners. International Fund for Agricultural Development(IFAD) Report. August 2009.
126. Mayoux, L. (2006). Women’s Empowerment and Microfinance: A ‘Think Piece’ for theMicrofinance Field, http://www.genfinance.info/.
127. Mohapatra, S., Rozelle, S. and J. Huang (2005). Climbing the development ladder: Economicdevelopment and evolution of occupations in rural China. UC Davis Working Paper, Universityof California.
128. Morris, M., Mekuria, M. and R. Gerpacio (2003). Impacts of CIMMYT Maize BreedingResearch. In: Evenson, R. and D. Gollin, Crop Variety Improvement and Its Effect onProductivity: The Impact of International Agricultural Research. Wallingford, United Kingdom:CABI Publishing.
129. Morton, J. F. (2007) “The Impact of Climate Change on Smallholder and SubsistenceAgriculture”, Proceedings of the National Academy of Sciences, December 11.
130. Nielsen, H. (1998). Socio-economic impact of the smallholder livestock development projectin Bangladesh: results of the second impact survey. In Women in agriculture and moderncommunication technology, proceedings of a workshop, Tune Landboskole, Denmark, 30 March -3 April 1998, organized by the Agricultural and Rural Development Advisers’ Forum.
131. Nino, C., K. Subbarao and A. Milazzo (2009) “How to Make Public Works Work: A reviewof the Experiences of Developing Countries”, Social Protection and Labour Working PaperSeries, 0905, The World Bank.
132. OECD (2009) SIGI Database. OECD: Paris.133. Okun, A. M. (1975) Equality and Efficiency: The Big Trade-off, Washington DC: Brookings
Institution134. Osmani, S. (1987). The impact of economic liberalisation on the small scale and rural
industries of Sri Lanka. In Islam, R. (ed). Rural Industrialisation and Employment in Asia. NewDelhi, International Labour Organisation.
135. Oxfam (2005). The Tsunami’s impact on Women. Oxfam Briefing Note. March 2005.136. Pandey, S. and Bhandari, H. (2009). Drought, Coping Mechanisms and Poverty: Insights
from the rainfed rice farming in Asia. Discussion paper, IFAD, Asia and the Pacific Division.137. Pender, J. (2008). Agriculture technology choices for poor farmers in less favoured areas of
South and South-east Asia. IFAD Asia and the Pacific Division.138. Pingali, P. and G. Traxler (2002). Changing locus of agricultural research: Will the poor
benefit from biotechnology and privatization trends? Food Policy 27 (3): 223-238.139. Rahman, A. (1999). Micro-credit Initiatives for Equitable and Sustainable Development: Who
Pays? World Development 27, no. 1 (1999): 67–82.140. Rashid, S., Ralph, C. and A. Gulati (2007). Grain marketing Parastatals in Asia: Results from
Six Case Studies, World Development, Vol. 35, No. 11, pp 1872-1888.141. Ravallion, M. and S. Chen (2004). China’s (uneven) progress against poverty. Mimeo,
DECRG, World Bank, Washington DC.
83
142. Reardon, T., Berdegue, J., Barrett, C. and K. Stamoulis (2007). Household IncomeDiversification into Rural Non-farm Activities. In S. Haggblade, P. Hazell, & T. Reardon (Eds.),Transforming the rural non-farm economy: Opportunities and threats in the developing world (pp.115 - 140). Baltimore: Johns Hopkins University Press.
143. Renkow, M. (2007). Cities, Towns, and the Rural Non-farm Economy. In: Haggblade, S.,Hazell, P. and T. Reardon (Editors). Transforming the Rural Non-farm Economy. Baltimore:Johns Hopkins University Press.
144. Sander, W. (1983). Irrigation development and non-farm employment changes in twocommunities in the Philippines. Indian Journal of Agricultural Economics, 38(1), 1-14.
145. Sebastian, K. (2007). GIS/Spatial Analysis Contribution to2008 WDR: Technical Notes onData & Methodologies. Background paper for the WDR 2008.
146. Sen, A. (1999). Development as Freedom. Oxford University Press: New York.147. Sen, A. (2000). A Decade of Human Development. Journal of Human Development, 1(1), 17-
23.148. Shilpi, F. and D. Umali-Deininger (2007) Where to Sell? Market Facilities and Agricultural
Marketing, Washington DC: Policy Research Working Paper 4455, World Bank.149. Shrestha, M. (1998). Report on Self-help Banking Programme and Women’s Empowerment.
Centre for Self-help Development (CSD), Kathmandu, (Nepal), 28.150. Sombilla, M. A., D. B. Antiporta, A. M. Balisacan and R. W. Dikitanan (2010) “Policy
Implications to Food Price Crisis and their Implications: The Case of greater Mekong Sub-RegionCountries, A Report submitted to Asia and the Pacific Division, IFAD, Rome, mimeo.
151. Srivastava, R.S. (2004). Land reforms and the poor in India: an overview of issues and recentevidence. In Gazdar, H. and Quan, J. (2004). Poverty and Access to Land in South Asia: A studyfor the Rural Support Programmes Network. Pakistan. Vol. 2: Country Studies DFID / RSPN /NRI May 2004.
152. Taylor, J.E. (2008). Rural Poverty and Markets. Background paper for the IFAD rural povertyreport 2010.
153. Thapa, G. (2009). Smallholder Farming in Transforming Economies of Asia and the Pacific:Challenges and Opportunities. Discussion Paper, IFAD.
154. Thapa, G. (2006). Rural Poverty Reduction Strategy for South Asia. ASARC Working Papers2004-06.
155. Thapa, G., Gaiha, R., Imai, K. and V. Kulkarni (2009). Soaring Food Prices: A Threat orOpportunity in Asia. BWPI Working Paper, Brooks World Poverty Institute, University ofManchester.
156. Thapa, G. and R. Gaiha (2011). Smallholder Farming in Asia and the Pacific: Challenges andOpportunities. IFAD conference on New Directions for Smallholder Agriculture, IFAD: Rome.
157. Timmer, C. P. (2010). Lessons from Food Crises Past. World Development, forthcoming.158. Timmer, C.P. (2009). Reflections of Food Crises Past. Food Policy, 35(2010), 1-11.159. Timmer, C.P. (2009a). Do Supermarkets Change the Food Policy Agenda? World
Development, Special Issue on Agrifood Industry Transformation and Small Farmers inDeveloping Countries, 37 (11), 1812-19
160. Todd, H. (1996). Women at the Centre: Grameen Bank Borrowers after One Decade.Westview Press: New York.
161. Tyler, S. and L. Fajber (2009). Land and Water Resource Management in Asia: Challengesfor Climate Adaptation. International Institute for Sustainable Development (IISD), Backgroundpaper for the Asia Regional Meeting of the Dialogue on Climatic Change, Adaptation for Landand Water Management, January 19-21, Hanoi.
162. UN (2010). The Millennium Development Goals Report. United Nations: New York.163. UNICEF (2009). Social Protection in South Asia: A review. United Nations Childrens Fund
Regional Office: Nepal.164. UNICEF (2010). ChildInfo database, available at http://www.childinfo.org/165. Unni, J. and G. Raveendran (2007). Growth of Employment (1993–2004/5): Illusion of
Inclusiveness? Economic and Political Weekly, January 20, 2007.
84
166. Valdes, A., Foster, W., Anriquez, G., Azzari, C., Covarrubias, K., Davis, B., DiGiuseppe, S.,Essam, T., Hertz, T., de la O, A., Quiñones, E., Stamoulis, K., Winters, P. and A. Zezza (2010). Aprofile of the rural poor. Background paper for IFAD Rural Poverty Report 2010.
167. Van der Walle, D. and D. Cratty (2003). Is the emerging non-farm market economy the routeout of poverty in Vietnam? Policy Research Working Paper 2950, Washington DC: World Bank,January.
168. Wanmali, S. (1992). Rural infrastructure, the settlement system, and development of theregional economy in Southern India. IFPRI Research Report 91, Washington DC: IFPRI.
169. Wiggins, S and P. Hazell (2008). Access to rural non-farm employment and enterprisedevelopment. Background paper for the IFAD Rural Poverty Report 2010.
170. World Food Programme (2008). WFP Food Security Monitoring and Analysis System. Rome.171. World Bank (2001a). Engendering Development: Through Gender Equality in Rights,
Resources, and Voice. Summary, Washington. www.worldbank.org/gender/prr/engendersummary.pdf
172. World Bank (2001). World Development Report 2001.World Bank: Washington DC.173. World Bank (2003). World Bank Development Indicators. World Bank: Washington DC.174. World Bank (2006). Hazards of Nature, Risks to Development. Independent Evaluation
Group, World Bank: Washington DC.175. World Bank (2007). World Development Report. World Bank: Washington DC.176. World Bank (2008). World Development Report 2008. World Bank: Washington DC.177. World Bank (2010). World Development Report 2010. World Bank: Washington DC.178. World Bank (2009). Poverty Profile and Trend in Cambodia: Findings from the 2007
Cambodian Socioeconomic Survey.179. World Bank Study Team (2002). In Krumm, K. and H. Kharas ed. (2004). East Asia
Integrates: a trade policy agenda for shared growth. World Bank and Oxford University Press.180. World Summit on Food Security (2009). Feeding the World, Eradicating Hunger. 16-18
November, 2009, FAO: Rome.181. Yan, YY., Zhang, LX., Luo, SG. and H. Wang (2006). The impact of NCMS: data from 101
villages in five provinces in China, Chinese Rural Economy, 5: 64-71 [In Chinese].