agriculture, profitability and income formation in the
TRANSCRIPT

Agricultural Economic Report 2 0 0 4
This report offers an English summary of the Landbouw-Economisch Bericht 2004.
It presents a survey of the economic state of Dutch agribusiness. First, attention is
paid to general economic and political developments and to the development of the
agricultural complex. Next, the report deals with the rural area and with environmental
issues. Following a description of the production structure and production factors in
agriculture, profitability and income formation in the various sub sectors are analysed.
of the Netherlands
Summary


Agricultural Economic Report 2 0 0 4 of the Netherlands
Summary
XPR-LE020224-SUMMARY2004 20-07-2004 16:57 Pagina 1

Agricultural Economics Research Institute (LEI)P.O.Box 29703, 2500 LS The HagueThe NetherlandsTelephone: +31 70 3358330Fax: +31 70 3615624E-mail: [email protected]
www.wur.nl
ISSN 0924-0764Price € 9,-
July 2004
ABSTRACT
AGRICULTURAL ECONOMIC REPORT 2004 OF THE NETHERLANDS: SUMMARYP. Berkhout & C. van Bruchem (eds.)The Hague, Agricultural Economics Research Institute (LEI), 2004ISSN 0924-076428 p., fig., tab.
This report offers an English summary of the Landbouw-Economisch Bericht 2004. It presents a survey of the economicstate of Dutch agribusiness. First, attention is paid to general economic and political developments and to the developmentof the agricultural complex. Next, the report deals with the rural area and with environmental issues. Following a descriptionof the production structure and production factors in agriculture, profitability and income formation in the various sub-sectorsare analysed.
Design and production: The Key Agency, Amsterdam
XPR-LE020224-SUMMARY2004 12-08-2004 13:43 Pagina 2

Preface
This summary of the Landbouw-Economisch Bericht 2004 offers a global survey of the economicand financial state of Dutch agriculture and horticulture. In it, the changing economic and politicalcircumstances affecting the sector are explicitly taken into account. The complete report, which isavailable only in Dutch, is based on data and contributions from the three research departments ofthe Institute. The report has been coordinated and edited by the Public Issues Department. The finaldraft of the 2004 edition of the report was completed in May 2004.
The Hague, July 2004
The Director,Prof. L.C. Zachariasse
XPR-LE020224-SUMMARY2004 12-08-2004 13:43 Pagina 3

Contents
Economic and Political Framework 11.1 General Situation 11.2 Agriculture in the World 21.3 Agriculture in the European Union 4
Developments in the Dutch Agribusiness 62.1 Consumption and Sales Structure of Foods 62.2 Agricultural Imports and Exports 62.3 The Agricultural Complex 8
Rural Areas and the Environment 103.1 Land Use 103.2 Environmental Issues 11
Structure of Agriculture and Horticulture 134.1 Production Capacity and Farm Structure 134.2 Labour, Land and Capital 15
Market and Income Developments in the Various Sectors 165.1 Results of the Primary Sector 165.2 Horticulture under Glass and Mushroom Growing 175.3 Outdoor Horticultural Production 175.4 Arable Farming 195.5 Grassland-Based Livestock Farming 205.6 Intensive Livestock Farming 22
Definitions 24
5
4
3
2
1
XPR-LE020224-SUMMARY2004 12-08-2004 13:43 Pagina 4
Economic and Political Framework______________________________________________________
General Situation
In 2003 the world economy showed a modest growth of around 1.5 to 2%. In the OECD countries, the economic growth was a mere 1.5%; in developing countries growth levels of 4% were reached.However, major differences exist between regions. In East Asia, with booming countries such as China and India, growth levels of 6% are not uncommon. Projections of economic growth for 2004 are slightly optimistic, with better prognoses for the United States than for the European Union (EU).However, the confidence of consumers in the economy remains an important risk factor in theseprojections. Terrorist attacks, such as the one in Madrid on 11 March, create uncertainty as well,which is also reflected in the sharp increase of oil prices since 11 March.
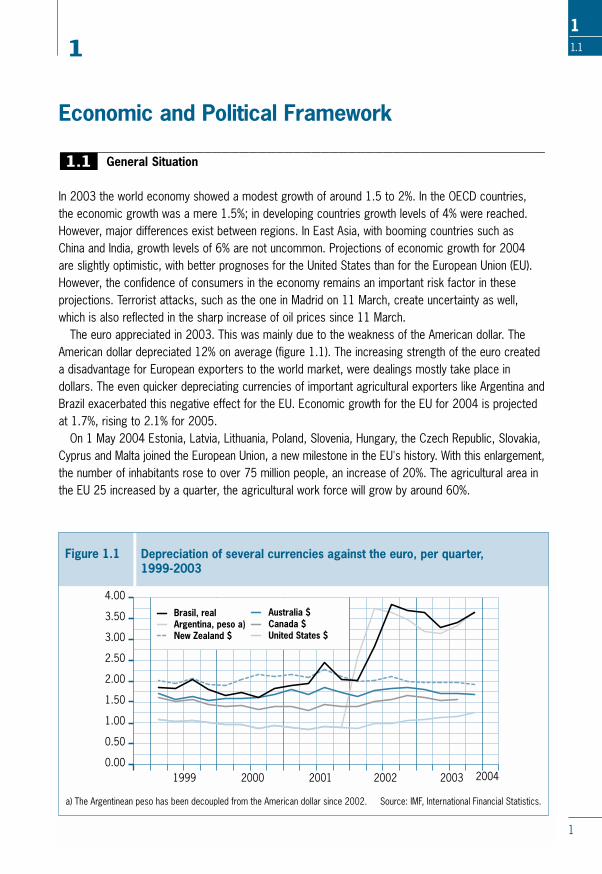
The euro appreciated in 2003. This was mainly due to the weakness of the American dollar. TheAmerican dollar depreciated 12% on average (figure 1.1). The increasing strength of the euro createda disadvantage for European exporters to the world market, were dealings mostly take place indollars. The even quicker depreciating currencies of important agricultural exporters like Argentina andBrazil exacerbated this negative effect for the EU. Economic growth for the EU for 2004 is projectedat 1.7%, rising to 2.1% for 2005.
On 1 May 2004 Estonia, Latvia, Lithuania, Poland, Slovenia, Hungary, the Czech Republic, Slovakia,Cyprus and Malta joined the European Union, a new milestone in the EU's history. With this enlargement,the number of inhabitants rose to over 75 million people, an increase of 20%. The agricultural area inthe EU 25 increased by a quarter, the agricultural work force will grow by around 60%.
1.1
1
1
11.1
0.00
0.50
1.00
1.50
2.00
2.50
3.00
3.50
4.00
Figure 1.1 Depreciation of several currencies against the euro, per quarter, 1999-2003
1999 2000 2001 2002 2003 2004
Brasil, realArgentina, peso a)New Zealand $
Australia $Canada $United States $
Source: IMF, International Financial Statistics.a) The Argentinean peso has been decoupled from the American dollar since 2002.
XPR-LE020224-SUMMARY2004 12-08-2004 13:43 Pagina 1

Another more disputed milestone in the EU is the lifting of the moratorium for admittance of newgenetically modified organisms (GMOs). With new rules concerning the labelling and the tracing ofGMOs the European Commission and the Member States hope to have effectively given in toobjections of consumer and environmental organisations.
In 2003 the Dutch economy stagnated, with a negative growth of 0.5%. The inflation was 3.3%. For 2004 a recovery of the economic growth to 1% is expected. In line with the low economic growth,the level of unemployment rose to 5.5%. Severe cuts in government spending have been announcedto stay in line with the requirements of the European Union's Stability pact. Together with substantialcutbacks in expenditure, the new Dutch government also presented her ideas to decreaseunemployment and stimulate economic growth in order to strengthen the economy.
______________________________________________________Agriculture in the World
World agricultural production has been fairly stable the past years. Although production grew slightly inabsolute terms, it increased by less than 1% per capita.
Cereals production rose slightly, the same goes for other arable products. The production of livestockproducts increased a little as well. The world market prices for agricultural products show a diversepicture. For crops, prices were generally speaking good, for livestock products prices improved fromthe low levels of 2002.
International trade has expanded strongly in the past fifty years, due to economic integration. The growth of trade in agricultural products has been less strong than the growth in trade in manufacturesand mining products. In 2002 the share of agricultural products (486 million dollars) and food (114 milliondollars) in the world export volume amounted to around 9%.
1.2
2
1.2
11.2
Table 1.1 Agricultural trade by region, 1993-2000
Specialisation index a) Net exportin billion USD
1993 1997 2000 1993 2000
EU-15 -12 -11 -10 -12.7 -11.6
Rest of Europe -6 -29 -25 -1.8 -10.7
Asia -52 -50 -54 -44.3 -56.0
NAFTA 23 18 8 179 72
Latin America 61 61 65 21.0 29.6
Africa -21 -9 -8 -2.7 -0.8
Oceania 72 70 71 12.7 16.5
World trade in billion USD 357 465 432
Idem, excl. EU 15 184 261 246
a) The specialisation-index is the ratio between the net-export of a product (group) and the total foreign trade of the product (group).Source: ITC/WTO.
XPR-LE020224-SUMMARY2004 12-08-2004 13:43 Pagina 2

Table 1.1 gives an overview of the most important importers and exporters of agricultural products.Not only the absolute value of the export, but also the so-called index of specialization is given. Thisindex reflects the importance of the net-export of a product in relation to total trade in a product. A higher index points to a greater importance of export in relation to total trade. The table shows theAsian agricultural trade deficit, caused mainly by the imports of Japan of livestock and meat, as wellas of processed agricultural products. The EU is a net importer of agricultural products as well.
Table 1.2 gives the specialization index for a number of products; the index is given for both the EU-15 and for the major exporters (export value more than 1 billion USD) of a certain product. Thetable shows the relative stable trade position of the EU compared to the position of other importanttrading blocks. Especially Latin America has developed into a major exporter of sugar and oilseeds.New Zealand and Australia have consolidated their position as major exporters of dairy products andlivestock and meat.
The trend of declining support of governments for agricultural production has been reversed in2003. The producer subsidy equivalent (PSE) was estimated at 32% in the OECD countries in 2003,
1.2
3
11.2
Specialization-index trade Net export in billion USD
93/94 97/98 00/01 93/94 00/01
Sugar EU-15 7 11 12 0.2 0.3
Latin America 91 92 94 1.2 2.2
Cereals EU-15 29 4 18 1.2 0.8
Asia -73 -72 -61 -7.2 -7.4
NAFTA 95 93 91 11.4 9.8
Oceania 97 98 97 2.1 2.7
Milk and dairy products EU-15 63 66 60 3.6 3.6
Asia -90 -90 -85 -2.5 -3.9
Oceania 95 97 97 2.6 4.3
Livestock and meat EU-15 0 3 -2 0.5 -0.3
Asia -83 -78 -81 -11.5 -14.5
NAFTA 36 50 41 3.4 5.4
Latin America 73 61 71 2.2 3.0
Oceania 97 95 94 5.5 6.1
Oilseeds/fat EU-15 -66 -51 -59 -8.5 -7.9
NAFTA 69 71 67 5.6 6.0
Latin America 84 79 88 6.4 9.2
a) excluding intra-trade. Source: ITC/WTO, calculations by LEI.
Table 1.2 Specialisation-index trade a) and net-export for a number of agricultural products, 1993/94-2000/01
XPR-LE020224-SUMMARY2004 12-08-2004 13:43 Pagina 3
a slight increase compared to 2002 but clearly less than in 1986-1988 when the PSE was estimatedat around 38%. The latest figures also show a shift in the composition of support; the most trade and production distorting forms of support now account for around 75% of the PSE against 90% in 1986-88. Less distorting support, such as payments based on area planted or number of animals,now account for around 14% of the PSE against 7% in 1986-88.
The WTO trade talks, otherwise known as the Doha development round, have come to a temporaryhalt due to non-agreement on several dossiers. The forthcoming presidential elections in the USA aswell as the new European Commission that will take office in November will slow down thenegotiations. Currently parties are working on a framework agreement that will serve as a basis forfurther negotiations. Market access and export subsidies remain the divisive issues.
______________________________________________________Agriculture in the European Union
In June 2003 the Council of Agricultural ministers adopted the proposals for a reform of the CommonAgricultural Policy (CAP). The core of the reform proposals is decoupling: support will no longer belinked to area or animals. The current support payments will be transformed into a single farmpayment, independent from production. These single farm payments will be given on the condition thatcertain standards in the area of the environment, food safety, animal welfare, health and occupationalsafety are met, as well as the requirement to keep all farmland in good condition (‘cross-compliance’).The single farm payments will be reduced over the years for holdings with a payment higher than5.000 euros to generate additional money for rural development and savings to finance furtherreforms. The single farm payment will enter into force in 2005. If a Member State needs a transitionalperiod due to its specific agricultural conditions, it may apply the single farm payment from 2007 atthe latest.
Besides the single farm payment a number of revisions to the market policy of the CAP have beenagreed, especially in the dairy sector. The intervention price for butter will be reduced by 25% overfour years; for skimmed milk powder a 15% reduction over three years was agreed. The milk quotawill be retained until 2015.
In order to respect the tight budgetary ceiling for the EU-25 until 2013, ministers agreed tointroduce a financial discipline mechanism. This mechanism enables them to reduce the farmpayments if the available budget would be exceeded.
To strengthen the second pillar of the CAP, three new measures are added to the current menuavailable for rural development: to promote quality, animal welfare and to help farmers to meet EUproduction standards.
The (revised) CAP is also applicable in the ten new EU members. From 1 May 2004 all marketmeasures – like intervention and export subsidies – will be applied. The direct payments will begradually phased in over a ten-year period, starting at 25% of the amounts given to farmers in the EU 15.
1.3
4
1.3
11.3
XPR-LE020224-SUMMARY2004 12-08-2004 13:43 Pagina 4

A wide variety in national implementationThe European Commission originally proposed to fully decouple payments and production. However,several Member States insisted on the option to partially couple payments, as full decoupling wouldtend to reduce and possibly jeopardise future production in more marginal, and often socio-economically sensitive, regions in the Union. Another choice Member States have is to implement thesingle farm payment on an individual basis or on a regional basis. In the latter case every farmer in theregion, including those who previously were not entitled to payments, will receive the same payment.The regional version is attractive for its administrative simplicity, but could lead to a redistribution ofsubsidies with matching income effects. The options Member States have chosen until now - theymust decide before 1 August 2004 how to implement the payments - show a wide variety inimplementation. For instance, Denmark, Germany, Finland, England, and Northern Ireland have optedfor a hybrid model, a combination of a regional base payment topped up with an individual payment.France, the Netherlands, Austria, Scotland and Wales have chosen for an individual payment withvarying degrees of (de)coupling. These different ways for implementation will most probably give riseto the question whether some harmonisation would not be desirable.
Production in the EUIn 2003, the volume of production in the EU 15 decreased by 3%, especially due to a 20% decreaseof the production of cereals in France. In the livestock sectors production remained by and large thesame; only in the poultry sector did production fall, mainly due to lower production in the Netherlandsas a consequence of the outbreak of Avian Influenza.
Agricultural prices increased by 2% on average. In the crop sector prices on average rose by 5%.The livestock sector was faced with a 2% price decrease on average, due to considerable pricechanges for pigs (-7%), poultry (+5%) and milk (-4%). The volume of the means of productionpurchased fell slightly, but prices went up with a few percent. The drop in agricultural income in the EU was on average 1%. In the northern member states incomes in general declined more substantiallythan in the southern member states. Farmers in Denmark and Germany faced the largest incomedecrease; farmers in the UK saw their income rise by 21% compared to 2002.
1.3
5
11.3
XPR-LE020224-SUMMARY2004 12-08-2004 13:43 Pagina 5

Development of the Dutch Agribusiness
______________________________________________________Consumption and sales structure of food
Consumer spending on food in the Netherlands increased to 32 billion euros in 2003, an increase by1.6% as a result of higher prices. The share of food expenditure in total expenditure on consumptionremained almost the same (11.4%). Consumption of fruit and vegetables has been steadily decliningthe past years. Poultry has become more popular the last decennium, due to the growing demand forconvenience food and the favourable price.
Within the Dutch retail sector the concentration process continues. Albert Heijn, the largest Dutchretailer and part of the Ahold concern, has a market share of around 27%. This retailer started a 'price war' in October 2003 to regain part of the market share it had lost to (German) discounters.These discounters are very successful with a formula based on low prices, low service and a limitednumber of products compared to retailers like Albert Heijn.
The food and beverages industry is the largest segment of the Dutch industry, offering jobs toaround 140,000 people in 4,825 companies. The slaughterhouses and the meat processing industrygenerate the largest turnover and provide most jobs within the food and beverages section. A largepart of the turnover is generated abroad. In 2001 foreign sales accounted for nearly 43% of totalsales. The majority (77%) was sold in the EU.
______________________________________________________Agricultural Imports and Exports
The total Dutch import and export decreased slightly in 2003, with 0.5 and 1% respectively. Importsamounted to 205 billion euros, including 26.5 billion euros in agricultural products. Exports totalled232 billion euros, including 46.4 billion in agricultural products. The surplus on the agricultural tradebalance grew to around 19.9 billion euros, unchanged compared to 2002. Ornamental crop products make the greatest contribution to the agricultural export, followed by meatand dairy products (figure 2.1).
The Dutch agricultural export is still largely focused on the EU partner states. In 2003 nearly 80% of agricultural exports was sold on the internal market and 65% of the import originated in the EU.Germany was, as always, the most important destination, followed by the United Kingdom, France and Belgium and Luxembourg. The United States are the most important non-EU trading partner.
2.2
2.1
6
2
22.1
XPR-LE020224-SUMMARY2004 12-08-2004 13:43 Pagina 6

2.2
7
22.2
Ornamental products
Meat
Tobacco
Vegetables
Dairy
Cereal products, starch
Preparations of potatoes,vegetables and fruit
Drinks
Fish
Feedstuffs, excluding cereals
Livestock
Horticultural seeds
Coffee, tea, tobacco
Sugar
Eggs
Margarine, fats and oils
Fruit, nuts and spices
Cereals, seeds, pulsesand potatoes
Oilseeds
Source: Statistics Netherlands, calculations by LEI.
import export
Figure 2.1 Agricultural imports and exports by product, 2000-2003
5 643210-1-2-3 7 8
2001
2000
2002
2003
Billion euros
XPR-LE020224-SUMMARY2004 12-08-2004 13:43 Pagina 7

8
2.3
22.3
______________________________________________________The Agricultural Complex
The gross value added of the Dutch agricultural complex has risen from around 32 billion euros in1995 to over 40 billion in 2002. However, the share of the agricultural complex in the national totalhas decreased in this period, just as the share in employment, to just above 10% (table 2.1). Theshare of the primary sector (the sum of agriculture and horticulture) in the gross value added hasdeclined over this period. The dependency of the Dutch agricultural complex on export is still rising, in 2002 about 75% of the gross value added and of employment was related to export activities,compared to 66% in 1985. The grassland-based livestock complex contributes most to the valueadded of the agricultural complex. The share of this sector is however diminishing, while that of thegreenhouse gardening complex is growing.
2.3
Gross value added Employment(EUR billion) (1,000)
1995 2002 1995 2002(est.) (est.)
Agricultural complex a) 32.3 40.3 659 660
Share in national total 12.0% 10.3% 11.6% 10.1%Gardening, agricultural services and forestry 1.0 1.6 39 46Foreign agricultural raw materials: 11.1 15.7 190 214
Processing industry 5.7 7.5 75 74
Supply 2.3 3.0 50 52
Distribution 3.1 5.2 65 88Agricultural complex (based on domestic agricultural raw materials) 20.2 22.9 430 400
Share in national total 7.5% 5.9% 7.6% 6.1%Agriculture and horticulture 8.4 7.7 189 170
Processing industry 3.0 4.9 54 48
Input manufacturing 6.5 7.3 135 126Distribution 2.3 3.1 53 55
a) Based on domestic and foreign agricultural raw materials (including gardening, agricultural services, forestry, cocoa, alcohol and tobacco).Source: LEI.
Table 2.1 Gross value added and employment of the Dutch agricultural complex, 1995 and 2002
XPR-LE020224-SUMMARY2004 12-08-2004 13:43 Pagina 8

3
9
33.1
Rural Areas and the Environment
______________________________________________________Land use
The total land area of the Netherlands amounts to 3.4 million hectares, of which some 69% is used foragriculture and horticulture, 17% for woodlands, nature reserves and recreation (‘green activities’) and14% for housing, business activities and infrastructure (‘red activities’). Between 1996 and 2000 theagricultural area decreased by 34,000 ha, mainly to make room for housing areas (25,000 ha) andnature and recreation areas (8,000 ha).
If a rural area is defined as an area with less than 100 addresses per square kilometre, 66% of thetotal area in the Netherlands can be defined as rural, 24% as semi-rural (100 to 500 addresses per km2),5% as peri-urban (500 to 1,000 addresses per km2) and 5% as urban (more than 1,000 addressesper km2). Sixteen percent of the Dutch population live in rural areas, 25% in semi-rural areas, 16% inperi-urban and 43% in urban areas.
The farming sector is still the most important employer in the rural areas; however, its share issteadily declining. In 2003 agriculture accounted for 17% of employment in the rural areas, comparedto 19% in 1998. Since 1992 over 7,300 farmhouses have lost their agricultural function. Around 14%of these have been redeveloped for other, non-agricultural uses, like a small enterprise in ITC. This re-use of farm buildings creates extra employment in rural areas.
The number of farmers involved in non-agricultural activities on the farm, like agro tourism andnature conservation, is growing. Around 17% of all holdings were engaged in some sort of non-agricultural activity, not including the production and sale of farm products like cheese. The incomederived from these activities remains however small, and is estimated at 1.5% of the total income ofthe primary sector. Especially grassland-based holdings are active in this segment.
The actual price of agricultural land decreased by around 13% in 2003, which is in contrast with thesharp price increases of the past few years. The reduction is due to the diminishing non-agriculturaldemand, mainly for houses. Over the past years there was a strong relation between the (rocketing)prices for houses and the price for land, especially in peri-urban areas. In areas less under theinfluence of cities the prices of land are also influenced strongly by the drop in agricultural incomes.
The new government has shifted the focus from nature conservation by public organisations tonature conservation by farmers and other private organisations. The goal for purchasing land by thegovernment for nature development has therefore been brought down. However the aim for the thenational ecological network, to be realised in the year 2018, remains unchanged at 730,000 ha; of these, 140,000 ha should be realised through private – including agricultural – management.
3.1
XPR-LE020224-SUMMARY2004 12-08-2004 13:43 Pagina 9

______________________________________________________Environmental Issues
The pressure on the environment from agriculture and horticulture is steadily diminishing; however notall goals have been reached yet. The reduction of pressure on the environment goes hand in hand witha declining production volume. In the previous decade total agricultural production grew by around13%; in the past few years production has hardly grown.
Crop protectionIn 2002 the use of pesticides increased (table 3.1), which is a deviation from the long-term trend of declining use. The past ten years the use of pesticides dropped by 20%. The increase in use ofchemical substances in 2002 should not be regarded as a reversal of the downward trend, as the usein 2001 was extremely low due to favourable weather conditions. The government has formulatedambitious goals to further cut back the use of pesticides.
Greenhouse gassesThe emission of greenhouse gasses from the agricultural sector has decreased by 16% since 1990, thereference year for the Kyoto protocol. According to this protocol, the Netherlands should reduce theemissions by 6% in the period 2008-2012. To make sure these aims will be achieved, the governmenthas set maximum emission levels for CO2 for several sectors of the economy. For the agricultural sectorthe maximum is determined at 7 million tons, a reduction of 10% compared to the emissions in 2000.In the long term the Dutch government aims at reducing the emission of greenhouse gasses by 40 to 60%.This ambitious goal can only be reached through strong adaptations in production processes, especiallyin sectors that use a lot of energy like the horticultural sector. In the past years this sector has substantiallyincreased its energy-efficiency, the amount of energy used per unit of product produced. In 2002 theamount of energy used per unit product has been halved compared to 1980. It has been agreed thatin 2010 an improvement of 65% must be achieved, although it is doubted if this ambitious aim can beattained. Further improvements in the energy-efficiency are possible but require far reaching innovationssuch as storing surplus solar energy in the ground to use this as a source of energy in the winter.
Mineral losses and ammonia emission
3.2
33.2
10
3.2
Tabel 3.1 Use of pesticides in Dutch agriculture (1984-2002) and policy objectives for 2000
Use in mio. kg active substance ObjectiveCategory 1984-88 1995 1997 1998 1999 2000 2001 2002 (v) 2000
Soil disinfectants 10.25 2.39 1.57 1.18 1.47 1.40 0.99 1.20 3.28
Herbicides 4.60 3.98 3.85 4.05 3.87 3.50 3.09 4.03 2.53
Fungicides 4.45 4.49 4.94 5.81 5.20 4.93 3.95 3.78 2.85
Insecticides 0.69 0.55 0.49 0.46 0.41 0.29 0.27 0.24 0.44
Other pesticides 1.31 1.20 1.16 1.18 1.05 1.26 1.12 1.29 0.86
Total 21.30 12.61 12.01 12.68 11.99 11.38 9.42 10.54 10.65
Source: PD/Nefyto.
XPR-LE020224-SUMMARY2004 12-08-2004 13:43 Pagina 10

3.2
11
33.2
The mineral surplus in Dutch agriculture has decreased steadily in the past years. The difference betweeninput and output of nitrogen (N) declined from 172 kg per ha in 2001 to 147 kg N per ha in 2002; thedifference between the input and output of phosphate (P2O5) decreased from 54 kg per ha in 2001 to42 kg per ha in 2002. The manure surplus has almost disappeared if the current standards for themaximum permitted losses per hectare are applied. In the long term, however, these standards arenot strict enough in the light of EU agreements. It can therefore not be excluded that a manure surpluswill again develop, despite the expected further reduction in the number of animals in the Netherlands.
The European Commission has approved the requested derogation by the Dutch government to allowa higher input of nitrogen per hectare grassland than allowed by the Nitrate directive (maximum of 170 kg N per ha). This request is based on the assumption that input of nitrogen can be higher becausethe output - through products - is higher as well. During a period of four years the derogation is set at250 kg. After four years the limit will probably be set at 230 kg per ha.
The emission of ammonia from Dutch livestock decreased from 220 million kg in 1980 to 123 million kgin 2002. This reduction is largely due to the reduction of the number of animals and strict rules for theapplication of manure. By 2010 emission should have been reduced, according to EU agreements, toaround 128 million kg. For the agricultural sector this results in an emission level of 114 million kg. Thelatest prognoses for ammonia emission point to an emission level of 90 million kg in 2010, well belowthe set goal.
Agribusiness and the environmentThe environmental pressure of the agri-industry (defined as the agricultural complex excluding theprimary sector) on the different environmental themes is lower than the pressure of the primary sector.Waste is the exception to the rule. The past years both the agri-industry as well as the primary sectorimproved their environmental performance more than the rest of the economy (table 3.2) This canpartly be explained by the difference in growth of production. With a modest growth environmentalgoals are easier to obtain.
Environmental theme Share (%) in the Development (%) national average, 2002 between 1995 and 2002
Agri-industry Agriculture Agri-industry Agriculture Nationaltotal
Greenhouse gasses 2.3 12.2 -4.5 -13.3 +1.4
Acidification 0.6 30.0 -34.3 -26.1 -15.6
Mineral surpluses a) 4.0 79.9 -22.3 -31.0 -23.0
Waste a) 11.2 1.3 -14.7 -74.3 -7.2
GDP/production volume 3.2 2.4 +5 +1 +23
a) 2002=2001 Source: Statistics Netherlands and Statistics-Statline.
Table 3.2 Environmental pressure of agriculture and the agri-industry, 1995-2002
XPR-LE020224-SUMMARY2004 12-08-2004 13:43 Pagina 11

12
4
44.1
Structure of Agriculture and Horticulture
______________________________________________________Production Capacity and Farm Structure
The number of holdings dropped between 2002 and 2003 by 4,100 to 85,501 farms. This is areduction by 4.6% and an acceleration of the decrease compared to previous years. The reduction in number of farms can largely be explained by more or less voluntary ending of especially smallerholdings due to mediocre income perspectives. The special government arrangements aimed atreducing the manure surplus are another reason for the increased decline in number of farms.
The number of organic farms dropped in 2003 to 1,522 after a steady growth these past years.The total area of organic farming dropped by 700 ha to 41,900 ha. Lagging demand is the key factorresponsible for the decline of the organic sector.
The agricultural production increasingly takes place on specialised farms, farms on which more thantwo thirds of production (measured in DSU, see Annex) originates from 1 sector. The degree of specialization- the part of production in a sector coming from specialised farms - has risen most in the intensivelivestock sector, from less than 50% in 1980 to over 70% in 2003. In the glasshouse horticulturalsector the degree of specialisation is highest, over 90%. In other sectors - arable farming, dairy farming,outdoor horticulture - the degree of specialization varies between 75 and 90%. In the poultry meatsector the degree of specialization is lowest, 65%. Due to the changes in the common agriculturalpolicy for the arable sector, it has become more attractive for arable farmers to keep poultry formeat. Consequently, the arable sector is the only sector were the degree of specialization decreased.
Concentration on one sector in general yields better results, technically and economically.Increasing demands on the production process by for instance society or further stages in theproduction chain, can give an extra impetus to the tendency towards specialisation. The ensuingadaptation of the holding and investments may lead to an accelerated cut down of smaller productionunits on the farm. Specialization may therefore step up further expansion of the farm size.
Further expansion of farm sizeThe average size of farms is still growing. Figure 4.1 and 4.2 (page 14 and 15) show the changes
over the past 23 years in number of holdings by size, and by area or number of animals for a fewsectors. In the arable sector the number of holdings with more than 100 hectares has increasedthreefold to 750. These large farms use 20% of the arable area against 10% in 1980. In the glasshousehorticulture sector holdings with more than 5 ha now account for 20% of the production area against1% in 1980. The average size of glass per holding has doubled since 1980 to 1.25 ha while thenumber of holdings with glass halved. In the dairy sector the percentage of farms with more than 100 cows has risen from 3% in 1980 to 10% in 2003. These holdings own 20% of the dairy herd.Comparable trends have occurred in the intensive livestock sector, pig farms with more than 1,500animals now account for 35% of the total stock against 6% in 1980. In the poultry sector nearly 30%of the animals are kept on farms with more than 100,000 animals, against 10% in 1980. In generalbigger farms generate better incomes and are more innovative.
4.1
XPR-LE020224-SUMMARY2004 12-08-2004 13:43 Pagina 12

4.2
13
44.2
______________________________________________________Labour, Land and Capital
Agriculture and horticulture offered employment to 255,000 people in the Netherlands in 2003, adecrease by 11% since the year 1990. The loss of employment mainly occurred after 2000, when thedecline in the number of farms quickened. The number of full-time jobs went down by almost 20%since 1990 to around 184,000 jobs. About one third of the labour force on farms is non-family labour,against 16% in 1991 (table 4.1).
The average balance total of all businesses in the Dutch agricultural and horticultural sectorincreased the past decade by nearly 0.5 mio to 1.6 mio euros. Increasing farm size, innovations andinvestments to improve the environmental and animal welfare status of the farm have necessitated thisincrease. Nearly one third of the capital is loan capital. The solvency percentage, the relation betweenown capital and loan capital, is highest on dairy farms, mainly due to the relatively large area of landon these farms and the value of the milk quotas.
The average family farm income in all agricultural and horticultural holdings in 2003 is estimated at40,000 euros. This is a partial recovery from last year's result of 34,800 euros. Income from outsidethe farm, which has become more important in the past years, is estimated at 8,000 euros. Totalfamily income (before taxes) therefore adds up to 48,000 euros.
Large differences exist between sectors and within sectors. In 2001 the income on half the holdingswas more than 40,000 euros, in 2002 39% of the farms had an income over 40,000 euros. About 1 in 3 holdings had an income below 20,000 euros, the Dutch lowincome line. Ten percent of theholdings had an income exceeding 100,000 euros, 15% of the holdings suffered losses.
4.2
Index (1990 = 100) Number(x1,000)
1995 2000 2002 2003 2003
Total labour force 96 97 90 89 255
Family labour 93 84 77 76 177
of which entrepreneur 101 92 87 85 125
other family labour 79 70 59 61 52
Non-family labour 107 151 140 137 79
Source: Statistics Netherlands, calculations by LEI.
Table 4.1 Agricultural labour force, 1995-2003
XPR-LE020224-SUMMARY2004 12-08-2004 13:43 Pagina 13

14
4.2
44.2
0200400600800
1,0001,2001,4001,6001,8002,000
1980 1990 2003 1980 1990 2003
1980 1990 2003 1980 1990 2003
1980 1990 2003 1980 1990 2003
Holdings with poultry Animals (x 1,000)
Animals (x 1,000)
Animals (x 1,000)
Holdings with fattening pigs
Holdings with milk cows
>= 100 75 - 100
50 - 75 < 10 10 - 50
Number of broilers per farm (x 1,000)
>= 1500500 - 1500
250 - 500 < 50 50 - 250
Number of pigs per farm (x 1,000)
>= 100 50 - 100
25 - 50 < 10 10 - 25
Milk cows per holding
0
10,000
20,000
30,000
40,000
50,000
60,000
0
5,000
10,000
15,000
20,000
25,000
30,000
35,000
0
1,000
2,000
3,000
4,000
5,000
6,000
7,000
8,000
0
10,000
20,000
30,000
40,000
50,000
60,000
70,000
80,000
0
500
1,000
1,500
2,000
2,500
Figure 4.1 Number of holdings and animals by size, 1980-2003
Source: Statistics Netherlands; calculations by LEI.
XPR-LE020224-SUMMARY2004 12-08-2004 13:43 Pagina 14

4.2
15
44.2
1980 1990 2003 1980 1990 2003
1980 1990 2003 1980 1990 2003
1980 1990 2003 1980 1990 2003
Holdings with glass house horticulture
Holdings with flower bulbs
Holdings with arable crops
Area of glass
Area
Area
Figure 4.2 Number of holdings and area by size, 1980-2003
0
2,000
4,000
6,000
8,000
10,000
12,000
14,000
16,000
0
2,000
4,000
6,000
8,000
10,000
12,000
0
1,000
2,000
3,000
4,000
5,000
6,000
0
5,000
10,000
15,000
20,000
25,000
30,000
0
10,000
20,000
30,000
40,000
50,000
60,000
0
100,000
200,000
300,000
400,000
500,000
600,000
700,000
>= 52,5 - 5
1 - 2,5 < 0,5 0,5 - 1
Ha glass per holding
>= 25 10 - 25
5 - 10 < 1 1 - 5
Ha flower bulbs per holding
>= 100 60 - 100
30 - 60 < 10 10 - 30
Ha arable crops per holding
Source: Statistics Netherlands; calculations by LEI.
XPR-LE020224-SUMMARY2004 12-08-2004 16:43 Pagina 15

16
5
55.1
Table 5.1 Value added of agriculture and horticulture in the Netherlands,2001-2003
Value added in EUR billion Index 2003 (2002 = 100)
2001 2002 (v) 2003 (est.) Volume (est.) Price (est.) Value (est.)
Arable products 2.4 2.5 2.7 103 106 110
Horticultural products 7.6 7.8 8.0 102 100 102
Grassland-based livestock products 4.6 4.5 4.4 100 97 97
Intensive livestock products 4.3 3.5 3.1 88 101 89
Other 1.9 1.8 1.9 102 103 105
Total 20.7 20.1 20.0 99 101 100
Intermediate consumption 11.1 11.0 10.9 98 102 99
Gross value added 9.6 9.1 9.1 101 100 100
Depreciations 2.5 2.6 2.7 103
Balance of levies and subsidies 0.1 0.2 0.1 -
Net value added 6.9 6.2 6.2 101
Source: Statistics Netherlands; 2003 estimation LEI.
Market and Income Developments in the Various Sectors
______________________________________________________Results of the Primary Sector
The production value of the primary sector was unchanged in 2003 compared to 2002. Prices weresomewhat higher but this was offset by a slightly lower volume of production (table 5.1).
Production in the arable sector increased due to good weather conditions; especially production ofcereals and sugar beets went up. In the horticultural sector the production volume grew as well;especially the production of fruit, plants and trees increased. Production of livestock reduced, largelydue to the outbreak of Avian Influenza (AI). The production of eggs and poultry meat fell by 35%. In thepig sector, however, production declined as well, by 6%. Due to fierce competition within the EU andoutside the EU, prices remain low for pig meat. Prices for arable products developed favourably,prices for other products showed little change. The slightly higher milk production was sold againstlower prices to the dairy industries.
The value of intermediate consumption went down compared to 2002, despite higher prices forenergy and fertilizer. Combined with a stable production value this leads to a somewhat higher netvalue added for the primary sector in 2003.
5.1
XPR-LE020224-SUMMARY2004 12-08-2004 13:43 Pagina 16

______________________________________________________Horticulture under Glass and Mushroom Growing
Horticulture under glass and mushroom growing together account for a quarter of the total productionvalue of Dutch agriculture and horticulture. Total production value of horticulture under glass increasedby 4% (table 5.2). Over the years a shift has occurred in production from the production of vegetablesto the production of flowers and plants. Meanwhile an increase took place in the size of the holdings.Holdings with more than 3 ha glass now own one third of the total Dutch glass area, compared to onlysix percent in 1980.
The surface area of glass increased to 10,535 ha in 2003. The number of specialised greenhousehorticulture holdings continues to fall and in 2002 comprises around 9,500. The number of mushroomgrowers likewise continues to fall. In 2003 their number declined to less than 400 holdings. The totalarea of mushrooms decreased by 2.5%.
The traditional auction to market vegetables, flowers and plants loses ground every year. In 1990about 56% of production was sold through the auctions, in 1998 this percentage had diminished to11%. It is expected this will further decrease to around 5% in 2012. Sales through contracts withretailers and food providers have taken over the role of the auction.
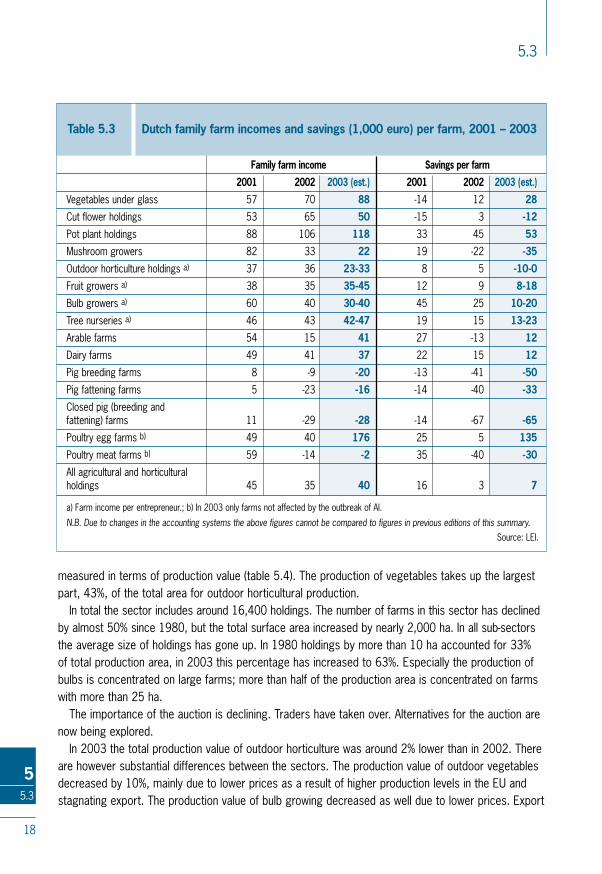
Thanks to the rise in production value, which was accompanied by a rather small increase in costs,the results of the vegetables under glass holdings and the pot plants holdings in 2003 substantiallyimproved (table 5.3). For the cut flower growers the results were less favourable; they suffered amongother things from the reduced export to markets outside the EU.
Mushroom growers on average faced very low incomes and negative savings (table 5.3). Due tofierce competition and stagnating demand, the incomes of these holdings have been under pressurethe past years.
______________________________________________________Outdoor Horticultural Production
The outdoor horticultural sector includes tree nurseries, bulb growing, fruit growing and vegetablegrowing. It is therefore a rather heterogeneous sector. The production of bulbs is most important,
5.3
5.2
5.2
17
55.2
Table 5.2 Production value (mio. euro) of horticulture under glass and mushroom growing in the Netherlands, 1990-2003
1990 1995 2000 2001 2002 2003 2003 as a % of 2002
Vegetables 1,173 1,067 1,259 1,163 1,192 1,300 109
Cut flowers 1,480 1,614 2,086 2,065 2,149 2,160 101
Pot plants 769 865 1,149 1,213 1,301 1,385 106
Total horticulture under glass 3,422 3,546 4,494 4,441 4,642 4,845 104
Mushroom 182 245 316 318 303 285 94
Source: Productschap Tuinbouw.
XPR-LE020224-SUMMARY2004 12-08-2004 13:43 Pagina 17
measured in terms of production value (table 5.4). The production of vegetables takes up the largestpart, 43%, of the total area for outdoor horticultural production.
In total the sector includes around 16,400 holdings. The number of farms in this sector has declinedby almost 50% since 1980, but the total surface area increased by nearly 2,000 ha. In all sub-sectorsthe average size of holdings has gone up. In 1980 holdings by more than 10 ha accounted for 33% of total production area, in 2003 this percentage has increased to 63%. Especially the production ofbulbs is concentrated on large farms; more than half of the production area is concentrated on farmswith more than 25 ha.
The importance of the auction is declining. Traders have taken over. Alternatives for the auction arenow being explored.
In 2003 the total production value of outdoor horticulture was around 2% lower than in 2002. Thereare however substantial differences between the sectors. The production value of outdoor vegetablesdecreased by 10%, mainly due to lower prices as a result of higher production levels in the EU andstagnating export. The production value of bulb growing decreased as well due to lower prices. Export
18
5.3
55.3
Table 5.3 Dutch family farm incomes and savings (1,000 euro) per farm, 2001 – 2003
Family farm income Savings per farm
2001 2002 2003 (est.) 2001 2002 2003 (est.)
Vegetables under glass 57 70 88 -14 12 28
Cut flower holdings 53 65 50 -15 3 -12
Pot plant holdings 88 106 118 33 45 53
Mushroom growers 82 33 22 19 -22 -35
Outdoor horticulture holdings a) 37 36 23-33 8 5 -10-0
Fruit growers a) 38 35 35-45 12 9 8-18
Bulb growers a) 60 40 30-40 45 25 10-20
Tree nurseries a) 46 43 42-47 19 15 13-23
Arable farms 54 15 41 27 -13 12
Dairy farms 49 41 37 22 15 12
Pig breeding farms 8 -9 -20 -13 -41 -50
Pig fattening farms 5 -23 -16 -14 -40 -33
Closed pig (breeding and fattening) farms 11 -29 -28 -14 -67 -65
Poultry egg farms b) 49 40 176 25 5 135
Poultry meat farms b) 59 -14 -2 35 -40 -30
All agricultural and horticultural holdings 45 35 40 16 3 7
a) Farm income per entrepreneur.; b) In 2003 only farms not affected by the outbreak of AI.
N.B. Due to changes in the accounting systems the above figures cannot be compared to figures in previous editions of this summary.Source: LEI.
XPR-LE020224-SUMMARY2004 12-08-2004 13:43 Pagina 18

of bulbs dropped considerably in the second half of 2003, with 10%, to important markets outside theEU like the United States and Japan due to the expensive euro. The fruit sector and the tree nurserysector showed an increase in production value.
The income in 2003 for outdoor vegetable growers is considerably lower than in 2002. Fruit growers,tree nurseries and bulb growers had comparable incomes to 2002 (table 5.3).
______________________________________________________Arable Farming
The production value of arable farming was 2.7 million euros in 2003. Potatoes account for about one third of this value (0.9 million euros), sugar beet and cereals both have a production value of 0.3 million euros.
The area of arable crops has been fairly stable in the past years at around 600,000 ha. In terms ofacreage cereals are the most important crop with nearly one third of the area. The number of farmsgrowing arable crops has decreased to nearly 29,500 farms. The average area per farm has gone up.In 1980 around 13% of the arable area could be found on farms with more than 80 ha. This percentagehas increased to 28% in 2003. Only 4% of the arable farms have more than 80 ha.
Production per ha of all crops but potatoes for consumption and starch potatoes developedfavourably in 2003 due to the good weather conditions. The tight supply in the EU led to rising priceswith the exception of starch potatoes (table 5.5).
The rising prices in combination with good production levels have restored incomes in the arablesector after the bad results of 2002 (table 5.3). On average income reached a level of 41,000 eurosallowing for average savings of 12,000 euros per farm.
5.4
5.4
19
55.4
Table 5.4 Production value (mio. euro) of outdoor horticulture in the Netherlands,1990-2003
1990 1995 2000 2001 2002 2003 2003 as a % of 2002
Vegetables 463 434 363 453 433 390 90
Fruit 309 313 326 347 330 360 109
Bulbs 381 504 563 600 613 575 94
Trees 346 433 548 535 553 570 103
Total outdoor horticulture 1,499 1,684 1,800 1,935 1,929 1,895 98Source: Productschap Tuinbouw.
XPR-LE020224-SUMMARY2004 12-08-2004 13:43 Pagina 19

______________________________________________________Grassland-Based Livestock Farming
Production value of grassland-based livestock farming declined to 4.4 million euros in 2003. Milkproduction takes up the larger part with 3.6 million. The decrease is due to a lower production of beefand lower prices for milk.
The total number of grassland-based livestock farms decreased to 50,344 farms; compared to1980 the number of farms has halved. Since 1980 the number of specialised dairy farms went downby two thirds, but they are still the largest group with 22,857 holdings. Milk production is more andmore concentrated on bigger farms, farms that produce more than 400,000 tons of milk per year.The majority of livestock, 92%, is kept on specialised farms, holdings that use more than two thirds oftheir production capacity for one farming activity. The livestock density, measured in livestock unitsper hectare, has fallen from 2.8 LFU in 1980 per ha to 2.2 LFU per ha on average in 2003.
The introduction of the milk quota in 1984 has had a major influence on the structural developmentof the Dutch livestock sector. In 1985 2.4 million cows were needed to produce the allowed amountof milk, in 2003 a little under 1.5 million cows did the job. Average milk production per cow increasedfrom just over 5,300 kg in 1985 to 7,100 kg in 2003. Before 1984, 40% of all dairy farms had lessthan 30 cows compared to 20% in 2003. The declining cowherd has had its effect on the calf-fatteningsector as well. They are forced to increase import of calves due to the diminished Dutch supply.
The income for dairy farmers dropped in 2003, due to lower milk prices and rising costs (table 5.3).The outlook for this year is mediocre as well, due to the expected effects of the reform of thecommon market organisation for dairy products. The lower institutional prices for butter and skimmed
5.5
20
55.5
Table 5.5 Production and prices a) for arable products, 2001-2003
Wheat Barley Potatoes for Seed Starch Sugar Onionsconsumption potatoes potatoes beet
Production (ton/ha)
2001 8.6 6.0 46.4 36.7 43.7 9.3 54.0
2002 8.1 5.7 53.5 35.7 46.5 9.7 52.7
2003 (est.) 10.0 5.8 48.8 36.8 40.0 10.9 55.0
Idem, change (%) +24 +2 -9 +3 -14 +12 +4
Prices (euro/100 kg)
2001 12.40 13.40 11.00 26.80 5.30 57.65 12.90
2002 10.70 12.90 6.95 19.00 5.30 48.50 9.40
2003 (est.) 14.30 13.75 12.00 21.00 5.30 48.00 18.00
Idem, change (%) +34 +7 +73 +11 0 -1 +91
a) Excluding the Mac Sharry payments. Source: LEI.
5.5
XPR-LE020224-SUMMARY2004 12-08-2004 13:43 Pagina 20

milk powder will reduce milk prices, a reduction only partly compensated by the farm payments.Prognoses for 2007 indicate an income drop of 5,000 euros due to the reform, which comes close to16% of the annual income.
Figure 5.1 shows that the income in the Dutch dairy sector is no longer the highest in Europe. Thisis caused by a slow growth of already big holdings, a somewhat lower milk price and higher productioncosts. Belgium dairy farmers have the highest income, if all dairy farms are taken into account,followed by Italy. If the category smaller farms is left out in the comparison a different picture arises,with Italy and Spain on top of the list. The UK and the Netherlands are the only two countries wereaverage income of all farms is higher than average income of farms with a quota between 200,000 and600,000 kg. This is due to the high income on farms with more than 600,000 kg of quota.
5.5
21
55.5
Figure 5.1 Family farm income (x 1,000 euro) per labour unit in the dairy sector, average 1996 – 2000
200-600 ton of milkquota
all
Source: RICA.0 10 20 30 40
Italy
Spain
Ireland
Belgium
Austria
Luxembourg
France
Germany
United Kingdom
The Netherlands
Denmark
Finland
Greece
Portugal
Sweden
XPR-LE020224-SUMMARY2004 12-08-2004 13:43 Pagina 21

The prices for beef improved in 2003 due to lower supply. Consumers have regained confidence inbeef; as a consequence consumption is increasing. The EU is now a net-importer of beef. Cattlefattening is usually a side activity on dairy farms. The cattle-fattening farms have similar results as in2002. These past years the profitability of the cattle-fattening business has been under pressure.
Prices for sheep meat were unchanged compared to 2002. Export of live sheep flourished, Francebeing the most important market. Consequently the export of sheep meat went down, by more than10%. Sheep farmers saw their results in 2003 diminish. The balance per ewe decreased by 7 eurosper ewe to 102 euros.
______________________________________________________Intensive Livestock Farming
The production value of the intensive livestock sector fell to 3.1 million euros in 2003, as aconsequence of much lower production volumes in the poultry sector due to the outbreak of AvianInfluenza (AI) in the spring 2003. The effect was partly offset by higher prices. Pig production is the most important part of livestock farming, with a share in total production value of over 50% (1.7 million euros), followed by poultry and eggs.
The number of farms in the intensive livestock sector has fallen considerably over the past years,especially the number of pig farms. This is partly due to the success of several measures of theministry of Agriculture. With a number of subsidy schemes the government has actively bought up pigproduction rights, thereby significantly reducing the livestock population and consequently the numberof holdings. In 2003 around 50,000 farms in the Netherlands were involved in intensive livestockfarming, compared to nearly 100,000 in 1985. In 2003 there were 11 million pigs in the Netherlands(compared to 15 million in 1997) and 81 million fowls. The last figure is considerably lower than in2002 due to the mass destruction of infected stock in order to combat the outbreak of AI.
The average size of pig and poultry farms has increased steadily over the past years. The 300 (3%)largest pig farms keep nearly 20% of all animals. In the poultry sector nearly 30% of all animals arekept on holdings with more than 100,000 animals, compared to 10% in 1980.
Prices for pigs were low in 2003, production decreased by 3%. In the EU pig production was stablecompared to 2002. The growth of pig production in for instance Canada and Brazil puts extrapressure on the European pig prices, although the growth in Canada seems to have come to an enddue to low economic results.
Family farm income in the pig sector was very low for all three types of farms: closed farms(combined breeding and fattening), fattening farms and breeding farms (table 5.3). The low incomescan for the larger part be explained by the low pig prices. Negative savings as high as 65,000 eurosclearly show the difficult financial position of a lot of pig farmers. The future does not look too brightfor a number of holdings in this sector. Increasing demands from society require investments toimprove the environmental and welfare status of the farms. This leads to rising costs that are not(always) reflected in the market price due to the competition from outside the EU where differentproduction standards are applied.
5.6
22
5.6
55.6
XPR-LE020224-SUMMARY2004 12-08-2004 16:43 Pagina 22

Figure 5.2 shows the wide variety in the family farm income on closed pig farms in several EUmember states. This variety is due to differences in costs, for instance environmental costs. Theseare quite high in the Netherlands but low in for instance Denmark. Italian and Belgium farmers have thebest results, thanks to high yields and low costs.
Prices for poultry meat were fairly stable in 2003. The production of poultry meat increasedworldwide. In the Netherlands production went down due to the effect of AI. The prices for eggs wentup with on average 30%, egg production dropped by 27%.
In the poultry sector family farm income was very high for those poultry egg holdings not affectedby the outbreak of AI. These farms could profit from the high(er) egg prices and had a very good yearwith incomes as high as 176,000 euros (table 5.3). Farms whose herd was stamped out faced – onaverage – a loss of 30,000 euros. For the unaffected poultry meat farms income was negative, mainlydue to low prices. Poultry meat farms that were affected by the AI had even worse incomes, minus60,000 euros on average.
5.6
23
55.6
Figure 5.2 Family farm income (x 1,000 euro) per labour unit on closed farms a)
in the pig sector, average 1996 – 2000
Source: RICA.
0 10 20 30 40 50 60-10
SwedenFinlandAustriaSpain
United KingdomDenmark
The NetherlandsBelgium
ItalyFrance
Germany
a) Combined breeding and fattening.
XPR-LE020224-SUMMARY2004 12-08-2004 13:43 Pagina 23

24
Definitions
Dutch size units (DSU)
A unit describing the economic size of agricultural holdings. The DSU is based on the standard gross margins
(SGM), which are calculated by deducting related specific costs from the gross returns per hectare or per animal.
The SGM is expressed in euro (current prices). On the EU level, the size of farms is not measured in SGM,
but in the more workable European Size Units (ESU). DSU is the Dutch variant of the ESU. The DSU is recalculated
frequently in such a way that the average farm size in DSU corresponds to the development of the volume of
the added value of the average farm. The 2000 DSU equals a SGM of about 1,375 euros. Some examples (on the
basis of the DSU 2000): 1 ha winter wheat = 0.81 DSU; 1 ha sugar beet = 1.72 DSU; 1 dairy cow = 1.270 DSU;
1 sow = 0.247 DSU, 1 ha round tomatoes under glass = 146,9 DSU and 1 ha roses = 245.9 DSU.
Family farm income
Income for the farm family arising from the farm business; this is a remuneration for the labour of all family
members as well as the private capital and land.
Gross value added
Gross returns minus purchased goods and services (excluding depreciation).
Net value added
Gross returns minus costs of goods and services purchased from other sectors (including depreciation).
Savings
The part of total income which has not been used for consumption or personal taxes, but is added to net worth.
Solvency
Net value in % of total capital.
Total income
Family farm income plus income from non-farm activities and social security benefits paid to the farmer and his
spouse.
XPR-LE020224-SUMMARY2004 12-08-2004 16:43 Pagina 24


Ag
This report offers an English summary of the Landbouw-Economisch Bericht 2004.
It presents a survey of the economic state of Dutch agribusiness. First, attention is
paid to general economic and political developments and to the development of the
agricultural complex. Next, the report deals with the rural area and with environmental
issues. Following a description of the production structure and production factors in
agriculture, profitability and income formation in the various sub-sectors are analysed.