agriculture statistics yearbook - agric.gov.ab.cadepartment/deptdocs.nsf/all/sdd16172/... ·...
TRANSCRIPT

2015
AgricultureStatistics
Yearbook

Published by:
Alberta Agriculture and Forestry
Statistics and Data Development Section
7000 – 113 Street
Edmonton Alberta
Canada T6H 5T6
Copyright © 2016. Her Majesty the Queen in Right of Alberta (Alberta Agriculture and Forestry).
All rights reserved.
Any reproduction of this publication or its parts may only be done in accordance with the Open Government
Licence – Alberta (website: http://open.alberta.ca/licence), under the terms of the Government of Alberta Open
Information Policy (http://open.alberta.ca/policy).
ISSN 0380-5050 (Print)
ISSN 1927-4106 (Online)
ISBN 978-1-4601-2977-7 (Print)
ISBN 978-1-4601-2978-4 (PDF)
This publication is available online at: http://agriculture.alberta.ca/stats-yearbook
See the website www.agriculture.alberta.ca/publications for other information products.
Alberta Agriculture and Forestry
Economics and Competitiveness Branch
Statistics and Data Development Section
41st Edition
September 2016
Agriculture
Statistics
Yearbook
2015
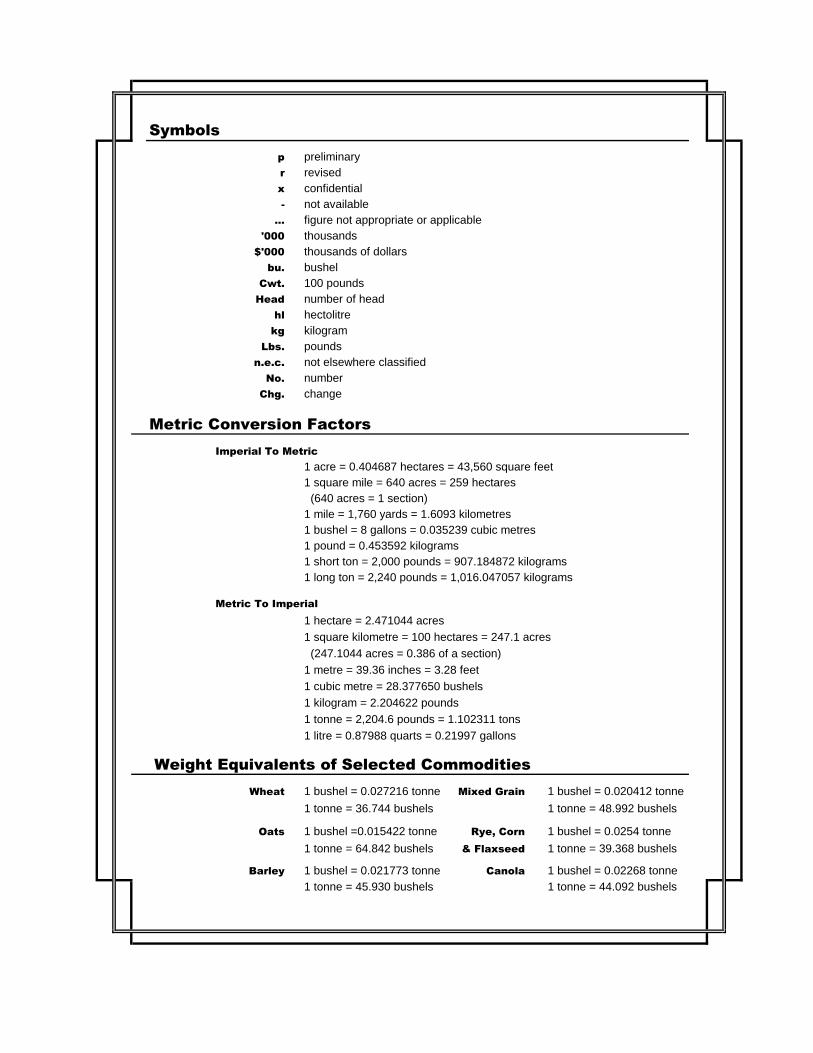
Symbols
p preliminary
r revised
x confidential
- not available
... figure not appropriate or applicable
'000 thousands
$'000 thousands of dollars
bu. bushel
Cwt. 100 pounds
Head number of head
hl hectolitre
kg kilogram
Lbs. pounds
n.e.c. not elsewhere classified
No. number
Chg. change
Metric Conversion Factors
Imperial To Metric
1 acre = 0.404687 hectares = 43,560 square feet
1 square mile = 640 acres = 259 hectares
(640 acres = 1 section)
1 mile = 1,760 yards = 1.6093 kilometres
1 bushel = 8 gallons = 0.035239 cubic metres
1 pound = 0.453592 kilograms
1 short ton = 2,000 pounds = 907.184872 kilograms
1 long ton = 2,240 pounds = 1,016.047057 kilograms
Metric To Imperial
1 hectare = 2.471044 acres
1 square kilometre = 100 hectares = 247.1 acres
(247.1044 acres = 0.386 of a section)
1 metre = 39.36 inches = 3.28 feet
1 cubic metre = 28.377650 bushels
1 kilogram = 2.204622 pounds
1 tonne = 2,204.6 pounds = 1.102311 tons
1 litre = 0.87988 quarts = 0.21997 gallons
Weight Equivalents of Selected Commodities
Wheat 1 bushel = 0.027216 tonne Mixed Grain 1 bushel = 0.020412 tonne
1 tonne = 36.744 bushels 1 tonne = 48.992 bushels
Oats 1 bushel =0.015422 tonne Rye, Corn 1 bushel = 0.0254 tonne
1 tonne = 64.842 bushels & Flaxseed 1 tonne = 39.368 bushels
Barley 1 bushel = 0.021773 tonne Canola 1 bushel = 0.02268 tonne
1 tonne = 45.930 bushels 1 tonne = 44.092 bushels

Inquiries regarding any of the topics presented in the Yearbook may be directed to:
Farm Income Reynold Jaipaul, Director 780-427-5376 [email protected]
Farm Income, Retail Prices, Custom
Rates, Agricultural Input Monitoring
System (AIMS)
Roy Larsen, Senior Statistician 780-644-1308 [email protected]
Economic Indicators, Food StatisticsJean Marie Uwizeyimana,
Agri-Food Statistician 780-422-3099 [email protected]
Agri-Food ExportsBarbara Pekalski,
Trade Research Statistician 780-427-5386 [email protected]
CropsAshan Shooshtarian,
Crop Statistician 780-422-2887 [email protected]
Livestock, Dairy, Poultry,
Beekeeping, Food Prices
John Paul Emunu,
Livestock Statistician 780-427-4243 [email protected]
Agriculture Real Estate ValuesGuangzhi Liu, Senior Business and
Research Analyst 780-422-4430 [email protected]
Census of Agriculture
Marion Harry, Research Assistant
Jean Marie Uwizeyimana,
Agri-Food Statistician
780-427-9206
780-422-3099
http://agriculture.alberta.ca/stats-yearbook
Alberta Agriculture and Forestry
Economics and Competitiveness Branch
Statistics and Data Development Section
J. G. O'Donoghue Building
302, 7000 - 113 Street
Edmonton, Alberta, CANADA, T6H 5T6
Telephone: 780-427-4011 Fax: 780-427-5220
Alberta Agriculture and Forestry has produced the Yearbook since the early 1970's as a service to government, policy makers, agri-
businesses, farm organizations, market researchers, academic institutions and the agricultural community at large. We hope you find this
edition informative and useful. Also, any comments or suggestions regarding the Yearbook would be greatly appreciated.
INTRODUCTION
The Agriculture Statistics Yearbook is compiled by the Statistics and Data Development Section of Alberta Agriculture and Forestry to
serve as a reference document and a principal source of information for users of statistics on the Alberta agri-food industry. The dynamic
trends occurring in the primary agricultural industry and the food and beverage processing sector are presented in the Yearbook's statistical
tables and charts, to provide both a current and historical perspective. For purposes of comparison, a number of tables and charts provide
information for Canada and other provinces, in addition to Alberta.
Individual sections of the Yearbook present information on identifiable industry sectors such as crops, livestock and food and beverages,
and industry measures and indicators such as farm income, agri-food exports and economic indicators. Together, the sections constitute a
reliable representation of the performance of Alberta's agri-food industry. Featured topics of major significance and importance to the agri-
food industry include farm cash receipts, net farm income, input costs, population, gross domestic product, employment, investment
expenditures, food expenditures, food and beverage processing activity measures, commodity prices, exports of primary commodities and
value added processed products, production and inventory of livestock, and crop estimates (production and acreage).
Statistical tables are presented on a calendar year basis, unless otherwise specified. Tables and charts have been updated to include data
for the 2015 reference year, where available. Data were compiled from a variety of sources, with the majority produced by the Agriculture
Division of Statistics Canada in collaboration with Alberta Agriculture and Forestry. We gratefully acknowledge the assistance of
Agriculture and Agri-Food Canada, as well as other federal and provincial departments and agencies who provided data for inclusion in this
publication. Special appreciation is extended to all agricultural producers and processors who responded to our surveys or supplied other
information to surveys conducted by Statistics Canada.
The Agriculture Statistics Yearbook may be viewed on-line by visiting the Alberta Agriculture and Forestry website at:
Note: Data presented in the Yearbook were current as of August 2016 . Users are advised that components of some statistical tables
may not add up to their totals due to rounding.
- i - Alberta Agriculture Statistics Yearbook, 2015
Page No.
i
ii
v
vi
vii
1
3
Table No.
Farm Income and Expenses..............................................................................................................................................................................................…5
Alberta Farm Income in 2015………….……………………………………………………………………………………………..……………………………………………………..…………………….…………………….…………………………………6
1. Selected Farm Income Statistics, Canada and Provinces, 2011-2015 ………………………………………………………………….……..8
2. Farm Cash Receipts by Type, Alberta and Canada, 2014 and 2015 ……………………………………………………………..………………11
3. Alberta Farm Cash Receipts by Type, 1986-2015 ……………………………………………………………………….…………………………………...….14
4. Alberta Farm Cash Receipts From the Sale of Crops, 1986-2015 …………………………………………….…………………………………………………..………15
5. Alberta Farm Cash Receipts From the Sale of Livestock, 1986-2015 …………………………………………………….………………………………………….….17
6. Alberta Farm Operating Expenses and Depreciation, 1986-2015 ………………………………………….…………………………………………………………..…..18
7. Alberta Net Farm Income, 1986-2015……………………………………………………………….………………………………………………….…..21
8. Value of Alberta Farm Capital and Value Per Acre of Farm Land and Buildings, at July 1, 1986-2015……………………………………………………………22
9. Alberta Farm Debt Outstanding by Lender, at December 31, 1986-2015…………………………………………………………………….……….23
Economic Indicators...................…………………………………......................................................................................................................................................…25
10. Population of Canada and Provinces on July 1, 2001-2015…………………………………………………………………………..…………………26
11. Alberta Urban and Rural Population, 1976-2011…………………………………..…………………………………………………………..…………………………………………………..……………………………………………………..…………………….…………………….…………………….………………………………………….……………..……………..26
12. Alberta Employed Labour Force in Agri-Food Industries, 1996-2015………………………………………………………………….……………27
13. Selected Economic Indicators, Canada and Alberta, 1979-2015…………………………………..……………………………………..…………28
14. Alberta Gross Domestic Product (GDP) for Agri-Food Industries In Chained (2007) Dollars, 2009-2015...……………………………………………………………………………………………..29
15. Capital Investment Expenditures in Alberta Agri-Food Industries, 2007-2015…………………………..…………………………………………………….30
16. Alberta Average Hourly Wage Rates for Agriculture and Other Major Industries, 2011-2015……………………………………………………………………………………………...……………31
17. Farm Bankruptcies, Canada and Provinces, 1996-2015………...……………………………………….……………………………………………….31
18. Alberta Average Farm Input Prices, 2014 and 2015 ………………………………………………………………………………………………………………32
19. Alberta Agricultural Real Estate Average Value by C.L.I., 1996-2015…………………………………………………………………… 33
20. Average Alberta Agricultural Land Values by C.L.I. and Municipality, 2015……………………………………………………………………34
Food and Beverage Industries.........................................................................................................................................................................…35
Alberta Food and Beverage Manufacturing Industries in 2015………………………………………………..……………………………………………..…………………………………………………..……………………………………………………..…………………….…………………….…………………….……………………………………………………….…………………..………………36
21. Employed Labour Force in Alberta Food and Beverage Industries, 2006-2015………………….……….………………..…………………..…………………….…………….…………….…………….38
22. Alberta Average Weekly Earnings for Food Related Industries, 2006-2015…………….………..…………………….………..………….………..………………………….…………….38
23. Alberta and Canada Value of Manufacturing Sales for Food and Beverage Industries, 1995-2015……….……………………………………………….………..……………………..…………39
24. Alberta Value of Manufacturing Sales for Food and Beverage Industries by Type, 2009-2015………..………………………………………………..…….………..………………………40
25. Value of Manufacturing Sales for Meat Product Industries, Canada and Provinces, 2006-2015……..…………………..………………………………..……………….………..……………………….…………..………………42
26. Alberta Food and Beverage Exports to Other Countries, 2006-2015…..………………..………………………..………………………………..…………………….…43
27. Average Household Food Expenditures, Alberta and Canada, 2014……………………………………………………………………………..44
28. Food Available Per Person for Selected Products, Canada, 2006-2015……………………………….………..……………………………………………..45
29. Alberta Food Services and Drinking Places, 2006-2015…...……………………..…………………….………..………………….………………………………..46
30. Alberta Retail Sales for Food and Beverage Stores, 2006-2015…………………………………………………..……………………..……………………………….46
31. Edmonton Monthly Retail Food Price Indices by Category (Jan 2009=100), 2015………...…………………………………………………..…………………….…..………………………..………………………..……………47
32. Edmonton Nutritious Food Basket - Weekly Average Cost for a Family of Four, 2015………………………………………………………………..…………………….………………………..………………………..………………………..……………………48
33. Per Capita Consumption of Meats in Canada and United States, 1986-2015…...……………….………………….…………………………..….49
34. Alberta Honey Statistics, 1997-2015…………………………………..….………………..….…………………………..….………………..….……………………..….50
Year in Review, 2015………………………………………………………………………………………..……………………………………………………..…………………….…………………….………………..……………………..…………………….……………………………………………………..….
Value of Agricultural Production in Alberta, 2010-2015………………………………………………………………………………………………..……………………………………………………..…………………….…………………….………..……………………………..…………………….………….
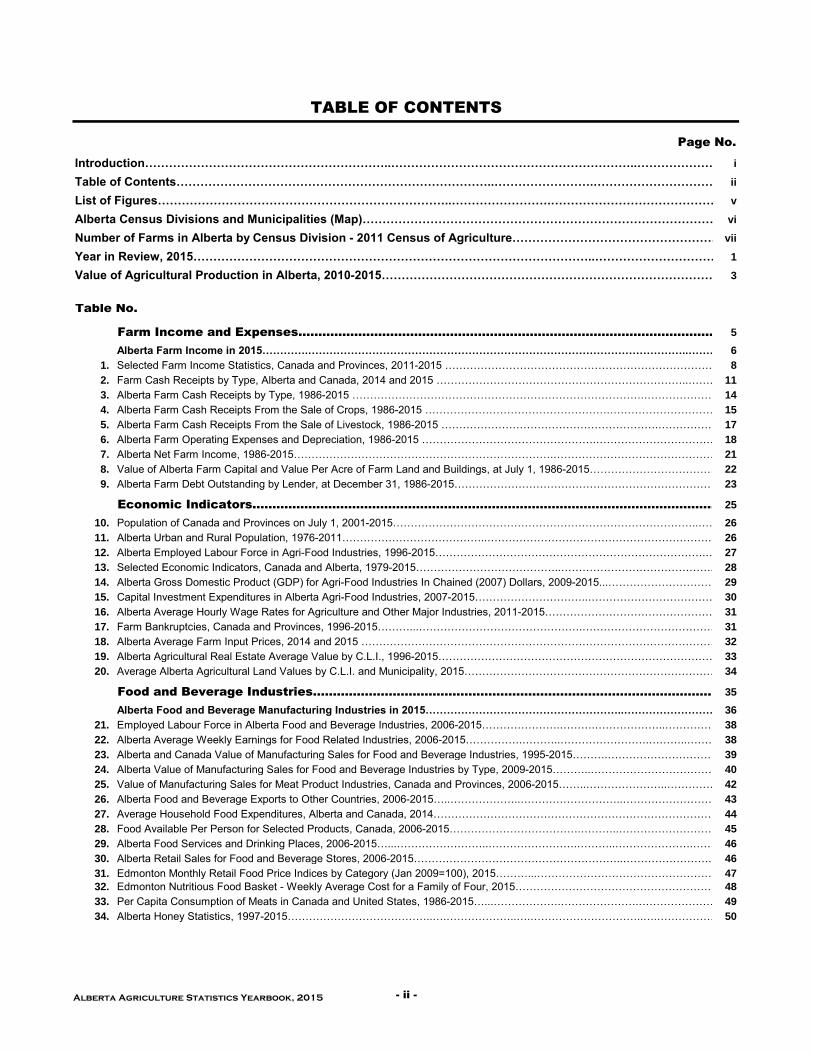
TABLE OF CONTENTS
Introduction……………………………………………………..……………………………………………………..…………………….……………………………………………………………………..……………………………………………………..…………………….…………………….….
Table of Contents……………………………………………………………………..…………………….……………………………………..…………………………………………………………………………..……………………………………………………..…………………….…………………….…………..…………………….…….
List of Figures………………………………………………………………..…………………….…………………………………………..…………………………………………………………………..……………………………………………………..…………………….…………………….…….
Alberta Census Divisions and Municipalities (Map)………………………………………………………………………………..……………………………………………………..…………………….…………………….………………………..………………………………………………………..…….
Number of Farms in Alberta by Census Division - 2011 Census of Agriculture………………………………………………………………………………………..……………………………………………………..…………………….…………………….………………..……………………..…………………….………………….
Alberta Agriculture Statistics Yearbook, 2015 - ii -

Table No. Page No.
Agri-Food Exports................................................................................................................................................…51
Alberta Agri-Food Exports in 2015…………………………………………..………………………………………………………………..…………52
35. Alberta International Agri-Food Exports - Value, 1989-2015..............................................................................................................…53
36. Agri-Food Exports by Type of Product, Alberta and Canada - Value, 2006-2015....................................................................................................…54
37. Alberta Agri-Food Exports by Product - Value, 2011-2015....................................................................................................….....................55
38. Alberta Agri-Food Exports by Product - Quantity, 2011-2015...................................................................................................… 56
39. Alberta Wheat Exports by Country - Value and Quantity, 2011-2015…………………………………………………….........................................................………………..............…………….57
40. Alberta Beef Exports by Country - Value, 2011-2015…….............................................................………….............................................................……………………. 58
41. Alberta Beef Exports by Country - Quantity, 2011-2015…….............................................................………….............................................................……………………. 59
42. Alberta Agri-Food Exports by Country - Value, 2011-2015……….................................................................................................................………………….60
43. Alberta Agri-Food Exports to The United States - Value, 2011-2015…………….............................................................……………..61
44. Alberta Agri-Food Exports to Japan - Value, 2011-2015…………………….............................................................…………………..62
45. Alberta Agri-Food Exports to Mexico - Value, 2011-2015…………………….............................................................…………………..63
46. Alberta Agri-Food Exports to China - Value, 2011-2015…………………….............................................................…………………..64
47. Alberta Agri-Food Exports to Asia - Value, 2011-2015……………..................................................................................................................…………………65
48. Alberta Agri-Food Exports to EU (28) and TPP Countries - Value, 2011-2015……………..................................................................................................................…………………66
Livestock......................................................................................................................................................................…67
Alberta Livestock Industry in 2015…………………………………………………………………………………………………………………………………………………….……………….68
49. Livestock on Farms, Canada and Provinces, July 1, 2004-2015 ……………………………………………………………….....................………..70
50. Cattle and Calves on Alberta Farms, July 1, 1970-2015………………………………………………………………………….…..………………..71
51. Pigs on Alberta Farms, July 1, 1989-2015 …………………………………………………………………………………………………………….. .73
52. Sheep and Lambs on Alberta Farms, July 1, 1972-2015…………………………………………………………………………………………………….74
53. Livestock Slaughtered, Canada and Provinces, 2008-2015 …………………………………………………………………………………………………….75
54. Livestock Slaughtered in Alberta and Western Canada, 2005-2015 ………………………………………………………………………………………………….. 76
55. Summary of Alberta Slaughter Hog Marketings, 2006-2015……………………………………………………………………………………………………..78
56. Alberta Supply and Disposition Livestock Balance Sheet, 2013-2015 ………………………………………………………………………78
57. Alberta Direct to Packer Sales, 2005-2015 …………………………………………………………………………………………………………………………79
58. Alberta Slaughter Cattle Prices, 2005-2015…………………………………………………………………………………………………………………………80
59. Average Feeder Cattle Prices, Northern Alberta, 2003-2015 ………………………………………………………………………..……………….81
60. Average Feeder Cattle Prices, Southern Alberta, 2003-2015 ………………………………………………………………………………………82
61. Average Calf Prices, Northern Alberta, 2003-2015……………………………………………………………………………………………………………………….. ………………83
62. Average Calf Prices, Southern Alberta, 2003-2015………………………………………………………………………………………………………………………84
63. Alberta Average Slaughter Hog Prices (Index 100), 2004-2015…………………………………………………………………………………………………………………………85
64. Central Alberta Average Market Lamb Prices (95-115 Lbs.), 2004-2015…………………………………………………………………………………………………………………………….. .86
65. Alberta Sheep and Lamb Marketings, 2004-2015………………………………………………………………………………..………………86
66. Alberta Brand Inspection Record of Live Cattle and Calf Shipments Out-of-Province, 2014 and 2015……………………………………………………………………………….. ………87
67. Registrations and Sales of Registered Horses in Alberta, 2006-2015………………………………………………………………………………88
68. Alberta Horse Meat Exports by Destination, 2006-2015………………………………………………………………...………………………88
69. Alberta Game Farming Industry, 2006-2015…………………………………………………………………………………………………………………………………………………89
70. Alberta Dairy Industry, 2010-2015…………………………………………………………………………………………………………………………………………………89
71. Output and Value of Poultry Meats, Alberta, 2004-2015…………………………………………………..……………………………………90
72. Production, Disposition and Value of Eggs, Alberta, 2004-2015………………………………………………………………………………………………………………91
73. Chickens Slaughtered in Registered Stations, Alberta, 2003-2015…………………………………………………………………………………………………91
TABLE OF CONTENTS - Cont'd
- iii - Alberta Agriculture Statistics Yearbook, 2015

Table No. Page No.
Crops………….……………………………………………………………………………………………..……………………………………………………..…………………….…………………….…………………………………93
Alberta Crops in 2015………….……………………………………………………………………………………………..……………………………………………………..…………………….…………………….…………………………………94
Precipitation Accumulation Relative to 1961-2013 Normal, April 01, 2015 to November 03, 2015 (Map)………………………………………………..…………………………………………………………………………………………………………96
74. Major Crop Production, Canada and Provinces, 2006-2015…………………………………………………………………………………………………….97
75. Acreage and Production of Principal Field Crops, Prairie Provinces and Canada, 2015…………..........................................…………………….98
76. Alberta Principal Field Crops - Area, Yield and Production, 2011-2015………………………………………………………………………………………………………………………………………………………….. .100
77. Alberta Major Crops - Acreage, 1964-2015………………………………………………………………………………………………………….. .………………………………………………………………………………………………………………….. .102
78. Alberta Major Crops - Yield, 1964-2015………………………………………………………………………………………………………………………………………………………………………………………….. .………………………………….. .103
79. Alberta Major Crops - Production, 1964-2015……………………………………………………………………………………………………………………………………………………………………………………………….. .…………………………….. .104
80. Alberta Major Crops - Unit Value, 1964-2015……………………………………………………………………………………………………………………………………………………………………………………………………….. .…………………….. .105
81. Alberta Wheat Crop by Type - Area, Yield and Production, 2006-2015………………………………………………………………………………………………………………………………………………………………………………………………….. .………………………….. .106
82. Alberta Summerfallow Area by Census Division, 2008-2015……………………………………………………………………………………………………………………………………………………………………………………………………………….. .…………….. .106
83. All Wheat Acreage and Production for Alberta Census Divisions, 2006-2015………………………………………………………………………………………………………………………………………………………………………………………………………….. .………………….. .107
84. Spring Wheat Acreage and Production for Alberta Census Divisions, 2006-2015………………………………………………………………………………………………………………………………………………………………………………………………………….. .………………….. .108
85. Durum Wheat Acreage and Production for Alberta Census Divisions, 2006-2015……………………………………………………………………………………………………………………………………………………………………………………………………….. .…………………….. .109
86. Barley Acreage and Production for Alberta Census Divisions, 2006-2015………………………………………………………………………………………………………………………………………………………………………………………………….. .………………………….. .110
87. Oats Acreage and Production for Alberta Census Divisions, 2006-2015……………………………………………………………………………………………………………………………………………………………………………………………………….. .…………………….. .111
88. Canola Acreage and Production for Alberta Census Divisions, 2006-2015…………………………………………………………………………………………………………………………………………………………………………………………………………….. .……………….. .112
89. Tame Hay Acreage and Production for Alberta Census Divisions, 2006-2015…………………………………………………………………………………………………………………………………………………………………………………………………………...…………………...113
90. Alberta Special Crops - Area, Yield, Production and Price, 2006-2015…………………………………………………………………………………………………………………………………………………………………………………………………….. .…………………….. .114
91. Canadian Wheat Board Payments, 2009-10 to 2015-16…………………………………………………………………………………………………………………………………………………………………………………………………………….. .……………….. .116
92. Canadian Wheat Board Payments (Initial and Final), 2013-14 and 2014-15…………………………………………………………………………………………………………………………….. .………………….. .117
93. Non-Board Feed Grain Prices, 2004-05 to 2014-15………………………………………………………………………………………………………………………………………………………………………………………….. .…………………….. .118
94. Greenhouse Industry, Alberta and Canada, 2007-2015……………………………………………………………………………………………………………………………………………………………………………………….. .…………………….. .118
95. Sugar Beet Industry, Alberta, 2008-2015……………………………………………………………………………………………………………………………………………………………………………………….. .……………………….. .119
96. Major Commercial Vegetable Production, Alberta, 2008-2015………………………………………………………………………………………………………………………………………………………………………………………….. .…………………….. .119
97. Alberta Forage Seed Crops Inspected for Pedigree Status, 2006-2015……………………………………………………………………………………………………………………………………………………………………………………………….. .……………….. .120
98. Alberta Pedigreed Acres, 2006-2015……………………………………………………………………………………………………………………………………………………………………………………………….. .…………….. .120
99. Municipal Co-Operative Seed Cleaning in Alberta, 2005-06 to 2014-15………………………………………………………………………………………………………………………………………………………………………………………………….. .…………….. .120
100. Stocks of Grain on Alberta Farms on July 31, 1978-2015………………………………………………………………………………………………………………………………………………………………………………………………….. .…………….. .121
101. Farm Supply and Disposition of Alberta Principal Field Crops, 2006-07 to 2014-15………………………………………………………………………………………………………………………………………………………………………….. .…………………………………….. ………….…122
102. Irrigation in Alberta by District, 2008-2015…………………………………………………………………………………………………………………………………………………………………………………………………….. .………….. .123
103. Crop Area Assessment in Alberta Irrigation Districts, 2008-2015…………………………………………………………………………………………………………………………………………………………………………………………….. .………………….. .123
104. Precipitation at Selected Alberta Weather Stations, 2011-2015……………………………………………………………………………………………………………………………………………………………………………………….. .…………………….. .124
105. Alberta Crop Insurance, 2009-2015 (as of March 31, 2016)…………………………………………………………………………………………………………………………………………………………………………………….. .……………….. .124
Selected Alberta Weather Stations (Map)……………………………………………………………………………..........................................………………125
Census of Agriculture………….……………………………………………………………………………………………..……………………………………………………..…………………….…………………….…………………………………127
Census of Agriculture for Alberta, 2011………….……………………………………………………………………………………………..……………………………………………………..…………………….…………………….…………………………………128
106. Census of Agriculture, Farms and Land, Canada and Provinces, 1996-2011…………………………………………………………………………………………………………………………………………………………………………………………………………….. .135
107. Census of Agriculture, Profile for Alberta, 1991-2011………………………………………………………………………………………………………………………………………………………………………………….. .………………………………………….. . 136
108. Census of Agriculture, Alberta Farm Operators, 1996-2011………………………………………………………………………………………………………………………………………………………….. .140
TABLE OF CONTENTS - Cont'd
Alberta Agriculture Statistics Yearbook 2015 - iv -

Figure No. Page No. Figure No. Page No.
1. Distribution of 2015 Canadian Farm Cash Receipts …………………………………………….………..10 23. Alberta Exports of Beef to Top Five Countries,
2. Alberta Farm Income Indicators, 2011-2015…………………………………..12 Quantity, 2011-2015……………………………………………..……………………………………………………………….59
3. Alberta Farm Cash Receipts, Crop Market Receipts 24. Alberta Agri-Food Exports to All Countries and
and Livestock Market Receipts, 2011-2015………………………………………….………..………………………………………….……………………..13 to Asia, 2011-2015…………………………………………..…………………………………………………65
4. Distribution of Canadian Farm Cash Receipts, 2015 ………………………………………….……………………………..13 25. Number of Cattle and Calves on Alberta Farms, July 1,
5. Per Cent Change in Farm Market Receipts (Crops and 2006-2015…………………………………………………………..……………………………………………………72
Livestock), Canada and Selected Provinces, 2015/2014……………………………13 26. Slaughter Activity in Alberta and Western Canada,
6. Employment in Alberta Agriculture Industries, Annual Per Cent Change, 2010-2015……………………………………………..……………………………………………………………..75
2006-2015………………………………………………………………….27 27. Number of Cattle Slaughtered (Excluding Calves),
7. Canada - U.S. Exchange Rate, 1991-2015…………………………………………………..28 Western Canada as a Per Cent of Canada, 2008-2015………………………………77
8. Alberta GDP for Agriculture Industries and Food 28. Cattle and Calves and Hogs Slaughtered in Alberta,
Manufacturing Industries in Chained (2007) Dollars - Western Canada and Canada, 2008-2015……………………………..…………………………………………………………..……………………………………………77
Annual Per Cent Change, 2011-2015……………………………………………….………..…………………………………29 29. Alberta Slaughter Cattle Prices, 2005-2015 ……………………………………………..…………………………………………………………..80
9. Alberta Capital Investment Expenditures for Crop and 30. Alberta Average Slaughter Hog Prices (Index 100),
Animal Production, Per Cent Share of Total Agriculture 2004-2015……………………………………………………….. 85
Industries, 2008-2015…………………………………….………..…………………………………30 31. Alberta Sheep and Lamb Marketings,
10. Alberta Average Agricultural Real Estate Values, and Average Market Lamb Price, 2004-2015………………………………………………………86
1996-2015…………………………………….………..…………………………….………33 32. Harvested Acreage of Alberta Wheat, Barley and
11. 2015 Distribution of Alberta Food Manufacturing Sales…………………………41 Canola, 2011-2015…………………………………………………………………..……………………………………………………………..…………..99
12. Alberta Food Manufacturing Sales by Type, 2006-2015………………………..41 33. Price of Alberta Wheat, Barley and Canola, 1985-2015…………………………………..…………………………………..……… 99
13. Alberta Retail Sales for Food and Beverage Stores, 34. Production of Alberta Wheat, Barley and Canola,
Annual Per Cent Change, 2007-2015……………………………………46 2006-2015………………………………………………………………..……..101
14. Edmonton Monthly Retail Food Price Indices, 35. Stocks of Wheat and Barley on Alberta Farms on
Selected Categories (Jan 2009=100), 2015…………………………47 July 31, 2005-2015……………………………………………..……………………………………………………………………….121
15. Edmonton Nutritious Food Basket - Weekly Average 36. Number and Average Size of Alberta Farms, 1961-2011……………………………….130
Cost for a Family of Four in 2015 …………………………………..48 37. Alberta Farms Classified by Total Farm Area,
16. Beef and Poultry Consumption in Canada and 1986-2011……………………………………………..……………………………………………………………………….130
United States, 1986-2015 …………………………………..……………………………………………………………………..49 38. Total Area of Alberta Farms and Land Use
17. Honey Production in Alberta, 2006-2015 …………………………………………………………..………….. 50 Distribution, 1986-2011…………………………………………..……………………………………………………………………….131
18. Growth in Alberta Agri-Food Exports Since Establishment 39. Tillage Practices on Alberta Farms, 1991-2011……………………………………………………………………..131
of Free Trade Agreements …………………………………………………..……………………………………………………..53 40. Alberta Farms Classified by Operating Arrangement,
19. Value of Alberta Agri-Food Exports to All Countries, 1991-2011……………………………………………………………………….132
1989-2015 …………………..…………..………………………..53 41. Alberta Farms Classified by Type, 2011……………………………………………..……………………………………………………………………….133
20. Value of Alberta Agri-Food Exports by Type of Product, 42. Alberta Farms Classified by Gross Farm Receipts,
2006-2015…………………...……………………………..…………………………………………………..54 1986-2011……………………………………………………………………….133
21. Quantity of Selected Commodities/Products Exported 43. Average Age and Number of Alberta Farm Operators
from Alberta, 2011-2015……………………………..………………………………………………………………56 by Age, 1981-2011……………………………………………..……………………………………………………………………….134
22. Alberta Exports of Beef to All Countries and the 44. Alberta Farms Using Internet For Farm Business,
United States, Value, 2011-2015………………………………………………..……………………………………………………..58 2001-2011……………………………………………..………………………………………………………………………134
List of Figures
- v - Alberta Agriculture Statistics Yearbook, 2015

Hanna(S.A. 2)
Oyen
(S.A. 3)
Consort(S.A. 4)
Grande Prairie(Co. 1)
Vulcan(Co. 2)
Ponoka (Co. 3)
Newell(Co. 4)
Warner
(Co. 5)
Stettler(Co. 6)
Thorhild(Co. 7)
Forty Mile(Co. 8)
Beaver (Co.9)
Wetaskiwin (Co. 10)
Barrhead(Co. 11)
Athabasca(Co. 12)
Smoky Lake(Co. 13)
Lacombe (Co. 14)
Wheatland
(Co. 16)
Mountain View
(Co. 17)
Paintearth(Co. 18)
St. Paul (Co.19)
Strathcona(Co. 20)
Two Hills (Co. 21)
Camrose(Co. 22)
Red Deer (Co. 23)
Vermilion
River(Co. 24)
Leduc (Co. 25)
Lethbridge(Co. 26)
Minburn (Co. 27)
Lac Ste. Anne(Co. 28)
Flagstaff(Co. 29)
Lamont(Co. 30)
Parkland (Co. 31)
Lac La Biche County
CypressCounty
CardstonCounty
Bighorn(MD 8)
Pincher Creek
(MD 9)
Taber(MD 14)
WoodlandsCounty
Greenview (MD 16)
Opportunity (MD 17)
Birch Hills
(MD 19)
Saddle HillsCounty
Clear Hills (MD 21)
Northern Lights (MD 22)
Mackenzie County
WillowCreek
(MD 26)
Foothills
(MD 31)
Acadia(MD 34)
Rocky View
(MD 44)
Starland
CountyKneehillCounty
Provost(MD 52)
Wainwright
(MD 61)
Ranchland(MD 66)
Brazeau(MD 77)
Bonnyville(MD 87)
Sturgeon
County
Westlock
County
Yellowhead County
Clearwater (MD 99)
Lesser Slave River
(MD 124)
SmokyRiver
(MD 130)
Northern SunriseCounty
MD133
MD135Fairview
(MD 136)
M.D.of
Big Lakes
Wood Buffalo (Regional)
Kananaskis
(ID 5)
Jasper ID
ID 4
Banff Park(ID 9)
Jasper Park
(ID 12)
Wood Buffalo Park(ID 24)
WilmoreWilderness
(ID 25)
CD 1
CD 2CD 3
CD 4
CD 5
CD 6
CD 7
CD 8
CD 9
CD 10CD 11
CD 12
CD 13
CD 14
CD 15
CD 16CD 17
CD 18
CD 19
Alberta Census Divisions and
Municipalities
CP
Compiled by Alberta Agriculture and Forestry, Economics and Competitiveness Branch,Statistics and Data Development Section
Alberta Agriculture Statistics Yearbook, 2015 - vi -

No. of No. of No. of
Farms Farms Farms
Census Division 1 Census Division 9 Census Division 16
(Medicine Hat)................................................................1,351 (Rocky Mountain House)..................................................1,096 (Fort McMurray)...........................................................0
Cypress M.D. 1.................................................................................827 Clearwater County.............................................................................................1,096
Forty Mile County 8...................................................................524 Census Division 17
Census Division 10 (Fort Vermilion)..................................................................2,231
Census Division 2 (Camrose/Vermilion)......................................................................4,616 Big Lakes...............................................................375
(Lethbridge).....................................................................2,790 Beaver County.............................................................................................677 Clear Hills ..................................................................443
Lethbridge County .........................................................................933 Camrose County ..............................................................................................999 Lesser Slave River 124 (4)............................................................160
Newell County 4...................................................................................717 Lamont County.....................................................................................753 Mackenzie County..................................................................626
Taber ..............................................................................652 Minburn County 27..................................................................................604 Northern Lights County.......................................................................446
Warner County 5....................................................................................488 Two Hills County 21...............................................................................................554 Northern Sunrise County ......................................................................181
Vermilion River County ......................................................................................1,029
Census Division 3 I.D. 13............................................................................ n/a Census Division 18
(Pincher Creek)........................................................1,717 (Valleyview).................................................................639
Cardston County..............................................................497 Census Division 11 Greenview No. 16...........................................................639
Pincher Creek No. 9..........................................................................448 (Edmonton).........................................................…5,034
Willow Creek M.D. 26........................................................................772 Brazeau County..........................................................................487 Census Division 19
I.D. 4............................................................................ n/a Edmonton....................................................................................73 (Grande Prairie/Fairview) 2,734
Leduc County ......................................................................1,255 Birch Hills County.....................................................295
Census Division 4 Parkland County........................................................................782 Fairview No. 136................................................................225
(Oyen/Hanna).......................................................1,216 Strathcona County.....................................................................658 Grande Prairie County 1............................................................1,206
Special Area 2 ............................................................................473 Sturgeon County...........................................................................823 Peace No. 135............................................................166
Special Area 3 (including Acadia) ............................................................................464 Wetaskiwin County 10 ..................................................................................956 Saddle Hills County............................................................463
Special Area 4 ........................................................279 Smoky River No. 130....................................................310
Census Division 12 Spirit River No.133......................................................69
(Bonnyville/St. Paul)..................................................2,220
Census Division 5 Bonnyville No. 87 ......................................................................739
(Drumheller/Vulcan).................................................2,371 Lac la Biche County (2)...............................… 239 Total Farms in Alberta......................................................43,234
Kneehill County............................................................................686 Smoky Lake County .................................................................454
Starland County (1)........................................................................300 St. Paul County 19....................................................................................788
Vulcan County .................................................................................................603
Wheatland County ......................................................................782 Census Division 13
(Barrhead/Athabasca)...................................................3,833
Census Division 6 Athabasca County ........................................................................697
(Calgary)......................................................................................4,186 Barrhead County 11...........................................................................667
Calgary..............................................................................................55 Lac Ste. Anne County.............................................................936
Foothills No. 31................................................................................1,224 Thorhild County 7.......................................................................462
Mountain View County ..............................................................1,636 Westlock County................................................................777
Rocky View County........................................................................1,271 Woodlands County...................................................................294
Census Division 7 Census Division 14
(Wainwright/Stettler)...............................................2,701 (Edson)....................................................................695
Flagstaff County ......................................................................650 Yellowhead County............................................................695
Paintearth County 18.......................................................................420 I.D. 25........................................................................... n/a
Provost No. 52...............................................................................425
Stettler County 6.............................................................................705 Census Division 15
Wainwright No. 61............................................................................501 (Mountain Parks Region)................................................122
Bighorn M.D. 8.....................................................................44
Census Division No. 8 Ranchland M.D. 66 (3)....................................................................78
(Red Deer)...............................................................................3,682
Lacombe County.........................................................................1,045
Ponoka County ............................................................................1,106
Red Deer County ..............................................................................................1,531
M.D. - Municipal District I.D. - Improvement District n/a - not available
Source: Statistics Canada, 2011 Census of Agriculture
Number of Farms in Alberta by Census Division - 2011 Census of Agriculture
Due to confidentiality constraints, agricultural data for subdivisions with very few farms were combined with data from adjacent areas. In most cases, the name of the amalgamation is identical to the largest component of the amalgamation:
(1) Starland County refers to: Drumheller and Starland County.
(2) Lac La Biche County refers to: Lac La Biche County and Census Division 16 (Improvement District No. 24, Wood Buffalo and RM of Wood Buffalo).
(3) Ranchland M.D. 66 refers to: Kananaskis Improvement District, Improvement District No. 9 (Banff), and Crowsnest Pass (CP).
(4) Lesser Slave River M.D. No. 124 refers to: Opportunity No. 17 and Lesser Slave River No. 124.
NOTE: Due to minimal or no agricultural activity, data are not available for Improvement Districts 4 (Waterton Park), 13 (Elk Island), 25 (Willmore Wilderness Park) and 12 (Jasper). Incompletely enumerated Indian Reserves and Settlements are excluded.
Amalgamations:
- vii - Alberta Agriculture Statistics Yearbook, 2015


Alberta Agriculture Statistics Yearbook, 2015 - 1 -
Year in Review, 2015
In 2015, Alberta’s agriculture and food sector performed exceptionally well, as evidenced by several records attained for key statistical indicators relating to farm income, international exports, and food and beverage manufacturing sales. For the first time, provincial farm cash receipts (FCR) surpassed $13 billion, a new high, and ranked second among Canadian provinces, fuelled largely by record livestock market receipts. Net cash income and realized net income also set new records. Relatively strong meat prices and the low Canadian dollar pushed total agri-food exports to a record as well, reaching $10 billion for the first time. The province continued to be the third largest exporter of agri-food products in Canada. Total food and beverage manufacturing sales also set a new industry record and ranked as Alberta’s largest manufacturing industry. In the livestock sector, as of July 1, 2015, year-over-year declines occurred for inventories of cattle and calves and sheep and lambs, while the pig inventory grew. Alberta remains the largest beef producing province in Canada. Total production of principal field crops in the province decreased from 2014, due to a cold and dry spring, coupled with a hot summer and limited rainfall. Agri-food employment increased for both primary agriculture and food and beverage industries, while real gross domestic product (GDP) showed a marginal decline from 2014. The following is a brief commentary on various sections of this Yearbook. For more detailed commentaries, users are advised to refer to the individual Yearbook sections.
Farm Income1
Alberta’s total FCR (sum of crop and livestock market receipts plus direct program payments to producers) set another record at $13.6 billion in 2015, and was up 5.1 per cent from 2014 (also a record). Fuelling most of the increase were record livestock market receipts, coupled with higher crop market receipts and program payments to producers. Livestock market receipts accounted for 50.1 per cent of the total, with crop market receipts and direct program payments accounting for 45.1 per cent and 4.8 per cent, respectively. The province also ranked second in total FCR, behind Saskatchewan ($14.4 billion), accounted for over one-fifth (22.8 per cent) of total Canadian FCR ($59.4 billion), and led all provinces in cattle market receipts.
Alberta’s livestock market receipts set a second consecutive record at $6.8 billion, an increase of 6.0 per cent from 2014 and significantly above the 2010-2014 average of $4.9 billion (up 37.4 per cent). These receipts were largely driven by record prices for cattle. Receipts at an all-time high included cattle and calves, dairy, poultry (hens, chickens and turkeys), lambs, and honey. Crop market receipts were the third highest on record at $6.1 billion (up 2.8 per cent from 2014), and up 10.1 per cent above the 2010-2014 average ($5.6 billion). The gain in receipts was mainly driven by higher prices. Setting new records in receipts were dry peas, lentils, flaxseed and corn, while other notable increases included wheat, canola, potatoes, and oats.
Direct program payments to producers jumped 18.9 per cent to $652.9 million. The increase was largely due to higher payments under Crop and Hail Insurance and AgriStability, given the dry growing conditions in 2015. The 2015 program payments were 7.1 per cent lower than the 2010-2014 average of $703.1 million.
Total farm operating expenses increased to a new high of $10.3 billion, up 2.3 per cent from 2014. Noteworthy expense increases included livestock and poultry purchases and commercial feed, while declines occurred for machinery fuel and repairs, and fertilizer and lime. With FCR more than offsetting expenses in 2015, Alberta’s net cash income was a record $3.2 billion. Realized net income also reached a new high at $1.5 billion, while total net income grew to $831.4 million.
Economic Indicators
Alberta’s real GDP, in chained (2007) dollars, for agri-food industries in 2015 totalled $5.4 billion, a marginal decline of 0.2 per cent from 2014. Of the total, primary agriculture industries accounted for $3.0 billion (down 4.3 per cent), while food manufacturing industries accounted for $2.4 billion (up 5.4 per cent). Total employment in agri-food industries were 89,200 persons (up 3.6 per cent from 2014), with 62,800 employed in primary agriculture (up 3.6 per cent) and 26,400 in food and beverage manufacturing industries (up 3.5 per cent). These industries accounted for 3.9 per cent of the provincial employed labour force (2,301,100 persons, up 1.2 per cent from 2014). The annual all-items Consumer Price Index for Alberta, a measure of overall inflation, increased to 133.7 (up 1.1 per cent from 2014), marking the sixth consecutive year-over-year increase. The Canadian dollar (annual average) fell significantly against the United States dollar to $0.7820 (down 13.6 per cent from 2014), and is the lowest annual average value since 2004 ($0.7685).
Food and Beverage Manufacturing Sales
In 2015, Alberta’s food and beverage manufacturing sales jumped 18.7 per cent from a year earlier to a record $14.6 billion, marking the second consecutive year of growth. It was also the largest manufacturing sector in the province, accounting for 21.5 per cent of total manufacturing sales ($68.0 billion). Of the $14.6 billion total, food industries set a record at $13.6 billion (up 23.4 per cent), while beverage industries fell 22.1 per cent to $1.0 billion. Collectively, four segments (meat product manufacturing, grain and oilseed milling, dairy product manufacturing and animal food manufacturing) accounted for 87.0 per cent (or $11.9 billion) of Alberta’s food manufacturing sales. The dominant segment is meat product manufacturing
(1) For detailed definitions of terms, see page 5.

Alberta Agriculture Statistics Yearbook, 2015 - 2 -
(including poultry) which accounted for 56.2 per cent or $7.7 billion of total food manufacturing sales. Within this segment, sales of red meats were $6.7 billion, with the remaining amount sold under poultry processing and rendering. Among provinces, Alberta continued to rank third (14.2 per cent) in the contribution to total Canadian food manufacturing sales of $95.7 billion, following Ontario (40.3 per cent) and Quebec (22.7 per cent).
Agri-Food Exports
Exporting to over 140 countries, Alberta’s 2015 international exports of primary and processed agricultural and food products (agri-food) set a new record, surpassing $10 billion for the first time. With exports totalling $10.2 billion, this was up 4.5 per cent from the previous record set in 2014. Among the factors contributing to the growth were the low Canadian dollar and relatively strong livestock and meat prices. Of Alberta’s total agri-food exports, almost three-quarters were shipped to five markets (73.6 per cent or $7.5 billion). The leading export markets were the United States ($4.0 billion), followed by China ($1.6 billion), Japan ($1.1 billion), Mexico ($572.5 million), and South Korea ($232.5 million). Among provinces, Alberta was the third largest exporter of agri-food products (behind Saskatchewan and Ontario), and accounted for nearly one-fifth (18.1 per cent) of the Canadian total ($56.1 billion).
Of the $10.2 billion in international exports, primary commodities accounted for 52.8 per cent, while value added products were 47.2 per cent. Exports of primary commodities were down 1.8 per cent from 2014 to $5.4 billion, while value added exports increased 12.5 per cent to $4.8 billion. The top five Alberta agri-food exports in 2015 were wheat ($2.4 billion), beef ($1.7 billion), canola seed ($1.7 billion), non-purebred live cattle ($585.1 million), and pork ($468.9 million).
Livestock
Alberta continues to be the largest beef producing province in Canada, as well as a producer of pigs and sheep and lambs. As of July 1, 2015, total cattle and calves on Alberta’s farms totalled 5.3 million head, down 2.6 per cent from a year earlier. Numbers fell for all animal classes with the exception of steers and milk cows. One of the major factors influencing the inventory decline were record annual cattle prices which served as an incentive for producers to market more animals. The province led the nation in cattle and calf inventories, and accounted for 40.8 per cent of the national herd. As of July 1, 2015, the total pig herd was 1.5 million head, up 1.4 per cent from a year previous. Among the factors impacting hog inventories were relatively strong slaughter hog prices and consumer demand for pork. The provincial sheep and lamb flock as of July 1, 2015 fell 2.5 per cent, to 195,000 head. Record slaughter lamb prices in late 2014 and the first half of 2015 encouraged lamb marketings. Among provinces, Alberta ranked first in cattle and calf inventories, third in sheep and lamb inventories, and fourth in pig inventories.
In 2015, tight North American cattle supplies coupled with strong consumer demand for beef led to the sixth consecutive annual price increase. The annual average slaughter steer price increased 18.9 per cent to a record $182.71 per cwt., while slaughter heifer prices were up 18.6 per cent to a record $180.75 per cwt. For hogs, the annual Alberta average index 100 price fell 23.5 per cent to $1.56 per kg, largely due to increased North American supply. Nearly three-quarters of Canadian beef processing occurs in Western Canada, with the vast majority concentrated in Alberta. In 2015, Western Canadian cattle slaughter (excluding calves) in federally and provincially inspected plants was 2.0 million head, down 5.1 per cent from 2014. Over one-tenth of Canadian pork processing occurs in Alberta. In 2015, hog slaughter in Alberta’s federally and provincially inspected plants increased 6.5 per cent to 2.7 million head. Total honey production in the province was estimated at 19,394 tonnes, up 20.4 per cent from 2014 and second highest on record. The growth in production was attributed to a record number of colonies (295,000, up 4.3 per cent from 2014), coupled with a re-seeding of some crops following the dry conditions that led to two sets of flowerings. Alberta continued to lead the nation in honey production, accounting for 44.9 per cent of the national total of 43,226 tonnes.
Crops
Total production of principal field crops (including forages) in Alberta totalled 26.9 million tonnes in 2015, down 12.3 per cent from 2014. Of the total, field crops accounted for 20.8 million tonnes (down 7.4 per cent), while forages were at 6.1 million tonnes (down 25.8 per cent). Compared to the 10-year average (2005 to 2014), field crops were 2.7 per cent above the average of 20.2 million tonnes, while forages were 30.4 per cent below the average of 8.8 million tonnes. Producers were challenged with a cold and dry spring, followed by a hot summer with limited rainfall. Provincial yields were generally lower than in 2014 (an above average year), with crop quality about average. Total seeded and harvested area for principal field crops declined 1.0 per cent and 4.1 per cent, respectively. Total production of all wheat (winter, spring, and durum) was 8.3 million tonnes, down 11.3 per cent from 2014 (1.5 per cent below the 10-year average), while canola was third highest on record at 5.4 million tonnes, despite a decline of 6.1 per cent (19.4 per cent above the 10-year average). Dry pea production fell 10.9 per cent to 1.3 million tonnes (47.9 per cent above the 10-year average), but still third highest on record. Barley production was at 4.3 million tonnes, up 3.8 per cent from 2014 (9.5 per cent below the 10-year average).
Overall, the average annual prices for most major grains and oilseeds increased in 2015. Prices for some notable crops included all wheat ($6.18 per bushel, up 1.0 per cent), canola ($10.37 per bushel, up 6.4 per cent), and barley ($4.54 per bushel, up 15.8 per cent). Total marketings of wheat decreased 1.4 per cent to 8.9 million tonnes, while canola fell 1.2 per cent to 5.7 million tonnes. Despite the declines, marketings for these crops remained above their five-year averages at 7.6 million tonnes and 5.0 million tonnes, respectively.

% Chg.
2010r 2011r 2012r 2013r 2014r 2015p '15/'14
Crops
All Wheat.............................................................................8,201.3 8,839.6 8,368.8 11,301.8 9,348.9 8,290.0 -11.3
Oats for Grain...............................................................................647.7 738.7 518.2 601.5 542.9 393.3 -27.6
Barley for Grain........................................................ 4,528.7 4,668.0 4,463.3 5,545.4 4,131.3 4,289.2 3.8
Fall Rye ................................................................................................50.8 54.0 34.3 36.3 30.9 33.0 6.8
Mixed Grains........................................................................................24.5 79.6 10.5 13.3 12.9 12.2 -5.4
Flaxseed.................................................................................30.5 54.7 41.9 73.7 87.6 83.8 -4.3
Canola.....................................................................................4,740.0 5,347.9 5,097.2 6,168.9 5,796.9 5,443.1 -6.1
Mustard Seed ....................................................................47.7 26.8 35.9 37.2 59.4 31.9 -46.3
Sugar Beets (2)......................................................................573.6 784.5 827.4 668.1 638.1 584.6 -8.4
Tame Hay............................................................................8,223.6 7,937.9 7,711.1 7,588.6 7,257.5 4,971.4 -31.5
Dry Peas ........................................................................…...982.5 805.6 1,208.4 1,321.3 1,475.1 1,314.5 -10.9
Other Crops...................................................................... … … … … … … …
All Wheat.............................................................................190.00 220.00 255.00 285.00 225.00 227.03 0.9
Oats for Grain...............................................................................153.00 194.00 182.00 210.00 166.00 176.84 6.5
Barley for Grain........................................................ 150.00 192.00 240.00 250.00 180.00 208.42 15.8
Fall Rye ................................................................................................151.02 214.97 231.29 245.11 246.05 251.14 2.1
Mixed Grains........................................................................................151.50 193.00 211.00 240.00 173.00 192.63 11.3
Flaxseed.................................................................................430.37 553.04 548.99 564.80 494.53 500.03 1.1
Canola.....................................................................................421.00 530.00 570.00 565.00 430.00 457.37 6.4
Mustard Seed ...............................................................…….630.51 598.82 665.09 - - - -
Sugar Beets (2)......................................................................53.12 53.52 55.10 50.74 52.69 50.74 -3.7
Tame Hay............................................................................112.74 74.90 68.51 77.91 87.53 119.85 36.9
Dry Peas .......................................................................……..188.00 265.00 290.00 310.00 240.00 301.81 25.8
Other Crops...................................................................... … … … … … … …
All Wheat.............................................................................1,558,247 1,944,712 2,134,044 3,221,013 2,103,503 1,882,079 -10.5
Oats for Grain...............................................................................99,098 143,308 94,312 126,315 90,121 69,551 -22.8
Barley for Grain.................................................................................679,305 896,256 1,071,192 1,386,350 743,634 893,955 20.2
Fall Rye ................................................................................................7,672 11,608 7,933 8,897 7,603 8,288 9.0
Mixed Grains.................................................................................................................3,712 15,363 2,216 3,192 2,232 2,350 5.3
Flaxseed.................................................................................13,126 30,251 23,003 41,626 43,321 41,903 -3.3
Canola...................................................................................1,995,540 2,834,387 2,905,404 3,485,429 2,492,667 2,489,511 -0.1
Mustard Seed .........................…....................................……30,075 16,048 23,877 - - - -
Sugar Beets (2)....................................................................30,470 41,986 45,590 33,899 33,621 29,663 -11.8
Tame Hay..........................................................................927,129 594,549 528,287 591,228 635,249 595,822 -6.2
Dry Peas .....................................................................…..184,710 213,484 350,436 409,603 354,024 396,729 12.1
Other Crops (4).............................................................……...419,512 439,390 524,671 537,696 568,593 646,667 13.7
Total Crops..........................................................................……………5,948,596 7,181,343 7,710,965 9,845,248 7,074,568 7,056,517 -0.3
(2) Source: Alberta Sugar Beet Growers
(3) Source: Alberta Agriculture and Forestry, Statistics and Data Development Section
(4) Source: Statistics Canada estimates of farm cash receipts. "Other Crops" include forage seeds, field and greenhouse vegetables, fruits,
floriculture and nursery, forest products, and specialty crops not specified in this table.
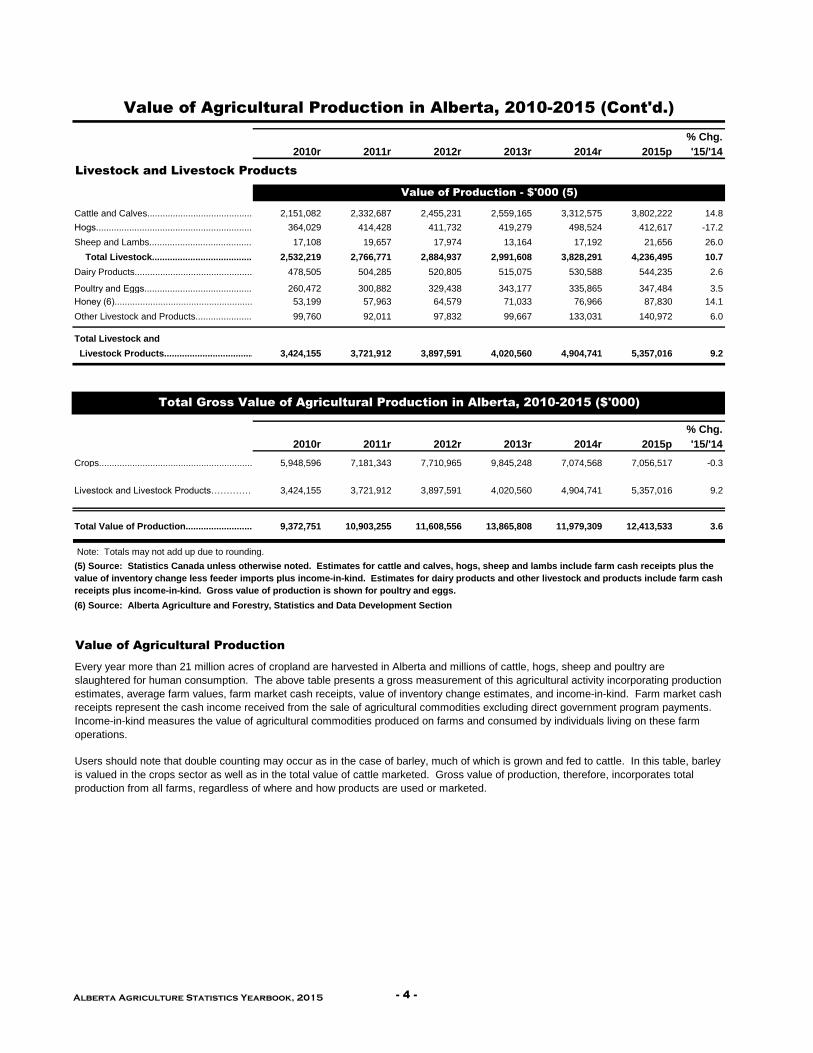
Value of Agricultural Production in Alberta, 2010-2015
Production - '000 tonnes (1)
Average Farm Value - $/tonne (1)
Value of Production - $'000 (3)
(1) Source: Statistics Canada; and Alberta Agriculture and Forestry, Statistics and Data Development Section
- 3 - Alberta Agriculture Statistics Yearbook, 2015
% Chg.
2010r 2011r 2012r 2013r 2014r 2015p '15/'14
Livestock and Livestock Products
Cattle and Calves..........................................................2,151,082 2,332,687 2,455,231 2,559,165 3,312,575 3,802,222 14.8
Hogs.......................................................................……………………………………………….364,029 414,428 411,732 419,279 498,524 412,617 -17.2
Sheep and Lambs...........................................................17,108 19,657 17,974 13,164 17,192 21,656 26.0
Total Livestock............................................................2,532,219 2,766,771 2,884,937 2,991,608 3,828,291 4,236,495 10.7
Dairy Products.......................................................... 478,505 504,285 520,805 515,075 530,588 544,235 2.6
Poultry and Eggs..................................................……………………………………………………260,472 300,882 329,438 343,177 335,865 347,484 3.5
Honey (6)..........................................................……………………………………………………………..53,199 57,963 64,579 71,033 76,966 87,830 14.1
Other Livestock and Products................................ 99,760 92,011 97,832 99,667 133,031 140,972 6.0
Total Livestock and
Livestock Products.......................................................3,424,155 3,721,912 3,897,591 4,020,560 4,904,741 5,357,016 9.2
% Chg.
2010r 2011r 2012r 2013r 2014r 2015p '15/'14
Crops.......................................................................................................5,948,596 7,181,343 7,710,965 9,845,248 7,074,568 7,056,517 -0.3
Livestock and Livestock Products……………………………………….3,424,155 3,721,912 3,897,591 4,020,560 4,904,741 5,357,016 9.2
Total Value of Production............................................9,372,751 10,903,255 11,608,556 13,865,808 11,979,309 12,413,533 3.6
Value of Agricultural Production
Every year more than 21 million acres of cropland are harvested in Alberta and millions of cattle, hogs, sheep and poultry are
slaughtered for human consumption. The above table presents a gross measurement of this agricultural activity incorporating production
estimates, average farm values, farm market cash receipts, value of inventory change estimates, and income-in-kind. Farm market cash
receipts represent the cash income received from the sale of agricultural commodities excluding direct government program payments.
Income-in-kind measures the value of agricultural commodities produced on farms and consumed by individuals living on these farm
operations.
Users should note that double counting may occur as in the case of barley, much of which is grown and fed to cattle. In this table, barley
is valued in the crops sector as well as in the total value of cattle marketed. Gross value of production, therefore, incorporates total
production from all farms, regardless of where and how products are used or marketed.
Value of Agricultural Production in Alberta, 2010-2015 (Cont'd.)
Value of Production - $'000 (5)
Total Gross Value of Agricultural Production in Alberta, 2010-2015 ($'000)
Note: Totals may not add up due to rounding.
(5) Source: Statistics Canada unless otherwise noted. Estimates for cattle and calves, hogs, sheep and lambs include farm cash receipts plus the
value of inventory change less feeder imports plus income-in-kind. Estimates for dairy products and other livestock and products include farm cash
receipts plus income-in-kind. Gross value of production is shown for poultry and eggs.
(6) Source: Alberta Agriculture and Forestry, Statistics and Data Development Section
Alberta Agriculture Statistics Yearbook, 2015 - 4 -

Page No.
Alberta Farm Income in 2015…………………………………………………………………………………..…………………...…..6
Table No.
1. Selected Farm Income Statistics, Canada and Provinces, 2011-2015 ………………………………………………………………….……..8
2. Farm Cash Receipts by Type, Alberta and Canada, 2014 and 2015 ……………………………………………………………..……….11
3. Alberta Farm Cash Receipts by Type, 1986-2015 ………………………………………….…………………………………...….14
4. Alberta Farm Cash Receipts From the Sale of Crops, 1986-2015 …………………………………………….…………………………………………………..………15
5. Alberta Farm Cash Receipts From the Sale of Livestock, 1986-2015 …………………………………………………….………………………………………….….17
6. Alberta Farm Operating Expenses and Depreciation, 1986-2015 ………………………………………….…………………………………………………………..…..18
7. Alberta Net Farm Income, 1986-2015……………………………………………………………….………………………………………………….…..21
8. Value of Alberta Farm Capital and Value Per Acre of Farm Land and Buildings, at July 1, 1986-2015……………………………………………………………22
9. Alberta Farm Debt Outstanding by Lender, at December 31, 1986-2015……………………………………….……….23
Measures of Net Farm Income (1) - Definitions
The agriculture economic statistics program uses three aggregate measures of net farm income:
Net cash income measures farm business cash flow (gross revenue minus operating expenses) generated from the production
of agricultural goods. Net cash income represents the amount of money available for debt repayment, investment or withdrawal
by the owner.
Realized net income (RNI) measures the financial flows, both monetary (cash income) and non-monetary (depreciation and
income-in-kind), of farm businesses. Similar to net cash income, realized net income represents the net farm income from
transactions in a given year, regardless of the year the agricultural goods were produced.
Total net income measures the financial flows and stock changes of farm businesses. Total net income values agriculture
economic production during the year that the agricultural goods were produced. It represents the return to owner's equity, unpaid
labour, management and risk.
(1) Source: Adapted from Agriculture and Agri-Food Canada and Statistics Canada, Understanding Measurements of Farm Income ,
Publication No. 2060/B and Cat. No. 21-525-XIE, November 2000, Section 1 "Agriculture Economic Statistics Program Measures".
(2) Statistics Canada, Census of Population
Components of Net Farm Income Measures
Farm cash receipts include revenues from the sale of agricultural commodities, program payments from government agencies,
and payments from private crop and livestock insurance programs. Receipts are recorded in the calendar year (January-
December) when the money is paid (cash basis) to farmers. Farm to farm sales are excluded. They are assumed to cancel each
other out, and have no net impact.
Farm operating expenses represent business costs incurred by farm businesses for goods and services used in the production
of agricultural commodities. Expenses, which are recorded when the money is disbursed by the farmer, include property taxes,
custom work, livestock purchases, rent, fertilizer and lime, pesticides, machinery and building repairs, fuel for heating and
machines, wages, interest and business share of insurance premiums.
Income-in-kind measures the value of the agricultural goods produced on farms and consumed by farm operator families. It is
included to measure total farm production. There is no monetary disbursement related to income-in-kind. It is calculated using
Statistics Canada estimates of per capita food consumption, coupled with Census (2) measurements of the farm population and
the average prices that producers would have received in the marketplace.
Depreciation charges account for the economic depreciation or for the loss in fair market value of the capital assets of the farm
business. There is no monetary disbursement associated with depreciation. Calculated on farm buildings, farm machinery, and
the farm business share of autos, trucks and the farm home, depreciation is generally considered to be the result of aging, wear
and tear, and obsolescence. It represents a decrease in the potential economic benefits that can be generated by the capital
asset.
Value of inventory change (VIC) measures the dollar value of the physical change in producer-owned inventories. This concept
is used to value total agricultural economic production. To calculate VIC, the change in producer-owned inventories (between the
end and the beginning of a calendar year) is first derived and then multiplied by the average annual crop prices or value per
animal. This calculation is different from the financial or accounting book value approach, which values the beginning and ending
stocks, and then derives the change.
F
A
R
M
I
N
C
O
M
E
A
N
D
E
X
P
E
N
S
E
S
- 5 - Alberta Agriculture Statistics Yearbook, 2015

Alberta Agriculture Statistics Yearbook, 2015 - 6 -
Alberta Farm Income in 2015
Farm Cash Receipts
In 2015, Alberta’s total farm cash receipts (FCR) set another record at $13.6 billion, up 5.1 per cent from 2014 (also a record), and 21.1 per cent above the five-year average (2010-2014) of $11.2 billion. Fuelling most of the increase were record livestock market receipts, coupled with higher crop market receipts and program payments to producers. FCR is the sum of crop and livestock market receipts plus direct program payments to producers. Total farm market receipts (the sum of crop and livestock market receipts, excluding program payments) were the highest on record at $12.9 billion, up 4.5 per cent from 2014, and 23.0 per cent above the five-year average ($10.5 billion). Livestock market receipts reached a second consecutive industry high in 2015 at $6.8 billion, driven largely by record prices for cattle. This was also the sixth consecutive year-over-year increase, and was up 6.0 per cent from 2014 and 37.4 per cent above the 2010-2014 average of $4.9 billion. Record receipts were set for cattle and calves (up 8.7 per cent, to $5.2 billion), dairy (up 2.6 per cent, to $544.1 million), poultry comprised of hens, chickens and turkeys (up 4.7 per cent, to $263.3 million), lambs (up 36.7 per cent, to $26.3 million), and honey (up 14.1 per cent, to $87.8 million). Hog receipts fell 17.3 per cent, to $411.7 million, due to lower prices, while receipts from eggs and hatcheries remained relatively flat (down 0.1 per cent, to $84.2 million).
Crop market receipts increased 2.8 per cent, to $6.1 billion, the third highest on record, and were mainly driven by higher prices. These receipts were also 10.1 per cent above the 2010-2014 average of $5.6 billion. Notable receipt gains included wheat (up 6.3 per cent, to $2.0 billion), canola (up 2.8 per cent, to $2.6 billion), potatoes (up 2.5 per cent, to $166.7 million), and oats (up 10.5 per cent, to $37.9 million). Setting records were dry peas (up 13.4 per cent, to $348.0 million), lentils (up 117.7 per cent, to $106.9 million), flaxseed (up 5.8 per cent, to $31.4 million), and corn (up 21.1 per cent, to $10.6 million). Barley receipts fell 15.3 per cent, to $262.8 million, as a result of lower marketings.
Total program payments to producers jumped 18.9 per cent per cent to $652.9 million. Despite payments being higher compared to 2014, they were 7.1 per cent below the 2010-2014 average of $703.1 million. The 2015 increase was largely due to higher payments under Crop and Hail Insurance (up 23.5 per cent, to $515.3 million), and AgriStability (up 15.5 per cent, to $58.1 million), given dry growing conditions. Notably down were payments under AgriInvest (down 9.9 per cent, to $64.5 million).
Nationally, total FCR in 2015 increased 2.7 per cent to $59.4 billion. Receipts increased in all provinces, with the exception of Quebec, Manitoba and Prince Edward Island. Alberta accounted for over one-fifth (22.8 per cent) of the Canadian total, and ranked second among provinces ($13.6 billion), behind Saskatchewan ($14.4 billion). The province led the nation in livestock market receipts ($6.8 billion), followed by Ontario ($6.2 billion), and in program payments to producers ($652.9 million), followed by Saskatchewan ($585.5 million). Alberta ranked third in crop market receipts at $6.1 billion, behind Saskatchewan ($11.1 billion), and Ontario ($6.2 billion). The province also led the nation in cattle and calf market receipts with nearly one-half (49.7 per cent) of the national total.
Farm Operating Expenses and Net Farm Income In 2015, Alberta total farm operating expenses (after rebates) increased 2.3 per cent to a record $10.3 billion, and were 14.5 per cent above the 2010-2014 average of $9.0 billion. This was the sixth consecutive year-over-year increase in operating expenses. Notable increases included livestock and poultry purchases (up 20.1 per cent, to $1.5 billion) and commercial feed (up 5.8 per cent, to $1.3 billion). Notable declines were machinery fuel and repairs (down 9.7 per cent, to $1.3 billion), as well as fertilizer and lime (down 3.0 per cent, to $1.3 billion).
Alberta’s net cash income (difference between total FCR and total expenses) was a record $3.2 billion ($2.8 billion in 2014). Adjusted for depreciation (a non-cash cost of $1.7 billion), the resulting realized net income (RNI) was a record $1.5 billion ($1.2 billion in 2014). Total net income (RNI adjusted for inventory change) jumped to $831.4 million ($357.0 million in 2014).
Farm Debt Outstanding and Value of Farm Capital
Alberta’s total farm debt outstanding at December 31, 2015 was up 8.0 per cent from a year previous, to $20.4 billion. The largest lender type was chartered banks, who were owed $7.8 billion (38.1 per cent of the total farm debt), up 10.0 per cent from 2014. The next largest group consisted of federal government agencies such as the Farm Credit Corporation and the Business Development Bank of Canada. This group was owed $4.8 billion (23.6 per cent of total farm debt), up 2.4 per cent from a year earlier. Provincial government agencies, such as the Agriculture Financial Services Corporation and Alberta Treasury Branches, followed with a total of $4.7 billion in loans to Alberta producers (23.0 per cent of total farm debt), and 11.4 per cent above 2014. Credit Unions accounted for $853.1 million in loans to farmers, up 7.1 per cent (4.2 per cent of total farm debt). Other lenders (including insurance and trust companies, along with private individuals and supply

Alberta Agriculture Statistics Yearbook, 2015 - 7 -
companies), were owed a total of $1.9 billion (9.5 per cent of total farm debt), up 10.9 per cent from 2014. Advance program payments fell 10.6 per cent to $345.9 million (1.7 per cent of total farm debt).
In 2015, Alberta led the nation in the total value of farm capital (land and buildings, machinery and equipment, and livestock and poultry). At July 1, the province’s total farm capital was a record $140.6 billion, while Ontario was second at $139.9 billion. Farm capital value for Alberta increased 10.1 per cent from the same period in 2014 and has steadily increased since 1993, when it was valued at $31.4 billion, mostly due to substantial gains in the value of land and buildings. The 2015 value was fuelled by new highs for the value of land and buildings, machinery and equipment, and the value of livestock and poultry. The value of land and buildings increased 9.3 per cent, to $116.3 billion, while the value of machinery and equipment was up 5.6 per cent, to $13.5 billion. The value of livestock and poultry was over $10 billion for the first time, a jump of 26.6 per cent from a year previous, to $10.8 billion, largely due to record cattle prices.
Source: Statistics Canada, CANSIM Database Table Numbers 002-0001 and 002-0009; and Alberta Agriculture and Forestry, Statistics and Data Development Section
0.0
2.0
4.0
6.0
8.0
10.0
12.0
14.0
1978 1980 1982 1984 1986 1988 1990 1992 1994 1996 1998 2000 2002 2004 2006 2008 2010 2012 2014
$ B
illi
on
s
Farm Operating Expenses
Farm Cash Receipts
Net Cash Income
Alberta Farm Cash Receipts, Operating Expenses and Net Cash Income, 1978-2015

British Atlantic
Canada Alberta Sask. Manitoba Columbia Ontario Quebec Provinces
2011........................ 49,634,044 10,289,441 11,043,371 4,970,757 2,604,723 11,094,699 7,959,103 1,671,951
2012r........................ 53,764,079 11,945,828 11,787,750 5,146,436 2,752,273 12,054,263 8,345,754 1,731,776
2013r........................ 55,227,014 11,844,104 12,260,838 5,832,678 2,803,705 12,382,263 8,296,274 1,807,152
2014r........................ 57,886,741 12,898,011 13,146,473 5,974,796 2,943,607 12,722,622 8,465,863 1,735,370
2015p........................ 59,430,885 13,554,060 14,353,635 5,822,559 3,075,821 12,726,184 8,158,424 1,740,202
2011........................ 100.0 20.7 22.2 10.0 5.2 22.4 16.0 3.4
2012r........................ 100.0 22.2 21.9 9.6 5.1 22.4 15.5 3.2
2013r........................ 100.0 21.4 22.2 10.6 5.1 22.4 15.0 3.3
2014r........................ 100.0 22.3 22.7 10.3 5.1 22.0 14.6 3.0
2015p........................ 100.0 22.8 24.2 9.8 5.2 21.4 13.7 2.9
2011........................ 25,827,372 5,189,051 8,188,944 2,549,720 1,237,082 5,507,441 2,410,423 744,710
2012r........................ 29,483,686 6,476,214 9,151,041 2,717,522 1,329,089 6,419,638 2,648,475 741,706
2013r........................ 30,996,302 6,365,528 9,711,738 3,468,338 1,388,472 6,516,298 2,753,811 792,117
2014r........................ 30,081,515 5,946,753 9,816,617 3,249,488 1,433,656 6,216,748 2,636,700 781,554
2015p........................ 31,638,922 6,115,691 11,120,530 3,183,059 1,513,049 6,237,450 2,697,286 771,858
2011........................ 20,328,875 4,419,074 1,636,782 1,920,458 1,302,010 5,304,715 4,893,139 852,696
2012r........................ 20,875,337 4,698,008 1,687,909 1,934,279 1,375,426 5,325,825 4,927,966 925,924
2013r........................ 21,545,206 4,782,214 1,894,298 1,993,391 1,370,801 5,515,812 5,036,805 951,885
2014r........................ 25,705,264 6,402,039 2,718,228 2,494,107 1,479,363 6,228,828 5,508,106 874,593
2015p........................ 25,665,916 6,785,488 2,647,651 2,334,995 1,526,327 6,182,461 5,259,757 929,237
2011........................ 46,156,247 9,608,125 9,825,726 4,470,178 2,539,092 10,812,156 7,303,562 1,597,406
2012r........................ 50,359,023 11,174,222 10,838,950 4,651,801 2,704,515 11,745,463 7,576,441 1,667,630
2013r........................ 52,541,508 11,147,742 11,606,036 5,461,729 2,759,273 12,032,110 7,790,616 1,744,002
2014r........................ 55,786,779 12,348,792 12,534,845 5,743,595 2,913,019 12,445,576 8,144,806 1,656,147
2015p........................ 57,304,838 12,901,179 13,768,181 5,518,054 3,039,376 12,419,911 7,957,043 1,701,095
2011........................ 3,477,798 681,316 1,217,645 500,579 65,631 282,542 655,541 74,544
2012........................ 3,405,056 771,606 948,800 494,635 47,758 308,800 769,312 64,145
2013r........................ 2,685,507 696,362 654,803 370,949 44,432 350,153 505,658 63,150
2014r........................ 2,099,962 549,219 611,628 231,201 30,588 277,046 321,057 79,223
2015p........................ 2,126,047 652,881 585,455 304,505 36,445 306,273 201,381 39,107
2011........................ 38,299,707 8,492,047 7,220,631 3,950,604 2,377,081 8,868,872 6,046,990 1,343,482
2012........................ 41,404,344 9,313,149 8,077,482 4,371,660 2,510,366 9,468,535 6,242,340 1,420,811
2013r........................ 42,664,426 9,536,957 8,402,729 4,577,774 2,558,239 9,727,466 6,424,877 1,436,384
2014r........................ 43,890,080 10,114,626 8,637,344 4,560,649 2,581,284 10,054,138 6,501,884 1,440,154
2015p........................ 44,396,107 10,346,492 8,582,278 4,619,098 2,635,764 10,219,566 6,532,336 1,460,572
Farm Operating Expenses After Rebates
Total Farm Cash Receipts - % Share of Canada
Table 1: Selected Farm Income Statistics, Canada and Provinces, 2011-2015
Program Payments
$'000
Source: Statistics Canada, CANSIM Database Table Numbers 002-0001 and 002-0005; and Alberta Agriculture and Forestry, Statistics and Data
Development Section
Total Farm Cash Receipts (Market Receipts plus Program Payments)
Crop Market Cash Receipts
Livestock and Livestock Products Market Cash Receipts
Total Farm Market Receipts (Crops plus Livestock and Livestock Products)
Alberta Agriculture Statistics Yearbook, 2015 - 8 -

British Atlantic
Canada Alberta Sask. Manitoba Columbia Ontario Quebec Provinces
2011........................ 11,334,338 1,797,394 3,822,740 1,020,153 227,642 2,225,827 1,912,113 328,469
2012........................ 12,359,735 2,632,679 3,710,268 774,776 241,907 2,585,728 2,103,414 310,964
2013r........................ 12,562,589 2,307,146 3,858,109 1,254,904 245,466 2,654,798 1,871,397 370,769
2014r........................ 13,996,662 2,783,385 4,509,129 1,414,147 362,323 2,668,484 1,963,979 295,216
2015p........................ 15,034,778 3,207,569 5,771,357 1,203,461 440,057 2,506,618 1,626,088 279,630
2011........................ 5,508,927 413,124 2,544,060 458,277 -139,627 950,079 1,119,312 163,701
2012........................ 6,304,514 1,186,878 2,374,530 194,371 -134,757 1,256,684 1,283,465 143,342
2013r........................ 6,262,460 788,755 2,447,268 648,009 -138,973 1,289,216 1,029,935 198,249
2014r........................ 7,458,635 1,192,350 3,022,667 779,839 -34,351 1,270,569 1,109,114 118,448
2015p........................ 8,144,972 1,502,989 4,175,951 531,911 32,732 1,049,248 754,469 97,671
2011........................ 6,085,181 939,560 2,709,264 -26,565 -86,386 1,343,518 1,106,952 98,838
2012........................ 6,335,381 668,897 2,227,368 925,698 -153,491 1,184,438 1,298,999 183,472
2013r........................ 12,408,746 2,515,890 5,874,198 1,460,705 -80,056 1,343,413 1,104,163 190,432
2014r........................ 4,684,087 357,049 1,619,545 401,577 -63,486 1,197,244 1,043,441 128,717
2015p........................ 6,757,964 831,406 2,948,916 773,909 65,367 1,112,406 906,653 119,306
2011........................ 68,409,485 14,942,403 9,550,668 7,331,909 5,176,288 17,382,104 11,816,100 2,210,015
2012........................ 72,659,871 16,026,523 10,285,413 7,173,463 5,577,391 19,225,555 12,137,571 2,233,956
2013r........................ 79,610,512 17,967,595 11,903,711 7,370,049 5,783,894 21,266,594 13,011,244 2,307,425
2014r........................ 84,582,110 18,929,090 13,057,555 7,659,982 6,137,439 22,275,184 14,031,464 2,491,397
2015p........................ 91,794,585 20,438,717 14,060,833 8,446,377 6,488,937 24,378,321 15,247,805 2,733,595
2011........................ 333,311,825 96,991,073 51,996,380 24,535,742 34,703,583 85,933,859 32,855,890 6,295,297
2012........................ 368,758,275 104,967,374 59,080,670 26,773,868 34,812,585 101,160,687 35,436,396 6,526,696
2013r........................ 418,926,516 116,090,902 69,380,329 31,509,564 35,382,682 117,466,051 42,299,143 6,797,844
2014r........................ 464,305,886 127,695,512 81,295,369 35,889,885 36,606,986 128,802,687 46,986,183 7,029,265
2015p........................ 507,353,806 140,607,940 90,129,393 39,637,732 38,374,174 139,938,617 51,336,129 7,329,821
2011........................ 1,724 1,592 624 1,035 4,988 5,985 3,128 2,100
2012........................ 1,924 1,725 724 1,137 4,984 7,155 3,398 2,145
2013........................ 2,227 1,934 881 1,388 5,060 8,417 4,231 2,221
2014........................ 2,460 2,092 1,043 1,583 5,217 9,243 4,718 2,300
2015p........................ 2,682 2,282 1,159 1,749 5,432 10,063 5,169 2,397
Table 1 (Cont'd.): Selected Farm Income Statistics, Canada and Provinces,
2011-2015
Net Cash Income (Total Farm Cash Receipts minus Farm Operating Expenses After Rebates)
Total Net Farm Income
Farm Debt Outstanding at December 31
Realized Net Farm Income
$'000
Source: Statistics Canada, CANSIM Database Table Numbers 002-0003, 002-0007, 002-0008 and 002-0009; and Alberta Agriculture and Forestry,
Statistics and Data Development Section
Value of Farm Capital at July 1
Value per Acre of Farm Land and Buildings (1) at July 1, Dollars (2)
(1) Value per acre of farm land and buildings, at July 1, reflects the value of all farm land, including pasture and unimproved land, plus the value of farm houses,
buildings, and other structures.
(2) Figures shown for Atlantic provinces are averages.
- 9 - Alberta Agriculture Statistics Yearbook, 2015

Alberta Canada
Alberta
as a % of
Canada
Selected Commodities
Cattle and Calves…………………………………………..…………………………………. 5,226,879 10,509,193 49.7
Barley…………………………………………..…………………………………. 262,836 657,735 40.0
Dry Peas……………………………………………………………………. 348,018 873,501 39.8
Honey…………………………………………..…………………………………. 87,830 223,248 39.3
Canola…………………………………………..…………………………………. 2,612,856 7,995,287 32.7
Hay and Clover…………………………………………..…………………………………. 153,262 471,040 32.5
Wheat (including Durum)……………...………………………………..…………………………………. 2,036,535 6,396,985 31.8
Forage and Grass Seed……………………………………………………….. 36,926 117,070 31.5
Mustard Seed…………………………………………..…………………………………. 25,788 99,543 25.9
Source: Statistics Canada, CANSIM Database Table Number 002-0001; and Alberta Agriculture and Forestry, Statistics and Data Development
Section
$'000
Alberta's Share of Canadian Farm Cash Receipts, 2003
2015 Farm Cash Receipts - Alberta as a Per Cent of Canada
* In 2015, total Canadian farm cash receipts, including direct program payments to
producers, was $59.4 billion.
#1 Saskatchewan (24.2%)
#2 Alberta (22.8%)#3 Ontario (21.4%)#4 Quebec (13.7%)#5 Manitoba (9.8%)
British Columbia
$3.1 Alberta$13.6 Saskat-
chewan$14.4
Manitoba$5.8
Ontario$12.7
Quebec$8.2
Atlantic Provinces
$1.7
Newfoundland
Prince Edward Island
Nova ScotiaNew
Brunswick
Top Five Agricultural Producing Provinces
as a Per Cent of Canada, 2015
Fig. 1 Distribution of 2015 Canadian Farm Cash Receipts* ($ Billions)
Alberta Agriculture Statistics Yearbook, 2015 - 10 -
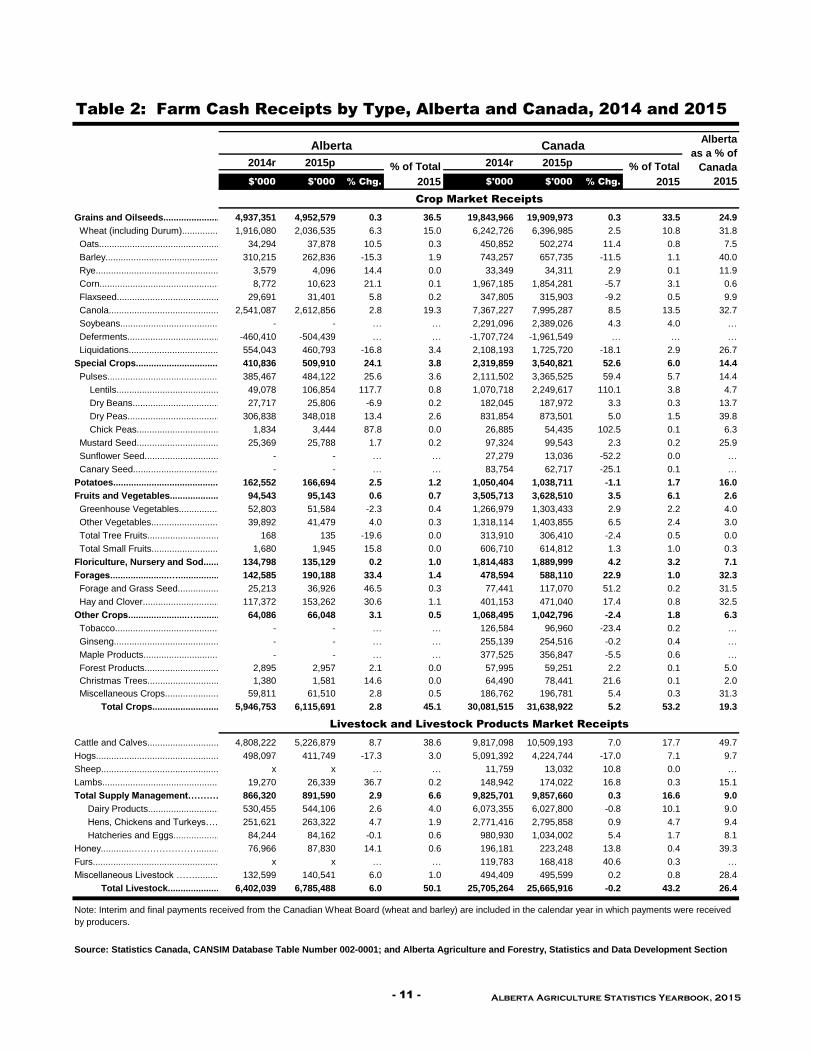
2014r 2015p 2014r 2015p
$'000 $'000 % Chg. 2015 $'000 $'000 % Chg. 2015
Grains and Oilseeds.................................................4,937,351 4,952,579 0.3 36.5 19,843,966 19,909,973 0.3 33.5 24.9
Wheat (including Durum).................................................................1,916,080 2,036,535 6.3 15.0 6,242,726 6,396,985 2.5 10.8 31.8
Oats....................................................................34,294 37,878 10.5 0.3 450,852 502,274 11.4 0.8 7.5
Barley.................................................................310,215 262,836 -15.3 1.9 743,257 657,735 -11.5 1.1 40.0
Rye........................................................................3,579 4,096 14.4 0.0 33,349 34,311 2.9 0.1 11.9
Corn.........................................................................8,772 10,623 21.1 0.1 1,967,185 1,854,281 -5.7 3.1 0.6
Flaxseed..................................................................29,691 31,401 5.8 0.2 347,805 315,903 -9.2 0.5 9.9
Canola................................................................................2,541,087 2,612,856 2.8 19.3 7,367,227 7,995,287 8.5 13.5 32.7
Soybeans.........................................................................- - … … 2,291,096 2,389,026 4.3 4.0 …
Deferments.........................................................................-460,410 -504,439 … … -1,707,724 -1,961,549 … … …
Liquidations.........................................................................554,043 460,793 -16.8 3.4 2,108,193 1,725,720 -18.1 2.9 26.7
Special Crops.............................................................410,836 509,910 24.1 3.8 2,319,859 3,540,821 52.6 6.0 14.4
Pulses....................................................................385,467 484,122 25.6 3.6 2,111,502 3,365,525 59.4 5.7 14.4
Lentils...............................................................49,078 106,854 117.7 0.8 1,070,718 2,249,617 110.1 3.8 4.7
Dry Beans................................................................27,717 25,806 -6.9 0.2 182,045 187,972 3.3 0.3 13.7
Dry Peas..............................................................306,838 348,018 13.4 2.6 831,854 873,501 5.0 1.5 39.8
Chick Peas..............................................................1,834 3,444 87.8 0.0 26,885 54,435 102.5 0.1 6.3
Mustard Seed...........................................................25,369 25,788 1.7 0.2 97,324 99,543 2.3 0.2 25.9
Sunflower Seed.......................................................- - … … 27,279 13,036 -52.2 0.0 …
Canary Seed..............................................................- - … … 83,754 62,717 -25.1 0.1 …
Potatoes..........................................................................................................162,552 166,694 2.5 1.2 1,050,404 1,038,711 -1.1 1.7 16.0
Fruits and Vegetables..........................................................................94,543 95,143 0.6 0.7 3,505,713 3,628,510 3.5 6.1 2.6
Greenhouse Vegetables...........................................................................................................52,803 51,584 -2.3 0.4 1,266,979 1,303,433 2.9 2.2 4.0
Other Vegetables.....................................................................................................39,892 41,479 4.0 0.3 1,318,114 1,403,855 6.5 2.4 3.0
Total Tree Fruits.....................................................................................................168 135 -19.6 0.0 313,910 306,410 -2.4 0.5 0.0
Total Small Fruits............................................................................................1,680 1,945 15.8 0.0 606,710 614,812 1.3 1.0 0.3
Floriculture, Nursery and Sod.........................................................................134,798 135,129 0.2 1.0 1,814,483 1,889,999 4.2 3.2 7.1
Forages.......................….......................................................……………..............142,585 190,188 33.4 1.4 478,594 588,110 22.9 1.0 32.3
Forage and Grass Seed................................................................................25,213 36,926 46.5 0.3 77,441 117,070 51.2 0.2 31.5
Hay and Clover..................................................................................................117,372 153,262 30.6 1.1 401,153 471,040 17.4 0.8 32.5
Other Crops.......................….......................................................……………..............64,086 66,048 3.1 0.5 1,068,495 1,042,796 -2.4 1.8 6.3
Tobacco..................................................................................................- - … … 126,584 96,960 -23.4 0.2 …
Ginseng.....................................................................................................- - … … 255,139 254,516 -0.2 0.4 …
Maple Products.............................................................................................- - … … 377,525 356,847 -5.5 0.6 …
Forest Products............................................................................................2,895 2,957 2.1 0.0 57,995 59,251 2.2 0.1 5.0
Christmas Trees...............................................................................................1,380 1,581 14.6 0.0 64,490 78,441 21.6 0.1 2.0
Miscellaneous Crops...............................................................................................59,811 61,510 2.8 0.5 186,762 196,781 5.4 0.3 31.3
Total Crops...............................................................................................5,946,753 6,115,691 2.8 45.1 30,081,515 31,638,922 5.2 53.2 19.3
Cattle and Calves.................................................................................4,808,222 5,226,879 8.7 38.6 9,817,098 10,509,193 7.0 17.7 49.7
Hogs....................................................................................................498,097 411,749 -17.3 3.0 5,091,392 4,224,744 -17.0 7.1 9.7
Sheep....................................................................................................x x … … 11,759 13,032 10.8 0.0 …
Lambs....................................................................................................19,270 26,339 36.7 0.2 148,942 174,022 16.8 0.3 15.1
Total Supply Management…………………..866,320 891,590 2.9 6.6 9,825,701 9,857,660 0.3 16.6 9.0
Dairy Products..............................................................530,455 544,106 2.6 4.0 6,073,355 6,027,800 -0.8 10.1 9.0
Hens, Chickens and Turkeys………………………………………..251,621 263,322 4.7 1.9 2,771,416 2,795,858 0.9 4.7 9.4
Hatcheries and Eggs......................................................84,244 84,162 -0.1 0.6 980,930 1,034,002 5.4 1.7 8.1
Honey............…………………............................…...............................76,966 87,830 14.1 0.6 196,181 223,248 13.8 0.4 39.3
Furs..............................................................................x x … … 119,783 168,418 40.6 0.3 …
Miscellaneous Livestock ……............................……………………132,599 140,541 6.0 1.0 494,409 495,599 0.2 0.8 28.4
Total Livestock..............................................................6,402,039 6,785,488 6.0 50.1 25,705,264 25,665,916 -0.2 43.2 26.4
Source: Statistics Canada, CANSIM Database Table Number 002-0001; and Alberta Agriculture and Forestry, Statistics and Data Development Section
Table 2: Farm Cash Receipts by Type, Alberta and Canada, 2014 and 2015
Note: Interim and final payments received from the Canadian Wheat Board (wheat and barley) are included in the calendar year in which payments were received
by producers.
Alberta Canada
Livestock and Livestock Products Market Receipts
Alberta
as a % of
Canada
2015
Crop Market Receipts
% of Total % of Total
- 11 - Alberta Agriculture Statistics Yearbook, 2015

2014r 2015p 2014r 2015p
$'000 $'000 % Chg. 2015 $'000 $'000 % Chg. 2015
Crop Insurance.................................................................312,177 456,147 46.1 3.4 777,446 1,107,471 42.4 1.9 41.2
Private Hail Insurance.................................................................104,942 59,182 -43.6 0.4 259,130 176,763 -31.8 0.3 33.5
AgriStability.................................................................50,304 58,078 15.5 0.4 432,894 295,718 -31.7 0.5 19.6
AgriInvest................................................................. 71,530 64,466 -9.9 0.5 320,989 268,853 -16.2 0.5 24.0
AgriRecovery................................................................. 0 0 … … 1,289 4,106 218.5 0.0 0.0
Prov. Stabilization Payments…............................…………………………………………0 0 … … 175,802 121,041 -31.1 0.2 0.0
Other Payments............................................................10,266 15,008 46.2 0.1 132,412 152,095 14.9 0.3 9.9
Total Payments..............................................................549,219 652,881 18.9 4.8 2,099,962 2,126,047 1.2 3.6 30.7
Total Farm Cash Receipts...........................................12,898,011 13,554,060 5.1 100.0 57,886,741 59,430,885 2.7 100.0 22.8
Mustard Seed…………………………………………..………………………………….
2011 2012 2013 2014 2015
Farm Cash Receipts 10,289 11,946 11,844 12,898 13,554
Farm Operating Expenses 8,492 9,313 9,537 10,115 10,346
Realized Net Income 413 1,187 789 1,192 1,503
Net Cash Income 1,797 2,633 2,307 2,783 3,208
Program Payments 681 772 696 549 653
Note: Farm operating expenses are after rebates and before depreciation.
Source: Statistics Canada, CANSIM Database Table Numbers 002-0001, 002-0005 and 002-0009; and Alberta Agriculture and Forestry, Statistics
and Data Development Section
Table 2 (Cont'd.): Farm Cash Receipts by Type, Alberta and Canada, 2014
and 2015
Source: Statistics Canada, CANSIM Database Table Number 002-0001; and Alberta Agriculture and Forestry, Statistics and Data Development Section
Alberta CanadaAlberta
as a % of
Canada
2015
Program Payments
% of Total % of Total
$ Millions
-2,000
0
2,000
4,000
6,000
8,000
10,000
12,000
14,000
16,000
2011 2012 2013 2014 2015
$ M
illio
ns
Farm Cash Receipts
Farm Operating
Expenses
Net Cash Income
Realized Net Income
Program Payments
Fig. 2 Alberta Farm Income Indicators, 2011-2015
Alberta Agriculture Statistics Yearbook, 2015 - 12 -

Source: Statistics Canada, CANSIM Database Table Number 002-0001; and Alberta Agriculture and Forestry, Statistics and Data
Development Section
Source: Statistics Canada, CANSIM Database Table Number 002-0001; and Alberta Agriculture and Forestry, Statistics and Data
Development Section
Source: Statistics Canada, CANSIM Database Table Number 002-0001; and Alberta Agriculture and Forestry, Statistics and Data
Development Section
Farm Cash Receipts Crop Market Receipts Livestock Market Receipts
10.3
11.9 11.8
12.913.6
5.2
6.5 6.45.9 6.1
4.4 4.7 4.8
6.46.8
0.0
2.0
4.0
6.0
8.0
10.0
12.0
14.0
2011 '12 '13 '14 '15 2011 '12 '13 '14 '15 2011 '12 '13 '14 '15
$ B
illi
on
s
Fig. 3 Alberta Farm Cash Receipts, Crop Market Receipts and Livestock
Market Receipts, 2011-2015
Fig. 5 Per Cent Change in Farm Market Receipts (Crops and Livestock),
Canada and Selected Provinces, 2015/2014
4.3 4.5
9.8
-3.9-0.2
-2.3
2.7
-10.0
-5.0
0.0
5.0
10.0
15.0
20.0
25.0
B.C. Alberta Sask. Manitoba Ontario Quebec Canada
Per
Cen
t C
han
ge
Ontario, $12.7 (21.4%)
Alberta, $13.6 (22.8%)
Saskatchewan, $14.4 (24.2%)
Quebec, $8.2 (13.7%)
Manitoba, $5.8 (9.8%)
Atlantic Provinces, $1.7 (2.9%)British Columbia, $3.1 (5.2%)
Fig. 4 Distribution of Canadian Farm Cash Receipts ($ Billions), 2015
Total Canadian Farm Cash Receipts (including direct program payments to producers) in 2015 = $59.4 Billion
- 13 - Alberta Agriculture Statistics Yearbook, 2015
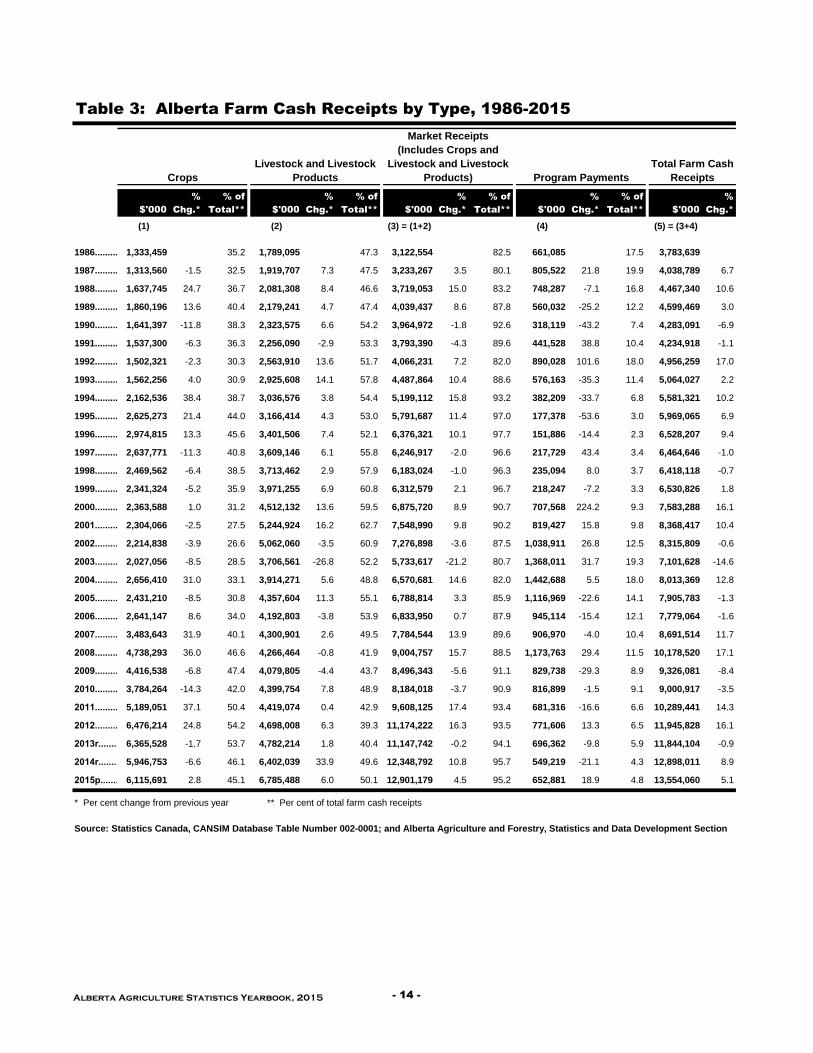
% % of % % of % % of % % of %
$'000 Chg.* Total** $'000 Chg.* Total** $'000 Chg.* Total** $'000 Chg.* Total** $'000 Chg.*
(1) (2) (3) = (1+2) (4) (5) = (3+4)
1986.........................1,333,459 35.2 1,789,095 47.3 3,122,554 82.5 661,085 17.5 3,783,639
1987.......................1,313,560 -1.5 32.5 1,919,707 7.3 47.5 3,233,267 3.5 80.1 805,522 21.8 19.9 4,038,789 6.7
1988.........................1,637,745 24.7 36.7 2,081,308 8.4 46.6 3,719,053 15.0 83.2 748,287 -7.1 16.8 4,467,340 10.6
1989........................1,860,196 13.6 40.4 2,179,241 4.7 47.4 4,039,437 8.6 87.8 560,032 -25.2 12.2 4,599,469 3.0
1990.....................1,641,397 -11.8 38.3 2,323,575 6.6 54.2 3,964,972 -1.8 92.6 318,119 -43.2 7.4 4,283,091 -6.9
1991.....................1,537,300 -6.3 36.3 2,256,090 -2.9 53.3 3,793,390 -4.3 89.6 441,528 38.8 10.4 4,234,918 -1.1
1992.......................1,502,321 -2.3 30.3 2,563,910 13.6 51.7 4,066,231 7.2 82.0 890,028 101.6 18.0 4,956,259 17.0
1993.....................1,562,256 4.0 30.9 2,925,608 14.1 57.8 4,487,864 10.4 88.6 576,163 -35.3 11.4 5,064,027 2.2
1994........................2,162,536 38.4 38.7 3,036,576 3.8 54.4 5,199,112 15.8 93.2 382,209 -33.7 6.8 5,581,321 10.2
1995.....................2,625,273 21.4 44.0 3,166,414 4.3 53.0 5,791,687 11.4 97.0 177,378 -53.6 3.0 5,969,065 6.9
1996.......................2,974,815 13.3 45.6 3,401,506 7.4 52.1 6,376,321 10.1 97.7 151,886 -14.4 2.3 6,528,207 9.4
1997........................2,637,771 -11.3 40.8 3,609,146 6.1 55.8 6,246,917 -2.0 96.6 217,729 43.4 3.4 6,464,646 -1.0
1998.................2,469,562 -6.4 38.5 3,713,462 2.9 57.9 6,183,024 -1.0 96.3 235,094 8.0 3.7 6,418,118 -0.7
1999.................2,341,324 -5.2 35.9 3,971,255 6.9 60.8 6,312,579 2.1 96.7 218,247 -7.2 3.3 6,530,826 1.8
2000.................2,363,588 1.0 31.2 4,512,132 13.6 59.5 6,875,720 8.9 90.7 707,568 224.2 9.3 7,583,288 16.1
2001..............…2,304,066 -2.5 27.5 5,244,924 16.2 62.7 7,548,990 9.8 90.2 819,427 15.8 9.8 8,368,417 10.4
2002..............…2,214,838 -3.9 26.6 5,062,060 -3.5 60.9 7,276,898 -3.6 87.5 1,038,911 26.8 12.5 8,315,809 -0.6
2003..............…2,027,056 -8.5 28.5 3,706,561 -26.8 52.2 5,733,617 -21.2 80.7 1,368,011 31.7 19.3 7,101,628 -14.6
2004..............…2,656,410 31.0 33.1 3,914,271 5.6 48.8 6,570,681 14.6 82.0 1,442,688 5.5 18.0 8,013,369 12.8
2005..............…2,431,210 -8.5 30.8 4,357,604 11.3 55.1 6,788,814 3.3 85.9 1,116,969 -22.6 14.1 7,905,783 -1.3
2006..............…2,641,147 8.6 34.0 4,192,803 -3.8 53.9 6,833,950 0.7 87.9 945,114 -15.4 12.1 7,779,064 -1.6
2007..............…3,483,643 31.9 40.1 4,300,901 2.6 49.5 7,784,544 13.9 89.6 906,970 -4.0 10.4 8,691,514 11.7
2008..............…4,738,293 36.0 46.6 4,266,464 -0.8 41.9 9,004,757 15.7 88.5 1,173,763 29.4 11.5 10,178,520 17.1
2009..............…4,416,538 -6.8 47.4 4,079,805 -4.4 43.7 8,496,343 -5.6 91.1 829,738 -29.3 8.9 9,326,081 -8.4
2010..............…3,784,264 -14.3 42.0 4,399,754 7.8 48.9 8,184,018 -3.7 90.9 816,899 -1.5 9.1 9,000,917 -3.5
2011..............…5,189,051 37.1 50.4 4,419,074 0.4 42.9 9,608,125 17.4 93.4 681,316 -16.6 6.6 10,289,441 14.3
2012..............…6,476,214 24.8 54.2 4,698,008 6.3 39.3 11,174,222 16.3 93.5 771,606 13.3 6.5 11,945,828 16.1
2013r..............…6,365,528 -1.7 53.7 4,782,214 1.8 40.4 11,147,742 -0.2 94.1 696,362 -9.8 5.9 11,844,104 -0.9
2014r..............…5,946,753 -6.6 46.1 6,402,039 33.9 49.6 12,348,792 10.8 95.7 549,219 -21.1 4.3 12,898,011 8.9
2015p..............…6,115,691 2.8 45.1 6,785,488 6.0 50.1 12,901,179 4.5 95.2 652,881 18.9 4.8 13,554,060 5.1
* Per cent change from previous year ** Per cent of total farm cash receipts
Source: Statistics Canada, CANSIM Database Table Number 002-0001; and Alberta Agriculture and Forestry, Statistics and Data Development Section
Table 3: Alberta Farm Cash Receipts by Type, 1986-2015
Crops
Livestock and Livestock
Products
Market Receipts
(Includes Crops and
Livestock and Livestock
Products) Program Payments
Total Farm Cash
Receipts
Alberta Agriculture Statistics Yearbook, 2015 - 14 -

Crop
Market Cash Sugar
Receipts (1) Wheat Oats Barley Rye Flaxseed Canola Beets Dry Peas
1986......................... 1,333,459 517,250 17,052 318,687 4,645 5,534 267,031 9,001 2,382
1987....................... 1,313,560 559,646 19,466 232,205 4,743 6,012 313,316 12,680 3,944
1988......................... 1,637,745 686,440 65,551 256,552 7,720 7,217 437,847 19,380 9,595
1989........................ 1,860,196 690,843 89,531 376,767 5,921 6,448 419,740 23,342 12,476
1990..................... 1,641,397 713,863 37,577 272,197 5,442 8,349 336,232 26,586 10,818
1991..................... 1,537,300 685,230 22,770 225,109 4,688 5,128 320,224 20,877 16,933
1992....................... 1,502,321 604,720 39,803 192,114 4,628 5,912 388,758 17,277 21,986
1993..................... 1,562,256 593,161 50,206 189,381 5,087 9,312 414,540 21,965 29,910
1994........................ 2,162,536 840,653 45,835 265,713 6,318 9,186 773,332 26,627 50,332
1995..................... 2,625,273 1,064,743 70,856 332,953 7,305 8,933 709,701 32,401 60,518
1996....................... 2,974,815 1,241,345 88,387 470,725 7,330 9,094 794,467 27,008 59,406
1997........................ 2,637,771 1,012,666 52,002 324,076 6,691 7,481 755,087 30,062 59,277
1998................. 2,469,562 863,418 34,220 198,273 4,182 7,832 881,378 38,402 59,516
1999................. 2,341,324 975,506 22,980 174,266 3,632 5,118 608,212 29,651 57,229
2000................. 2,363,588 959,622 20,708 220,607 2,978 5,616 556,266 32,899 53,893
2001..............… 2,304,066 938,302 31,469 213,676 3,520 4,379 584,239 19,333 70,349
2002..............… 2,214,838 817,337 42,195 159,809 2,718 4,897 530,186 20,072 48,053
2003..............… 2,027,056 652,550 20,742 156,647 1,519 3,953 624,433 22,732 58,140
2004..............… 2,656,410 964,469 23,715 209,184 9,748 7,695 785,822 30,921 78,434
2005..............… 2,431,210 800,040 39,939 140,403 2,930 4,278 742,610 32,140 78,000
2006..............… 2,641,147 816,087 30,535 143,172 5,350 3,295 990,705 38,180 81,637
2007..............… 3,483,643 1,239,947 38,799 340,801 8,673 7,318 1,207,425 34,726 113,003
2008..............… 4,738,293 1,870,461 28,308 388,240 9,693 8,784 1,855,050 23,543 122,289
2009..............… 4,416,538 1,691,336 27,015 267,130 4,584 7,158 1,647,729 22,690 133,833
2010..............… 3,784,264 1,142,010 32,335 161,321 5,241 8,396 1,694,906 23,222 151,316
2011..............… 5,189,051 1,594,004 48,160 247,647 7,808 8,320 2,626,269 36,061 255,315
2012..............… 6,476,214 2,104,347 126,191 303,318 9,287 21,733 3,076,848 x 291,010
2013r..............… 6,365,528 2,243,959 41,272 469,441 5,475 19,010 2,575,760 x 325,785
2014r..............… 5,946,753 1,916,080 34,294 310,215 3,579 29,691 2,541,087 x 306,838
2015p..............… 6,115,691 2,036,535 37,878 262,836 4,096 31,401 2,612,856 x 348,018
(1) Includes market receipts only (does not include program payments).
Source: Statistics Canada, CANSIM Database Table Number 002-0001; and Alberta Agriculture and Forestry, Statistics and Data Development Section
Table 4: Alberta Farm Cash Receipts From the Sale of Crops, 1986-2015
$'000
- 15 - Alberta Agriculture Statistics Yearbook, 2015
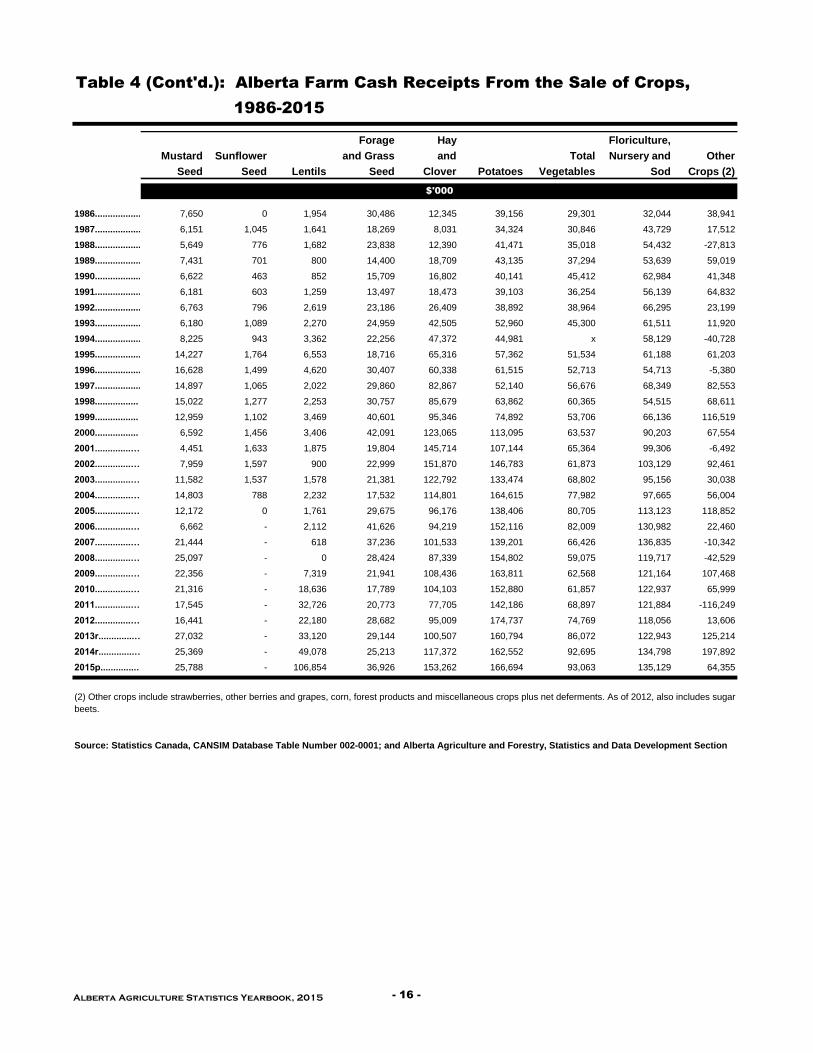
Forage Hay Floriculture,
Mustard Sunflower and Grass and Total Nursery and Other
Seed Seed Lentils Seed Clover Potatoes Vegetables Sod Crops (2)
1986......................... 7,650 0 1,954 30,486 12,345 39,156 29,301 32,044 38,941
1987....................... 6,151 1,045 1,641 18,269 8,031 34,324 30,846 43,729 17,512
1988......................... 5,649 776 1,682 23,838 12,390 41,471 35,018 54,432 -27,813
1989........................ 7,431 701 800 14,400 18,709 43,135 37,294 53,639 59,019
1990..................... 6,622 463 852 15,709 16,802 40,141 45,412 62,984 41,348
1991..................... 6,181 603 1,259 13,497 18,473 39,103 36,254 56,139 64,832
1992....................... 6,763 796 2,619 23,186 26,409 38,892 38,964 66,295 23,199
1993..................... 6,180 1,089 2,270 24,959 42,505 52,960 45,300 61,511 11,920
1994........................ 8,225 943 3,362 22,256 47,372 44,981 x 58,129 -40,728
1995..................... 14,227 1,764 6,553 18,716 65,316 57,362 51,534 61,188 61,203
1996....................... 16,628 1,499 4,620 30,407 60,338 61,515 52,713 54,713 -5,380
1997........................ 14,897 1,065 2,022 29,860 82,867 52,140 56,676 68,349 82,553
1998................. 15,022 1,277 2,253 30,757 85,679 63,862 60,365 54,515 68,611
1999................. 12,959 1,102 3,469 40,601 95,346 74,892 53,706 66,136 116,519
2000................. 6,592 1,456 3,406 42,091 123,065 113,095 63,537 90,203 67,554
2001..............… 4,451 1,633 1,875 19,804 145,714 107,144 65,364 99,306 -6,492
2002..............… 7,959 1,597 900 22,999 151,870 146,783 61,873 103,129 92,461
2003..............… 11,582 1,537 1,578 21,381 122,792 133,474 68,802 95,156 30,038
2004..............… 14,803 788 2,232 17,532 114,801 164,615 77,982 97,665 56,004
2005..............… 12,172 0 1,761 29,675 96,176 138,406 80,705 113,123 118,852
2006..............… 6,662 - 2,112 41,626 94,219 152,116 82,009 130,982 22,460
2007..............… 21,444 - 618 37,236 101,533 139,201 66,426 136,835 -10,342
2008..............… 25,097 - 0 28,424 87,339 154,802 59,075 119,717 -42,529
2009..............… 22,356 - 7,319 21,941 108,436 163,811 62,568 121,164 107,468
2010..............… 21,316 - 18,636 17,789 104,103 152,880 61,857 122,937 65,999
2011..............… 17,545 - 32,726 20,773 77,705 142,186 68,897 121,884 -116,249
2012..............… 16,441 - 22,180 28,682 95,009 174,737 74,769 118,056 13,606
2013r..............… 27,032 - 33,120 29,144 100,507 160,794 86,072 122,943 125,214
2014r..............… 25,369 - 49,078 25,213 117,372 162,552 92,695 134,798 197,892
2015p..............… 25,788 - 106,854 36,926 153,262 166,694 93,063 135,129 64,355
Source: Statistics Canada, CANSIM Database Table Number 002-0001; and Alberta Agriculture and Forestry, Statistics and Data Development Section
(2) Other crops include strawberries, other berries and grapes, corn, forest products and miscellaneous crops plus net deferments. As of 2012, also includes sugar
beets.
Table 4 (Cont'd.): Alberta Farm Cash Receipts From the Sale of Crops,
1986-2015
$'000
Alberta Agriculture Statistics Yearbook, 2015 - 16 -

Other
Livestock Cattle Sheep Total Chickens, Eggs Livestock
Market Cash and and Supply Dairy Hens and and and
Receipts (1) Calves Hogs Lambs (2) Mgmt. Products Turkeys Hatcheries Honey Products
1986.........................1,789,095 1,116,853 279,377 7,854 349,503 223,658 83,754 42,091 12,982 22,526
1987.......................1,919,707 1,224,926 287,590 9,247 354,171 221,104 92,143 40,924 12,502 31,271
1988.........................2,081,308 1,400,573 259,397 7,978 368,728 238,186 87,729 42,813 10,139 34,493
1989........................2,179,241 1,474,780 265,031 8,695 386,966 246,982 96,267 43,717 9,001 34,768
1990.....................2,323,575 1,573,696 298,895 8,081 397,210 251,207 104,035 41,968 11,666 34,027
1991.....................2,256,090 1,537,410 276,091 7,386 393,359 250,093 99,609 43,657 11,666 30,178
1992.......................2,563,910 1,815,960 276,903 13,245 392,086 248,537 97,595 45,954 13,001 52,715
1993.....................2,925,608 2,109,871 322,885 14,513 395,852 244,663 103,708 47,481 13,352 69,135
1994........................3,036,576 2,191,208 315,333 13,100 421,021 257,843 112,680 50,498 15,609 80,305
1995.....................3,166,414 2,221,065 381,812 14,394 430,846 265,643 112,404 52,799 19,689 98,608
1996.......................3,401,506 2,347,628 444,585 17,145 471,041 290,753 125,115 55,173 19,693 101,414
1997........................3,609,146 2,541,552 438,374 15,297 484,647 316,826 129,373 38,448 22,857 106,419
1998.................3,713,462 2,763,190 309,938 12,763 485,205 311,460 136,058 37,687 30,734 111,632
1999.................3,971,255 2,968,144 344,341 13,385 498,662 327,063 133,836 37,763 25,832 120,891
2000.................4,512,132 3,340,203 496,616 16,080 495,745 318,454 138,249 39,042 19,911 143,577
2001..............…5,244,924 3,918,165 572,119 14,050 547,600 348,378 156,730 42,492 24,312 168,678
2002..............…5,062,060 3,845,765 437,343 19,118 555,215 366,827 143,638 44,750 45,679 158,940
2003..............…3,706,561 2,512,011 427,552 15,799 579,715 384,704 149,290 45,721 57,450 114,034
2004..............…3,914,271 2,571,540 564,882 12,092 595,024 382,979 161,594 50,451 53,075 117,658
2005..............…4,357,604 3,032,268 522,224 17,801 611,693 398,675 165,771 47,247 39,229 134,389
2006..............…4,192,803 2,939,546 475,765 18,527 590,562 382,094 161,726 46,742 40,247 128,156
2007..............…4,300,901 3,024,332 444,386 20,563 654,205 426,818 180,217 47,170 36,494 120,921
2008..............…4,266,464 2,966,595 411,755 17,615 723,978 459,317 208,853 55,808 34,423 112,098
2009..............…4,079,805 2,863,875 331,151 16,897 723,526 462,344 206,158 55,024 44,293 100,063
2010..............…4,399,754 3,121,625 368,597 17,596 738,835 478,363 204,689 55,783 53,199 99,902
2011..............…4,419,074 3,025,722 416,649 21,562 805,024 504,142 237,141 63,741 57,963 92,154
2012..............…4,698,008 3,254,744 412,639 17,971 850,103 520,665 259,157 70,281 64,579 97,972
2013r..............…4,782,214 3,319,944 419,089 14,229 858,114 514,937 262,405 80,772 71,033 99,805
2014r..............…6,402,039 4,808,222 498,097 19,270 866,320 530,455 251,621 84,244 76,966 133,164
2015p..............…6,785,488 5,226,879 411,749 26,339 891,590 544,106 263,322 84,162 87,830 141,101
Source: Statistics Canada, CANSIM Database Table Number 002-0001; and Alberta Agriculture and Forestry, Statistics and Data Development Section
Table 5: Alberta Farm Cash Receipts From the Sale of Livestock, 1986-2015
(1) Includes market receipts only (does not include program payments).
$'000
Supply Management
(2) In 2005, and 2009 through 2015 only includes farm cash receipts for lambs as sheep was confidential.
- 17 - Alberta Agriculture Statistics Yearbook, 2015

Cash Cash Machine
and Wages, Net Net Heating Repairs
Property Share Room Interest Interest Heating Fuel and
Taxes Rent and Board Payments Rebates Fuel Rebates Other
1986..........................................68,774 182,453 270,153 420,316 24,145 37,632 5,412 331,884
1987........................................ 70,149 154,113 297,263 437,030 16,260 28,753 2,743 312,081
1988..........................................73,023 178,018 279,957 395,963 12,532 23,547 3,975 312,724
1989.........................................77,731 193,581 299,212 389,571 10,322 26,940 2,813 349,523
1990...................................... 83,221 193,583 311,033 397,129 9,954 29,520 2,294 362,680
1991...................................... 86,581 191,491 320,431 486,373 9,378 31,561 2,600 362,209
1992........................................ 89,763 200,742 330,312 431,422 9,136 32,044 300 367,851
1993...................................... 92,579 223,028 350,243 421,382 8,907 37,215 0 388,268
1994.........................................97,347 230,911 385,411 451,622 9,308 43,312 0 419,988
1995...................................... 101,677 245,485 397,238 484,555 7,150 40,956 0 424,188
1996........................................101,840 273,794 419,792 461,133 8,108 44,167 0 434,102
1997.........................................104,985 276,068 443,858 433,811 7,370 42,956 0 428,979
1998.................................................106,035 280,876 451,559 488,807 4,956 41,254 0 423,670
1999..................................................104,975 289,707 477,408 528,940 4,010 49,524 0 443,786
2000..................................................104,965 293,230 488,071 570,609 6,109 58,734 2,700 456,002
2001...............................................…100,254 306,339 510,367 564,618 5,588 63,023 13,000 469,118
2002...............................................…95,300 317,700 528,599 515,389 5,914 55,635 199 482,612
2003...............................................…95,130 329,197 521,161 514,223 5,802 75,386 2,133 481,550
2004..............................................…95,330 325,664 514,865 496,236 5,591 74,678 3,702 488,187
2005......................................…94,337 329,745 535,821 495,519 5,076 84,020 3,511 502,229
2006...........................................................…93,709 337,219 548,607 578,406 4,837 75,454 6,279 500,754
2007....................................................…92,491 372,553 561,699 633,767 3,902 79,126 3,134 533,699
2008................................................…93,878 444,791 586,270 651,387 2,916 86,508 4,004 552,863
2009.....................................................…95,756 417,875 588,603 523,032 1,933 70,217 3,792 551,790
2010.....................................................…96,618 435,848 617,277 508,428 1,295 73,964 0 555,116
2011................................................…96,134 486,702 623,450 521,752 0 73,224 0 582,872
2012.............................................…100,171 518,762 673,326 541,708 0 60,043 0 614,930
2013r.............................................…105,180 576,400 690,159 595,324 0 65,447 0 627,229
2014r.............................................…109,387 560,368 707,413 613,588 0 82,464 0 664,863
2015p.............................................…112,997 591,747 732,173 641,430 0 65,311 0 694,782
Table 6: Alberta Farm Operating Expenses and Depreciation, 1986-2015
$'000
Source: Statistics Canada, CANSIM Database Table Number 002-0005; and Alberta Agriculture and Forestry, Statistics and Data Development Section
Alberta Agriculture Statistics Yearbook, 2015 - 18 -
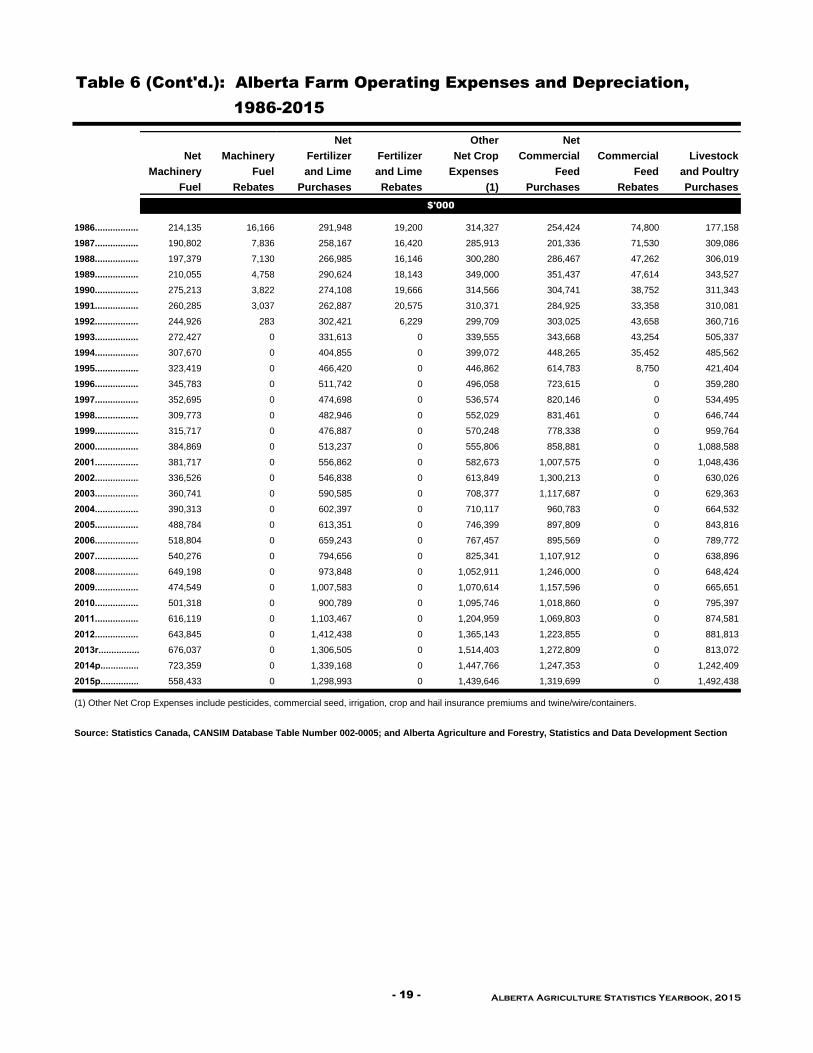
Net Other Net
Net Machinery Fertilizer Fertilizer Net Crop Commercial Commercial Livestock
Machinery Fuel and Lime and Lime Expenses Feed Feed and Poultry
Fuel Rebates Purchases Rebates (1) Purchases Rebates Purchases
1986..........................................214,135 16,166 291,948 19,200 314,327 254,424 74,800 177,158
1987........................................190,802 7,836 258,167 16,420 285,913 201,336 71,530 309,086
1988..........................................197,379 7,130 266,985 16,146 300,280 286,467 47,262 306,019
1989.........................................210,055 4,758 290,624 18,143 349,000 351,437 47,614 343,527
1990......................................275,213 3,822 274,108 19,666 314,566 304,741 38,752 311,343
1991......................................260,285 3,037 262,887 20,575 310,371 284,925 33,358 310,081
1992........................................244,926 283 302,421 6,229 299,709 303,025 43,658 360,716
1993......................................272,427 0 331,613 0 339,555 343,668 43,254 505,337
1994.........................................307,670 0 404,855 0 399,072 448,265 35,452 485,562
1995......................................323,419 0 466,420 0 446,862 614,783 8,750 421,404
1996........................................345,783 0 511,742 0 496,058 723,615 0 359,280
1997.........................................352,695 0 474,698 0 536,574 820,146 0 534,495
1998.................................................309,773 0 482,946 0 552,029 831,461 0 646,744
1999..................................................315,717 0 476,887 0 570,248 778,338 0 959,764
2000..................................................384,869 0 513,237 0 555,806 858,881 0 1,088,588
2001...............................................…381,717 0 556,862 0 582,673 1,007,575 0 1,048,436
2002...............................................…336,526 0 546,838 0 613,849 1,300,213 0 630,026
2003...............................................…360,741 0 590,585 0 708,377 1,117,687 0 629,363
2004..............................................…390,313 0 602,397 0 710,117 960,783 0 664,532
2005......................................…488,784 0 613,351 0 746,399 897,809 0 843,816
2006...........................................................…518,804 0 659,243 0 767,457 895,569 0 789,772
2007....................................................…540,276 0 794,656 0 825,341 1,107,912 0 638,896
2008................................................…649,198 0 973,848 0 1,052,911 1,246,000 0 648,424
2009.....................................................…474,549 0 1,007,583 0 1,070,614 1,157,596 0 665,651
2010.....................................................…501,318 0 900,789 0 1,095,746 1,018,860 0 795,397
2011................................................…616,119 0 1,103,467 0 1,204,959 1,069,803 0 874,581
2012.............................................…643,845 0 1,412,438 0 1,365,143 1,223,855 0 881,813
2013r.............................................…676,037 0 1,306,505 0 1,514,403 1,272,809 0 813,072
2014p.............................................…723,359 0 1,339,168 0 1,447,766 1,247,353 0 1,242,409
2015p.............................................…558,433 0 1,298,993 0 1,439,646 1,319,699 0 1,492,438
Source: Statistics Canada, CANSIM Database Table Number 002-0005; and Alberta Agriculture and Forestry, Statistics and Data Development Section
Table 6 (Cont'd.): Alberta Farm Operating Expenses and Depreciation,
1986-2015
$'000
(1) Other Net Crop Expenses include pesticides, commercial seed, irrigation, crop and hail insurance premiums and twine/wire/containers.
- 19 - Alberta Agriculture Statistics Yearbook, 2015

Operating Total Expenses
Repairs Electricity Expenses After Rebates
to Buildings and After Depreciation Depreciation Total Including
and Fences Telephone Misc. (2) Rebates on Buildings on Machinery Depreciation Depreciation
1986..........................................77,225 83,544 257,287 2,981,260 95,252 611,157 706,409 3,687,669
1987........................................98,813 83,064 273,587 3,000,157 92,528 593,927 686,455 3,686,612
1988..........................................97,155 86,472 303,969 3,107,958 91,662 594,835 686,497 3,794,455
1989.........................................93,286 92,178 354,593 3,421,258 102,907 613,341 716,248 4,137,506
1990......................................101,047 97,161 351,845 3,407,190 110,192 635,196 745,388 4,152,578
1991......................................102,381 103,834 427,886 3,541,296 107,711 618,859 726,570 4,267,866
1992........................................105,285 110,314 467,057 3,645,587 103,490 614,152 717,642 4,363,229
1993......................................115,976 119,670 472,230 4,013,191 103,495 631,920 735,415 4,748,606
1994.........................................127,565 128,366 414,159 4,344,105 113,442 672,385 785,827 5,129,932
1995......................................124,698 140,568 416,677 4,648,930 130,539 719,751 850,290 5,499,220
1996........................................136,269 148,520 419,449 4,875,544 143,410 780,346 923,756 5,799,300
1997.........................................137,813 153,901 385,953 5,126,932 160,864 827,614 988,478 6,115,410
1998.................................................134,486 146,933 379,717 5,276,290 172,513 863,876 1,036,389 6,312,679
1999..................................................136,874 151,036 434,472 5,717,676 179,748 893,053 1,072,801 6,790,477
2000..................................................143,403 161,120 470,866 6,148,381 189,743 895,230 1,084,973 7,233,354
2001...............................................…146,742 176,872 543,956 6,458,552 199,448 922,739 1,122,187 7,580,739
2002...............................................…139,953 206,182 552,304 6,321,126 205,405 906,122 1,111,527 7,432,653
2003...............................................…141,821 215,537 543,109 6,323,867 209,345 935,091 1,144,436 7,468,303
2004..............................................…143,714 205,897 562,323 6,235,036 215,690 924,891 1,140,581 7,375,617
2005......................................…148,488 206,446 582,269 6,569,034 219,253 963,359 1,182,611 7,751,645
2006...........................................................…148,480 223,638 619,313 6,756,426 221,197 973,363 1,194,559 7,950,985
2007....................................................…156,208 242,339 647,824 7,226,787 235,145 1,003,572 1,238,716 8,465,503
2008................................................…162,773 246,727 675,508 8,071,086 261,252 1,021,176 1,282,428 9,353,513
2009.....................................................…159,014 229,412 690,412 7,702,104 258,619 1,077,108 1,335,727 9,037,831
2010.....................................................…160,918 225,973 748,406 7,734,658 265,365 1,057,933 1,323,298 9,057,957
2011................................................…154,481 250,197 834,307 8,492,047 269,619 1,123,378 1,392,998 9,885,045
2012.............................................…164,522 271,122 841,471 9,313,149 281,138 1,173,316 1,454,453 10,767,602
2013r.............................................…169,458 268,166 856,768 9,536,957 291,361 1,236,326 1,527,688 11,064,645
2014p.............................................…177,931 264,948 933,610 10,114,626 295,694 1,307,277 1,602,971 11,717,597
2015p.............................................…182,379 246,641 969,823 10,346,492 296,265 1,421,595 1,717,860 12,064,351
Source: Statistics Canada, CANSIM Database Table Number 002-0005; and Alberta Agriculture and Forestry, Statistics and Data Development Section
Table 6 (Cont'd.): Alberta Farm Operating Expenses and Depreciation,
1986-2015
$'000
(2) Miscellaneous expenses include business insurance, custom work, stabilization premiums, artificial insemination and veterinary fees, legal and accounting fees
and other expenses, less any other rebates.
Alberta Agriculture Statistics Yearbook, 2015 - 20 -

1 2 3 4 5 6 7 8
Operating (1-2) (3+4-5) (6+7)
Total Expenses Net Income Realized Value of Total
Farm Cash After Cash in Depreciation Net Inventory Net Farm
Receipts Rebates Income Kind Charges Income Change Income
1986......................... 3,783,639 2,981,260 802,379 15,901 706,409 111,871 471,085 582,956
1987....................... 4,038,789 3,000,157 1,038,632 13,685 686,455 365,862 23,555 389,417
1988......................... 4,467,340 3,107,958 1,359,382 13,229 686,497 686,114 85,899 772,013
1989........................ 4,599,469 3,421,258 1,178,211 13,130 716,248 475,093 99,799 574,892
1990..................... 4,283,091 3,407,190 875,901 13,139 745,388 143,652 202,391 346,043
1991..................... 4,234,918 3,541,296 693,622 12,326 726,570 -20,622 164,210 143,588
1992....................... 4,956,259 3,645,587 1,310,672 12,830 717,642 605,860 -160,060 445,800
1993..................... 5,064,027 4,013,191 1,050,836 14,955 735,415 330,376 601,179 931,555
1994........................ 5,581,321 4,344,105 1,237,216 15,549 785,827 466,938 103,018 569,956
1995..................... 5,969,065 4,648,930 1,320,135 15,153 850,290 484,998 396,563 881,561
1996....................... 6,528,207 4,875,544 1,652,663 16,518 923,756 745,425 13,800 759,225
1997........................ 6,464,646 5,126,932 1,337,714 9,305 988,478 358,541 -61,562 296,979
1998...............................6,418,118 5,276,290 1,141,828 8,631 1,036,389 114,070 190,282 304,352
1999..................................6,530,826 5,717,676 813,150 8,402 1,072,801 -251,249 491,929 240,680
2000..................................7,583,288 6,148,381 1,434,907 9,048 1,084,973 358,982 29,821 388,803
2001..............………………..8,368,417 6,458,552 1,909,865 8,977 1,122,187 796,655 -258,676 537,979
2002..............……………….8,315,809 6,321,126 1,994,683 8,386 1,111,527 891,542 -1,066,029 -174,487
2003..............………………….7,101,628 6,323,867 777,761 8,302 1,144,436 -358,373 941,157 582,784
2004..............…………………8,013,369 6,235,036 1,778,333 10,880 1,140,581 648,632 507,193 1,155,825
2005..............……………………7,905,783 6,569,034 1,336,750 14,449 1,182,611 168,588 287,055 455,642
2006..............…………………..7,779,064 6,756,426 1,022,638 10,876 1,194,559 -161,045 -286,598 -447,642
2007..............…………………..8,691,514 7,226,787 1,464,727 8,154 1,238,716 234,164 -289,055 -54,891
2008..............………………….10,178,520 8,071,086 2,107,434 8,051 1,282,428 833,057 738,440 1,571,498
2009..............…………………..9,326,081 7,702,104 1,623,977 7,011 1,335,727 295,261 -623,961 -328,700
2010..............……………………9,000,917 7,734,658 1,266,258 7,497 1,323,298 -49,543 321,963 272,420
2011..............…………………..10,289,441 8,492,047 1,797,394 8,728 1,392,998 413,124 526,436 939,560
2012..............………………..11,945,828 9,313,149 2,632,679 8,653 1,454,453 1,186,878 -517,981 668,897
2013r..............…………………11,844,104 9,536,957 2,307,146 9,296 1,527,688 788,755 1,727,135 2,515,890
2014r..............……………..12,898,011 10,114,626 2,783,385 11,936 1,602,971 1,192,350 -835,301 357,049
2015p..............……………..13,554,060 10,346,492 3,207,569 13,280 1,717,860 1,502,989 -671,583 831,406
Table 7: Alberta Net Farm Income, 1986-2015
$'000
Source: Statistics Canada, CANSIM Database Table Numbers 002-0001, 002-0005, and 002-0009; and Alberta Agriculture and Forestry, Statistics and
Data Development Section
- 21 - Alberta Agriculture Statistics Yearbook, 2015

Total Value of
Livestock Land Machinery Farm Farm Land and
and Poultry and Buildings and Equipment Capital Buildings (1)
$/Acre
1986......................... 2,375,837 20,773,520 5,382,284 28,531,641 407
1987....................... 2,796,853 19,744,120 5,409,712 27,950,685 386
1988......................... 3,048,758 19,159,142 5,523,052 27,730,952 374
1989........................ 3,236,197 21,091,994 5,790,087 30,118,278 411
1990..................... 3,351,948 22,169,169 6,124,730 31,645,847 432
1991..................... 3,499,557 21,291,475 6,079,438 30,870,470 414
1992....................... 3,394,565 20,798,399 5,982,777 30,175,741 405
1993..................... 4,087,167 21,147,301 6,209,895 31,444,363 413
1994........................ 4,637,627 23,017,810 6,640,116 34,295,553 450
1995..................... 4,191,096 26,302,921 7,109,304 37,603,321 515
1996....................... 3,792,358 28,696,985 7,458,676 39,948,019 553
1997........................ 4,581,994 31,761,777 7,767,975 44,111,746 611
1998.............................. 4,766,483 34,217,431 8,258,258 47,242,172 658
1999...................................... 5,235,172 35,894,547 8,545,928 49,675,647 690
2000........................................ 6,294,818 37,520,833 8,588,902 52,404,553 721
2001..............…………………… 6,872,033 38,872,514 8,684,163 54,428,710 747
2002..............……………………… 5,938,611 41,970,588 8,902,738 56,811,937 806
2003..............……………………… 4,745,685 44,950,634 9,072,927 58,769,246 863
2004..............…………………… 3,791,175 48,505,355 9,219,494 61,516,024 931
2005..............……………………….4,650,202 52,739,434 9,467,913 66,857,549 1,012
2006..............…………………….. 5,415,571 57,101,345 9,680,138 72,197,054 1,095
2007..............……………………….5,188,070 62,315,967 9,826,559 77,330,596 1,203
2008..............……………………. 4,469,827 71,100,340 9,961,453 85,531,619 1,381
2009..............……………………. 4,314,929 72,947,427 10,188,996 87,451,352 1,426
2010..............……………………… 4,474,378 76,932,467 10,600,968 92,007,812 1,514
2011..............…………………….. 5,686,741 80,371,125 10,933,208 96,991,073 1,592
2012..............…………………….. 6,236,200 87,296,486 11,434,688 104,967,374 1,725
2013..............…………………….. 5,818,758 98,138,012 12,134,132 116,090,902 1,934
2014r..............…………………… 8,518,443 106,399,668 12,777,401 127,695,512 2,092
2015p..............…………………… 10,786,227 116,325,913 13,495,800 140,607,940 2,282
Source: Statistics Canada, CANSIM Database Table Numbers 002-0003 and 002-0007; and Alberta Agriculture and Forestry, Statistics and Data
Development Section
Table 8: Value of Alberta Farm Capital and Value Per Acre of Farm Land
and Buildings, at July 1, 1986-2015
$'000
(1) Value per acre of farm land and buildings, at July 1, reflects the value of all farm land, including pasture and unimproved land, plus the value of farm houses,
buildings, and other structures.
Alberta Agriculture Statistics Yearbook, 2015 - 22 -

Federal Provincial
Gov't Gov't Advance Total
Chartered Agencies Agencies Credit Payment Debt at
Banks (1) (2) Unions Other (3) Programs Year End
1986......................... 2,281,000 754,509 1,692,152 187,000 540,237 92,748 5,547,646
1987....................... 2,353,990 663,140 1,698,125 181,000 513,730 81,298 5,491,283
1988......................... 2,385,487 568,601 1,735,406 146,000 547,821 85,954 5,469,269
1989........................ 2,611,875 487,126 1,899,786 176,000 547,821 21,397 5,744,005
1990..................... 2,669,062 428,274 1,930,615 216,750 615,308 318,985 6,178,994
1991..................... 2,868,250 409,507 1,994,467 222,000 615,308 291,912 6,401,444
1992....................... 2,787,663 386,705 1,971,709 228,500 594,548 257,810 6,226,935
1993..................... 2,957,253 370,798 1,974,000 236,000 576,623 244,935 6,359,609
1994........................ 3,078,729 384,142 1,963,940 249,750 578,059 144,294 6,398,914
1995..................... 3,177,512 449,450 1,950,592 278,750 630,834 145,580 6,632,718
1996....................... 3,247,877 550,539 1,810,124 311,500 798,809 175,356 6,894,205
1997........................ 3,673,817 702,042 1,741,163 344,250 965,123 113,846 7,540,241
1998............................................4,137,918 806,589 1,753,953 389,500 969,355 116,561 8,173,876
1999.........................................4,456,500 927,045 1,793,995 411,257 985,014 118,617 8,692,428
2000........................................4,613,459 951,550 1,976,111 458,031 1,030,569 132,329 9,162,049
2001..............………………………4,675,587 1,076,162 2,114,858 508,550 1,076,122 109,799 9,561,078
2002..............………………………4,775,517 1,182,368 2,171,862 554,094 1,181,570 50,904 9,916,315
2003..............………………………5,046,257 1,366,847 2,333,345 604,241 1,155,822 106,754 10,613,266
2004..............…………………………5,029,303 1,610,617 2,247,985 650,994 1,256,157 85,938 10,880,994
2005..............……………………………5,029,246 1,895,609 2,253,519 673,517 1,017,811 109,656 10,979,358
2006..............………………………5,080,269 2,168,670 2,303,300 711,918 1,179,664 138,825 11,582,646
2007..............……………………………….5,135,147 2,460,342 2,333,473 724,204 1,127,318 129,774 11,910,258
2008..............…………………………5,470,315 2,866,816 2,390,460 732,039 1,468,244 219,358 13,147,232
2009..............…………………………..5,186,997 3,384,132 2,495,938 692,847 1,835,466 202,081 13,797,461
2010..............…………………………..5,759,885 3,667,581 2,629,920 684,144 1,670,056 173,830 14,585,416
2011..............…………………………6,025,203 3,956,736 2,845,357 692,342 1,230,606 192,159 14,942,403
2012..............………………………….5,971,910 4,348,093 3,239,532 722,024 1,588,015 156,949 16,026,523
2013r..............…………………………6,461,091 4,529,680 3,625,182 779,697 2,219,793 352,152 17,967,595
2014r..............………………………..7,068,461 4,710,953 4,216,986 796,280 1,749,525 386,885 18,929,090
2015p..............………………………..7,778,375 4,823,147 4,698,393 853,107 1,939,768 345,927 20,438,717
Source: Statistics Canada, CANSIM Database Table Number 002-0008; and Alberta Agriculture and Forestry, Statistics and Data Development Section
(3) Includes insurance, trust companies, supply companies, private individuals and others.
Table 9: Alberta Farm Debt Outstanding by Lender, at December 31,
1986-2015
$'000
(2) Includes loans made through Alberta Treasury Branches and the Alberta Agriculture Financial Services Corporation.
(1) Includes loans made through the Farm Credit Corporation and Business Development Bank of Canada.
- 23 - Alberta Agriculture Statistics Yearbook, 2015


Page No.
Table No.
10. Population of Canada and Provinces on July 1, 2001-2015…………………………………………………………………………..26
11. Alberta Urban and Rural Population, 1976-2011…………………………………..…………………………………………………………..…………………………………………………..……………………………………………………..…………………….…………………….…………………….………………………………………….……………..……………..26
12. Alberta Employed Labour Force in Agri-Food Industries, 1996-2015………………………………………………………………….27
13. Selected Economic Indicators, Canada and Alberta, 1979-2015…………………………………..……………………………………28
14. Alberta Gross Domestic Product (GDP) for Agri-Food Industries
In Chained (2007) Dollars, 2009-2015...……………………………………………………………………………………………..29
15. Capital Investment Expenditures in Alberta Agri-Food Industries, 2007-2015…………………………..…………………………………………………….30
16. Alberta Average Hourly Wage Rates for Agriculture and Other Major Industries, 2011-2015……………………………………………………………………………………………...……………31
17. Farm Bankruptcies, Canada and Provinces, 1996-2015………...……………………………………….……………………………………………….31
18. Alberta Average Farm Input Prices, 2014 and 2015 ………………………………………………………………………………………………………………32
19. Alberta Agricultural Real Estate Average Value by C.L.I., 1996-2015……………………………………………………………………33
20. Average Alberta Agricultural Land Values by C.L.I. and Municipality, 2015……………………………………………………………………34
E
C
O
N
O
M
I
C
I
N
D
I
C
A
T
O
R
S
- 25 - Alberta Agriculture Statistics Yearbook, 2015
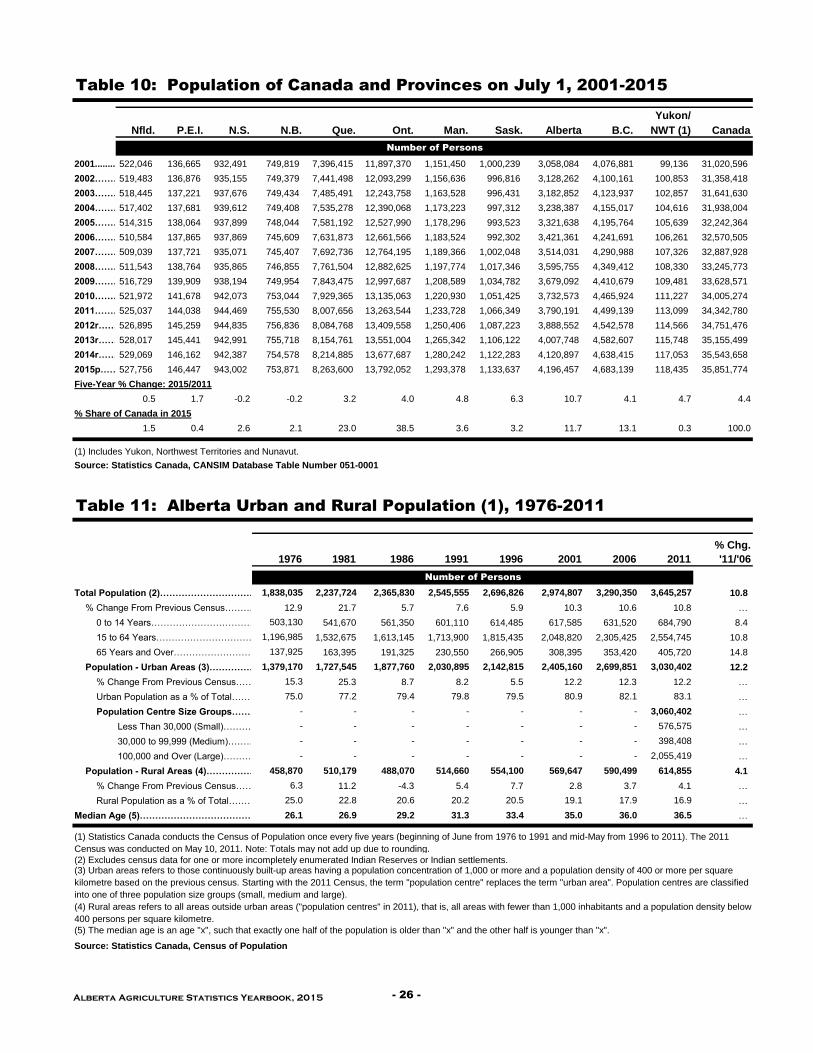
Yukon/
Nfld. P.E.I. N.S. N.B. Que. Ont. Man. Sask. Alberta B.C. NWT (1) Canada
2001.................522,046 136,665 932,491 749,819 7,396,415 11,897,370 1,151,450 1,000,239 3,058,084 4,076,881 99,136 31,020,596
2002………………………………519,483 136,876 935,155 749,379 7,441,498 12,093,299 1,156,636 996,816 3,128,262 4,100,161 100,853 31,358,418
2003…………………………………………….518,445 137,221 937,676 749,434 7,485,491 12,243,758 1,163,528 996,431 3,182,852 4,123,937 102,857 31,641,630
2004………………….517,402 137,681 939,612 749,408 7,535,278 12,390,068 1,173,223 997,312 3,238,387 4,155,017 104,616 31,938,004
2005………………………..514,315 138,064 937,899 748,044 7,581,192 12,527,990 1,178,296 993,523 3,321,638 4,195,764 105,639 32,242,364
2006………………………..510,584 137,865 937,869 745,609 7,631,873 12,661,566 1,183,524 992,302 3,421,361 4,241,691 106,261 32,570,505
2007………………………..509,039 137,721 935,071 745,407 7,692,736 12,764,195 1,189,366 1,002,048 3,514,031 4,290,988 107,326 32,887,928
2008……………………..511,543 138,764 935,865 746,855 7,761,504 12,882,625 1,197,774 1,017,346 3,595,755 4,349,412 108,330 33,245,773
2009………………….516,729 139,909 938,194 749,954 7,843,475 12,997,687 1,208,589 1,034,782 3,679,092 4,410,679 109,481 33,628,571
2010……………………..521,972 141,678 942,073 753,044 7,929,365 13,135,063 1,220,930 1,051,425 3,732,573 4,465,924 111,227 34,005,274
2011……………………..525,037 144,038 944,469 755,530 8,007,656 13,263,544 1,233,728 1,066,349 3,790,191 4,499,139 113,099 34,342,780
2012r…………………..526,895 145,259 944,835 756,836 8,084,768 13,409,558 1,250,406 1,087,223 3,888,552 4,542,578 114,566 34,751,476
2013r………………………………..528,017 145,441 942,991 755,718 8,154,761 13,551,004 1,265,342 1,106,122 4,007,748 4,582,607 115,748 35,155,499
2014r………………………………..529,069 146,162 942,387 754,578 8,214,885 13,677,687 1,280,242 1,122,283 4,120,897 4,638,415 117,053 35,543,658
2015p…….527,756 146,447 943,002 753,871 8,263,600 13,792,052 1,293,378 1,133,637 4,196,457 4,683,139 118,435 35,851,774
Five-Year % Change: 2015/2011
0.5 1.7 -0.2 -0.2 3.2 4.0 4.8 6.3 10.7 4.1 4.7 4.4
% Share of Canada in 2015
1.5 0.4 2.6 2.1 23.0 38.5 3.6 3.2 11.7 13.1 0.3 100.0
(1) Includes Yukon, Northwest Territories and Nunavut.
1976 1981 1986 1991 1996 2001 2006 2011
% Chg.
'11/'06
Total Population (2)…………………………………1,838,035 2,237,724 2,365,830 2,545,555 2,696,826 2,974,807 3,290,350 3,645,257 10.8
% Change From Previous Census…………………………………..12.9 21.7 5.7 7.6 5.9 10.3 10.6 10.8 …
0 to 14 Years……………………………………………………..503,130 541,670 561,350 601,110 614,485 617,585 631,520 684,790 8.4
15 to 64 Years……………………………………………………………….1,196,985 1,532,675 1,613,145 1,713,900 1,815,435 2,048,820 2,305,425 2,554,745 10.8
65 Years and Over……………………………………………………………………….137,925 163,395 191,325 230,550 266,905 308,395 353,420 405,720 14.8
Population - Urban Areas (3)………………………………………………………………1,379,170 1,727,545 1,877,760 2,030,895 2,142,815 2,405,160 2,699,851 3,030,402 12.2
% Change From Previous Census………………………………………………………….15.3 25.3 8.7 8.2 5.5 12.2 12.3 12.2 …
Urban Population as a % of Total……………………………………………………………..75.0 77.2 79.4 79.8 79.5 80.9 82.1 83.1 …
Population Centre Size Groups………………………………………………………………………..- - - - - - - 3,060,402 …
Less Than 30,000 (Small)………………………………………………………………….- - - - - - - 576,575 …
30,000 to 99,999 (Medium)………………………………………………………………..- - - - - - - 398,408 …
100,000 and Over (Large)……………………………………………………………………..- - - - - - - 2,055,419 …
Population - Rural Areas (4)……………………………………………………………….458,870 510,179 488,070 514,660 554,100 569,647 590,499 614,855 4.1
% Change From Previous Census…………………………………………………………………………………………..6.3 11.2 -4.3 5.4 7.7 2.8 3.7 4.1 …
Rural Population as a % of Total…………………………………………………………………………….25.0 22.8 20.6 20.2 20.5 19.1 17.9 16.9 …
Median Age (5)…………………………………………………………………………………………..26.1 26.9 29.2 31.3 33.4 35.0 36.0 36.5 …
(2) Excludes census data for one or more incompletely enumerated Indian Reserves or Indian settlements.
Table 10: Population of Canada and Provinces on July 1, 2001-2015
(3) Urban areas refers to those continuously built-up areas having a population concentration of 1,000 or more and a population density of 400 or more per square
kilometre based on the previous census. Starting with the 2011 Census, the term "population centre" replaces the term "urban area". Population centres are classified
into one of three population size groups (small, medium and large).
(4) Rural areas refers to all areas outside urban areas ("population centres" in 2011), that is, all areas with fewer than 1,000 inhabitants and a population density below
400 persons per square kilometre.
(5) The median age is an age "x", such that exactly one half of the population is older than "x" and the other half is younger than "x".
Source: Statistics Canada, Census of Population
Number of Persons
Source: Statistics Canada, CANSIM Database Table Number 051-0001
Table 11: Alberta Urban and Rural Population (1), 1976-2011
Number of Persons
(1) Statistics Canada conducts the Census of Population once every five years (beginning of June from 1976 to 1991 and mid-May from 1996 to 2011). The 2011
Census was conducted on May 10, 2011. Note: Totals may not add up due to rounding.
Alberta Agriculture Statistics Yearbook, 2015 - 26 -

Agriculture Industries
Total
1996.......................1,405.6 26.3 40.1 29.9 10.2 24.6 1.5 92.5 106.8 19.5 112.0
1997........................1,453.2 24.5 41.1 31.4 9.7 20.2 3.1 88.9 118.2 19.1 108.0
1998........................1,508.9 25.8 42.8 31.8 11.0 19.1 2.2 90.0 125.4 20.2 110.2
1999.…………...1,543.2 27.2 42.2 29.9 12.3 10.3 2.1 81.8 134.7 18.3 100.1
2000.................1,583.1 20.8 40.7 28.8 11.9 7.7 - 70.6 137.6 18.9 89.5
2001.................1,627.4 16.5 33.0 20.6 12.4 8.6 1.5 59.5 139.2 22.1 81.6
2002.................1,673.8 15.4 35.5 23.5 12.0 7.2 2.3 60.4 147.6 28.3 88.7
2003…………………………………………….1,729.0 20.6 37.3 25.6 11.7 5.3 2.2 65.3 147.1 25.3 90.6
2004………………….1,774.8 17.2 41.0 29.7 11.3 5.5 1.5 65.2 146.6 26.2 91.4
2005………………………..1,820.4 17.3 28.7 20.7 8.0 8.5 - 55.9 134.4 22.4 78.3
2006………………………..1,911.6 14.1 27.2 18.4 8.8 9.3 1.8 52.4 140.9 27.4 79.8
2007………………………..1,991.0 14.8 26.9 18.5 8.4 6.2 1.9 49.8 144.4 22.7 72.5
2008……………………..2,053.9 15.7 35.8 25.0 10.8 4.9 3.0 59.3 140.3 23.0 82.3
2009………………….2,029.7 19.3 32.1 21.6 10.5 4.9 1.9 58.3 123.4 20.7 79.0
2010……………………..2,023.7 19.1 24.9 17.2 7.7 5.4 2.0 51.4 125.2 22.6 74.0
2011……………………..2,099.5 17.2 31.9 20.0 11.9 4.1 2.1 55.3 133.7 20.1 75.4
2012……………………..2,172.5 22.1 28.2 17.0 11.2 3.8 2.2 56.3 137.6 19.5 75.8
2013……………………..2,226.2 26.9 29.0 17.6 11.4 3.9 3.5 63.4 142.7 27.4 90.8
2014………………………………..2,274.6 24.8 28.2 16.5 11.7 5.4 2.2 60.6 144.5 25.5 86.1
2015p…. 2,301.1 18.6 33.8 17.6 16.2 6.8 3.7 62.8 139.9 26.4 89.2
% Share of All Industries in 2015
100.0 0.8 1.5 0.8 0.7 0.3 0.2 2.7 6.1 1.1 3.9
Note: Totals may not add up due to rounding.
Animal Production
Mixed
Farming
Industries
Table 12: Alberta Employed Labour Force (1) in Agri-Food Industries,
1996-2015
Total
Manu-
facturing
Cattle
Ranching
and
Farming
Total Agri-
Food
Industries
Manufacturing
Total
Agriculture
All
Industries
Source: Statistics Canada, CANSIM Database Table Number 282-0008; and Labour Statistics Division
(1) Annual averages for employed labour force refers to persons 15 years of age and over who (a) did any work during the reference period or (b) had a job but
were not at work due to illness or disability; personal or family responsibilities; bad weather; labour disputes; vacation; or other reasons not specified. Work
includes any work for pay or profit. It also includes unpaid family work which contributes directly to the operation of a farm, business or professional practice
owned or operated by a related member of the household.
Food and
Beverage
Crop
Production
Other
Animal
Production
Support
Activities
Source: Statistics Canada, CANSIM Database Table Number 282-0008; and Labour Statistics Division
'000s of Persons
0
5
10
15
20
25
30
35
40
2006 2007 2008 2009 2010 2011 2012 2013 2014 2015
'00
0s
of
Pe
rso
ns
Animal Production
Crop Production
Fig. 6 Employment in Alberta Agriculture Industries, 2006-2015
Other Agriculture
- 27 - Alberta Agriculture Statistics Yearbook, 2015

Bank Rate (2) Prime Rate (3) Canada$ per US$ US$ per Canada$
All Items
Index % Change
All Items
Index % Change1979................................…...........................…................................................................40.0 40.0 12.10 12.90 1.1714 0.8537
1980...........................................…...................................…....................44.0 10.0 44.1 10.3 12.89 14.25 1.1692 0.8553
1981........................................…...............................…....................49.5 12.5 49.8 12.9 17.93 19.29 1.1989 0.8341
1982........................................….................................…...................54.9 10.9 55.4 11.2 13.96 15.81 1.2337 0.8105
1983........................................…....................................…................58.1 5.8 58.3 5.2 9.55 11.17 1.2324 0.8114
1984........................................….....................................…..............60.6 4.3 59.8 2.6 11.31 12.06 1.2951 0.7722
1985........................................…..................................…...................63.0 4.0 61.6 3.0 9.65 10.58 1.3655 0.7323
1986........................................…...............................….....................65.6 4.1 63.7 3.4 9.21 10.52 1.3895 0.7197
1987....................................................68.5 4.4 66.3 4.1 8.40 9.52 1.3260 0.7542
1988...................................…...........................…..............................................................71.2 3.9 68.1 2.7 9.69 10.83 1.2307 0.8125
1989........................................…...................................….....................74.8 5.1 70.9 4.1 12.29 13.33 1.1840 0.8446
1990...............................….....................78.4 4.8 75.0 5.8 13.05 14.06 1.1668 0.8571
1991....................................…...............82.8 5.6 79.4 5.9 9.03 9.94 1.1457 0.8728
1992...............................….......................84.0 1.4 80.6 1.5 6.78 7.48 1.2087 0.8273
1993.........................…............................85.6 1.9 81.4 1.0 5.09 5.94 1.2901 0.7751
1994...................................…...................85.7 0.1 82.6 1.5 5.77 6.88 1.3657 0.7322
1995..............................…...................87.6 2.2 84.5 2.3 7.31 8.65 1.3724 0.7286
1996..................................…...................88.9 1.5 86.4 2.2 4.53 6.06 1.3635 0.7334
1997...........................….........................90.4 1.7 88.1 2.0 3.52 4.96 1.3846 0.7222
1998...............................…...........................….................................................................91.3 1.0 89.2 1.2 5.10 6.60 1.4835 0.6741
1999.......................................…................92.9 1.8 91.4 2.5 4.92 6.44 1.4857 0.6731
2000...............................…...........................95.4 2.7 94.5 3.4 5.77 7.27 1.4854 0.6732
2001……...........................…...........................….........................……………………………..97.8 2.5 96.7 2.3 4.31 5.81 1.5488 0.6456
2002………...........................…...........................….........................…………………………..100.0 2.2 100.0 3.4 2.71 4.21 1.5703 0.6368
2003…………...........................…...........................….........................………………………..102.8 2.8 104.4 4.4 3.19 4.69 1.4010 0.7138
2004…………...........................…...........................….........................………………………..104.7 1.8 105.9 1.4 2.50 4.00 1.3013 0.7685
2005…………...........................…...........................….........................………………………..107.0 2.2 108.1 2.1 2.92 4.42 1.2114 0.8255
2006…………...........................…...........................….........................………………………..109.1 2.0 112.3 3.9 4.31 5.81 1.1343 0.8816
2007…………...........................…...........................….........................………………………..111.5 2.2 117.9 5.0 4.60 6.10 1.0740 0.9311
2008…………...........................…...........................….........................………………………..114.1 2.3 121.6 3.1 3.21 4.73 1.0671 0.9371
2009…………...........................…...........................….........................………………………..114.4 0.3 121.5 -0.1 0.65 2.40 1.1415 0.8760
2010…………...........................…...........................….........................………………………..116.5 1.8 122.7 1.0 0.85 2.60 1.0301 0.9708
2011…………...........................…...........................….........................………………………..119.9 2.9 125.7 2.4 1.25 3.00 0.9893 1.0108
2012…………...........................…...........................….........................………………………..121.7 1.5 127.1 1.1 1.25 3.00 0.9994 1.0006
2013…………...........................…...........................….........................………………………..122.8 0.9 128.9 1.4 1.25 3.00 1.0301 0.9708
2014…………...........................…...........................….........................………………………..125.2 2.0 132.2 2.6 1.25 3.00 1.1047 0.9052
2015…………...........................…...........................….........................………………………..126.6 1.1 133.7 1.1 0.88 2.78 1.2788 0.7820
(2) The Bank Rate is the minimum rate at which the Bank of Canada makes short-term advances to the chartered banks.
(3) The Canada Prime Rate or the Chartered Bank Rate on Prime Business Loans is the rate charged to the most credit-worthy borrowers.
Source: Statistics Canada, CANSIM Database Table Numbers 326-0021 and 176-0064; and Bank of Canada Review
Source: Bank of Canada Review
Table 13: Selected Economic Indicators, Canada and Alberta, 1979-2015
(1) The Consumer Price Index (CPI) measures the percentage change through time in the cost of purchasing a constant "basket" of goods and services
representing the purchases by a particular population group in a specified time period. The All Items Index includes these components: food; shelter;
household operations and furnishings; clothing and footwear; transportation; health and personal care; recreation; education and reading; and alcoholic
beverages and tobacco products.
Canada - United States
Exchange RateCanada Interest Rates
Canada Alberta
Consumer Price Index (2002=100) (1)
0.5000
0.6000
0.7000
0.8000
0.9000
1.0000
1.1000
1991 1993 1995 1997 1999 2001 2003 2005 2007 2009 2011 2013 2015
US
$ p
er
Ca
na
da
$
Fig. 7 Canada - U.S. Exchange Rate (US$ per Canada$), 1991-2015
Alberta Agriculture Statistics Yearbook, 2015 - 28 -
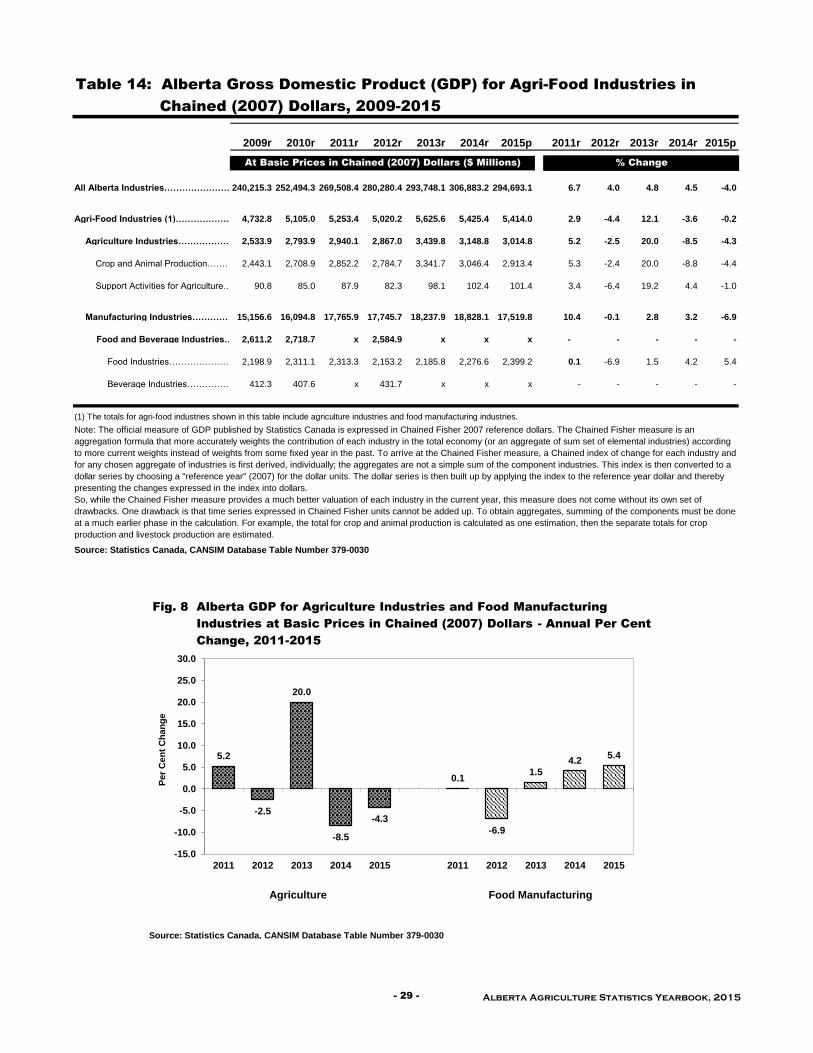
2009r 2010r 2011r 2012r 2013r 2014r 2015p 2011r 2012r 2013r 2014r 2015p
All Alberta Industries…………………………………..240,215.3 252,494.3 269,508.4 280,280.4 293,748.1 306,883.2 294,693.1 6.7 4.0 4.8 4.5 -4.0
Agri-Food Industries (1)……………………………………………………………………. 4,732.8 5,105.0 5,253.4 5,020.2 5,625.6 5,425.4 5,414.0 2.9 -4.4 12.1 -3.6 -0.2
Agriculture Industries………………………………………………2,533.9 2,793.9 2,940.1 2,867.0 3,439.8 3,148.8 3,014.8 5.2 -2.5 20.0 -8.5 -4.3
Crop and Animal Production………………………………………….2,443.1 2,708.9 2,852.2 2,784.7 3,341.7 3,046.4 2,913.4 5.3 -2.4 20.0 -8.8 -4.4
Support Activities for Agriculture…………………………………………90.8 85.0 87.9 82.3 98.1 102.4 101.4 3.4 -6.4 19.2 4.4 -1.0
Manufacturing Industries………………………………………..15,156.6 16,094.8 17,765.9 17,745.7 18,237.9 18,828.1 17,519.8 10.4 -0.1 2.8 3.2 -6.9
Food and Beverage Industries…………………………………………….2,611.2 2,718.7 x 2,584.9 x x x - - - - -
Food Industries……………………………………………..2,198.9 2,311.1 2,313.3 2,153.2 2,185.8 2,276.6 2,399.2 0.1 -6.9 1.5 4.2 5.4
Beverage Industries………………………………………………412.3 407.6 x 431.7 x x x - - - - -
Source: Statistics Canada, CANSIM Database Table Number 379-0030
Source: Statistics Canada, CANSIM Database Table Number 379-0030
Note: The official measure of GDP published by Statistics Canada is expressed in Chained Fisher 2007 reference dollars. The Chained Fisher measure is an
aggregation formula that more accurately weights the contribution of each industry in the total economy (or an aggregate of sum set of elemental industries) according
to more current weights instead of weights from some fixed year in the past. To arrive at the Chained Fisher measure, a Chained index of change for each industry and
for any chosen aggregate of industries is first derived, individually; the aggregates are not a simple sum of the component industries. This index is then converted to a
dollar series by choosing a "reference year" (2007) for the dollar units. The dollar series is then built up by applying the index to the reference year dollar and thereby
presenting the changes expressed in the index into dollars.
So, while the Chained Fisher measure provides a much better valuation of each industry in the current year, this measure does not come without its own set of
drawbacks. One drawback is that time series expressed in Chained Fisher units cannot be added up. To obtain aggregates, summing of the components must be done
at a much earlier phase in the calculation. For example, the total for crop and animal production is calculated as one estimation, then the separate totals for crop
production and livestock production are estimated.
% ChangeAt Basic Prices in Chained (2007) Dollars ($ Millions)
(1) The totals for agri-food industries shown in this table include agriculture industries and food manufacturing industries.
Table 14: Alberta Gross Domestic Product (GDP) for Agri-Food Industries in
Chained (2007) Dollars, 2009-2015
5.2
-2.5
20.0
-8.5
-4.3
0.1
-6.9
1.5
4.25.4
-15.0
-10.0
-5.0
0.0
5.0
10.0
15.0
20.0
25.0
30.0
2011 2012 2013 2014 2015 2011 2012 2013 2014 2015
Per
Cen
t C
han
ge
Fig. 8 Alberta GDP for Agriculture Industries and Food Manufacturing
Industries at Basic Prices in Chained (2007) Dollars - Annual Per Cent
Change, 2011-2015
Agriculture Food Manufacturing
- 29 - Alberta Agriculture Statistics Yearbook, 2015

Food Total
All Alberta Total and Crop Animal Support Total Agri-Food
Industries Manuf. Food Beverage Beverage Production Production Services Agriculture Industries (3)
2007………………………..62,158.6 2,620.7 105.1 26.3 131.4 447.6 467.2 37.3 952.1 1,083.5
2008……………………..69,969.8 2,844.7 91.7 26.3 118.0 456.5 476.5 19.9 952.9 1,070.9
2009………………….49,516.0 1,364.0 93.9 15.7 109.6 724.1 338.2 18.7 1,081.0 1,190.6
2010……………………..61,228.2 1,295.3 48.5 23.1 71.6 724.1 338.1 26.6 1,088.8 1,160.4
2011……………………..70,389.3 1,641.9 63.5 26.1 89.6 920.5 300.2 45.0 1,265.7 1,355.3
2012……………………..78,605.8 1,526.4 145.5 16.6 162.1 982.1 295.7 22.9 1,300.7 1,462.8
2013……………………..91,681.7 2,091.7 187.9 26.6 214.5 1,202.5 338.3 28.9 1,569.7 1,784.2
2014r……….. 97,800.2 2,473.8 224.7 31.1 255.8 1,220.5 367.1 x 1,587.6 1,843.4
2015p…… 74,926.5 2,508.1 168.8 44.8 213.6 1,226.6 374.4 11.6 1,612.6 1,826.2
% Share of All Industries in 2015
100.0 3.3 0.2 0.1 0.3 1.6 0.5 0.0 2.2 2.4
2008……………………..12.6 8.5 -12.7 0.0 -10.2 2.0 2.0 -46.6 0.1 -1.2
2009………………….-29.2 -52.1 2.4 -40.3 -7.1 58.6 -29.0 -6.0 13.4 11.2
2010……………………..23.7 -5.0 -48.3 47.1 -34.7 0.0 0.0 42.2 0.7 -2.5
2011……………………..15.0 26.8 30.9 13.0 25.1 27.1 -11.2 69.2 16.2 16.8
2012……………………..11.7 -7.0 129.1 -36.4 80.9 6.7 -1.5 -49.1 2.8 7.9
2013……………………..16.6 37.0 29.1 60.2 32.3 22.4 14.4 26.2 20.7 22.0
2014r……… 6.7 18.3 19.6 16.9 19.3 1.5 8.5 - 1.1 3.3
2015p……… -23.4 1.4 -24.9 44.1 -16.5 0.5 2.0 - 1.6 -0.9
Source: Statistics Canada Cat. No. 61-205-X, "Private and Public Investment in Canada, Intentions 2013"
Table 15: Capital Investment Expenditures in Alberta Agri-Food
Source: Statistics Canada, CANSIM Database Table Number 029-0045
$ Millions
% Change From Previous Year
Capital investment expenditures refers to the cost of procuring, constructing and installing new durable plant and machinery and equipment, whether for
replacement of worn or obsolete assets, as additions to existing assets or for lease or rent to others. Also included are all capitalized costs such as feasibility
studies, architectural, legal, installation and engineering fees, the value of capital assets put in place by firms either by contract or with their own labour force, as
well as the capitalized interest charges on loans with which capital projects are financed. Gross outlays have been reported without any deduction for scrap, trade-
in value of old assets and include any grants and/or subsidies received.
(3) Agri-food industries is the sum of food and beverage manufacturing industries plus agriculture industries.
(1) Statistics Canada conducts The Capital and Repair Expenditure Survey (CAPEX) to generate data on investment made in Canada in all types of industries.
Information on capital expenditures provides a useful indication of market conditions in the economy as a whole and in specific industries. Statistics Canada has
undertaken a comprehensive redesign of CAPEX. For more information on conceptual and methodological changes, access Statistics Canada website at:
http://www23.statcan.gc.ca/imdb-bmdi/document/2803_D16_T9_V1-eng.htm.
2) Agriculture industries refer to establishments growing crops, raising animals or producing animal products as well as establishments providing support services
for crops and livestock production. Note: The figures shown above for "Support Services" include estimates for the forestry industry (separate data for agriculture
are not available due to confidentiality).
Industries (1), 2007-2015
Agriculture Industries (2)
Manufacturing Industries
Source: Statistics Canada, CANSIM Database Table Number 029-0045
0.0
10.0
20.0
30.0
40.0
50.0
60.0
70.0
80.0
2007 2008 2009 2010 2011 2012 2013 2014 2015
Per
Cen
t S
hare
Crop Production
Animal Production
Fig. 9 Alberta Capital Investment Expenditures for Crop and Animal Production,
Per Cent Share of Total Agriculture Industries, 2008-2015
Alberta Agriculture Statistics Yearbook, 2015 - 30 -

2011 2012 2013 2014 2015p 2014 2015p
Total Employees, All Industries………………………… 25.46 26.68 27.68 28.12 29.06 1.6 3.3
Goods-Producing Sector………………………………. 29.80 31.70 32.15 32.91 33.75 2.4 2.6
Agriculture…………………………………………………………………17.20 18.21 16.24 17.64 19.51 8.6 10.6
Males…………………………………………………………17.43 19.91 17.34 18.30 21.67 5.5 18.4
Females…………………………………………………………..16.79 15.53 14.46 16.19 15.76 12.0 -2.7
Full-Time (1) - Both Sexes……………………………………….17.64 18.94 16.26 17.92 20.24 10.2 12.9
Part-Time (1) - Both Sexes…………………………………………….15.09 15.74 16.08 15.81 17.16 -1.7 8.5
By Age Group - Both Sexes
15 Years and Over………………………………………………………………..17.20 18.21 16.24 17.64 19.51 8.6 10.6
15 to 24 Years…………………………………………………………………….13.60 14.92 16.07 15.43 16.46 -4.0 6.7
25 to 54 Years………………………………………….18.52 19.40 16.02 18.12 21.49 13.1 18.6
55 Years and Over…………………………………………………………………….20.29 19.41 17.54 x 21.67 '- -
Forestry, Fishing, Mining, Oil and Gas……………………………………………35.67 38.37 39.63 39.64 40.81 0.0 3.0
Utilities…………………………………………………………………..……………36.15 36.49 38.08 40.09 42.70 5.3 6.5
Construction……………………………………………………….28.49 29.93 29.84 30.65 32.13 2.7 4.8
Manufacturing………………………………………………………….25.60 26.85 28.12 28.84 29.38 2.6 1.9
Services-Producing Sector……………………………………………….23.95 24.80 26.00 26.30 27.37 1.2 4.1
Trade…………………………………………………………………………………………19.54 19.92 20.76 21.21 22.26 2.2 5.0
Transportation and Warehousing…………………………………………………25.59 27.54 29.40 28.52 29.31 -3.0 2.8
Finance, Insurance, Real Estate, Leasing……………………………………………24.11 26.70 27.89 28.97 29.47 3.9 1.7
Professional, Scientific, Technical Services………………………………………………….32.50 32.78 35.39 34.57 36.67 -2.3 6.1
Business, Building, Other Support Services……………………………………………………………19.68 20.74 22.32 21.84 24.14 -2.2 10.5
Educational Services…………………………………………………………………………….30.41 31.65 31.17 31.50 33.20 1.1 5.4Health Care and Social Assistance……………………………………………………………….26.43 26.76 29.37 29.51 29.89 0.5 1.3
Information, Culture and Recreation………………………………………………………………22.27 22.89 23.46 24.18 24.70 3.1 2.2
Accommodation and Food Services……………………………………………………….13.83 14.89 14.86 15.25 15.58 2.6 2.2
Other Services………………………………………………………………..21.91 21.68 22.75 24.36 25.11 7.1 3.1
Public Administration………………………………………………………………………..32.65 33.93 34.79 35.91 36.64 3.2 2.0
(1) Full-time employees usually work 30 hours or more per week at their main job. Part-time employees usually work less than 30 hours per week.
British Other
Canada Alberta Columbia Sask. Manitoba Ontario Quebec Canada (1)
1996.............................................. 275 75 1 95 24 17 54 9
1997............................................. 243 61 4 76 19 15 54 14
1998.................................................... 244 55 5 92 27 12 47 6
1999.................................................... 243 45 6 99 29 17 42 5
2000................................................... 213 38 14 76 18 20 40 7
2001................................................... 220 44 6 64 19 23 57 7
2002................................................... 228 36 16 53 43 38 33 9
2003r................................................... 225 47 16 59 28 23 46 6
2004r................................................... 228 56 4 64 27 34 31 12
2005r................................................... 239 65 6 75 26 27 35 5
2006r................................................... 218 16 7 79 36 29 39 12
2007r................................................... 140 15 1 50 14 21 30 9
2008r................................................... 127 6 6 34 22 31 20 8
2009r................................................... 91 5 1 13 14 22 27 9
2010r................................................... 61 6 3 3 6 15 25 3
2011r................................................... 68 1 1 13 5 18 17 13
2012r................................................... 47 3 2 3 7 12 14 6
2013r................................................... 66 5 2 5 13 18 13 10
2014r................................................... 25 1 3 1 2 3 14 1
2015p................................................... 20 3 1 3 0 2 10 1
Note: Starting in 2003, bankruptcies are based on the North American Industrial Classification System (NAICS). Data for prior years are based on
the 1980 Standard Industrial Classification System (SIC) and may include proposals.
Source: Industry Canada, Office of the Superintendent of Bankruptcy Canada
Source: Statistics Canada, CANSIM Database Table Number 282-0072
Number
Table 17: Farm Bankruptcies*, Canada and Provinces, 1996-2015
(1) Includes Atlantic Provinces, Yukon, Northwest Territories and Nunavut.
Table 16: Alberta Average Hourly Wage Rates for Agriculture and Other
Note: Industry refers to the general nature of the business carried out by the employer for whom the individual (respondent) works, that is, the main job.
Major Industries, 2011-2015
Dollars Per Hour % Change
*Farm bankruptcies include only crop production and animal production.
- 31 - Alberta Agriculture Statistics Yearbook, 2015

% Change
Item Specifications 2014 2015 '15/'14
Lumber, construction grade……………………………………………………………………………………………………………... . 2x6, spruce, thousand board feet (M) 543.24 579.96 6.8
Lumber, rough grade……………………………………………………………………………………………………………... . 2x8, spruce, thousand board feet (M) 562.93 604.25 7.3
Sheathing, plywood……………………………………………………………………………………………………………... . unsanded, spruce, 9.6 mm, 4'x8' sheet 16.80 18.10 7.8
Fence posts……………………………………………………………………………………………………………... . standard grade, treated, 3"-4" x 7' post 4.69 5.40 15.1
Concrete, ready-mix……………………………………………………………………………………………………………... . 20 MPA strength, cubic metre 215.76 225.75 4.6
Nails……………………………………………………………………………………………………………... . standard grade, 4" spiral, 50 lb box 75.49 76.17 0.9
Pipe, plastic……………………………………………………………………………………………………………... . 1" diameter, 75 PSI, 100' coil 56.65 59.19 4.5Rods, steel reinforcing……………………………………………………………………………………………………………... . 10 mm x 6 metre 6.54 6.09 -6.8
Barbed wire……………………………………………………………………………………………………………... . 12 gauge, double strand, 40 kg spool 66.71 66.89 0.3
Grain bin, hopper-bottom*……………………………………………………………………………………………………………... . 4,000 bushel capacity 14,856.09 15,486.26 4.2
.Truck tires, 1st line, blackwall……………………………………………………………………………………………………………... . LT285-70R-17 radial, enviro tax inc'd 291.63 295.06 1.2Storage battery……………………………………………………………………………………………………………... . 12 volts, 24 series, 525 cranking amps 98.22 101.58 3.4
V-Belt, implement……………………………………………………………………………………………………………... . 1/2" X 70" fibre belt 13.03 13.29 2.0
Antifreeze……………………………………………………………………………………………………………... . ethylene glycol, anti-corrosive, 4 litre 14.90 14.91 0.0
Mechanical repairs……………………………………………………………………………………………………………... . farm machinery, shop & labour, per hour 115.07 121.07 5.2
Baler twine……………………………………………………………………………………………………………... . plastic, 28,000' bale 31.59 32.24 2.1
General farm labour……………………………………………………………………………………………………………... . full time, without board, per month 3,151.42 3,314.58 5.2
.Tractor……………………………………………………………………………………………………………... . 105-130 hp, 6 cylinder diesel, fwd 115,563.07 128,118.01 10.9Tractor……………………………………………………………………………………………………………... . 325-375 hp, 6-8 cylinder diesel, 4wd 292,790.11 344,145.34 17.5Combine, self-propelled*……………………………………………………………………………………………………………... . diesel, 323-374 hp, twin, cross or axial rotary 368,057.98 397,229.57 7.9
Air drill*……………………………………………………………………………………………………………... . 40'-42', with packer wheels, 325 bu, 3 compartment tank 226,517.00 256,593.13 13.3
Sprayer……………………………………………………………………………………………………………... . pull-type, 800-900 gallon tank, 90'-100' boom 61,763.28 67,596.12 9.4
Round baler……………………………………………………………………………………………………………... . pull-type, PTO driven, 5'x6' hard core bale 48,698.10 53,362.56 9.6
Double disc……………………………………………………………………………………………………………... . heavy duty tandem, 19'-21', 22" blades 46,570.69 52,027.47 11.7
Truck, 3/4 ton……………………………………………………………………………………………………………... . V-8, 5.4L or 5.9L, 4x4, 4 speed auto trans. 40,646.11 43,442.75 6.9
.Calf starter ration*……………………………………………………………………………………………………………... . pellets, 13-20%, bagged 25 kg 14.35 14.90 3.9
Dairy supplement*……………………………………………………………………………………………………………... . pellets, 32%, bagged 25 kg 19.81 18.88 -4.7
Feedlot supplement*……………………………………………………………………………………………………………... . pellets, 32% (excl. Ionophore), bagged 25 kg 14.34 16.11 12.3
Hog grower ration*……………………………………………………………………………………………………………... . pellets, 15-17%, bagged 25 kg 13.60 15.61 14.8Swine supplement*……………………………………………………………………………………………………………... . pellets, 35-40%, bagged 25 kg 20.84 20.18 -3.2Broiler grower complete feed*……………………………………………………………………………………………………………... . 18-20%, bagged 25 kg 14.38 17.07 18.7
Cattle mineral, salt free*……………………………………………………………………………………………………………... . 18% phosphorus:18% calcium, 20 kg 28.19 30.13 6.9
Feed barley……………………………………………………………………………………………………………... . No. 1, non-board, farm gate, bushel 3.38 3.93 16.3
Feed wheat……………………………………………………………………………………………………………... . No. 1, non-board, farm gate, bushel 4.36 4.89 12.0Feed oats**……………………………………………………………………………………………………………... . good quality, non-board, farm gate, bushel 2.48 2.64 6.6Hay, good quality……………………………………………………………………………………………………. baled, over 50% alfalfa, farm gate, ton 85.56 117.16 36.9
.Fertilizer, Urea……………………………………………………………………………………………………………... . 46-0-0, tonne, bulk 644.64 602.11 -6.6
Fertilizer, Monammonium Phosphate……………………………………………………………………………………………………………... . 11-51-0, tonne, bulk 760.83 815.33 7.2
Fertilizer, Anhydrous Ammonia……………………………………………………………………………………………………………... . 82-0-0, tonne, bulk (applicator inc'd) 1,042.94 1,008.21 -3.3
Refine SG*……………………………………………………………………………………………………………... . granular, 486 g 274.84 277.21 0.9
Assert 300 SC……………………………………………………………………………………………………………... . liquid, 10.8 litres 227.40 232.30 2.2
Roundup WeatherMax……………................…………………………. liquid, 10 litres 71.16 74.44 4.6
.Penicillin G, injectable……………………………………………………………………………………………………………... . short-acting, 300 mg/ml, 250 ml 17.95 20.94 16.7
Vitamin A D with E, injectable……………………………………………………………………………………………………………... . IU/cc: A-500,000, D-75,000, E-50, 250 ml 27.25 27.26 0.1
Seed; wheat……………………………………………………………………………………………………………... . certified No. 1, 100 kg, bulk 49.66 50.11 0.9
Seed; barley……………………………………………………………………………………………………………... . certified No. 1, 100 kg, bulk 40.35 39.36 -2.4
Seed; Roundup Ready Herbicide Tolerant Canola……………………………………………………………………………………………………………... . certified No. 1, treated, not incl. TUA, 22.7 kg, bagged 469.16 462.75 -1.4
Seed; Liberty Link Herbicide Tolerant Canola……………………………………………………………………………………………………………... . certified No. 1, treated, not incl. TUA, 22.7 kg, bagged 589.92 593.99 0.7
.Gasoline, marked ……………………………………………………………………………………………………………... . regular unleaded, 100 litres 102.70 86.26 -16.0
Diesel fuel, marked……………………………………………………………………………………………………………... . 100 litres (provincial allowance deducted) 110.82 86.47 -22.0
Propane……………………………………………………………………………………………………………... . liquefied, bulk, 100 litres 66.60 67.18 0.9
Natural gas……………………………………………………………………………………………………………... . excl. service/delivery, provincial rebate deducted, GJ 4.59 2.90 -36.9
Electricity……………………………………………………………………………………………………………... . farm use, excl. service/delivery, 100 kWh 7.59 5.72 -24.6
Oil, for diesel engines*……………………………………………………………………………………………………………... . 15W-40, enviro tax inc'd, 5 litres 20.48 20.34 -0.6
* Specification changed as of January 2012 ** New input as of January 2012
Source: Agricultural Input Monitoring System (AIMS), Alberta Agriculture and Forestry, Statistics and Data Development Section
Dollars
Note: The prices reported are simple averages for the province and are based on a survey conducted in the first week of each month.
Table 18: Alberta Average Farm Input Prices, 2014 and 2015
Alberta Agriculture Statistics Yearbook, 2015 - 32 -
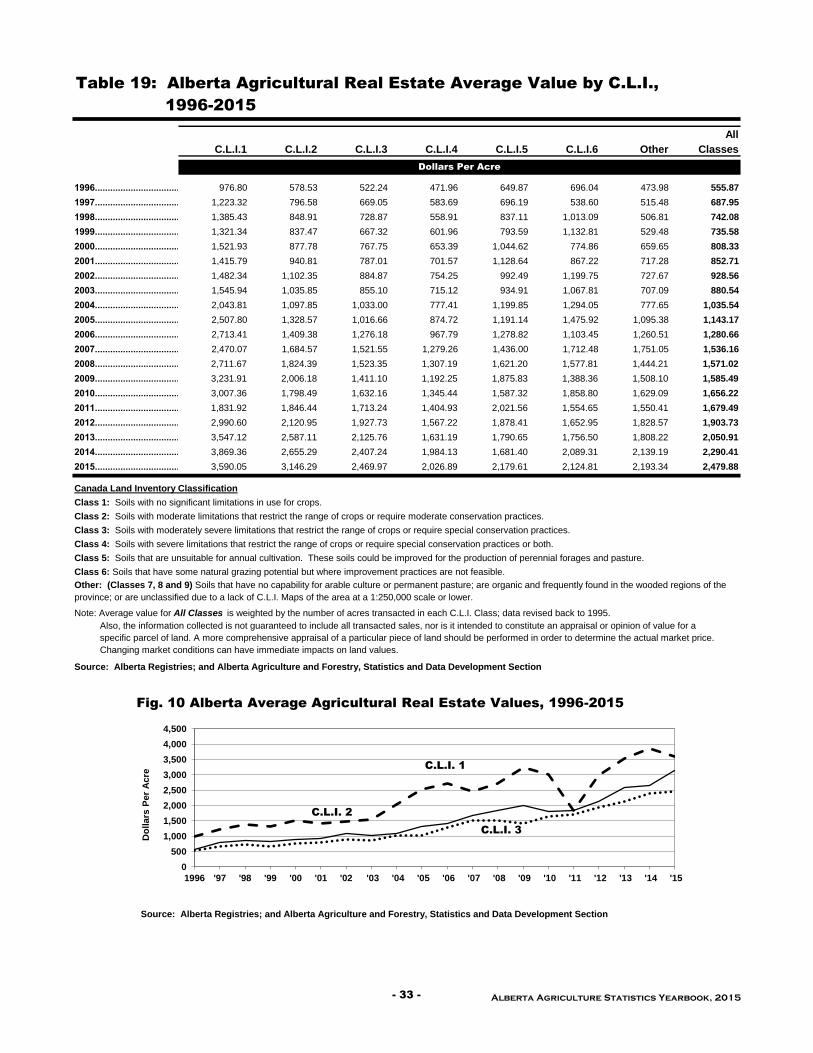
All
C.L.I.1 C.L.I.2 C.L.I.3 C.L.I.4 C.L.I.5 C.L.I.6 Other Classes
1996...............................................…976.80 578.53 522.24 471.96 649.87 696.04 473.98 555.87
1997...............................................…1,223.32 796.58 669.05 583.69 696.19 538.60 515.48 687.95
1998...............................................…1,385.43 848.91 728.87 558.91 837.11 1,013.09 506.81 742.08
1999...............................................…1,321.34 837.47 667.32 601.96 793.59 1,132.81 529.48 735.58
2000...............................................…1,521.93 877.78 767.75 653.39 1,044.62 774.86 659.65 808.33
2001...............................................…1,415.79 940.81 787.01 701.57 1,128.64 867.22 717.28 852.71
2002...............................................…1,482.34 1,102.35 884.87 754.25 992.49 1,199.75 727.67 928.56
2003...............................................…1,545.94 1,035.85 855.10 715.12 934.91 1,067.81 707.09 880.54
2004...............................................…2,043.81 1,097.85 1,033.00 777.41 1,199.85 1,294.05 777.65 1,035.54
2005...............................................…2,507.80 1,328.57 1,016.66 874.72 1,191.14 1,475.92 1,095.38 1,143.17
2006...............................................…2,713.41 1,409.38 1,276.18 967.79 1,278.82 1,103.45 1,260.51 1,280.66
2007...............................................…2,470.07 1,684.57 1,521.55 1,279.26 1,436.00 1,712.48 1,751.05 1,536.16
2008...............................................…2,711.67 1,824.39 1,523.35 1,307.19 1,621.20 1,577.81 1,444.21 1,571.02
2009...............................................…3,231.91 2,006.18 1,411.10 1,192.25 1,875.83 1,388.36 1,508.10 1,585.49
2010...............................................…3,007.36 1,798.49 1,632.16 1,345.44 1,587.32 1,858.80 1,629.09 1,656.22
2011...............................................…1,831.92 1,846.44 1,713.24 1,404.93 2,021.56 1,554.65 1,550.41 1,679.49
2012...............................................…2,990.60 2,120.95 1,927.73 1,567.22 1,878.41 1,652.95 1,828.57 1,903.73
2013...............................................…3,547.12 2,587.11 2,125.76 1,631.19 1,790.65 1,756.50 1,808.22 2,050.91
2014...............................................…3,869.36 2,655.29 2,407.24 1,984.13 1,681.40 2,089.31 2,139.19 2,290.41
2015...............................................…3,590.05 3,146.29 2,469.97 2,026.89 2,179.61 2,124.81 2,193.34 2,479.88
Also, the information collected is not guaranteed to include all transacted sales, nor is it intended to constitute an appraisal or opinion of value for a
specific parcel of land. A more comprehensive appraisal of a particular piece of land should be performed in order to determine the actual market price.
Changing market conditions can have immediate impacts on land values.
'97
'98
'99
'00
'01
'02
'03
'04
'05
'06
'07
'08
'09
'10
'11
'12
Other: (Classes 7, 8 and 9) Soils that have no capability for arable culture or permanent pasture; are organic and frequently found in the wooded regions of the
province; or are unclassified due to a lack of C.L.I. Maps of the area at a 1:250,000 scale or lower.
Note: Average value for All Classes is weighted by the number of acres transacted in each C.L.I. Class; data revised back to 1995.
Source: Alberta Registries; and Alberta Agriculture and Forestry, Statistics and Data Development Section
Source: Alberta Registries; and Alberta Agriculture and Forestry, Statistics and Data Development Section
Table 19: Alberta Agricultural Real Estate Average Value by C.L.I.,
Class 6: Soils that have some natural grazing potential but where improvement practices are not feasible.
Class 2: Soils with moderate limitations that restrict the range of crops or require moderate conservation practices.
Class 3: Soils with moderately severe limitations that restrict the range of crops or require special conservation practices.
Class 4: Soils with severe limitations that restrict the range of crops or require special conservation practices or both.
Class 5: Soils that are unsuitable for annual cultivation. These soils could be improved for the production of perennial forages and pasture.
1996-2015
Dollars Per Acre
Canada Land Inventory Classification
Class 1: Soils with no significant limitations in use for crops.
0
500
1,000
1,500
2,000
2,500
3,000
3,500
4,000
4,500
1996 '97 '98 '99 '00 '01 '02 '03 '04 '05 '06 '07 '08 '09 '10 '11 '12 '13 '14 '15
Do
llars
Per
Acre
Fig. 10 Alberta Average Agricultural Real Estate Values, 1996-2015
C.L.I. 2
C.L.I. 3
C.L.I. 1
- 33 - Alberta Agriculture Statistics Yearbook, 2015

C.L.I. 1 C.L.I. 2 C.L.I. 3 C.L.I. 4 C.L.I. 5 C.L.I. 6 Other (1) All Classes
Beaver County.................................................................2,375.14 2,714.90 1,622.30 1,438.64 3,364.94 - - 2,416.43
Birch Hills County................................................................. - 925.73 3,563.82 1,492.88 2,042.66 - 1,876.48 2,872.09
Brazeau County................................................................. - - 2,365.65 1,925.74 2,830.98 - 2,741.34 2,442.87
Cardston County................................................................. - 2,935.46 2,254.53 1,580.29 2,470.70 - - 2,273.57
Clear Hills County................................................................. - 433.39 812.90 685.01 - - 947.30 747.61
Clearwater County................................................................. - 3,471.49 3,687.44 3,054.39 3,819.26 2,830.91 2,627.33 3,190.53
County of Athabasca No. 12.................................................................- - 1,916.44 1,315.28 2,768.13 1,573.95 1,120.40 1,509.37
County of Barrhead No. 11.................................................................- 3,115.19 3,114.59 2,912.56 2,985.80 2,160.51 3,494.50 3,001.75
County of Camrose No. 22.................................................................- 3,940.30 4,499.59 2,310.64 2,170.45 1,328.19 - 3,756.98
County of Forty Mile No. 8.................................................................- 6,105.12 3,952.63 3,406.63 2,113.12 5,066.50 - 3,973.32
County of Grande Prairie No. 1.................................................................- 2,539.83 2,549.07 2,193.15 1,183.58 - 2,074.45 2,269.50
County of Lethbridge No. 26.................................................................- 3,171.54 4,003.16 - - 4,647.39 2,702.13 3,475.32
County of Minburn No. 27.................................................................2,627.76 3,660.23 2,065.31 1,618.24 1,100.87 - - 2,671.15
County of Newell No. 4.................................................................3,965.11 3,235.98 3,914.12 4,395.33 8,159.32 3,814.66 3,811.80 4,134.25
County of Paintearth No. 18.................................................................- - 1,450.76 712.80 777.18 1,945.12 2,568.18 1,429.11
County of St. Paul No. 19.................................................................- 1,778.08 2,078.30 1,727.97 2,609.35 - 1,879.78 2,004.74
County of Stettler No. 6.................................................................- 2,360.27 1,752.53 2,665.50 1,359.62 3,002.37 3,791.05 2,273.68
County of Thorhild No. 7.................................................................- 3,709.95 2,249.20 1,460.78 - 629.38 1,978.13 2,068.62
County of Two Hills No. 21.................................................................2,155.79 2,512.92 1,958.34 2,082.15 1,306.02 3,403.35 - 2,145.13
County of Vermilion River No. 24.................................................................- 2,641.79 1,968.06 2,242.93 2,263.44 - - 2,321.39
County of Warner No. 5.................................................................- 4,725.72 1,192.78 1,764.44 - 995.76 - 2,885.24
County of Wetaskiwin No. 10.................................................................3,903.19 3,851.89 3,078.50 2,019.30 2,172.37 - 3,051.10 2,853.20
Cypress County................................................................. - - 3,426.39 2,428.69 2,467.57 3,853.04 - 2,705.56
Flagstaff County.................................................................4,220.45 3,195.76 2,995.61 1,720.24 - - 3,461.89 3,004.49
Kneehill County.................................................................2,080.41 4,101.20 2,735.91 3,815.51 2,814.72 - - 2,837.88
Lac La Biche County.................................................................- - - 1,848.53 3,877.08 - - 2,374.47
Lac Ste. Anne County.................................................................- 1,695.58 2,213.67 2,005.65 1,302.50 1,445.72 2,270.23 2,035.05
Lacombe County................................................................. - 4,932.48 4,260.19 2,736.54 2,909.01 - 2,251.78 4,228.04
Lamont County.................................................................2,329.61 3,220.27 2,766.37 2,568.87 2,289.10 1,818.63 3,064.92 2,804.58
Leduc County.................................................................4,235.47 3,471.80 2,645.13 3,448.16 2,234.32 1,219.98 4,815.91 3,435.61
M.D. of Acadia No. 34.................................................................- - - 2,151.70 - - - 2,151.70
M.D. of Big Lakes................................................................. - 989.45 1,328.52 490.96 499.11 - 498.70 841.45
M.D. of Bighorn No. 8............................................................. - - - - 6,205.63 - - 6,205.63
M.D. of Bonnyville No. 87.................................................................- - 1,919.33 1,719.78 1,455.37 2,595.71 1,125.89 1,714.34
M.D. of Fairview No. 136.................................................................- 2,217.92 2,014.56 - 409.10 - 1,613.77 1,979.33
M.D. of Foothills No. 31.................................................................- 2,255.15 1,960.43 - 2,189.23 - - 2,123.28
M.D. of Greenview No. 16.................................................................- 2,030.04 1,344.78 1,863.56 1,444.99 625.49 1,180.56 1,437.33
M.D. of Lesser Slave River No. 124.................................................................- - - 1,264.58 - - - 1,264.58
M.D. of Northern Lights No. 22.................................................................- 2,035.21 1,947.03 1,826.26 - - 1,854.34 1,925.60
M.D. of Peace River No. 135.................................................................- 1,186.07 1,255.08 - - - - 1,241.67
M.D. of Pincher Creek No. 9.................................................................- 2,929.65 - - 2,335.92 - - 2,619.87
M.D. of Provost No. 52.................................................................- - 1,709.26 1,471.38 1,121.72 2,613.76 - 1,706.91
M.D. of Ranchland No. 66.................................................................- - - - - 8,131.42 - 8,131.42
M.D. of Rocky View No. 44.................................................................4,378.46 - 4,099.87 4,303.40 5,930.00 1,905.26 - 4,251.89
M.D. of Smoky River No. 130.................................................................- 2,190.59 1,987.61 1,688.06 3,608.15 - 3,874.48 2,320.75
M.D. of Spirit River No. 133.................................................................- 1,523.36 1,246.21 - - - 889.16 1,225.13
M.D. of Taber.................................................................1,563.73 6,565.23 6,438.57 4,069.44 3,329.17 3,509.59 4,114.94 4,912.30
M.D. of Wainwright No. 61.................................................................6,396.86 1,485.77 1,590.58 1,804.06 3,262.99 2,482.79 - 2,135.28
M.D. of Willow Creek No. 26.................................................................- 3,513.20 3,936.95 4,491.78 3,217.64 - 1,249.06 3,576.42
Mackenzie County................................................................. - - 1,568.63 1,385.15 1,944.40 2,095.40 1,218.13 1,519.35
Mountain View County.................................................................4,477.88 3,089.34 3,970.85 - 4,128.92 - 4,362.82 3,880.06
Northern Sunrise County.................................................................- 1,993.88 2,129.68 848.42 2,189.23 - 2,891.87 1,930.69
Parkland County.................................................................7,010.74 3,151.52 4,298.15 3,058.36 5,076.60 3,068.67 1,614.40 3,894.82
Ponoka County.................................................................575.45 4,397.45 3,887.24 2,752.17 2,606.22 - 3,553.05 3,613.78
Red Deer County.................................................................3,072.21 4,199.00 3,876.44 4,220.24 4,732.29 - 3,501.87 4,133.25
Saddle Hills County................................................................. - 1,007.13 1,249.09 886.97 1,497.23 1,250.99 848.17 1,062.17
Smoky Lake County.................................................................- 2,464.51 1,287.50 1,635.47 - 1,274.73 - 1,697.28
Special Area 2 Hanna.................................................................- - - 1,490.04 624.78 234.92 - 887.40
Special Area 3 Oyen.................................................................- - - 1,141.83 376.02 1,053.18 - 876.51
Special Area 4 Consort.................................................................- - 111.65 872.39 382.07 106.14 - 570.41
Starland County.................................................................2,498.31 1,917.18 1,922.18 2,087.16 1,699.46 - 237.69 1,885.32
Strathcona County................................................................. - - - 8,522.35 2,502.86 - 6,518.73 6,726.56
Sturgeon County.................................................................4,941.73 2,805.55 2,736.66 3,689.94 3,272.80 - 4,857.29 4,039.57
Vulcan County................................................................. - 3,431.06 2,972.41 2,686.26 625.49 1,501.18 - 2,908.71
Westlock County................................................................. - 4,132.89 2,149.91 1,731.84 - 1,407.36 2,794.82 2,477.74
Wheatland County................................................................. - 2,510.92 3,045.47 3,846.79 - - - 3,263.11
Woodlands County................................................................. - - 4,992.85 1,448.32 844.42 - 1,226.35 1,520.76
Yellowhead County................................................................. - 3,895.68 1,694.09 2,561.08 2,088.56 696.71 1,343.92 2,242.99
Alberta Average.................................................................3,590.05 3,146.29 2,469.97 2,026.89 2,179.61 2,124.81 2,193.34 2,479.88
C.L.I. - Canada Land Inventory All Classes average value is weighted by the number of acres transacted in each C.L.I. Class.
(1) Includes parcels that were predominantly C.L.I.7, C.L.I.8 or C.L.I. 9.
Note: The information collected is not guaranteed to include all transacted sales, nor is it intended to constitute an appraisal or opinion of value for a specific parcel
of land. A more comprehensive appraisal of a particular piece of land should be performed in order to determine the actual market price. Changing market
conditions can have immediate impacts on land values.
Source: Alberta Registries; and Alberta Agriculture and Forestry, Statistics and Data Development Section
Table 20: Average Alberta Agricultural Land Values by C.L.I. and
Municipality, 2015
Dollars Per Acre
Alberta Agriculture Statistics Yearbook, 2015 - 34 -

Page No.
Alberta Food and Beverage Manufacturing Industries in 2015…………..…………………….…………………...……….36
Table No.
21. Employed Labour Force in Alberta Food and Beverage Industries, 2006-2015………………….……….………………..…………………..…………………….…………….…………….…………….38
22. Alberta Average Weekly Earnings for Food Related Industries, 2006-2015…………….………..…………………….…………….38
23. Alberta and Canada Value of Manufacturing Sales for Food and Beverage Industries, 1995-2015……….…………………………………………………..…………39
24. Alberta Value of Manufacturing Sales for Food and Beverage Industries by Type, 2009-2015………..………………………………………………..…………40
25. Value of Manufacturing Sales for Meat Product Industries, Canada and Provinces, 2006-2015……..…………………..………………………………..…………………….…………..………………42
26. Alberta Food Exports to Other Countries, 2006-2015…..………………..………………………..………………………………..…………………….…43
27. Average Household Food Expenditures, Alberta and Canada, 2014………………………………………………………..44
28. Food Available Per Person for Selected Products, Canada, 2006-2015…………………………………………………………..45
29. Alberta Food Services and Drinking Places, 2006-2015…...……………………..…………………….………………………………..46
30. Alberta Retail Sales for Food and Beverage Stores, 2006-2015…………………………………………………..……………………..……………………………….46
31. Edmonton Monthly Retail Food Price Indices by Category (Jan 2009=100), 2015………...…………………………………………………..…………………….…..………………………..………………………..……………47
32. Edmonton Nutritious Food Basket - Weekly Average Cost for a Family of Four, 2015………………………………………………………………..…………………….………………………..………………………..………………………..……………………48
33. Per Capita Consumption of Meats in Canada and United States, 1986-2015…...……………….………………….…………………………..….49
34. Alberta Honey Statistics, 1997-2015…………………………………..….………………..….…………………………..….………………..….……………………..….50
F
O
O
D
A
N
D
B
E
V
E
R
A
G
E
I
N
D
U
S
T
R
I
E
S
- 35 - Alberta Agriculture Statistics Yearbook, 2015
Alberta Agriculture Statistics Yearbook, 2015 - 36 -
Alberta Food and Beverage Manufacturing Industries* in 2015
Food and Beverage Manufacturing Sales
Manufacturing sales for all industries in Alberta declined 14.0 per cent to $68.0 billion in 2015, the sector’s first annual decrease since 2009. In contrast, the province’s food and beverage manufacturing sales rose to a record $14.63 billion, and were up 18.7 per cent over 2014. Revenues from food manufacturing industries jumped 23.4 per cent to a high of $13.6 billion while the province’s sales for beverage industries fell 22.1 per cent to $1.0 billion. The food and beverage manufacturing industries represented the largest manufacturing sector (21.5 per cent of total sales), surpassing petroleum and coal products industries which ranked second (21.4 per cent or $14.56 billion). Chemical industries followed, accounting for 17.7 per cent (or $12.0 billion).
Food Manufacturing Sales
Food manufacturing sales in Alberta reached an all-time high in 2015 at $13.6 billion, with several segments reporting higher sales. Sales of meat products including poultry jumped 28.6 per cent to $7.7 billion, largely due to strong boxed beef prices. Red meat sales totaled $6.7 billion while the remaining $986.4 million was from rendering and poultry processing. Sales in animal food (including feed) manufacturing increased 14.4 per cent to $1.1 billion, and marked the second consecutive year of growth. Other food manufacturing industries (including snack foods) reported a gain of 27.0 per cent to total $839.3 million. Grain and oilseed milling sales declined 5.9 per cent to $1.6 billion. Compared to 2014, dairy product sales almost doubled in 2015, totalling $1.4 billion. In 2015, 87.0 per cent of Alberta's food manufacturing sales were concentrated in four segments: meat product manufacturing (livestock and poultry slaughtering, processing and rendering), grain and oilseed milling, dairy product manufacturing and animal food (including feed) manufacturing. Production activity continued to be dominated by meat product industries. This segment accounted for 56.2 per cent of total food sales. Grain and oilseed milling accounted for 11.9 per cent, dairy product manufacturing for 10.6 per cent, and animal food (including feed) manufacturing for 8.3 per cent. The remaining 13.0 per cent of food sales was distributed among other food manufacturing industries including bakeries and tortilla manufacturing, sugar and confectionery products, fruit and vegetable preserving, seafood products, specialty foods and snack foods. Lower oil prices impacted Alberta’s manufacturing sales in 2015, causing the sector to fall for the first time since 2009. After contracting in 2009 during the recession, sales recovered in subsequent years until 2014. In 2015, the majority of manufacturing industries reported lower sales. However, some industries performed well. Food industries with a gain of 23.4 per cent registered the largest increase of all Alberta’s manufacturing industries. Printing and related activities followed at 18.4 per cent, and paper manufacturing at 14.6 per cent. On a national basis, three provinces accounted for 77.3 per cent (or $73.9 billion) of total Canadian food sales ($95.7 billion) in 2015: Ontario ($38.5 billion or 40.3 per cent), Quebec ($21.8 billion or 22.7 per cent) and Alberta ($13.6 billion or 14.2 per cent). Compared to 2014, Alberta led gains in sales in 2015 with 23.4 per cent, and was followed by British Columbia (18.7 per cent), and Ontario (13.9 per cent). Alberta food manufacturing was also recorded strongest annual growth since 1995. Nationally, Canada’s food manufacturing sales increased 8.2 per cent in 2015. Canada’s meat product manufacturing sales reached a new high of $26.8 billion in 2015, and were up 8.1 per cent over 2014. The top three provinces contributing to this total were Ontario ($9.2 billion or 34.3 per cent), Alberta ($7.7 billion or 28.6 per cent) and Quebec ($5.8 billion or 21.6 per cent). Among these provinces, Alberta had the highest percentage of its total food sales generated by meat product industries. At 56.2 per cent of total food sales, Alberta’s proportion surpassed comparable proportions for Ontario (23.8 per cent) and Quebec (26.6 per cent). ‘* Food manufacturing industries transform agricultural products, livestock and crops into products for intermediate or final consumption. “Manufacturing sales" or "sales of goods manufactured" refers to the net selling value of goods made by reporting establishments. Sales include sales from Canadian locations (domestic and export); transfers to other business units or a head office; sales of goods that were shipped earlier on consignment; sales shipped to foreign countries for which customs entry forms have been prepared; charges for installation of manufactured goods where installation is part of the sales; and book value of goods sold for rental. Sales exclude discounts and returns; shipping charges by common or contract carriers; federal and provincial sales taxes and excise duties; and sales purchased for resale.

Alberta Agriculture Statistics Yearbook, 2015
- 37 -
Employment in Food and Beverage Manufacturing Industries Canada’s employment in food and beverage manufacturing industries edged up 3.2 per cent to 295,100 persons in 2015. This compares to the record set in 2004 at 306,700 persons. In 2015, seven of the ten provinces reported job gains, and were led by Prince Edward (with an increase of 50.0 per cent), and Newfoundland and Labrador (30.2 per cent). Alberta had an increase of 3.6 per cent. The largest concentration of workers were in Ontario (115,600 persons or 39.2 per cent of Canada’s food and beverage employed labour force), Quebec (77,200 persons or 26.2 per cent), British Columbia (33,100 persons or 11.2 per cent) and Alberta (26,400 persons or 8.9 per cent). Alberta’s largest manufacturing employer in 2015 was the food and beverage processing sector at 26,400 persons or 18.9 per cent of total manufacturing employees (139,900 persons). This was followed by fabricated metal product industries at 22,200 persons (15.9 per cent) and machinery manufacturing employees at 17,100 (12.2 per cent). The largest food segment remains meat product (including poultry) manufacturing which accounted for 10,800 persons or 43.9 per cent of total food employees (10,800 persons).
After five years of consecutive growth following the recession of 2009, Alberta’s employment in manufacturing industries declined 3.2 per cent to 139,900 persons in 2015. While the manufacturing sector in general has experienced recent steady employment growth (with the exception of 2015), Alberta’s food and beverage industries have reported fluctuations. These industries experienced their highest level of employment in 2002 at 28,300 persons. During the next decade, employment generally trended downward. By 2012, the level dropped to 19,500 persons. However, in 2013, the trend reversed with a significant increase of 40.5 per cent to total 27,400 persons. Much of this increase was attributable to significant job creation in meat product (including poultry) industries, which reported an increase of 67.2 per cent to a total of 11,200 persons. In 2014, food and beverage manufacturing employment decreased 6.9 per cent to 25,500 persons, a reflection of job losses in meat product industries (down 17.0 per cent to 9,300 persons). Employment in meat industries recovered in 2015 (up 16.1 per cent) and led food and beverage employment to an increase of 3.5 per cent to 26,400 persons.
Alberta’s food manufacturing industries continue to face competition for wages from higher paying industries, most notably oil and gas extraction and construction industries. Food manufacturing workers earned a weekly average of $891.48, up 3.4 per cent compared to 2014. However, this was below the average weekly wage of $1,298.63 for the manufacturing sector as a whole. In comparison, workers in oil and gas extraction industries earned an average of $2,605.52 (down 3.4 per cent) while construction workers earned $1,471.57 (down 3.7 per cent).
Exports of Food (Including Beverages and Animal Feeds)
In 2015, Alberta’s total agri-food exports of $10.2 billion were distributed among primary commodities (animals and crops) at $5.4 billion (or 52.8 per cent), and value added products (food products, beverage products and animal feeds; and crude animal and plant products) at $4.8 billion (or 47.2 per cent). Total exports increased 4.5 per cent over 2014 mainly due to a 12.5 per cent gain in value added products. In contrast, primary commodity exports declined 1.8 per cent.
From 2011 to 2015, the level of Alberta’s exports of food (including beverages and animal feeds) averaged $2.5 billion per year. In 2015, exports jumped 12.2 per cent to $3.9 billion, the highest level in the last decade. These exports accounted for 38.4 per cent of total provincial agri-food exports. This proportion compares to 39.6 per cent in 2006. The 2015 growth was mainly attributable to increases in food products ($3.2 billion, up 11.7 per cent) and animal feeds ($586.9 million, up 9.0 per cent). Beverage exports increased 10.1 per cent to $83.8 million. In 2015, exports of food, beverage and animal feed totalled $3.9 billion. The top five products were:
1. Beef and Veal, $1.7 billion (43.4 per cent) 2. Animal Feeds, $586.9 million (15.0 per cent) 3. Pork, $468.9 million (12.0 per cent) 4. Cereals, Milled and Prepared, $356.7 million (9.1 per cent) 5. Processed Potatoes, $328.8 million (8.4 per cent)
Exports of meat and meat products jumped 13.5 per cent to $2.3 billion in 2015, marking the highest level since 2006 and the third consecutive year of growth. Most of the meat categories reported increases with the exception of horse meat (down 5.5 per cent to $50.9 million) and processed meat (down 2.8 per cent to $33.6 million). The overall gain was led by beef and veal exports ($1.7 billion, up 18.7 per cent) and pork ($468.9 million, slightly up 0.4 per cent).

2006 2007 2008 2009 2010 2011 2012 2013 2014 2015
All Industries…………………………….……………………………………………1,911.6 1,991.0 2,053.9 2,029.7 2,023.7 2,099.5 2,172.5 2,226.2 2,274.6 2,301.1
Manufacturing Industries……………………………………..…………..140.9 144.4 140.3 123.4 125.2 133.7 137.6 142.7 144.5 139.9
Food and Beverage Industries………………..……………………...……27.4 22.7 23.0 20.7 22.6 20.1 19.5 27.4 25.5 26.4
% Share of Manufacturing Industries…………………………...………………..…………………….…..19.4 15.7 16.4 16.8 18.1 15.0 14.2 19.2 17.6 18.9
Food Industries (2)…………………………….………….24.5 20.1 20.1 18.6 20.3 18.2 17.4 25.5 22.7 24.6
Meat Products Manufacturing……….……………………………...…….13.7 9.0 8.6 8.6 9.2 8.5 6.7 11.2 9.3 10.8
% Share of Food Industries…….…………………….....….…..55.9 44.8 42.8 46.2 45.3 46.7 38.5 43.9 41.0 43.9
Other Food Manufacturing………………………………………...…….10.8 11.1 11.5 10.0 11.1 9.7 10.7 14.3 13.4 13.8
% Share of Food Industries…….…………………….....….…..44.1 55.2 57.2 53.8 54.7 53.3 61.5 56.1 59.0 56.1
Dairy Products Manufacturing…………..…………………….……………..x 2.5 x x x x x x x x
Grain and Oilseed Milling………………….…………………….……………..x x x x x 1.6 x 1.5 x x
Bakeries and Tortilla Manufacturing…………………………..………………..4.6 3.7 3.3 3.6 3.5 2.4 2.8 3.1 5.9 3.5
Beverage Industries…………………………………………3.0 2.6 2.9 2.2 2.3 1.8 2.1 1.9 2.8 1.8
Food and Beverages Stores…………………………………………………………………………..52.5 52.9 57.8 59.6 53.4 53.2 52.8 53.0 56.4 55.5
Food Services and Drinking Places…………………………………………………………………………..90.6 90.8 91.8 99.8 100.2 110.4 114.3 117.3 121.5 123.8
2006r 2007r 2008r 2009r 2010r 2011r 2012r 2013r 2014r 2015p
Industrial Aggregate (2)...………………….…………………822.08 870.67 922.19 948.29 990.88 1,034.22 1,070.44 1,107.85 1,149.45 1,145.97
Manufacturing Industries…………………………………………………..967.86 1,006.65 1,065.29 1,026.79 1,100.92 1,161.79 1,165.78 1,189.35 1,246.66 1,298.63
Food Manufacturing Industries………………………………………………...776.46 833.04 796.52 744.74 745.63 791.18 815.97 833.76 862.56 891.48
Grain and Oilseed Milling…………………………………………………1,107.95 1,393.02 .. .. .. .. .. .. .. ..
Meat Product Manufacturing………………………………………………766.88 822.92 787.28 .. .. .. .. .. .. ..
Retail Trade Industries……………………………………………………….488.58 499.42 517.77 546.44 549.17 557.00 576.66 585.05 610.60 612.57
Food and Beverage Stores (3)………………………………………………..380.26 368.46 372.77 409.49 426.65 439.03 447.63 460.22 452.26 474.63
Grocery Stores…………………………………………………….388.21 372.91 374.72 411.79 425.85 440.49 446.21 460.40 456.79 478.77
Specialty Food Stores…………………………………………………….320.14 328.69 340.22 .. .. .. .. .. .. ..
Accommodation and Food Services…………………………………………………..320.81 348.78 372.52 388.25 409.60 408.88 421.71 415.55 427.38 409.59
Food Services and Drinking Places…………………………………………………280.43 311.88 340.15 354.24 378.25 375.46 378.74 366.92 380.31 367.19
Dollars Per Week
(1) The data shown in this table are generated from the enterprise-based Survey of Employment, Payrolls and Hours (SEPH). This survey provides monthly
estimates to measure levels and month-to-month trends of payroll employment paid hours and earnings. The target population is composed of all employers in
Canada except those involved in agriculture, fishing and trapping, private household services, religious organizations and military personnel of defence services.
(2) The industrial aggregate represents the sum of all the industries included in the SEPH excluding unclassified businesses. Data includes overtime.
(3) Food and beverage stores include grocery stores, specialty food stores and beer/wine/liquor stores.
Source: Statistics Canada, CANSIM Database Table Number 281-0027
Table 21: Employed Labour Force in Alberta Food and Beverage
Industries (1), 2006-2015
'000 of Persons
(1) Annual averages for employed labour force refers to persons 15 years of age and over who (a) did any work during the reference period, or (b) had a job but
were not at work due to illness or disability; personal or family responsibilities; bad weather; labour disputes; vacation; or other reasons not specified. Work
includes any work for pay or profit. It also includes unpaid family work which contributes directly to the operation of a farm, business or professional practice
owned or operated by a related member of the household.
(2) Data shown for food sub-categories should be used with caution due to high sampling variability.
Source: Statistics Canada, CANSIM Database Table Number 282-0008; and Labour Statistics Division
Table 22: Alberta Average Weekly Earnings for Food Related Industries (1),
2006-2015
Alberta Agriculture Statistics Yearbook, 2015 - 38 -
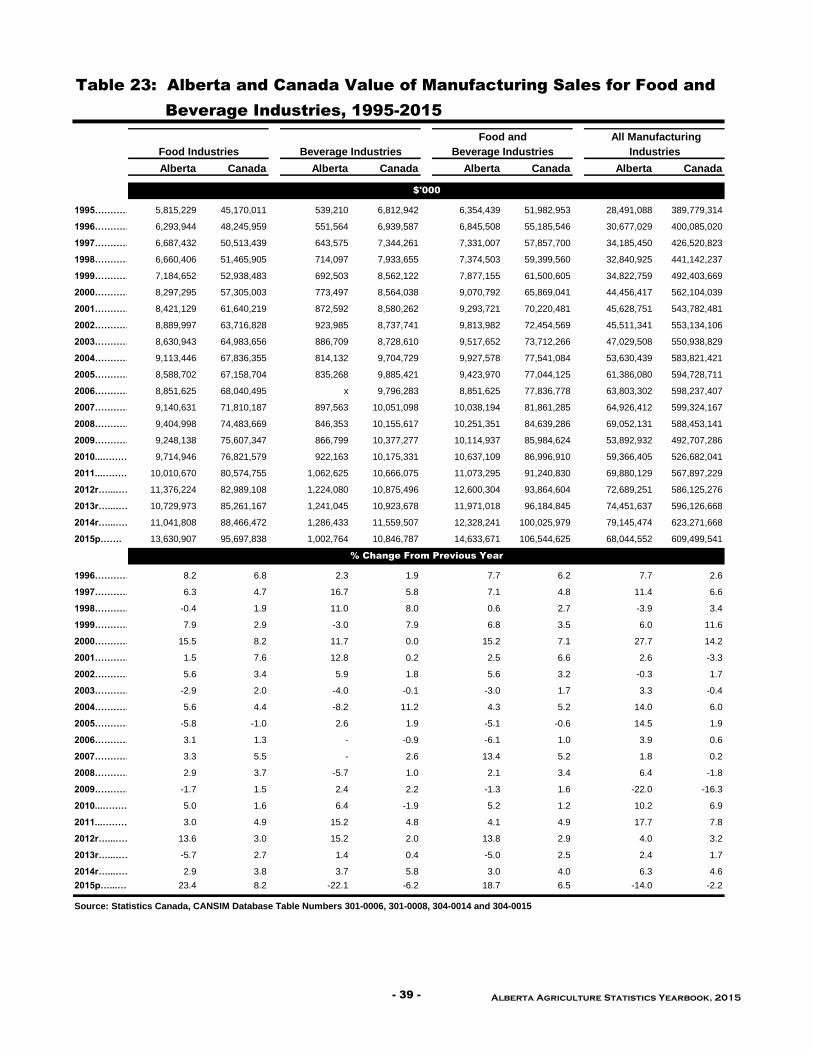
Alberta Canada Alberta Canada Alberta Canada Alberta Canada
1995…………………………………………………5,815,229 45,170,011 539,210 6,812,942 6,354,439 51,982,953 28,491,088 389,779,314
1996…………………………………………………6,293,944 48,245,959 551,564 6,939,587 6,845,508 55,185,546 30,677,029 400,085,020
1997…………………………………………………6,687,432 50,513,439 643,575 7,344,261 7,331,007 57,857,700 34,185,450 426,520,823
1998…………………………………………………6,660,406 51,465,905 714,097 7,933,655 7,374,503 59,399,560 32,840,925 441,142,237
1999…………………………………………………7,184,652 52,938,483 692,503 8,562,122 7,877,155 61,500,605 34,822,759 492,403,669
2000…………………………………………………8,297,295 57,305,003 773,497 8,564,038 9,070,792 65,869,041 44,456,417 562,104,039
2001…………………………………………………8,421,129 61,640,219 872,592 8,580,262 9,293,721 70,220,481 45,628,751 543,782,481
2002…………………………………………………8,889,997 63,716,828 923,985 8,737,741 9,813,982 72,454,569 45,511,341 553,134,106
2003…………………………………………………8,630,943 64,983,656 886,709 8,728,610 9,517,652 73,712,266 47,029,508 550,938,829
2004…………………………………………………9,113,446 67,836,355 814,132 9,704,729 9,927,578 77,541,084 53,630,439 583,821,421
2005…………………………………………………8,588,702 67,158,704 835,268 9,885,421 9,423,970 77,044,125 61,386,080 594,728,711
2006……………………….8,851,625 68,040,495 x 9,796,283 8,851,625 77,836,778 63,803,302 598,237,407
2007……………………………….9,140,631 71,810,187 897,563 10,051,098 10,038,194 81,861,285 64,926,412 599,324,167
2008……………………………….9,404,998 74,483,669 846,353 10,155,617 10,251,351 84,639,286 69,052,131 588,453,141
2009……………………………….9,248,138 75,607,347 866,799 10,377,277 10,114,937 85,984,624 53,892,932 492,707,286
2010...…………………………….9,714,946 76,821,579 922,163 10,175,331 10,637,109 86,996,910 59,366,405 526,682,041
2011...…………………………….10,010,670 80,574,755 1,062,625 10,666,075 11,073,295 91,240,830 69,880,129 567,897,229
2012r…...…………………………….11,376,224 82,989,108 1,224,080 10,875,496 12,600,304 93,864,604 72,689,251 586,125,276
2013r…...…………………………….10,729,973 85,261,167 1,241,045 10,923,678 11,971,018 96,184,845 74,451,637 596,126,668
2014r…...…………………………….11,041,808 88,466,472 1,286,433 11,559,507 12,328,241 100,025,979 79,145,474 623,271,668
2015p……. 13,630,907 95,697,838 1,002,764 10,846,787 14,633,671 106,544,625 68,044,552 609,499,541
1996…………………………………………………8.2 6.8 2.3 1.9 7.7 6.2 7.7 2.6
1997…………………………………………………6.3 4.7 16.7 5.8 7.1 4.8 11.4 6.6
1998…………………………………………………-0.4 1.9 11.0 8.0 0.6 2.7 -3.9 3.4
1999…………………………………………………7.9 2.9 -3.0 7.9 6.8 3.5 6.0 11.6
2000…………………………………………………15.5 8.2 11.7 0.0 15.2 7.1 27.7 14.2
2001…………………………………………………1.5 7.6 12.8 0.2 2.5 6.6 2.6 -3.3
2002…………………………………………………5.6 3.4 5.9 1.8 5.6 3.2 -0.3 1.7
2003…………………………………………………-2.9 2.0 -4.0 -0.1 -3.0 1.7 3.3 -0.4
2004…………………………………………………5.6 4.4 -8.2 11.2 4.3 5.2 14.0 6.0
2005…………………………………………………-5.8 -1.0 2.6 1.9 -5.1 -0.6 14.5 1.9
2006………………………. 3.1 1.3 - -0.9 -6.1 1.0 3.9 0.6
2007……………………………….3.3 5.5 - 2.6 13.4 5.2 1.8 0.2
2008……………………………….2.9 3.7 -5.7 1.0 2.1 3.4 6.4 -1.8
2009……………………………….-1.7 1.5 2.4 2.2 -1.3 1.6 -22.0 -16.3
2010...…………………………….5.0 1.6 6.4 -1.9 5.2 1.2 10.2 6.9
2011...…………………………….3.0 4.9 15.2 4.8 4.1 4.9 17.7 7.8
2012r…...…………………………….13.6 3.0 15.2 2.0 13.8 2.9 4.0 3.2
2013r…...…………………………….-5.7 2.7 1.4 0.4 -5.0 2.5 2.4 1.7
2014r…...…………………………….2.9 3.8 3.7 5.8 3.0 4.0 6.3 4.6
2015p…...…………………………….23.4 8.2 -22.1 -6.2 18.7 6.5 -14.0 -2.2
Source: Statistics Canada, CANSIM Database Table Numbers 301-0006, 301-0008, 304-0014 and 304-0015
$'000
Table 23: Alberta and Canada Value of Manufacturing Sales for Food and
Beverage Industries, 1995-2015
% Change From Previous Year
All Manufacturing
Beverage Industries IndustriesFood Industries Beverage Industries
Food and
- 39 - Alberta Agriculture Statistics Yearbook, 2015
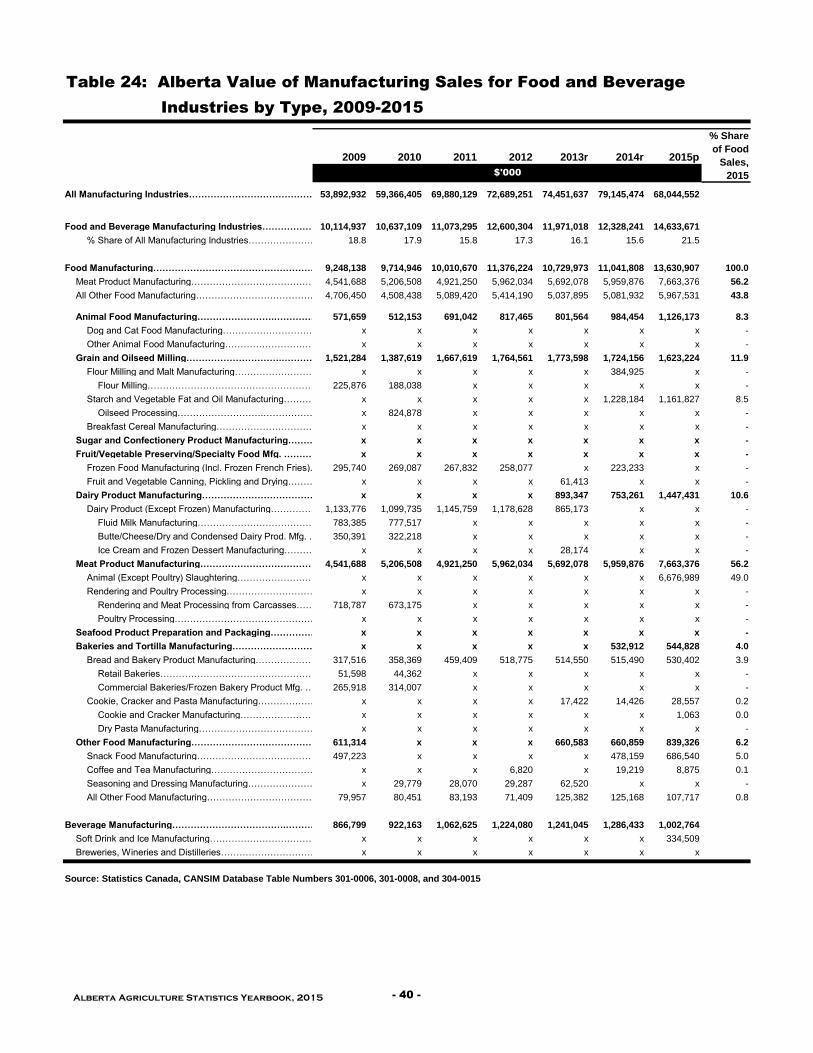
2009 2010 2011 2012 2013r 2014r 2015p
All Manufacturing Industries………………………………………………………………..53,892,932 59,366,405 69,880,129 72,689,251 74,451,637 79,145,474 68,044,552
Food and Beverage Manufacturing Industries……………………………………………………………..10,114,937 10,637,109 11,073,295 12,600,304 11,971,018 12,328,241 14,633,671
% Share of All Manufacturing Industries………………………………………………..18.8 17.9 15.8 17.3 16.1 15.6 21.5
Food Manufacturing……………………………………………………………………………………..9,248,138 9,714,946 10,010,670 11,376,224 10,729,973 11,041,808 13,630,907 100.0
Meat Product Manufacturing………………………………………………………………………..4,541,688 5,206,508 4,921,250 5,962,034 5,692,078 5,959,876 7,663,376 56.2
All Other Food Manufacturing……………………………………………………….4,706,450 4,508,438 5,089,420 5,414,190 5,037,895 5,081,932 5,967,531 43.8
Animal Food Manufacturing…………………….………………………………………….571,659 512,153 691,042 817,465 801,564 984,454 1,126,173 8.3
Dog and Cat Food Manufacturing………………………………………………………..x x x x x x x -
Other Animal Food Manufacturing…………………………………………………………x x x x x x x -
Grain and Oilseed Milling………………………….………………………………….1,521,284 1,387,619 1,667,619 1,764,561 1,773,598 1,724,156 1,623,224 11.9
Flour Milling and Malt Manufacturing……………………………………………………x x x x x 384,925 x -
Flour Milling………………………………………………………………………………………………..225,876 188,038 x x x x x -
Starch and Vegetable Fat and Oil Manufacturing………………………………………………………….x x x x x 1,228,184 1,161,827 8.5
Oilseed Processing……………………….…………………………………………….x 824,878 x x x x x -
Breakfast Cereal Manufacturing……………………………………………………….x x x x x x x -
Sugar and Confectionery Product Manufacturing…………………………………x x x x x x x -
Fruit/Vegetable Preserving/Specialty Food Mfg. ……………………………….x x x x x x x -
Frozen Food Manufacturing (Incl. Frozen French Fries)…………………………………………………………………….295,740 269,087 267,832 258,077 x 223,233 x -
Fruit and Vegetable Canning, Pickling and Drying………………………………………….x x x x 61,413 x x -
Dairy Product Manufacturing……………………………………………………………………x x x x 893,347 753,261 1,447,431 10.6
Dairy Product (Except Frozen) Manufacturing……………………………………………………..1,133,776 1,099,735 1,145,759 1,178,628 865,173 x x -
Fluid Milk Manufacturing………………………………………………………………..783,385 777,517 x x x x x -
Butte/Cheese/Dry and Condensed Dairy Prod. Mfg. ……………………………….350,391 322,218 x x x x x -
Ice Cream and Frozen Dessert Manufacturing……………………………………….x x x x 28,174 x x -
Meat Product Manufacturing……………………………………………………………4,541,688 5,206,508 4,921,250 5,962,034 5,692,078 5,959,876 7,663,376 56.2
Animal (Except Poultry) Slaughtering………………………………………...……………………………….x x x x x x 6,676,989 49.0
Rendering and Poultry Processing……………………………………...…………………………………. x x x x x x x -
Rendering and Meat Processing from Carcasses……………………………………..718,787 673,175 x x x x x -
Poultry Processing………………………………………………….………………………………………………………x x x x x x x -
Seafood Product Preparation and Packaging……………………………………….x x x x x x x -
Bakeries and Tortilla Manufacturing………………………………….. x x x x x 532,912 544,828 4.0
Bread and Bakery Product Manufacturing…………………………………………….317,516 358,369 459,409 518,775 514,550 515,490 530,402 3.9
Retail Bakeries………………………………………………………………..………………..……………………………..51,598 44,362 x x x x x -
Commercial Bakeries/Frozen Bakery Product Mfg. ………………………….265,918 314,007 x x x x x -
Cookie, Cracker and Pasta Manufacturing………………………………..………………………………x x x x 17,422 14,426 28,557 0.2
Cookie and Cracker Manufacturing………………………………………………………x x x x x x 1,063 0.0
Dry Pasta Manufacturing……………………………………………………..………………………….x x x x x x x -
Other Food Manufacturing……………………………………………...…………………………………611,314 x x x 660,583 660,859 839,326 6.2
Snack Food Manufacturing………………………………………………….…………………………497,223 x x x x 478,159 686,540 5.0
Coffee and Tea Manufacturing………………………………………………………………………………………….x x x 6,820 x 19,219 8,875 0.1
Seasoning and Dressing Manufacturing………………………………………………………………………………………….x 29,779 28,070 29,287 62,520 x x -
All Other Food Manufacturing…………………………………..………………………………………………….79,957 80,451 83,193 71,409 125,382 125,168 107,717 0.8
Beverage Manufacturing……………………………….……………………………….866,799 922,163 1,062,625 1,224,080 1,241,045 1,286,433 1,002,764
Soft Drink and Ice Manufacturing………………………………………………………………..x x x x x x 334,509
Breweries, Wineries and Distilleries………………………………………………………………….x x x x x x x
Source: Statistics Canada, CANSIM Database Table Numbers 301-0006, 301-0008, and 304-0015
% Share
of Food
Sales,
2015
Table 24: Alberta Value of Manufacturing Sales for Food and Beverage
Industries by Type, 2009-2015
$'000
Alberta Agriculture Statistics Yearbook, 2015 - 40 -

Source: Statistics Canada, CANSIM Database Numbers 301-0006 and 304-0015
Source: Statistics Canada, CANSIM Database Number 304-0015
(1) Includes manufacturing of snack foods, tea, coffee, flavouring syrup and concentrates, seasonings, dressings, sugar and confectionery
products, fruit and vegetable preserving, specialty foods, seafood products and tortillas and bakery products.
Meat Products (Includes Poultry)$7.7 Billion, 56.2%
Grain and Oilseed Milling
$1.6 Billion, 11.9%
Dairy Products $1.4 Billion, 10.6%
Animal Food Mfg. (Includes Feed)
$1.1 Billion, 8.3%
Other Food Mfg. (1) $1.8 Billion,13.0%
Fig. 11 2015 Distribution of Alberta Food Manufacturing Sales
5.25.0
4.74.5
5.24.9
6.05.7
6.0
7.7
3.6
4.2
4.7 4.74.5
5.15.4
5.0 5.1
6.0
0.0
1.0
2.0
3.0
4.0
5.0
6.0
7.0
8.0
9.0
2006 2007 2008 2009 2010 2011 2012 2013 2014 2015
$ B
illi
on
s
Meat Products Other Food Mfg
Fig. 12 Alberta Food Manufacturing Sales by Type, 2006-2015
2015 Food Manufacturing Sales = $13.6 Billion
- 41 - Alberta Agriculture Statistics Yearbook, 2015

Other
Canada Alberta Ontario Quebec Provinces
2006……………………………………………….. 20,920,307 5,210,944 7,261,926 4,536,776 3,910,661
2007……………………….. 21,634,756 4,981,037 7,793,602 4,618,418 4,241,699
2008………………………………………………. 21,377,013 4,695,700 7,579,228 4,786,794 4,315,291
2009………………………………………………. 21,922,783 4,541,688 7,699,858 5,232,420 4,448,817
2010………………………………………………. 22,493,696 5,206,508 8,179,197 4,807,141 4,300,850
2011………………………………………………. 22,389,560 4,921,250 7,956,110 4,908,244 4,603,956
2012r………………………………………………. 23,666,018 5,962,034 8,093,433 4,646,281 4,964,270
2013r………………………………………………. 23,365,885 5,692,078 8,487,017 4,589,872 4,596,918
2014r………………………………………………. 24,789,223 5,959,876 8,207,663 5,410,794 5,210,890
2015p………………………………………………. 26,791,117 7,663,376 9,177,774 5,780,486 4,169,481
Meat Product Sales as a % Share of Canada in 2015
100.0 28.6 34.3 21.6 15.6
Food Manufacturing Sales in 2015
95,681,873 13,630,983 38,529,880 21,760,405 21,760,605
Meat Product Sales as a % of Food Manufacturing Sales in 2015
28.0 56.2 23.8 26.6 19.2
2006……………………………………………….. 10,280,637 4,016,217 2,034,265 2,350,262 1,879,893
2007……………………….. 10,221,156 3,775,791 2,086,362 2,442,199 1,916,804
2008………………………………………………. 9,615,391 3,387,837 1,906,811 2,454,524 1,866,219
2009………………………………………………. 10,186,565 - 2,081,240 2,517,978 -
2010………………………………………………. 10,595,462 - 2,005,944 2,546,305 -
2011………………………………………………. - - - - -
2012r………………………………………………. - - - - -
2013r………………………………………………. - - - - -
2014r………………………………………………. - - - - -
2015p………………………………………………. 13,395,962 6,676,989 2,423,725 - 1,868,532
2006……………………………………………….. 10,639,670 1,194,727 5,227,661 2,186,514 2,030,768
2007……………………….. 11,413,600 1,205,246 5,707,240 2,176,219 2,324,895
2008………………………………………………. 11,761,622 1,307,863 5,672,417 2,332,270 2,449,072
2009………………………………………………. 11,736,218 - 5,618,618 2,714,442 -
2010………………………………………………. 11,898,234 - 6,173,253 2,260,836 -
2011………………………………………………. - - - - -
2012………………………………………………. - - - - -
2013r………………………………………………. - - - - -
2014r………………………………………………. - - - - -
2015p………………………………………………. 13,395,155 986,387 6,754,049 - 5,654,719
Source: Statistics Canada, CANSIM Database Table Numbers 301-0006, 301-0008, 304-0014 and 304-0015
Table 25: Value of Manufacturing Sales for Meat Product Industries, Canada
and Provinces, 2006-2015
Total Meat Product Manufacturing Industries ($'000) (A. + B.)
A. Animal (Except Poultry) Slaughtering Industries ($'000)
B. Rendering and Meat Processing From Carcasses and Poultry Processing Industries ($'000)
Alberta Agriculture Statistics Yearbook, 2015 - 42 -

2006 2007 2008 2009 2010 2011 2012 2013r 2014r 2015p
Total Agri-Food Exports……………………………………..5,813,428 6,491,477 8,385,912 7,428,837 6,775,409 8,061,065 9,209,942 8,711,642 9,744,893 10,181,266
Animals and Crops………………………...…………... 3,039,976 3,623,134 5,070,451 4,216,732 3,262,394 4,520,345 5,529,191 5,060,670 5,476,265 5,378,661
% Share of Total Exports……………………52.3 55.8 60.5 56.8 48.2 56.1 60.0 58.1 56.2 52.8
Value Added Products…………………...………………2,773,452 2,868,343 3,315,461 3,212,105 3,513,015 3,540,720 3,680,751 3,650,973 4,268,628 4,802,605
% Share of Total Exports…………………………………47.7 44.2 39.5 43.2 51.8 43.9 40.0 41.9 43.8 47.2
Crude Animal and Plant Products (1)…………………………..471,294 685,719 613,791 676,035 989,594 1,007,298 1,091,195 933,826 752,604 892,537
Food, Beverages and Animal Feeds……………….2,302,158 2,182,624 2,701,670 2,536,070 2,523,421 2,533,422 2,589,556 2,717,146 3,516,024 3,910,068
Food, Beverages and Animal Feeds……………….2,302,158 2,182,624 2,701,670 2,536,070 2,523,421 2,533,422 2,589,556 2,710,338 3,485,343 3,910,068
% Share of Total Exports………………………………………………………………………39.6 33.6 32.2 34.1 37.2 31.4 28.1 31.1 35.8 38.4
Food Products……………………………………….2,106,273 1,983,440 2,442,870 2,237,418 2,157,614 2,184,072 2,132,453 2,180,111 2,901,306 3,239,415
Beverage Products…………………………………………54,699 52,668 61,491 76,794 75,291 59,473 77,718 79,150 76,071 83,754
Animal Feeds……………………………………………………………………………….141,185 146,517 197,309 221,858 290,516 289,876 379,386 457,886 538,647 586,899
Meats (2) 1,400,430 1,298,249 1,481,699 1,396,706 1,510,321 1,444,082 1,297,934 1,397,723 1,996,156 2,266,268
% Share of Food Products………………………………66.5 65.5 60.7 62.4 70.0 66.1 60.9 64.1 68.8 70.0
Fresh/Chilled/Frozen Meat Incl. Offal………………………………1,397,645 1,292,856 1,479,047 1,393,073 1,507,102 1,435,047 1,274,965 1,368,965 1,961,617 2,232,685
Beef and Veal……………………………………………..916,384 888,023 1,068,685 956,866 1,051,758 969,377 852,153 961,703 1,428,935 1,696,488
Pork………………………………………………………………………..423,681 345,751 342,119 361,096 391,638 411,542 364,980 348,311 467,049 468,885
Horse………………………………………………..……………………………….44,069 47,711 52,685 60,299 49,160 41,908 45,935 46,115 53,825 50,891
Other Meat (Sheep, Poultry, Bison)……………………………………………………….13,511 11,372 15,559 14,813 14,546 12,220 11,897 12,837 11,807 16,422
Processed Meat…………………………………………………………………….2,785 5,393 2,652 3,633 3,219 9,035 22,970 28,758 34,539 33,582
Other Food Products
Dairy Products………………………………………………………………………….2,844 8,370 4,031 394 3,100 1,731 4,933 531 3,504 283
Eggs……………………………………………………………………………………………….1,711 4,566 130 - - - - - 8 1,063
Honey………………………………………………………………..4,919 6,994 18,523 16,924 15,530 9,389 10,995 12,832 14,929 20,499
Cereals, Milled and Prepared…………………………………………..186,328 211,396 335,860 325,319 225,878 226,641 259,050 261,444 322,379 356,655
- Wheat or Meslin Flour…………………………………………8,449 10,901 18,985 22,149 15,720 6,170 5,213 6,389 8,720 8,627
- Malt Roasted or Not Roasted…………………………….96,460 136,709 244,021 223,504 142,745 151,501 179,954 174,599 225,601 237,583
- Other Cereals Milled…………………………………………….41,641 25,944 32,675 37,210 28,540 33,170 41,654 47,434 50,874 61,578
- Cereal Preparations (3)……………………………………………….39,779 37,842 40,179 42,456 38,873 35,800 32,230 33,022 37,185 48,868
Fruit and Vegetable Preparations………………………………………..3,474 7,929 9,680 7,935 4,982 6,948 4,355 7,092 8,121 18,976
Fruit and Vegetable Juices…………………………………………………………8,059 8,777 9,498 9,339 8,241 7,384 6,931 4,877 3,701 3
Processed Potatoes……………………………………………………………………234,277 239,069 235,223 261,328 191,397 201,611 203,319 208,343 277,585 328,795
Sugar and Sugar Preparations…………………………………….38,732 14,459 31,882 12,176 14,581 39,829 34,105 17,826 10,710 17,698
Foods and Food Materials (4)………………………………………35,774 35,871 37,593 38,102 35,643 44,086 44,664 29,937 36,443 38,025
Oils and Fats…………………………………………………..189,725 147,733 278,751 169,195 147,904 202,330 266,165 239,396 227,769 191,149
Canola/Mustard Oil, Refined……………………………….157,117 122,741 231,957 136,146 112,289 142,966 184,452 167,092 145,448 113,017
Other Oils and Fats………………………………………….32,608 24,992 46,794 33,050 35,615 59,364 81,713 72,304 82,322 78,132
Other Products…………………………………………………………………………………..- 26 - - 36 41 - 110 - -
Beverage Products…………………………………………54,699 52,668 61,491 76,794 75,291 59,473 77,718 79,150 76,071 83,754
Whiskey……………………………………………………………..36,178 34,528 39,194 39,253 42,760 54,717 73,722 71,515 66,105 66,880
Beer……………………………………………………………………………….1,238 1,050 1,536 1,297 2,952 1,226 - 15 32 30
Other Beverages (5)……………………………………………..17,283 17,089 20,761 36,244 29,579 3,530 3,996 7,620 9,934 16,845
Animal Feeds……………………………………………………………………………….141,185 146,517 197,309 221,858 290,516 289,876 379,386 457,886 538,647 586,899
Oilseed Cake and Meal……………………………………..99,128 96,028 145,931 146,064 168,756 165,160 225,526 229,939 279,168 254,296
Alfalfa Meal and Pellets……………………………………….11,492 4,593 61 40 12 101 4,298 1,260 1,222 1,200
Feeds of Vegetable Origin………………………………………………4,020 4,630 2,982 7,508 6,262 4,411 6,889 14,068 15,437 14,468
Prepared Animal Feeds………………………………………26,544 41,266 48,335 68,246 115,487 120,205 142,673 212,619 242,820 316,935
(5) Other beverages include alcoholic and non-alcoholic beverages, wines, cider, soft drinks and bottled water.
(1) Refers to inedible crude animal and plant products such as raw hides/skins, fur skins, seeds for sowing, nursery stock, bovine semen and peat moss. Also includes tallow,
crude canola oil and tobacco.
(2) Includes fresh, chilled, frozen meat, edible offal and processed meat.
(3) Cereal preparations include bakery products and pasta products.
(4) Foods and food materials includes such items as spices, condiments, ice cream, soups, sauces, etc.
Source: Statistics Canada; Alberta Agriculture and Forestry, Statistics and Data Development Section
Table 26: Alberta Food Exports to Other Countries, 2006-2015
Agri-Food Exports ($'000)
Food Exports (Including Beverages and Animal Feeds) ($'000)
Food Products ($'000)
Beverage Products ($'000)
Animal Feeds ($'000)
- 43 - Alberta Agriculture Statistics Yearbook, 2015

Alberta
(Dollars)
% of Current
Consumption
% of Total
Average
Expend.
Canada
(Dollars)
% of Current
Consumption
% of Total
Average
Expend.
Total Average Expenditure per Household (1)………………………………………………………….100,957 100.0 80,728 100.0
Total Current Consumption (Goods and Services)…………………………………………………………….71,211 100.0 70.5 59,057 100.0 73.2
Food Purchased From Stores and Restaurants…………………………………………………………………..8,740 12.3 8.7 8,109 13.7 10.0
Shelter…………………………………………………………….. 20,676 29.0 20.5 17,160 29.1 21.3
Principal Accommodation………………………………………………………………………….18,219 25.6 18.0 15,471 26.2 19.2
Other Accommodation…………………………………………………………………..2,457 3.5 2.4 1,689 2.9 2.1
Household Operation…………………………………………………………………..4,907 6.9 4.9 4,393 7.4 5.4
Household Furnishings And Equipment………………………………………………………..2,359 3.3 2.3 2,067 3.5 2.6
Clothing And Accessories………………………………………………………………4,378 6.1 4.3 3,503 5.9 4.3
Transportation…………………………………………………………….15,402 21.6 15.3 11,891 20.1 14.7
Health Care………………………………………………………………….2,515 3.5 2.5 2,251 3.8 2.8
Personal Care…………………………………………………………………………1,425 2.0 1.4 1,207 2.0 1.5
Recreation…………………………………………………………………..5,147 7.2 5.1 3,843 6.5 4.8
Education…………………………………………………………………………1,442 2.0 1.4 1,502 2.5 1.9
Reading Materials And Other Printed Matter………………………………………………………………..207 0.3 0.2 144 0.2 0.2
Tobacco Products And Alcoholic Beverages………………………………………………………………..1,637 2.3 1.6 1,222 2.1 1.5
Games Of Chance………………………………………………………………….167 0.2 0.2 156 0.3 0.2
Miscellaneous Expenditures……………………………………………………………………………………..2,210 3.1 2.2 1,608 2.7 2.0
Income Taxes………………………………………………………………………………..21,294 21.1 14,867 18.4
Personal Insurance Payments/Pension Contributions…………………………………………..…..5,928 5.9 4,871 6.0
Gifts of Money/Support Pymts./Charitable Contributions…. 2,524 2.5 1,934 2.4
Food Purchased From Stores…………………………………………………….6,223 100.0 5,880 100.0
Bakery Products……………………………………………………….. 506 8.1 562 9.6
Bread and Unsweetened Rolls and Buns…………………………………………………….232 3.7 257 4.4
Cookies and Crackers………………………………………………………..105 1.7 115 2.0
Other Bakery Products……………………………………………. 169 2.7 191 3.2
Cereal Grains And Cereal Products……………………………………………………………….339 5.4 327 5.6
Rice and Rice Mixes………………………………………………………………..53 0.9 41 0.7
Pasta Products……………………………………………………………….48 0.8 54 0.9
Other Cereal Grains and Cereal Products…………………………………………………………..237 3.8 231 3.9
Fruit, Fruit Preparations and Nuts……………………………………………………..745 12.0 719 12.2
Fresh Fruit…………………………………………………………. 491 7.9 465 7.9
Preserved Fruit and Fruit Preparations……………………………………………………..170 2.7 173 2.9
Nuts and Seeds…………………………………………………… 84 1.3 81 1.4
Vegetables and Vegetable Preparations…………………………………………………..676 10.9 675 11.5
Fresh Vegetables…………………………………………………. 485 7.8 515 8.8
Frozen and Dried Vegetables………………………………………..45 0.7 43 0.7
Canned Vegetables/Other Veg. Preparations………………………….145 2.3 117 2.0
Dairy Products and Eggs……………………………………………………………………..917 14.7 864 14.7
Cheese……………………………………………………………. 331 5.3 281 4.8
Milk…………………………………………………………………………..194 3.1 202 3.4
Butter…………………………………………………………………… 29 0.5 38 0.6
Ice Cream and Ice Milk (Including Novelties)……………………………………………………………………………76 1.2 61 1.0
Other Dairy Products……………………………………………………208 3.3 204 3.5
Eggs and Other Egg Products……………………………………………………………………..80 1.3 76 1.3
Meat and Processed Meat…………………………...……………………………………….. 1,240 19.9 1,182 20.1
Beef………………………………………………………………… 270 4.3 315 5.4
Pork……………………………………………………………….. 137 2.2 137 2.3
Poultry…………………………………………………………….. 345 5.5 271 4.6
Processed Meat……………………………………………………..461 7.4 419 7.1
Fish and Seafood…………………………………………………………….182 2.9 211 3.6
Non-Alcoholic Beverages/Other Food Products……………………………………………….1,618 26.0 1,342 22.8
Coffee and Tea……………………………………………………. 199 3.2 153 2.6
Non-Alcoholic Beverages…………………………………………………………..292 4.7 220 3.7
Sugar and Confectionery……………………………………………………….261 4.2 248 4.2
Margarine, Oils and Fats (Excluding Butter)………………………………………………………………55 0.9 60 1.0
Condiments, Spices and Vinegars………………………………………………………………304 4.9 229 3.9
Frozen Prepared Food………………………………………………………………………………..143 2.3 116 2.0
Ready-To-Serve Prepared Food……………………………………………………………………………..85 1.4 65 1.1
Snack Food…………………………………………………………. 75 1.2 80 1.4
Food Purchased From Restaurants…………………………………………………………….2,517 2,229
(1) Average spending for a specific good or service is calculated for all households, including those with and those without expenditures for the category.
Average spending includes sales tax.
Source: Statistics Canada, 2014 Survey of Household Spending (SHS); CANSIM Database Table Numbers 203-0021 and 203-0028
Table 27: Average Household Food Expenditures, Alberta and
Canada, 2014
% of Food
Purchased From
Stores
% of Food
Purchased From
Stores
Alberta
(Dollars)
Canada
(Dollars)
Alberta Agriculture Statistics Yearbook, 2015 - 44 -

Units 2006r 2007r 2008r 2009r 2010r 2011r 2012r 2013r 2014r 2015p
Wheat Flour…………………………………………kg 66.91 66.69 62.76 63.34 62.53 60.61 60.21 59.13 58.49 58.11
Rice……………………………………………………. kg 7.42 7.47 6.98 7.05 6.82 6.81 6.47 7.40 7.06 6.86
Breakfast Food………………………………………………………………….. kg 5.55 5.67 5.71 5.76 5.64 5.52 5.44 5.17 5.08 5.05
Sugar (Refined)……………………………….. kg 30.52 30.29 31.15 31.70 29.75 30.15 28.90 30.34 30.04 29.24
Tea…………………………………………………………litres 62.06 85.80 91.94 77.45 111.00 96.96 68.87 71.59 84.35 69.08
Coffee……………………………………………………………………………litres 101.17 104.18 102.93 105.60 106.68 104.54 104.40 103.52 103.09 101.97
Ale/Beer/Stout, Pop.15 Yrs.+………………………………….litres 83.16 83.42 82.98 82.75 82.81 79.60 79.56 77.31 75.17 74.96
Distilled Spirits, Pop. 15 Yrs. +……………………………………………..litres 5.38 5.48 5.54 5.54 5.40 5.40 5.42 5.44 5.28 5.31
Wines, Pop. 15 Yrs. +…………………………………………………………………….litres 12.95 13.58 14.04 14.35 14.63 14.90 15.24 15.51 15.48 15.96
Soft Drinks……………………………………………………………………litres 100.36 90.47 86.25 84.77 82.53 80.32 76.67 72.32 68.53 65.33
Processed Cheese……………………………………………………………..kg 2.30 2.24 2.13 2.10 1.86 2.06 1.99 1.92 1.78 1.57
Concentrated Whole Milk………………………………………………..litres 0.65 0.74 0.83 0.69 0.73 0.74 0.61 0.55 0.57 0.54
Ice Cream………………………………………………………………………..litres 9.21 8.02 6.89 5.53 5.54 5.44 5.53 5.11 5.48 4.43
Standard Milk 3.25%............................................................................litres 12.36 11.95 11.34 11.18 10.57 10.46 10.28 10.24 10.16 10.08
Skim Milk………………………………………………………………..litres 8.71 8.76 8.69 8.61 8.32 8.21 7.86 7.23 6.55 5.58
Yogurt………………………………………………………………………….litres 7.21 7.40 7.92 8.04 8.56 8.91 9.99 9.51 9.62 10.85
Sour Cream………………………………….litres 1.50 1.47 1.37 1.24 1.21 1.25 1.31 1.28 1.30 1.18
Eggs……………………………………………………………………….kg (2) 11.47 11.00 11.53 11.40 11.64 12.01 12.34 12.86 13.32 13.81
Chicken…………………………………. kg (3) 32.85 33.10 33.08 32.74 32.94 32.61 32.97 32.97 33.45 34.98
Turkey…………………………………. kg (3) 4.31 4.33 4.58 4.49 4.34 4.24 4.18 4.24 4.08 4.16
Pork………………………..……………………………………………………kg (4) 23.40 25.14 23.89 23.57 22.06 21.50 22.30 20.90 20.64 22.63
Beef…………………………..………………………………………………….kg (4) 29.94 30.60 29.76 28.28 27.88 27.26 27.60 27.34 26.44 24.40
Veal……………………..……………………..kg (4) 1.05 1.08 1.01 1.01 1.08 1.03 0.97 0.93 0.92 0.87
Mutton and Lamb……………………………………..…..kg (4) 1.21 1.22 1.17 1.16 1.09 1.06 0.97 1.00 1.05 1.04
Offal………………………………………. kg (4) 1.20 1.07 0.91 1.36 1.16 0.52 0.68 0.52 0.45 1.08
Butter……………………………………………….kg 2.70 2.59 2.64 2.67 2.69 2.82 2.85 2.71 2.81 2.74
Margarine…………………………………………………………………….kg 3.96 3.94 3.78 3.72 3.53 3.47 3.37 3.17 3.04 2.97
Salad Oils………………………………………………………….kg (5) 12.38 12.39 12.89 13.13 13.31 13.37 13.90 14.07 14.23 14.16
Apples, Fresh………………………………………………………………………………..kg 11.24 10.52 10.89 11.84 11.14 11.28 10.74 10.92 11.46 10.94
Bananas, Fresh…………………………………………………………………..kg 14.06 14.33 14.35 14.32 14.58 14.75 14.75 15.43 15.61 15.67
Blueberries, Fresh………………………………………………………………kg 0.73 0.91 1.13 1.11 1.29 1.40 1.18 1.28 1.06 0.68
Strawberries, Fresh………………………………………………………………………..kg 2.98 3.06 3.05 3.31 3.48 3.82 3.83 3.70 3.12 3.07
Cherries, Fresh………………………………………………………………………..kg 0.69 0.83 0.81 1.09 0.87 0.95 1.15 0.79 0.92 0.68
Oranges, Fresh………………………………………………………………….kg 9.53 8.63 9.52 8.94 9.27 9.29 9.02 9.00 8.31 9.06
Grapefruits, Fresh………………………………………………………………kg 1.42 1.61 1.50 1.36 1.30 1.28 1.23 1.19 1.12 1.11
Asparagus, Fresh…………………………………………………………………kg 0.60 0.59 0.64 0.70 0.71 0.75 0.71 0.67 0.70 0.60
Beets, Fresh…………………………………………………………….kg 0.48 0.38 0.33 0.52 0.53 0.64 0.72 0.68 0.71 0.92
Broccoli, Fresh…………………………………………………………kg 2.98 3.11 2.90 2.90 2.67 2.39 2.53 2.64 2.70 2.70
Cabbage, Fresh…………………………………………..………..kg 3.55 3.14 3.62 4.28 3.61 4.07 4.43 4.24 4.14 3.90
Carrots, Fresh……………………………………………………kg 6.64 6.62 6.19 7.12 9.43 8.77 8.69 7.17 6.24 7.52
Cucumbers, Fresh…………………………………kg 3.13 2.70 2.65 3.44 3.46 3.42 3.55 3.28 3.43 3.15
Garlic, Fresh……………………………………………………………………...kg 0.34 0.45 0.44 0.44 0.39 0.46 0.46 0.48 0.48 0.49
Lettuce, Fresh……………………………………………………….kg 10.60 10.06 9.67 9.42 9.63 9.79 9.40 9.38 9.55 9.60
Mushrooms, Fresh…………………………………………………………………kg 1.68 1.61 1.90 1.72 1.44 1.62 1.81 1.78 1.87 1.74
Onions and Shallots, Fresh…………………kg 8.15 8.41 6.11 8.58 8.64 8.78 8.76 8.17 8.51 9.07
Peas, Fresh…………………………………………………………..kg 0.34 0.30 0.29 0.31 0.28 0.29 0.16 0.27 0.22 0.21
Potatoes, Frozen………………………………………………………….kg 8.41 7.63 6.89 6.69 7.89 6.01 8.02 7.38 6.91 7.27
Potatoes, White, Fresh………………………………………………………kg (6) 29.33 27.38 25.60 24.73 25.23 22.37 27.25 28.35 23.01 22.27
Spinach, Fresh……………………………………………………kg 0.53 0.54 0.60 0.66 0.74 0.75 0.82 0.89 0.96 0.94
Tomatoes, Fresh………………………………………………….kg 7.28 7.52 8.05 8.15 7.96 8.16 8.13 8.58 8.36 8.08
Tomatoes, Canned……………………………………………………kg 4.03 4.00 3.96 3.75 3.85 4.02 3.93 3.95 3.72 3.67
Fresh/Frozen Sea Fish……………………….kg (7) 3.99 3.94 3.26 3.63 3.45 3.49 2.94 3.60 3.31 2.84
(2) In fresh equivalent weight.
(3) Eviscerated weight. Note: Use data with caution.
(4) In carcass weight.
(5) As of 2007, "salad oils" include olive oil.
(6) Includes seed potatoes.
(7) In edible weight.
Source: Statistics Canada, CANSIM Database Table Number 002-0011
Table 28: Food Available Per Person for Selected Products (1), Canada,
2006-2015
(1) The data in this table represent food available for consumption and not actual quantities of food consumed since they do not allow for losses
such as waste and/or spoilage in stores, households, private institutions or restaurants.
- 45 - Alberta Agriculture Statistics Yearbook, 2015

2006 2007 2008 2009 2010 2011 2012 2013 2014 2015p
Total Receipts……………….…………………………..6,050,872 6,409,540 6,618,399 6,526,605 6,665,414 7,082,169 7,662,228 8,169,148 8,685,279 8,762,633
Special Food Services (1)…………………….420,492 ... 541,023 473,027 504,458 601,731 684,433 652,507 692,888 634,469
Drinking Places (2)………………………...442,473 409,423 374,006 357,652 318,788 308,104 327,120 334,835 333,358 311,238
Full-Service Restaurants………………………………………..2,702,921 2,860,482 2,891,090 2,793,156 2,830,353 3,040,660 3,259,340 3,551,779 3,818,869 3,769,950
Limited-Service Eating Places…………………………………………….2,484,983 2,647,766 2,812,279 2,902,770 3,011,813 3,131,677 3,391,335 3,630,024 3,840,162 4,046,976
(1) Special food services include contractors, social caterers and mobile food services.
(2) Drinking places with alcoholic beverages.
Source: Statistics Canada, CANSIM Database Table Number 355-0006
2006 2007 2008 2009 2010 2011 2012 2013 2014 2015p
Total Retail Sales………………………………………………………………………………....……….55,973.1 61,490.2 61,619.6 56,489.2 59,848.9 63,945.0 68,407.5 73,108.7 78,582.1 74,989.4
Food and Beverage Stores……………………………………………………...……..11,153.2 11,897.1 12,464.0 12,625.1 12,946.3 13,028.8 13,370.2 13,746.1 14,343.4 14,247.3
% Share of Total Retail Sales…………………………………...…………………………………19.9 19.3 20.2 22.3 21.6 20.4 19.5 18.8 18.3 19.0
Total Grocery Stores……………………………………………………………………………………..x x x x 10,338.8 10,308.1 10,657.1 10,907.8 11,308.2 11,098.7
Supermarkets and Other
Grocery Stores……...…………………………………………………………………..….8,439.8 8,841.8 9,176.6 9,196.2 9,409.0 9,512.6 9,891.2 10,148.8 10,588.4 10,330.6
Convenience Stores……………………………………………………………………………….x x x x 929.8 795.5 765.9 759.0 719.8 768.1
Specialty Food Stores…………………………………………………………………………..x x x x 393.6 426.7 446.7 518.0 515.0 514.9
Beer, Wine and Liquor Stores.……………………………………………………………………………………………1,682.3 1,898.4 2,080.0 2,218.7 2,213.9 2,294.0 2,266.5 2,320.3 2,520.2 2,633.7
Source: Statistics Canada, CANSIM Database Table Number 080-0020
Source: Statistics Canada, CANSIM Database Table Number 080-0020
Table 29: Alberta Food Services and Drinking Places, 2006-2015
$ Millions
Table 30: Alberta Retail Sales for Food and Beverage Stores, 2006-2015
$ Millions
2007 2008 2009 2010 2011 2012 2013 2014 2015
Food and Beverage Stores 6.7 4.8 1.3 2.5 0.6 2.6 2.8 4.3 -0.7
Total Retail Sales 9.9 0.2 -8.3 5.9 6.8 7.0 6.9 7.5 -4.6
-10.0
-5.0
0.0
5.0
10.0
15.0
20.0
Fig. 13 Alberta Retail Sales for Food and Beverage Stores,
Annual Per Cent Change, 2007-2015
Per
Cen
t C
han
ge
Alberta Agriculture Statistics Yearbook, 2015 - 46 -
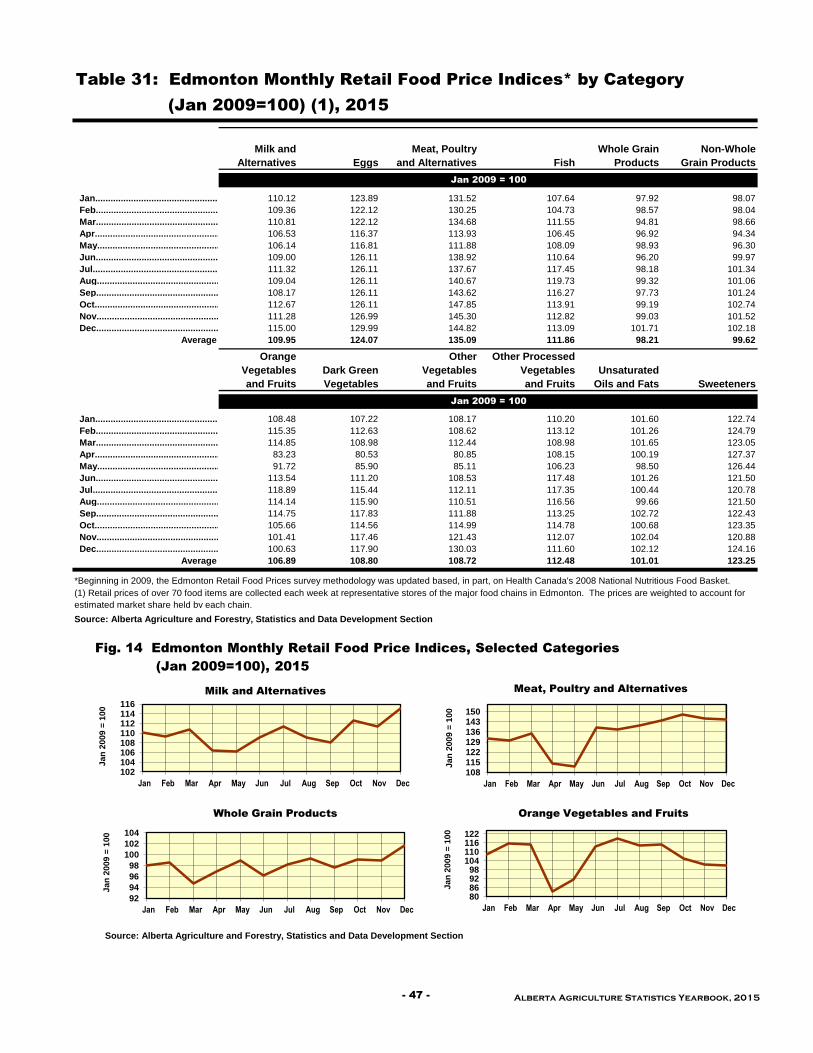
Milk and
Alternatives Eggs
Meat, Poultry
and Alternatives Fish
Whole Grain
Products
Non-Whole
Grain Products
Jan................................................. 110.12 123.89 131.52 107.64 97.92 98.07
Feb......................................................................................109.36 122.12 130.25 104.73 98.57 98.04
Mar..................................................................................110.81 122.12 134.68 111.55 94.81 98.66
Apr....................................................................................106.53 116.37 113.93 106.45 96.92 94.34
May........................................................................................106.14 116.81 111.88 108.09 98.93 96.30
Jun........................................................................................109.00 126.11 138.92 110.64 96.20 99.97
Jul............................................................................................111.32 126.11 137.67 117.45 98.18 101.34
Aug...........................................................................................109.04 126.11 140.67 119.73 99.32 101.06
Sep...............................................................................108.17 126.11 143.62 116.27 97.73 101.24
Oct.......................................................................................112.67 126.11 147.85 113.91 99.19 102.74
Nov..............................................................................111.28 126.99 145.30 112.82 99.03 101.52
Dec..................................................................................115.00 129.99 144.82 113.09 101.71 102.18
Average 109.95 124.07 135.09 111.86 98.21 99.62
Orange
Vegetables
and Fruits
Dark Green
Vegetables
Other
Vegetables
and Fruits
Other Processed
Vegetables
and Fruits
Unsaturated
Oils and Fats Sweeteners
Jan................................................. 108.48 107.22 108.17 110.20 101.60 122.74
Feb......................................................................................115.35 112.63 108.62 113.12 101.26 124.79
Mar..................................................................................114.85 108.98 112.44 108.98 101.65 123.05
Apr....................................................................................83.23 80.53 80.85 108.15 100.19 127.37
May........................................................................................91.72 85.90 85.11 106.23 98.50 126.44
Jun........................................................................................113.54 111.20 108.53 117.48 101.26 121.50
Jul............................................................................................118.89 115.44 112.11 117.35 100.44 120.78
Aug...........................................................................................114.14 115.90 110.51 116.56 99.66 121.50
Sep...............................................................................114.75 117.83 111.88 113.25 102.72 122.43
Oct.......................................................................................105.66 114.56 114.99 114.78 100.68 123.35
Nov..............................................................................101.41 117.46 121.43 112.07 102.04 120.88
Dec..................................................................................100.63 117.90 130.03 111.60 102.12 124.16
Average 106.89 108.80 108.72 112.48 101.01 123.25
May
Jun
Jul
Aug
Sep
Oct
Nov
Dec
Source: Alberta Agriculture and Forestry, Statistics and Data Development Section
Jan 2009 = 100
Table 31: Edmonton Monthly Retail Food Price Indices* by Category
(Jan 2009=100) (1), 2015
Jan 2009 = 100
(1) Retail prices of over 70 food items are collected each week at representative stores of the major food chains in Edmonton. The prices are weighted to account for
estimated market share held by each chain.
Source: Alberta Agriculture and Forestry, Statistics and Data Development Section
*Beginning in 2009, the Edmonton Retail Food Prices survey methodology was updated based, in part, on Health Canada's 2008 National Nutritious Food Basket.
Fig. 14 Edmonton Monthly Retail Food Price Indices, Selected Categories
(Jan 2009=100), 2015
102104106108110112114116
Jan Feb Mar Apr May Jun Jul Aug Sep Oct Nov Dec
Jan
2009 =
100
Milk and Alternatives
108115122129136143150
Jan Feb Mar Apr May Jun Jul Aug Sep Oct Nov Dec
Ja
n 2
00
9 =
10
0
Meat, Poultry and Alternatives
80869298
104110116122
Jan Feb Mar Apr May Jun Jul Aug Sep Oct Nov Dec
Ja
n 2
00
9 =
10
0
Orange Vegetables and Fruits
92
94
96
98
100
102
104
Jan Feb Mar Apr May Jun Jul Aug Sep Oct Nov Dec
Jan
2009 =
100
Whole Grain Products
- 47 - Alberta Agriculture Statistics Yearbook, 2015
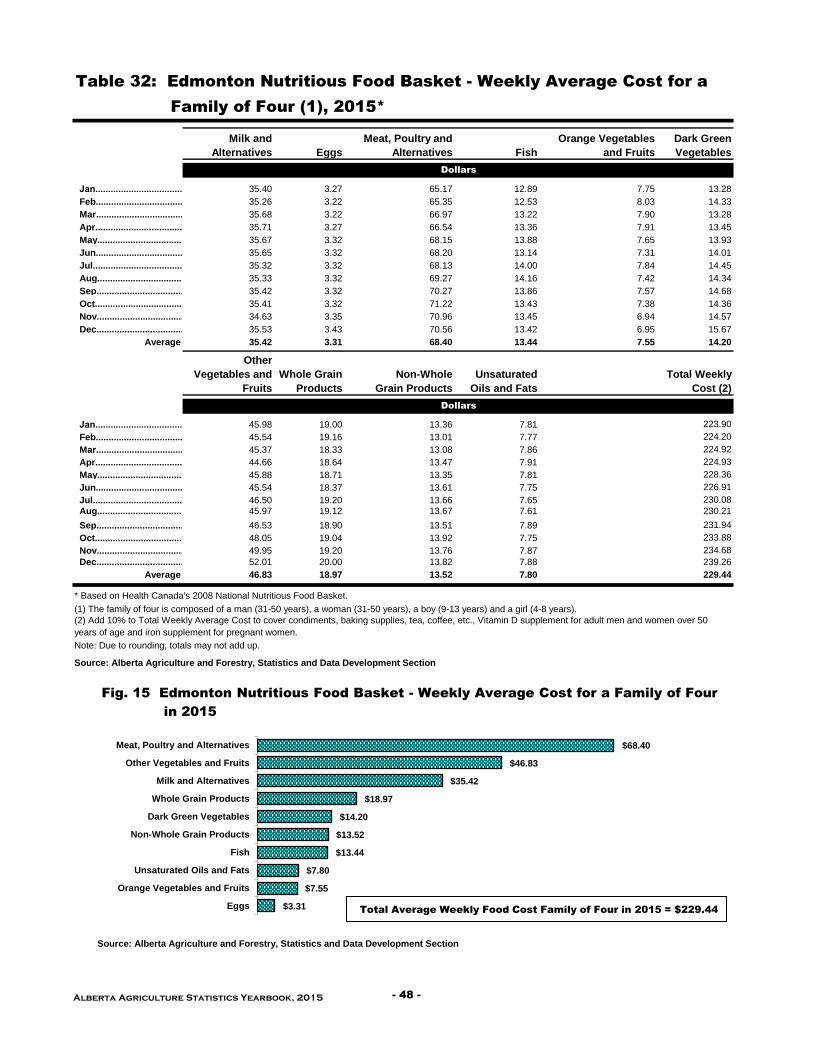
Milk and
Alternatives Eggs
Meat, Poultry and
Alternatives Fish
Orange Vegetables
and Fruits
Dark Green
Vegetables
Jan................................................................…35.40 3.27 65.17 12.89 7.75 13.28
Feb......................................................................35.26 3.22 65.35 12.53 8.03 14.33
Mar.......................................... 35.68 3.22 66.97 13.22 7.90 13.28
Apr.......................................... 35.71 3.27 66.54 13.36 7.91 13.45
May.......................................... 35.67 3.32 68.15 13.88 7.65 13.93
Jun........................................................ 35.65 3.32 68.20 13.14 7.31 14.01
Jul........................................................ 35.32 3.32 68.13 14.00 7.84 14.45
Aug........................................................ 35.33 3.32 69.27 14.16 7.42 14.34
Sep...................................................... 35.42 3.32 70.27 13.86 7.57 14.68
Oct........................................................ 35.41 3.32 71.22 13.43 7.38 14.36
Nov..................................................... 34.63 3.35 70.96 13.45 6.94 14.57
Dec......................................................... 35.53 3.43 70.56 13.42 6.95 15.67
Average 35.42 3.31 68.40 13.44 7.55 14.20
Other
Vegetables and
Fruits
Whole Grain
Products
Non-Whole
Grain Products
Unsaturated
Oils and Fats
Jan................................................................…45.98 19.00 13.36 7.81
Feb......................................................................45.54 19.16 13.01 7.77
Mar.......................................... 45.37 18.33 13.08 7.86
Apr.......................................... 44.66 18.64 13.47 7.91
May.......................................... 45.88 18.71 13.35 7.81
Jun........................................................ 45.54 18.37 13.61 7.75
Jul........................................................ 46.50 19.20 13.66 7.65 Aug........................................................ 45.97 19.12 13.67 7.61
Sep...................................................... 46.53 18.90 13.51 7.89
Oct........................................................ 48.05 19.04 13.92 7.75
Nov..................................................... 49.95 19.20 13.76 7.87
Dec......................................................... 52.01 20.00 13.82 7.88
Average 46.83 18.97 13.52 7.80
(1) The family of four is composed of a man (31-50 years), a woman (31-50 years), a boy (9-13 years) and a girl (4-8 years).
(2) Add 10% to Total Weekly Average Cost to cover condiments, baking supplies, tea, coffee, etc., Vitamin D supplement for adult men and women over 50
years of age and iron supplement for pregnant women.
Note: Due to rounding, totals may not add up.
239.26
Source: Alberta Agriculture and Forestry, Statistics and Data Development Section
229.44
Source: Alberta Agriculture and Forestry, Statistics and Data Development Section
* Based on Health Canada's 2008 National Nutritious Food Basket.
228.36
226.91
230.21
231.94
233.88
234.68
230.08
224.20
224.92
224.93
Dollars
Total Weekly
Cost (2)
Dollars
Table 32: Edmonton Nutritious Food Basket - Weekly Average Cost for a
Family of Four (1), 2015*
223.90
Fig. 15 Edmonton Nutritious Food Basket - Weekly Average Cost for a Family of Four
in 2015
$3.31
$7.55
$7.80
$13.44
$13.52
$14.20
$18.97
$35.42
$46.83
$68.40
Eggs
Orange Vegetables and Fruits
Unsaturated Oils and Fats
Fish
Non-Whole Grain Products
Dark Green Vegetables
Whole Grain Products
Milk and Alternatives
Other Vegetables and Fruits
Meat, Poultry and Alternatives
Total Average Weekly Food Cost Family of Four in 2015 = $229.44
Alberta Agriculture Statistics Yearbook, 2015 - 48 -

Canada U.S. Canada U.S. Canada U.S. Canada U.S. Canada (2) U.S.
1986......................... 38.2 49.0 1.6 1.0 0.9 0.7 27.9 28.5 25.1 32.5
1987....................... 36.3 47.2 1.5 0.8 0.9 0.7 27.5 28.7 26.5 35.1
1988......................... 36.3 46.8 1.3 0.7 0.8 0.7 28.0 30.6 27.4 36.3
1989........................ 35.3 44.4 1.4 0.7 0.8 0.7 28.7 30.4 27.1 38.2
1990..................... 34.0 43.6 1.5 0.6 0.8 0.7 26.1 29.1 28.1 40.1
1991...................... 33.3 43.2 1.5 0.5 0.9 0.7 25.9 29.3 28.3 41.6
1992....................... 32.4 42.9 1.5 0.6 0.8 0.7 28.4 30.8 28.8 43.1
1993...................... 31.1 41.8 1.4 0.5 0.9 0.7 27.6 30.3 29.2 43.7
1994......................... 31.7 43.3 1.3 0.5 0.8 0.6 28.4 30.7 30.9 44.4
1995..................... 31.7 43.4 1.4 0.5 0.8 0.6 27.8 30.2 30.6 44.1
1996......................... 31.4 43.5 1.3 0.6 0.8 0.5 25.9 28.3 30.8 45.0
1997........................ 31.4 42.6 1.4 0.6 0.7 0.5 25.4 27.9 31.8 45.7
1998...............................31.9 43.2 1.3 0.4 0.8 0.6 28.7 30.1 32.6 46.2
1999...............................32.6 43.7 1.3 0.4 0.9 0.6 30.1 30.8 33.8 48.5
2000...............................32.0 43.9 1.3 0.4 0.9 0.6 28.7 29.9 35.3 49.0
2001.......................................30.8 43.0 1.3 0.3 1.0 0.6 28.9 29.4 36.5 49.0
2002.......................................30.6 43.9 1.3 0.3 1.0 0.6 27.8 30.1 36.8 51.3
2003........................................32.4 42.1 1.2 0.3 1.1 0.6 25.1 30.3 35.8 51.8
2004r.......................................31.2 42.9 1.2 0.3 1.1 0.6 26.8 30.1 36.4 52.8
2005r.......................................30.3 42.5 1.1 0.3 1.1 0.5 23.1 29.3 36.9 53.6
2006r.......................................29.9 42.7 1.1 0.2 1.2 0.5 23.4 28.9 37.2 54.0
2007r.......................................30.6 42.3 1.1 0.2 1.2 0.6 25.1 29.7 37.4 53.5
2008r.......................................29.8 40.5 1.0 0.2 1.2 0.5 23.9 28.9 37.7 52.7
2009r.......................................28.3 39.6 1.0 0.2 1.2 0.5 23.6 29.3 37.2 50.4
2010r.......................................27.9 38.6 1.1 0.2 1.1 0.5 22.1 27.9 37.3 51.6
2011r.......................................27.3 37.1 1.0 0.2 1.1 0.4 21.5 26.7 36.9 51.7
2012r………………………………………..27.6 37.2 1.0 0.2 1.0 0.4 22.3 26.8 37.2 50.3
2013r………………………………..…27.3 36.5 0.9 0.2 1.0 0.5 20.9 27.4 37.2 51.0
2014r………………………………..…26.4 35.1 0.9 0.1 1.1 0.5 20.6 27.1 37.5 51.6
2015p………………………………..…24.4 35.0 0.9 0.1 1.0 0.5 22.6 29.1 39.1 54.6
Table 33: Per Capita Consumption of Meats in Canada and
United States, 1986-2015
Beef Veal Mutton/Lamb Pork Poultry (1)
kg/year
Source: Statistics Canada, CANSIM Database Table Number 002-0011; and Livestock Market Information Center
Note: Carcass weight figures for beef, veal, mutton/lamb and pork. Eviscerated (carcass) weight figures for total poultry.
(1) Total poultry includes stewing hens, chickens and turkeys, (2) Due to changes in methodology for Canadian poultry from 2002, use the numbers with caution.
Source: Statistics Canada, CANSIM Database Table Number 002-0011; and Livestock Market Information Center
15
20
25
30
35
40
45
50
55
60
1986 1990 1994 1998 2002 2006 2010 2014
kg
/year
15
20
25
30
35
40
45
50
55
60
1986 1990 1994 1998 2002 2006 2010 2014
kg
/year
Fig. 16 Beef and Poultry Consumption in Canada and United States, 1986-2015
PoultryBeef
Canada
United States United States
Canada
- 49 - Alberta Agriculture Statistics Yearbook, 2015

Colonies
Per
Beekeepers Colonies Beekeeper Yield per Colony Production Price Value
kg tonnes $/kg $'000
1997.............................................................725 175,000 241 61 10,716 2.43 26,039.0
1998....................................... 730 205,000 281 85 17,389 1.96 34,000.0
1999....................................... 725 205,000 283 55 11,251 1.79 20,157.5
2000....................................... 747 217,000 290 50 10,926 1.81 19,741.4
2001....................................... 739 227,000 307 54 12,150 2.26 27,488.0
2002....................................... 700 227,000 324 59 13,488 4.32 58,320.0
2003........................................ 755 221,000 293 57 12,630 4.50 56,845.0
2004....................................... 695 248,000 357 61 15,186 3.32 50,455.0
2005....................................... 728 251,000 345 58 14,459 2.17 31,428.0
2006....................................... 733 254,000 347 83 21,199 2.19 46,375.0
2007....................................... 726 237,000 326 55 13,115 2.26 29,627.0
2008....................................... 620 226,000 365 52 11,789 3.20 37,755.0
2009....................................... 683 251,000 367 53 13,207 3.70 48,837.0
2010....................................... 769 266,000 346 59 15,685 3.58 56,230.0
2011....................................... 798 274,600 344 56 15,445 3.83 59,168.0
2012....................................... 883 278,400 315 62 17,237 3.96 68,340.0
2013....................................... 890 278,100 312 54 15,059 4.84 72,905.0
2014r.......................................1,015 282,900 279 57 16,103 4.95 79,788.0
2015p.......................................1,000 295,000 295 66 19,394 4.82 93,418.0
31489
28112
-10.72%
57.28%
9.92%
48.32%
Table 34: Alberta Honey Statistics, 1997-2015
Source: Statistics Canada, CANSIM Database Table Number 001-0007
Number
Honey
Source: Statistics Canada, CANSIM Database Table Number 001-0007
$ Millions
0
5,000
10,000
15,000
20,000
25,000
2006 2007 2008 2009 2010 2011 2012 2013 2014 2015
ton
nes
Fig. 17 Honey Production in Alberta, 2006-2015
Ten-Year Average
2006-2015 is 15,823 tonnes
Alberta Agriculture Statistics Yearbook, 2015 - 50 -

Page No.
Alberta Agri-Food Exports in 2015…………………………………………..…………………………………………………………52
Table No.
35. Alberta International Agri-Food Exports - Value, 1989-2015..............................................................................................................…53
36. Agri-Food Exports by Type of Product, Alberta and Canada - Value, 2006-2015....................................................................................................…54
37. Alberta Agri-Food Exports by Product - Value, 2011-2015....................................................................................................…55
38. Alberta Agri-Food Exports by Product - Quantity, 2011-2015...................................................................................................…56
39. Alberta Wheat Exports by Country - Value and Quantity, 2011-2015…………………………………………………….........................................................………………..............…………….57
40. Alberta Beef Exports by Country - Value, 2011-2015…….............................................................………….............................................................……………………. 58
41. Alberta Beef Exports by Country - Quantity, 2011-2015…….............................................................………….............................................................……………………. 59
42. Alberta Agri-Food Exports by Country - Value, 2011-2015……….................................................................................................................………………….60
43. Alberta Agri-Food Exports to The United States - Value, 2011-2015…………….............................................................……………..61
44. Alberta Agri-Food Exports to Japan - Value, 2011-2015…………………….............................................................…………………..62
45. Alberta Agri-Food Exports to Mexico - Value, 2011-2015…………………….............................................................…………………..63
46. Alberta Agri-Food Exports to China - Value, 2011-2015…………………….............................................................…………………..64
47. Alberta Agri-Food Exports to Asia - Value, 2011-2015……………..................................................................................................................…………………65
48. Alberta Agri-Food Exports to EU (28) and TPP Countries - Value, 2011-2015……………..................................................................................................................…………………66
(1) Source: Statistics Canada "Canadian International Merchandise Trade" - Technical notes
(2) Source: Alberta Agriculture and Forestry, Statistics and Data Development Section
Alberta's international agri-food exports include exports of primary agricultural commodities (live animals and crops) and
processed agricultural and food products (value added exports). The latter includes food, beverages, animal feeds, and inedible
crude animal and plant products.
Information on Alberta agri-food exports is compiled by the Statistics and Data Development Section of Alberta Agriculture and
Forestry. Data are sourced from the International Trade Division of Statistics Canada.
Canadian international merchandise trade statistics are compiled from Canada Border Services Agency and U.S. Customs and
Border Protection administrative files. Customs-based export statistics may understate and/or incorrectly portray the destination
of exports or the province of origin. Inaccuracies of export data often result from the attribution of exports on a province of lading
basis rather than by province of origin. Also, the country of final destination may be inaccurately reported when exports are routed
through an intermediary country before continuing on to their final destination. For example, exports to the United States may be
overestimated and exports to other countries such as Mexico or Russia underestimated. As well, caution should be used when
reporting exports of some commodities/products, for example: hides and skins, tallow, peas, lentils, dehydrated alfalfa, peat moss,
etc. Alberta exports of these products may be underestimated.
Note: Statistics on Alberta agri-food exports presented in the Yearbook refer to non-adjusted export statistics and are subject to revision.
Trade Statistics - Definitions
Export Statistics (1)
International trade statistics are compiled by Statistics Canada according to the "General" system of trade defined by the
Statistical Office of the United Nations. Under this system, domestic exports include all goods grown, extracted or manufactured
in Canada, including goods of foreign origin which have been materially transformed in Canada.
Export statistics are classified and published according to the Harmonized Commodity Description and Coding System
(Harmonized System or HS). The HS is a product classification system used by almost all countries in reporting export statistics.
It is consistent for all countries to the 6-digit level.
Exports are, in principle, valued or recorded at the values declared on export documents, which usually reflect the transaction
value or the actual selling price. Canadian exports to overseas countries are valued at "Free on Board" (F.O.B.) port of exit
basis, including freight charges to that point but net of discounts and allowances. As of January, 1990, Canadian exports to the
U.S. are valued F.O.B. point of exit from Canada. Prior to 1990, they were valued F.O.B. place of lading net of freight charges,
discounts and allowances.
Alberta's Agri-Food Exports (2)
A
G
R
I
-
F
O
O
D
E
X
P
O
R
T
S
- 51 - Alberta Agriculture Statistics Yearbook, 2015
Alberta Agriculture Statistics Yearbook, 2015
- 52 -
Alberta Agri-Food Exports in 2015
In 2015, Alberta exports of primary and processed agricultural and food products (agri-food) set a new record at $10.2 billion, surpassing the 2014 record by 4.5 per cent. It was the first time that exports have exceeded the $10.0 billion mark. Gains were reported mainly in exports of value added products, owing to relatively high meat prices and the low Canadian dollar. Nationally, Alberta accounted for 18.1 per cent of the Canadian total, and remained the third largest exporter of agri-food products after Saskatchewan and Ontario.
Export Products In 2015, exports of value added products rose for the second consecutive year, up 12.5 per cent to $4.8 billion and represented 47.2
per cent of Alberta's total. Meats were the largest value added export, followed by french fries, canola oil, prepared animal feeds, canola
cake and meal, and malt. Exports of primary commodities (animals and crops), declined 1.8 per cent to $5.4 billion and accounted for
52.8 per cent of Alberta's total exports. The decline was a result of lower exports of oilseeds and live cattle.
In the crop sector, exports of major grains were slightly higher, while exports of oilseeds were lower in both value and quantity in 2015.
Wheat exports rose 3.6 per cent in value and 3.1 per cent in quantity. Top markets for wheat were the United States, Indonesia, Japan,
Peru and Bangladesh. Exports of canola seed declined 5.1 per cent in value and 6.4 per cent in quantity. For the third consecutive year,
China was the largest market for canola seed, followed by Japan, Mexico and Pakistan. Among the other crops, declines were reported
for dry peas, mustard seed and hay and fodder.
In the livestock sector, as a result of high prices, exports of beef rose 18.7 per cent to $1.7 billion with quantity up 2.1 per cent. While beef exports rose, exports of live cattle (excluding purebred) fell 18.1 per cent in value from the 2014 high, and the quantity was down 37.3 per cent. On the other hand, exports of live hogs increased in quantity but declined in value. Pork exports grew marginally in value, while quantity rose at a higher rate. The United States was Alberta's largest market for live cattle, hogs and beef.
Trading Partners In 2015, Alberta’s top export markets for agri-food products were the United States, China, Japan, Mexico and South Korea. Exports to these five countries were $7.5 billion, representing almost three-quarters of Alberta’s total agri-food exports. The United States continues to be Alberta's largest trading partner, accounting for 39.3 per cent of the total agri-food exports. In 2015,
exports to this market were $4.0 billion. Substantial increases occurred in exports of value added products such as meats, crude canola
oil, prepared animal feed, french fries and processed cereals. These increases moderated declines in primary commodity exports.
Commodity exports fell 18.6 per cent from 2014, mainly due to lower export values and quantities of major crops and live animals. The
United States remained Alberta's sole export market for non-purebred live cattle and hogs and accounted for 69.1 per cent of the
province's total beef exports (quantity).
Exports to China, Alberta's second largest market in 2015, grew 19.5 per cent to $1.6 billion. The growth was a result of significantly
larger exports of beef, crude canola oil and wheat. In 2012 and 2013, crude canola oil was the second largest export to China, after
canola seed. In 2015, beef became the second largest export after canola seed, growing from $39 million in 2014 to $235 million. Exports
of canola seed fell 11.9 per cent to $690 million. Canola seed, beef and crude canola oil combined, made up 70.7 per cent of Alberta's
total agri-food exports to China.
Exports to Japan, Alberta's third largest market, fell for the third year in a row and was down 8.1 per cent to $1.1 billion in 2015. Lower
exports of canola seed, wheat, barley and beef contributed to the decline. Canola seed ($357 million), the largest export to Japan, fell
15.2 per cent in value and 16.4 per cent in quantity. Moderating these declines were higher exports of pork, horse meat, malt, french fries
and processed cereals. Pork, the second largest export to this market rose 5.3 per cent to $199.0 million.
Exports to Mexico, Alberta's fourth largest market, rose 6.6 per cent to $572 million in 2015. Larger exports of beef, pork, malt, milled cereals and canola seed, partially offset lower exports of wheat. Beef exports grew 4.6 per cent to $143 million, while canola seed was up 1.6 per cent to $252 million. Canola seed, beef and wheat combined, made up 85.2 per cent of Alberta's total agri-food exports to this market. Exports to South Korea, Alberta's fifth largest export market, grew moderately by 2.1 per cent to $233 million in 2015. Substantial increases were reported in exports of hides and skins, crude canola oil and pork. On the other hand, exports of wheat, beef and malt fell from the 2014 high.
At the regional level, the largest exports were reported for North America and Asia. Exports to Asia rose 11.2 per cent to $3.9 billion or 38.7 per cent of Alberta’s total agri-food exports. The highest growth occurred in exports to Western Europe (22.6 per cent), Oceania (17.5 per cent), Africa (8.3 per cent) and Central America (7.9 per cent). On the other hand, exports to Eastern Europe, the Middle East and South America declined.
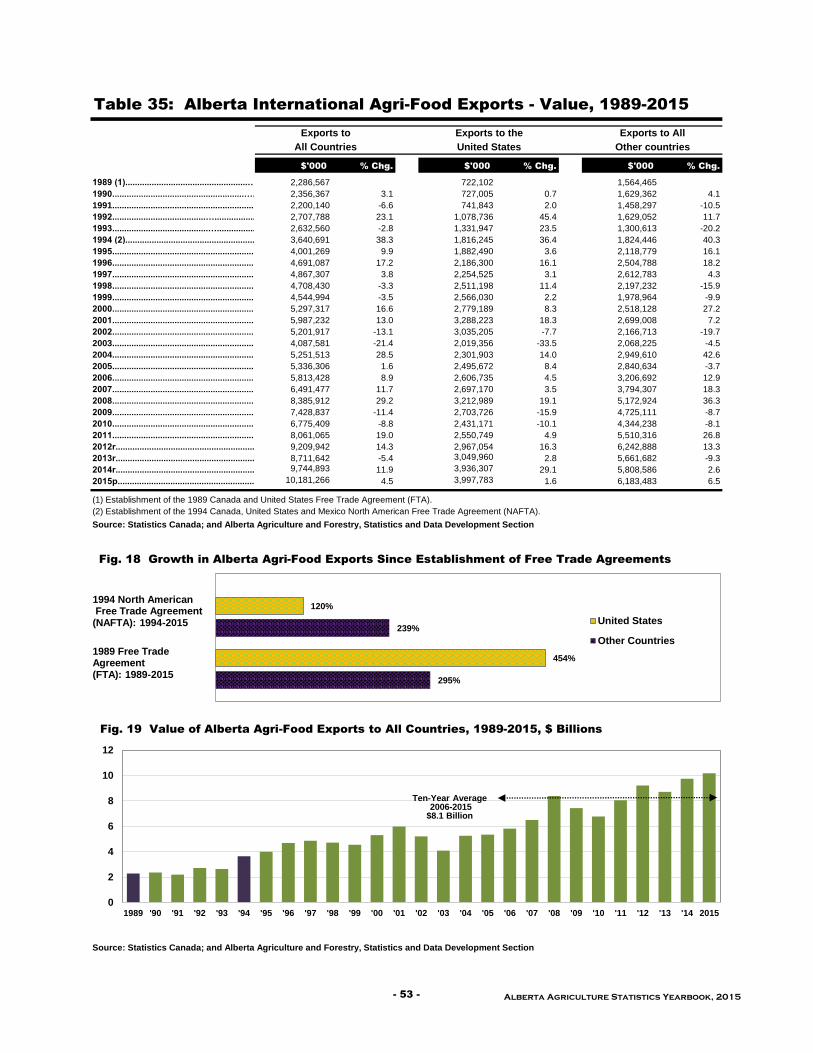
$'000 % Chg. $'000 % Chg. $'000 % Chg.
1989 (1)...................................................…...........................…2,286,567 722,102 1,564,465
1990.......................................................….............................2,356,367 3.1 727,005 0.7 1,629,362 4.1
1991........................................................................................2,200,140 -6.6 741,843 2.0 1,458,297 -10.5
1992.......................................….............................................2,707,788 23.1 1,078,736 45.4 1,629,052 11.7
1993........................................…............................................2,632,560 -2.8 1,331,947 23.5 1,300,613 -20.2
1994 (2).............................................................................…3,640,691 38.3 1,816,245 36.4 1,824,446 40.3
1995....................................................................................…4,001,269 9.9 1,882,490 3.6 2,118,779 16.1
1996....................................................................................…4,691,087 17.2 2,186,300 16.1 2,504,788 18.2
1997....................................................................................…4,867,307 3.8 2,254,525 3.1 2,612,783 4.3
1998..................................................................................…4,708,430 -3.3 2,511,198 11.4 2,197,232 -15.9
1999..................................................................................…4,544,994 -3.5 2,566,030 2.2 1,978,964 -9.9
2000...................................................................................…5,297,317 16.6 2,779,189 8.3 2,518,128 27.2
2001..................................................................................…5,987,232 13.0 3,288,223 18.3 2,699,008 7.2
2002................................................................................…5,201,917 -13.1 3,035,205 -7.7 2,166,713 -19.7
2003...................................................................................4,087,581 -21.4 2,019,356 -33.5 2,068,225 -4.5
2004...................................................................................5,251,513 28.5 2,301,903 14.0 2,949,610 42.6
2005...................................................................................5,336,306 1.6 2,495,672 8.4 2,840,634 -3.7
2006.................................................................… 5,813,428 8.9 2,606,735 4.5 3,206,692 12.9
2007.................................................................… 6,491,477 11.7 2,697,170 3.5 3,794,307 18.3
2008.................................................................… 8,385,912 29.2 3,212,989 19.1 5,172,924 36.3
2009.................................................................… 7,428,837 -11.4 2,703,726 -15.9 4,725,111 -8.7
2010.................................................................… 6,775,409 -8.8 2,431,171 -10.1 4,344,238 -8.1
2011.................................................................… 8,061,065 19.0 2,550,749 4.9 5,510,316 26.8
2012r.................................................................… 9,209,942 14.3 2,967,054 16.3 6,242,888 13.3
2013r.................................................................… 8,711,642 -5.4 3,049,960 2.8 5,661,682 -9.3
2014r.................................................................… 9,744,893 11.9 3,936,307 29.1 5,808,586 2.6
2015p.................................................................… 10,181,266 4.5 3,997,783 1.6 6,183,483 6.5
(1) Establishment of the 1989 Canada and United States Free Trade Agreement (FTA).
(2) Establishment of the 1994 Canada, United States and Mexico North American Free Trade Agreement (NAFTA).
Source: Statistics Canada; and Alberta Agriculture and Forestry, Statistics and Data Development Section
Table 35: Alberta International Agri-Food Exports - Value, 1989-2015
Exports to Exports to the Exports to All
All Countries United States Other countries
Source: Statistics Canada; and Alberta Agriculture and Forestry, Statistics and Data Development Section
Fig. 18 Growth in Alberta Agri-Food Exports Since Establishment of Free Trade Agreements
1994 North AmericanFree Trade Agreement
(NAFTA): 1994-2015
1989 Free Trade Agreement(FTA): 1989-2015
295%
239%
454%
120%
United States
Other Countries
Fig. 19 Value of Alberta Agri-Food Exports to All Countries, 1989-2015, $ Billions
0
2
4
6
8
10
12
1989 '90 '91 '92 '93 '94 '95 '96 '97 '98 '99 '00 '01 '02 '03 '04 '05 '06 '07 '08 '09 '10 '11 '12 '13 '14 2015
Ten-Year Average2006-2015
$8.1 Billion
- 53 - Alberta Agriculture Statistics Yearbook, 2015

Value Added Total Value Added Total
Primary Processed Agri-Food Primary Processed Agri-Food
Commodities Products Exports Commodities Products Exports
2006.....................................................…................................................….........3,039,976 2,773,452 5,813,428 46.7 -15.0 8.9
2007.....................................................…................................................….........3,623,134 2,868,343 6,491,477 19.2 3.4 11.7
2008.....................................................…................................................….........5,070,451 3,315,461 8,385,912 39.9 15.6 29.2
2009.....................................................…................................................….........4,216,732 3,212,105 7,428,837 -16.8 -3.1 -11.4
2010.....................................................…................................................….........3,262,394 3,513,015 6,775,409 -22.6 9.4 -8.8
2011.....................................................…................................................….........4,520,345 3,540,720 8,061,065 38.6 0.8 19.0
2012r.....................................................…................................................….........5,529,191 3,680,751 9,209,942 22.3 4.0 14.3
2013r.....................................................…................................................….........5,060,670 3,650,973 8,711,642 -8.5 -0.8 -5.4
2014r.....................................................…................................................….........5,476,265 4,268,628 9,744,893 8.2 16.9 11.9
2015p.....................................................…................................................….........5,378,661 4,802,605 10,181,266 -1.8 12.5 4.5
4,517,782 3,562,605 8,080,387 76.9 73.2 75.1
5,193,026 3,988,735 9,181,762 19.0 35.6 26.3
2006.....................................................…................................................….........11,703,412 16,451,797 28,155,210 22.1 -2.9 6.1
2007.....................................................…................................................….........14,885,138 16,916,865 31,802,003 27.2 2.8 13.0
2008.....................................................…................................................….........20,316,795 18,921,239 39,238,035 36.5 11.8 23.4
2009.....................................................…................................................….........17,506,050 18,004,367 35,510,417 -13.8 -4.8 -9.5
2010.....................................................…................................................….........16,379,712 19,381,765 35,761,478 -6.4 7.7 0.7
2011....................................................…................................................….........18,847,012 21,765,974 40,612,986 15.1 12.3 13.6
2012r.....................................................…................................................….........20,625,638 23,243,295 43,868,933 9.4 6.8 8.0
2013r.....................................................…................................................….........22,098,258 24,236,188 46,334,445 7.1 4.3 5.6
2014r.....................................................…................................................….........25,620,005 26,293,142 51,913,147 15.9 8.5 12.0
2015p.....................................................…................................................….........26,697,392 29,410,739 56,108,131
19,467,941 21,462,537 40,930,478 128.1 78.8 99.3
22,777,661 24,989,867 47,767,528 41.7 35.1 38.2
Source: Statistics Canada; and Alberta Agriculture and Forestry, Statistics and Data Development Section
Source: Statistics Canada; and Alberta Agriculture and Forestry, Statistics and Data Development Section
Five-Year Average: 2011-2015 Five-Year % Change: 2015/2011
% Change From Previous Year
Table 36: Agri-Food Exports by Type of Product, Alberta and Canada -
Value, 2006-2015
Alberta
Ten-Year Average: 2006-2015
$'000
Ten-Year % Change: 2015/2006
Canada
Ten-Year Average: 2006-2015 Ten-Year % Change: 2015/2006
Note: Primary commodities refer to raw commodities (animals and crops). Value added products refer to processed products and by-products of manufacture, as
well as, crude animal and plant products.
Five-Year % Change: 2015/2011Five-Year Average: 2011-2015
Fig. 20 Value of Alberta Agri-Food Exports by Type of Product, 2006-2015
0
1
2
3
4
5
6
7
8
9
10
11
12
2006 2007 2008 2009 2010 2011 2012 2013 2014 2015
$ B
illio
ns Primary Commodities
Value Added Products
Alberta Agriculture Statistics Yearbook, 2015 - 54 -

% Chg.
2011 2012 2013r 2014r 2015p '15/'14
% $'000 %
Animals and Crops
Live Cattle, Purebred...................................................................................408 684 4,345 3,671 974 -73.5 2,016 0.0
Live Cattle, Other..............................................................................................…463,592 588,269 477,928 714,742 585,111 -18.1 565,928 6.2
Live Hogs........................................................................................................................................42,530 39,330 45,206 61,839 53,091 -14.1 48,399 0.5
Other Live Animals (incl. Bison, Sheep, Poultry)............................................................................................................................20,341 23,654 26,377 41,536 52,945 27.5 32,971 0.4
Barley.................................................................................................................................……………120,213 188,391 183,018 194,184 194,773 0.3 176,116 1.9
Wheat..............................................................................................................................................1,915,327 2,276,110 2,307,003 2,339,479 2,422,649 3.6 2,252,114 24.5
Oats ................................................................................................................................................……………50,709 109,765 53,737 41,358 44,267 7.0 59,967 0.7
Other Cereal, Unmilled.....................................................................................................................................................................14,647 21,687 25,967 6,968 20,742 197.7 18,002 0.2
Hay and Fodder (incl. Alfalfa Cubes)................................................................................................................64,336 114,190 104,146 100,465 96,131 -4.3 95,854 1.0
Peas.....................................................................................................................................................92,661 149,918 85,590 64,820 59,019 -9.0 90,402 1.0
Lentils.....................................................................................................................................................2,393 3,769 5,608 5,646 13,473 138.6 6,178 0.1
Other Dried Beans..........................................................................................................21,746 54,922 40,765 45,472 53,688 18.1 43,319 0.5
Potatoes, Seed and Other.................................................….................................…10,920 11,630 11,879 21,634 26,309 21.6 16,474 0.2
Fruits and Vegetables.........................................................................................................................…7,600 11,041 13,169 14,848 6,372 -57.1 10,606 0.1
Canola Seed.........................................................................................................................…1,651,859 1,872,995 1,615,906 1,766,655 1,676,864 -5.1 1,716,856 18.7
Mustard Seed.........................................................................................................................…30,110 20,176 24,446 21,713 18,633 -14.2 23,016 0.3
Linseed.........................................................................................................................……………………………9,792 21,649 33,887 29,485 51,050 73.1 29,173 0.3
Other Oilseeds and Oilnuts.......................................................................…1,161 21,011 1,692 1,750 2,571 46.9 5,637 0.1
Sub-Total........................................................................................................................4,520,345 5,529,191 5,060,670 5,476,265 5,378,661 -1.8 5,193,026 56.6
Crude Animal and Plant Products
Raw Hides and Skins (incl. Fur Skins)................................................................................................................................................……………188,384 176,110 204,577 253,286 221,079 -12.7 208,687 2.3
Bovine Semen................................................................................................................................................……………32,977 36,464 42,995 55,074 47,322 -14.1 42,967 0.5
Other Crude Animal Products................................................................................................................................................……………27,403 32,044 38,901 52,772 69,583 31.9 44,141 0.5
Seeds for Sowing................................................................................................................................................……………29,287 37,931 44,599 42,985 51,256 19.2 41,212 0.4
Peat Moss......................................................................……………41,529 48,806 48,599 54,679 80,564 47.3 54,835 0.6
Nursery and Other Crude Vegetable Products.................................................................................................................................................……………5,267 5,195 5,219 8,446 10,038 18.9 6,833 0.1
Sub-Total........................................................................................................................324,847 336,550 384,891 467,240 479,841 2.7 398,674 4.3
Products and By-Products of Manufacture
Meats (1) - Total..........................................................................................................................................1,444,082 1,297,934 1,397,723 1,996,156 2,266,268 13.5 1,680,433 18.3
Beef and Veal....................................................................................................................................………………...............................................................…969,377 852,153 961,703 1,428,935 1,696,488 18.7 1,181,731 12.9
Pork ..........................................................……………….........................................................................................411,542 364,980 348,311 467,049 468,885 0.4 412,153 4.5
Horse Meat..........................................................………………....................................................................................................41,908 45,935 46,115 53,825 50,891 -5.5 47,735 0.5
Other Meat (2)..................................................................................................12,220 11,897 12,837 11,807 16,422 39.1 13,037 0.1
Processed Meat.................................................................................................................................9,035 22,970 28,758 34,539 33,582 -2.8 25,777 0.3
Dairy Products and Eggs...........................................................................................................................1,731 4,933 531 3,512 1,346 -61.7 2,411 0.0
Honey....................................................................................................................................………………..9,389 10,995 12,832 14,929 20,499 37.3 13,729 0.1
Wheat Flour....................................................................................................................................6,170 5,213 6,389 8,720 8,627 -1.1 7,024 0.1
Malt of Barley..........................................................……………….................................................……………………………………..151,501 179,954 174,599 225,601 237,583 5.3 193,847 2.1
Other Cereals Milled.....................................................................................................33,170 41,654 47,434 50,874 61,578 21.0 46,942 0.5
Cereals Preparations.....................................................................................................35,800 32,230 33,022 37,185 48,868 31.4 37,421 0.4
Vegetable and Fruit Preparations..........................................................……………….................................................)6,948 4,355 7,092 8,121 18,976 133.7 9,098 0.1
Fruit and Vegetable Juices..........................................................……………….................................................7,384 6,931 4,877 3,701 3 -99.9 4,579 0.0
Processed Potatoes.........................................................................................................................…201,611 203,319 208,343 277,585 328,795 18.4 243,931 2.7
Sugar and Sugar Preparations………………………………………………………….39,829 34,105 17,826 10,710 17,698 65.3 24,034 0.3
Foods and Food Materials.....................................................................…44,086 44,664 29,937 36,443 38,025 4.3 38,631 0.4
Oilseed Cake and Meal...............................................................................................................165,160 225,526 229,939 279,168 254,296 -8.9 230,818 2.5
Alfalfa Meal and Pellets, Dehydrated...................................................................................................................101 4,298 1,260 1,222 1,200 -1.8 1,616 0.0
Feeds of Vegetable Origin..........................................................................................................4,411 6,889 14,068 15,437 14,468 -6.3 11,054 0.1
Prepared Animal Feeds..........................................................................................................120,205 142,673 212,619 242,820 316,935 30.5 207,050 2.3
Whiskey..........................................................................................................................................................54,717 73,722 71,515 66,105 66,880 1.2 66,588 0.7
Beer....................................................................................................................................………………..1,226 - 15 32 30 -7.7 261 0.0
Other Beverages (Wine, Mineral Water)..................................................................................................3,530 3,996 7,620 9,934 16,845 69.6 8,385 0.1
Tallow................................................................................………………..119,427 124,614 104,330 100,471 88,499 -11.9 107,468 1.2
Canola/Mustard Oil, Crude………..........................................................................………………..563,024 630,030 444,606 184,893 324,197 75.3 429,350 4.7
Canola/Mustard Oil, Refined………..........................................................................………………..142,966 184,452 167,092 145,448 113,017 -22.3 150,595 1.6
Other Oils, Fats, Waxes and Extracts………..........................................................................……………………..59,364 81,713 72,304 82,322 78,132 -5.1 74,767 0.8
Other Products......................................................................... 41 0 110 - - - 30 0.0
Sub-Total........................................................................................................................3,215,873 3,344,201 3,266,082 3,801,388 4,322,764 13.7 3,590,061 39.1
Total Agri-Food Exports..........................................................................................................................8,061,065 9,209,942 8,711,642 9,744,893 10,181,266 4.5 9,181,762 100.0
(1) Refers to fresh, chilled, frozen meat, edible offal and includes processed meat. 0 - (zero) refers to value less than $500.
(2) Includes poultry, sheep and bison meat.
Source: Statistics Canada; and Alberta Agriculture and Forestry, Statistics and Data Development Section
Table 37: Alberta Agri-Food Exports by Product - Value, 2011-2015
$'000
Average
2011-2015
- 55 - Alberta Agriculture Statistics Yearbook, 2015

% Chg. Average
2011 2012 2013r 2014r 2015p '15/'14 2011-2015
% Head
Live Cattle - Total.......................................................................................336,281 383,889 291,730 360,874 226,071 -37.4 319,769
Purebred Cattle...................................................................................61 46 950 1,063 294 -72.3 483
Other Cattle..............................................................................................…336,220 383,843 290,780 359,811 225,777 -37.3 319,286
Live Hogs..............................................................................................…...................................636,466 599,942 571,400 614,794 643,722 4.7 613,265
% tonnes
Meats (1) - Total.......................................................................................................................................388,023 329,320 339,904 380,761 393,191 3.3 366,240
Beef and Veal....................................................................................................................................…249,170 195,631 205,184 235,525 240,469 2.1 225,196
Pork ....................................................................................................................................123,050 111,556 109,930 122,225 131,035 7.2 119,559
Horse Meat..........................................................................................................................7,426 8,811 8,312 8,652 6,919 -20.0 8,024
Other Meat (2).........................................................................................…....................................…6,131 7,126 8,507 5,829 6,890 18.2 6,896
Processed Meat..............................................................................................................................2,246 6,196 7,971 8,530 7,877 -7.6 6,564
Crops - Total.......................................................................................................................................………………………………………………………………9,604,596 11,704,285 10,967,031 12,047,421 11,985,836 -0.5 11,261,834
Wheat................................................................................................…..............................…5,543,766 6,715,670 6,845,987 7,331,799 7,561,405 3.1 6,799,725
Barley..................................................................................................…............................…409,112 601,395 572,566 625,825 564,627 -9.8 554,705
Oats.....................................................................................…197,779 422,882 182,839 127,985 139,987 9.4 214,294
Other Cereals Unmilled.....................................................................................…43,741 43,897 66,293 13,359 43,691 227.1 42,196
Hay and Fodder (incl. Alfalfa Cubes)....................................................................…202,445 354,701 310,781 279,736 247,266 -11.6 278,986
Potatoes, Seed and Other………………………………………………….28,039 26,239 29,927 40,405 36,118 -10.6 32,146
Vegetables and Fruits……………………………………………………….5,576 6,485 7,328 10,966 3,559 -67.5 6,783
Peas, Dried……………………………………………………………………………..254,514 392,257 219,720 175,652 119,677 -31.9 232,364
Lentils…………………………………………………………………………………………..2,730 4,916 7,622 9,409 14,318 52.2 7,799
Other Dried Beans……………………………………………………………25,147 46,377 37,467 41,998 53,092 26.4 40,816
Canola Seed............................................................................................................................................................…2,836,740 2,999,516 2,609,422 3,319,319 3,105,404 -6.4 2,974,080
Mustard Seed............................................................................................................................................................…38,711 24,039 26,878 24,984 21,683 -13.2 27,259
Linseed............................................................................................................................................................…14,907 33,702 48,057 43,231 73,082 69.0 42,596
Other Oilseeds............................................................................................................................................................…1,389 32,209 2,143 2,752 1,928 -30.0 8,084
Manufacture Products
Dairy Produce.......................................................................................................................................................................…..............................…490 2,020 235 808 70 -91.4 724
Honey................................................................................................…..............................…2,168 2,566 2,507 2,840 3,640 28.2 2,744
Wheat or Meslin Flour.....................................................................................…9,532 8,176 9,761 11,225 10,109 -9.9 9,761
Malt Roasted or not Roasted............................................................................................................................................................…288,653 291,858 272,435 349,959 326,573 -6.7 305,895
Other Cereals Milled.....................................................................................................61,148 80,215 92,438 81,500 94,675 16.2 81,995
Cereals Prepared............................................................................................................................................................…10,859 9,111 8,734 10,195 13,225 29.7 10,425
Processed Potatoes............................................................................................................................................................…185,069 179,105 176,736 226,179 224,867 -0.6 198,391
Oilseed Cake and Meal............................................................................................................................................................…735,274 724,411 662,717 775,080 808,222 4.3 741,141
Alfalfa Meal and Pellets, Dehydrated...................................................................................................................298 14,163 3,211 2,813 2,224 -20.9 4,542
Other Feeds of Vegetable Origin………………………………….25,799 38,752 58,227 58,364 47,928 -17.9 45,814
Prepared Animal Feeds............................................................................................................................................................…98,895 110,428 130,932 127,740 119,366 -6.6 117,472
Canola/Mustard Oil, Crude............................................................................................................................................................…454,701 510,524 367,146 186,330 366,653 96.8 377,071
Canola/Mustard Oil, Refined............................................................................................................................................................…108,041 134,178 121,544 124,022 93,331 -24.7 116,223
Tallow............................................................................................................................................................…109,987 126,103 117,415 111,278 117,130 5.3 116,383
Seeds for Sowing............................................................................................................................................................…15,973 17,390 17,937 14,714 15,144 2.9 16,232
Peat Moss...........................................................................................................................................................…167,954 185,711 147,062 158,397 204,352 29.0 172,695
Source: Statistics Canada; and Alberta Agriculture and Forestry, Statistics and Data Development Section
Source: Statistics Canada; and Alberta Agriculture and Forestry, Statistics and Data Development Section
(2) Includes, poultry, sheep and bison meat.
Table 38: Alberta Agri-Food Exports by Product - Quantity, 2011-2015
(1) Refers to fresh, chilled and frozen meat, edible offal and includes processed meat.
Head
tonnes
Fig. 21 Quantity of Selected Commodities/Products Exported from Alberta, 2011-2015
0
1,000
2,000
3,000
4,000
5,000
6,000
7,000
8,000
9,000
2011 2012 2013 2014 2015
'000 t
on
nes
Wheat
Canola Seed
Barley
0
50
100
150
200
250
300
350
400
450
2011 2012 2013 2014 2015
'000 t
on
nes
Beef
Pork
Alberta Agriculture Statistics Yearbook, 2015 - 56 -

% Chg. Average
Country Rank in 2015 2011 2012 2013r 2014r 2015p '15/'14 2011-2015
Value (1) % $'000
1 United States……………………………………………………………………………194,563 280,939 342,612 326,366 259,508 -20.5 280,798
2 Indonesia…………………………………………………………………….112,349 133,542 173,557 147,630 200,008 35.5 153,417
3 Japan………………………………………………………………………………………….157,227 219,647 203,503 187,833 159,764 -14.9 185,595
4 Peru……………………………………………………………………………….57,136 63,879 89,498 124,498 146,099 17.4 96,222
5 Bangladesh……………………………………………………………………………..121,608 68,164 100,886 100,881 129,511 28.4 104,210
6 Venezuela……………………………………………………………………………84,929 96,585 118,809 100,514 123,364 22.7 104,840
7 China……………………………………………………………………………………………………..23,356 74,309 109,320 35,839 120,206 235.4 72,606
8 Colombia…………………………………………………………………………80,797 88,921 83,341 116,914 99,349 -15.0 93,864
9 Philippines…………………………………………………………………………17,200 22,844 36,312 12,991 98,521 658.4 37,574
10 Mexico………………………………………………………………………………………………..…108,327 123,133 125,456 103,724 93,414 -9.9 110,811
11 Italy………………………………………………………………………………………67,726 52,093 47,993 87,727 87,988 0.3 68,705
12 Sri Lanka……………………………………………………………………….94,786 120,205 48,687 67,247 76,886 14.3 81,562
13 Nigeria……………………………………………………………………………….17,699 43,430 59,555 75,350 74,988 -0.5 54,204
14 Ecuador…………………………………………………………………………56,298 52,287 47,262 37,436 59,353 58.5 50,527
15 Algeria……………………………………………………………………………..9,655 52,573 33,411 42,924 47,879 11.5 37,289
16 Chile…………………………………………………………………………………..20,762 17,029 18,029 47,223 44,578 -5.6 29,524
17 Ghana……………………………………………………………………………………………………….43,360 44,520 52,236 24,452 44,239 80.9 41,761
18 Saudi Arabia……………………………………………………………………………..76,305 73,273 16,630 79,436 44,176 -44.4 57,964
19 United Kingdom……………………………………………………………41,615 51,319 47,164 33,321 41,675 25.1 43,019
20 Thailand…………………………………………………………………………………45,489 26,957 17,878 11,739 33,530 185.6 27,119
21 United Arab Emirates…………………………………………………………….29,757 42,631 60,215 43,205 31,846 -26.3 41,531
22 Morocco…………………………………………………………………………….18,891 39,028 42,356 39,786 31,057 -21.9 34,223
23 Vietnam……………………………………………………………………………………….1,769 11,421 22,306 4,670 30,972 563.2 14,228
24 Cuba…………………………………………………………………………….25,713 28,649 29,202 23,079 27,332 18.4 26,795
25 Sudan……………………………………………………………………………47,583 44,758 54,475 76,362 27,088 -64.5 50,054
Top 25 Countries…………………………………………………..1,554,900 1,872,133 1,980,694 1,951,146 2,133,328 9.3 1,898,440
Other………………………………………………………………………..360,427 403,977 326,310 388,332 289,321 -25.5 353,673
All Countries (Total Value)….....................................................................................…1,915,327 2,276,110 2,307,003 2,339,479 2,422,649 3.6 2,252,114
Quantity (1) % tonnes
1 United States……………………………………………………………………………606,772 827,036 1,066,423 1,036,378 744,495 -28.2 856,221
2 Indonesia…………………………………………………………………….325,904 394,981 516,764 480,378 638,658 32.9 471,337
3 Japan………………………………………………………………………………………….450,377 640,510 595,730 594,474 509,941 -14.2 558,206
4 Peru……………………………………………………………………………….164,142 185,998 265,031 392,466 489,478 24.7 299,423
5 Bangladesh……………………………………………………………………………..352,323 204,549 294,682 327,835 421,151 28.5 320,108
6 China……………………………………………………………………………………………………..66,419 217,726 322,029 109,231 372,642 241.2 217,609
7 Venezuela……………………………………………………………………………241,344 281,652 345,701 310,607 343,368 10.5 304,534
8 Colombia…………………………………………………………………………232,522 265,503 249,885 373,194 338,502 -9.3 291,921
9 Mexico………………………………………………………………………………………………..…316,808 368,665 378,496 334,361 319,317 -4.5 343,529
10 Philippines…………………………………………………………………………49,235 62,223 107,479 42,540 308,292 624.7 113,954
11 Sri Lanka……………………………………………………………………….273,565 360,261 143,107 217,565 259,865 19.4 250,873
12 Nigeria……………………………………………………………………………….52,769 129,813 176,362 240,917 234,436 -2.7 166,859
13 Italy………………………………………………………………………………………189,538 146,938 135,429 230,832 233,696 1.2 187,287
14 Ecuador…………………………………………………………………………161,988 154,828 139,654 118,927 198,350 66.8 154,749
15 Chile…………………………………………………………………………………..59,384 49,984 53,681 150,569 163,128 8.3 95,349
16 Saudi Arabia……………………………………………………………………………..220,464 224,329 48,059 252,993 155,847 -38.4 180,338
17 Ghana……………………………………………………………………………………………………….124,074 132,558 155,178 78,984 138,609 75.5 125,881
18 Thailand…………………………………………………………………………………130,238 81,078 52,174 36,925 124,890 238.2 85,061
19 United Kingdom……………………………………………………………120,252 150,206 140,374 107,817 115,507 7.1 126,831
20 Vietnam……………………………………………………………………………………….4,977 32,302 69,055 15,209 109,493 619.9 46,207
21 United Arab Emirates…………………………………………………………….85,105 127,963 175,448 137,542 98,045 -28.7 124,821
22 Algeria……………………………………………………………………………..23,439 141,672 90,381 113,804 97,113 -14.7 93,282
23 Sudan……………………………………………………………………………134,675 136,813 162,747 243,953 90,967 -62.7 153,831
24 Cuba…………………………………………………………………………….73,469 85,283 86,278 74,470 78,136 4.9 79,527
25 Morocco…………………………………………………………………………….55,270 104,459 114,536 100,401 71,516 -28.8 89,236
Top 25 Countries…………………………………………………..4,515,053 5,507,330 5,884,683 6,122,372 6,655,442 8.7 5,736,976
Other………………………………………………………………………..1,028,713 1,208,340 961,304 1,209,427 905,963 -25.1 1,062,749
5,543,766 6,715,670 6,845,987 7,331,799 7,561,405 3.1 6,799,725
(1) Includes durum wheat.
Source: Statistics Canada; and Alberta Agriculture and Forestry, Statistics and Data Development Section
All Countries (Total Quantity)….....................................................................................…
Table 39: Alberta Wheat Exports by Country - Value and Quantity, 2011-2015
$'000
tonnes
- 57 - Alberta Agriculture Statistics Yearbook, 2015

% Chg. Average
Country Rank in 2015 2011 2012 2013r 2014r 2015p '15/'14 2011-2015
% $'000
1 United States...................................................................................................................…655,345 581,009 618,949 945,962 1,150,110 21.6 790,275
U.S. % of Total 67.6 68.2 64.4 66.2 67.8 66.9
2 China...................................................................................................................…- 4,686 25,929 39,023 234,879 501.9 60,903
3 Mexico...................................................................................................................…133,800 103,598 84,221 136,318 142,594 4.6 120,106
4 Hong Kong...................................................................................................................…76,672 63,726 136,965 172,523 71,544 -58.5 104,286
5 Japan...................................................................................................................…56,946 60,772 56,871 73,270 65,076 -11.2 62,587
6 Philippines…………………………………………………………………………3,864 2,425 2,121 3,137 6,369 103.0 3,583
7 Korea, South...................................................................................................................…45 7,361 6,905 22,953 3,710 -83.8 8,195
8 Cuba…………………………………………………………………………………….1,560 1,318 4,041 1,052 3,654 247.3 2,325
9 Netherlands…………………………………………………………………….1,482 950 1,065 4,649 3,548 -23.7 2,339
10 Angola……………………………………………………………………………………...450 190 481 2,666 2,471 -7.3 1,252
11 Chile…………………………………………………………………………………………- - - 398 2,261 468.5 532
12 Egypt……………………………………………………………………………………….3,710 2,341 2,145 2,400 2,133 -11.1 2,546
13 Switzerland…………………………………………………………………………1,098 1,962 1,837 2,094 1,735 -17.1 1,745
14 Taiwan…………………………………………………………………………………5,484 1,274 2,682 11,654 1,341 -88.5 4,487
15 Peru……………………………………………………………………………………- - 663 4,243 1,297 -69.4 1,240
16 France………………………………………………………………………………..391 941 264 946 869 -8.2 682
17 Ivory Coast……………………………………………………………………………..234 225 257 635 761 19.7 422
18 United Arab Emirates………………………………………………………………………………..243 362 845 422 683 62.1 511
19 Bahrain…………………………………………………………………………………………….- - 89 362 327 -9.9 156
20 Panama………………………………………………………………………………………………..- - 7 - 233 - 48
21 New Zealand…………………………………………………………………….- - - - 200 - 40
22 Colombia…………………………………………………………………………………...…….- 158 240 18 175 879.4 118
23 Gabon……………………………………………………………………………………..102 119 65 233 122 -47.5 128
24 Vietnam………………………………………………………………………………..1,200 3,415 1,787 - 87 - 1,298
25 Mozambique……………………………………………………………………….17 - 75 178 86 -51.4 71
26 Barbados………………………………………………………………………………..- - - 3 48 - 10
27 Congo, Democratic Republic……………………………………………………………………………………..- - - - 47 - 9
28 Congo…………………………………………………………………………………..- - - 147 46 -68.9 39
29 Senegal………………………………………………………………………………….106 42 89 109 30 -72.6 75
30 Qatar………………………………………………………………………………………..- - - - 22 - 4
31 Swaziland………………………………………………………………………………….- - 16 - 15 - 632 Italy……………………………………………………………………………………………1,952 2,025 1,553 1,357 14 -99.0 1,380
33 Sweden…………………………………………………………………………….- - - - 3 - 1Other Countries...................................................................................................................…24,678 13,253 11,539 2,183 - -100.0 10,331
969,377 852,153 961,703 1,428,935 1,696,488 18.7 1,181,731
(1) Refers to fresh, chilled and frozen meat and includes edible offal.
Source: Statistics Canada; and Alberta Agriculture and Forestry, Statistics and Data Development Section
Source: Statistics Canada; and Alberta Agriculture and Forestry, Statistics and Data Development Section
Table 40: Alberta Beef Exports by Country - Value, 2011-2015 (1)
All Countries (Total)….....................................................................................…
$'000
67.6% 68.2%
64.4%
66.2%
67.8%
0
200
400
600
800
1,000
1,200
1,400
1,600
1,800
2011 2012 2013 2014 2015
All Countries
United States$ M
illio
ns
Fig. 22 Alberta Exports of Beef to All Countries and the United States, Value, 2011-2015
Alberta Agriculture Statistics Yearbook, 2015 - 58 -

% Chg. Average
Country Rank in 2015 2011 2012 2013r 2014r 2015p '15/'14 2011-2015
% tonnes
1 United States...................................................................................................................…178,188 134,803 139,696 156,855 166,074 5.9 155,123
U.S. % of Total 71.5 68.9 68.1 66.6 69.1 68.9
2 China...................................................................................................................…- 1,360 5,652 6,492 29,749 358.2 8,651
3 Mexico...................................................................................................................…28,185 21,035 16,244 21,315 17,836 -16.3 20,923
4 Japan...................................................................................................................…10,761 10,810 11,948 13,785 9,799 -28.9 11,421
5 Hong Kong...................................................................................................................…18,514 16,158 21,899 22,884 8,789 -61.6 17,649
6 Angola……………………………………………………………………………………...283 114 550 2,373 2,104 -11.3 1,085
7 Egypt……………………………………………………………………………………….2,422 1,714 2,014 1,676 945 -43.6 1,754
8 Philippines…………………………………………………………………………1,275 745 490 467 940 101.2 784
9 Peru……………………………………………………………………………………- - 595 2,125 800 -62.3 704
10 Ivory Coast……………………………………………………………………………..214 230 300 627 691 10.3 413
11 Korea, South...................................................................................................................…24 1,748 1,016 2,906 463 -84.1 1,231
12 Cuba…………………………………………………………………………………….224 138 690 204 435 112.9 338
13 Chile…………………………………………………………………………………………- - - 96 315 227.2 82
14 Netherlands…………………………………………………………………….122 86 109 336 264 -21.6 183
15 Bahrain…………………………………………………………………………………………….- - 70 248 225 -9.2 109
16 Switzerland…………………………………………………………………………110 175 185 205 179 -12.4 171
17 Gabon……………………………………………………………………………………..59 14 123 157 152 -3.5 101
18 Taiwan…………………………………………………………………………………1,064 346 503 1,607 130 -91.9 730
19 Colombia…………………………………………………………………………………...…….- 120 207 25 101 309.1 90
20 France………………………………………………………………………………..37 91 24 104 100 -3.4 71
21 Mozambique……………………………………………………………………….24 - 97 149 76 -48.7 69
22 New Zealand…………………………………………………………………….- - - - 59 - 12
23 United Arab Emirates………………………………………………………………………………..23 32 110 36 56 55.1 51
24 Congo…………………………………………………………………………………..- - - 77 52 -32.6 26
25 Panama………………………………………………………………………………………………..- - 0 - 38 - 8
26 Senegal………………………………………………………………………………….105 27 125 103 25 -75.3 77
27 Congo, Democratic Republic……………………………………………………………………………………..- - - - 25 - 5
28 Vietnam………………………………………………………………………………..335 616 330 - 22 - 261
29 Barbados………………………………………………………………………………..- - - 0 21 … 4
30 Qatar………………………………………………………………………………………..- - - - 2 - 0
31 Swaziland………………………………………………………………………………….- - 1 - 1 - 1
32 Italy……………………………………………………………………………………………165 187 136 98 1 -98.7 118
33 Sweden…………………………………………………………………………….- - - - 0 - 0
Other Countries...................................................................................................................…7,036 5,083 2,067 575 - -100.0 2,952
All Countries (Total)….....................................................................................…249,170 195,631 205,184 235,525 240,469 2.1 225,196
(1) Refers to fresh, chilled and frozen meat and includes edible offal. 0 - (zero) refers to value less than $500.
Source: Statistics Canada; and Alberta Agriculture and Forestry, Statistics and Data Development Section
Source: Statistics Canada; and Alberta Agriculture and Forestry, Statistics and Data Development Section
tonnes
Table 41: Alberta Beef Exports by Country - Quantity, 2011-2015 (1)
0
50
100
150
200
250
300
2011 2012 2013 2014 2015
'000 t
on
nes
Hong Kong
Japan
Mexico
China
United States
All Countries
Fig. 23 Alberta Exports of Beef to Top Five Countries, Quantity, 2011-2015
- 59 - Alberta Agriculture Statistics Yearbook, 2015
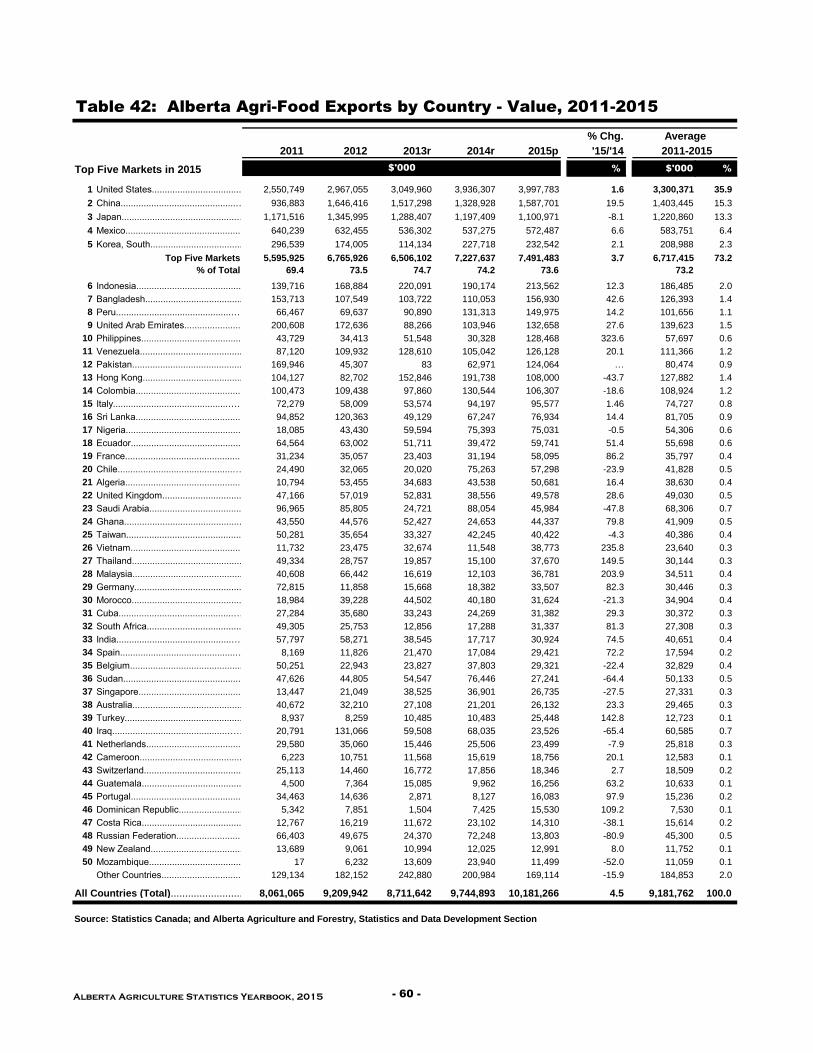
% Chg.
2011 2012 2013r 2014r 2015p '15/'14
Top Five Markets in 2015 % $'000 %
1 United States.............................................……………………………………………………...……….2,550,749 2,967,055 3,049,960 3,936,307 3,997,783 1.6 3,300,371 35.9
2 China.............................................……………………………………………………...……….936,883 1,646,416 1,517,298 1,328,928 1,587,701 19.5 1,403,445 15.3
3 Japan.............................................……………………………………………………...……….1,171,516 1,345,995 1,288,407 1,197,409 1,100,971 -8.1 1,220,860 13.3
4 Mexico.............................................……………………………………………………...……….640,239 632,455 536,302 537,275 572,487 6.6 583,751 6.4
5 Korea, South.............................................……………………………………………………...……….296,539 174,005 114,134 227,718 232,542 2.1 208,988 2.3
Top Five Markets 5,595,925 6,765,926 6,506,102 7,227,637 7,491,483 3.7 6,717,415 73.2
% of Total 69.4 73.5 74.7 74.2 73.6 73.2
6 Indonesia.............................................……………………………………………………...……….139,716 168,884 220,091 190,174 213,562 12.3 186,485 2.0
7 Bangladesh.............................................……………………………………………………...……….153,713 107,549 103,722 110,053 156,930 42.6 126,393 1.4
8 Peru.............................................……………………………………………………...……….66,467 69,637 90,890 131,313 149,975 14.2 101,656 1.1
9 United Arab Emirates.............................................……………………………………………………...……….200,608 172,636 88,266 103,946 132,658 27.6 139,623 1.5
10 Philippines.............................................……………………………………………………...……….43,729 34,413 51,548 30,328 128,468 323.6 57,697 0.6
11 Venezuela.............................................……………………………………………………...……….87,120 109,932 128,610 105,042 126,128 20.1 111,366 1.2
12 Pakistan.............................................……………………………………………………...……….169,946 45,307 83 62,971 124,064 … 80,474 0.9
13 Hong Kong.............................................……………………………………………………...……….104,127 82,702 152,846 191,738 108,000 -43.7 127,882 1.4
14 Colombia.............................................……………………………………………………...……….100,473 109,438 97,860 130,544 106,307 -18.6 108,924 1.2
15 Italy.............................................……………………………………………………...……….72,279 58,009 53,574 94,197 95,577 1.46 74,727 0.8
16 Sri Lanka.............................................……………………………………………………...……….94,852 120,363 49,129 67,247 76,934 14.4 81,705 0.9
17 Nigeria.............................................……………………………………………………...……….18,085 43,430 59,594 75,393 75,031 -0.5 54,306 0.6
18 Ecuador.............................................……………………………………………………...……….64,564 63,002 51,711 39,472 59,741 51.4 55,698 0.6
19 France.............................................……………………………………………………...……….31,234 35,057 23,403 31,194 58,095 86.2 35,797 0.4
20 Chile.............................................……………………………………………………...……….24,490 32,065 20,020 75,263 57,298 -23.9 41,828 0.5
21 Algeria.............................................……………………………………………………...……….10,794 53,455 34,683 43,538 50,681 16.4 38,630 0.4
22 United Kingdom.............................................……………………………………………………...……….47,166 57,019 52,831 38,556 49,578 28.6 49,030 0.5
23 Saudi Arabia.............................................……………………………………………………...……….96,965 85,805 24,721 88,054 45,984 -47.8 68,306 0.7
24 Ghana.............................................……………………………………………………...……….43,550 44,576 52,427 24,653 44,337 79.8 41,909 0.5
25 Taiwan.............................................……………………………………………………...……….50,281 35,654 33,327 42,245 40,422 -4.3 40,386 0.4
26 Vietnam.............................................……………………………………………………...……….11,732 23,475 32,674 11,548 38,773 235.8 23,640 0.3
27 Thailand.............................................……………………………………………………...……….49,334 28,757 19,857 15,100 37,670 149.5 30,144 0.3
28 Malaysia.............................................……………………………………………………...……….40,608 66,442 16,619 12,103 36,781 203.9 34,511 0.4
29 Germany.............................................……………………………………………………...……….72,815 11,858 15,668 18,382 33,507 82.3 30,446 0.3
30 Morocco.............................................……………………………………………………...……….18,984 39,228 44,502 40,180 31,624 -21.3 34,904 0.4
31 Cuba.............................................……………………………………………………...……….27,284 35,680 33,243 24,269 31,382 29.3 30,372 0.3
32 South Africa.............................................……………………………………………………...……….49,305 25,753 12,856 17,288 31,337 81.3 27,308 0.3
33 India.............................................……………………………………………………...……….57,797 58,271 38,545 17,717 30,924 74.5 40,651 0.4
34 Spain.............................................……………………………………………………...……….8,169 11,826 21,470 17,084 29,421 72.2 17,594 0.2
35 Belgium.............................................……………………………………………………...……….50,251 22,943 23,827 37,803 29,321 -22.4 32,829 0.4
36 Sudan.............................................……………………………………………………...……….47,626 44,805 54,547 76,446 27,241 -64.4 50,133 0.5
37 Singapore.............................................……………………………………………………...……….13,447 21,049 38,525 36,901 26,735 -27.5 27,331 0.3
38 Australia.............................................……………………………………………………...……….40,672 32,210 27,108 21,201 26,132 23.3 29,465 0.3
39 Turkey.............................................……………………………………………………...……….8,937 8,259 10,485 10,483 25,448 142.8 12,723 0.1
40 Iraq.............................................……………………………………………………...……….20,791 131,066 59,508 68,035 23,526 -65.4 60,585 0.7
41 Netherlands.............................................……………………………………………………...……….29,580 35,060 15,446 25,506 23,499 -7.9 25,818 0.3
42 Cameroon.............................................……………………………………………………...……….6,223 10,751 11,568 15,619 18,756 20.1 12,583 0.1
43 Switzerland.............................................……………………………………………………...……….25,113 14,460 16,772 17,856 18,346 2.7 18,509 0.2
44 Guatemala.............................................……………………………………………………...……….4,500 7,364 15,085 9,962 16,256 63.2 10,633 0.1
45 Portugal.............................................……………………………………………………...……….34,463 14,636 2,871 8,127 16,083 97.9 15,236 0.2
46 Dominican Republic.............................................……………………………………………………...……….5,342 7,851 1,504 7,425 15,530 109.2 7,530 0.1
47 Costa Rica.............................................……………………………………………………...……….12,767 16,219 11,672 23,102 14,310 -38.1 15,614 0.2
48 Russian Federation.............................................……………………………………………………...……….66,403 49,675 24,370 72,248 13,803 -80.9 45,300 0.5
49 New Zealand.............................................……………………………………………………...……….13,689 9,061 10,994 12,025 12,991 8.0 11,752 0.1
50 Mozambique.............................................……………………………………………………...……….17 6,232 13,609 23,940 11,499 -52.0 11,059 0.1
Other Countries........................................................…...............................…129,134 182,152 242,880 200,984 169,114 -15.9 184,853 2.0
All Countries (Total)................................................…...................................8,061,065 9,209,942 8,711,642 9,744,893 10,181,266 4.5 9,181,762 100.0
Source: Statistics Canada; and Alberta Agriculture and Forestry, Statistics and Data Development Section
Table 42: Alberta Agri-Food Exports by Country - Value, 2011-2015
2011-2015
$'000
Average
Alberta Agriculture Statistics Yearbook, 2015 - 60 -
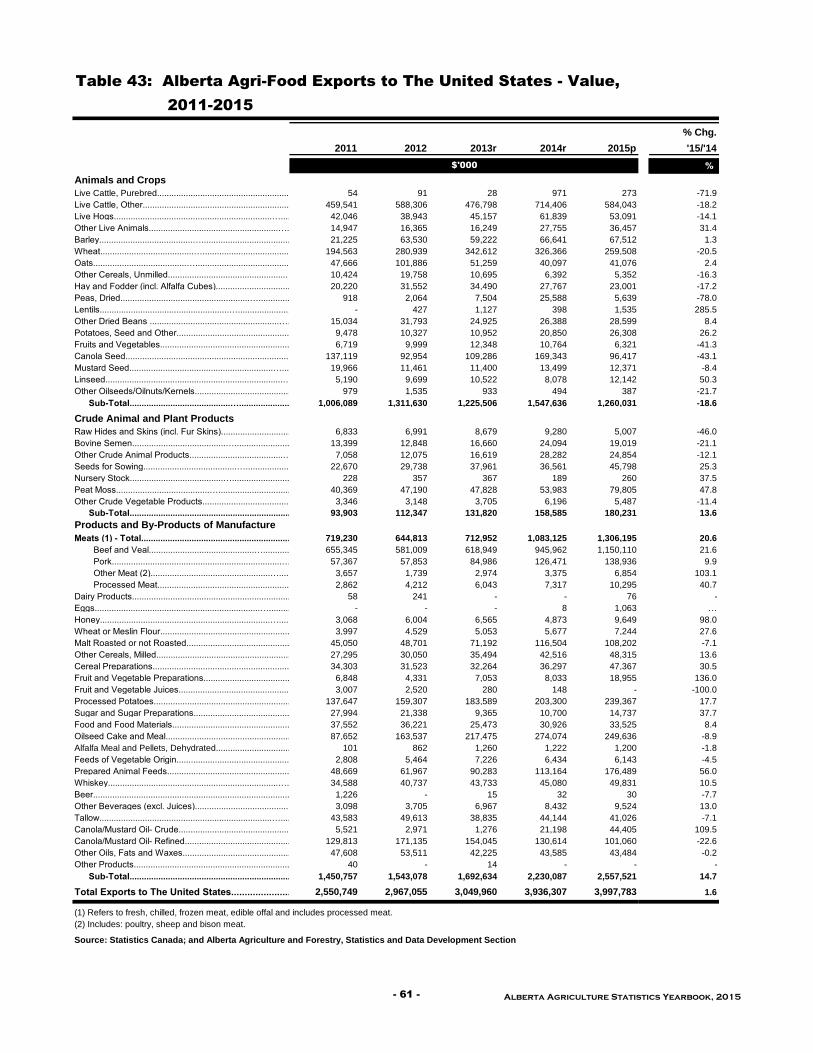
% Chg.
2011 2012 2013r 2014r 2015p '15/'14
%
Animals and Crops
Live Cattle, Purebred...................................................................................54 91 28 971 273 -71.9
Live Cattle, Other..............................................................................................…459,541 588,306 476,798 714,406 584,043 -18.2
Live Hogs..................................................................…..................…42,046 38,943 45,157 61,839 53,091 -14.1
Other Live Animals......................................................…............................…14,947 16,365 16,249 27,755 36,457 31.4
Barley.......................................….......................................….................................................................…...................…21,225 63,530 59,222 66,641 67,512 1.3
Wheat.......................................….......................................….....................................................................…...............…194,563 280,939 342,612 326,366 259,508 -20.5
Oats.......................................….......................................….................................................................…...................…47,666 101,886 51,259 40,097 41,076 2.4
Other Cereals, Unmilled.................................................….................................…10,424 19,758 10,695 6,392 5,352 -16.3
Hay and Fodder (incl. Alfalfa Cubes)...........................................… 20,220 31,552 34,490 27,767 23,001 -17.2
Peas, Dried......................................................…............................… 918 2,064 7,504 25,588 5,639 -78.0
Lentils......................................................…............................… - 427 1,127 398 1,535 285.5
Other Dried Beans ......................................................….............……………15,034 31,793 24,925 26,388 28,599 8.4
Potatoes, Seed and Other.................................................….................................…9,478 10,327 10,952 20,850 26,308 26.2
Fruits and Vegetables...........................................................….......................…6,719 9,999 12,348 10,764 6,321 -41.3
Canola Seed.....................................................................…...........................................…137,119 92,954 109,286 169,343 96,417 -43.1
Mustard Seed............................................................…......................…19,966 11,461 11,400 13,499 12,371 -8.4
Linseed..........................................................................…......................................…5,190 9,699 10,522 8,078 12,142 50.3
Other Oilseeds/Oilnuts/Kernels.................................................….................................…979 1,535 933 494 387 -21.7
Sub-Total..........................................…...................................…1,006,089 1,311,630 1,225,506 1,547,636 1,260,031 -18.6
Crude Animal and Plant Products
Raw Hides and Skins (incl. Fur Skins).......................................….......................................…6,833 6,991 8,679 9,280 5,007 -46.0
Bovine Semen.......................................….......................................…13,399 12,848 16,660 24,094 19,019 -21.1
Other Crude Animal Products.......................................….......................................…7,058 12,075 16,619 28,282 24,854 -12.1
Seeds for Sowing.......................................….......................................…22,670 29,738 37,961 36,561 45,798 25.3
Nursery Stock.......................................….......................................… 228 357 367 189 260 37.5
Peat Moss.......................................….......................................…........…40,369 47,190 47,828 53,983 79,805 47.8
Other Crude Vegetable Products.......................................….......................................…3,346 3,148 3,705 6,196 5,487 -11.4
Sub-Total.......................................................................…...........…93,903 112,347 131,820 158,585 180,231 13.6
Products and By-Products of Manufacture
Meats (1) - Total.............................................................…....................................719,230 644,813 712,952 1,083,125 1,306,195 20.6
Beef and Veal............................................…......................................…655,345 581,009 618,949 945,962 1,150,110 21.6
Pork.......................................................................…...............…57,367 57,853 84,986 126,471 138,936 9.9
Other Meat (2)..................................................…....................................…3,657 1,739 2,974 3,375 6,854 103.1
Processed Meat.....................................................................…..................…2,862 4,212 6,043 7,317 10,295 40.7
Dairy Products.....................................................................….................…58 241 - - 76 -
Eggs.....................................................................….................… - - - 8 1,063 …
Honey.......................................................................…...............…...........3,068 6,004 6,565 4,873 9,649 98.0
Wheat or Meslin Flour.............................................................................…...............…...............................…3,997 4,529 5,053 5,677 7,244 27.6
Malt Roasted or not Roasted.....................................................................................…...............….......................…45,050 48,701 71,192 116,504 108,202 -7.1
Other Cereals, Milled..................................................................................…27,295 30,050 35,494 42,516 48,315 13.6
Cereal Preparations................................................................................…...............…............................…34,303 31,523 32,264 36,297 47,367 30.5
Fruit and Vegetable Preparations.....................................................................…...............….......................................…6,848 4,331 7,053 8,033 18,955 136.0
Fruit and Vegetable Juices.....................................................................…...............….......................................…3,007 2,520 280 148 - -100.0
Processed Potatoes...................................................................…...................…137,647 159,307 183,589 203,300 239,367 17.7
Sugar and Sugar Preparations..............................................................................…...............…...............................…27,994 21,338 9,365 10,700 14,737 37.7
Food and Food Materials.........................................................................................…...............…...................…37,552 36,221 25,473 30,926 33,525 8.4
Oilseed Cake and Meal...............................................................................…...............….............................…87,652 163,537 217,475 274,074 249,636 -8.9
Alfalfa Meal and Pellets, Dehydrated...................................................................................................................101 862 1,260 1,222 1,200 -1.8
Feeds of Vegetable Origin...........................................................................................…...............….................…2,808 5,464 7,226 6,434 6,143 -4.5
Prepared Animal Feeds.............................................................................…...............…...............................…48,669 61,967 90,283 113,164 176,489 56.0
Whiskey.......................................................................…...............…………..34,588 40,737 43,733 45,080 49,831 10.5
Beer.............................................................................................…...............….........................….............…1,226 - 15 32 30 -7.7
Other Beverages (excl. Juices)..................................................................................…3,098 3,705 6,967 8,432 9,524 13.0
Tallow........................................................................…...............................…43,583 49,613 38,835 44,144 41,026 -7.1
Canola/Mustard Oil- Crude.....................................................…............................…5,521 2,971 1,276 21,198 44,405 109.5
Canola/Mustard Oil- Refined..............................................................................…...............…..............................…129,813 171,135 154,045 130,614 101,060 -22.6
Other Oils, Fats and Waxes.................................................................................…...............…...........................…47,608 53,511 42,225 43,585 43,484 -0.2
Other Products.................................................................…................… 40 - 14 - - -
Sub-Total.............................................................................................…...............…..................1,450,757 1,543,078 1,692,634 2,230,087 2,557,521 14.7
Total Exports to The United States..............................................................................…...............…........................................….............…2,550,749 2,967,055 3,049,960 3,936,307 3,997,783 1.6
Source: Statistics Canada; and Alberta Agriculture and Forestry, Statistics and Data Development Section
(2) Includes: poultry, sheep and bison meat.
Table 43: Alberta Agri-Food Exports to The United States - Value,
2011-2015
(1) Refers to fresh, chilled, frozen meat, edible offal and includes processed meat.
$'000
- 61 - Alberta Agriculture Statistics Yearbook, 2015

% Chg.
2011 2012 2013r 2014r 2015p '15/'14
%
Animals and Crops
Live Horses, Asses, Mules and Hinnies..................................................................................…5,078 7,081 9,671 13,515 15,917 17.8
Barley...........................................….......................................………………………….37,161 49,156 40,830 34,081 12,990 -61.9
Wheat..........................................................................................................…157,227 219,647 203,503 187,833 159,764 -14.9
Oats..........................................................................................................................................…1,832 3,085 1,698 762 966 26.7
Other Cereals, Unmilled..................................................................................…3,688 636 14,561 37 252 576.0
Hay and Fodder (incl. Alfalfa Cubes)..................................................................................…38,149 67,417 58,276 57,927 55,851 -3.6
Peas, Dried..........................................................................................................................................…395 642 935 1,159 1,788 54.3
Lentils..........................................................................................................................................…73 116 - - - -
Other Dried Beans..................................................................................… - - 45 230 163 -28.9
Fruits and Vegetables.................................................................................…74 - 95 - - -
Canola Seed..................................................................................… 495,422 537,188 544,378 420,946 356,808 -15.2
Mustard Seed..................................................................................… 4,164 3,304 3,943 3,483 3,224 -7.4
Linseed..................................................................................……………………………120 237 396 204 181 -11.3
Other Oilseeds..................................................................................……………………35 59 - 45 18 -61.4
Sub-Total...............................................................................… 743,419 888,568 878,333 720,221 607,921 -15.6
Crude Animal and Plant Products
Raw Hides and Skins..................................................................................…1,951 2,805 1,761 2,393 2,207 -7.8
Fur Skins Undressed..................................................................................… - 0 - - - -
Bovine Semen..................................................................................… 884 1,400 1,412 1,256 2,484 97.7
Other Crude Animal Products..................................................................................…9 6 23 163 123 -24.8
Seeds for Sowing..................................................................................… 124 459 271 559 782 39.9
Peat Moss..........................................................................................................................................…553 405 139 132 174 31.0
Other Crude Vegetable Products..................................................................................…4 - 5 4 - -100.0
Sub-Total..................................................................................… 3,525 5,076 3,612 4,508 5,769 28.0
Products and By-Products of Manufacture
Meats (1) - Total.................................................................................................269,081 274,508 250,505 309,540 311,667 0.7
Beef and Veal..................................................................................…56,946 60,772 56,871 73,270 65,076 -11.2
Pork.........................................................................................…....................................…192,646 178,542 153,310 189,024 198,976 5.3
Horsemeat..................................................................................… 13,992 17,058 17,919 20,350 24,556 20.7
Other Meat (2).........................................................................................…....................................…96 38 30 419 70 -83.2
Processed Meat....................................................................…..................…5,401 18,097 22,375 26,477 22,988 -13.2
Dairy Products .....................................................................….................… - 998 - - - -
Honey......................................................................................………………………………….4,813 4,464 5,771 9,832 10,236 4.1
Malt Roasted or not Roasted..................................................................................…55,601 67,201 70,383 68,358 80,613 17.9
Other Cereals, Milled..................................................................................………………….126 747 2,728 428 1,178 175.1
Cereals, Prepared..................................................................................………………….- - 43 149 646 334.0
Processed Potatoes......................................................................................…26,888 17,753 5,331 21,783 32,439 48.9
Sugar and Sugar Preparations..................................................................................…15 27 4 - 2 -
Food and Food Materials..................................................................................…1,526 2,951 2,761 2,790 2,627 -5.8
Oilseed Cake and Meal..................................................................................…88 62 687 91 149 63.2
Alfalfa Meal and Pellets, Dehydrated...................................................................................................................- 3,437 - - - -
Feeds of Vegetable Origin..................................................................................…726 522 2,123 2,728 1,942 -28.8
Prepared Animal Feeds...................................................................................................…1,407 1,743 2,336 3,766 6,279 66.7
Whiskey..............................................................................................................…...............…1,510 13,950 10,078 5,950 2,610 -56.1
Other Beverages (excl. Juices)..................................................................................…25 - 468 1,038 569 -45.2
Tallow......................................................................................………………………………….48,753 48,182 38,591 36,091 25,123 -30.4
Canola/Mustard Oil, Crude.....................................................…............................…1,445 4,148 3,070 - 898 -
Canola/Mustard Oil, Refined.....................................................…............................…5,875 5,124 4,844 4,032 3,300 -18.2
Other Oils, Fats and Waxes..................................................................................…6,689 6,536 6,738 6,101 7,005 14.8
Sub-Total..................................................................................……………..424,571 452,352 406,462 472,679 487,281 3.1
Total Exports to Japan..................................................................................…1,171,516 1,345,995 1,288,407 1,197,409 1,100,971 -8.1
0 - (zero) refers to value less than $500.
Source: Statistics Canada; and Alberta Agriculture and Forestry, Statistics and Data Development Section
Table 44: Alberta Agri-Food Exports to Japan - Value, 2011-2015
(1) Refers to fresh, chilled, frozen meat, edible offal and includes processed meat.
(2) Includes poultry, sheep, and other meat.
$'000
Alberta Agriculture Statistics Yearbook, 2015 - 62 -

% Chg.
2011 2012 2013r 2014r 2015p '15/'14
%
Animals and Crops
Purebred Live Cattle................................................................................... - - - 878 341 -61.2
Live Cattle (incl. Purebred)...................................................................................- - - 336 1,069 217.8
Other Live Animals (Sheep and Goats)...................................................................................0 1 10 - 0 0.0
Barley...........................................….......................................………………………….3,993 8,535 374 335 - -100.0
Wheat..................................................................................………………………108,327 123,133 125,456 103,724 93,414 -9.9
Oats..........................................................................................................................................…340 2,173 286 18 814 …
Other Cereals, Unmilled..................................................................................…- - - - - -
Peas, Dried..........................................................................................................................................…- - 36 38 - -100.0
Lentils..........................................................................................................................................…- 93 - - - -
Other Dried Beans..................................................................................… - 1,526 1,994 - - -
Potatoes, Seed and Other..................................................................................…1,436 1,302 926 595 - -100.0
Canola Seed..................................................................................… 301,670 345,461 279,748 247,767 251,830 1.6
Linseed..........................................................................................................................................…129 235 380 217 249 14.4
Sub-Total...............................................................................… 415,896 482,458 409,211 353,908 347,716 -1.7
Crude Animal and Plant Products
Raw Hides and Skins..................................................................................…7 2 2 0 0 2.6
Fur Skins Undressed..................................................................................… 0 1 1 - - 0.0
Bovine Semen..................................................................................… 185 66 88 386 1,080 179.8
Other Crude Animal Products..................................................................................…7,112 8,805 8,819 10,980 14,927 36.0
Peat Moss..........................................................................................................................................…- - - - - -
Other Crude Vegetable Products..................................................................................…- - - 3 3 -3.4
Sub-Total..................................................................................… 7,305 8,874 8,909 11,369 16,010 40.8
Products and By-Products of Manufacture
Meats (1) - Total.................................................................................................137,749 108,436 94,606 145,604 152,527 4.8
Beef and Veal..................................................................................…133,800 103,598 84,221 136,318 142,594 4.6
Pork.........................................................................................…....................................…3,465 4,210 10,385 9,157 9,863 7.7
Horsemeat..................................................................................… 17 - - - - -
Other Meat (2).........................................................................................…....................................…239 77 - 98 70 -29.1
Processed Meat....................................................................…..................…228 551 - 29 - -
Dairy Products .....................................................................….................…1,400 625 - - - -
Malt Roasted or not Roasted..................................................................................…- - - 7,356 21,001 185.5
Cereals, Milled..................................................................................… 2,897 5,456 2,455 4,929 11,453 132.4
Fruit and Vegetable Preparations......................................................................................…- - - - - -
Fruit and Vegetable Juices..................................................................................…4,373 4,399 4,597 3,531 - -100.0
Processed Potatoes......................................................................................…5,779 8,872 5,387 3,440 3,590 4.4
Sugar and Sugar Preparations......................................................................................…11,501 12,706 8,400 - 2,900 0.0
Food and Food Materials..................................................................................…1 - - 432 - -100.0
Oilseed Cake and Meal..................................................................................…1,379 66 - - - -
Prepared Animal Feeds...................................................................................................…- - - - - -
Whiskey...................................................................................................…200 53 105 129 312 142.4
Beverages (excl. Beer and Fruit Juices)…………………………………………...- - - 298 6,214 …
Tallow.............................................................................................….........…69 - - 4,420 9,142 106.9
Canola/Mustard Oil, Crude.....................................................…............................…50,827 - - - - -
Canola/Mustard Oil, Refined.....................................................…............................…- - - - - -
Other Oils, Fats and Waxes..................................................................................…864 511 2,632 1,861 1,622 -12.8
Sub-Total..................................................................................……………..217,038 141,123 118,181 171,998 208,761 21.4
Total Exports to Mexico..................................................................................…640,239 632,455 536,302 537,275 572,487 6.6
0 - (zero) refers to value less than $500.
(2) Includes poultry, sheep, and other meat.
Source: Statistics Canada; and Alberta Agriculture and Forestry, Statistics and Data Development Section
Table 45: Alberta Agri-Food Exports to Mexico - Value, 2011-2015
$'000
(1) Refers to fresh, chilled, frozen meat, edible offal and includes processed meat.
- 63 - Alberta Agriculture Statistics Yearbook, 2015

% Chg.
2011 2012 2013r 2014r 2015p '15/'14
%
Animals and Crops
Live Cattle, Purebred................................................................................... - - - - - -
Live Hogs................................................................................... - 300 - - - -
Barley..................................................................................…...........................................….......................................………………………….21,268 40,029 51,946 76,800 114,101 48.6
Wheat..................................................................................………………….23,356 74,309 109,320 35,839 120,206 235.4
Oats..................................................................................…………………. 2 6 8 12 290 …
Other Cereals, Unmilled..................................................................................…- - - - - -
Hay and Fodder (incl. Alfalfa Cubes)..................................................................................…- 299 1,606 4,515 6,973 54.4
Peas, Dried..........................................................................................................................................…30,446 75,567 34,391 11,825 6,459 -45.4
Lentils..........................................................................................................................................…- 14 41 405 207 -49.0
Other Dried Beans..........................................................................................................................................…- 45 - - - -
Vegetables and Fruits..................................................................................… - 160 - 921 - -
Canola Seed.......................................................................................................…277,135 673,134 663,645 782,652 689,815 -11.9
Mustard Seeds...............................................................................………………………….…34 29 48 33 43 31.6
Linseed...............................................................................………………………….…1,898 8,283 12,494 11,316 25,562 125.9
Sub-Total...............................................................................… 354,139 872,174 873,499 924,319 963,656 4.3
Crude Animal and Plant Products
Raw Hides and Skins..................................................................................…122,482 132,231 170,577 201,606 137,770 -31.7
Fur Skins Undressed..................................................................................… - - - 7 - -
Bovine Semen..................................................................................… 878 2,914 2,687 5,905 4,207 -28.8
Other Crude Animal Products..................................................................................…4,034 1,860 1,221 1,574 2,874 82.5
Seeds for Sowing..................................................................................….......................................….......................................…581 728 653 487 244 -50.0
Nursery Stock...................................................................….......................................….......................................…- 15 - - - -
Peat Moss..........................................................................................................................................…18 27 - - 15 -
Other Crude Vegetable Products..................................................................................…25 3 42 511 110 -78.4
Sub-Total..................................................................................… 128,019 137,777 175,180 210,090 145,220 -30.9
Products and By-Products of Manufacture
Meats (1) - Total.................................................................................................2,913 8,411 26,669 39,990 257,360 543.6
Beef and Veal..................................................................................… - 4,686 25,929 39,023 234,879 501.9
Pork.........................................................................................…....................................…2,759 3,726 740 967 22,456 …
Other Meat (2).........................................................................................…....................................…154 - - - - -
Peocessed Meat.........................................................................................…....................................…- - - - 26 -
Dairy Produce .....................................................................….................… 3 - - - - -
Honey .....................................................................….................… 385 257 400 224 385 71.6
Wheat or Meslin Flour..................................................................................…19 - 18 60 - -100.0
Malt Roasted or not Roasted..................................................................................…- - 13 - - -
Cereals, Milled..................................................................................… 13 10 172 189 - -100.0
Cereals, Prepared..................................................................................… - - - - - -
Processed Potatoes......................................................................................…6,102 4,211 6,793 27,195 19,633 -27.8
Sugar and Sugar Preparations……………………………………………………………………- - - 7 - -
Food/Food Materials..................................................................................…76 33 137 338 409 20.7
Oilseed Cake and Meal..................................................................................…74,587 56,415 - - 4 -
Prepared Animal Feeds...................................................................................................…1,269 - 196 188 98 -47.9
Whiskey..............................................................................................................…...............…19 32 - - 83 -
Other Beverages (Mineral Water and Grape Wine)..............................................................................................................…...............…91 146 137 2 20 830.0
Canola/Mustard Oil- Crude.....................................................…............................…369,241 565,043 432,438 124,511 197,714 58.8
Canola/Mustard Oil- Refined.....................................................…............................…- 1,880 1,646 1,800 3,024 68.0
Other Oils, Fats and Waxes..................................................................................…5 26 - 17 94 467.1
Sub-Total..................................................................................……………..454,725 636,465 468,618 194,519 478,824 146.2
Total Exports to China..................................................................................…936,883 1,646,416 1,517,298 1,328,928 1,587,700 19.5
(2) Includes poultry, sheep, and other meat.
Source: Statistics Canada; and Alberta Agriculture and Forestry, Statistics and Data Development Section
Table 46: Alberta Agri-Food Exports to China - Value, 2011-2015
$'000
(1) Refers to fresh, chilled, frozen meat and includes edible offal.
Alberta Agriculture Statistics Yearbook, 2015 - 64 -

% Chg. Average
2011 2012 2013r 2014r 2015p '15/'14 2011-2015
% $'000
Top Five Markets in 2015
1 China..............................................................................................936,883 1,646,416 1,517,298 1,328,928 1,587,700 19.5 1,403,445
2 Japan...........................................................................................1,171,516 1,345,995 1,288,407 1,197,409 1,100,971 -8.1 1,220,860
3 Korea, South...........................................................................................296,539 174,005 114,134 227,718 232,542 2.1 208,988
4 Indonesia...........................................................................................139,716 168,884 220,091 190,174 213,562 12.3 186,485
5 Bangladesh...........................................................................................153,713 107,549 103,722 110,053 156,930 42.6 126,393
Top Five Markets 2,698,366 3,442,849 3,243,652 3,054,282 3,291,706 7.8 3,146,171
Remaining Markets
6 Philippines...........................................................................................43,729 34,413 51,548 30,328 128,468 323.6 57,697
7 Pakistan...........................................................................................169,946 45,307 83 62,971 124,064 97.0 80,474
8 Hong Kong...........................................................................................104,127 82,702 152,846 191,738 108,000 -43.7 127,882
9 Sri Lanka...........................................................................................94,852 120,363 49,129 67,247 76,934 14.4 81,705
10 Taiwan...........................................................................................50,281 35,654 33,327 42,245 40,422 -4.3 40,386
11 Vietnam...........................................................................................11,732 23,475 32,674 11,548 38,773 235.8 23,640
12 Thailand...........................................................................................49,334 28,757 19,857 15,100 37,670 149.5 30,144
13 Malaysia...........................................................................................40,608 66,442 16,619 12,103 36,781 203.9 34,511
14 India...........................................................................................57,797 58,271 38,545 17,717 30,924 74.5 40,651
15 Singapore...........................................................................................13,447 21,049 38,525 36,901 26,735 -27.5 27,331
16 Myanmar (Burma)...........................................................................................- - 576 508 504 -0.7 318
17 Nepal...........................................................................................503 - 53 138 44 -68.2 148
18 Brunei Darussalam...........................................................................................- - 63 - 35 - 20
19 Mongolia...........................................................................................- 68 10 18 1 -92.8 19
20 Afghanistan...........................................................................................- 111 0 0 - -100.0 22
21 Korea, North...........................................................................................60 - - - - - 12
22 Macao...........................................................................................126 13 6,819 1,019 - -100.0 1,595
23 Timor-Leste……………………………………………………………………………….- - - 15 - -100.0 -
Remaining Markets 636,541 516,625 440,674 489,596 649,356 32.6 546,558
Exports to Asia.....................................................................................................3,334,907 3,959,474 3,684,326 3,543,878 3,941,062 11.2 3,692,729
Exports to All Countries...............................................................................8,061,065 9,209,942 8,711,642 9,744,893 10,181,266 4.5 9,181,762
Asia % of Total Exports..................................................................................41.4 43.0 42.3 36.4 38.7 40.2
0 - (zero) refers to value less than $500.
Table 47: Alberta Agri-Food Exports to Asia - Value, 2011-2015
$'000
Source: Statistics Canada; and Alberta Agriculture and Forestry, Statistics and Data Development Section
Source: Statistics Canada; and Alberta Agriculture and Forestry, Statistics and Data Development Section
Fig. 24 Alberta Agri-Food Exports to All Countries and to Asia, 2011-2015
0
2
4
6
8
10
12
2011 2012 2013 2014 2015
$ B
illio
ns
All Countries
Asia
- 65 - Alberta Agriculture Statistics Yearbook, 2015

% Chg. Average
2011 2012 2013r 2014r 2015p '15/'14 2011-2015
% $'000
8,061,065 9,209,942 8,711,642 9,744,893 10,181,266 4.5 9,181,762
Agri-Food Exports to EU (28)
1 Italy…………………………………………………………………………………72,279 58,009 53,574 94,197 95,577 1.5 74,727
2 France…………………………………………………………………………………..31,234 35,057 23,403 31,194 58,095 86.2 35,797
3 United Kingdom……………………………………………………………..47,166 57,019 52,831 38,556 49,578 28.6 49,030
4 Germany…………………………………………………………………………………….72,815 11,858 15,668 18,382 33,507 82.3 30,446
5 Spain…………………………………………………………………………………….8,169 11,826 21,470 17,084 29,421 72.2 17,594
6 Belgium………………………………………………………………………………………………………..…..50,251 22,943 23,827 37,803 29,321 -22.4 32,829
7 Netherlands……………………………………………………………………..29,580 35,060 15,446 25,506 23,499 -7.9 25,818
8 Portugal………………………………………………………………………….34,463 14,636 2,871 8,127 16,083 97.9 15,236
9 Sweden…………………………………………………………………………………..2,358 2,511 5,144 6,976 10,027 43.7 5,403
10 Poland……………………………………………………………………………2,149 4,046 6,173 5,663 8,201 44.8 5,247
11 Czech Republic………………………………………………………………..4,293 5,049 4,455 4,146 7,312 76.4 5,051
12 Greece………………………………………………………………………………………..4,903 7,629 6,097 7,241 7,178 -0.9 6,610
13 Finland………………………………………………………………………………1,368 2,880 3,472 4,277 5,416 26.6 3,483
14 Denmark………………………………………………………………………………..4,867 2,090 2,461 1,683 2,023 20.2 2,625
15 Hungary…………………………………………………………………………………..2,325 2,381 2,090 1,711 1,866 9.1 2,075
16 Romania…………………………………………………………………………….- - 718 971 1,122 15.6 562
17 Lithuania……………………………………………………………………………606 1,087 766 865 937 8.4 852
18 Latvia……………………………………………………………………………………409 596 374 279 574 105.6 446
19 Croatia……………………………………………………………………………………………..197 166 207 371 511 37.5 291
20 Ireland, Republic of (EIRE)…………………………………………………………………384 4,302 1,087 611 478 -21.8 1,372
21 Cyprus……………………………………………………………………………………………………………….185 292 807 1,028 423 -58.9 547
22 Bulgaria……………………………………………………..…………………………96 95 209 233 317 35.8 190
23 Malta……………………………………………………………………..…………………………- - 388 92 176 91.2 131
24 Luxembourg………………………………………………………………………………30 16 20 103 47 -54.7 43
25 Austria…………………………………………………………………….………………………………..10 3 100 0 17 … 26
26 Estonia………………………………………………………………………………..16 - 16 13 4 -72.0 10
27 Slovakia……………………………………………………………………………260 - - 12 - - 54
28 Slovenia…………………………………………………………………………………………- 158 77 - - - 47
Exports to EU (28)…………………………………………………………………….………………………370,414 279,708 243,750 307,124 381,707 24.3 316,541
EU % of Total…………………………………………………………………………..…4.6 3.0 2.8 3.2 3.7 3.4
Agri-Food Exports to TPP % $'000
1 United States (US)…………………………………………………………………..…………………………2,550,749 2,967,055 3,049,960 3,936,307 3,997,783 1.6 3,300,371
2 Japan…………………………………………………………………..…………………………1,171,516 1,345,995 1,288,407 1,197,409 1,100,971 -8.1 1,220,860
3 Mexico…………………………………………………………………..…………………………640,239 632,455 536,302 537,275 572,487 6.6 583,751
4 Peru…………………………………………………………………..…………………………66,467 69,637 90,890 131,313 149,975 14.2 101,656
5 Chile…………………………………………………………………..…………………………24,490 32,065 20,020 75,263 57,298 -23.9 41,828
6 Vietnam…………………………………………………………………..…………………………11,732 23,475 32,674 11,548 38,773 235.8 23,640
7 Malaysia…………………………………………………………………..…………………………40,608 66,442 16,619 12,103 36,781 203.9 34,511
8 Singapore…………………………………………………………………..…………………………13,447 21,049 38,525 36,901 26,735 -27.5 27,331
9 Australia…………………………………………………………………..…………………………40,672 32,210 27,108 21,201 26,132 23.3 29,465
10 New Zealand…………………………………………………………………..…………………………13,689 9,061 10,994 12,025 12,991 8.0 11,752
11 Brunei Darussalam…………………………………………………………………..…………………………- - 63 - 35 - 20
Exports to TPP…………………………………………………………………..…………………………4,573,608 5,199,444 5,111,563 5,971,345 6,019,962 0.8 5,375,185
TPP % of Total…………………………………………………………………………..…56.7 56.5 58.7 61.3 59.1 58.5
Exports to TPP Excluding US…………………………………………………………………………..…2,022,860 2,232,389 2,061,603 2,035,038 2,022,179 -0.6 2,074,814
TPP (Excl. US) % of Total…………………………………………………………………………..…25.1 24.2 23.7 20.9 19.9 22.6
Source: Statistics Canada; and Alberta Agriculture and Forestry, Statistics and Data Development Section
Table 48: Alberta Agri-Food Exports to European Union (28) and
Trans-Pacific Partnership (TPP) Countries - Value, 2011-2015
$'000
$'000
Total Alberta Agri-Food Exports
Alberta Agriculture Statistics Yearbook, 2015 - 66 -

Page No.
Alberta Livestock Industry in 2015……………………………………………………………………………………….68
Table No.
49. Livestock on Farms, Canada and Provinces, July 1, 2004-2015 ………………………………………………………………………..70
50. Cattle and Calves on Alberta Farms, July 1, 1970-2015………………………………………………………………………….…..………………..71
51. Pigs on Alberta Farms, July 1, 1989-2015 …………………………………………………………………………………………………………….. .73
52. Sheep and Lambs on Alberta Farms, July 1, 1972-2015…………………………………………………………………………………………………….74
53. Livestock Slaughtered, Canada and Provinces, 2008-2015 …………………………………………………………………………………………………….75
54. Livestock Slaughtered in Alberta and Western Canada, 2005-2015 ………………………………………………………………………………………………….. 76
55. Summary of Alberta Slaughter Hog Marketings, 2006-2015……………………………………………………………………………………………………..78
56. Alberta Supply and Disposition Livestock Balance Sheet, 2013-2015 ………………………………………………………………………78
57. Alberta Direct to Packer Sales, 2005-2015 …………………………………………………………………………………………………………………………79
58. Alberta Slaughter Cattle Prices, 2005-2015…………………………………………………………………………………………………………………………80
59. Average Feeder Cattle Prices, Northern Alberta, 2003-2015 ………………………………………………………………………..……………….81
60. Average Feeder Cattle Prices, Southern Alberta, 2003-2015 ………………………………………………………………………………………82
61. Average Calf Prices, Northern Alberta, 2003-2015……………………………………………………………………………………………………………………….. ………………83
62. Average Calf Prices, Southern Alberta, 2003-2015………………………………………………………………………………………………………………………84
63. Alberta Average Slaughter Hog Prices (Index 100), 2004-2015…………………………………………………………………………………………………………………………85
64. Central Alberta Average Market Lamb Prices (95-115 Lbs.), 2004-2015…………………………………………………………………………………………………………………………….. .86
65. Alberta Sheep and Lamb Marketings, 2004-2015………………………………………………………………………………..………………86
66. Alberta Brand Inspection Record of Live Cattle and Calf Shipments Out-of-Province, 2014 and 2015……………………………………………………………………………….. ………87
67. Registrations and Sales of Registered Horses in Alberta, 2006-2015………………………………………………………………………………88
68. Alberta Horse Meat Exports by Destination, 2006-2015………………………………………………………………...………………………88
69. Alberta Game Farming Industry, 2006-2015…………………………………………………………………………………………………………………………………………………89
70. Alberta Dairy Industry, 2010-2015…………………………………………………………………………………………………………………………………………………89
71. Output and Value of Poultry Meats, Alberta, 2004-2015…………………………………………………..……………………………………90
72. Production, Disposition and Value of Eggs, Alberta, 2004-2015………………………………………………………………………………………………………………91
73. Chickens Slaughtered in Registered Stations, Alberta, 2003-2015…………………………………………………………………………………………………91
L
I
V
E
S
T
O
C
K
- 67 - Alberta Agriculture Statistics Yearbook, 2015
Alberta Agriculture Statistics Yearbook, 2015 - 68 -
Alberta Livestock Industry in 2015
Cattle and Calves As of July 1, 2015, cattle and calves on Alberta farms totalled 5.3 million head, down 2.6 per cent from July 1, 2014. The decline in inventory was mainly due to a drop in all cattle classes with the exception of steers and milk cows. Alberta's total beef breeding herd, comprising cows and heifers, decreased 4.0 per cent to 1.8 million head. Total beef cows numbers fell 4.4 per cent to 1.5 million head, while beef heifers for replacement shrunk 1.6 per cent to 248,100 head. The decline in inventories was the continuation of a downward trend due to the strength in cattle prices in recent years that encouraged marketings. Like the beef herd, Alberta’s dairy herd, comprising of milk cows and dairy replacement heifers fell marginally by 0.4 per cent to 118,200 head, compared to July 1, 2014. Nationally, Canadian farmers had 13.0 million head of cattle on their farms, down 2.0 per cent from July 1, 2014. Most provinces showed a decline in inventories with the exception of British Columbia. Alberta continued to lead the nation in cattle and calf inventories (5.3 million head), followed by Saskatchewan (2.7 million head), and Ontario (1.7 million head). Currently, Alberta accounts for 53.7 per cent of the total Western Canadian herd (9.9 million head) and 40.8 per cent nationally (13.0 million head). Three-quarters of Canadian beef processing occurred in Western Canada, with the majority concentrated in Alberta. In 2015, Western Canadian cattle slaughter (excluding calves) in federally and provincially inspected plants was 2.0 million head, down 5.1 per cent from 2014. Steers and heifers accounted for the bulk of the slaughter, and together constituted 84.3 per cent of the total. In 2015, cow slaughter was down 13.8 per cent to 298,218 head, while bull slaughter rose 29.9 per cent to 12,978 head. Cattle prices, which had strengthened for six consecutive years, reached a new historic high in 2015. Tight cattle supplies coupled with strong demand for beef were the main factors driving prices up. Compared to 2014, the annual average slaughter steer price rose 18.9 per cent to $182.71 per cwt., while slaughter heifer prices increased 18.6 per cent to $180.75 per cwt., cow prices (D1/D2) grew 18.9 per cent to $132.45 per cwt., and cow prices (D3) rose 19.2 per cent to $118.03 per cwt. Similarly feeder cow prices jumped 22.7 per cent to $139.69 per cwt., and bull prices went up 27.2 per cent to $153.63 per cwt. Alberta live cattle and calf shipments out-of-province were down significantly compared with 2014. Total live cattle and calf shipments from Alberta dropped 28.2 per cent to 406,179 head. An increase in the US calf crop, record US carcass weights and a narrow fed basis were some of the factors which led to a reduction in cattle exports in 2015. Live feeder cattle and calf shipments to all destinations in 2015 totalled 188,470 head, 1.2 per cent above 2014. Of this total, 144,672 head, were exported to other Canadian provinces, and 43,798 head were shipped to the United States and other countries. Total shipments of cattle and calves for slaughter fell 44.2 per cent to 201,748 head compared to a year earlier. Of this total, the bulk (84.7 per cent) was shipped to the United States, with the remainder shipped to other Canadian provinces. Shipments of live replacement cattle and calves declined 12.0 per cent to 15,961 head. The majority (93.6 per cent) of replacements were shipped to other Canadian provinces, with Saskatchewan and British Columbia accounting for the bulk. Pigs Alberta’s total pig herd estimated at 1.5 million head, was up 1.4 per cent from July 1, 2014. Inventories increased for all classes of animals with the exception of market hogs in the "120-180 pounds" class and boars which remained flat. Among the factors impacting pig inventories were relatively strong slaughter hog prices and consumer demand for pork. The estimated breeding inventory, comprising boars, sows and bred gilts, was up 0.4 per cent from July 1, 2014, to 140,900 head. Sows and bred gilts increased 0.4 per cent to 136,600 head, while boars remained unchanged at 4,300 head. The total market hog inventory grew 1.5 per cent to 1.4 million head. Hogs in the "Under 50 pounds" class rose 1.5 per cent to 491,200 head, while hogs in the “50 to 119 pounds” class increased 0.2 per cent to 247,900 head. Similarly, hogs in the “over 180 pounds” class was up 10.8 per cent to 310,600 head, while hogs in the "120-180 pounds" class were down 5.8 per cent to 304,400 head. Nationally, Canadian producers had 13.2 million head of pigs, up 1.5 per cent from July 1, 2014. Across the country Alberta ranked fourth in pig inventories (1.5 million head), behind Quebec (4.2 million head), Ontario (3.1 million head), and Manitoba (3.0 million head). All provinces posted gains in hog inventories with the exception of British Columbia and Prince Edward Island. Alberta accounted for 26.0 per cent of the Western Canadian pig population of 5.7 million head, and 11.3 per
Alberta Agriculture Statistics Yearbook, 2015 - 69 -
cent of the national total of 13.2 million head. In 2015, over a tenth of Canadian pork processing occurred in Alberta. Hog slaughter in federally and provincially inspected plants, irrespective of origin, increased 6.5 per cent to 2.7 million head, compared to 2014. The 2015 slaughter represented 12.6 per cent of the Canadian total of 21.2 million head, and 30.4 per cent of the Western Canadian total of 8.8 million head. The annual average index 100 hog price fell 23.5 per cent to $1.56 per kilogram compared to 2014. Prices were higher in 2014 due to tighter hog supplies caused by the impact of Porcine Epidemic Diarrhea (PED) virus. Since then, hog inventories have increased in both Canada and the US, leading to the drop in prices observed in 2015. Sheep and Lambs As of July 1, 2015, the size of the provincial flock on Alberta farms was 195,000 head, down 2.5 per cent from a year earlier. The drop in inventory was mainly due to a decline in all classes of animals. Record slaughter lamb prices in late 2014 and the first half of 2015 encouraged lamb marketings. Ewes, at 89,400 head, were 0.9 per cent below July 1, 2014. Replacement lambs declined 1.4 per cent to 14,000 head, and market lambs decreased 4.1 per cent to 87,000 head. The total number of rams fell 6.1 per cent to 4,600 head. Nationally, the sheep and lamb flock declined 2.0 per cent to 1.1 million head. The decline in inventory was not unique to Alberta as all provinces showed inventories down with the exception of Newfoundland and Labrador, Manitoba and Saskatchewan which had increases. Among provinces, Alberta ranked third in sheep and lamb inventories (195,000 head), behind Ontario (329,100 head), and Quebec (250,000 head). Alberta accounted for 43.7 per cent of the total Western Canadian flock of 446,000 head, and 18.2 per cent of the national total of 1.1 million head. Apiculture (1)
Preliminary estimates in 2015 indicate that the number of beekeepers in Alberta decreased for the first time in six years. There were 1,000 beekeepers in the province (down 1.5 per cent from 2014) and represented 11.7 per cent of the Canadian total of 8,533 or 20.3 per cent of the Western Canadian total of 4,925 beekeepers. There were 295,000 colonies in the province, setting a new record, and up 4.3 per cent from 282,900 colonies in 2014. Despite Alberta accounting for a relatively small percentage of the nation’s total beekeepers, the province had 40.9 per cent of the honey producing colonies in Canada (721,106 colonies), and 55.4 per cent of the Western Canadian total (532,480 colonies). In 2015, total honey production was estimated at 19,394 tonnes, 20.4 per cent higher than the 16,103 tonnes in 2014, and the second highest on record. The increase was attributed to a rise in the number of honey bee colonies in the province, and significantly higher yields which jumped 15.5 per cent to 66 kilograms per colony. Alberta continues to lead the nation in honey production, accounting for 44.9 per cent of the Canadian total of 43,226 tonnes, and 52.6 per cent of the Western Canadian total of 36,870 tonnes.
_______________________________ (1) 2015 honey statistics are based on the Statistics Canada, CANSIM Database Table Number 001-0007 hence, estimates are subject to revision. Preliminary estimates are used to facilitate comparisons with Canada.

British Atlantic
Canada Alberta Sask. Manitoba Columbia Ontario Quebec Provinces
2004........................................ 15,670.0 6,400.0 3,540.0 1,730.0 950.0 2,180.3 1,515.0 294.7
2005........................................ 16,610.0 6,700.0 3,625.0 1,735.0 915.0 2,154.6 1,455.0 295.4
2006........................................ 16,000.0 6,300.0 3,450.0 1,680.0 820.0 2,032.6 1,425.0 292.4
2007........................................ 15,665.0 6,350.0 3,390.0 1,505.0 785.0 1,967.2 1,380.0 287.8
2008........................................ 14,910.0 5,970.0 3,215.6 1,485.0 730.0 1,881.4 1,350.0 278.0
2009........................................ 14,315.0 5,725.0 3,015.0 1,415.0 690.0 1,866.8 1,350.0 253.2
2010........................................ 13,695.0 5,425.0 2,920.0 1,330.0 650.0 1,816.3 1,310.0 243.7
2011........................................ 13,545.0 5,455.0 2,895.0 1,260.0 645.0 1,775.7 1,275.0 239.3
2012........................................ 13,520.0 5,460.0 2,905.0 1,250.0 650.0 1,789.1 1,230.0 235.9
2013........................................ 13,520.0 5,535.0 2,910.0 1,255.0 645.0 1,743.0 1,200.0 232.0
2014r........................................13,295.0 5,455.0 2,800.0 1,220.0 650.0 1,764.0 1,175.0 231.0
2015p........................................13,035.0 5,315.0 2,715.0 1,205.0 660.0 1,743.0 1,170.0 227.05410 2905 1280 655 1260 239.4
2004........................................ 14,980.0 2,030.0 1,350.0 2,890.0 155.0 3,849.4 4,350.0 355.6
2005........................................ 15,195.0 2,000.0 1,395.0 2,940.0 144.0 3,995.4 4,384.0 336.6
2006........................................ 15,065.0 2,056.0 1,389.0 2,980.0 135.0 3,929.6 4,250.0 325.4
2007........................................ 14,880.0 1,950.0 1,345.0 3,005.0 131.0 3,958.7 4,190.0 300.3
2008........................................ 13,320.0 1,630.0 1,025.0 2,840.0 123.0 3,348.8 4,165.0 188.2
2009........................................ 12,595.0 1,475.0 940.0 2,675.0 116.0 3,223.6 4,015.0 150.4
2010........................................ 12,525.0 1,420.0 975.0 2,815.0 89.0 2,994.6 4,100.0 131.4
2011........................................ 12,650.0 1,400.0 1,040.0 2,845.0 88.0 3,033.1 4,120.0 123.9
2012........................................ 12,640.0 1,395.0 1,030.0 2,830.0 89.0 3,038.9 4,135.0 122.1
2013........................................ 12,765.0 1,440.0 1,070.0 2,860.0 87.0 3,045.0 4,140.0 123.0
2014r........................................13,005.0 1,475.0 1,145.0 2,945.0 89.0 3,022.6 4,210.0 118.4
2015p........................................13,200.0 1,495.0 1,170.0 2,995.0 87.0 3,102.9 4,235.0 115.112870 1410 1100 2890 89 3120.5
2004........................................ 1,240.5 248.0 160.0 82.0 75.0 340.0 290.0 45.5
2005........................................ 1,190.5 239.0 142.0 78.0 76.0 310.0 302.0 43.5
2006........................................ 1,151.2 228.0 133.0 68.5 62.5 311.0 307.0 41.2
2007........................................ 1,109.9 209.0 122.0 70.0 58.0 312.0 296.0 42.9
2008........................................ 1,090.8 193.0 128.0 66.0 61.0 309.0 293.0 40.8
2009........................................ 1,104.4 189.0 119.0 71.0 59.0 335.0 289.0 42.4
2010........................................ 1,104.7 195.0 121.0 65.0 57.0 343.0 280.0 43.7
2011........................................ 1,138.0 203.0 123.0 68.0 58.0 360.0 280.0 46.0
2012........................................ 1,138.4 201.0 127.0 73.0 58.0 359.0 273.0 47.4
2013........................................ 1,125.9 204.0 126.0 76.0 59.0 350.8 263.0 47.1
2014r........................................ 1,092.9 200.0 123.0 72.0 57.0 335.5 258.1 47.3
2015p........................................ 1,071.6 195.0 124.0 73.0 54.0 329.1 250.0 46.5
Source: Statistics Canada, CANSIM Database Table Numbers 003-0031, 003-0032 and 003-0100
Table 49: Livestock on Farms, Canada and Provinces, July 1, 2004-2015
Cattle and Calves - '000 Head
Pigs - '000 Head
Sheep and Lambs - '000 Head
Alberta Agriculture Statistics Yearbook, 2015 - 70 -
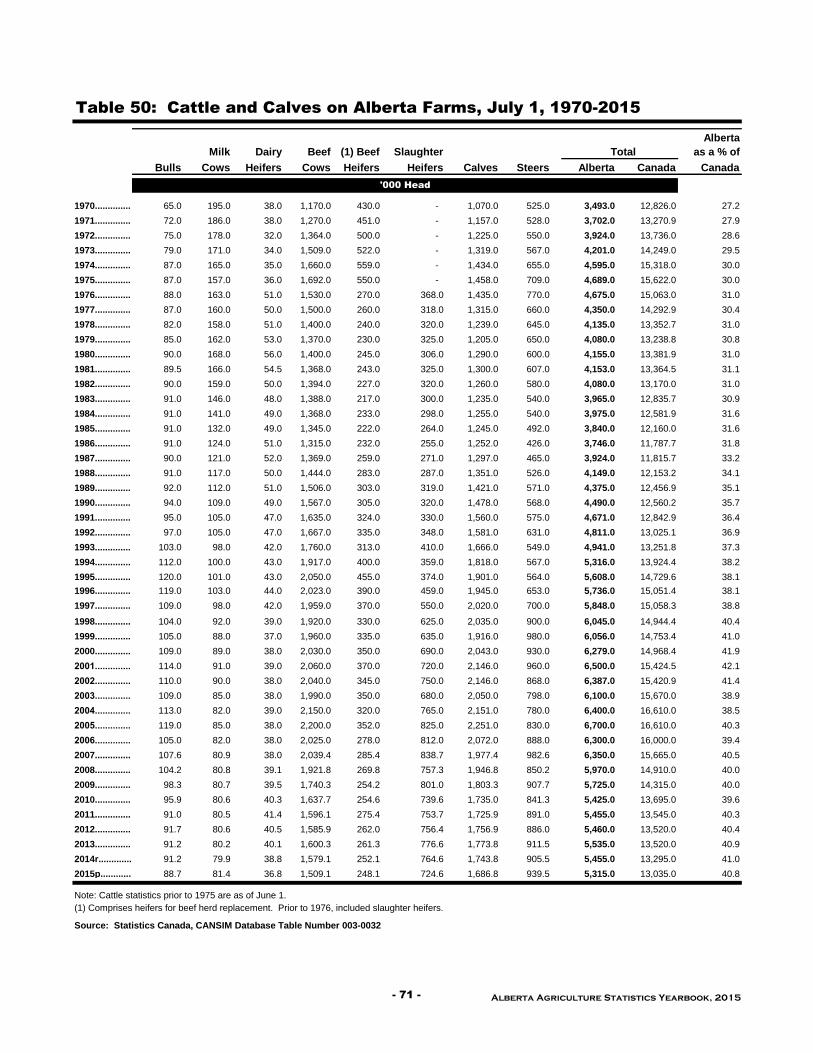
Milk Dairy Beef (1) Beef Slaughter
Alberta
as a % of
Bulls Cows Heifers Cows Heifers Heifers Calves Steers Alberta Canada Canada
1970........................ 65.0 195.0 38.0 1,170.0 430.0 - 1,070.0 525.0 3,493.0 12,826.0 27.2
1971.......................... 72.0 186.0 38.0 1,270.0 451.0 - 1,157.0 528.0 3,702.0 13,270.9 27.9
1972........................ 75.0 178.0 32.0 1,364.0 500.0 - 1,225.0 550.0 3,924.0 13,736.0 28.6
1973........................ 79.0 171.0 34.0 1,509.0 522.0 - 1,319.0 567.0 4,201.0 14,249.0 29.5
1974...................... 87.0 165.0 35.0 1,660.0 559.0 - 1,434.0 655.0 4,595.0 15,318.0 30.0
1975....................... 87.0 157.0 36.0 1,692.0 550.0 - 1,458.0 709.0 4,689.0 15,622.0 30.0
1976...........................88.0 163.0 51.0 1,530.0 270.0 368.0 1,435.0 770.0 4,675.0 15,063.0 31.0
1977.......................... 87.0 160.0 50.0 1,500.0 260.0 318.0 1,315.0 660.0 4,350.0 14,292.9 30.4
1978....................... 82.0 158.0 51.0 1,400.0 240.0 320.0 1,239.0 645.0 4,135.0 13,352.7 31.0
1979..............................85.0 162.0 53.0 1,370.0 230.0 325.0 1,205.0 650.0 4,080.0 13,238.8 30.8
1980.............................90.0 168.0 56.0 1,400.0 245.0 306.0 1,290.0 600.0 4,155.0 13,381.9 31.0
1981...................... 89.5 166.0 54.5 1,368.0 243.0 325.0 1,300.0 607.0 4,153.0 13,364.5 31.1
1982....................... 90.0 159.0 50.0 1,394.0 227.0 320.0 1,260.0 580.0 4,080.0 13,170.0 31.0
1983....................... 91.0 146.0 48.0 1,388.0 217.0 300.0 1,235.0 540.0 3,965.0 12,835.7 30.9
1984........................ 91.0 141.0 49.0 1,368.0 233.0 298.0 1,255.0 540.0 3,975.0 12,581.9 31.6
1985........................ 91.0 132.0 49.0 1,345.0 222.0 264.0 1,245.0 492.0 3,840.0 12,160.0 31.6
1986......................... 91.0 124.0 51.0 1,315.0 232.0 255.0 1,252.0 426.0 3,746.0 11,787.7 31.8
1987....................... 90.0 121.0 52.0 1,369.0 259.0 271.0 1,297.0 465.0 3,924.0 11,815.7 33.2
1988......................... 91.0 117.0 50.0 1,444.0 283.0 287.0 1,351.0 526.0 4,149.0 12,153.2 34.1
1989........................ 92.0 112.0 51.0 1,506.0 303.0 319.0 1,421.0 571.0 4,375.0 12,456.9 35.1
1990..................... 94.0 109.0 49.0 1,567.0 305.0 320.0 1,478.0 568.0 4,490.0 12,560.2 35.7
1991..................... 95.0 105.0 47.0 1,635.0 324.0 330.0 1,560.0 575.0 4,671.0 12,842.9 36.4
1992....................... 97.0 105.0 47.0 1,667.0 335.0 348.0 1,581.0 631.0 4,811.0 13,025.1 36.9
1993...................... 103.0 98.0 42.0 1,760.0 313.0 410.0 1,666.0 549.0 4,941.0 13,251.8 37.3
1994.........................112.0 100.0 43.0 1,917.0 400.0 359.0 1,818.0 567.0 5,316.0 13,924.4 38.2
1995..................... 120.0 101.0 43.0 2,050.0 455.0 374.0 1,901.0 564.0 5,608.0 14,729.6 38.1
1996....................... 119.0 103.0 44.0 2,023.0 390.0 459.0 1,945.0 653.0 5,736.0 15,051.4 38.1
1997........................ 109.0 98.0 42.0 1,959.0 370.0 550.0 2,020.0 700.0 5,848.0 15,058.3 38.8
1998.................. 104.0 92.0 39.0 1,920.0 330.0 625.0 2,035.0 900.0 6,045.0 14,944.4 40.4
1999.................. 105.0 88.0 37.0 1,960.0 335.0 635.0 1,916.0 980.0 6,056.0 14,753.4 41.0
2000.................. 109.0 89.0 38.0 2,030.0 350.0 690.0 2,043.0 930.0 6,279.0 14,968.4 41.9
2001...............… 114.0 91.0 39.0 2,060.0 370.0 720.0 2,146.0 960.0 6,500.0 15,424.5 42.1
2002................… 110.0 90.0 38.0 2,040.0 345.0 750.0 2,146.0 868.0 6,387.0 15,420.9 41.4
2003................… 109.0 85.0 38.0 1,990.0 350.0 680.0 2,050.0 798.0 6,100.0 15,670.0 38.9
2004................… 113.0 82.0 39.0 2,150.0 320.0 765.0 2,151.0 780.0 6,400.0 16,610.0 38.5
2005................… 119.0 85.0 38.0 2,200.0 352.0 825.0 2,251.0 830.0 6,700.0 16,610.0 40.3
2006................… 105.0 82.0 38.0 2,025.0 278.0 812.0 2,072.0 888.0 6,300.0 16,000.0 39.4
2007........................................107.6 80.9 38.0 2,039.4 285.4 838.7 1,977.4 982.6 6,350.0 15,665.0 40.5
2008........................................104.2 80.8 39.1 1,921.8 269.8 757.3 1,946.8 850.2 5,970.0 14,910.0 40.0
2009........................................98.3 80.7 39.5 1,740.3 254.2 801.0 1,803.3 907.7 5,725.0 14,315.0 40.0
2010........................................95.9 80.6 40.3 1,637.7 254.6 739.6 1,735.0 841.3 5,425.0 13,695.0 39.6
2011........................................91.0 80.5 41.4 1,596.1 275.4 753.7 1,725.9 891.0 5,455.0 13,545.0 40.3
2012........................................91.7 80.6 40.5 1,585.9 262.0 756.4 1,756.9 886.0 5,460.0 13,520.0 40.4
2013........................................91.2 80.2 40.1 1,600.3 261.3 776.6 1,773.8 911.5 5,535.0 13,520.0 40.9
2014r........................................91.2 79.9 38.8 1,579.1 252.1 764.6 1,743.8 905.5 5,455.0 13,295.0 41.0
2015p........................................88.7 81.4 36.8 1,509.1 248.1 724.6 1,686.8 939.5 5,315.0 13,035.0 40.8
Note: Cattle statistics prior to 1975 are as of June 1.
(1) Comprises heifers for beef herd replacement. Prior to 1976, included slaughter heifers.
Source: Statistics Canada, CANSIM Database Table Number 003-0032
Table 50: Cattle and Calves on Alberta Farms, July 1, 1970-2015
Total
'000 Head
- 71 - Alberta Agriculture Statistics Yearbook, 2015
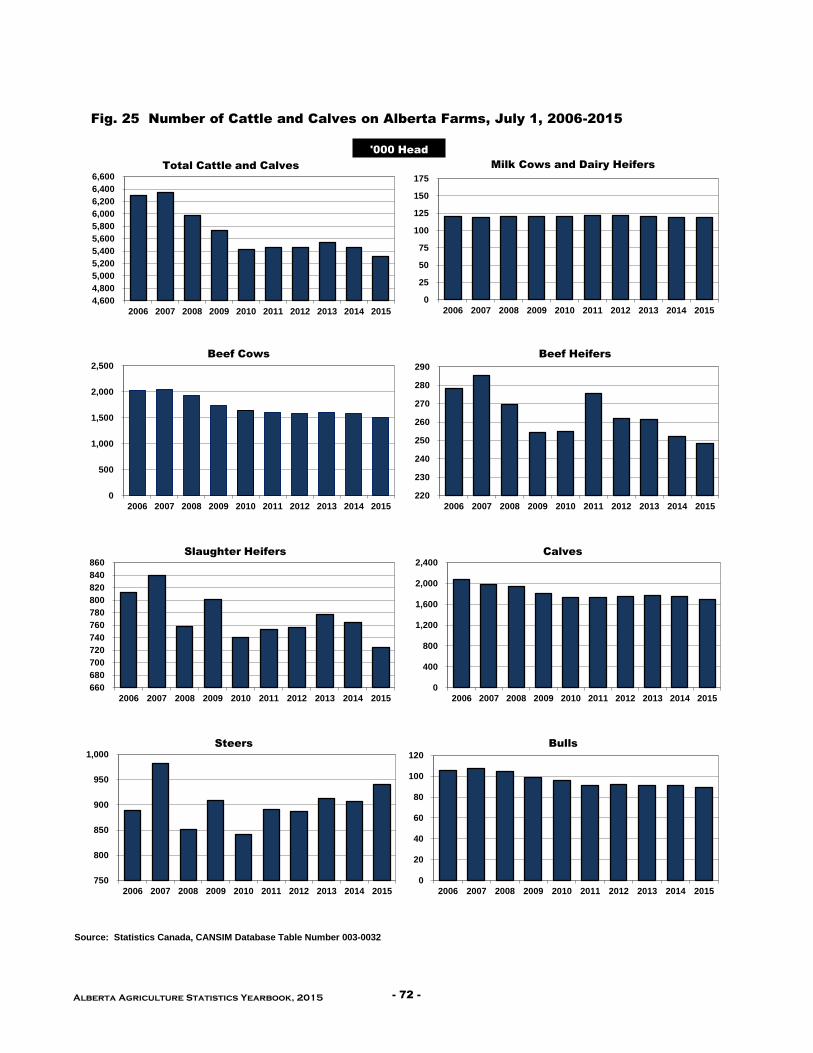
Source: Statistics Canada, CANSIM Database Table Number 003-0032
Fig. 25 Number of Cattle and Calves on Alberta Farms, July 1, 2006-2015
0
500
1,000
1,500
2,000
2,500
2006 2007 2008 2009 2010 2011 2012 2013 2014 2015
Beef Cows
220
230
240
250
260
270
280
290
2006 2007 2008 2009 2010 2011 2012 2013 2014 2015
Beef Heifers
660
680
700
720
740
760
780
800
820
840
860
2006 2007 2008 2009 2010 2011 2012 2013 2014 2015
Slaughter Heifers
0
400
800
1,200
1,600
2,000
2,400
2006 2007 2008 2009 2010 2011 2012 2013 2014 2015
Calves
750
800
850
900
950
1,000
2006 2007 2008 2009 2010 2011 2012 2013 2014 2015
Steers
0
20
40
60
80
100
120
2006 2007 2008 2009 2010 2011 2012 2013 2014 2015
Bulls
4,600
4,800
5,000
5,200
5,400
5,600
5,800
6,000
6,200
6,400
6,600
2006 2007 2008 2009 2010 2011 2012 2013 2014 2015
Total Cattle and Calves
0
25
50
75
100
125
150
175
2006 2007 2008 2009 2010 2011 2012 2013 2014 2015
Milk Cows and Dairy Heifers
'000 Head
Alberta Agriculture Statistics Yearbook, 2015 - 72 -

≤ 49 50-119 120-180 Over 180
1989........................14.0 185.0 199.0 580.7 420.8 361.7 246.8 1,610.0 1,809.0 10,820.5 16.7
1990..................... 13.0 176.0 189.0 542.9 391.4 346.6 219.1 1,500.0 1,689.0 10,146.3 16.6
1991..................... 13.0 187.0 200.0 584.4 406.9 335.4 233.3 1,560.0 1,760.0 10,444.5 16.9
1992....................... 14.1 198.9 213.0 605.7 470.0 359.6 264.8 1,700.1 1,913.1 10,803.0 17.7
1993...................... 12.9 194.2 207.1 587.2 442.5 349.4 262.4 1,641.5 1,848.6 10,596.4 17.4
1994.........................13.5 196.6 210.1 573.3 415.8 331.7 247.7 1,568.5 1,778.6 10,728.1 16.6
1995..................... 13.3 191.6 204.9 632.9 483.8 367.6 341.9 1,826.2 2,031.1 11,536.0 17.6
1996....................... 12.0 178.5 190.5 582.4 458.6 332.4 312.0 1,685.4 1,875.9 11,547.6 16.2
1997........................10.5 182.4 192.9 569.3 451.8 315.2 292.8 1,629.1 1,822.0 11,672.4 15.6
1998................... 9.9 181.2 191.1 574.1 489.6 315.3 310.8 1,689.8 1,880.9 12,357.1 15.2
1999................... 9.9 179.2 189.1 598.1 463.6 301.7 295.7 1,659.1 1,848.2 12,688.8 14.6
2000................... 9.7 185.7 195.4 610.3 501.4 308.7 302.4 1,722.8 1,918.2 13,401.0 14.3
2001................... 8.9 200.9 209.8 638.7 535.4 323.3 322.2 1,819.6 2,029.4 14,050.4 14.4
2002.................... 7.9 209.0 216.9 675.3 551.4 342.5 354.8 1,924.0 2,140.9 14,715.0 14.5
2003.................... 7.5 203.5 211.0 680.4 453.8 330.3 354.5 1,819.0 2,030.0 14,720.0 13.8
2004.................... 7.3 198.0 205.3 669.4 483.1 327.7 344.5 1,824.7 2,030.0 14,980.0 13.6
2005.................... 7.2 196.8 204.0 661.7 482.0 312.3 340.0 1,796.0 2,000.0 15,195.0 13.2
2006.................... 7.1 188.0 195.1 665.1 524.2 316.4 355.2 1,860.9 2,056.0 15,065.0 13.6
2007........................................7.0 179.9 186.9 625.3 468.7 305.5 363.6 1,763.1 1,950.0 14,880.0 13.1
2008........................................6.2 160.2 166.4 537.8 366.0 256.1 303.7 1,463.6 1,630.0 13,320.0 12.2
2009........................................5.2 149.7 154.9 466.2 350.6 235.3 268.0 1,320.1 1,475.0 12,595.0 11.7
2010........................................4.9 139.9 144.8 465.2 341.8 220.2 248.0 1,275.2 1,420.0 12,525.0 11.3
2011........................................4.5 136.1 140.6 485.1 224.9 322.3 227.1 1,259.4 1,400.0 12,650.0 11.1
2012........................................4.3 135.9 140.2 483.1 226.2 314.5 231.0 1,254.8 1,395.0 12,640.0 11.0
2013........................................4.3 136.0 140.3 488.3 234.4 320.8 256.2 1,299.7 1,440.0 12,765.0 11.3
2014r........................................4.3 136.1 140.4 483.8 247.4 323.0 280.4 1,334.6 1,475.0 13,005.0 11.3
2015p........................................4.3 136.6 140.9 491.2 247.9 304.4 310.6 1,354.1 1,495.0 13,200.0 11.3
Source: Statistics Canada, CANSIM Database Table Number 003-0100
Boars Sows Total
Total
Alberta Canada
Table 51: Pigs on Alberta Farms, July 1, 1989-2015
'000 Head
Alberta
as a % of
Canada
All Other Pigs
Weight Class (Lbs.)
Total
Breeding Stock
- 73 - Alberta Agriculture Statistics Yearbook, 2015

Rams Ewes and Lambs, Breeding Lambs, Market
Alberta
as a % of
1 Year Plus Wethers Under 1 Year Under 1 Year Alberta Canada Canada
1972........................ - - - - 259.0 845.0 30.7
1973........................ - - - - 255.0 832.5 30.6
1974...................... - - - - 250.0 783.5 31.9
1975....................... - - - - 226.0 702.6 32.2
1976........................... - - - - 183.0 577.2 31.7
1977.......................... - - - - 146.5 558.6 26.2
1978....................... - - - - 142.5 587.2 24.3
1979.............................. - - - - 153.5 648.7 23.7
1980............................. - - - - 178.0 733.8 24.3
1981...................... - - - - 198.0 803.2 24.7
1982....................... - - - - 203.0 811.9 25.0
1983....................... - - - - 202.0 802.9 25.2
1984........................ 4.5 85.5 - - 188.0 768.8 24.5
1985........................ 4.1 75.9 - - 175.0 720.3 24.3
1986......................... 3.9 79.0 17.8 82.9 183.6 694.9 26.4
1987....................... 4.3 89.0 21.0 88.7 203.0 731.3 27.8
1988......................... 4.6 97.0 23.0 106.4 231.0 788.9 29.3
1989........................ 5.0 110.0 26.0 110.0 251.0 827.5 30.3
1990..................... 5.6 120.0 28.0 121.4 275.0 874.4 31.5
1991..................... 6.0 135.0 32.0 126.0 299.0 917.8 32.6
1992....................... 7.6 143.5 36.9 123.0 311.0 897.1 34.7
1993...................... 6.0 135.2 27.6 118.2 287.0 883.0 32.5
1994......................... 6.3 116.0 29.6 98.1 250.0 825.6 30.3
1995..................... 5.7 124.7 31.4 102.2 264.0 857.6 30.8
1996....................... 6.0 115.3 30.7 92.5 244.5 846.7 28.9
1997........................ 5.8 109.5 28.7 81.7 225.7 821.5 27.5
1998................… 5.9 109.1 26.7 83.3 225.0 892.0 25.2
1999................... 6.5 111.0 30.0 92.5 240.0 979.0 24.5
2000................... 6.6 118.2 35.9 109.3 270.0 1,105.3 24.4
2001................... 7.0 128.8 30.4 120.8 287.0 1,247.7 23.0
2002................... 7.5 132.4 29.1 119.0 288.0 1,252.1 23.0
2003.................... 6.7 119.0 27.8 101.5 255.0 1,247.2 20.4
2004.................... 5.1 101.5 19.3 122.1 248.0 1,240.5 20.0
2005.................... 5.3 103.5 19.0 111.2 239.0 1,190.5 20.1
2006.................... 5.2 103.6 16.0 103.2 228.0 1,151.2 19.8
2007........................................5.0 93.4 16.1 94.5 209.0 1,109.9 18.8
2008........................................4.4 91.1 12.1 85.4 193.0 1,090.8 17.7
2009........................................4.6 88.9 12.8 82.7 189.0 1,104.4 17.1
2010........................................4.8 89.9 14.2 86.1 195.0 1,104.7 17.7
2011........................................5.0 92.6 15.1 90.3 203.0 1,138.0 17.8
2012........................................5.2 91.6 14.9 89.3 201.0 1,138.4 17.7
2013........................................5.2 91.4 15.3 92.1 204.0 1,125.9 18.1
2014r........................................4.9 90.2 14.2 90.7 200.0 1,092.9 18.3
2015p........................................4.6 89.4 14.0 87.0 195.0 1,071.6 18.2
Note: Sheep statistics prior to 1975 are as of June 1.
Source: Statistics Canada, CANSIM Database Table Number 003-0031
Total
'000 Head
Table 52: Sheep and Lambs on Alberta Farms, July 1, 1972-2015
Alberta Agriculture Statistics Yearbook, 2015 - 74 -

Quebec and
Atlantic
Canada Alberta* Ontario Provinces
2008.………….………….………….…………3,792,242 2,303,532 2,587,956 724,753 479,533
2009.…….………….………………3,650,287 2,396,065 2,512,172 698,138 439,977
2010.….………….…………………3,694,979 2,471,063 2,519,028 726,651 449,300
2011.….………….…………………3,345,786 - 2,211,271 705,487 429,028
2012.….………….…………………3,059,962 - 2,015,877 711,001 333,084
2013..………….……………………3,015,832 - 2,035,537 711,012 269,283
2014r.….………….…………………3,083,446 - 2,122,774 700,343 260,329
2015p.….………….…………………2,898,336 - 2,013,571 643,427 241,338
*Alberta cattle and calf slaughter no longer available due to confidentiality. Quebec and
Saskatchewan British Western Atlantic
Canada Alberta and Manitoba Columbia Canada Ontario Provinces
2008.………….…………21,519,392 2,701,366 4,855,220 523,003 8,079,589 5,122,047 8,317,756
2009.………….…………21,639,122 2,599,175 5,281,888 500,035 8,381,098 4,949,398 8,308,626
2010.………….…………21,123,052 2,662,056 5,356,151 499,317 8,517,524 4,432,312 8,173,216
2011.………….…………21,097,518 2,507,035 5,569,738 490,521 8,567,294 4,451,554 8,078,670
2012.………….…………21,120,505 2,406,048 5,784,752 484,602 8,675,402 4,430,997 8,014,106
2013.………….…………20,758,902 2,358,033 5,675,383 472,952 8,506,368 4,232,823 8,019,711
2014r.………….…………20,335,730 2,509,468 5,345,215 493,772 8,348,455 4,021,926 7,965,349
2015p.………….…………21,186,243 2,673,257 5,628,842 504,124 8,806,223 4,017,084 8,362,936
Quebec and
Western Atlantic
Canada Canada Ontario Provinces
2008.………….………… 550,328 113,960 275,761 160,607
2009.………….………… 538,169 105,020 269,019 164,130
2010.………….………… 524,796 105,248 262,202 157,346
2011.………….………… 507,086 100,305 259,713 147,068
2012.………….………… 518,668 106,889 262,735 149,044
2013.………….………… 568,794 121,464 301,737 145,593
2014r.………….………… 585,612 118,747 319,348 147,517
2015p.………….………… 557,851 127,243 294,110 136,498
(1) Data represent livestock slaughtered in federally and provincially inspected plants, irrespective of origin.
Source: Agriculture and Agri-Food Canada
Source: Agriculture and Agri-Food Canada
Sheep and Lambs - Head
Table 53: Livestock Slaughtered (1), Canada and Provinces, 2008-2015
Hogs - Head
Cattle and Calves - Head
Western Canada
Fig. 26 Slaughter Activity in Alberta and Western Canada, Annual Per Cent Change,
2010-2015
0.3
-12.2-8.8
1.0
4.3
-5.1
2.4
-5.8-4.0
-2.0
6.4 6.5
-20.0
-15.0
-10.0
-5.0
0.0
5.0
10.0
15.0
2010 2011 2012 2013 2014 2015 2010 2011 2012 2013 2014 2015
Per
Cen
t C
han
ge
Cattle and Calves (Western Canada) Hogs (Alberta)
- 75 - Alberta Agriculture Statistics Yearbook, 2015
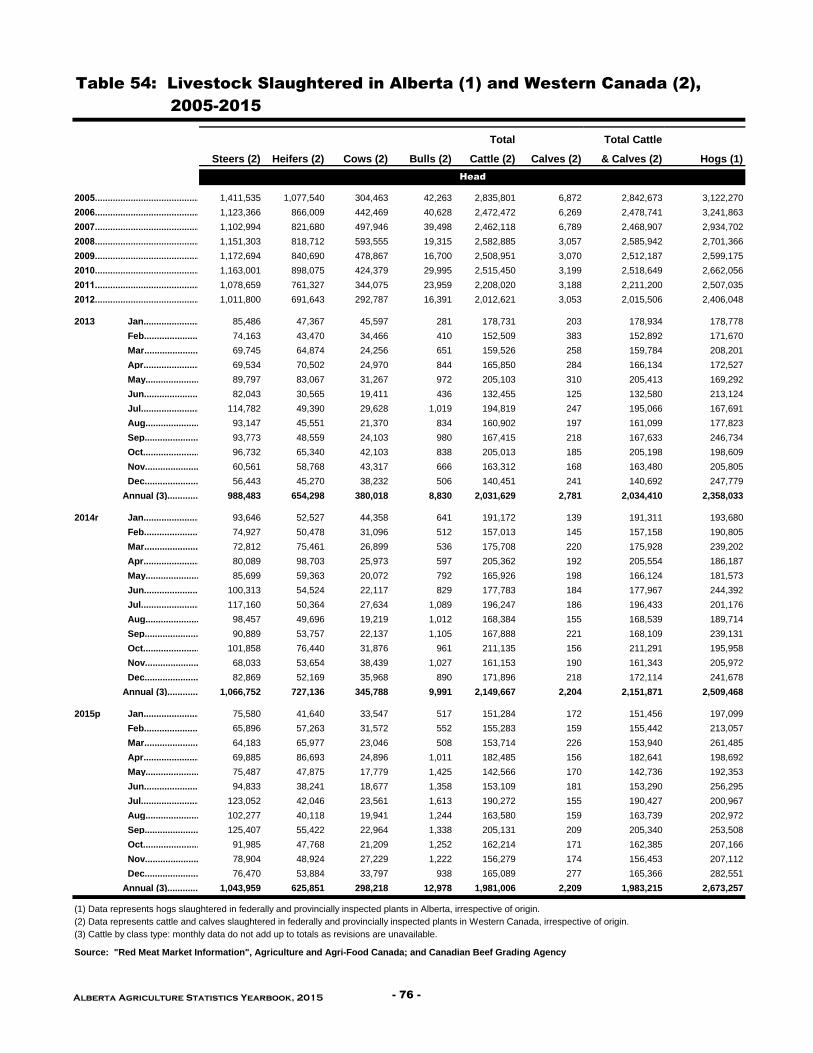
Total Total Cattle
Steers (2) Heifers (2) Cows (2) Bulls (2) Cattle (2) Calves (2) & Calves (2) Hogs (1)
2005............................................… 1,411,535 1,077,540 304,463 42,263 2,835,801 6,872 2,842,673 3,122,270
2006............................................… 1,123,366 866,009 442,469 40,628 2,472,472 6,269 2,478,741 3,241,863
2007............................................… 1,102,994 821,680 497,946 39,498 2,462,118 6,789 2,468,907 2,934,702
2008............................................… 1,151,303 818,712 593,555 19,315 2,582,885 3,057 2,585,942 2,701,366
2009............................................… 1,172,694 840,690 478,867 16,700 2,508,951 3,070 2,512,187 2,599,175
2010............................................… 1,163,001 898,075 424,379 29,995 2,515,450 3,199 2,518,649 2,662,056
2011............................................… 1,078,659 761,327 344,075 23,959 2,208,020 3,188 2,211,200 2,507,035
2012............................................… 1,011,800 691,643 292,787 16,391 2,012,621 3,053 2,015,506 2,406,048
2013 Jan.................................................85,486 47,367 45,597 281 178,731 203 178,934 178,778
Feb..............................................74,163 43,470 34,466 410 152,509 383 152,892 171,670
Mar..........................................69,745 64,874 24,256 651 159,526 258 159,784 208,201
Apr............................................69,534 70,502 24,970 844 165,850 284 166,134 172,527
May................................................89,797 83,067 31,267 972 205,103 310 205,413 169,292
Jun................................................82,043 30,565 19,411 436 132,455 125 132,580 213,124
Jul....................................................114,782 49,390 29,628 1,019 194,819 247 195,066 167,691
Aug...................................................93,147 45,551 21,370 834 160,902 197 161,099 177,823
Sep.......................................93,773 48,559 24,103 980 167,415 218 167,633 246,734
Oct...............................................96,732 65,340 42,103 838 205,013 185 205,198 198,609
Nov......................................60,561 58,768 43,317 666 163,312 168 163,480 205,805
Dec..........................................56,443 45,270 38,232 506 140,451 241 140,692 247,779
Annual (3)................................................988,483 654,298 380,018 8,830 2,031,629 2,781 2,034,410 2,358,033
2014r Jan.................................................93,646 52,527 44,358 641 191,172 139 191,311 193,680
Feb..............................................74,927 50,478 31,096 512 157,013 145 157,158 190,805
Mar..........................................72,812 75,461 26,899 536 175,708 220 175,928 239,202
Apr............................................80,089 98,703 25,973 597 205,362 192 205,554 186,187
May................................................85,699 59,363 20,072 792 165,926 198 166,124 181,573
Jun................................................100,313 54,524 22,117 829 177,783 184 177,967 244,392
Jul....................................................117,160 50,364 27,634 1,089 196,247 186 196,433 201,176
Aug...................................................98,457 49,696 19,219 1,012 168,384 155 168,539 189,714
Sep.......................................90,889 53,757 22,137 1,105 167,888 221 168,109 239,131
Oct...............................................101,858 76,440 31,876 961 211,135 156 211,291 195,958
Nov......................................68,033 53,654 38,439 1,027 161,153 190 161,343 205,972
Dec..........................................82,869 52,169 35,968 890 171,896 218 172,114 241,678
Annual (3)................................................1,066,752 727,136 345,788 9,991 2,149,667 2,204 2,151,871 2,509,468
2015p Jan.................................................75,580 41,640 33,547 517 151,284 172 151,456 197,099
Feb..............................................65,896 57,263 31,572 552 155,283 159 155,442 213,057
Mar..........................................64,183 65,977 23,046 508 153,714 226 153,940 261,485
Apr............................................69,885 86,693 24,896 1,011 182,485 156 182,641 198,692
May................................................75,487 47,875 17,779 1,425 142,566 170 142,736 192,353
Jun................................................94,833 38,241 18,677 1,358 153,109 181 153,290 256,295
Jul....................................................123,052 42,046 23,561 1,613 190,272 155 190,427 200,967
Aug...................................................102,277 40,118 19,941 1,244 163,580 159 163,739 202,972
Sep.......................................125,407 55,422 22,964 1,338 205,131 209 205,340 253,508
Oct...............................................91,985 47,768 21,209 1,252 162,214 171 162,385 207,166
Nov......................................78,904 48,924 27,229 1,222 156,279 174 156,453 207,112
Dec..........................................76,470 53,884 33,797 938 165,089 277 165,366 282,551
Annual (3)................................................1,043,959 625,851 298,218 12,978 1,981,006 2,209 1,983,215 2,673,257
Source: "Red Meat Market Information", Agriculture and Agri-Food Canada; and Canadian Beef Grading Agency
Table 54: Livestock Slaughtered in Alberta (1) and Western Canada (2),
2005-2015
(2) Data represents cattle and calves slaughtered in federally and provincially inspected plants in Western Canada, irrespective of origin.
(3) Cattle by class type: monthly data do not add up to totals as revisions are unavailable.
Head
(1) Data represents hogs slaughtered in federally and provincially inspected plants in Alberta, irrespective of origin.
Alberta Agriculture Statistics Yearbook, 2015 - 76 -

1996
1997
1998
1999
2000
2001
2002
2003
2004
2005
2006
2007
2008
2009
2010
2011
Source: "Red Meat Market Information", Agriculture and Agri-Food Canada; and Canadian Beef Grading Agency
0.0
2.0
4.0
6.0
8.0
10.0
12.0
14.0
16.0
18.0
20.0
22.0
24.0
26.0
2008 2009 2010 2011 2012 2013 2014 2015
Millio
n H
ead
Alberta
Canada
Fig. 27 Number of Cattle Slaughtered (Excluding Calves), Western Canada as a
Per Cent of Canada, 2008-2015
0.0
0.5
1.0
1.5
2.0
2.5
3.0
3.5
4.0
4.5
5.0
2008 2009 2010 2011 2012 2013 2014 2015
Millio
n H
ead Western
Canada
Canada
Cattle and Calves
Hogs
71.3%74.5% 74.8% 74.0% 72.3% 72.4%
74.8% 75.3%
0.0%
30.0%
60.0%
90.0%
2008 2009 2010 2011 2012 2013 2014 2015
Per
Cen
t
Note: Data represents livestock slaughtered in federally and provincially inspected plants in Western Canada and Alberta, irrespective of origin.
Fig. 28 Cattle and Calves and Hogs Slaughtered in Alberta, Western Canada and
Canada, 2008-2015
- 77 - Alberta Agriculture Statistics Yearbook, 2015
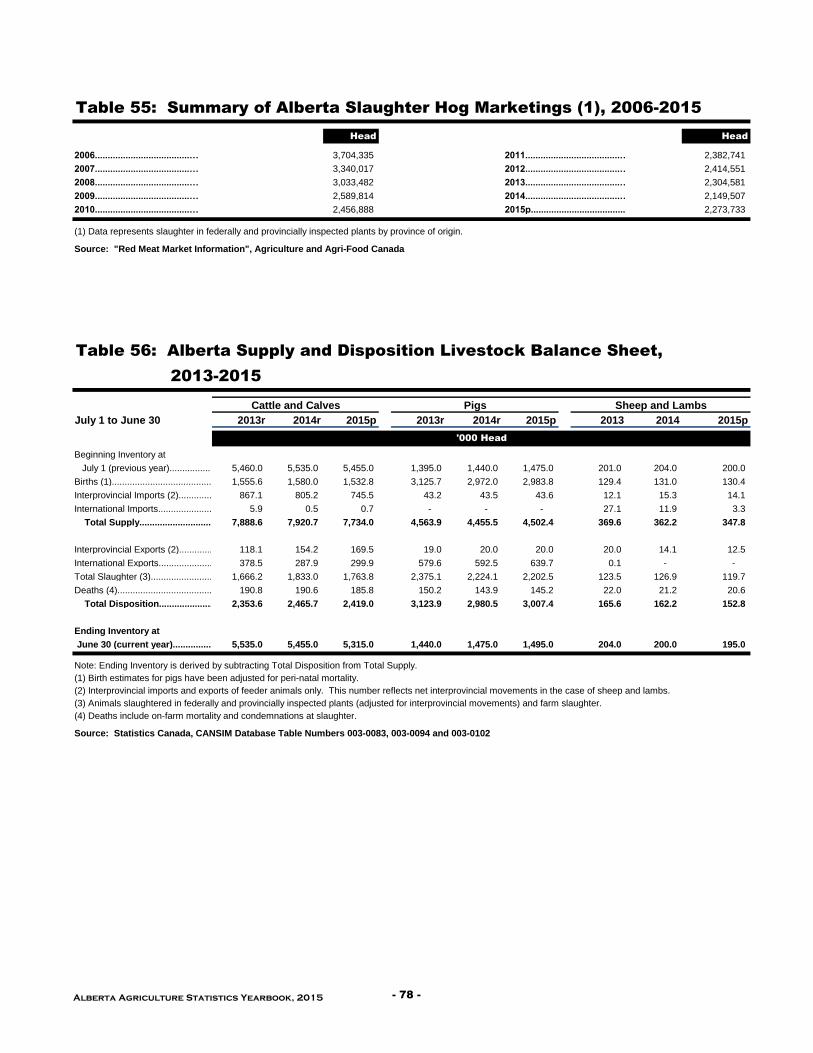
Head Head
2006.....................................… . 3,704,335 2011.....................................… 2,382,741
2007.....................................… 3,340,017 2012.....................................… 2,414,551
2008.....................................… 3,033,482 2013.....................................… 2,304,581
2009.....................................… 2,589,814 2014.....................................… 2,149,507
2010.....................................… 2,456,888 2015p.....................................… 2,273,733
(1) Data represents slaughter in federally and provincially inspected plants by province of origin.
Source: "Red Meat Market Information", Agriculture and Agri-Food Canada
July 1 to June 30 2013r 2014r 2015p 2013r 2014r 2015p 2013 2014 2015p
Beginning Inventory at
July 1 (previous year)....................... 5,460.0 5,535.0 5,455.0 1,395.0 1,440.0 1,475.0 201.0 204.0 200.0
Births (1).......................................... 1,555.6 1,580.0 1,532.8 3,125.7 2,972.0 2,983.8 129.4 131.0 130.4
Interprovincial Imports (2)...............................867.1 805.2 745.5 43.2 43.5 43.6 12.1 15.3 14.1
International Imports............................ 5.9 0.5 0.7 - - - 27.1 11.9 3.3
Total Supply................................ 7,888.6 7,920.7 7,734.0 4,563.9 4,455.5 4,502.4 369.6 362.2 347.8
Interprovincial Exports (2)..........................118.1 154.2 169.5 19.0 20.0 20.0 20.0 14.1 12.5
International Exports.............................. 378.5 287.9 299.9 579.6 592.5 639.7 0.1 - -
Total Slaughter (3)............................... 1,666.2 1,833.0 1,763.8 2,375.1 2,224.1 2,202.5 123.5 126.9 119.7
Deaths (4)...................................... 190.8 190.6 185.8 150.2 143.9 145.2 22.0 21.2 20.6
Total Disposition..................................2,353.6 2,465.7 2,419.0 3,123.9 2,980.5 3,007.4 165.6 162.2 152.8
Ending Inventory at
June 30 (current year).........................5,535.0 5,455.0 5,315.0 1,440.0 1,475.0 1,495.0 204.0 200.0 195.0
Source: Statistics Canada, CANSIM Database Table Numbers 003-0083, 003-0094 and 003-0102
Note: Ending Inventory is derived by subtracting Total Disposition from Total Supply.
(1) Birth estimates for pigs have been adjusted for peri-natal mortality.
(2) Interprovincial imports and exports of feeder animals only. This number reflects net interprovincial movements in the case of sheep and lambs.
(3) Animals slaughtered in federally and provincially inspected plants (adjusted for interprovincial movements) and farm slaughter.
Table 55: Summary of Alberta Slaughter Hog Marketings (1), 2006-2015
(4) Deaths include on-farm mortality and condemnations at slaughter.
'000 Head
Table 56: Alberta Supply and Disposition Livestock Balance Sheet,
2013-2015
Cattle and Calves Pigs Sheep and Lambs
Alberta Agriculture Statistics Yearbook, 2015 - 78 -
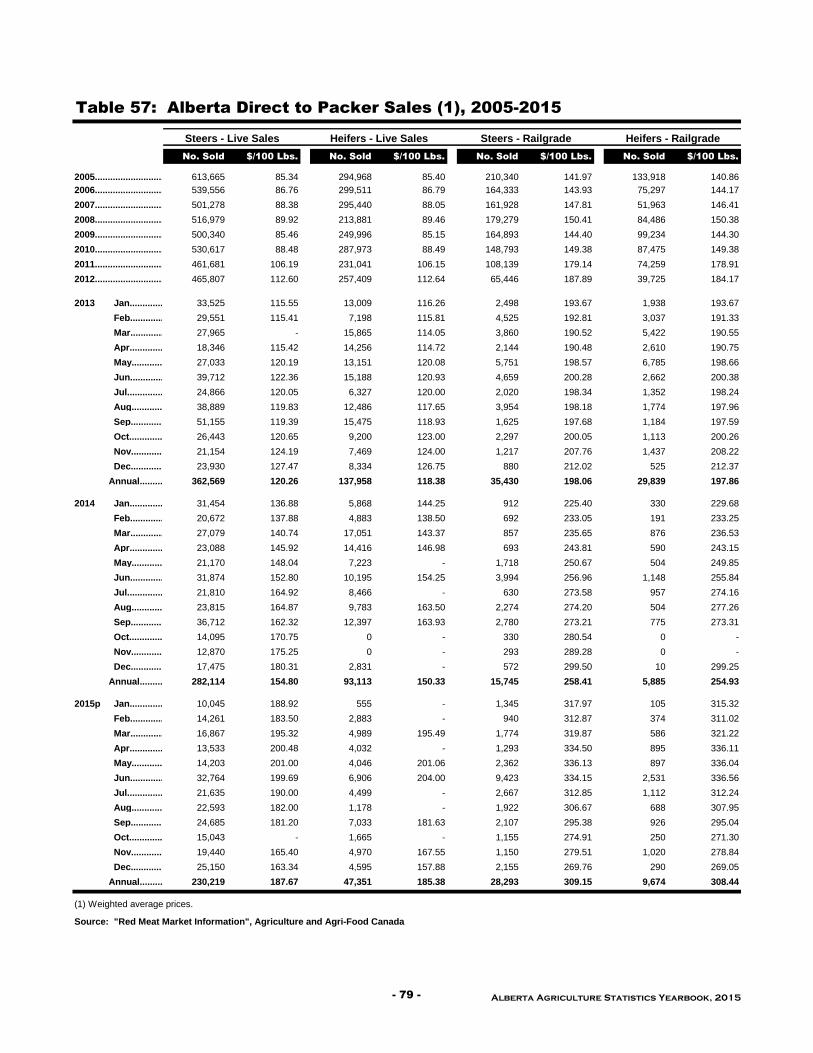
No. Sold $/100 Lbs. No. Sold $/100 Lbs. No. Sold $/100 Lbs. No. Sold $/100 Lbs.
2005.................................... 613,665 85.34 294,968 85.40 210,340 141.97 133,918 140.86
2006.................................... 539,556 86.76 299,511 86.79 164,333 143.93 75,297 144.17
2007.................................... 501,278 88.38 295,440 88.05 161,928 147.81 51,963 146.41
2008.................................... 516,979 89.92 213,881 89.46 179,279 150.41 84,486 150.38
2009.................................... 500,340 85.46 249,996 85.15 164,893 144.40 99,234 144.30
2010.................................... 530,617 88.48 287,973 88.49 148,793 149.38 87,475 149.38
2011.................................... 461,681 106.19 231,041 106.15 108,139 179.14 74,259 178.91
2012.................................... 465,807 112.60 257,409 112.64 65,446 187.89 39,725 184.17
2013 Jan.................................................33,525 115.55 13,009 116.26 2,498 193.67 1,938 193.67
Feb..............................................29,551 115.41 7,198 115.81 4,525 192.81 3,037 191.33
Mar..........................................27,965 - 15,865 114.05 3,860 190.52 5,422 190.55
Apr............................................18,346 115.42 14,256 114.72 2,144 190.48 2,610 190.75
May................................................27,033 120.19 13,151 120.08 5,751 198.57 6,785 198.66
Jun................................................39,712 122.36 15,188 120.93 4,659 200.28 2,662 200.38
Jul....................................................24,866 120.05 6,327 120.00 2,020 198.34 1,352 198.24
Aug...................................................38,889 119.83 12,486 117.65 3,954 198.18 1,774 197.96
Sep.......................................51,155 119.39 15,475 118.93 1,625 197.68 1,184 197.59
Oct...............................................26,443 120.65 9,200 123.00 2,297 200.05 1,113 200.26
Nov......................................21,154 124.19 7,469 124.00 1,217 207.76 1,437 208.22
Dec..........................................23,930 127.47 8,334 126.75 880 212.02 525 212.37
Annual.................................................362,569 120.26 137,958 118.38 35,430 198.06 29,839 197.86
2014 Jan.................................................31,454 136.88 5,868 144.25 912 225.40 330 229.68
Feb..............................................20,672 137.88 4,883 138.50 692 233.05 191 233.25
Mar..........................................27,079 140.74 17,051 143.37 857 235.65 876 236.53
Apr............................................23,088 145.92 14,416 146.98 693 243.81 590 243.15
May................................................21,170 148.04 7,223 - 1,718 250.67 504 249.85
Jun................................................31,874 152.80 10,195 154.25 3,994 256.96 1,148 255.84
Jul....................................................21,810 164.92 8,466 - 630 273.58 957 274.16
Aug...................................................23,815 164.87 9,783 163.50 2,274 274.20 504 277.26
Sep.......................................36,712 162.32 12,397 163.93 2,780 273.21 775 273.31
Oct...............................................14,095 170.75 0 - 330 280.54 0 -
Nov......................................12,870 175.25 0 - 293 289.28 0 -
Dec..........................................17,475 180.31 2,831 - 572 299.50 10 299.25
Annual.................................................282,114 154.80 93,113 150.33 15,745 258.41 5,885 254.93
2015p Jan.................................................10,045 188.92 555 - 1,345 317.97 105 315.32
Feb..............................................14,261 183.50 2,883 - 940 312.87 374 311.02
Mar..........................................16,867 195.32 4,989 195.49 1,774 319.87 586 321.22
Apr............................................13,533 200.48 4,032 - 1,293 334.50 895 336.11
May................................................14,203 201.00 4,046 201.06 2,362 336.13 897 336.04
Jun................................................32,764 199.69 6,906 204.00 9,423 334.15 2,531 336.56
Jul....................................................21,635 190.00 4,499 - 2,667 312.85 1,112 312.24
Aug...................................................22,593 182.00 1,178 - 1,922 306.67 688 307.95
Sep.......................................24,685 181.20 7,033 181.63 2,107 295.38 926 295.04
Oct...............................................15,043 - 1,665 - 1,155 274.91 250 271.30
Nov......................................19,440 165.40 4,970 167.55 1,150 279.51 1,020 278.84
Dec..........................................25,150 163.34 4,595 157.88 2,155 269.76 290 269.05
Annual.................................................230,219 187.67 47,351 185.38 28,293 309.15 9,674 308.44
(1) Weighted average prices.
Source: "Red Meat Market Information", Agriculture and Agri-Food Canada
Table 57: Alberta Direct to Packer Sales (1), 2005-2015
Steers - Live Sales Heifers - Live Sales Steers - Railgrade Heifers - Railgrade
- 79 - Alberta Agriculture Statistics Yearbook, 2015
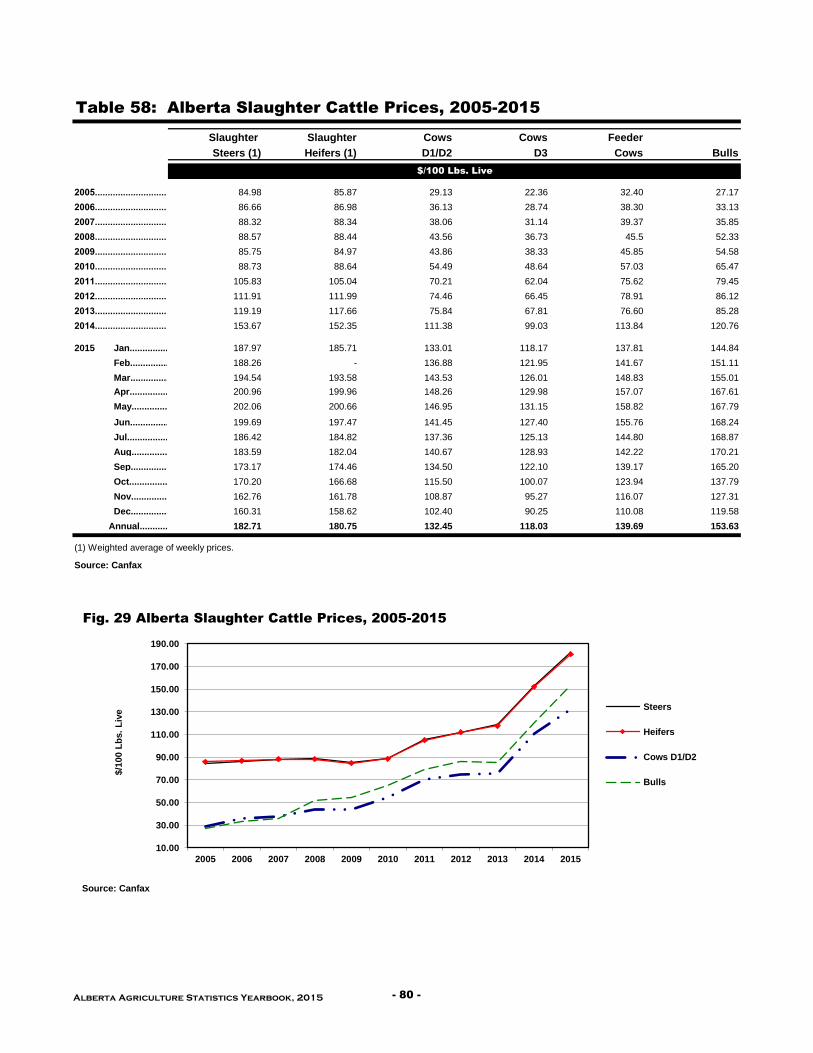
Slaughter Slaughter Cows Cows Feeder
Steers (1) Heifers (1) D1/D2 D3 Cows Bulls
2005...................................… 84.98 85.87 29.13 22.36 32.40 27.17
2006...................................… 86.66 86.98 36.13 28.74 38.30 33.13
2007...................................… 88.32 88.34 38.06 31.14 39.37 35.85
2008...................................… 88.57 88.44 43.56 36.73 45.5 52.33
2009...................................… 85.75 84.97 43.86 38.33 45.85 54.58
2010...................................… 88.73 88.64 54.49 48.64 57.03 65.47
2011...................................… 105.83 105.04 70.21 62.04 75.62 79.45
2012...................................… 111.91 111.99 74.46 66.45 78.91 86.12
2013...................................… 119.19 117.66 75.84 67.81 76.60 85.28
2014...................................… 153.67 152.35 111.38 99.03 113.84 120.76
2015 Jan.................................................187.97 185.71 133.01 118.17 137.81 144.84
Feb..............................................188.26 - 136.88 121.95 141.67 151.11
Mar..........................................194.54 193.58 143.53 126.01 148.83 155.01
Apr............................................200.96 199.96 148.26 129.98 157.07 167.61
May................................................202.06 200.66 146.95 131.15 158.82 167.79
Jun................................................199.69 197.47 141.45 127.40 155.76 168.24
Jul....................................................186.42 184.82 137.36 125.13 144.80 168.87
Aug...................................................183.59 182.04 140.67 128.93 142.22 170.21
Sep....................................... 173.17 174.46 134.50 122.10 139.17 165.20
Oct...............................................170.20 166.68 115.50 100.07 123.94 137.79
Nov...................................... 162.76 161.78 108.87 95.27 116.07 127.31
Dec..........................................160.31 158.62 102.40 90.25 110.08 119.58
Annual.................................................182.71 180.75 132.45 118.03 139.69 153.63
(1) Weighted average of weekly prices.
Source: Canfax
Source: Canfax
Table 58: Alberta Slaughter Cattle Prices, 2005-2015
$/100 Lbs. Live
10.00
30.00
50.00
70.00
90.00
110.00
130.00
150.00
170.00
190.00
2005 2006 2007 2008 2009 2010 2011 2012 2013 2014 2015
$/1
00 L
bs.
Liv
e
Steers
Heifers
Cows D1/D2
Bulls
Fig. 29 Alberta Slaughter Cattle Prices, 2005-2015
Alberta Agriculture Statistics Yearbook, 2015 - 80 -
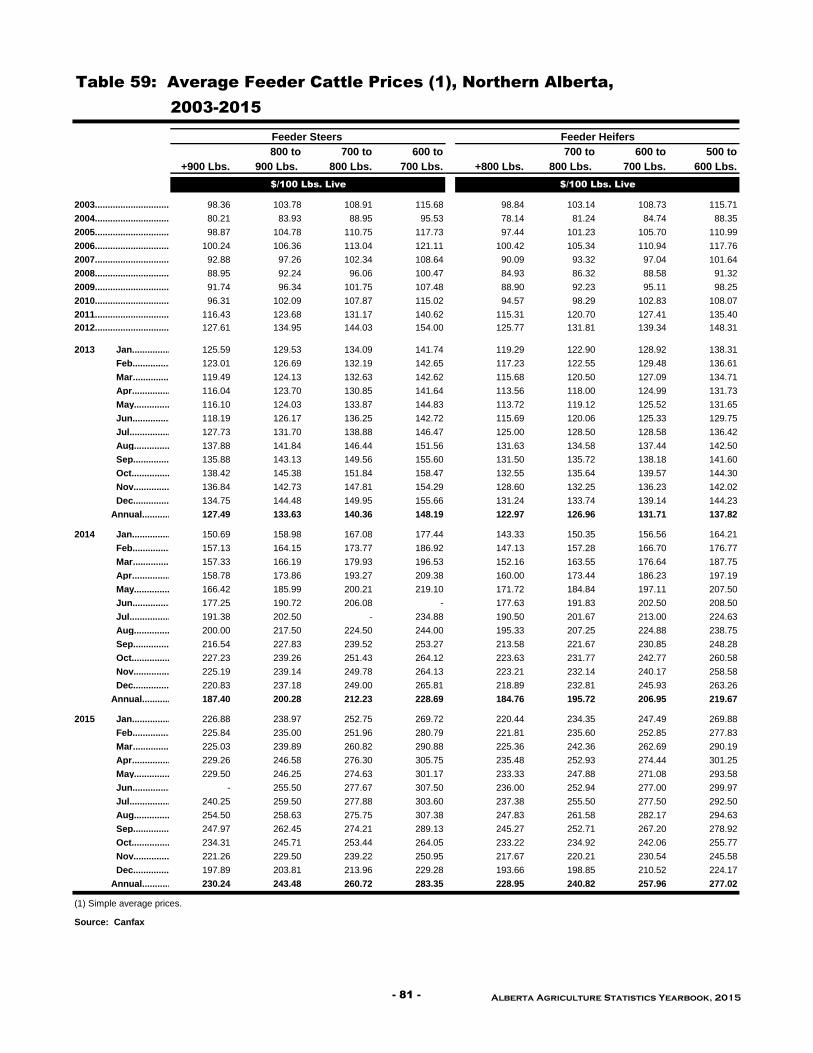
800 to 700 to 600 to 700 to 600 to 500 to
+900 Lbs. 900 Lbs. 800 Lbs. 700 Lbs. +800 Lbs. 800 Lbs. 700 Lbs. 600 Lbs.
2003.................................... 98.36 103.78 108.91 115.68 98.84 103.14 108.73 115.71
2004.................................... 80.21 83.93 88.95 95.53 78.14 81.24 84.74 88.35
2005.................................... 98.87 104.78 110.75 117.73 97.44 101.23 105.70 110.99
2006.................................... 100.24 106.36 113.04 121.11 100.42 105.34 110.94 117.76
2007.................................... 92.88 97.26 102.34 108.64 90.09 93.32 97.04 101.64
2008.................................... 88.95 92.24 96.06 100.47 84.93 86.32 88.58 91.32
2009.................................... 91.74 96.34 101.75 107.48 88.90 92.23 95.11 98.25
2010.................................... 96.31 102.09 107.87 115.02 94.57 98.29 102.83 108.07
2011.................................... 116.43 123.68 131.17 140.62 115.31 120.70 127.41 135.40
2012.................................... 127.61 134.95 144.03 154.00 125.77 131.81 139.34 148.31
2013 Jan.................................................125.59 129.53 134.09 141.74 119.29 122.90 128.92 138.31
Feb..............................................123.01 126.69 132.19 142.65 117.23 122.55 129.48 136.61
Mar..........................................119.49 124.13 132.63 142.62 115.68 120.50 127.09 134.71
Apr............................................116.04 123.70 130.85 141.64 113.56 118.00 124.99 131.73
May................................................116.10 124.03 133.87 144.83 113.72 119.12 125.52 131.65
Jun................................................118.19 126.17 136.25 142.72 115.69 120.06 125.33 129.75
Jul....................................................127.73 131.70 138.88 146.47 125.00 128.50 128.58 136.42
Aug...................................................137.88 141.84 146.44 151.56 131.63 134.58 137.44 142.50
Sep.......................................135.88 143.13 149.56 155.60 131.50 135.72 138.18 141.60
Oct...............................................138.42 145.38 151.84 158.47 132.55 135.64 139.57 144.30
Nov......................................136.84 142.73 147.81 154.29 128.60 132.25 136.23 142.02
Dec..........................................134.75 144.48 149.95 155.66 131.24 133.74 139.14 144.23
Annual.................................................127.49 133.63 140.36 148.19 122.97 126.96 131.71 137.82
2014 Jan.................................................150.69 158.98 167.08 177.44 143.33 150.35 156.56 164.21
Feb..............................................157.13 164.15 173.77 186.92 147.13 157.28 166.70 176.77
Mar..........................................157.33 166.19 179.93 196.53 152.16 163.55 176.64 187.75
Apr............................................158.78 173.86 193.27 209.38 160.00 173.44 186.23 197.19
May................................................166.42 185.99 200.21 219.10 171.72 184.84 197.11 207.50
Jun................................................177.25 190.72 206.08 - 177.63 191.83 202.50 208.50
Jul....................................................191.38 202.50 - 234.88 190.50 201.67 213.00 224.63
Aug...................................................200.00 217.50 224.50 244.00 195.33 207.25 224.88 238.75
Sep.......................................216.54 227.83 239.52 253.27 213.58 221.67 230.85 248.28
Oct...............................................227.23 239.26 251.43 264.12 223.63 231.77 242.77 260.58
Nov......................................225.19 239.14 249.78 264.13 223.21 232.14 240.17 258.58
Dec..........................................220.83 237.18 249.00 265.81 218.89 232.81 245.93 263.26
Annual.................................................187.40 200.28 212.23 228.69 184.76 195.72 206.95 219.67
2015 Jan.................................................226.88 238.97 252.75 269.72 220.44 234.35 247.49 269.88
Feb..............................................225.84 235.00 251.96 280.79 221.81 235.60 252.85 277.83
Mar..........................................225.03 239.89 260.82 290.88 225.36 242.36 262.69 290.19
Apr............................................229.26 246.58 276.30 305.75 235.48 252.93 274.44 301.25
May................................................229.50 246.25 274.63 301.17 233.33 247.88 271.08 293.58
Jun................................................- 255.50 277.67 307.50 236.00 252.94 277.00 299.97
Jul....................................................240.25 259.50 277.88 303.60 237.38 255.50 277.50 292.50
Aug...................................................254.50 258.63 275.75 307.38 247.83 261.58 282.17 294.63
Sep.......................................247.97 262.45 274.21 289.13 245.27 252.71 267.20 278.92
Oct...............................................234.31 245.71 253.44 264.05 233.22 234.92 242.06 255.77
Nov......................................221.26 229.50 239.22 250.95 217.67 220.21 230.54 245.58
Dec..........................................197.89 203.81 213.96 229.28 193.66 198.85 210.52 224.17
Annual.................................................230.24 243.48 260.72 283.35 228.95 240.82 257.96 277.02
(1) Simple average prices.
Table 59: Average Feeder Cattle Prices (1), Northern Alberta,
2003-2015
Feeder Steers Feeder Heifers
$/100 Lbs. Live $/100 Lbs. Live
Source: Canfax
- 81 - Alberta Agriculture Statistics Yearbook, 2015

800 to 700 to 600 to 700 to 600 to 500 to
+900 Lbs. 900 Lbs. 800 Lbs. 700 Lbs. +800 Lbs. 800 Lbs. 700 Lbs. 600 Lbs.
2003.................................... 100.16 106.08 112.79 119.57 102.51 104.83 111.27 118.78
2004.................................... 79.29 83.26 87.36 92.81 77.48 80.20 83.82 88.05
2005.................................... 98.83 105.22 110.94 118.13 99.43 102.96 107.77 113.23
2006.................................... 100.79 107.16 113.68 121.59 101.14 106.00 111.76 118.29
2007.................................... 93.09 98.17 103.61 109.85 91.81 94.60 98.40 102.92
2008.................................... 89.20 92.35 96.31 100.89 86.21 87.83 89.72 92.39
2009.................................... 92.10 96.86 102.35 108.49 90.39 93.49 96.91 99.43
2010.................................... 96.36 102.67 108.31 115.25 95.90 99.06 103.81 108.00
2011.................................... 116.50 123.74 131.17 140.51 115.81 121.38 128.01 135.69
2012.................................... 128.17 135.74 143.47 155.27 125.93 132.73 140.55 149.28
2013 Jan................................................. - 124.42 127.75 133.04 117.33 120.36 123.73 130.22
Feb..............................................123.85 127.69 132.75 141.79 119.16 122.38 128.45 138.06
Mar..........................................119.75 124.63 132.44 144.66 116.91 121.04 126.54 136.25
Apr............................................116.87 122.40 131.27 143.69 113.88 119.27 124.54 133.06
May................................................115.34 122.15 132.32 143.67 114.23 119.80 125.10 130.21
Jun................................................118.00 123.58 133.14 - 114.77 120.44 125.36 132.19
Jul....................................................129.07 134.87 140.34 145.99 123.97 128.14 128.68 133.15
Aug...................................................138.77 144.43 148.51 150.56 133.81 135.39 139.29 139.26
Sep.......................................136.67 144.68 150.25 153.63 131.53 136.47 138.85 141.42
Oct...............................................137.33 147.32 152.68 159.38 131.92 136.43 140.74 146.90
Nov......................................139.00 142.44 148.04 154.93 131.75 132.28 136.74 142.38
Dec..........................................139.00 144.58 151.58 155.67 129.94 134.79 138.94 145.29
Annual.................................................128.51 133.60 140.09 147.91 123.27 127.23 131.41 137.37
2014 Jan.................................................147.97 158.17 165.00 176.28 143.00 154.50 161.65 171.96
Feb..............................................155.67 164.38 173.83 188.63 148.03 159.39 165.26 176.05
Mar..........................................155.00 166.72 177.19 194.50 155.00 163.86 175.75 185.04
Apr............................................157.00 173.28 192.50 204.50 158.58 172.58 183.75 194.17
May................................................166.25 176.50 199.75 216.38 169.13 178.67 198.00 206.38
Jun................................................175.00 189.25 204.00 222.08 174.63 193.83 202.31 218.58
Jul....................................................194.00 204.40 219.56 234.20 189.13 199.88 211.16 225.51
Aug...................................................204.81 213.97 223.13 249.75 192.50 209.06 222.42 241.67
Sep.......................................214.58 226.39 237.10 248.74 209.00 217.83 226.67 250.47
Oct...............................................228.25 241.25 250.05 263.99 224.63 235.70 243.65 261.48
Nov......................................225.00 235.00 250.43 262.91 206.98 230.00 242.78 257.72
Dec..........................................220.00 235.50 247.61 265.38 215.25 225.00 241.50 264.88
Annual.................................................186.96 198.73 211.68 227.28 182.16 195.03 206.24 221.16
2015 Jan.................................................227.67 242.50 249.19 269.00 220.00 236.00 248.75 277.50
Feb..............................................223.50 238.00 251.44 279.25 221.83 234.50 254.75 280.50
Mar..........................................224.70 242.21 261.42 287.63 223.83 244.31 264.82 290.75
Apr............................................231.06 245.00 275.13 304.00 235.00 248.69 271.38 297.33
May................................................232.81 246.31 269.75 301.50 227.50 245.00 275.42 294.13
Jun................................................239.00 256.83 - 300.25 236.63 258.00 272.50 300.88
Jul....................................................237.48 252.50 283.75 299.75 239.19 251.91 278.75 296.25
Aug...................................................244.63 264.13 274.74 305.83 246.02 255.38 277.36 302.60
Sep.......................................247.33 264.22 274.38 287.83 244.90 254.92 267.10 287.10
Oct...............................................236.50 243.50 254.31 265.32 230.50 235.13 243.14 256.91
Nov......................................220.25 230.28 238.98 249.51 - 222.83 232.89 245.44
Dec..........................................- 200.00 213.25 220.38 200.50 188.00 199.50 224.59
Annual.................................................233.18 243.79 258.76 280.85 229.63 239.56 257.20 279.50
(1) Simple average prices.
Table 60: Average Feeder Cattle Prices (1), Southern Alberta, 2003-2015
Feeder Steers Feeder Heifers
$/100 Lbs. Live $/100 Lbs. Live
Source: Canfax
Alberta Agriculture Statistics Yearbook, 2015 - 82 -

500 to 400 to Under 400 to 300 to
600 Lbs. 500 Lbs. 400 Lbs. 500 Lbs. 400 Lbs.
2003.........................................................................124.57 134.09 139.59 123.08 127.82
2004.........................................................................100.89 105.67 108.64 92.13 95.18
2005.........................................................................124.28 130.53 133.57 116.11 119.07
2006.........................................................................130.77 139.49 144.30 124.75 129.71
2007.........................................................................115.31 121.02 123.93 106.37 109.80
2008.........................................................................105.26 108.88 110.58 94.40 95.14
2009.........................................................................113.08 118.00 120.12 102.41 104.70
2010.........................................................................122.10 129.45 133.45 113.23 115.86
2011.........................................................................152.03 164.34 172.52 144.62 151.52
2012.........................................................................167.62 180.06 189.61 159.13 167.11
2013 Jan................................................. 157.23 173.11 181.75 148.21 155.38
Feb.............................................. 156.21 166.26 174.44 146.25 154.48
Mar.............................................................................153.80 163.13 167.23 140.43 144.16
Apr............................................ 152.76 157.82 163.92 137.30 140.84
May................................................ 152.78 155.78 160.19 135.07 139.53
Jun................................................ 152.08 153.06 152.88 134.85 134.56
Jul.................................................... 151.52 154.85 161.50 137.75 141.33
Aug................................................... 158.75 165.63 168.42 145.54 147.25
Sep.........................................................................162.21 175.50 191.48 149.50 163.42
Oct............................................... 166.73 181.60 201.60 155.78 167.01
Nov........................................................................161.82 179.43 197.03 152.15 162.22
Dec......................................................................165.60 178.59 196.17 151.86 160.18
Annual................................................. 157.62 167.06 176.38 144.56 150.86
2014 Jan................................................. 187.81 204.96 207.86 173.18 178.35
Feb.............................................. 201.48 212.15 214.79 182.98 193.13
Mar.............................................................................209.29 219.06 220.67 194.76 198.46
Apr............................................ 218.65 224.70 225.60 204.79 206.63
May................................................ 229.19 236.25 240.03 216.01 214.26
Jun................................................ 242.50 242.00 244.13 220.25 224.83
Jul.................................................... 245.40 255.05 266.83 235.83 -
Aug................................................... 258.75 290.00 300.00 250.00 256.25
Sep.........................................................................273.25 306.67 341.64 280.31 312.22
Oct............................................... 286.37 320.19 365.30 290.25 324.80
Nov........................................................................286.56 319.70 364.44 286.36 313.77
Dec......................................................................292.06 325.25 360.17 292.53 315.46
Annual................................................. 244.28 263.00 279.29 235.60 248.92
2015 Jan................................................. 297.35 327.25 358.75 293.81 309.92
Feb.............................................. 306.10 336.13 371.08 301.44 328.48
Mar.............................................................................317.36 345.92 369.33 314.54 332.96
Apr............................................ 329.38 349.40 372.25 326.15 335.93
May................................................ 326.06 344.69 346.25 320.46 326.00
Jun................................................ 324.13 340.50 - 311.67 312.50
Jul.................................................... 317.31 335.92 335.50 294.50 310.00
Aug................................................... 323.00 343.31 377.38 321.03 328.00
Sep.........................................................................306.63 347.25 384.56 304.92 339.33
Oct............................................... 284.59 323.73 361.83 283.79 315.25
Nov........................................................................275.55 313.82 363.72 273.24 314.38
Dec......................................................................253.71 288.25 348.42 248.25 284.13
Annual................................................. 305.10 333.01 362.64 299.48 319.74
(1) Simple average prices.
Source: Canfax
Table 61: Average Calf Prices (1), Northern Alberta, 2003-2015
Feeder Steer Calves Feeder Heifer Calves
$/100 Lbs. Live $/100 Lbs. Live
- 83 - Alberta Agriculture Statistics Yearbook, 2015
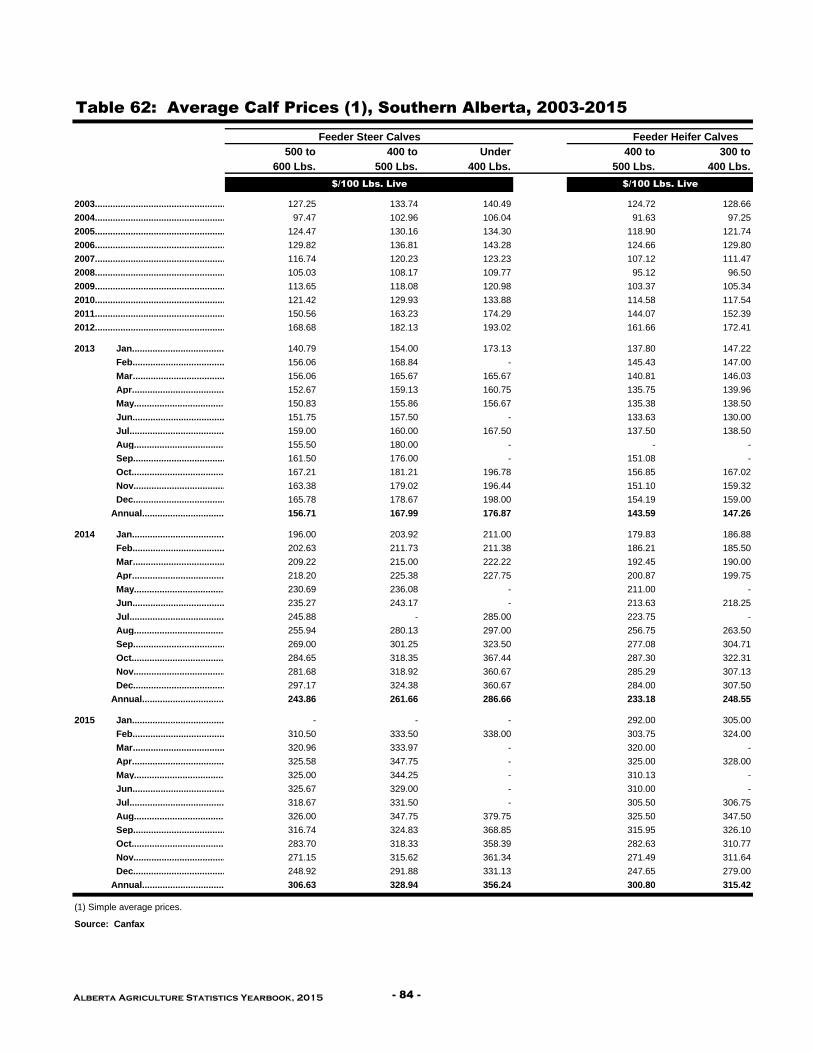
500 to 400 to Under 400 to 300 to
600 Lbs. 500 Lbs. 400 Lbs. 500 Lbs. 400 Lbs.
2003......................................................................... 127.25 133.74 140.49 124.72 128.66
2004......................................................................... 97.47 102.96 106.04 91.63 97.25
2005......................................................................... 124.47 130.16 134.30 118.90 121.74
2006......................................................................... 129.82 136.81 143.28 124.66 129.80
2007......................................................................... 116.74 120.23 123.23 107.12 111.47
2008......................................................................... 105.03 108.17 109.77 95.12 96.50
2009......................................................................... 113.65 118.08 120.98 103.37 105.34
2010......................................................................... 121.42 129.93 133.88 114.58 117.54
2011......................................................................... 150.56 163.23 174.29 144.07 152.39
2012......................................................................... 168.68 182.13 193.02 161.66 172.41
2013 Jan................................................. 140.79 154.00 173.13 137.80 147.22
Feb.............................................. 156.06 168.84 - 145.43 147.00
Mar.............................................................................156.06 165.67 165.67 140.81 146.03
Apr............................................ 152.67 159.13 160.75 135.75 139.96
May................................................ 150.83 155.86 156.67 135.38 138.50
Jun................................................ 151.75 157.50 - 133.63 130.00
Jul.................................................... 159.00 160.00 167.50 137.50 138.50
Aug................................................... 155.50 180.00 - - -
Sep.........................................................................161.50 176.00 - 151.08 -
Oct............................................... 167.21 181.21 196.78 156.85 167.02
Nov........................................................................163.38 179.02 196.44 151.10 159.32
Dec......................................................................165.78 178.67 198.00 154.19 159.00
Annual................................................. 156.71 167.99 176.87 143.59 147.26
2014 Jan................................................. 196.00 203.92 211.00 179.83 186.88
Feb.............................................. 202.63 211.73 211.38 186.21 185.50
Mar.............................................................................209.22 215.00 222.22 192.45 190.00
Apr............................................ 218.20 225.38 227.75 200.87 199.75
May................................................ 230.69 236.08 - 211.00 -
Jun................................................ 235.27 243.17 - 213.63 218.25
Jul.................................................... 245.88 - 285.00 223.75 -
Aug................................................... 255.94 280.13 297.00 256.75 263.50
Sep.........................................................................269.00 301.25 323.50 277.08 304.71
Oct............................................... 284.65 318.35 367.44 287.30 322.31
Nov........................................................................281.68 318.92 360.67 285.29 307.13
Dec......................................................................297.17 324.38 360.67 284.00 307.50
Annual................................................. 243.86 261.66 286.66 233.18 248.55
2015 Jan................................................. - - - 292.00 305.00
Feb.............................................. 310.50 333.50 338.00 303.75 324.00
Mar.............................................................................320.96 333.97 - 320.00 -
Apr............................................ 325.58 347.75 - 325.00 328.00
May................................................ 325.00 344.25 - 310.13 -
Jun................................................ 325.67 329.00 - 310.00 -
Jul.................................................... 318.67 331.50 - 305.50 306.75
Aug................................................... 326.00 347.75 379.75 325.50 347.50
Sep.........................................................................316.74 324.83 368.85 315.95 326.10
Oct............................................... 283.70 318.33 358.39 282.63 310.77
Nov........................................................................271.15 315.62 361.34 271.49 311.64
Dec......................................................................248.92 291.88 331.13 247.65 279.00
Annual................................................. 306.63 328.94 356.24 300.80 315.42
(1) Simple average prices.
Source: Canfax
Table 62: Average Calf Prices (1), Southern Alberta, 2003-2015
Feeder Steer Calves Feeder Heifer Calves
$/100 Lbs. Live $/100 Lbs. Live
Alberta Agriculture Statistics Yearbook, 2015 - 84 -
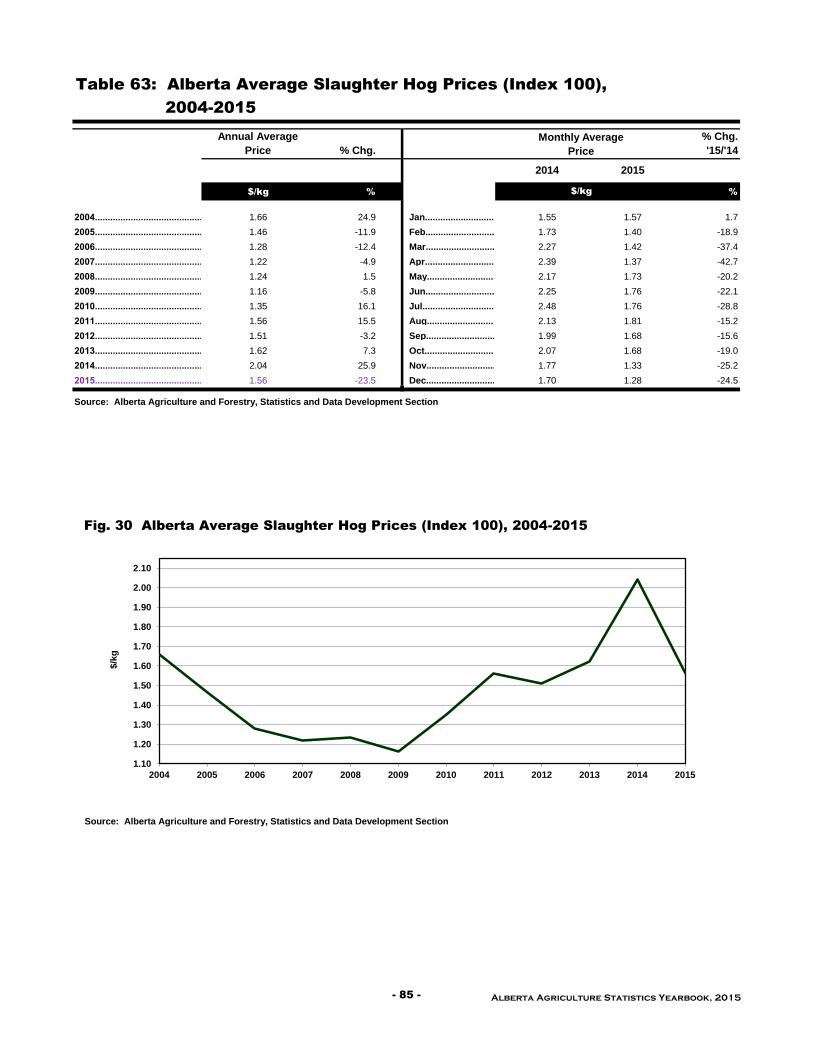
Annual Average
Price % Chg.
% Chg.
'15/'14
2014 2015
$/kg % %
2004.........................................................................…1.66 24.9 Jan...............................................................................................................................1.55 1.57 1.7
2005.........................................................................…1.46 -11.9 Feb............................................................................................................................1.73 1.40 -18.9
2006.........................................................................…1.28 -12.4 Mar........................................................................................................................2.27 1.42 -37.4
2007.........................................................................…1.22 -4.9 Apr..........................................................................................................................2.39 1.37 -42.7
2008.........................................................................…1.24 1.5 May..............................................................................................................................2.17 1.73 -20.2
2009.........................................................................…1.16 -5.8 Jun..............................................................................................................................2.25 1.76 -22.1
2010.........................................................................…1.35 16.1 Jul..................................................................................................................................2.48 1.76 -28.8
2011.........................................................................…1.56 15.5 Aug.................................................................................................................................2.13 1.81 -15.2
2012.........................................................................…1.51 -3.2 Sep.....................................................................................................................1.99 1.68 -15.6
2013.........................................................................…1.62 7.3 Oct.............................................................................................................................2.07 1.68 -19.0
2014.........................................................................…2.04 25.9 Nov....................................................................................................................1.77 1.33 -25.2
2015.........................................................................…1.56 -23.5 Dec........................................................................................................................1.70 1.28 -24.5
Source: Alberta Agriculture and Forestry, Statistics and Data Development Section
Table 63: Alberta Average Slaughter Hog Prices (Index 100),
Monthly Average
Price
$/kg
Source: Alberta Agriculture and Forestry, Statistics and Data Development Section
2004-2015
1.10
1.20
1.30
1.40
1.50
1.60
1.70
1.80
1.90
2.00
2.10
2004 2005 2006 2007 2008 2009 2010 2011 2012 2013 2014 2015
$/k
g
Fig. 30 Alberta Average Slaughter Hog Prices (Index 100), 2004-2015
- 85 - Alberta Agriculture Statistics Yearbook, 2015

2014 2015
2004.........................................................................…83.18 Jan...........................................................................................................................................................................................................................................................................................................................................................................................................................................................................................................................................................................................................................................................................................................................................................................................................................................................................................................................................................................................................................................................130.56 189.74
2005.........................................................................…109.75 Feb...........................................................................................................................................................................................................................................................................................................................................................................................................................................................................................................................................................................................................................................................................................................................................................................................................................................................................................................................................................................................................................................................133.44 177.92
2006.........................................................................…123.37 Mar...........................................................................................................................................................................................................................................................................................................................................................................................................................................................................................................................................................................................................................................................................................................................................................................................................................................................................................................................................................................................................................................................133.44 183.02
2007.........................................................................…116.86 Apr...........................................................................................................................................................................................................................................................................................................................................................................................................................................................................................................................................................................................................................................................................................................................................................................................................................................................................................................................................................................................................................................................133.44 188.70
2008.........................................................................…119.23 May...........................................................................................................................................................................................................................................................................................................................................................................................................................................................................................................................................................................................................................................................................................................................................................................................................................................................................................................................................................................................................................................................133.44 199.56
2009.........................................................................…124.62 Jun...........................................................................................................................................................................................................................................................................................................................................................................................................................................................................................................................................................................................................................................................................................................................................................................................................................................................................................................................................................................................................................................................133.44 208.85
2010.........................................................................…135.23 Jul...........................................................................................................................................................................................................................................................................................................................................................................................................................................................................................................................................................................................................................................................................................................................................................................................................................................................................................................................................................................................................................................................139.78 192.62
2011.........................................................................…172.42 Aug...........................................................................................................................................................................................................................................................................................................................................................................................................................................................................................................................................................................................................................................................................................................................................................................................................................................................................................................................................................................................................................................................148.20 190.44
2012.........................................................................…141.91 Sep......................................................................................................................................................................................................................................................................................................................................................................................................................................................................................................................................................................................................................................................................................................................................................................................................................................................................................................................................................................................................................................................160.80 193.79
2013.........................................................................…107.17 Oct...........................................................................................................................................................................................................................................................................................................................................................................................................................................................................................................................................................................................................................................................................................................................................................................................................................................................................................................................................................................................................................................................170.40 190.13
2014.........................................................................…148.13 Nov............................................................................................................................................................................................................................................................................................................................................................................................................................................................................................................................................................................................................................................................................................................................................................................................................................................................................................................................................................................................................................178.20 188.26
2015.........................................................................…191.13 Dec...........................................................................................................................................................................................................................................................................................................................................................................................................................................................................................................................................................................................................................................................................................................................................................................................................................................................................................................................................................................................................................................................182.37 190.50
Source: Alberta Agriculture and Forestry, Statistics and Data Development Section
2004 ..................................................................................... 2010............................................................................................................................................................................................................................................................................................................................................................................................................................................................................................................................................................................................................................................................................................................................................................................................................................................................................................................................................................................................................................................................81,900
2005..................................................................................... 2011............................................................................................................................................................................................................................................................................................................................................................................................................................................................................................................................................................................................................................................................................................................................................................................................................................................................................................................................................................................................................................................................73,900
2006..................................................................................... 2012............................................................................................................................................................................................................................................................................................................................................................................................................................................................................................................................................................................................................................................................................................................................................................................................................................................................................................................................................................................................................................................................84,400
2007..................................................................................... 2013............................................................................................................................................................................................................................................................................................................................................................................................................................................................................................................................................................................................................................................................................................................................................................................................................................................................................................................................................................................................................................................................100,400
2008..................................................................................... 2014r...........................................................................................................................................................................................................................................................................................................................................................................................................................................................................................................................................................................................................................................................................................................................................................................................................................................................................................................................................................................................................................................................96,100
2009............................................................................................................................................................................................................................................................................................................................................................................................................................................................................................................................................................................................................................................................................................................................................................................................................................................................................................................................................................................................................................................................2015p...........................................................................................................................................................................................................................................................................................................................................................................................................................................................................................................................................................................................................................................................................................................................................................................................................................................................................................................................................................................................................................................................104,500
Table 64: Central Alberta Average Market Lamb Prices (95-115 Lbs.) (1),
2004-2015
Monthly Average
Price
$/100 Lbs. $/100 Lbs.
Annual
Average
Price
89,700
(1) Estimate from Alberta's sheep and lamb balance sheets. These data represent sheep and lambs of Alberta origin slaughtered in Alberta and
Canadian provinces.
Source: Statistics Canada
Note: Plant price converted to live weight equivalent.
(1) Simple average prices.
Table 65: Alberta Sheep and Lamb Marketings (1), 2004-2015
Total Sheep
and
Lambs
Head
Total Sheep
and
Lambs
Head
105,400
89,700
98,200
98,200
105,400
0
50
100
150
200
250
0
20
40
60
80
100
120
2004 2005 2006 2007 2008 2009 2010 2011 2012 2013 2014 2015
$/1
00 L
bs.
Th
ou
san
d H
ead
Sheep and Lambs Marketings Average Price
Fig. 31 Alberta Sheep and Lamb Marketings and Average Market Lamb Price,
2004-2015
Source: Statistics Canada; and Alberta Agriculture and Forestry, Statistics and Data Development Section
Alberta Agriculture Statistics Yearbook, 2015 - 86 -
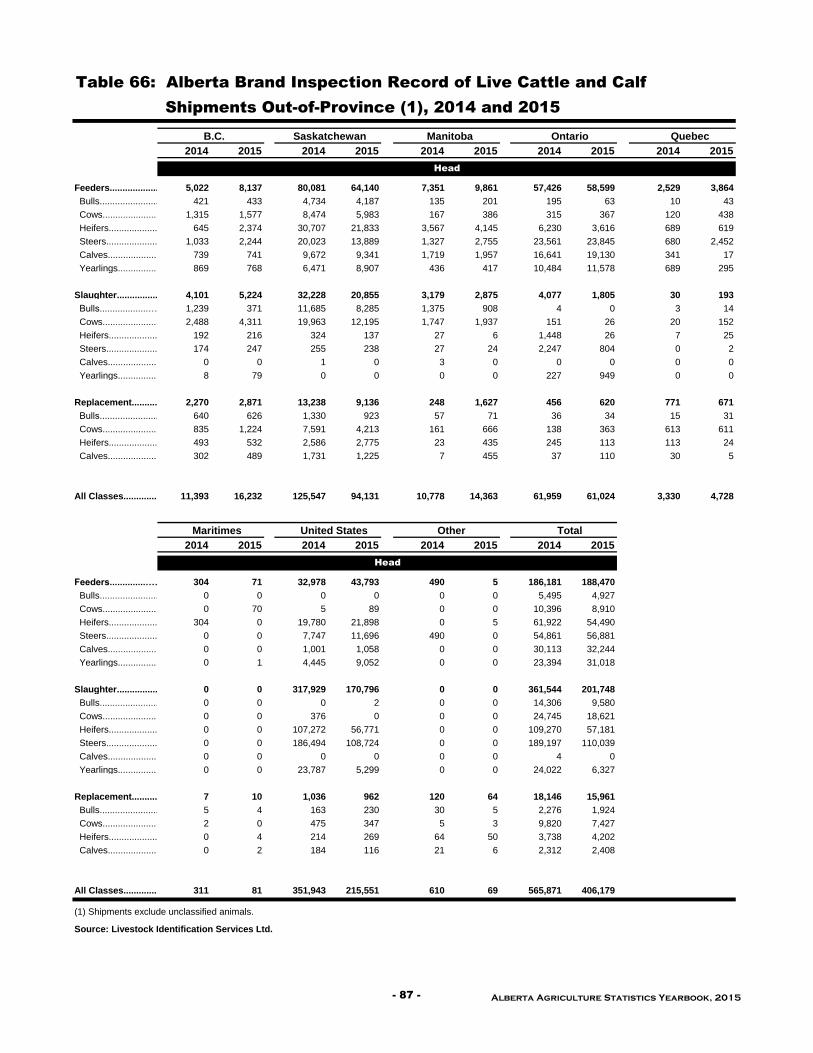
2014 2015 2014 2015 2014 2015 2014 2015 2014 2015
Feeders...............................5,022 8,137 80,081 64,140 7,351 9,861 57,426 58,599 2,529 3,864
Bulls.................................. 421 433 4,734 4,187 135 201 195 63 10 43
Cows.............................. 1,315 1,577 8,474 5,983 167 386 315 367 120 438
Heifers.......................... 645 2,374 30,707 21,833 3,567 4,145 6,230 3,616 689 619
Steers............................ 1,033 2,244 20,023 13,889 1,327 2,755 23,561 23,845 680 2,452
Calves............................. 739 741 9,672 9,341 1,719 1,957 16,641 19,130 341 17
Yearlings........................... 869 768 6,471 8,907 436 417 10,484 11,578 689 295
Slaughter...................... 4,101 5,224 32,228 20,855 3,179 2,875 4,077 1,805 30 193
Bulls...................……….....1,239 371 11,685 8,285 1,375 908 4 0 3 14
Cows........................... 2,488 4,311 19,963 12,195 1,747 1,937 151 26 20 152
Heifers.......................... 192 216 324 137 27 6 1,448 26 7 25
Steers.............................. 174 247 255 238 27 24 2,247 804 0 2
Calves.......................... 0 0 1 0 3 0 0 0 0 0
Yearlings.......................... 8 79 0 0 0 0 227 949 0 0
Replacement.................... 2,270 2,871 13,238 9,136 248 1,627 456 620 771 671
Bulls........................….... 640 626 1,330 923 57 71 36 34 15 31
Cows............................ 835 1,224 7,591 4,213 161 666 138 363 613 611
Heifers............................ 493 532 2,586 2,775 23 435 245 113 113 24
Calves............................ 302 489 1,731 1,225 7 455 37 110 30 5
All Classes........................11,393 16,232 125,547 94,131 10,778 14,363 61,959 61,024 3,330 4,728
2014 2015 2014 2015 2014 2015 2014 2015
Feeders..............……..............304 71 32,978 43,793 490 5 186,181 188,470
Bulls............................... 0 0 0 0 0 0 5,495 4,927
Cows............................ 0 70 5 89 0 0 10,396 8,910
Heifers............................. 304 0 19,780 21,898 0 5 61,922 54,490
Steers................................. 0 0 7,747 11,696 490 0 54,861 56,881
Calves........................... 0 0 1,001 1,058 0 0 30,113 32,244
Yearlings............................. 0 1 4,445 9,052 0 0 23,394 31,018
Slaughter....................... 0 0 317,929 170,796 0 0 361,544 201,748
Bulls................................... 0 0 0 2 0 0 14,306 9,580
Cows............................ 0 0 376 0 0 0 24,745 18,621
Heifers............................ 0 0 107,272 56,771 0 0 109,270 57,181
Steers................................ 0 0 186,494 108,724 0 0 189,197 110,039
Calves................................. 0 0 0 0 0 0 4 0
Yearlings................................ 0 0 23,787 5,299 0 0 24,022 6,327
Replacement......................... 7 10 1,036 962 120 64 18,146 15,961
Bulls................................. 5 4 163 230 30 5 2,276 1,924
Cows................................ 2 0 475 347 5 3 9,820 7,427
Heifers................................ 0 4 214 269 64 50 3,738 4,202
Calves.............................. 0 2 184 116 21 6 2,312 2,408
All Classes..................... 311 81 351,943 215,551 610 69 565,871 406,179
(1) Shipments exclude unclassified animals.
Source: Livestock Identification Services Ltd.
Table 66: Alberta Brand Inspection Record of Live Cattle and Calf
Shipments Out-of-Province (1), 2014 and 2015
B.C. Saskatchewan Manitoba Ontario Quebec
Head
Maritimes United States Other Total
Head
- 87 - Alberta Agriculture Statistics Yearbook, 2015

2006 2007 2008 2009 2010 2011 2012 2013 2014 2015p
Arabian...........................................................241 258 229 221 202 128 187 212 157 -
Appaloosa............................................................130 133 85 52 45 108 63 86 45 48
Morgan................................................................253 218 161 158 122 104 82 89 86 64
Paint.................................................................916 873 862 783 605 538 458 564 499 469
Quarter Horse..........................................................6,342 5,269 5,856 4,915 4,237 3,944 3,441 3,366 3,538 3,102
Standardbred....................................................401 377 322 288 203 197 137 147 168 192
Thoroughbred..............................................550 500 484 411 353 257 260 252 206 233
Draft..................................................................190 180 232 152 200 166 177 173 163 129
Other (1)..............................................................910 723 539 394 373 298 241 324 384 261
Warmblood (3)................................................................- - 268 219 210 89 205 181 100 175
Total (4).............................................................9,485 9,313 9,933 8,518 6,550 5,829 5,251 5,394 5,346 4,673
Arabian (2)............................................................279 311 232 350 216 175 218 185 197 -
Appaloosa.......................................................127 122 91 77 77 73 53 50 46 29
Morgan..............................................................238 282 200 207 154 135 168 143 85 96
Paint................................................................- - - - - - - - - -
Quarter Horse..................................................................5,533 5,450 5,517 4,642 4,642 3,892 3,772 3,450 3,468 3,577
Standardbred..................................................................- - - - - - - - - -
Thoroughbred..................................................................- - - - - - - - - -
Draft................................................................328 189 226 167 180 183 219 244 142 101
Other (1).........................................................947 924 514 452 453 398 433 462 338 427
Warmblood (3)................................................................- - 302 296 248 118 324 294 182 290
Total (4).............................................................7,452 7,199 7,449 7,452 7,278 4,974 5,187 4,828 4,458 4,520
2006 2007 2008 2009 2010 2011 2012 2013r 2014r 2015p
Japan...........................................................................3,163 3,939 3,164 3,056 2,189 2,387 2,660 2,678 2,773 3,288
France.............................................................2,529 3,455 3,760 3,869 2,681 2,363 2,352 1,727 2,024 1,969
Switzerland...................................................1,027 1,041 1,039 1,331 1,197 1,103 917 1,117 1,172 1,487
Belgium................................................... - 36 105 666 1,846 1,279 1,141 586 401 148
Kazakhstan...................................................- - 999 829 338 - 1,640 1,952 2,120 -
Other Countries................................................2,073 1,267 925 763 460 294 102 252 162 26
Total................................................................8,793 9,738 9,991 10,514 8,709 7,426 8,811 8,312 8,652 6,919
Japan...........................................................................15,817 16,803 16,926 18,571 14,735 13,992 17,058 17,919 20,350 24,556
France.............................................................14,186 16,551 19,937 22,407 14,904 13,026 12,008 9,067 13,495 13,292
Switzerland...................................................8,886 9,760 11,155 12,944 11,224 10,909 9,157 11,585 12,180 12,628
Belgium................................................... - 348 321 2,296 6,121 3,116 2,996 1,660 1,563 307
Kazakhstan...................................................- - 2,071 1,812 873 - 4,263 5,006 5,509 -
Other Countries................................................5,180 4,249 2,276 2,269 1,304 864 453 878 728 107
Total................................................................44,069 47,711 52,685 60,299 49,160 41,908 45,935 46,115 53,825 50,891
(1) Refers to fresh or chilled and frozen horse meat and may include some meat of asses and mules.
Table 67: Registrations and Sales of Registered Horses in Alberta, 2006-2015
Registration by Breed Association - Head
Ownership Transfers - Head
(1) Other registrations and transfers include the addition of donkey data in 2001.
(2) Part breed transfers are not recorded (except when made at time of registration).
(3) Warmblood figures included in "Other" up to 2007.
(4) Transfer totals do not include Standardbreds, Thoroughbreds and Paints.
Source: Alberta Agriculture and Forestry, Food Safety and Technology Division, Animal Health and Assurance Branch, Livestock Traceability Section;
and Breed Registries
Table 68: Alberta Horse Meat Exports by Destination, 2006-2015 (1)
tonnes
Value - $'000
Source: Statistics Canada; and Alberta Agriculture and Forestry, Statistics and Data Development Section
Alberta Agriculture Statistics Yearbook, 2015 - 88 -
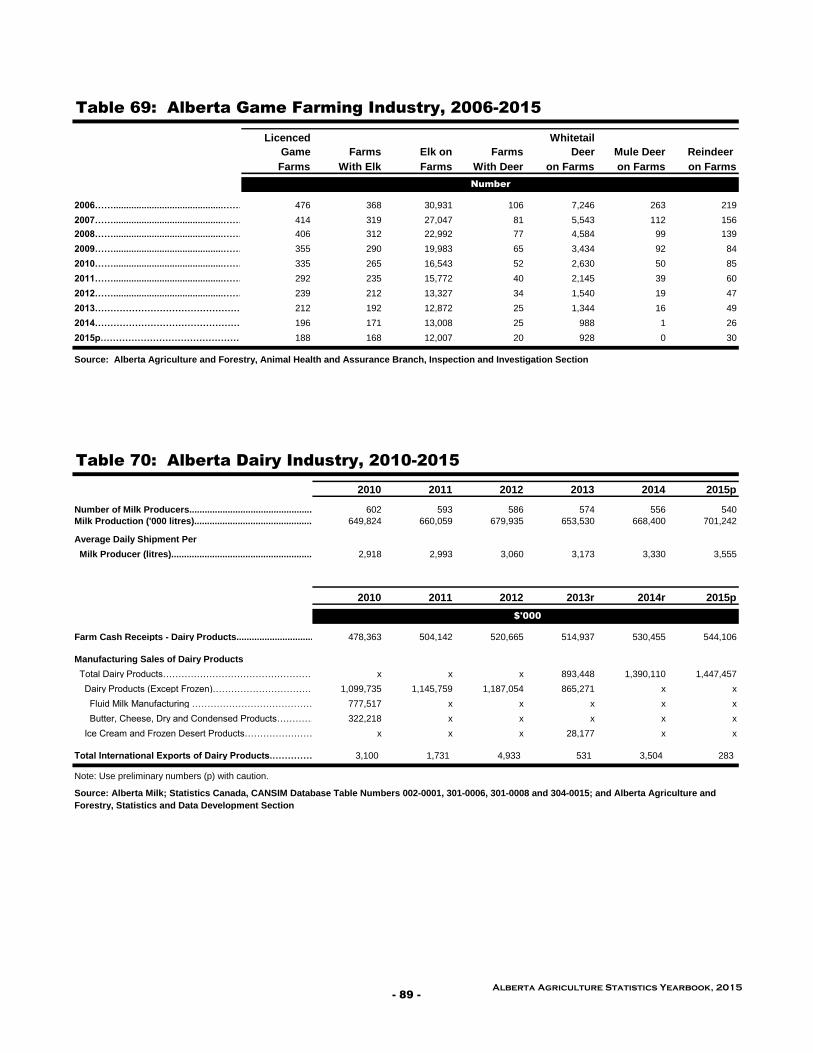
Licenced
Game Farms Elk on Farms
Whitetail
Deer Mule Deer Reindeer
Farms With Elk Farms With Deer on Farms on Farms on Farms
2006……...........................................……….. 476 368 30,931 106 7,246 263 219
2007……...........................................……….. 414 319 27,047 81 5,543 112 156
2008……...........................................……….. 406 312 22,992 77 4,584 99 139
2009……...........................................……….. 355 290 19,983 65 3,434 92 84
2010……...........................................……….. 335 265 16,543 52 2,630 50 85
2011……...........................................……….. 292 235 15,772 40 2,145 39 60
2012……...........................................……….. 239 212 13,327 34 1,540 19 47
2013………………………………………………………………………………………………212 192 12,872 25 1,344 16 49
2014………………………………………………………………………………………………196 171 13,008 25 988 1 26
2015p………………………………………………………………………………………………188 168 12,007 20 928 0 30
2010 2011 2012 2013 2014 2015p
Number of Milk Producers.................................................... 602 593 586 574 556 540
Milk Production ('000 litres).................................................. 649,824 660,059 679,935 653,530 668,400 701,242
Average Daily Shipment Per
Milk Producer (litres)........................................................... 2,918 2,993 3,060 3,173 3,330 3,555
2010 2011 2012 2013r 2014r 2015p
Farm Cash Receipts - Dairy Products.....................................................................................................478,363 504,142 520,665 514,937 530,455 544,106
Manufacturing Sales of Dairy Products
Total Dairy Products………………………………………………………………………………………………………x x x 893,448 1,390,110 1,447,457
Dairy Products (Except Frozen)…………………………………………………………………………..1,099,735 1,145,759 1,187,054 865,271 x x
Fluid Milk Manufacturing ………………………………………………………………………………………………………..777,517 x x x x x
Butter, Cheese, Dry and Condensed Products…………………………………322,218 x x x x x
Ice Cream and Frozen Desert Products……………………………………………………………….x x x 28,177 x x
Total International Exports of Dairy Products.…………………….. 3,100 1,731 4,933 531 3,504 283
Note: Use preliminary numbers (p) with caution.
Source: Alberta Milk; Statistics Canada, CANSIM Database Table Numbers 002-0001, 301-0006, 301-0008 and 304-0015; and Alberta Agriculture and
Forestry, Statistics and Data Development Section
Table 69: Alberta Game Farming Industry, 2006-2015
Number
Source: Alberta Agriculture and Forestry, Animal Health and Assurance Branch, Inspection and Investigation Section
Table 70: Alberta Dairy Industry, 2010-2015
$'000
- 89 -
Alberta Agriculture Statistics Yearbook, 2015

$'000 $'000 $'000
2004.............................................................................…89,416 138,838 269 421 89,147 138,417
2005.............................................................................…87,712 142,378 265 435 87,447 141,943
2006.............................................................................…88,150 138,493 430 733 87,721 137,760
2007.............................................................................…89,888 152,800 418 647 89,470 152,154
2008.............................................................................…90,622 172,983 404 704 90,218 172,279
2009.............................................................................…91,128 177,365 384 687 90,744 176,678
2010.............................................................................…95,121 178,120 373 632 94,748 177,488
2011.............................................................................…96,692 207,663 355 687 96,337 206,975
2012.............................................................................…98,444 220,204 347 681 98,097 219,522
2013r.............................................................................…98,482 224,448 365 746 98,116 223,702
2014r.............................................................................…99,060 216,131 372 738 98,688 215,393
2015p.............................................................................…107,191 226,679 393 745 106,798 225,934
2004.............................................................................…12,156 23,260 34 65 12,122 23,195
2005.............................................................................…13,035 23,892 35 64 13,000 23,828
2006.............................................................................…13,242 23,738 29 52 13,213 23,686
2007.............................................................................…13,997 27,872 29 58 13,968 27,814
2008.............................................................................…16,200 36,016 30 67 16,170 35,949
2009.............................................................................…13,330 29,312 29 65 13,301 29,247
2010.............................................................................…13,317 27,068 28 57 13,288 27,011
2011.............................................................................…14,636 32,783 27 61 14,609 32,722
2012.............................................................................…15,824 37,661 27 63 15,797 37,598
2013r.............................................................................…16,265 38,983 27 66 16,238 38,917
2014r.............................................................................…15,476 36,473 27 62 15,449 36,411
2015p.............................................................................…15,995 37,305 27 63 15,968 37,241
2004.............................................................................…101,572 162,098 303 485 101,268 161,613
2005.............................................................................…100,747 166,269 300 499 100,447 165,770
2006.............................................................................…101,392 162,231 459 785 100,933 161,446
2007.............................................................................…103,886 180,672 447 704 103,438 179,968
2008.............................................................................…106,822 208,999 434 771 106,388 208,228
2009.............................................................................…104,459 206,677 414 752 104,045 205,925
2010.............................................................................…108,438 205,188 401 690 108,037 204,498
2011.............................................................................…111,329 240,445 383 748 110,946 239,697
2012.............................................................................…114,268 257,865 374 744 113,894 257,120
2013r.............................................................................…114,747 263,431 393 812 114,354 262,620
2014r.............................................................................…114,535 252,604 398 800 114,137 251,804
2015p.............................................................................…123,187 263,983 420 808 122,766 263,175
Table 71: Output and Value of Poultry Meats, Alberta, 2004-2015
Total Production Consumed by Producers Sold
tonnes tonnes tonnes
Source: Statistics Canada, CANSIM Database Table Number 003-0018
Stewing Hen and Chicken
Turkey
Total Stewing Hen, Chicken and Turkey
Alberta Agriculture Statistics Yearbook, 2015 - 90 -
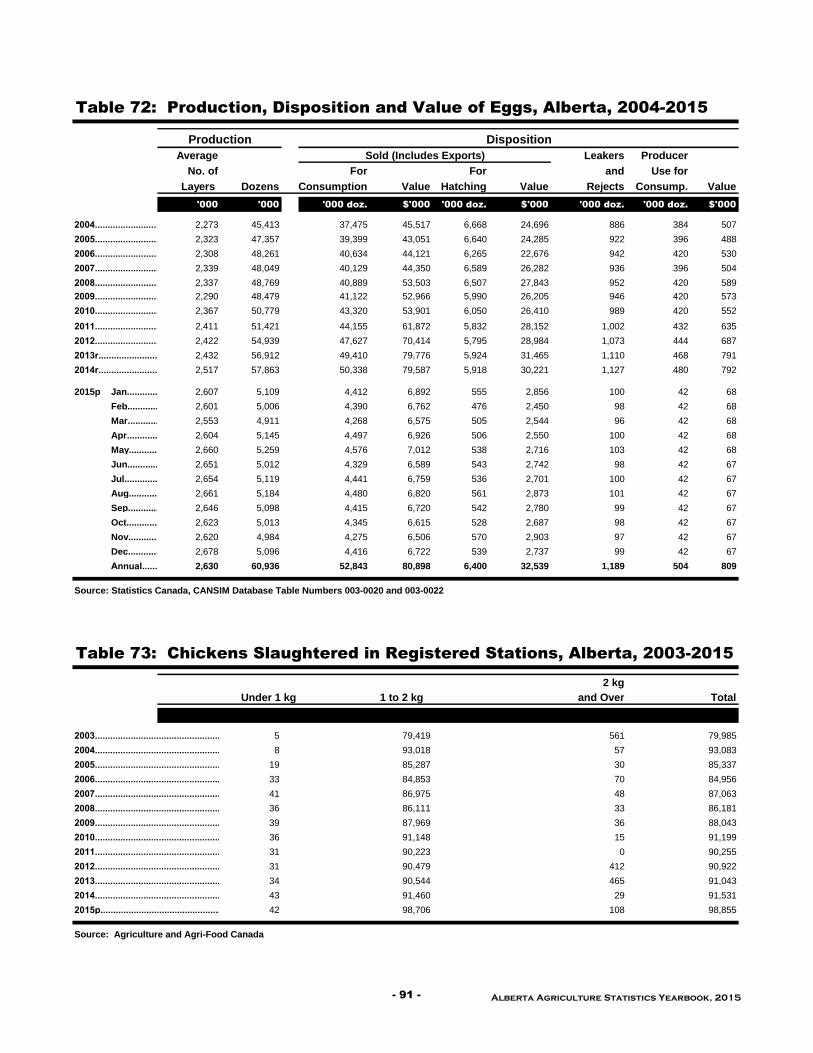
Average Leakers Producer
No. of For For and Use for
Layers Dozens Consumption Value Hatching Value Rejects Consump. Value
'000 '000 '000 doz. $'000 '000 doz. $'000 '000 doz. '000 doz. $'000
2004.............................................................................…2,273 45,413 37,475 45,517 6,668 24,696 886 384 507
2005.............................................................................…2,323 47,357 39,399 43,051 6,640 24,285 922 396 488
2006.............................................................................…2,308 48,261 40,634 44,121 6,265 22,676 942 420 530
2007.............................................................................…2,339 48,049 40,129 44,350 6,589 26,282 936 396 504
2008.............................................................................…2,337 48,769 40,889 53,503 6,507 27,843 952 420 589
2009.............................................................................…2,290 48,479 41,122 52,966 5,990 26,205 946 420 573
2010.............................................................................…2,367 50,779 43,320 53,901 6,050 26,410 989 420 552
2011.............................................................................…2,411 51,421 44,155 61,872 5,832 28,152 1,002 432 635
2012.............................................................................…2,422 54,939 47,627 70,414 5,795 28,984 1,073 444 687
2013r.............................................................................…2,432 56,912 49,410 79,776 5,924 31,465 1,110 468 791
2014r.............................................................................…2,517 57,863 50,338 79,587 5,918 30,221 1,127 480 792
2015p Jan.............. 2,607 5,109 4,412 6,892 555 2,856 100 42 68
Feb.............. 2,601 5,006 4,390 6,762 476 2,450 98 42 68
Mar.............. 2,553 4,911 4,268 6,575 505 2,544 96 42 68
Apr.................. 2,604 5,145 4,497 6,926 506 2,550 100 42 68
May................. 2,660 5,259 4,576 7,012 538 2,716 103 42 68
Jun.............. 2,651 5,012 4,329 6,589 543 2,742 98 42 67
Jul.............. 2,654 5,119 4,441 6,759 536 2,701 100 42 67
Aug................ 2,661 5,184 4,480 6,820 561 2,873 101 42 67
Sep................ 2,646 5,098 4,415 6,720 542 2,780 99 42 67
Oct............... 2,623 5,013 4,345 6,615 528 2,687 98 42 67
Nov............... 2,620 4,984 4,275 6,506 570 2,903 97 42 67
Dec............... 2,678 5,096 4,416 6,722 539 2,737 99 42 67
Annual.............… 2,630 60,936 52,843 80,898 6,400 32,539 1,189 504 809
2 kg
1 to 2 kg and Over Total
2003...........................................................................................…5 79,419 561 79,985
2004...........................................................................................…8 93,018 57 93,083
2005...........................................................................................…19 85,287 30 85,337
2006.......................................................................................……………………………………………………………………………33 84,853 70 84,956
2007...........................................................................................…41 86,975 48 87,063
2008...........................................................................................…36 86,111 33 86,181
2009...........................................................................................…39 87,969 36 88,043
2010...........................................................................................…36 91,148 15 91,199
2011...........................................................................................…31 90,223 0 90,255
2012...........................................................................................…31 90,479 412 90,922
2013...........................................................................................…34 90,544 465 91,043
2014...........................................................................................…43 91,460 29 91,531
2015p...........................................................................................…42 98,706 108 98,855
Table 72: Production, Disposition and Value of Eggs, Alberta, 2004-2015
Production Disposition
Sold (Includes Exports)
Source: Statistics Canada, CANSIM Database Table Numbers 003-0020 and 003-0022
Source: Agriculture and Agri-Food Canada
Table 73: Chickens Slaughtered in Registered Stations, Alberta, 2003-2015
Under 1 kg
Eviscerated Weight - tonnes
- 91 - Alberta Agriculture Statistics Yearbook, 2015


Page No.
Alberta Crops in 2015…………………………………………………………………………………………….94
Precipitation Accumulation Relative to 1961-2013 Normal, April 01, 2015 to November 3, 2015 (Map)………………………………………………..…………………………………………………………………………………………………………96
Table No.
74. Major Crop Production, Canada and Provinces, 2006-2015…………………………………………………………………………………………………….97
75. Acreage and Production of Principal Field Crops, Prairie Provinces and Canada, 2015……………………………….98
76. Alberta Principal Field Crops - Area, Yield and Production, 2011-2015………………………………………………………………………………………………………………………………………………………….. .100
77. Alberta Major Crops - Acreage, 1964-2015………………………………………………………………………………………………………….. .………………………………………………………………………………………………………………….. .102
78. Alberta Major Crops - Yield, 1964-2015………………………………………………………………………………………………………………………………………………………………………………………….. .………………………………….. .103
79. Alberta Major Crops - Production, 1964-2015……………………………………………………………………………………………………………………………………………………………………………………………….. .…………………………….. .104
80. Alberta Major Crops - Unit Value, 1964-2015……………………………………………………………………………………………………………………………………………………………………………………………………….. .…………………….. .105
81. Alberta Wheat Crop by Type - Area, Yield and Production, 2006-2015………………………………………………………………………………………………………………………………………………………………………………………………….. .………………………….. .106
82. Alberta Summerfallow Area by Census Division, 2008-2015……………………………………………………………………………………………………………………………………………………………………………………………………………….. .…………….. .106
83. All Wheat Acreage and Production for Alberta Census Divisions, 2006-2015………………………………………………………………………………………………………………………………………………………………………………………………………….. .………………….. .107
84. Spring Wheat Acreage and Production for Alberta Census Divisions, 2006-2015………………………………………………………………………………………………………………………………………………………………………………………………………….. .………………….. .108
85. Durum Wheat Acreage and Production for Alberta Census Divisions, 2006-2015……………………………………………………………………………………………………………………………………………………………………………………………………….. .…………………….. .109
86. Barley Acreage and Production for Alberta Census Divisions, 2006-2015………………………………………………………………………………………………………………………………………………………………………………………………….. .………………………….. .110
87. Oats Acreage and Production for Alberta Census Divisions, 2006-2015……………………………………………………………………………………………………………………………………………………………………………………………………….. .…………………….. .111
88. Canola Acreage and Production for Alberta Census Divisions, 2006-2015…………………………………………………………………………………………………………………………………………………………………………………………………………….. .……………….. .112
89. Tame Hay Acreage and Production for Alberta Census Divisions, 2006-2015…………………………………………………………………………………………………………………………………………………………………………………………………………...…………………...113
90. Alberta Special Crops - Area, Yield, Production and Price, 2006-2015…………………………………………………………………………………………………………………………………………………………………………………………………….. .…………………….. .114
91. Canadian Wheat Board Payments, 2009-10 to 2015-16…………………………………………………………………………………………………………………………………………………………………………………………………………….. .……………….. .116
92. Canadian Wheat Board Payments (Initial and Final), 2013-14 and 2014-15…………………………………………………………………………………………………………………………….. .………………….. .117
93. Non-Board Feed Grain Prices, 2004-05 to 2014-15………………………………………………………………………………………………………………………………………………………………………………………….. .…………………….. .118
94. Greenhouse Industry, Alberta and Canada, 2007-2015……………………………………………………………………………………………………………………………………………………………………………………….. .…………………….. .118
95. Sugar Beet Industry, Alberta, 2008-2015……………………………………………………………………………………………………………………………………………………………………………………….. .……………………….. .119
96. Major Commercial Vegetable Production, Alberta, 2008-2015………………………………………………………………………………………………………………………………………………………………………………………….. .…………………….. .119
97. Alberta Forage Seed Crops Inspected for Pedigree Status, 2006-2015……………………………………………………………………………………………………………………………………………………………………………………………….. .……………….. .120
98. Alberta Pedigreed Acres, 2006-2015……………………………………………………………………………………………………………………………………………………………………………………………….. .…………….. .120
99. Municipal Co-Operative Seed Cleaning in Alberta, 2005-06 to 2014-15………………………………………………………………………………………………………………………………………………………………………………………………….. .…………….. .120
100. Stocks of Grain on Alberta Farms on July 31, 1978-2015………………………………………………………………………………………………………………………………………………………………………………………………….. .…………….. .121
101. Farm Supply and Disposition of Alberta Principal Field Crops, 2006-07 to 2014-15………………………………………………………………………………………………………………………………………………………………………….. .…………………………………….. ………….…122
102. Irrigation in Alberta by District, 2008-2015…………………………………………………………………………………………………………………………………………………………………………………………………….. .………….. .123
103. Crop Area Assessment in Alberta Irrigation Districts, 2008-2015…………………………………………………………………………………………………………………………………………………………………………………………….. .………………….. .123
104. Precipitation at Selected Alberta Weather Stations, 2011-2015……………………………………………………………………………………………………………………………………………………………………………………….. .…………………….. .124
105. Alberta Crop Insurance, 2009-2015 (as of March 31, 2016)…………………………………………………………………………………………………………………………………………………………………………………….. .……………….. .124
Selected Alberta Weather Stations (Map)……………………………………………………………………………………………125
C
R
O
P
S
- 93 - Alberta Agriculture Statistics Yearbook, 2015
Alberta Agriculture Statistics Yearbook, 2015 - 94 -
Alberta Crops in 2015
The following presents a review of the crop season and an analysis of crop production statistics for 2015. Also, a precipitation map for the 2015 crop season is shown for reference on page 96.
The 2015 Crop Season Crop growing conditions in the province during 2015 were somewhat challenging for Alberta`s producers. The 2015 crop season started with a dry spring followed by a hot summer with limited moisture, which had an adverse impact on crop growth. However, as harvest progressed across the province, yields were higher than what were expected. Alberta`s 2015 total field crop production (excluding forage) was comparable in volume to the non-drought years of 2008, 2010 and 2012. The early snow melt in May allowed producers to get an early start to seeding across the province. Seeding progressed quickly compared to the 5-year average, particularly in the South Region, followed by the Central, North West, North East and Peace Regions. Fall seeded crops survived the winter with 77 per cent rated as good to excellent and 23 per cent rated as fair to poor. Surface soil moisture condition in the beginning of May was reported as 70 per cent good to excellent, 24 per cent fair and six per cent poor, but windy conditions depleted soil moisture levels during the month in the top couple of inches of the soil layer. Declining soil moisture caused some producers to delay seeding of shallow seeded crops, especially canola. Dry weather continued to persist across the South and Central Regions and delayed the seeding of canola. By the end of May, seeding was practically completed across the province, one week earlier than the 5-year average. However, extremely dry conditions and cool nights delayed seed emergence. Also, low night time temperatures in May caused some producers to re-seed, due to frost in their fields. In June, dry weather continued throughout the province, exacerbated by warm temperatures and wind, which led to uneven crop emergence in annual crops. By mid-June, most areas of the province that were in critical need of moisture had received some spotty precipitation that caused uneven germination in late seeded crops, especially canola. By the end of June, isolated rain showers somewhat alleviated moisture stress. However, surface and sub-surface soil moisture conditions remained poor and field crops continued to be influenced by the dry conditions. Surface soil moisture conditions were reported as 21 per cent good to excellent, 36 per cent fair and 43 per cent poor as of June 29, 2015. In July, temperatures returned to more normal levels and spotty showers were active in all regions, especially in the South Region. However, dry conditions continued to persist in the Northern Region. Crop development and moisture ratings varied across the province by mid-July and continued to be influenced by dry weather. In the third week of July, precipitation in most parts of the province alleviated moisture stress on cereals and oilseeds crops. Surface and subsurface soil moisture ratings improved. However, soil moisture conditions remained extremely low through many areas, especially north of Edmonton and in much of the northern and eastern Peace Region. By the end of July, more moderate temperatures combined with widespread shower activities across the province decreased the stress on crops and improved both surface and sub-surface soil moisture. August started with the return of above normal temperatures combined with limited precipitation, particularly in the more northerly regions. As a result of higher temperatures, crop development progressed quickly, with harvest almost one week ahead in August 2015 compared to most years. Harvest of winter cereals, field peas and barley started in the first week of August, while canola development was in a wide variance of crop stages across the province. Preliminary estimates of yield were reported as being low (25 to 30 per cent below average) for most crops. Surface and sub-surface soil moisture remained in poor condition until mid-August, when large parts of the province received 5 to 70 mm of precipitation. Rain showers continued until the end of August, with rainfall accumulation causing some delays in harvest operations. Improvement in both surface and sub-surface provincial soil moisture benefited late seeded crops. While yield estimates improved significantly by the end of August, second growth became a significant problem for producers. Harvest operation in September was another challenge for producers. The month started with thick smoke haze in the atmosphere which reduced temperatures and slowed drying across much of the province. While windy conditions in South Alberta helped to dry crops, it caused damage by blowing swaths and breaking heads. By mid-September, harvest progress was ahead in the South, North East and North West Regions (compared to 2014), and five per cent more advanced provincially. However, generally damp conditions in September delayed harvest operations across the province. By the end of September, harvest progress was behind in all regions and 26 per cent provincially, compared to 2014. September rainfall was beneficial for fall seeded crops and improved soil moisture. Dry and warm weather in October allowed producers to complete harvest by the end of October. Overall, crop yields in the province in 2015 were a little below their long term averages, but much better than was expected earlier in the summer. Crop quality deteriorated after the wet rainy weather in September slowed harvest progress, largely because of sprouting in many crops. However, crop quality was still above the long-term average for all crops, with the exception of malt barley, oats and canola. Insects and Crop Diseases In 2015, poor growing conditions led to some insect issues. This was especially true with flea beetles and cutworms in canola. Grasshoppers were a large concern in some areas in central Alberta and parts of the Peace Region. Wheat midge

Alberta Agriculture Statistics Yearbook, 2015 - 95 -
was not a major concern. The incidence of Bertha armyworm was extremely low throughout the province. Pea leaf weevil was a concern for faba bean producers in central Alberta. Forage and Pasture In May, pasture, hay and fall seeded crops started greening slowly. The dry conditions and cool nights resulted in slow growth for tame hay and pasture. Provincially, both hay and pasture growth conditions were reported as 25 per cent poor, 41 per cent fair, 31 per cent good, and three per cent excellent as of May 26, 2015. In June, grasses and legumes stopped growing and turned brown due to dry conditions. Both hay and pasture growth conditions deteriorated to only 17 per cent rated as good or excellent as of June 29, 2015. By mid-August, first cut dryland hay was 96 per cent complete, with an average provincial yield of 0.8 ton per acre. For irrigated haying operations, it was virtually complete with yield reported at 2.4 tons per acre. The quality of first cut hay was rated as 64 and 84 per cent good to excellent, respectively, for dryland and irrigated hay. Hay and pasture growth showed a slight improvement in August and was rated as 19 per cent good to excellent. Similarly, as of September 29, pasture growth conditions reported at 34 per cent poor, 37 per cent fair and 29 per cent good to excellent, across the province.
Alberta Crop Production Based on Statistics Canada`s November estimate, total production of principal field crops (including forages) in Alberta was estimated at 26.9 million tonnes, down 12.3 per cent from 2014. While crop production in 2015 was 2.7 per cent higher than the 10-year (2005-2014) average, forage production was 34.0 per cent below the 10-year average, resulting in a 7.3 per cent drop (from the 10-year average) in total production of crop and forage. Provincial average yields were generally lower than in 2014 which was an above average year. Crop quality in general was about average. In 2015, total seeded and harvested areas of principal field crops in the province declined 0.6 per cent and 4.1 per cent, respectively. Total production of spring wheat in 2015 decreased 13.4 per cent from 2014, to 7.2 million tonnes, and was 2.0 per cent lower than the 10-year average. The lower production stemmed from a decline in yield and harvested area. Yield was down 8.9 per cent, while harvested area declined 5.0 per cent from 2014. The provincial average yield was 47.2 bushels per acre and harvested area at 5.6 million acres. For durum wheat, production was up 15.4 per cent, to 816,500 tonnes. Durum production was 5.1 per cent higher than the 10-year average, due to an increase in harvested area of 49.1 per cent to 805,000 acres. Average yield fell 22.5 per cent to 37.3 bushels per acre. Overall, production of all wheat was 8.3 million tonnes, a decrease of 11.3 per cent from 2014. Total barley production increased to 4.3 million tonnes, up 3.8 per cent from 2014. The higher production was attributed to a 1.9 per cent increase in yield to 68.6 bushels per acre, and a 1.8 per cent increase in harvested area at 2.9 million acres. Despite this increase, barley production was 9.5 per cent below the 10-year average. Total canola production decreased 6.1 per cent from 2014 to 5.4 million tonnes, but was 19.4 per cent higher than the 10-year average. The decrease was due to lower harvested area, down 10.0 per cent to 6.0 million acres. Canola yield in 2015 was 39.7 bushel per acre, up 4.5 per cent from 2014 and 8.8 per cent from the 10-year average. Dry peas production fell 10.9 per cent to 1.3 million tonnes. Harvested area was up 10.1 per cent to 1.4 million acres, while yield fell 19.0 per cent to 34.0 bushels per acre. Total oat production fell 27.6 per cent to 393,300 tonnes, and was 35.1 per cent below the 10-year average. Harvested area was down 25.3 per cent to 340,000 acres and yield fell 3.1 per cent to 75.0 bushels per acre.
Alberta Forage Production Total tame hay production in Alberta in 2015 was estimated at 5.0 million tonnes, based on the Statistics Canada report “Production of Principal Field Crops, December, 2015”. This was down 31.5 per cent from 2014, and 36.6 per cent below the 10-year average. The decline in production was as a result of lower yields (down 23.5 per cent from 2014 to 1.3 tons per acre), as well as a decrease in harvest area (down 8.1 per cent to 4.2 million acres). Based on a survey conducted by the Statistics and Data Development Section of Alberta Agriculture and Forestry, total greenfeed production in the province increased 24.0 per cent from 2014, to 949,000 tonnes, mainly due to a 45.0 per cent increase in harvested area and despite a 14.2 per cent decrease in the average provincial yield. Total silage production was estimated at 2.1 million tonnes, down 20.0 per cent from 2014. This reduction was the result of a 34.3 per cent decline in the average provincial yields for silage which more than offset a 21.7 per cent increase in harvested area. The provincial average yield for greenfeed was estimated at 2.17 tonnes per acre, 14.2 per cent lower than in 2014. The estimated provincial average yield for silage declined 34.3 per cent to 4.39 tonnes per acre. Total area harvested for greenfeed and silage in 2015 was estimated at 919,976 acres, an increase of 32 per cent from 2014. Total area harvested for greenfeed increased 45.0 per cent to 438,219 acres, while silage acreage rose by 21.7 per cent to 481,757 acres. Producers harvested more greenfeed and silage mainly because of a significant shortage in hay production caused by the dry conditions in the province.

Alberta Agriculture Statistics Yearbook, 2015 - 96 -
Crop Prices and Marketings Local and international market prices for all major grains and oilseeds in 2015 were up from 2014. In Alberta, the average price of all wheat increased almost 1.0 per cent to $6.18 per bushel, while the average price for barley was estimated at $4.54 per bushel, up 15.8 per cent from a year earlier. Prices for oats and flaxseed increased by 6.6 per cent and 1.1 per cent, respectively, from 2014. For canola, the average price was estimated at $10.37 per bushel, up 6.4 per cent from 2014. With respect to marketings, year-over-year changes varied substantially among major crops. While marketing for total wheat, canola and dry peas in 2015 decreased to 8.9, 5.7 and 1.1 million tonnes, respectively, marketing for these crops remained higher than the 5-year average (2010-2014) of 7.6, 5.0 and 1.0 million tonnes. For barley, total marketing declined to 1.2 million tonnes, down 27.4 per cent from 2014, and down 16.1.per cent from the 5-year average of 1.4 million tonnes. Marketing for lentils increased dramatically to 141,697 tonnes, up 37.3 per cent from 2014, and up 118.1 per cent from the 5-year average.
Source: Alberta Agriculture and Forestry, Environmental Stewardship Branch, Engineering and Climate Services Section. Created on November 3, 2015
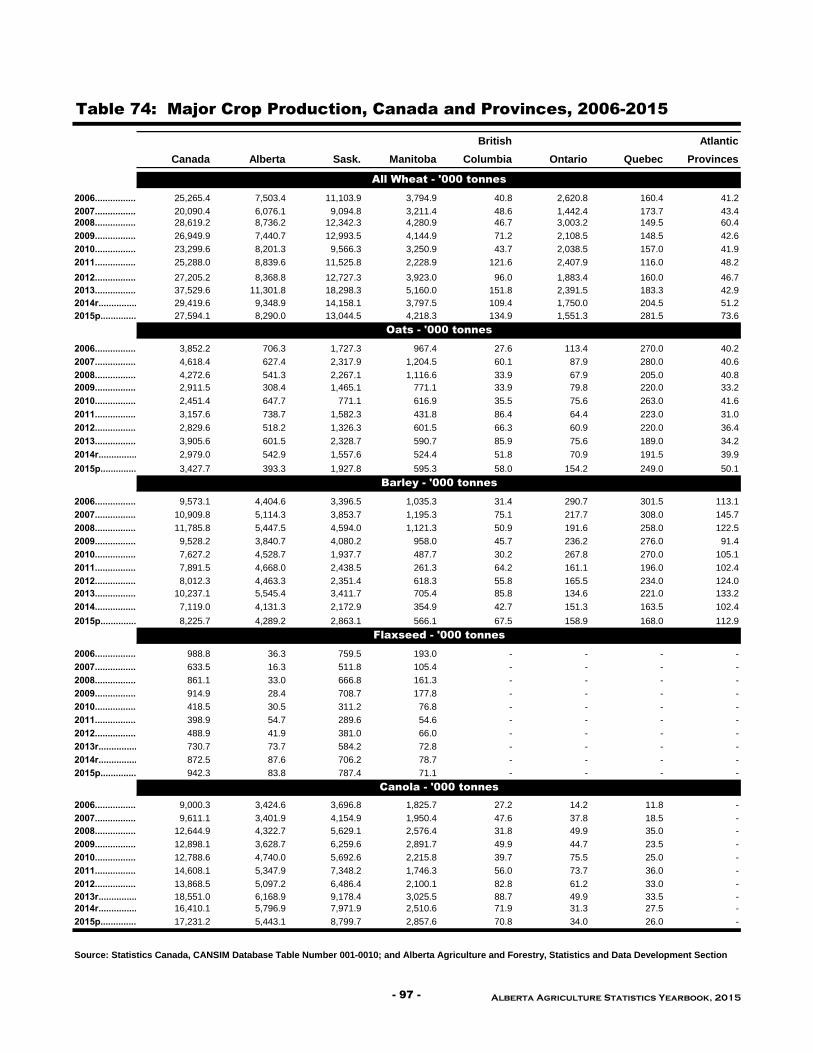
British Atlantic
Canada Alberta Sask. Manitoba Columbia Ontario Quebec Provinces
2006.........................… 25,265.4 7,503.4 11,103.9 3,794.9 40.8 2,620.8 160.4 41.2
2007.........................… 20,090.4 6,076.1 9,094.8 3,211.4 48.6 1,442.4 173.7 43.4
2008.........................… 28,619.2 8,736.2 12,342.3 4,280.9 46.7 3,003.2 149.5 60.4
2009.........................… 26,949.9 7,440.7 12,993.5 4,144.9 71.2 2,108.5 148.5 42.6
2010..........................… 23,299.6 8,201.3 9,566.3 3,250.9 43.7 2,038.5 157.0 41.9
2011...........................… 25,288.0 8,839.6 11,525.8 2,228.9 121.6 2,407.9 116.0 48.2
2012.........................… 27,205.2 8,368.8 12,727.3 3,923.0 96.0 1,883.4 160.0 46.7
2013.........................… 37,529.6 11,301.8 18,298.3 5,160.0 151.8 2,391.5 183.3 42.9
2014r....................… 29,419.6 9,348.9 14,158.1 3,797.5 109.4 1,750.0 204.5 51.2
2015p....................… 27,594.1 8,290.0 13,044.5 4,218.3 134.9 1,551.3 281.5 73.6
2006.........................… 3,852.2 706.3 1,727.3 967.4 27.6 113.4 270.0 40.2
2007.........................… 4,618.4 627.4 2,317.9 1,204.5 60.1 87.9 280.0 40.6
2008.........................… 4,272.6 541.3 2,267.1 1,116.6 33.9 67.9 205.0 40.8
2009.........................… 2,911.5 308.4 1,465.1 771.1 33.9 79.8 220.0 33.2
2010..........................… 2,451.4 647.7 771.1 616.9 35.5 75.6 263.0 41.6
2011...........................… 3,157.6 738.7 1,582.3 431.8 86.4 64.4 223.0 31.0
2012.........................… 2,829.6 518.2 1,326.3 601.5 66.3 60.9 220.0 36.4
2013.........................… 3,905.6 601.5 2,328.7 590.7 85.9 75.6 189.0 34.2
2014r....................… 2,979.0 542.9 1,557.6 524.4 51.8 70.9 191.5 39.9
2015p....................… 3,427.7 393.3 1,927.8 595.3 58.0 154.2 249.0 50.1
2006.........................… 9,573.1 4,404.6 3,396.5 1,035.3 31.4 290.7 301.5 113.1
2007.........................… 10,909.8 5,114.3 3,853.7 1,195.3 75.1 217.7 308.0 145.7
2008.........................… 11,785.8 5,447.5 4,594.0 1,121.3 50.9 191.6 258.0 122.5
2009.........................… 9,528.2 3,840.7 4,080.2 958.0 45.7 236.2 276.0 91.4
2010..........................… 7,627.2 4,528.7 1,937.7 487.7 30.2 267.8 270.0 105.1
2011...........................… 7,891.5 4,668.0 2,438.5 261.3 64.2 161.1 196.0 102.4
2012.........................… 8,012.3 4,463.3 2,351.4 618.3 55.8 165.5 234.0 124.0
2013.........................… 10,237.1 5,545.4 3,411.7 705.4 85.8 134.6 221.0 133.2
2014....................… 7,119.0 4,131.3 2,172.9 354.9 42.7 151.3 163.5 102.4
2015p....................… 8,225.7 4,289.2 2,863.1 566.1 67.5 158.9 168.0 112.9
2006.........................… 988.8 36.3 759.5 193.0 - - - -
2007.........................… 633.5 16.3 511.8 105.4 - - - -
2008.........................… 861.1 33.0 666.8 161.3 - - - -
2009.........................… 914.9 28.4 708.7 177.8 - - - -
2010..........................… 418.5 30.5 311.2 76.8 - - - -
2011...........................… 398.9 54.7 289.6 54.6 - - - -
2012.........................… 488.9 41.9 381.0 66.0 - - - -
2013r.........................… 730.7 73.7 584.2 72.8 - - - -
2014r....................… 872.5 87.6 706.2 78.7 - - - -
2015p....................… 942.3 83.8 787.4 71.1 - - - -
2006.........................… 9,000.3 3,424.6 3,696.8 1,825.7 27.2 14.2 11.8 -
2007.........................… 9,611.1 3,401.9 4,154.9 1,950.4 47.6 37.8 18.5 -
2008.........................… 12,644.9 4,322.7 5,629.1 2,576.4 31.8 49.9 35.0 -
2009.........................… 12,898.1 3,628.7 6,259.6 2,891.7 49.9 44.7 23.5 -
2010..........................… 12,788.6 4,740.0 5,692.6 2,215.8 39.7 75.5 25.0 -
2011...........................… 14,608.1 5,347.9 7,348.2 1,746.3 56.0 73.7 36.0 -
2012.........................… 13,868.5 5,097.2 6,486.4 2,100.1 82.8 61.2 33.0 -
2013r.........................… 18,551.0 6,168.9 9,178.4 3,025.5 88.7 49.9 33.5 -
2014r....................… 16,410.1 5,796.9 7,971.9 2,510.6 71.9 31.3 27.5 -
2015p....................… 17,231.2 5,443.1 8,799.7 2,857.6 70.8 34.0 26.0 -
Source: Statistics Canada, CANSIM Database Table Number 001-0010; and Alberta Agriculture and Forestry, Statistics and Data Development Section
Table 74: Major Crop Production, Canada and Provinces, 2006-2015
All Wheat - '000 tonnes
Oats - '000 tonnes
Barley - '000 tonnes
Flaxseed - '000 tonnes
Canola - '000 tonnes
- 97 - Alberta Agriculture Statistics Yearbook, 2015

Alberta Sask. Manitoba Canada Alberta Sask. Manitoba
All Wheat.............................................................................. 6,850.0 13,060.0 3,150.0 24,218.3 28.3 53.9 13.0
Winter Wheat................................................................................................................150.0 240.0 220.0 1,278.0 11.7 18.8 17.2
Spring Wheat...............................................................................................................5,860.0 7,800.0 2,915.0 17,012.9 34.4 45.8 17.1
Durum Wheat..............................................................................................................820.0 5,000.0 0.0 5,820.0 14.1 85.9 -
Oats........................................................................................670.0 1,700.0 480.0 3,336.8 20.1 50.9 14.4
Barley.........................................................................................3,350.0 2,400.0 400.0 6,527.1 51.3 36.8 6.1
Fall Rye........................................................................................35.0 90.0 70.0 258.6 13.5 34.8 27.1
Mixed Grains............................................................................80.0 0.0 20.0 245.8 32.5 - -
Flaxseed....................................................................................115.0 1,400.0 125.0 1,640.0 7.0 85.4 7.6
Canola.....................................................................................6,100.0 10,700.0 3,140.0 20,094.7 30.4 53.2 15.6
Corn for Grain..................................................................................40.0 0.0 250.0 3,274.9 1.2 - 7.6
Peas, Dry...............................................................................1,445.0 2,135.0 70.0 3,680.0 39.3 58.0 1.9
Lentils....................................................................................250.0 3,700.0 0.0 3,950.0 6.3 93.7 -
Mustard Seed............................................................................90.0 255.0 0.0 345.0 26.1 73.9 -
Beans, Dry.....................................................................40.0 0.0 90.0 260.0 15.4 - 34.6
Triticale..................................................................... 35.0 40.0 0.0 75.0 46.7 53.3 -
Fodder Corn...........................................................................90.0 35.0 90.0 661.3 13.6 5.3 13.6
Tame Hay...........................................................................4,875.0 4,575.0 1,950.0 16,685.1 29.2 27.4 11.7
All Wheat.............................................................................. 6,595.0 12,895.0 3,080.0 23,667.2 27.9 54.5 13.0
Winter Wheat................................................................................................................150.0 240.0 220.0 1,273.0 11.8 18.9 17.3
Spring Wheat...............................................................................................................5,640.0 7,710.0 2,860.0 16,644.2 33.9 46.3 17.2
Durum Wheat..............................................................................................................805.0 4,945.0 0.0 5,750.0 14.0 86.0 -
Oats........................................................................................340.0 1,430.0 400.0 2,605.8 13.0 54.9 15.4
Barley.........................................................................................2,870.0 2,220.0 365.0 5,815.8 49.3 38.2 6.3
Fall Rye........................................................................................30.0 80.0 65.0 233.6 12.8 34.2 27.8
Mixed Grains.............................................................................10.0 0.0 5.0 128.4 7.8 - -
Flaxseed....................................................................................115.0 1,360.0 120.0 1,595.0 7.2 85.3 7.5
Canola....................................................................................6,050.0 10,640.0 3,130.0 19,973.9 30.3 53.3 15.7
Corn for Grain..................................................................................30.0 0.0 245.0 3,241.5 0.9 - 7.6
Peas, Dry...............................................................................1,420.0 2,115.0 67.0 3,632.0 39.1 58.2 1.8
Lentils....................................................................................246.0 3,680.0 0.0 3,926.0 6.3 93.7 -
Mustard Seed............................................................................88.0 240.0 0.0 328.0 26.8 73.2 -
Beans, Dry.....................................................................38.0 0.0 90.0 258.0 14.7 - 34.9
Triticale..................................................................... 10.0 15.0 0.0 25.0 40.0 60.0 -
Fodder Corn...........................................................................65.0 20.0 85.0 610.0 10.7 3.3 13.9
Tame Hay...........................................................................4,225.0 3,825.0 1,855.0 15,015.3 28.1 25.5 12.4
All Wheat.............................................................................. 8,290.0 13,044.5 4,218.3 27,594.1 30.0 47.3 15.3
Winter Wheat...........................................................................225.9 255.8 367.4 2,243.1 10.1 11.4 16.4
Spring Wheat...............................................................................................................7,247.6 8,216.5 3,850.9 19,962.3 36.3 41.2 19.3
Durum Wheat.........................................................................816.5 4,572.2 0.0 5,388.7 15.2 84.8 -
Oats........................................................................................393.3 1,927.8 595.3 3,427.7 11.5 56.2 17.4
Barley.........................................................................................4,289.2 2,863.1 566.1 8,225.7 52.1 34.8 6.9
Fall Rye........................................................................................33.0 53.3 78.7 225.5 14.6 23.6 34.9
Mixed Grains.............................................................................12.2 0.0 4.9 155.5 7.8 - -
Flaxseed....................................................................................83.8 787.4 71.1 942.3 8.9 83.6 7.5
Canola.....................................................................................5,443.1 8,799.7 2,857.6 17,231.2 31.6 51.1 16.6
Corn for Grain..................................................................................87.6 0.0 787.4 13,559.1 0.6 - 5.8
Peas, Dry...............................................................................1,314.5 1,778.5 78.2 3,200.7 41.1 13.1 0.6
Lentils.........................…............................... 138.0 2,234.9 0.0 2,372.9 5.8 94.2 -
Mustard Seed............................................................................31.9 91.5 0.0 123.4 25.9 74.1 -
Beans, Dry.....................................................................47.9 0.0 80.7 243.3 19.7 - 33.2
Triticale..................................................................... 14.5 10.4 0.0 24.9 58.2 41.8 -
Fodder Corn...........................................................................1,115.8 238.6 1,542.2 10,737.3 10.4 2.2 14.4
Tame Hay...........................................................................4,971.4 3,642.3 2,984.6 22,526.3 22.1 16.2 13.2
Source: Statistics Canada, CANSIM Database Table Numbers 001-0010 and 001-0017; and Alberta Agriculture and Forestry, Statistics and Data
Development Section
Table 75: Acreage and Production of Principal Field Crops, Prairie Provinces
and Canada, 2015
Seeded Acres - '000 % of Canada
Harvested Acres - '000 % of Canada
Production - '000 tonnes % of Canada
Alberta Agriculture Statistics Yearbook, 2015 - 98 -

Source: Statistics Canada; Alberta Agriculture and Forestry, Statistics and Data Development Section
Source: Statistics Canada, CANSIM Database Table Numbers 001-0010 and 001-0017; and Alberta Agriculture and Forestry, Statistics and Data
Development Section
Fig. 32 Harvested Acreage of Alberta Wheat, Barley and Canola, 2011-2015
$0
$2
$4
$6
$8
$10
$12
$14
1985 1987 1989 1991 1993 1995 1997 1999 2001 2003 2005 2007 2009 2011 2013 2015
$/B
ush
el
Canola
Wheat
Barley
Fig. 33 Price of Alberta Wheat, Barley and Canola, 1985-2015
2011 2012 2013r 2014r
3.203.40 3.33
2.82
Barley (millions of acres)
2011 2012 2013r 2014r 2015p
5.976.55
6.186.73
6.05
Canola (millions of acres)
2011 2012 2013r 2014r
6.62 6.45
7.106.65
Wheat (millions of acres)
2011 2012 2013r 2014r 2015p
3.20 3.40 3.332.82 2.87
Barley (millions of acres)
2011 2012 2013r 2014r 2015p
6.62 6.457.10
6.65 6.60
Wheat (millions of acres)
- 99 - Alberta Agriculture Statistics Yearbook, 2015
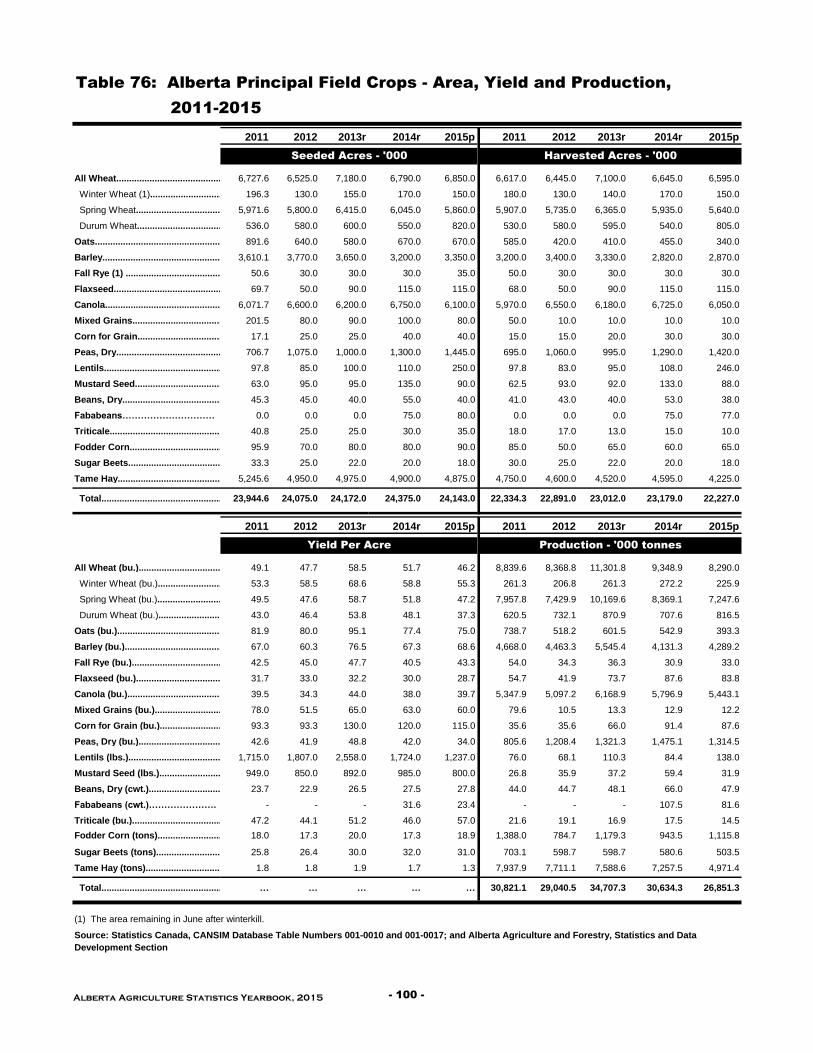
2011 2012 2013r 2014r 2015p 2011 2012 2013r 2014r 2015p
All Wheat..........................................................................6,727.6 6,525.0 7,180.0 6,790.0 6,850.0 6,617.0 6,445.0 7,100.0 6,645.0 6,595.0
Winter Wheat (1)..........................................................................196.3 130.0 155.0 170.0 150.0 180.0 130.0 140.0 170.0 150.0
Spring Wheat.............................................................................5,971.6 5,800.0 6,415.0 6,045.0 5,860.0 5,907.0 5,735.0 6,365.0 5,935.0 5,640.0
Durum Wheat................................................................................536.0 580.0 600.0 550.0 820.0 530.0 580.0 595.0 540.0 805.0
Oats......................................................................................891.6 640.0 580.0 670.0 670.0 585.0 420.0 410.0 455.0 340.0
Barley................................................................................3,610.1 3,770.0 3,650.0 3,200.0 3,350.0 3,200.0 3,400.0 3,330.0 2,820.0 2,870.0
Fall Rye (1) ...............................................................................50.6 30.0 30.0 30.0 35.0 50.0 30.0 30.0 30.0 30.0
Flaxseed...........................................................................69.7 50.0 90.0 115.0 115.0 68.0 50.0 90.0 115.0 115.0
Canola...........................................................................6,071.7 6,600.0 6,200.0 6,750.0 6,100.0 5,970.0 6,550.0 6,180.0 6,725.0 6,050.0
Mixed Grains...................................................................201.5 80.0 90.0 100.0 80.0 50.0 10.0 10.0 10.0 10.0
Corn for Grain.......................................................................17.1 25.0 25.0 40.0 40.0 15.0 15.0 20.0 30.0 30.0
Peas, Dry....................................................................................706.7 1,075.0 1,000.0 1,300.0 1,445.0 695.0 1,060.0 995.0 1,290.0 1,420.0
Lentils................................................................................97.8 85.0 100.0 110.0 250.0 97.8 83.0 95.0 108.0 246.0
Mustard Seed..........................................................................63.0 95.0 95.0 135.0 90.0 62.5 93.0 92.0 133.0 88.0
Beans, Dry..........................................................................45.3 45.0 40.0 55.0 40.0 41.0 43.0 40.0 53.0 38.0
Fababeans………………………… 0.0 0.0 0.0 75.0 80.0 0.0 0.0 0.0 75.0 77.0
Triticale..........................................................................40.8 25.0 25.0 30.0 35.0 18.0 17.0 13.0 15.0 10.0
Fodder Corn.......................................................................95.9 70.0 80.0 80.0 90.0 85.0 50.0 65.0 60.0 65.0
Sugar Beets.......................................................................33.3 25.0 22.0 20.0 18.0 30.0 25.0 22.0 20.0 18.0
Tame Hay................................................................................5,245.6 4,950.0 4,975.0 4,900.0 4,875.0 4,750.0 4,600.0 4,520.0 4,595.0 4,225.0
Total..............................................................................................23,944.6 24,075.0 24,172.0 24,375.0 24,143.0 22,334.3 22,891.0 23,012.0 23,179.0 22,227.0
2011 2012 2013r 2014r 2015p 2011 2012 2013r 2014r 2015p
All Wheat (bu.)...................................................................49.1 47.7 58.5 51.7 46.2 8,839.6 8,368.8 11,301.8 9,348.9 8,290.0
Winter Wheat (bu.)...............................................................53.3 58.5 68.6 58.8 55.3 261.3 206.8 261.3 272.2 225.9
Spring Wheat (bu.)........................................................................49.5 47.6 58.7 51.8 47.2 7,957.8 7,429.9 10,169.6 8,369.1 7,247.6
Durum Wheat (bu.).....................................................................43.0 46.4 53.8 48.1 37.3 620.5 732.1 870.9 707.6 816.5
Oats (bu.)........................................................................81.9 80.0 95.1 77.4 75.0 738.7 518.2 601.5 542.9 393.3
Barley (bu.)........................................................................67.0 60.3 76.5 67.3 68.6 4,668.0 4,463.3 5,545.4 4,131.3 4,289.2
Fall Rye (bu.).....................................................................42.5 45.0 47.7 40.5 43.3 54.0 34.3 36.3 30.9 33.0
Flaxseed (bu.)........................................................................31.7 33.0 32.2 30.0 28.7 54.7 41.9 73.7 87.6 83.8
Canola (bu.)........................................................................39.5 34.3 44.0 38.0 39.7 5,347.9 5,097.2 6,168.9 5,796.9 5,443.1
Mixed Grains (bu.)......................................................................78.0 51.5 65.0 63.0 60.0 79.6 10.5 13.3 12.9 12.2
Corn for Grain (bu.)................................................................93.3 93.3 130.0 120.0 115.0 35.6 35.6 66.0 91.4 87.6
Peas, Dry (bu.)..................................................................42.6 41.9 48.8 42.0 34.0 805.6 1,208.4 1,321.3 1,475.1 1,314.5
Lentils (lbs.)...................................................................1,715.0 1,807.0 2,558.0 1,724.0 1,237.0 76.0 68.1 110.3 84.4 138.0
Mustard Seed (lbs.)..................................................................949.0 850.0 892.0 985.0 800.0 26.8 35.9 37.2 59.4 31.9
Beans, Dry (cwt.)..........................................................................23.7 22.9 26.5 27.5 27.8 44.0 44.7 48.1 66.0 47.9
Fababeans (cwt.)…………………. - - - 31.6 23.4 - - - 107.5 81.6
Triticale (bu.)..........................................................................47.2 44.1 51.2 46.0 57.0 21.6 19.1 16.9 17.5 14.5
Fodder Corn (tons)...............................................................18.0 17.3 20.0 17.3 18.9 1,388.0 784.7 1,179.3 943.5 1,115.8
Sugar Beets (tons)...................................................................25.8 26.4 30.0 32.0 31.0 703.1 598.7 598.7 580.6 503.5
Tame Hay (tons)................................................................1.8 1.8 1.9 1.7 1.3 7,937.9 7,711.1 7,588.6 7,257.5 4,971.4
Total........................................................................… … … … … 30,821.1 29,040.5 34,707.3 30,634.3 26,851.3
Table 76: Alberta Principal Field Crops - Area, Yield and Production,
2011-2015
Seeded Acres - '000 Harvested Acres - '000
Yield Per Acre Production - '000 tonnes
(1) The area remaining in June after winterkill.
Source: Statistics Canada, CANSIM Database Table Numbers 001-0010 and 001-0017; and Alberta Agriculture and Forestry, Statistics and Data
Development Section
Alberta Agriculture Statistics Yearbook, 2015 - 100 -

2005
2006
2007
2008
2009
2010
20112012
2013
2014
2015
10 yr avg
Source: Statistics Canada, CANSIM Database Table Number 001-0010; and Alberta Agriculture and
Forestry, Statistics and Data Development Section
Fig. 34 Production of Alberta Wheat, Barley and Canola, 2006-2015
0.0
1.0
2.0
3.0
4.0
5.0
6.0
7.0
2006 2007 2008 2009 2010 2011 2012 2013 2014 2015
Millio
ns o
f to
nn
es
Canola
Ten-Year Average2006-2015
4.7 Million Tonnes
Alberta 2015 Production:5.4 million tonnes
or 32% of Canada's Total
4.0
5.0
6.0
7.0
8.0
9.0
10.0
11.0
12.0
2006 2007 2008 2009 2010 2011 2012 2013 2014 2015
Millio
ns o
f to
nn
es
Wheat
Ten-Year Average2006-2015
8.4 million tonnes
Alberta 2015 Production:8.3 million tonnes
or30% of Canada's Total
Barley
Ten-Year Average2006-2015
4.6 million tonnes
Alberta 2015 Production:4.3 million tonnes
or 52% of Canada's Total
2.0
3.0
4.0
5.0
6.0
7.0
8.0
2006 2007 2008 2009 2010 2011 2012 2013 2014 2015
Millio
ns o
f to
nn
es
- 101 - Alberta Agriculture Statistics Yearbook, 2015
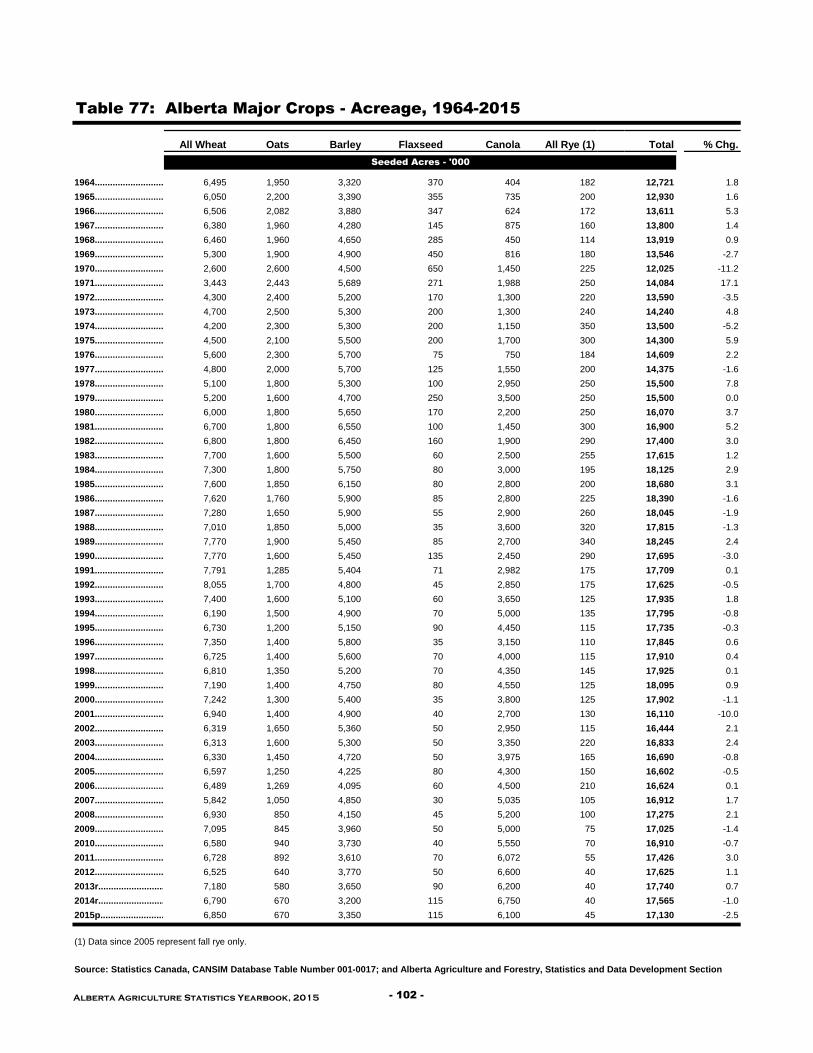
All Wheat Oats Barley Flaxseed Canola All Rye (1) Total % Chg.
1964.................................... 6,495 1,950 3,320 370 404 182 12,721 1.8
1965.................................... 6,050 2,200 3,390 355 735 200 12,930 1.6
1966.................................... 6,506 2,082 3,880 347 624 172 13,611 5.3
1967..................................... 6,380 1,960 4,280 145 875 160 13,800 1.4
1968................................... 6,460 1,960 4,650 285 450 114 13,919 0.9
1969.................................. 5,300 1,900 4,900 450 816 180 13,546 -2.7
1970.................................. 2,600 2,600 4,500 650 1,450 225 12,025 -11.2
1971..............................................3,443 2,443 5,689 271 1,988 250 14,084 17.1
1972............................................4,300 2,400 5,200 170 1,300 220 13,590 -3.5
1973............................................4,700 2,500 5,300 200 1,300 240 14,240 4.8
1974.......................................... 4,200 2,300 5,300 200 1,150 350 13,500 -5.2
1975...........................................4,500 2,100 5,500 200 1,700 300 14,300 5.9
1976........................... 5,600 2,300 5,700 75 750 184 14,609 2.2
1977..............................................4,800 2,000 5,700 125 1,550 200 14,375 -1.6
1978...........................................5,100 1,800 5,300 100 2,950 250 15,500 7.8
1979..................................................5,200 1,600 4,700 250 3,500 250 15,500 0.0
1980.................................................6,000 1,800 5,650 170 2,200 250 16,070 3.7
1981.......................................... 6,700 1,800 6,550 100 1,450 300 16,900 5.2
1982...........................................6,800 1,800 6,450 160 1,900 290 17,400 3.0
1983...........................................7,700 1,600 5,500 60 2,500 255 17,615 1.2
1984............................................7,300 1,800 5,750 80 3,000 195 18,125 2.9
1985............................................7,600 1,850 6,150 80 2,800 200 18,680 3.1
1986.............................................7,620 1,760 5,900 85 2,800 225 18,390 -1.6
1987...........................................7,280 1,650 5,900 55 2,900 260 18,045 -1.9
1988.............................................7,010 1,850 5,000 35 3,600 320 17,815 -1.3
1989............................................7,770 1,900 5,450 85 2,700 340 18,245 2.4
1990......................................... 7,770 1,600 5,450 135 2,450 290 17,695 -3.0
1991......................................... 7,791 1,285 5,404 71 2,982 175 17,709 0.1
1992...........................................8,055 1,700 4,800 45 2,850 175 17,625 -0.5
1993......................................... 7,400 1,600 5,100 60 3,650 125 17,935 1.8
1994............................................6,190 1,500 4,900 70 5,000 135 17,795 -0.8
1995......................................... 6,730 1,200 5,150 90 4,450 115 17,735 -0.3
1996...........................................7,350 1,400 5,800 35 3,150 110 17,845 0.6
1997............................................6,725 1,400 5,600 70 4,000 115 17,910 0.4
1998..................................... 6,810 1,350 5,200 70 4,350 145 17,925 0.1
1999..................................... 7,190 1,400 4,750 80 4,550 125 18,095 0.9
2000..................................... 7,242 1,300 5,400 35 3,800 125 17,902 -1.1
2001..................................... 6,940 1,400 4,900 40 2,700 130 16,110 -10.0
2002..................................... 6,319 1,650 5,360 50 2,950 115 16,444 2.1
2003..................................... 6,313 1,600 5,300 50 3,350 220 16,833 2.4
2004..................................... 6,330 1,450 4,720 50 3,975 165 16,690 -0.8
2005..................................... 6,597 1,250 4,225 80 4,300 150 16,602 -0.5
2006..................................… 6,489 1,269 4,095 60 4,500 210 16,624 0.1
2007..................................... 5,842 1,050 4,850 30 5,035 105 16,912 1.7
2008..................................... 6,930 850 4,150 45 5,200 100 17,275 2.1
2009..................................... 7,095 845 3,960 50 5,000 75 17,025 -1.4
2010..................................... 6,580 940 3,730 40 5,550 70 16,910 -0.7
2011..................................... 6,728 892 3,610 70 6,072 55 17,426 3.0
2012..................................... 6,525 640 3,770 50 6,600 40 17,625 1.1
2013r..................................... 7,180 580 3,650 90 6,200 40 17,740 0.7
2014r..................................... 6,790 670 3,200 115 6,750 40 17,565 -1.0
2015p..................................... 6,850 670 3,350 115 6,100 45 17,130 -2.5
(1) Data since 2005 represent fall rye only.
Table 77: Alberta Major Crops - Acreage, 1964-2015
Seeded Acres - '000
Source: Statistics Canada, CANSIM Database Table Number 001-0017; and Alberta Agriculture and Forestry, Statistics and Data Development Section
Alberta Agriculture Statistics Yearbook, 2015 - 102 -

All Wheat Oats Barley Flaxseed Canola All Rye (1)
1964.................................... 22.3 40.5 32.2 11.6 16.0 19.2
1965.................................... 25.3 47.3 33.9 13.8 12.9 23.0
1966.................................... 29.4 48.5 41.0 15.9 17.6 25.0
1967..................................... 22.7 40.8 32.2 11.7 13.9 19.4
1968................................... 25.7 48.0 38.3 15.1 16.7 21.1
1969.................................. 26.4 51.6 40.0 14.0 14.3 19.4
1970.................................. 27.7 57.1 42.0 16.3 17.6 23.1
1971.............................................. 26.4 51.7 39.4 12.9 16.1 24.0
1972............................................ 27.4 56.8 44.2 15.9 18.5 23.1
1973............................................ 27.0 55.5 39.0 14.5 16.5 24.2
1974.......................................... 24.3 47.1 36.9 12.5 16.3 23.7
1975........................................... 30.0 55.3 42.2 16.0 17.9 28.3
1976........................... 32.5 58.9 45.4 16.0 19.7 28.3
1977.............................................. 24.8 58.1 45.9 16.0 22.9 25.0
1978........................................... 29.8 52.4 45.1 20.0 21.0 35.2
1979.................................................. 28.5 58.4 45.9 17.6 18.1 27.6
1980................................................. 33.0 63.1 50.7 19.4 22.7 28.8
1981.......................................... 34.1 62.3 49.6 22.0 23.1 42.0
1982........................................... 32.4 62.9 49.5 20.0 22.6 31.0
1983........................................... 32.5 59.1 45.9 18.3 18.8 32.5
1984............................................ 24.6 53.9 41.0 15.0 20.0 27.7
1985............................................ 23.7 54.5 41.7 13.8 19.6 23.5
1986............................................. 34.9 72.3 59.5 22.4 25.0 37.3
1987........................................... 29.3 67.5 54.0 21.8 25.3 27.4
1988............................................. 27.7 73.8 57.2 22.9 24.2 20.5
1989............................................ 31.1 61.9 51.1 20.0 23.0 29.3
1990......................................... 33.1 62.6 56.3 22.2 23.1 25.7
1991......................................... 37.0 60.0 54.0 21.3 24.0 37.5
1992........................................... 30.6 56.0 51.3 18.8 21.6 31.1
1993......................................... 39.6 79.2 64.4 26.7 26.1 40.0
1994............................................ 33.8 67.0 55.2 22.9 21.8 35.0
1995......................................... 40.3 66.7 61.9 23.3 24.5 34.7
1996........................................... 39.8 66.7 61.3 22.9 25.0 31.5
1997............................................ 37.9 63.5 57.0 21.4 23.5 37.1
1998..................................... 37.1 62.5 56.5 22.1 25.3 32.1
1999..................................... 42.4 70.0 65.5 22.1 29.0 38.0
2000..................................... 37.7 71.0 56.3 20.0 26.1 33.4
2001..................................... 33.3 64.0 54.5 22.9 27.3 27.1
2002..................................... 28.2 53.3 42.0 20.0 21.6 25.4
2003..................................... 38.6 65.4 56.3 20.0 29.7 36.2
2004..................................... 45.6 76.7 65.4 25.6 34.2 40.7
2005..................................... 47.7 79.7 66.8 28.0 37.9 44.4
2006..................................… 43.3 65.0 59.5 26.0 33.7 40.9
2007..................................... 39.3 65.6 55.0 21.3 30.0 36.3
2008..................................... 46.9 70.2 66.7 28.9 36.9 45.0
2009..................................... 40.9 66.7 58.2 28.0 32.7 37.5
2010..................................... 46.9 79.2 66.6 31.6 38.0 44.4
2011..................................... 49.1 81.9 67.0 31.7 39.5 42.5
2012..................................... 47.7 80.0 60.3 33.0 34.3 45.0
2013r……………...................................58.5 95.1 76.5 32.2 44.0 47.7
2014r……….................................……..51.7 77.4 67.3 30.0 38.0 40.5
2015p……….................................……..46.2 75.0 68.6 28.7 39.7 43.3
(1) Data since 2005 represent fall rye only.
Table 78: Alberta Major Crops - Yield, 1964-2015
Bushels per Acre
Source: Statistics Canada, CANSIM Database Table Number 001-0017; and Alberta Agriculture and Forestry, Statistics and Data Development Section
- 103 - Alberta Agriculture Statistics Yearbook, 2015

All Wheat Oats Barley Flaxseed Canola All Rye (1) Total % Chg.
1964.................................... 3,946.0 1,218.0 2,330.0 109.2 146.5 88.9 7,838.6 1.8
1965.................................... 4,164.0 1,604.0 2,504.0 124.5 215.5 116.4 8,728.4 11.4
1966.................................... 5,198.0 1,558.0 3,462.0 139.7 249.5 109.0 10,716.2 22.8
1967..................................... 3,946.0 1,234.0 3,005.0 43.2 276.7 79.2 8,584.1 -19.9
1968................................... 4,518.0 1,450.0 3,875.0 109.2 170.1 60.7 10,183.0 18.6
1969.................................. 3,810.0 1,511.0 4,267.0 160.0 265.4 89.4 10,102.8 -0.8
1970.................................. 1,959.0 1,804.0 4,115.0 269.3 578.3 132.2 8,857.8 -12.3
1971..............................................2,477.0 1,558.0 4,877.0 88.9 725.7 152.2 9,878.8 11.5
1972............................................3,211.0 1,604.0 5,008.0 68.6 544.3 128.7 10,564.6 6.9
1973............................................3,456.0 1,712.0 4,289.0 73.7 487.6 147.2 10,165.5 -3.8
1974..........................................2,776.0 1,234.0 4,180.0 63.5 424.1 210.2 8,887.8 -12.6
1975...........................................3,674.0 1,450.0 4,964.0 81.3 691.7 216.0 11,077.0 24.6
1976........................... 4,953.0 1,635.0 5,487.0 30.5 335.7 131.7 12,572.9 13.5
1977..............................................3,239.0 1,388.0 5,443.0 50.8 805.1 126.7 11,052.6 -12.1
1978...........................................4,136.0 1,172.0 4,964.0 50.8 1,406.1 223.2 11,952.1 8.1
1979..................................................4,028.0 1,126.0 4,550.0 111.8 1,440.2 175.7 11,431.7 -4.4
1980.................................................5,389.0 1,265.0 6,075.0 83.8 1,134.0 183.3 14,130.1 23.6
1981..........................................6,221.0 1,249.0 6,967.0 55.9 759.8 319.8 15,572.5 10.2
1982...........................................5,988.0 1,357.0 6,575.0 81.3 975.2 228.2 15,204.7 -2.4
1983...........................................6,804.0 1,049.0 5,095.0 27.9 1,066.0 210.4 14,252.3 -6.3
1984............................................4,883.0 956.0 4,638.0 30.5 1,361.0 137.4 12,005.9 -15.8
1985............................................4,899.0 925.0 4,768.0 27.9 1,247.0 119.4 11,986.3 -0.2
1986.............................................7,212.3 1,449.7 7,184.9 48.3 1,587.6 142.2 17,625.0 47.0
1987...........................................5,796.6 1,249.2 6,586.2 30.5 1,667.0 121.9 15,451.4 -12.3
1988.............................................5,233.4 1,650.2 5,856.8 20.3 1,973.1 99.1 14,832.9 -4.0
1989............................................6,457.4 1,480.5 5,726.2 43.2 1,406.1 152.4 15,265.8 2.9
1990.........................................6,994.8 1,110.4 6,248.7 76.2 1,281.4 91.4 15,802.9 3.5
1991.........................................7,772.7 786.5 5,878.6 38.1 1,621.6 76.2 16,173.7 2.3
1992...........................................6,327.6 1,036.4 4,855.3 19.1 1,349.4 75.0 13,662.8 -15.5
1993.........................................7,620.2 1,465.1 6,314.0 40.6 2,154.6 81.3 17,675.8 29.4
1994............................................5,592.7 1,187.5 5,464.9 40.6 2,472.1 88.9 14,846.7 -16.0
1995.........................................7,266.5 771.1 6,335.8 53.3 2,449.4 66.1 16,942.2 14.1
1996...........................................7,789.1 1,079.5 7,076.0 20.3 1,701.0 64.1 17,730.0 4.6
1997............................................6,839.3 979.3 6,270.5 38.1 2,109.2 66.1 16,302.5 -8.1
1998..................................... 6,752.3 771.1 5,660.8 39.4 2,472.1 77.5 15,773.2 -3.2
1999..................................... 8,219.2 863.6 5,987.4 39.4 2,971.0 72.4 18,153.0 15.1
2000..................................... 7,123.7 657.0 5,268.9 17.8 2,188.6 42.5 15,298.5 -15.7
2001..................................... 5,864.9 592.2 4,746.4 20.3 1,655.6 58.4 12,937.8 -15.4
2002..................................... 3,522.4 370.1 2,547.4 20.3 1,224.7 16.1 7,701.0 -40.5
2003..................................... 6,429.6 826.6 5,421.3 25.4 2,222.6 82.8 15,008.3 94.9
2004..................................... 7,571.4 828.2 5,628.2 29.2 2,925.7 77.5 17,060.2 13.7
2005..................................... 8,371.4 829.7 5,231.9 53.3 3,651.4 79.0 18,216.7 6.8
2006..................................… 7,503.4 706.3 4,404.6 36.3 3,424.6 57.2 16,132.4 -11.4
2007.................................... 6,076.1 627.4 5,114.3 16.3 3,401.9 36.8 15,272.8 -5.3
2008..................................... 8,736.2 541.3 5,447.5 33.0 4,322.7 57.2 19,137.9 25.3
2009..................................... 7,440.7 308.4 3,840.7 28.4 3,628.7 38.1 15,285.0 -20.1
2010..................................... 8,201.3 647.7 4,528.7 30.5 4,740.0 50.8 18,199.0 19.1
2011..................................... 8,839.6 738.7 4,668.0 54.7 5,347.9 54.0 19,702.9 8.3
2012..................................... 8,368.8 518.2 4,463.3 41.9 5,097.2 34.3 18,523.7 -6.0
2013r.....................................11,301.8 601.5 5,545.4 73.7 6,168.9 36.3 23,727.6 28.1
2014r.....................................9,348.9 542.9 4,131.3 87.6 5,796.9 30.9 19,938.5 -16.0
2015p.....................................8,290.0 393.3 4,289.2 83.8 5,443.1 33.0 18,532.4 -7.1
(1) Data since 2005 represent fall rye only.
Table 79: Alberta Major Crops - Production, 1964-2015
'000 tonnes
Source: Statistics Canada, CANSIM Database Table Number 001-0010; and Alberta Agriculture and Forestry, Statistics and Data Development Section
Alberta Agriculture Statistics Yearbook, 2015 - 104 -
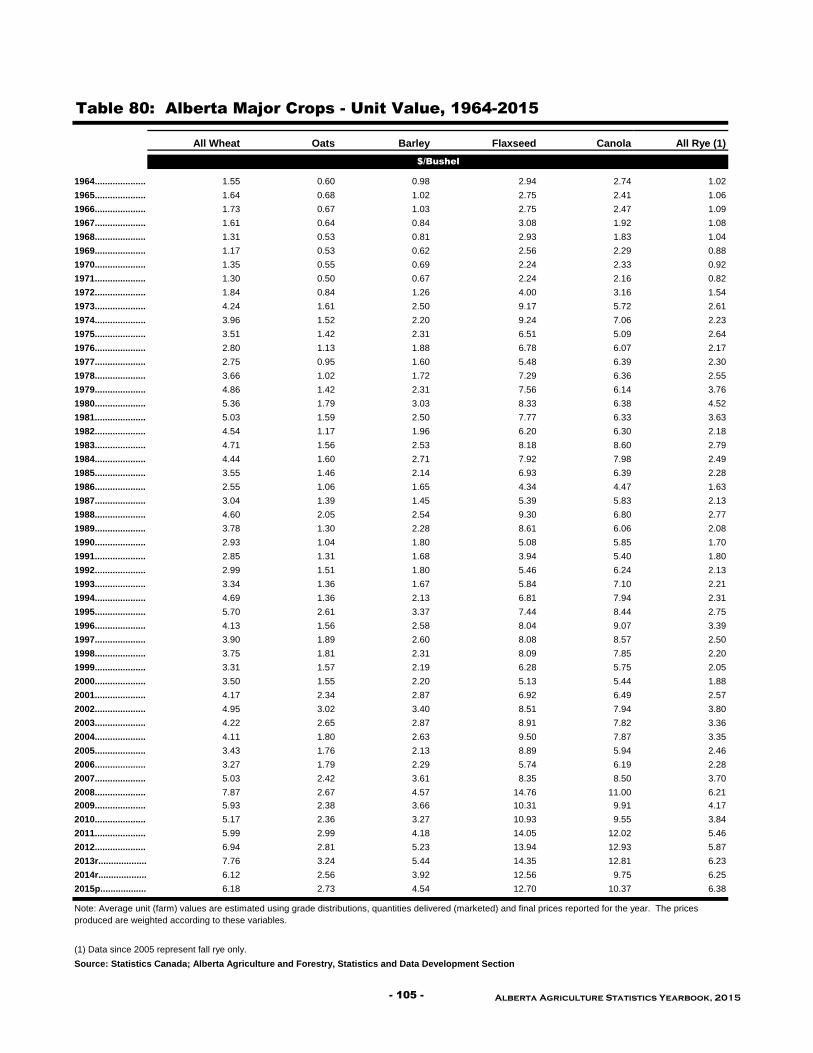
All Wheat Oats Barley Flaxseed Canola All Rye (1)
1964.................................... 1.55 0.60 0.98 2.94 2.74 1.02
1965.................................... 1.64 0.68 1.02 2.75 2.41 1.06
1966.................................... 1.73 0.67 1.03 2.75 2.47 1.09
1967..................................... 1.61 0.64 0.84 3.08 1.92 1.08
1968................................... 1.31 0.53 0.81 2.93 1.83 1.04
1969.................................. 1.17 0.53 0.62 2.56 2.29 0.88
1970.................................. 1.35 0.55 0.69 2.24 2.33 0.92
1971.............................................. 1.30 0.50 0.67 2.24 2.16 0.82
1972............................................ 1.84 0.84 1.26 4.00 3.16 1.54
1973............................................ 4.24 1.61 2.50 9.17 5.72 2.61
1974.......................................... 3.96 1.52 2.20 9.24 7.06 2.23
1975........................................... 3.51 1.42 2.31 6.51 5.09 2.64
1976........................... 2.80 1.13 1.88 6.78 6.07 2.17
1977.............................................. 2.75 0.95 1.60 5.48 6.39 2.30
1978........................................... 3.66 1.02 1.72 7.29 6.36 2.55
1979..................................................4.86 1.42 2.31 7.56 6.14 3.76
1980................................................. 5.36 1.79 3.03 8.33 6.38 4.52
1981.......................................... 5.03 1.59 2.50 7.77 6.33 3.63
1982........................................... 4.54 1.17 1.96 6.20 6.30 2.18
1983........................................... 4.71 1.56 2.53 8.18 8.60 2.79
1984............................................ 4.44 1.60 2.71 7.92 7.98 2.49
1985............................................ 3.55 1.46 2.14 6.93 6.39 2.28
1986............................................. 2.55 1.06 1.65 4.34 4.47 1.63
1987........................................... 3.04 1.39 1.45 5.39 5.83 2.13
1988............................................. 4.60 2.05 2.54 9.30 6.80 2.77
1989............................................ 3.78 1.30 2.28 8.61 6.06 2.08
1990......................................... 2.93 1.04 1.80 5.08 5.85 1.70
1991......................................... 2.85 1.31 1.68 3.94 5.40 1.80
1992........................................... 2.99 1.51 1.80 5.46 6.24 2.13
1993......................................... 3.34 1.36 1.67 5.84 7.10 2.21
1994............................................ 4.69 1.36 2.13 6.81 7.94 2.31
1995......................................... 5.70 2.61 3.37 7.44 8.44 2.75
1996........................................... 4.13 1.56 2.58 8.04 9.07 3.39
1997............................................ 3.90 1.89 2.60 8.08 8.57 2.50
1998..................................... 3.75 1.81 2.31 8.09 7.85 2.20
1999..................................... 3.31 1.57 2.19 6.28 5.75 2.05
2000..................................... 3.50 1.55 2.20 5.13 5.44 1.88
2001..................................... 4.17 2.34 2.87 6.92 6.49 2.57
2002..................................... 4.95 3.02 3.40 8.51 7.94 3.80
2003..................................... 4.22 2.65 2.87 8.91 7.82 3.36
2004..................................... 4.11 1.80 2.63 9.50 7.87 3.35
2005..................................... 3.43 1.76 2.13 8.89 5.94 2.46
2006..................................… 3.27 1.79 2.29 5.74 6.19 2.28
2007..................................... 5.03 2.42 3.61 8.35 8.50 3.70
2008..................................... 7.87 2.67 4.57 14.76 11.00 6.21
2009..................................... 5.93 2.38 3.66 10.31 9.91 4.17
2010..................................... 5.17 2.36 3.27 10.93 9.55 3.84
2011..................................... 5.99 2.99 4.18 14.05 12.02 5.46
2012..................................... 6.94 2.81 5.23 13.94 12.93 5.87
2013r..................................... 7.76 3.24 5.44 14.35 12.81 6.23
2014r..................................... 6.12 2.56 3.92 12.56 9.75 6.25
2015p..................................... 6.18 2.73 4.54 12.70 10.37 6.38
(1) Data since 2005 represent fall rye only.
Table 80: Alberta Major Crops - Unit Value, 1964-2015
$/Bushel
Note: Average unit (farm) values are estimated using grade distributions, quantities delivered (marketed) and final prices reported for the year. The prices
produced are weighted according to these variables.
Source: Statistics Canada; Alberta Agriculture and Forestry, Statistics and Data Development Section
- 105 - Alberta Agriculture Statistics Yearbook, 2015
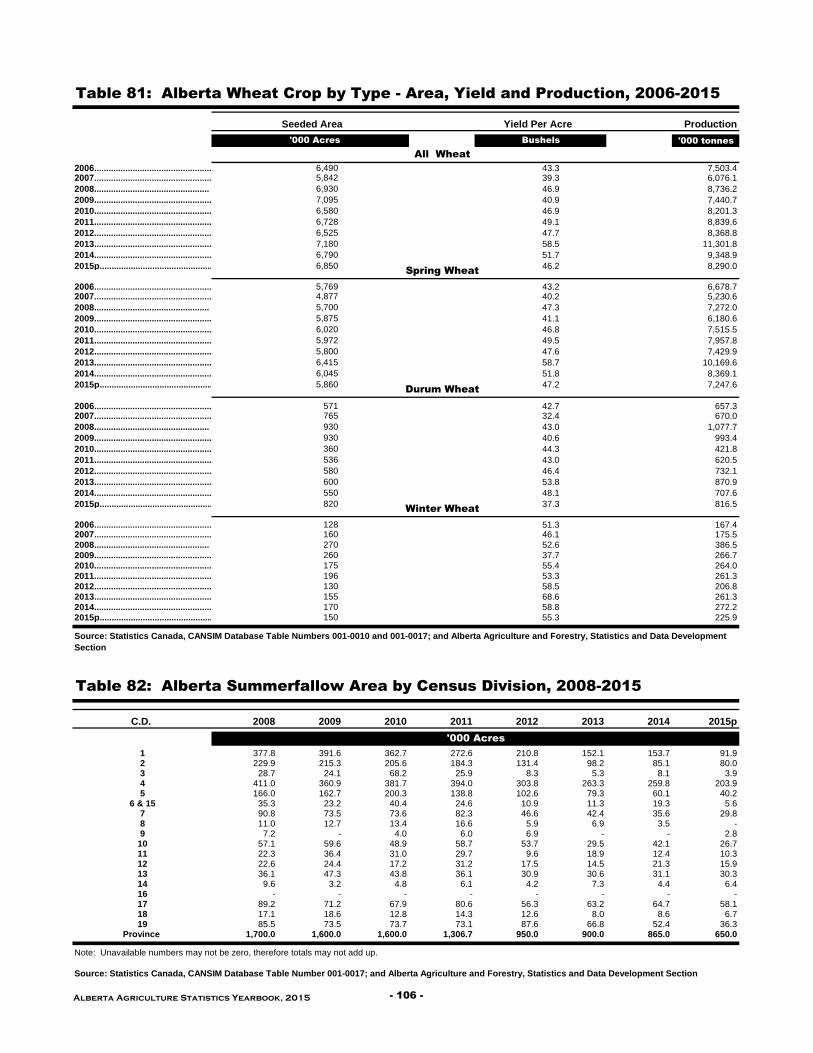
Seeded Area Production
'000 tonnes
2006.........................................................…….… 43.3 7,503.42007.........................................................…….… 39.3 6,076.1
2008................................................ 46.9 8,736.2
2009................................................................... 40.9 7,440.7
2010................................................................................... 46.9 8,201.3
2011................................................................ 49.1 8,839.6
2012................................................................ 47.7 8,368.8
2013................................................................ 58.5 11,301.8
2014................................................................................................................................................................................................................................................................................................................................................................................................................................................................................................................................................................................51.7 9,348.9
2015p................................................................................................................................................................................................................................................................................................................................................................................................................................................................................................................................................................................46.2 8,290.0
2006.........................................................…….… 43.2 6,678.72007.......................................................…….… 40.2 5,230.6
2008................................................ 47.3 7,272.0
2009................................................................... 41.1 6,180.6
2010................................................................................... 46.8 7,515.5
2011................................................................ 49.5 7,957.8
2012.............................................................. 47.6 7,429.9
2013................................................................ 58.7 10,169.6
2014................................................................................................................................................................................................................................................................................................................................................................................................................................................................................................................................................................................51.8 8,369.1
2015p........................................................... 47.2 7,247.6
2006.........................................................…….… 42.7 657.32007.........................................................…….… 32.4 670.0
2008................................................ 43.0 1,077.7
2009................................................................... 40.6 993.4
2010................................................................................... 44.3 421.8
2011................................................................ 43.0 620.5
2012................................................................ 46.4 732.1
2013................................................................ 53.8 870.9
2014................................................................................................................................................................................................................................................................................................................................................................................................................................................................................................................................................................................48.1 707.6
2015p........................................................... 37.3 816.5
2006..............................................................................................................................................................................................................................................................................................................................................................................................................................................................................................................................................................................................................................................................................................................................................................................................................................……..............…51.3 167.42007.........................................................…….… 46.1 175.5
2008................................................ 52.6 386.5
2009................................................................... 37.7 266.7
2010................................................................................... 55.4 264.0
2011................................................................ 53.3 261.3
2012................................................................ 58.5 206.8
2013................................................................ 68.6 261.3
2014................................................................................................................................................................................................................................................................................................................................................................................................................................................................................................................................................................................58.8 272.2
2015p...................................................... 55.3 225.9
C.D. 2008 2009 2010 2011 2012 2013 2014 2015p
1 377.8 391.6 362.7 272.6 210.8 152.1 153.7 91.92 229.9 215.3 205.6 184.3 131.4 98.2 85.1 80.03 28.7 24.1 68.2 25.9 8.3 5.3 8.1 3.94 411.0 360.9 381.7 394.0 303.8 263.3 259.8 203.95 166.0 162.7 200.3 138.8 102.6 79.3 60.1 40.2
6 & 15 35.3 23.2 40.4 24.6 10.9 11.3 19.3 5.67 90.8 73.5 73.6 82.3 46.6 42.4 35.6 29.88 11.0 12.7 13.4 16.6 5.9 6.9 3.5 -9 7.2 - 4.0 6.0 6.9 - - 2.8
10 57.1 59.6 48.9 58.7 53.7 29.5 42.1 26.711 22.3 36.4 31.0 29.7 9.6 18.9 12.4 10.312 22.6 24.4 17.2 31.2 17.5 14.5 21.3 15.913 36.1 47.3 43.8 36.1 30.9 30.6 31.1 30.314 9.6 3.2 4.8 6.1 4.2 7.3 4.4 6.416 - - - - - - - -17 89.2 71.2 67.9 80.6 56.3 63.2 64.7 58.118 17.1 18.6 12.8 14.3 12.6 8.0 8.6 6.719 85.5 73.5 73.7 73.1 87.6 66.8 52.4 36.3
Province 1,700.0 1,600.0 1,600.0 1,306.7 950.0 900.0 865.0 650.02035
Note: Unavailable numbers may not be zero, therefore totals may not add up.
Source: Statistics Canada, CANSIM Database Table Numbers 001-0010 and 001-0017; and Alberta Agriculture and Forestry, Statistics and Data Development
Section
Table 82: Alberta Summerfallow Area by Census Division, 2008-2015
'000 Acres
Source: Statistics Canada, CANSIM Database Table Number 001-0017; and Alberta Agriculture and Forestry, Statistics and Data Development Section
Table 81: Alberta Wheat Crop by Type - Area, Yield and Production, 2006-2015
Yield Per Acre
'000 Acres Bushels
All Wheat
Spring Wheat
Durum Wheat
Winter Wheat
6,4905,842
6,930
7,095
6,580
6,728
6,525
7,180
6,790
6,850
5,7694,877
5,700
5,875
6,020
5,972
5,800
6,415
6,045
5,860
571765
930
930
360
536
580
600
550
820
128
155
170
150
160
270
260
175
196
130
Alberta Agriculture Statistics Yearbook, 2015 - 106 -

C.D. 2006 2007 2008 2009 2010 2011 2012 2013 2014 2015p
1 635.8 575.1 698.9 659.3 605.0 582.5 582.9 612.4 594.1 591.9
2 747.2 717.0 782.8 796.8 575.3 744.7 712.3 746.7 679.9 728.0
3 302.0 238.4 299.7 254.9 179.1 293.6 195.3 252.1 228.7 259.9
4 443.4 348.8 467.4 379.6 397.2 397.0 405.2 457.9 363.8 361.7
5 1,103.6 964.2 1,174.9 1,119.7 1,160.5 994.8 998.7 939.0 935.8 861.0
6 & 15 287.7 252.0 287.1 309.5 292.0 267.6 243.7 303.2 338.6 310.9
7 711.2 611.0 730.1 829.0 723.9 741.8 686.1 790.8 769.7 779.4
8 173.0 159.8 219.2 232.5 243.8 205.5 213.4 281.9 243.8 214.8
9 5.9 - - - - 7.0 - - 17.6 18.1
10 788.9 775.6 849.0 888.8 868.9 919.3 890.4 964.0 865.9 913.1
11 281.9 335.8 343.5 355.3 297.3 300.9 330.7 356.5 326.1 367.4
12 73.9 61.8 84.0 65.3 72.0 95.4 110.9 159.7 115.5 87.1
13 156.8 138.5 180.2 238.6 204.4 227.5 250.6 240.7 242.8 291.4
14 6.4 - 7.9 7.6 14.6 9.9 11.0 6.7 - -
16 - - - - - - - - - -
17 208.5 158.7 270.6 280.1 290.8 278.4 275.4 443.7 443.3 340.0
18 37.1 33.3 25.5 48.9 21.3 61.7 38.5 24.1 22.1 21.9
19 495.8 397.8 474.9 597.2 582.3 632.6 576.2 584.4 592.4 686.2
Province 6,489.5 5,842.0 6,930.0 7,095.0 6,580.0 6,727.6 6,525.0 7,180.0 6,790.0 6,850.0
1 38.3 29.2 39.2 43.4 44.1 41.8 46.0 50.6 48.6 35.0
2 49.6 37.2 52.0 47.7 50.9 45.0 53.5 60.4 60.8 50.9
3 43.1 39.4 47.3 45.3 48.2 24.3 50.2 62.9 55.2 57.8
4 28.7 27.2 32.3 29.4 33.1 33.7 35.7 45.7 40.1 27.2
5 45.7 43.1 50.5 38.0 47.8 55.9 46.3 59.0 45.8 46.0
6 & 15 54.1 45.9 56.8 47.6 58.6 66.5 55.1 67.9 60.5 63.1
7 38.2 31.0 39.5 32.6 43.0 45.6 42.4 52.2 47.0 38.3
8 51.8 54.0 64.9 53.9 63.8 56.0 56.6 72.8 66.4 70.9
9 - - - - - - - - - -
10 39.2 36.8 47.2 40.1 49.0 45.7 45.2 58.4 53.6 44.6
11 50.0 50.6 61.4 43.6 58.5 57.3 52.4 70.8 64.1 51.5
12 41.5 41.2 57.4 45.2 54.6 38.6 55.6 70.3 60.7 44.3
13 63.2 61.0 68.4 51.7 65.5 70.8 62.1 77.4 69.1 55.9
14 17.9 - 47.6 50.4 67.8 70.5 52.5 67.6 - -
16 - - - - - - - - - -
17 40.8 43.8 42.3 40.3 40.3 58.4 42.5 54.9 43.1 34.1
18 40.5 48.5 33.5 29.2 25.8 33.5 42.4 41.3 38.8 41.3
19 42.1 46.0 34.6 35.2 31.2 57.3 48.3 53.0 42.8 48.7
Province 43.3 39.3 46.9 40.9 46.9 49.1 47.7 58.5 51.7 46.2
1 655.0 453.8 728.9 771.4 710.3 655.6 723.6 830.6 735.7 546.1
2 996.8 711.3 1,094.8 1,018.5 752.1 888.4 1,015.2 1,190.9 1,072.3 974.2
3 350.9 250.7 383.0 307.0 218.7 186.3 253.7 404.7 330.8 400.9
4 326.4 240.0 408.4 185.9 349.8 360.6 388.0 563.6 387.3 210.2
5 1,351.6 1,104.6 1,585.5 1,109.1 1,490.0 1,513.6 1,238.9 1,507.6 1,148.2 1,048.5
6 & 15 420.4 300.3 443.9 355.4 458.9 482.0 355.0 550.0 546.3 528.9
7 722.1 505.8 780.6 661.4 838.3 906.5 785.4 1,105.5 963.0 777.1
8 238.0 226.5 384.1 332.8 416.1 306.7 328.3 550.8 430.9 384.6
9 - - - - - - - - 24.7 37.4
10 832.7 771.8 1,091.7 960.1 1,150.6 1,110.6 1,087.5 1,521.9 1,257.5 1,099.0
11 377.2 454.9 573.7 410.0 465.6 455.2 465.7 683.4 568.5 496.9
12 82.7 69.3 131.3 78.3 106.1 99.2 167.6 305.1 186.7 102.8
13 267.6 229.2 335.5 334.0 363.5 434.6 421.7 505.8 455.3 435.1
14 3.1 - 10.3 10.5 26.3 17.5 15.7 12.0 - -
16 - - - - - - - - - -
17 227.0 189.3 311.7 303.8 318.2 441.5 317.8 661.9 516.4 298.8
18 40.9 44.0 23.2 38.9 15.0 55.4 44.0 27.1 23.4 24.6
19 564.8 498.0 444.9 561.0 486.7 973.6 755.2 841.3 687.5 900.3
Province 7,503.4 6,076.1 8,736.2 7,440.7 8,201.3 8,839.6 8,368.8 11,301.8 9,348.9 8,290.0
Source: Statistics Canada, CANSIM Database Table Numbers 001-0010 and 001-0017; and Alberta Agriculture and Forestry, Statistics and Data
Development Section
Table 83: All Wheat Acreage and Production for Alberta Census Divisions,
2006-2015
Seeded Acres - '000
Yield per Acre - Bushels
Production - '000 tonnes
Note: Unavailable numbers may not be zero, therefore totals may not add up.
- 107 - Alberta Agriculture Statistics Yearbook, 2015

C.D. 2006 2007 2008 2009 2010 2011 2012 2013 2014 2015p
1 459.0 336.7 351.4 297.7 466.2 395.2 364.9 393.8 385.4 295.0
2 500.8 383.4 384.7 394.2 410.5 498.3 448.4 488.4 424.2 370.2
3 247.4 157.9 184.1 166.8 156.7 234.2 147.5 180.2 162.7 196.5
4 371.9 263.2 338.7 296.0 349.7 320.1 318.8 341.6 294.3 226.8
5 1,017.9 861.2 1,014.1 965.7 1,096.3 932.7 927.7 878.0 862.8 766.6
6 & 15 282.6 237.6 271.9 294.8 280.4 256.6 240.3 293.2 327.8 279.5
7 696.6 597.1 712.2 807.4 701.1 729.4 673.4 780.9 758.1 777.2
8 165.7 156.9 212.8 230.2 239.1 200.1 212.1 279.2 240.0 212.9
9 5.8 - - - - 6.2 - - 17.5 18.1
10 781.1 761.9 848.0 875.8 853.6 905.4 884.9 960.4 854.2 913.2
11 272.2 319.5 337.1 339.9 289.6 292.7 328.6 352.1 321.9 367.3
12 73.3 61.1 84.0 65.3 71.3 93.8 110.6 158.7 113.7 87.1
13 153.0 134.8 180.2 236.5 203.2 223.2 249.3 240.1 237.7 290.5
14 5.8 - 7.1 7.6 14.2 8.9 10.8 6.7 - -
16 - - - - - - - - - -
17 198.5 155.3 270.6 277.3 286.2 273.8 272.9 441.9 438.5 340.1
18 37.0 32.9 25.5 48.9 21.0 57.8 38.4 24.1 22.0 21.9
19 484.5 384.1 469.4 569.4 558.6 611.7 567.9 579.7 574.6 679.8
Province 5,768.7 4,877.0 5,700.0 5,875.0 6,020.0 5,971.6 5,800.0 6,415.0 6,045.0 5,860.0
1 37.1 28.3 35.0 43.7 42.5 36.5 45.0 49.1 50.6 36.3
2 49.7 42.3 57.2 54.9 51.7 46.6 54.2 59.7 62.4 57.3
3 42.4 38.7 44.9 45.4 47.5 21.9 48.8 61.2 51.7 57.2
4 27.8 26.8 30.7 27.3 32.9 31.4 33.8 44.4 39.5 29.9
5 45.9 42.6 50.9 38.9 47.6 55.6 46.6 59.5 46.0 46.1
6 & 15 54.1 45.8 57.3 48.0 59.0 66.8 55.0 68.6 60.5 66.1
7 38.3 31.0 39.6 32.8 42.8 45.6 42.5 52.3 47.2 38.1
8 51.8 54.1 65.5 54.2 63.8 56.3 56.7 72.9 66.4 70.5
9 - - - - - - - - 57.8 75.4
10 39.2 36.8 47.2 40.3 48.8 46.0 45.3 58.4 53.7 44.4
11 49.9 50.8 61.2 43.5 58.9 58.4 52.5 70.9 64.4 51.3
12 41.5 41.2 57.3 45.2 54.7 39.1 55.6 70.5 61.0 44.1
13 63.7 60.9 68.1 51.8 65.6 71.9 62.1 77.4 69.7 55.7
14 19.2 - 47.7 50.4 67.8 77.3 52.7 67.6 - -
16 - - - - - - - - - -
17 40.9 43.8 42.0 40.3 40.3 58.8 42.8 54.9 43.1 33.9
18 40.7 48.5 33.7 29.1 25.7 35.4 42.4 41.3 38.9 41.1
19 42.1 45.9 34.4 35.4 30.9 56.9 48.2 53.0 42.8 48.4
Province 43.2 40.2 47.3 41.1 46.8 49.5 47.6 58.7 51.8 47.2
1 459.2 257.8 324.8 349.4 525.7 389.5 445.8 523.6 503.8 278.5
2 666.6 439.1 589.0 573.6 542.5 619.0 645.3 781.3 678.3 550.4
3 284.7 165.1 224.8 204.9 187.7 137.4 184.8 285.8 225.1 301.2
4 263.2 177.8 279.9 122.7 304.4 269.7 287.9 408.9 308.2 129.7
5 1,253.4 974.5 1,390.4 972.8 1,394.6 1,408.8 1,155.4 1,419.9 1,063.7 936.3
6 & 15 413.4 282.4 423.8 338.3 448.2 465.8 349.7 537.6 529.5 500.9
7 709.6 495.2 761.4 651.1 805.4 890.5 774.1 1,097.5 951.6 772.5
8 227.9 222.4 376.6 329.8 410.9 301.3 327.0 547.3 424.3 381.7
9 - - - - - - - - 24.6 37.3
10 824.3 757.2 1,087.3 946.1 1,124.2 1,097.5 1,082.6 1,516.8 1,243.9 1,095.2
11 363.1 433.5 561.4 390.2 455.5 450.6 463.8 676.6 564.3 495.1
12 82.0 68.5 131.0 78.0 104.8 98.6 167.3 303.8 184.7 102.5
13 263.3 222.4 333.8 330.6 360.3 432.0 419.7 504.7 451.0 432.7
14 3.0 - 9.3 10.4 26.2 17.3 15.4 12.0 - -
16 - - - - - - - - - -
17 216.1 185.3 309.0 302.2 313.5 436.6 317.3 659.7 511.1 297.8
18 40.7 43.5 23.2 38.7 14.7 55.1 43.9 27.1 23.3 24.5
19 552.1 478.7 434.6 539.4 461.8 937.4 744.6 836.6 667.6 887.0
Province 6,678.7 5,230.6 7,272.0 6,180.6 7,515.5 7,957.8 7,429.9 10,169.6 8,369.1 7,247.6
Source: Statistics Canada, CANSIM Database Table Numbers 001-0010 and 001-0017; and Alberta Agriculture and Forestry, Statistics and Data
Development Section
Table 84: Spring Wheat Acreage and Production for Alberta Census Divisions,
2006-2015
Seeded Acres - '000
Yield per Acre - Bushels
Production - '000 tonnes
Note: Unavailable numbers may not be zero, therefore totals may not add up.
Alberta Agriculture Statistics Yearbook, 2015 - 108 -
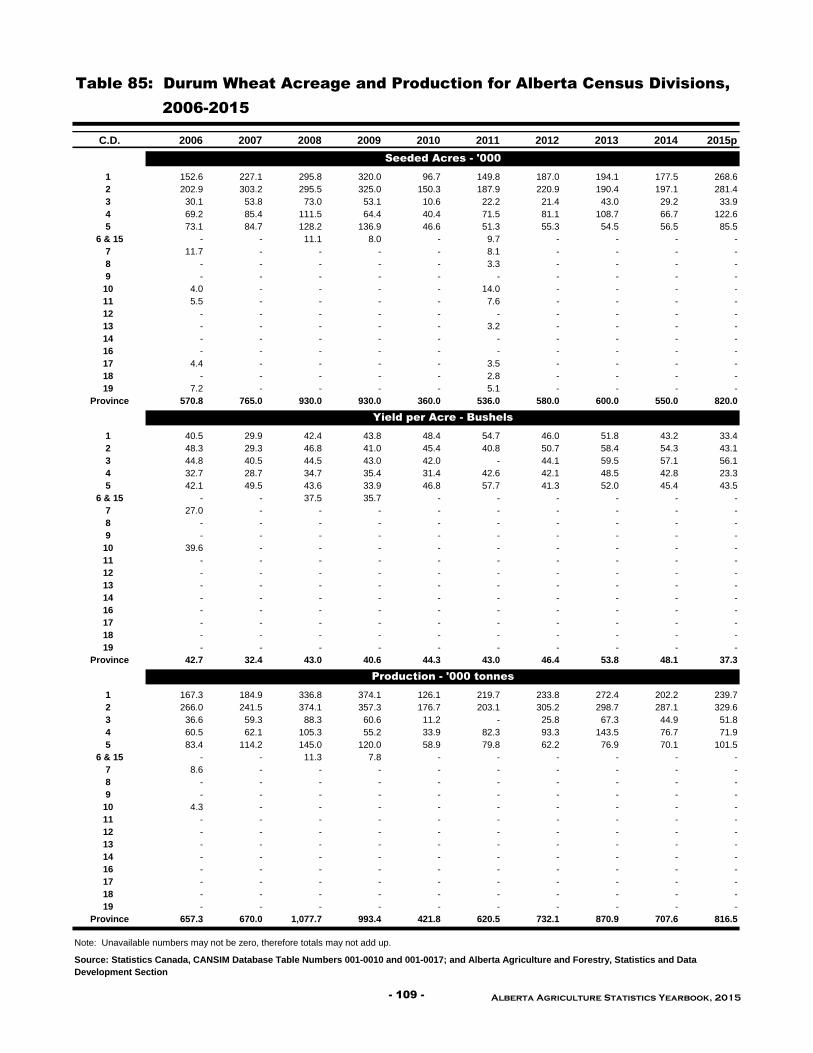
C.D. 2006 2007 2008 2009 2010 2011 2012 2013 2014 2015p
1 152.6 227.1 295.8 320.0 96.7 149.8 187.0 194.1 177.5 268.6
2 202.9 303.2 295.5 325.0 150.3 187.9 220.9 190.4 197.1 281.4
3 30.1 53.8 73.0 53.1 10.6 22.2 21.4 43.0 29.2 33.9
4 69.2 85.4 111.5 64.4 40.4 71.5 81.1 108.7 66.7 122.6
5 73.1 84.7 128.2 136.9 46.6 51.3 55.3 54.5 56.5 85.5
6 & 15 - - 11.1 8.0 - 9.7 - - - -
7 11.7 - - - - 8.1 - - - -
8 - - - - - 3.3 - - - -
9 - - - - - - - - - -
10 4.0 - - - - 14.0 - - - -
11 5.5 - - - - 7.6 - - - -
12 - - - - - - - - - -
13 - - - - - 3.2 - - - -
14 - - - - - - - - - -
16 - - - - - - - - - -
17 4.4 - - - - 3.5 - - - -
18 - - - - - 2.8 - - - -
19 7.2 - - - - 5.1 - - - -
Province 570.8 765.0 930.0 930.0 360.0 536.0 580.0 600.0 550.0 820.0
1 40.5 29.9 42.4 43.8 48.4 54.7 46.0 51.8 43.2 33.4
2 48.3 29.3 46.8 41.0 45.4 40.8 50.7 58.4 54.3 43.1
3 44.8 40.5 44.5 43.0 42.0 - 44.1 59.5 57.1 56.1
4 32.7 28.7 34.7 35.4 31.4 42.6 42.1 48.5 42.8 23.3
5 42.1 49.5 43.6 33.9 46.8 57.7 41.3 52.0 45.4 43.5
6 & 15 - - 37.5 35.7 - - - - - -
7 27.0 - - - - - - - - -
8 - - - - - - - - - -
9 - - - - - - - - - -
10 39.6 - - - - - - - - -
11 - - - - - - - - - -
12 - - - - - - - - - -
13 - - - - - - - - - -
14 - - - - - - - - - -
16 - - - - - - - - - -
17 - - - - - - - - - -
18 - - - - - - - - - -
19 - - - - - - - - - -
Province 42.7 32.4 43.0 40.6 44.3 43.0 46.4 53.8 48.1 37.3
1 167.3 184.9 336.8 374.1 126.1 219.7 233.8 272.4 202.2 239.7
2 266.0 241.5 374.1 357.3 176.7 203.1 305.2 298.7 287.1 329.6
3 36.6 59.3 88.3 60.6 11.2 - 25.8 67.3 44.9 51.8
4 60.5 62.1 105.3 55.2 33.9 82.3 93.3 143.5 76.7 71.9
5 83.4 114.2 145.0 120.0 58.9 79.8 62.2 76.9 70.1 101.5
6 & 15 - - 11.3 7.8 - - - - - -
7 8.6 - - - - - - - - -
8 - - - - - - - - - -
9 - - - - - - - - - -
10 4.3 - - - - - - - - -
11 - - - - - - - - - -
12 - - - - - - - - - -
13 - - - - - - - - - -
14 - - - - - - - - - -
16 - - - - - - - - - -
17 - - - - - - - - - -
18 - - - - - - - - - -
19 - - - - - - - - - -
Province 657.3 670.0 1,077.7 993.4 421.8 620.5 732.1 870.9 707.6 816.5
Source: Statistics Canada, CANSIM Database Table Numbers 001-0010 and 001-0017; and Alberta Agriculture and Forestry, Statistics and Data
Development Section
Table 85: Durum Wheat Acreage and Production for Alberta Census Divisions,
2006-2015
Seeded Acres - '000
Yield per Acre - Bushels
Production - '000 tonnes
Note: Unavailable numbers may not be zero, therefore totals may not add up.
- 109 - Alberta Agriculture Statistics Yearbook, 2015
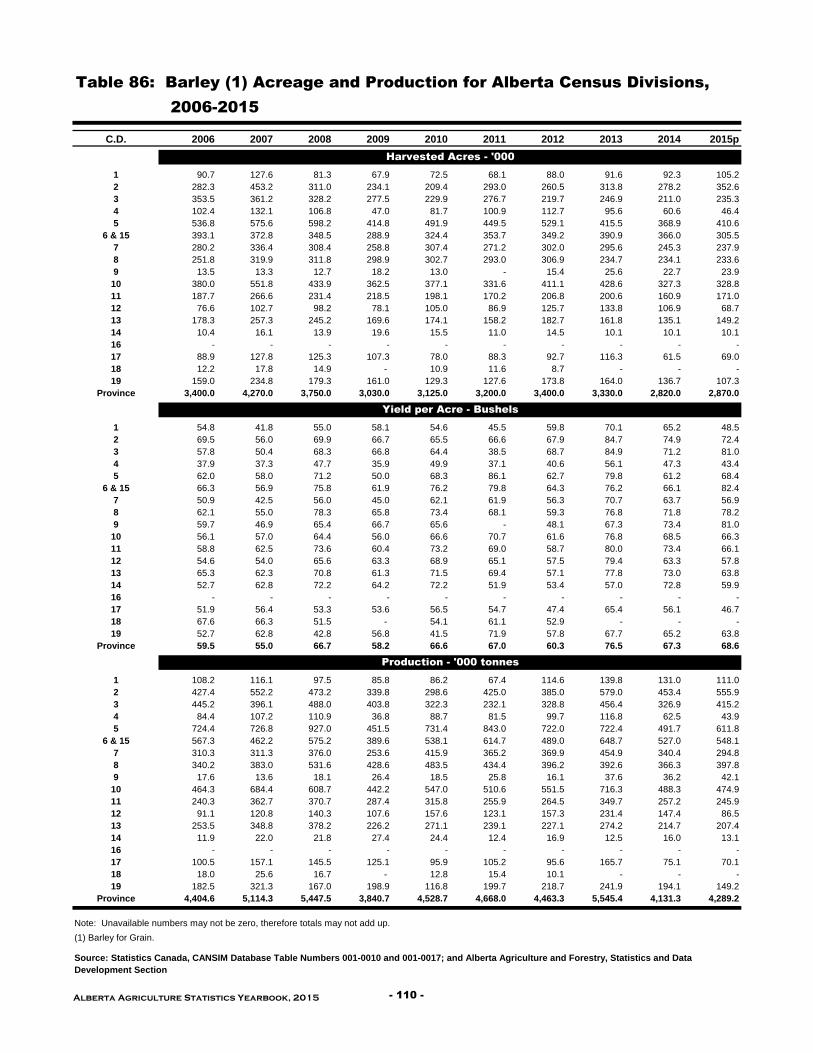
C.D. 2006 2007 2008 2009 2010 2011 2012 2013 2014 2015p
1 90.7 127.6 81.3 67.9 72.5 68.1 88.0 91.6 92.3 105.2
2 282.3 453.2 311.0 234.1 209.4 293.0 260.5 313.8 278.2 352.6
3 353.5 361.2 328.2 277.5 229.9 276.7 219.7 246.9 211.0 235.3
4 102.4 132.1 106.8 47.0 81.7 100.9 112.7 95.6 60.6 46.4
5 536.8 575.6 598.2 414.8 491.9 449.5 529.1 415.5 368.9 410.6
6 & 15 393.1 372.8 348.5 288.9 324.4 353.7 349.2 390.9 366.0 305.5
7 280.2 336.4 308.4 258.8 307.4 271.2 302.0 295.6 245.3 237.9
8 251.8 319.9 311.8 298.9 302.7 293.0 306.9 234.7 234.1 233.6
9 13.5 13.3 12.7 18.2 13.0 - 15.4 25.6 22.7 23.9
10 380.0 551.8 433.9 362.5 377.1 331.6 411.1 428.6 327.3 328.8
11 187.7 266.6 231.4 218.5 198.1 170.2 206.8 200.6 160.9 171.0
12 76.6 102.7 98.2 78.1 105.0 86.9 125.7 133.8 106.9 68.7
13 178.3 257.3 245.2 169.6 174.1 158.2 182.7 161.8 135.1 149.2
14 10.4 16.1 13.9 19.6 15.5 11.0 14.5 10.1 10.1 10.1
16 - - - - - - - - - -
17 88.9 127.8 125.3 107.3 78.0 88.3 92.7 116.3 61.5 69.0
18 12.2 17.8 14.9 - 10.9 11.6 8.7 - - -
19 159.0 234.8 179.3 161.0 129.3 127.6 173.8 164.0 136.7 107.3
Province 3,400.0 4,270.0 3,750.0 3,030.0 3,125.0 3,200.0 3,400.0 3,330.0 2,820.0 2,870.0
1 54.8 41.8 55.0 58.1 54.6 45.5 59.8 70.1 65.2 48.5
2 69.5 56.0 69.9 66.7 65.5 66.6 67.9 84.7 74.9 72.4
3 57.8 50.4 68.3 66.8 64.4 38.5 68.7 84.9 71.2 81.0
4 37.9 37.3 47.7 35.9 49.9 37.1 40.6 56.1 47.3 43.4
5 62.0 58.0 71.2 50.0 68.3 86.1 62.7 79.8 61.2 68.4
6 & 15 66.3 56.9 75.8 61.9 76.2 79.8 64.3 76.2 66.1 82.4
7 50.9 42.5 56.0 45.0 62.1 61.9 56.3 70.7 63.7 56.9
8 62.1 55.0 78.3 65.8 73.4 68.1 59.3 76.8 71.8 78.2
9 59.7 46.9 65.4 66.7 65.6 - 48.1 67.3 73.4 81.0
10 56.1 57.0 64.4 56.0 66.6 70.7 61.6 76.8 68.5 66.3
11 58.8 62.5 73.6 60.4 73.2 69.0 58.7 80.0 73.4 66.1
12 54.6 54.0 65.6 63.3 68.9 65.1 57.5 79.4 63.3 57.8
13 65.3 62.3 70.8 61.3 71.5 69.4 57.1 77.8 73.0 63.8
14 52.7 62.8 72.2 64.2 72.2 51.9 53.4 57.0 72.8 59.9
16 - - - - - - - - - -
17 51.9 56.4 53.3 53.6 56.5 54.7 47.4 65.4 56.1 46.7
18 67.6 66.3 51.5 - 54.1 61.1 52.9 - - -
19 52.7 62.8 42.8 56.8 41.5 71.9 57.8 67.7 65.2 63.8
Province 59.5 55.0 66.7 58.2 66.6 67.0 60.3 76.5 67.3 68.6
1 108.2 116.1 97.5 85.8 86.2 67.4 114.6 139.8 131.0 111.0
2 427.4 552.2 473.2 339.8 298.6 425.0 385.0 579.0 453.4 555.9
3 445.2 396.1 488.0 403.8 322.3 232.1 328.8 456.4 326.9 415.2
4 84.4 107.2 110.9 36.8 88.7 81.5 99.7 116.8 62.5 43.9
5 724.4 726.8 927.0 451.5 731.4 843.0 722.0 722.4 491.7 611.8
6 & 15 567.3 462.2 575.2 389.6 538.1 614.7 489.0 648.7 527.0 548.1
7 310.3 311.3 376.0 253.6 415.9 365.2 369.9 454.9 340.4 294.8
8 340.2 383.0 531.6 428.6 483.5 434.4 396.2 392.6 366.3 397.8
9 17.6 13.6 18.1 26.4 18.5 25.8 16.1 37.6 36.2 42.1
10 464.3 684.4 608.7 442.2 547.0 510.6 551.5 716.3 488.3 474.9
11 240.3 362.7 370.7 287.4 315.8 255.9 264.5 349.7 257.2 245.9
12 91.1 120.8 140.3 107.6 157.6 123.1 157.3 231.4 147.4 86.5
13 253.5 348.8 378.2 226.2 271.1 239.1 227.1 274.2 214.7 207.4
14 11.9 22.0 21.8 27.4 24.4 12.4 16.9 12.5 16.0 13.1
16 - - - - - - - - - -
17 100.5 157.1 145.5 125.1 95.9 105.2 95.6 165.7 75.1 70.1
18 18.0 25.6 16.7 - 12.8 15.4 10.1 - - -
19 182.5 321.3 167.0 198.9 116.8 199.7 218.7 241.9 194.1 149.2
Province 4,404.6 5,114.3 5,447.5 3,840.7 4,528.7 4,668.0 4,463.3 5,545.4 4,131.3 4,289.2
Note: Unavailable numbers may not be zero, therefore totals may not add up.
Source: Statistics Canada, CANSIM Database Table Numbers 001-0010 and 001-0017; and Alberta Agriculture and Forestry, Statistics and Data
Development Section
Table 86: Barley (1) Acreage and Production for Alberta Census Divisions,
2006-2015
Harvested Acres - '000
Yield per Acre - Bushels
Production - '000 tonnes
(1) Barley for Grain.
Alberta Agriculture Statistics Yearbook, 2015 - 110 -

C.D. 2006 2007 2008 2009 2010 2011 2012 2013 2014 2015p
1 10.4 5.3 6.4 3.2 3.3 4.2 2.6 3.4 - -
2 13.3 5.8 3.9 - 4.4 9.5 3.1 2.7 2.3 4.1
3 9.7 8.0 7.4 3.4 2.8 4.1 4.0 - 4.2 1.6
4 34.8 31.1 26.6 7.4 20.3 24.3 12.2 14.6 10.1 9.6
5 14.2 8.4 7.3 3.8 10.0 13.6 6.5 6.0 13.2 4.4
6 & 15 20.2 14.3 15.5 4.5 20.0 14.7 15.6 11.4 11.1 6.9
7 85.6 59.4 52.0 22.3 61.5 53.1 47.8 50.2 46.4 21.7
8 23.7 15.6 19.7 10.9 27.3 19.2 18.4 14.5 9.7 7.1
9 3.7 11.2 3.6 4.6 5.7 - 4.4 5.3 7.1 4.1
10 98.9 97.2 63.3 41.4 53.7 55.9 61.5 59.0 102.2 46.3
11 70.9 54.9 48.1 26.9 53.0 46.6 36.6 51.8 36.9 28.5
12 41.6 48.5 55.8 25.2 35.9 33.4 33.6 31.4 45.0 23.5
13 90.2 61.0 55.6 41.8 73.7 61.8 58.4 54.1 60.5 44.3
14 7.6 8.8 8.0 4.6 7.4 12.8 7.2 3.8 6.9 11.6
16 - - - - - - - - - -
17 76.2 85.2 60.5 44.6 70.7 75.9 46.1 51.0 44.7 60.3
18 13.7 19.9 22.0 7.0 17.2 16.0 19.0 13.8 4.5 8.8
19 89.4 84.5 44.2 46.7 63.0 67.9 43.1 34.8 48.6 54.5
Province 705.0 620.0 500.0 300.0 530.0 585.0 420.0 410.0 455.0 340.0
1 46.1 46.6 47.3 69.3 81.8 49.4 81.3 66.9 - -
2 79.9 60.8 75.2 - 85.6 26.1 93.6 101.0 102.3 95.3
3 72.4 51.0 53.6 82.5 82.7 80.0 72.7 - 83.6 77.9
4 41.0 36.8 43.7 43.1 61.7 46.9 56.1 63.7 53.9 50.4
5 77.7 56.5 79.8 63.9 89.9 72.2 80.7 87.5 60.2 68.4
6 & 15 79.0 75.4 87.4 75.1 89.4 87.1 85.7 100.1 93.2 108.5
7 45.9 40.8 56.4 51.1 77.9 73.7 76.1 79.2 71.5 68.4
8 65.7 71.3 93.1 79.1 95.7 94.9 85.9 102.8 84.5 99.1
9 76.2 83.0 68.9 60.1 83.7 - 64.8 64.0 49.7 78.2
10 63.3 55.2 71.8 57.1 82.0 88.6 87.3 97.3 77.6 96.0
11 68.7 75.9 77.1 67.1 88.7 83.8 79.9 108.6 83.7 82.0
12 60.4 64.6 78.0 70.4 87.1 75.2 80.6 98.6 90.2 80.0
13 68.3 71.7 77.6 66.1 89.2 89.6 97.0 96.3 83.2 76.9
14 59.9 67.5 83.6 84.1 91.1 50.8 66.9 78.5 68.1 63.5
16 - - - - - - - - - -
17 71.6 77.1 71.9 79.0 77.5 97.9 64.3 99.7 63.1 51.8
18 63.3 76.2 60.8 62.8 42.9 101.6 75.6 80.2 55.7 73.2
19 78.3 79.8 61.5 67.0 53.4 87.3 71.6 104.7 78.1 76.7
Province 65.0 65.6 70.2 66.7 79.2 81.9 80.0 95.1 77.4 75.0
1 7.4 3.8 4.7 3.4 4.2 3.2 3.2 3.5 - -
2 16.4 5.4 4.5 - 5.8 3.8 4.5 4.2 3.6 6.0
3 10.8 6.3 6.1 4.3 3.6 5.1 4.5 - 5.4 2.0
4 22.0 17.7 17.9 4.9 19.3 17.6 10.5 14.4 8.4 7.4
5 17.0 7.3 9.0 3.7 13.9 15.2 8.1 8.1 12.3 4.7
6 & 15 24.6 16.7 20.9 5.2 27.5 19.7 20.7 17.6 16.0 11.6
7 60.5 37.4 45.2 17.6 73.9 60.4 56.1 61.3 51.1 22.9
8 24.1 17.2 28.3 13.3 40.2 28.1 24.4 23.0 12.7 10.8
9 4.3 14.3 3.9 4.3 7.4 4.3 4.4 5.3 5.4 4.9
10 96.5 82.7 70.1 36.4 68.0 76.5 82.9 88.7 122.3 68.5
11 75.1 64.2 57.2 27.8 72.6 60.3 45.1 86.8 47.6 36.1
12 38.8 48.3 67.1 27.3 48.2 38.7 41.8 47.7 62.7 29.0
13 95.0 67.5 66.5 42.6 101.4 85.4 87.3 80.4 77.6 52.6
14 7.0 9.2 10.3 6.0 10.4 10.0 7.5 4.6 7.2 11.3
16 - - - - - - - - - -
17 84.1 101.2 67.1 54.3 84.6 114.7 45.7 78.4 43.4 48.2
18 13.4 23.4 20.6 6.8 11.4 25.1 22.1 17.1 3.9 10.0
19 108.0 104.1 41.9 48.2 51.9 91.4 47.6 56.2 58.6 64.5
Province 706.3 627.4 541.3 308.4 647.7 738.7 518.2 601.5 542.9 393.3
Note: Unavailable numbers may not be zero, therefore totals may not add up.
(1) Oats for Grain.
Source: Statistics Canada, CANSIM Database Table Numbers 001-0010 and 001-0017; and Alberta Agriculture and Forestry, Statistics and Data
Development Section
Table 87: Oats (1) Acreage and Production for Alberta Census Divisions,
2006-2015
Harvested Acres - '000
Yield per Acre - Bushels
Production - '000 tonnes
- 111 - Alberta Agriculture Statistics Yearbook, 2015

C.D. 2006 2007 2008 2009 2010 2011 2012 2013 2014 2015p
1 53.3 63.8 54.6 50.8 100.0 148.3 190.4 109.6 123.3 153.6
2 163.0 221.9 244.0 181.6 168.7 388.7 386.6 378.4 351.1 377.0
3 80.2 89.5 96.9 71.1 105.2 184.4 144.1 192.0 173.9 192.4
4 55.4 65.3 63.2 50.1 63.2 102.4 122.0 134.7 105.1 101.7
5 498.3 519.0 632.6 572.3 689.2 751.2 817.6 650.3 710.3 651.5
6 & 15 214.0 235.8 271.2 292.6 285.7 - 310.0 337.6 348.9 323.5
7 480.8 522.7 557.1 572.2 584.5 619.1 623.7 640.5 705.6 634.5
8 227.0 221.3 319.3 269.3 292.9 320.3 383.7 316.2 299.1 306.8
9 5.4 - - - 6.6 7.5 7.1 17.6 18.1 22.4
10 875.9 1,022.7 983.7 904.5 982.7 1,062.7 1,053.7 1,060.8 1,068.0 1,062.0
11 383.1 456.5 406.6 380.5 374.0 397.9 456.8 411.5 387.2 405.8
12 134.1 155.8 164.8 117.3 156.3 192.1 200.1 221.0 219.2 149.6
13 258.2 289.5 295.7 348.1 374.0 404.6 439.5 346.9 359.6 355.8
14 6.5 15.8 10.2 18.7 10.4 16.8 15.6 - 17.7 -
16 - - - - - - - - - -
17 340.6 356.0 396.9 426.6 460.3 426.9 515.0 504.6 680.4 466.6
18 43.1 54.5 43.2 51.6 54.1 58.8 54.0 25.4 0.0 34.4
19 681.1 735.8 657.4 684.8 842.4 760.7 779.6 716.4 915.1 842.9
Province 4,500.0 5,035.0 5,200.0 5,000.0 5,550.0 6,071.7 6,600.0 6,080.0 6,500.0 6,100.0
1 33.3 28.7 35.8 44.2 42.7 44.0 34.7 39.8 35.9 33.7
2 36.4 30.3 44.3 43.4 46.3 35.7 35.5 48.7 42.8 42.4
3 34.8 27.0 40.2 40.5 39.4 27.8 37.5 49.0 38.0 44.4
4 28.0 18.6 28.0 20.2 35.1 30.9 30.3 38.4 36.2 19.0
5 34.9 30.7 42.4 34.0 42.5 50.1 32.3 44.3 37.7 43.1
6 & 15 41.0 33.9 43.7 34.9 38.0 - 33.2 43.0 39.6 46.2
7 32.8 23.7 32.2 28.2 37.7 39.1 35.0 41.9 38.8 39.7
8 37.6 32.5 45.0 37.1 40.2 38.7 34.9 45.9 42.8 49.5
9 - - - - 25.0 - 32.7 51.5 43.8 53.6
10 33.2 27.8 37.5 30.1 43.0 37.0 34.5 46.2 39.9 41.1
11 37.6 35.5 45.4 34.4 48.1 41.9 34.3 45.5 44.3 44.6
12 33.9 31.2 39.4 33.7 44.9 29.5 33.9 45.9 37.4 39.3
13 39.9 35.5 44.2 40.6 48.6 47.7 37.4 44.0 43.5 45.1
14 32.5 30.9 46.4 42.9 45.2 26.2 34.9 - 34.6 -
16 - - - - - - - - - -
17 28.1 30.2 27.6 27.0 29.2 36.1 28.2 38.0 30.3 24.6
18 27.7 30.6 28.5 25.5 19.3 21.9 27.2 29.0 - 34.9
19 28.6 30.4 22.2 29.4 21.5 31.9 32.0 40.6 29.5 33.6
Province 33.7 30.0 36.9 32.7 38.0 39.5 34.3 43.7 37.5 39.7
1 39.7 41.5 44.3 55.2 94.1 147.4 149.6 96.3 97.6 116.8
2 134.4 152.2 241.5 188.6 171.0 302.9 307.4 408.9 333.6 361.7
3 62.4 54.5 88.0 70.7 89.5 115.8 119.9 211.2 144.8 193.1
4 35.1 27.0 40.1 12.0 50.4 70.8 83.4 117.3 84.0 38.4
5 393.7 352.9 603.6 457.0 659.1 852.0 575.8 650.5 604.8 636.7
6 & 15 196.6 178.2 268.3 221.1 235.7 314.7 228.8 326.0 307.1 337.3
7 355.1 280.5 404.4 340.3 499.1 547.2 493.5 607.6 620.8 568.8
8 187.9 161.1 320.7 233.3 263.2 278.2 301.8 327.8 284.2 336.3
9 - - - - 3.8 - 5.3 20.5 17.3 26.9
10 657.5 645.6 835.2 544.6 950.4 869.4 819.7 1,110.1 963.1 985.3
11 323.8 363.6 418.6 295.6 406.4 364.4 352.4 423.1 388.7 409.2
12 102.9 109.5 147.1 81.9 159.1 123.8 152.7 229.4 184.8 131.1
13 233.1 233.1 296.0 340.5 412.4 428.7 370.5 345.7 354.9 362.3
14 4.5 9.5 10.2 18.9 10.6 9.2 12.4 - 13.9 -
16 - - - - - - - - - -
17 215.4 243.1 244.1 265.8 302.8 335.7 327.0 433.8 467.3 256.2
18 27.1 37.6 28.0 31.0 23.7 26.9 33.2 16.6 - 26.3
19 439.9 505.5 330.3 468.1 408.7 533.3 565.1 658.6 610.4 639.4
Province 3,424.6 3,401.9 4,322.7 3,628.7 4,740.0 5,347.9 5,097.2 5,998.8 5,488.5 5,443.1
Source: Statistics Canada, CANSIM Database Table Numbers 001-0010 and 001-0017; and Alberta Agriculture and Forestry, Statistics and Data
Development Section
Table 88: Canola Acreage and Production for Alberta Census Divisions,
2006-2015
Seeded Acres - '000
Yield per Acre - Bushels
Production - '000 tonnes
Note: Unavailable numbers may not be zero, therefore totals may not add up.
Alberta Agriculture Statistics Yearbook, 2015 - 112 -

C.D. 2006 2007 2008 2009 2010 2011 2012 2013 2014 2015p
1 117.7 110.9 157.0 151.8 196.0 202.5 155.8 176.8 138.4 56.7
2 277.2 218.0 284.3 297.2 263.6 252.7 151.0 233.5 277.5 255.3
3 247.0 189.6 179.9 229.0 298.3 223.8 234.2 204.5 267.4 224.0
4 281.9 392.9 338.0 - 427.9 444.7 314.3 374.3 558.1 321.6
5 210.6 184.8 231.4 156.9 197.2 260.6 215.9 282.2 350.7 169.5
6 & 15 453.0 441.9 453.9 386.7 328.1 390.5 286.2 309.5 222.6 308.4
7 329.2 365.8 390.6 159.8 432.1 393.5 338.9 385.6 321.6 319.9
8 366.6 378.9 342.9 251.0 366.3 331.6 246.3 240.6 206.6 239.3
9 147.0 65.1 116.1 161.5 148.2 137.2 136.9 120.2 84.1 101.4
10 388.4 395.0 434.4 362.4 380.5 491.9 325.9 360.3 274.6 229.3
11 506.7 566.0 525.2 470.8 416.7 429.7 394.1 300.3 341.7 299.2
12 421.3 513.5 372.3 361.8 446.6 493.7 369.9 349.6 339.7 387.8
13 585.9 685.0 623.4 533.7 545.2 524.3 518.4 422.3 330.4 359.5
14 87.6 80.3 130.4 147.8 87.1 80.4 76.0 85.2 90.3 74.9
16 - - - - - - - - - -
17 392.4 342.5 465.0 502.0 443.2 422.4 258.8 273.0 335.3 461.6
18 106.0 258.7 114.2 221.9 120.1 99.4 109.4 - - 75.7
19 518.6 390.7 425.8 488.8 503.6 421.3 456.6 306.2 363.6 340.9
Province 5,450.0 5,415.0 5,260.0 4,555.0 4,960.0 4,750.0 4,600.0 4,520.0 4,595.0 4,225.0
1 1.7 2.4 1.9 1.8 2.1 2.1 2.2 1.1 1.6 2.4
2 2.9 3.0 3.7 3.4 3.1 2.9 3.0 2.6 2.7 3.6
3 2.1 2.0 2.8 2.1 2.6 2.0 1.8 2.0 2.6 1.9
4 1.1 1.4 1.0 - 1.9 1.6 1.6 1.5 0.9 0.7
5 2.1 2.3 2.6 1.5 2.4 2.1 2.3 2.3 2.4 2.2
6 & 15 2.0 2.2 2.2 1.2 2.2 2.1 2.1 2.1 2.4 1.6
7 1.5 1.6 1.8 - 2.2 1.9 1.8 1.5 1.2 0.7
8 2.2 2.3 2.1 1.4 2.3 2.1 2.1 2.0 2.7 1.7
9 1.9 2.0 2.1 1.2 1.8 2.6 1.8 1.8 1.3 1.4
10 1.3 1.5 1.4 0.6 1.7 1.4 1.3 2.0 1.7 0.8
11 1.7 2.0 1.8 1.1 1.8 1.7 1.7 1.8 1.5 1.0
12 1.3 1.3 1.5 0.7 1.6 1.4 1.5 1.5 1.8 0.9
13 1.6 1.9 1.7 0.9 1.5 1.9 2.0 1.9 2.1 1.0
14 1.2 1.5 1.9 1.0 1.7 1.5 1.9 - 1.9 0.9
16 - - - - - - - - - -
17 1.2 1.4 1.5 0.9 0.8 1.4 1.6 1.9 1.4 0.9
18 1.6 1.9 1.5 0.8 1.2 1.6 2.6 - - 1.0
19 1.1 1.6 1.3 0.8 0.8 1.7 1.7 1.9 0.9 1.3
Province 1.6 1.8 1.8 1.2 1.8 1.8 1.8 1.9 1.7 1.3
1 203.0 269.3 291.9 266.3 408.1 423.9 344.3 201.5 215.5 136.5
2 794.4 656.1 1,063.1 1,001.8 823.2 739.6 448.6 596.1 753.6 910.0
3 530.3 375.7 500.4 477.4 777.7 440.7 429.4 406.4 699.7 426.0
4 319.3 562.9 350.2 147.2 819.7 721.2 503.8 533.9 488.2 220.6
5 445.4 432.7 603.6 230.4 465.6 539.7 491.5 647.5 854.2 367.4
6 & 15 920.7 956.4 1,006.8 468.4 709.1 831.7 613.2 652.6 524.2 483.4
7 481.5 574.4 706.5 - 967.3 759.6 595.1 591.6 393.9 211.9
8 793.6 883.8 706.9 359.4 834.9 682.0 511.5 470.3 555.3 398.6
9 283.9 131.1 243.5 197.2 266.4 362.9 251.9 216.7 106.0 144.2
10 512.1 582.5 596.8 217.2 643.3 671.4 418.2 703.9 470.6 179.5
11 859.8 1,148.1 966.6 532.8 768.7 734.2 664.6 527.3 513.7 312.5
12 543.3 643.9 574.8 236.7 731.7 679.3 536.2 537.4 615.0 353.1
13 939.0 1,294.0 1,030.3 453.7 792.6 1,004.6 1,048.9 786.8 700.9 358.2
14 103.1 118.0 244.0 151.1 146.6 120.7 141.3 - 168.6 68.1
16 - - - - - - - - - -
17 463.6 472.9 680.4 455.6 338.6 596.5 415.1 523.6 454.1 399.8
18 168.1 480.1 175.4 176.2 142.5 156.7 281.6 148.1 121.3 78.6
19 573.0 638.1 558.5 412.2 404.3 735.5 781.0 580.9 332.5 431.5
Province 8,975.0 10,000.0 9,730.0 5,440.0 9,065.0 8,750.0 8,500.0 8,365.0 8,000.0 5,480.0
Source: Statistics Canada, CANSIM Database Table Number 001-0017; and Alberta Agriculture and Forestry, Statistics and Data Development Section
Table 89: Tame Hay Acreage and Production for Alberta Census Divisions,
2006-2015
Harvested Acres - '000
Yield Per Acre - tons
Production - '000 tons
Note: Unavailable numbers may not be zero, therefore totals may not add up.
- 113 - Alberta Agriculture Statistics Yearbook, 2015
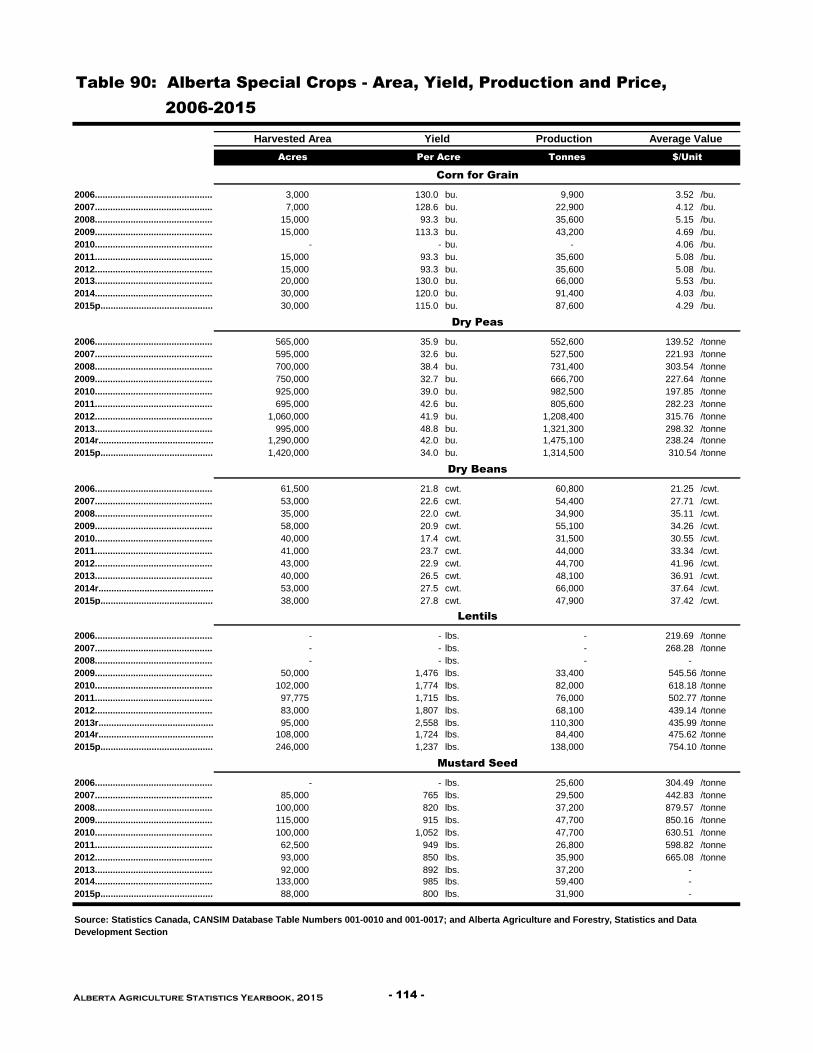
2006........................................................... 3,000 130.0 bu. 9,900 3.52 /bu.
2007........................................................... 7,000 128.6 bu. 22,900 4.12 /bu.
2008........................................................... 15,000 93.3 bu. 35,600 5.15 /bu.
2009........................................................... 15,000 113.3 bu. 43,200 4.69 /bu.
2010........................................................... - - bu. - 4.06 /bu.
2011........................................................... 15,000 93.3 bu. 35,600 5.08 /bu.
2012........................................................... 15,000 93.3 bu. 35,600 5.08 /bu.
2013........................................................... 20,000 130.0 bu. 66,000 5.53 /bu.
2014........................................................... 30,000 120.0 bu. 91,400 4.03 /bu.
2015p........................................................... 30,000 115.0 bu. 87,600 4.29 /bu.
2006........................................................... 565,000 35.9 bu. 552,600 139.52 /tonne
2007........................................................... 595,000 32.6 bu. 527,500 221.93 /tonne
2008........................................................... 700,000 38.4 bu. 731,400 303.54 /tonne
2009........................................................... 750,000 32.7 bu. 666,700 227.64 /tonne
2010........................................................... 925,000 39.0 bu. 982,500 197.85 /tonne
2011........................................................... 695,000 42.6 bu. 805,600 282.23 /tonne
2012........................................................... 1,060,000 41.9 bu. 1,208,400 315.76 /tonne
2013........................................................... 995,000 48.8 bu. 1,321,300 298.32 /tonne
2014r........................................................... 1,290,000 42.0 bu. 1,475,100 238.24 /tonne
2015p........................................................... 1,420,000 34.0 bu. 1,314,500 310.54 /tonne
2006........................................................... 61,500 21.8 cwt. 60,800 21.25 /cwt.
2007........................................................... 53,000 22.6 cwt. 54,400 27.71 /cwt.
2008........................................................... 35,000 22.0 cwt. 34,900 35.11 /cwt.
2009........................................................... 58,000 20.9 cwt. 55,100 34.26 /cwt.
2010........................................................... 40,000 17.4 cwt. 31,500 30.55 /cwt.
2011........................................................... 41,000 23.7 cwt. 44,000 33.34 /cwt.
2012........................................................... 43,000 22.9 cwt. 44,700 41.96 /cwt.
2013........................................................... 40,000 26.5 cwt. 48,100 36.91 /cwt.
2014r........................................................... 53,000 27.5 cwt. 66,000 37.64 /cwt.
2015p........................................................... 38,000 27.8 cwt. 47,900 37.42 /cwt.
2006........................................................... - - lbs. - 219.69 /tonne
2007........................................................... - - lbs. - 268.28 /tonne
2008........................................................... - - lbs. - -
2009........................................................... 50,000 1,476 lbs. 33,400 545.56 /tonne
2010........................................................... 102,000 1,774 lbs. 82,000 618.18 /tonne
2011........................................................... 97,775 1,715 lbs. 76,000 502.77 /tonne
2012........................................................... 83,000 1,807 lbs. 68,100 439.14 /tonne
2013r........................................................... 95,000 2,558 lbs. 110,300 435.99 /tonne
2014r........................................................... 108,000 1,724 lbs. 84,400 475.62 /tonne
2015p........................................................... 246,000 1,237 lbs. 138,000 754.10 /tonne
2006........................................................... - - lbs. 25,600 304.49 /tonne
2007........................................................... 85,000 765 lbs. 29,500 442.83 /tonne
2008........................................................... 100,000 820 lbs. 37,200 879.57 /tonne
2009........................................................... 115,000 915 lbs. 47,700 850.16 /tonne
2010........................................................... 100,000 1,052 lbs. 47,700 630.51 /tonne
2011........................................................... 62,500 949 lbs. 26,800 598.82 /tonne
2012........................................................... 93,000 850 lbs. 35,900 665.08 /tonne
2013........................................................... 92,000 892 lbs. 37,200 -
2014........................................................... 133,000 985 lbs. 59,400 -
2015p........................................................... 88,000 800 lbs. 31,900 -
Table 90: Alberta Special Crops - Area, Yield, Production and Price,
2006-2015
Harvested Area Yield Production Average Value
Acres Per Acre Tonnes $/Unit
Source: Statistics Canada, CANSIM Database Table Numbers 001-0010 and 001-0017; and Alberta Agriculture and Forestry, Statistics and Data
Development Section
Corn for Grain
Dry Peas
Dry Beans
Lentils
Mustard Seed
Alberta Agriculture Statistics Yearbook, 2015 - 114 -
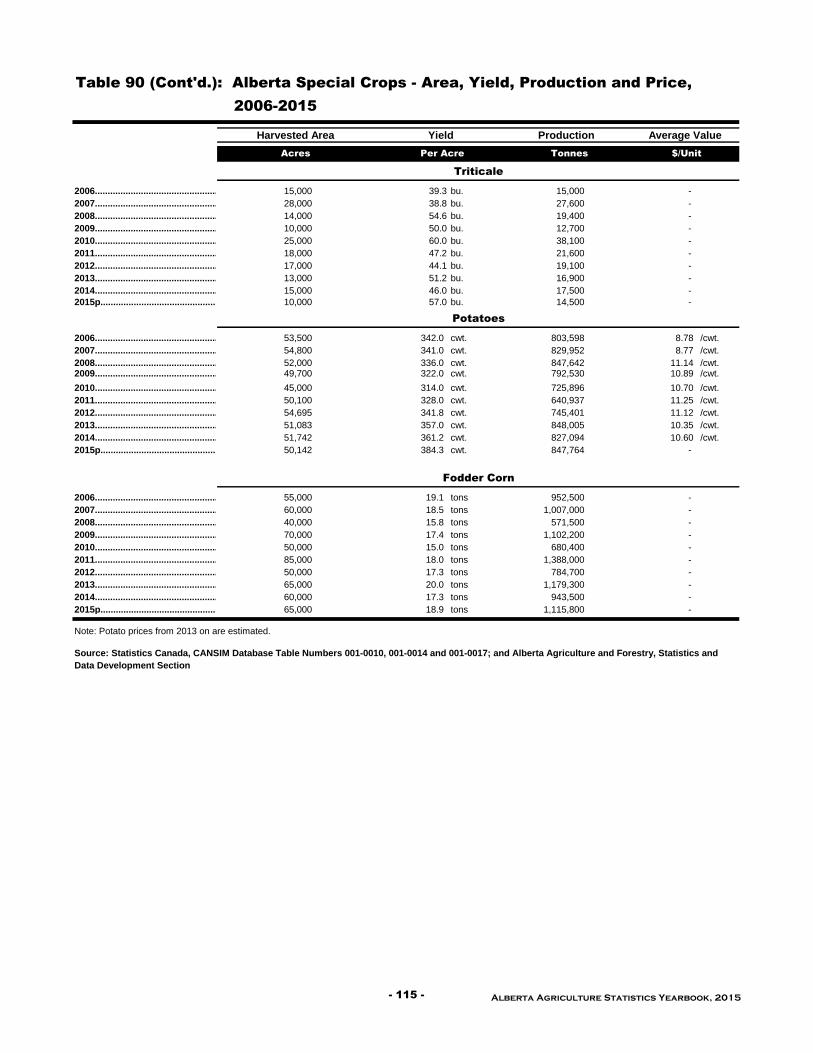
2006........................................................... 15,000 39.3 bu. 15,000 -
2007........................................................... 28,000 38.8 bu. 27,600 -
2008........................................................... 14,000 54.6 bu. 19,400 -
2009........................................................... 10,000 50.0 bu. 12,700 -
2010.......................................................... 25,000 60.0 bu. 38,100 -
2011........................................................... 18,000 47.2 bu. 21,600 -
2012........................................................... 17,000 44.1 bu. 19,100 -
2013........................................................... 13,000 51.2 bu. 16,900 -
2014........................................................... 15,000 46.0 bu. 17,500 -
2015p........................................................... 10,000 57.0 bu. 14,500 -
2006........................................................... 53,500 342.0 cwt. 803,598 8.78 /cwt.
2007........................................................... 54,800 341.0 cwt. 829,952 8.77 /cwt.
2008........................................................... 52,000 336.0 cwt. 847,642 11.14 /cwt.2009........................................................... 49,700 322.0 cwt. 792,530 10.89 /cwt.
2010.......................................................... 45,000 314.0 cwt. 725,896 10.70 /cwt.
2011........................................................... 50,100 328.0 cwt. 640,937 11.25 /cwt.
2012........................................................... 54,695 341.8 cwt. 745,401 11.12 /cwt.
2013........................................................... 51,083 357.0 cwt. 848,005 10.35 /cwt.
2014........................................................... 51,742 361.2 cwt. 827,094 10.60 /cwt.
2015p........................................................... 50,142 384.3 cwt. 847,764 -
2006........................................................... 55,000 19.1 tons 952,500 -
2007........................................................... 60,000 18.5 tons 1,007,000 -
2008........................................................... 40,000 15.8 tons 571,500 -
2009........................................................... 70,000 17.4 tons 1,102,200 -
2010.......................................................... 50,000 15.0 tons 680,400 -
2011........................................................... 85,000 18.0 tons 1,388,000 -
2012........................................................... 50,000 17.3 tons 784,700 -
2013........................................................... 65,000 20.0 tons 1,179,300 -
2014........................................................... 60,000 17.3 tons 943,500 -
2015p........................................................... 65,000 18.9 tons 1,115,800 -
Table 90 (Cont'd.): Alberta Special Crops - Area, Yield, Production and Price,
2006-2015
Harvested Area Yield Production Average Value
Acres Per Acre Tonnes $/Unit
Triticale
Potatoes
Fodder Corn
Source: Statistics Canada, CANSIM Database Table Numbers 001-0010, 001-0014 and 001-0017; and Alberta Agriculture and Forestry, Statistics and
Data Development Section
Note: Potato prices from 2013 on are estimated.
- 115 - Alberta Agriculture Statistics Yearbook, 2015
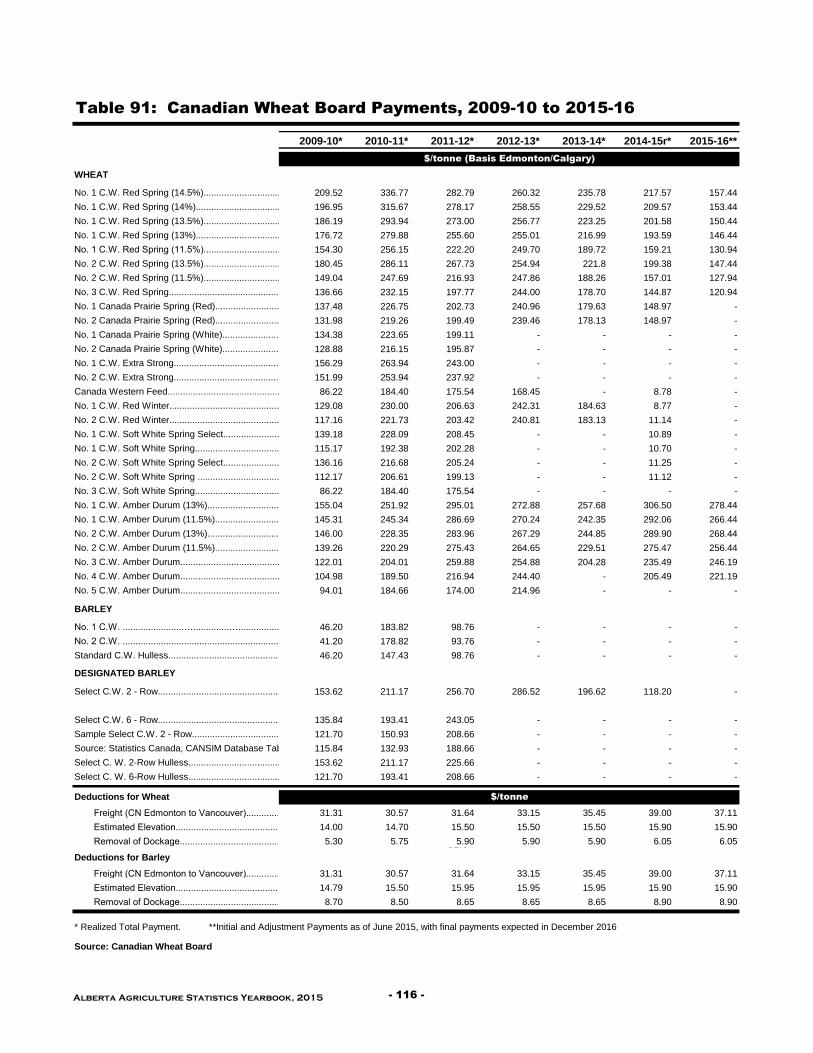
2009-10* 2010-11* 2011-12* 2012-13* 2013-14* 2014-15r* 2015-16**
WHEAT
209.52 336.77 282.79 260.32 235.78 217.57 157.44
196.95 315.67 278.17 258.55 229.52 209.57 153.44
186.19 293.94 273.00 256.77 223.25 201.58 150.44
176.72 279.88 255.60 255.01 216.99 193.59 146.44
154.30 256.15 222.20 249.70 189.72 159.21 130.94
180.45 286.11 267.73 254.94 221.8 199.38 147.44
149.04 247.69 216.93 247.86 188.26 157.01 127.94
136.66 232.15 197.77 244.00 178.70 144.87 120.94
137.48 226.75 202.73 240.96 179.63 148.97 -
131.98 219.26 199.49 239.46 178.13 148.97 -
134.38 223.65 199.11 - - - -
128.88 216.15 195.87 - - - -
156.29 263.94 243.00 - - - -
151.99 253.94 237.92 - - - -
86.22 184.40 175.54 168.45 - 8.78 -
129.08 230.00 206.63 242.31 184.63 8.77 -
117.16 221.73 203.42 240.81 183.13 11.14 -
139.18 228.09 208.45 - - 10.89 -
115.17 192.38 202.28 - - 10.70 -
136.16 216.68 205.24 - - 11.25 -
112.17 206.61 199.13 - - 11.12 -
86.22 184.40 175.54 - - - -
155.04 251.92 295.01 272.88 257.68 306.50 278.44
145.31 245.34 286.69 270.24 242.35 292.06 266.44
146.00 228.35 283.96 267.29 244.85 289.90 268.44
139.26 220.29 275.43 264.65 229.51 275.47 256.44
122.01 204.01 259.88 254.88 204.28 235.49 246.19
104.98 189.50 216.94 244.40 - 205.49 221.19
94.01 184.66 174.00 214.96 - - -
BARLEY
46.20 183.82 98.76 - - - -
41.20 178.82 93.76 - - - -
46.20 147.43 98.76 - - - -
153.62 211.17 256.70 286.52 196.62 118.20 -
135.84 193.41 243.05 - - - -
121.70 150.93 208.66 - - - -
115.84 132.93 188.66 - - - -
153.62 211.17 225.66 - - - -
121.70 193.41 208.66 - - - -
Deductions for Wheat
Freight (CN Edmonton to Vancouver)............................................................…31.31 30.57 31.64 33.15 35.45 39.00 37.11
Estimated Elevation............................................................…14.00 14.70 15.50 15.50 15.50 15.90 15.90
Removal of Dockage............................................................…5.30 5.75 5.90 5.90 5.90 6.05 6.0531.64
Deductions for Barley
Freight (CN Edmonton to Vancouver)............................................................…31.31 30.57 31.64 33.15 35.45 39.00 37.11
Estimated Elevation............................................................…14.79 15.50 15.95 15.95 15.95 15.90 15.90
Removal of Dockage............................................................…8.70 8.50 8.65 8.65 8.65 8.90 8.90
* Realized Total Payment. **Initial and Adjustment Payments as of June 2015, with final payments expected in December 2016
Source: Canadian Wheat Board
Table 91: Canadian Wheat Board Payments, 2009-10 to 2015-16
$/tonne (Basis Edmonton/Calgary)
No. 1 C.W. Red Spring (14.5%)..........................................................
No. 1 C.W. Red Spring (14%)..........................................................
No. 1 C.W. Red Spring (13.5%)........................................................
No. 1 C.W. Red Spring (13%)........................................................
No. 1 C.W. Red Spring (11.5%).............................................................…
No. 2 C.W. Red Spring (13.5%)............................................................
No. 2 C.W. Red Spring (11.5%).....................................................................
No. 3 C.W. Red Spring.....................................................................
No. 1 Canada Prairie Spring (Red).............................................................
No. 2 Canada Prairie Spring (Red).......................................................
No. 1 Canada Prairie Spring (White)........................................................
No. 2 Canada Prairie Spring (White)......................................................
No. 1 C.W. Extra Strong..............................................................
No. 2 C.W. Extra Strong.............................................................
Canada Western Feed.................................................................
No. 1 C.W. Red Winter................................................................
No. 2 C.W. Red Winter.................................................................
No. 1 C.W. Soft White Spring Select..........................................................
No. 1 C.W. Soft White Spring..........................................................
No. 2 C.W. Soft White Spring Select..............................
No. 2 C.W. Soft White Spring ...........................................................
No. 3 C.W. Soft White Spring.........................................................
No. 1 C.W. Amber Durum (13%)........................................................
No. 1 C.W. Amber Durum (11.5%)......................................................
No. 2 C.W. Amber Durum (13%).......................................................
No. 2 C.W. Amber Durum (11.5%).......................................................
No. 3 C.W. Amber Durum.....................................................
No. 4 C.W. Amber Durum.........................................................
No. 5 C.W. Amber Durum..............................................................
No. 1 C.W. ........................…..............…...................................…....
No. 2 C.W. ............................................................................……..
Standard C.W. Hulless...................................................................
Sample Select C.W. 2 - Row................................................................................................
Source: Statistics Canada, CANSIM Database Table Numbers 001-0010, 001-0014 (potatoe prices since 2013 are estimated) and 001-0017; and Alberta Agriculture and Forestry, Statistics and Data Development Section
Select C. W. 2-Row Hulless.............................................................................................
Select C. W. 6-Row Hulless..............................................................................................
$/tonne
.
DESIGNATED BARLEY
Select C.W. 2 - Row.........................................................................................................
Select C.W. 6 - Row.....................................................................................................
Alberta Agriculture Statistics Yearbook, 2015 - 116 -

2013-14 2014-15 2013-14 2014-15 2013-14 2014-15 2013-14 2014-15
WHEAT
No. 1 C.W. Red Spring (14.5%).............................................153.45 114.55 57.00 88.00 25.33 15.02 235.78 217.57
No. 1 C.W. Red Spring (14%)................................................149.35 111.55 59.00 83.00 21.17 15.02 229.52 209.57
No. 1 C.W. Red Spring (13.5%).............................................145.35 108.55 60.00 78.00 17.90 15.03 223.25 201.58
No. 1 C.W. Red Spring (13%)................................................142.15 105.55 60.00 73.00 14.84 15.04 216.99 193.59
No. 1 C.W. Red Spring (11.5%)..............................................132.15 82.05 46.00 61.00 11.57 16.16 189.72 159.21
No. 2 C.W. Red Spring (13.5%)............................................140.25 105.55 62.00 79.00 19.55 14.83 221.80 199.38
No. 2 C.W. Red Spring (11.5%).............................................127.9 79.05 48.00 61.00 12.36 16.96 188.26 157.01
No. 3 C.W. Red Spring...........................................................109.15 68.05 55.00 56.00 14.55 20.82 178.70 144.87
No. 1 Canada Prairie Spring (Red).................................... 107.65 74.55 63.00 60.00 8.98 14.42 179.63 148.97
No. 2 Canada Prairie Spring (Red)................................... 106.15 72.55 63.00 62.00 8.98 14.42 178.13 148.97
Canada Western Feed.......................................................... - - - - - - - -
No. 1 C.W. Red Winter............................................................112.65 74.55 58.00 10.00 13.98 - 184.63 84.55
No. 2 C.W. Red Winter...........................................................111.15 72.55 58.00 10.00 13.98 - 183.13 82.55
No. 1 C.W. Amber Durum (13%).........................................161.15 135.55 72.00 151.00 24.53 19.95 257.68 306.50
No. 1 C.W. Amber Durum (11.5%).......................................159.15 123.55 59.00 151.00 24.20 17.51 242.35 292.06
No. 2 C.W. Amber Durum (13%)........................................153.15 125.55 70.00 146.00 21.70 18.35 244.85 289.90
No. 2 C.W. Amber Durum (11.5%)......................................151.15 113.55 57.00 146.00 21.36 15.92 229.51 275.47
No. 3 C.W. Amber Durum....................................................139.15 103.30 52.00 116.00 13.13 16.19 204.28 235.49
No. 4 C.W. Amber Durum.................................................... - 78.30 - 109.00 - 18.19 - 205.49
No. 5 C.W. Amber Durum.................................................... - - - - - - - -
DESIGNATED BARLEY
Select C.W. 2 - Row................................................................147.95 118.2 15.00 - 33.67 - 196.62 118.20
Source: Canadian Wheat Board
Table 92: Canadian Wheat Board Payments (Initial and Final), 2013-14
and 2014-15
Initial Payment Adjusted Payment Final Payment Realized Payment
$/tonne (Basis Edmonton/Calgary)
- 117 - Alberta Agriculture Statistics Yearbook, 2015

Wheat Oats Barley Wheat Barley Wheat Oats Barley
2004-05.................................................105.71 123.24 111.20 103.91 104.08 101.19 116.32 102.29
2005-06.................................................105.03 119.58 107.63 96.24 97.93 90.86 111.02 94.92
2006-07.................................................157.38 142.43 157.94 - 145.47 146.30 140.40 142.56
2007-08.................................................233.90 183.61 208.26 - 196.41 214.82 - 197.51
2008-09.................................................198.34 168.19 176.59 180.70 171.46 179.89 - 170.19
2009-10................................................ 161.32 153.39 152.55 158.36 148.28 151.54 - 142.60
2010-11.................................................192.57 188.60 188.51 187.05 180.90 - - -
2011-12.................................................227.06 181.23 226.20 222.88 221.03 219.70 173.25 213.13
2012-13.................................................290.24 221.97 278.92 290.93 273.10 291.75 208.93 266.03
2013-14.................................................192.28 179.97 187.24 191.84 179.70 191.16 173.57 172.55
2014-15p.................................................200.54 174.71 200.76 197.79 194.84 197.84 170.12 187.57
Vermilion
Wheat Oats Barley Wheat Oats Barley
2004-05................................................. 94.93 96.31 93.10 91.10 97.65 88.88 92.31
2005-06................................................. 88.01 90.13 87.44 82.77 93.31 81.73 83.73
2006-07.................................................135.00 - 130.09 138.94 128.38 129.71 132.27
2007-08.................................................212.88 - 188.82 203.74 153.77 171.11 183.51
2008-09.................................................185.95 - 160.99 186.02 148.44 143.70 147.30
2009-10................................................ 154.68 - 138.80 155.98 144.37 123.93 125.26
2010-11.................................................183.49 150.61 168.81 197.54 181.48 160.14 150.02
2011-12.................................................216.36 164.74 203.47 192.74 165.51 180.11 201.03
2012-13.................................................290.64 208.80 259.47 265.06 190.77 226.00 258.56
2013-14.................................................190.01 173.68 162.36 165.53 141.92 131.63 166.27
2014-15p.................................................195.76 169.74 178.46 166.52 139.59 152.07 183.00
Source: Alberta Grain Commission; and Alberta Canola Producers Commission
2007 2008 2009 2010 2011 2012 2013r 2014r 2015p
Alberta
Total Area ('000 sq. ft.)...........................................................…11,615 10,419 11,087 12,152 12,183 12,162 12,250 12,520 12,533
Total Sales ($'000)...........................................................…120,856 108,657 112,485 115,641 114,848 123,905 124,860 138,750 130,439
Canada
Total Area ('000 sq. ft.)...........................................................…225,954 235,107 240,667 242,501 247,093 254,333 259,403 254,759 256,153
Total Sales ($'000)...........................................................…2,266,934 2,168,141 2,379,194 2,445,788 2,500,934 2,438,112 2,641,810 2,710,594 2,798,893
Alberta as a % of Canada
Total Area………............................................................…5.1 4.4 4.6 5.0 4.9 4.8 4.7 4.9 4.9
Total Sales……………...........................................................…5.3 5.0 4.7 4.7 4.6 5.1 4.7 5.1 4.7
Table 93: Non-Board Feed Grain Prices, 2004-05 to 2014-15
Lethbridge Red Deer Calgary
Peace River/
$/tonne
Table 94: Greenhouse Industry, Alberta and Canada, 2007-2015
Source: Statistics Canada, CANSIM Database Table Number 001-0046, 001-0051
Edmonton
$/tonne
Barley
Grande Prairie
Alberta Agriculture Statistics Yearbook, 2015 - 118 -

2008 2009 2010 2011 2012 2013 2014r 2015p
Contracted (acres).......................................................18,397 29,653 30,379 33,598 30,528 24,948 22,053 21,675
Planted (acres)............................................................18,270 29,995 31,109 33,672 30,527 24,425 22,404 21,836
Harvested (acres)..........................................................18,211 23,128 30,360 33,307 30,306 24,127 22,385 21,836
Production (tonnes)...........................................................385,219 526,686 573,640 784,500 827,434 668,087 638,099 584,560
Avg. Yield (tonnes/acre)..................................................21.15 22.77 18.90 28.45 27.30 27.69 28.51 26.77
Market Price
Beets ($/tonne)...............................................................45.73 44.05 53.12 53.52 55.10 50.74 52.69 -
Sugar Content % (1)..............................................................18.45 18.10 18.59 19.35 19.30 18.53 19.07 19.64
(1) Factory sugar content.
Source: Alberta Sugar Beet Growers; and Statistics Canada, CANSIM Database Table Number 001-0010
2008 2009 2010 2011 2012 2013 2014r 2015p
Beans, Green or Wax........................................................................................................260 0 0 0 310 220 400 455
Cabbage........................................................................395 0 379 363 0 849 572 325
Carrots...........................................................................0 415 249 266 281 0 315 420
Corn, Sweet.........................................................................4,000 3,800 3,282 3,988 3,253 3,837 3,624 3,433
Cucumbers......................................................................40 0 41 48 46 69 64 56
Dry Onions....................................................................0 0 0 0 0 576 1,213 0
Green Peas........................................................................4,100 4,065 2,414 3,089 3,114 3,046 3,029 2,981
Total Area...........................................................................8,795 8,280 6,365 7,754 7,004 8,597 9,217 7,670
Beans, Green or Wax........................................................................................................209 0 0 0 410 295 513 435
Cabbage........................................................................0 0 3,774 2,488 2,727 6,882 6,558 4,169
Carrots...........................................................................0 2,697 1,528 1,851 1,943 0 0 0
Corn, Sweet.........................................................................14,515 15,422 13,440 12,667 13,791 14,893 17,798 17,558
Cucumbers......................................................................156 0 36 79 65 220 204 143
Dry Onions....................................................................5,761 0 0 0 0 6,422 23,199 0
Green Peas........................................................................5,579 7,023 2,590 3,776 4,159 3,639 4,586 4,693
Total Production...............................................................26,220 25,142 21,368 20,861 23,095 32,351 52,858 26,998838
Beans, Green or Wax........................................................................................................510 516 622 0 585 650 1,015 1,089
Cabbage............................................................. 0 0 1,936 1,572 1,981 4,388 4,763 3,646
Carrots................................................................ 0 0 1,811 2,230 2,367 0 4,240 5,475
Corn, Sweet.........................................................................3,400 0 2,857 3,327 3,321 4,600 4,847 4,892
Cucumbers......................................................................220 0 104 229 217 437 661 498
Dry Onions....................................................................2,600 0 0 0 0 3,800 9,415 0
Green Peas........................................................................1,900 2,326 800 1,551 1,665 2,040 1,880 1,799
Total Value.................................................................................................8,630 2,842 8,130 8,909 10,136 15,915 26,821 17,399
Source: Statistics Canada, CANSIM Database Table Number 001-0013; and Alberta Agriculture and Forestry, Statistics and Data Development Section
Table 95: Sugar Beet Industry, Alberta, 2008-2015
Table 96: Major Commercial Vegetable Production, Alberta, 2008-2015
Harvested Area - Acres
Production - tonnes
Total Value - $'000
- 119 - Alberta Agriculture Statistics Yearbook, 2015

2006 2007 2008 2009 2010 2011 2012 2013 2014 2015p
Alfalfa..............................................................................14,458 17,030 17,600 18,235 21,265 20,028 21,953 24,916 27,602 36,985
Bromegrass................................................7,135 9,374 9,515 7,904 5,958 4,557 3,277 3,639 3,315 3,495
Clover.............................................................................1,837 1,814 1,962 1,300 1,303 1,620 1,936 1,693 1,285 1,536
Fescue...........................................................13,494 10,733 14,492 11,091 9,640 6,587 6,641 6,897 4,952 8,016
Ryegrass..........................................................................893 470 108 36 201 264 300 270 - 680
Timothy............................................................10,388 12,061 13,094 11,360 9,226 8,486 12,157 15,633 16,272 15,966
Wheatgrass.....................................................................5,606 6,818 4,425 4,479 5,359 4,653 3,495 2,516 3,215 3,349
Source: Canadian Seed Growers Association
2006 2007 2008 2009 2010 2011 2012 2013 2014 2015p
Wheat.................................................................76,131 55,129 66,035 67,825 77,658 90,125 84,014 97,055 68,003 78,516
Oats......................................................................6,430 5,013 3,229 4,005 7,548 6,951 4,467 5,933 4,264 5,724
Barley.....................................................................50,053 55,914 50,226 49,703 44,396 59,750 58,161 55,777 43,555 49,538
Other Cereals...........................................................1,393 3,147 1,822 2,294 2,626 2,944 2,148 4,075 5,384 3,425
Flax....................................................................................2,264 1,684 2,511 2,818 4,170 4,604 2,705 5,168 7,493 8,363
Oilseeds.............................................................................31,641 49,554 63,051 48,479 49,989 58,510 60,901 68,167 55,254 47,123
Special Crops.............................................................16,715 20,156 21,095 22,614 26,686 23,256 26,912 33,972 38,738 41,860
Source: Canadian Seed Growers Association
2005-06 2006-07 2007-08 2008-09 2009-10 2010-11 2011-12 2012-13 2013-14 2014-15p
Total Seed........................................24,595,201 25,385,218 25,193,714 26,387,763 26,305,396 26,735,092 29,480,516 30,977,284 32,074,607 31,520,747
Commercial Seed................................21,506,462 22,328,581 21,532,489 22,920,796 23,201,499 22,947,425 24,824,359 26,169,533 27,242,291 27,061,215
Pedigree Seed...............................3,088,739 3,056,637 3,661,225 3,466,967 3,103,897 3,787,667 4,656,157 4,807,751 4,832,316 4,458,772
Dockage Removed...................................4,680,927 4,028,603 3,124,242 5,186,168 4,417,341 6,278,109 12,782,393 5,643,648 7,519,974 6,489,825
Cleaning
Total.............................................................29,276,128 29,413,821 27,878,323 31,573,931 30,722,737 33,013,201 42,262,909 36,620,932 39,594,581 38,010,572
Per Plant Average....................................385,212 392,184 388,000 471,000 445,000 472,000 604,000 530,738 590,964 567,322
Treated Seed........................................2,039,839 1,974,958 2,020,647 2,174,138 2,011,883 2,132,741 2,341,645 2,689,893 2,603,611 2,670,735
Table 97: Alberta Forage Seed Crops Inspected for Pedigree Status,
2006-2015
Table 98: Alberta Pedigreed Acres, 2006-2015
Acres
Acres
Source: Association of Alberta Co-Op Seed Cleaning Plants
Bushels
Table 99: Municipal Co-Operative Seed Cleaning in Alberta, 2005-06 to
2014-15
Alberta Agriculture Statistics Yearbook, 2015 - 120 -

All Wheat Oats Barley All Rye Flaxseed Canola
1978........................................................ 599 386 1,350 25 3 14
1979...............................................................1,361 355 1,393 97 5 91
1980.............................................................. 680 232 500 56 2 120
1981....................................................... 355 230 610 20 10 170
1982........................................................ 1,010 230 1,070 38 3 34
1983........................................................ 500 350 1,560 60 8 15
1984......................................................... 480 200 570 30 3 3
1985......................................................... 260 180 450 35 7 30
1986.......................................................... 200 170 400 35 2 85
1987........................................................ 930 450 700 40 10 70
1988.......................................................... 550 350 1,200 60 0 40
1989......................................................... 220 250 600 40 0 190
1990...................................................... 245 400 550 40 5 100
1991..................................................... 320 350 750 25 30 50
1992........................................................ 750 200 850 10 30 120
1993...................................................... 850 220 850 10 5 30
1994......................................................... 1,195 390 1,050 10 0 20
1995...................................................... 215 300 600 15 0 70
1996............................................ 320 150 475 5 10 200
1997............................................. 600 250 900 5 5 90
1998........................................ 315 250 800 5 0 40
1999........................................ 300 350 1,100 20 10 130
2000........................................ 440 400 1,150 30 15 450
2001........................................ 570 280 850 15 5 190
2002........................................ 490 120 750 10 0 150
2003........................................ 280 100 450 0 5 100
2004........................................ 400 300 750 5 0 50
2005........................………………….. 800 275 1,200 35 0 300
2006........................………………….. 1,440 320 1,330 50 25 350
2007........................………………….. 820 180 550 25 33 250
2008........................………………….. 180 225 670 10 2 165
2009........................………………….. 440 300 1,100 25 15 335
2010........................………………….. 775 205 800 30 10 250
2011........................………………….. 1,535 300 800 10 5 250
2012........................………………….. 680 250 600 1 15 55
2013r........................………………….. 510 140 425 1 1 65
2014r........................………………….. 1,785 195 850 3 1 480
2015p........................………………….. 890 150 600 8 5 370
1.3
Table 100: Stocks of Grain on Alberta Farms on July 31, 1978-2015
'000 tonnes
Source: Statistics Canada, CANSIM Database Table Number 001-0040
Source: Statistics Canada, CANSIM Database Table Number 001-0040
0
200
400
600
800
1,000
1,200
1,400
1,600
1,800
2,000
2005 2006 2007 2008 2009 2010 2011 2012 2013 2014 2015
'000 t
on
nes
Barley
Wheat
Fig. 35 Stocks of Wheat and Barley on Alberta Farms on July 31, 2005-2015
- 121 - Alberta Agriculture Statistics Yearbook, 2015
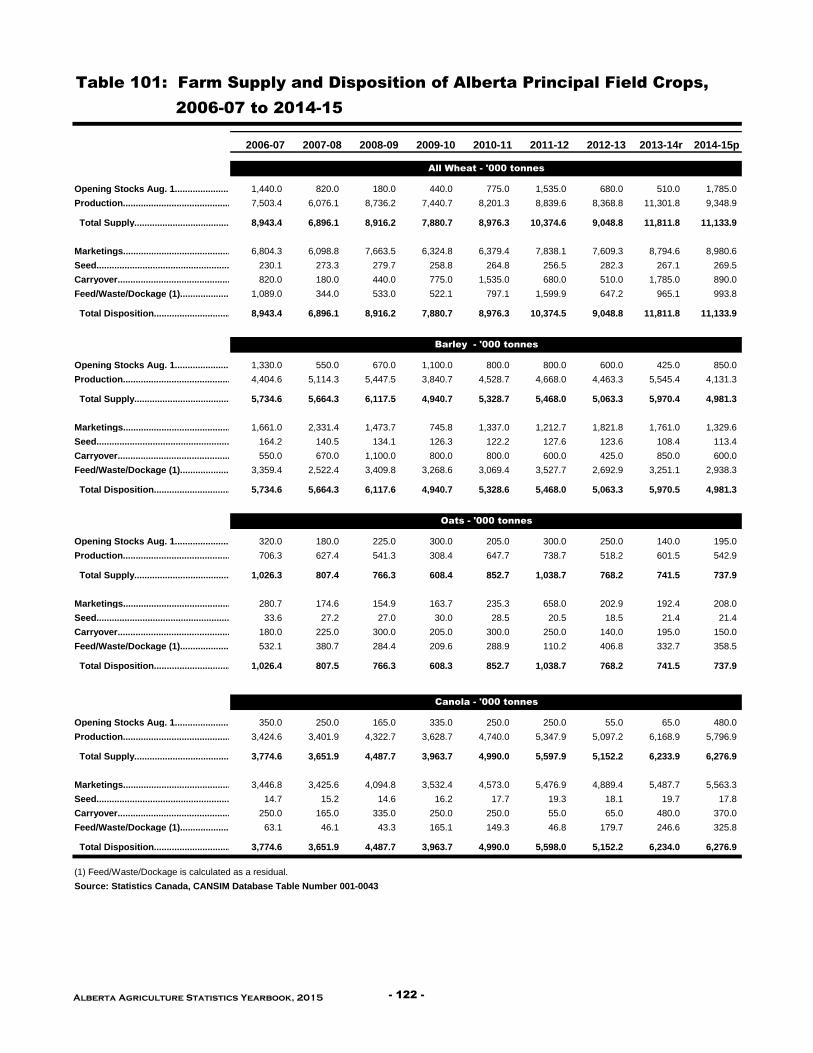
2006-07 2007-08 2008-09 2009-10 2010-11 2011-12 2012-13 2013-14r 2014-15p
Opening Stocks Aug. 1...................... 1,440.0 820.0 180.0 440.0 775.0 1,535.0 680.0 510.0 1,785.0
Production.........................................................7,503.4 6,076.1 8,736.2 7,440.7 8,201.3 8,839.6 8,368.8 11,301.8 9,348.9
Total Supply....................................................................8,943.4 6,896.1 8,916.2 7,880.7 8,976.3 10,374.6 9,048.8 11,811.8 11,133.9
Marketings.......................................................................6,804.3 6,098.8 7,663.5 6,324.8 6,379.4 7,838.1 7,609.3 8,794.6 8,980.6
Seed.......................................................................................230.1 273.3 279.7 258.8 264.8 256.5 282.3 267.1 269.5
Carryover......................................................................820.0 180.0 440.0 775.0 1,535.0 680.0 510.0 1,785.0 890.0
Feed/Waste/Dockage (1).....................................................1,089.0 344.0 533.0 522.1 797.1 1,599.9 647.2 965.1 993.8
Total Disposition...............................................................8,943.4 6,896.1 8,916.2 7,880.7 8,976.3 10,374.5 9,048.8 11,811.8 11,133.9
Opening Stocks Aug. 1.........................................1,330.0 550.0 670.0 1,100.0 800.0 800.0 600.0 425.0 850.0
Production.........................................................4,404.6 5,114.3 5,447.5 3,840.7 4,528.7 4,668.0 4,463.3 5,545.4 4,131.3
Total Supply......................................................5,734.6 5,664.3 6,117.5 4,940.7 5,328.7 5,468.0 5,063.3 5,970.4 4,981.3
Marketings.........................................................1,661.0 2,331.4 1,473.7 745.8 1,337.0 1,212.7 1,821.8 1,761.0 1,329.6
Seed.........................................................................164.2 140.5 134.1 126.3 122.2 127.6 123.6 108.4 113.4
Carryover........................................................550.0 670.0 1,100.0 800.0 800.0 600.0 425.0 850.0 600.0
Feed/Waste/Dockage (1).......................................3,359.4 2,522.4 3,409.8 3,268.6 3,069.4 3,527.7 2,692.9 3,251.1 2,938.3
Total Disposition.................................................5,734.6 5,664.3 6,117.6 4,940.7 5,328.6 5,468.0 5,063.3 5,970.5 4,981.3
Opening Stocks Aug. 1.........................................320.0 180.0 225.0 300.0 205.0 300.0 250.0 140.0 195.0
Production.........................................................706.3 627.4 541.3 308.4 647.7 738.7 518.2 601.5 542.9
Total Supply......................................................1,026.3 807.4 766.3 608.4 852.7 1,038.7 768.2 741.5 737.9
Marketings.........................................................280.7 174.6 154.9 163.7 235.3 658.0 202.9 192.4 208.0
Seed.........................................................................33.6 27.2 27.0 30.0 28.5 20.5 18.5 21.4 21.4
Carryover........................................................180.0 225.0 300.0 205.0 300.0 250.0 140.0 195.0 150.0
Feed/Waste/Dockage (1).......................................532.1 380.7 284.4 209.6 288.9 110.2 406.8 332.7 358.5
Total Disposition.................................................1,026.4 807.5 766.3 608.3 852.7 1,038.7 768.2 741.5 737.9
Opening Stocks Aug. 1.........................................350.0 250.0 165.0 335.0 250.0 250.0 55.0 65.0 480.0
Production.........................................................3,424.6 3,401.9 4,322.7 3,628.7 4,740.0 5,347.9 5,097.2 6,168.9 5,796.9
Total Supply......................................................3,774.6 3,651.9 4,487.7 3,963.7 4,990.0 5,597.9 5,152.2 6,233.9 6,276.9
Marketings............................................................................3,446.8 3,425.6 4,094.8 3,532.4 4,573.0 5,476.9 4,889.4 5,487.7 5,563.3
Seed.........................................................................14.7 15.2 14.6 16.2 17.7 19.3 18.1 19.7 17.8
Carryover........................................................250.0 165.0 335.0 250.0 250.0 55.0 65.0 480.0 370.0
Feed/Waste/Dockage (1).......................................63.1 46.1 43.3 165.1 149.3 46.8 179.7 246.6 325.8
Total Disposition.................................................3,774.6 3,651.9 4,487.7 3,963.7 4,990.0 5,598.0 5,152.2 6,234.0 6,276.9
(1) Feed/Waste/Dockage is calculated as a residual.
Source: Statistics Canada, CANSIM Database Table Number 001-0043
Table 101: Farm Supply and Disposition of Alberta Principal Field Crops,
2006-07 to 2014-15
All Wheat - '000 tonnes
Barley - '000 tonnes
Oats - '000 tonnes
Canola - '000 tonnes
Alberta Agriculture Statistics Yearbook, 2015 - 122 -

2008 2009 2010 2011 2012 2013 2014 2015p
Aetna..............................................................…........................................................3,699 3,699 4,389 4,390 4,376 4,376 4,511 4,607
Bow River.............................................................….....................233,869 233,438 233,925 234,014 234,327 241,604 254,909 258,114
Eastern..............................................................….....................285,086 294,612 290,429 294,373 294,620 296,619 297,884 298,763
Leavitt....................................................................…................5,126 4,706 4,793 4,848 4,840 4,853 4,876 4,898
Lethbridge Northern........................................................…...........................176,069 176,201 176,282 176,187 177,593 179,014 179,719 180,007
Magrath...................................................................….....................18,300 18,300 18,300 18,300 18,300 18,300 18,300 18,300
Mountain View..........................................................…............................3,700 3,700 3,700 3,617 3,616 3,698 3,698 3,711
Raymond.............................................................…..........................46,293 46,303 46,302 46,302 46,402 46,500 46,500 46,500
Ross Creek..........................................................…..........................1,101 1,101 1,101 1,101 1,101 1,101 1,101 1,101
St. Mary's River........................................................…...........................373,162 373,092 373,018 374,408 373,835 380,371 388,039 390,497
Taber...................................................................….....................82,600 82,569 82,728 82,773 82,750 82,822 83,263 83,584
United.............................................................…......................34,069 34,325 34,370 34,382 34,382 34,393 34,395 34,391
Western........................................................….............................96,079 96,045 95,628 95,754 95,788 95,776 95,641 95,516
Total..............................................................…........................1,359,153 1,368,091 1,364,965 1,370,449 1,371,930 1,389,427 1,412,836 1,419,989
Aetna........................................................................…...................2,361 2,361 150 2,961 2,797 3,285 1,611 1,611
Bow River.................................................................….................206,284 211,578 182,483 202,478 208,217 217,417 224,952 239,957
Eastern...............................................................…....................280,691 285,191 284,127 294,569 294,748 295,923 297,015 297,930
Leavitt................................................................…....................4,763 4,706 0 4,714 4,625 1,736 1,736 1,736
Lethbridge Northern.........................................................…..........................175,886 174,487 176,393 175,683 177,593 178,697 179,296 179,625
Magrath..........................................................…..............................13,420 14,866 5,688 12,774 14,175 14,386 14,305 16,182
Mountain View............................................................…..........................3,509 3,500 500 2,920 535 608 1,801 1,746
Raymond................................................................….......................38,617 40,174 17,481 37,163 39,560 39,839 37,511 43,378
Ross Creek.........................................................…...........................0 800 374 770 878 770 897 897
St. Mary's River.......................................................…............................352,564 352,104 340,078 346,079 338,439 338,588 362,254 370,590
Taber...............................................................….........................77,132 77,571 72,989 75,048 76,775 76,002 75,838 77,123
United..................................................................….................21,735 23,383 17,333 21,003 22,655 22,708 21,044 34,391
Western.................................................................…....................48,126 64,196 48,700 42,270 52,483 49,791 60,587 67,800
Total..............................................................…........................1,225,088 1,254,916 1,146,296 1,218,432 1,233,480 1,239,750 1,278,847 1,332,966
2008 2009 2010 2011 2012 2013 2014 2015p
Cereals....................................................................................….................................…456,907 453,636 426,826 429,805 423,112 483,144 458,084 457,943
Forages..............................................................................….......................................…516,321 515,956 512,310 473,073 444,947 430,036 445,907 463,331
Oilseeds...............................................................…......................................................…195,962 181,309 183,895 191,153 208,168 191,585 198,543 196,696
Specialty Crops.......................................................…...........................................................................….............…153,961 179,009 184,499 213,150 248,461 240,748 258,839 257,934
Other............................................................................….........................................…36,002 38,181 57,434 63,268 47,242 43,914 50,958 42,726
Total Crops...............................................................…....................................................................…............…1,359,153 1,368,091 1,364,964 1,370,449 1,371,930 1,389,427 1,412,331 1,418,629
Source: Alberta Agriculture and Forestry, Irrigation and Farm Water Branch
Acres
Cereals: Barley, CPS Wheat, Durum, Grain Corn, Hard Spring Wheat, Malt
Barley, Oats, Rye, Soft Wheat, Triticale, and Winter Wheat.
Forages: Alfalfa Hay and Silage, Barley Silage, Brome Hay, Corn Silage,
Grass Hay, Green Feed, Milk Vetch, Millet, Native Pasture, Oats Silage,
Sorghum/Sudan Grass, Tame Pasture, Timothy Hay, Triticale Silage.
Oilseeds: Canola, Flax, Mustard.
Specialty Crops: Alfalfa Seed, Canary Seed, Canola Seed, Caraway Seed, Carrots,
Dill, Dry Beans, Dry Peas, Faba Beans, Fresh Corn (sweet), Fresh Peas, Grass Seed,
Hemp, Lawn Turf, Lentils, Market Gardens, Mint, Monarda, Nursery, Onions, Potatoes,
Safflower, Seed Potatoes, Small Fruit, Soy Beans, Sugar Beets, Sunflower.
Other: Miscellaneous, Non Crop, Summerfallow, Unknown (not reported).
Table 102: Irrigation in Alberta by District, 2008-2015
Assessment Roll Acres
Acres Actually Irrigated
Source: Alberta Agriculture and Forestry, Irrigation and Farm Water Branch
Table 103: Crop Area Assessment in Alberta Irrigation Districts, 2008-2015
- 123 - Alberta Agriculture Statistics Yearbook, 2015

Average 2015 as a %
1961-2015
Average
2011 2012 2013 2014 2015 of Average
Athabasca AGCM....................................................... 340.4 381.2 365.8 244.5 291.2 241.0 70.8
Barrhead CS....................................................... 347.2 431.5 363.6 282.8 296.5 182.4 52.5
Beaverlodge RCS....................................................... 290.3 292.5 180.7 334.1 225.0 258.1 88.9
Brooks CDA....................................................... 244.7 193.7 309.8 279.6 239.5 145.5 59.5
Calgary Int'L CS....................................................... 332.8 376.3 312.5 381.4 285.8 292.7 88.0
Cardston............................................................ 349.7 312.7 245.8 314.7 348.2 234.0 66.9
Champion AGDM....................................................... 300.8 274.4 288.1 311.1 265.8 243.0 80.8
Cleardale AGDM....................................................... 283.0 298.3 192.0 363.4 185.3 168.2 59.4
Coronation Climate.......................................................275.6 215.1 336.6 264.3 310.1 321.7 116.7
Dupre AGCM....................................................... 326.0 336.2 333.7 217.5 344.8 234.7 72.0
Fincastle IMCIN....................................................... 267.4 240.1 323.5 322.3 306.1 164.3 61.5
Fort Vermilion....................................................... 275.3 153.5 204.7 227.7 168.0 96.5 35.0
Hawk Hills AGCM....................................................... 275.7 280.6 171.1 220.9 198.8 144.6 52.4
Jean Cote AGCM....................................................... 289.3 437.9 291.7 307.1 167.4 188.6 65.2
Killam AGDM....................................................... 300.9 255.8 315.5 218.9 323.6 271.6 90.3
Kitscoty AGCM....................................................... 307.8 350.6 382.3 233.9 289.6 226.9 73.7
La Crete AGCM....................................................... 295.1 189.4 188.3 196.2 146.0 114.5 38.8
Lacombe CDA 2....................................................... 345.8 381.7 305.8 344.6 290.7 310.1 89.7
Lethbridge Demo Farm IMCIN.......................................................293.4 312.4 273.6 356.0 384.8 172.9 58.9
Mayerthorpe....................................................... 386.3 417.7 426.3 381.7 266.7 231.9 60.0
Medicine Hat RCS.......................................................245.9 174.7 244.5 311.2 348.6 135.2 55.0
Morrin AGDM....................................................... 278.9 293.0 304.9 216.9 365.7 324.6 116.4
Olds College AGDM.......................................................366.9 295.3 380.3 381.5 409.3 389.6 106.2
Oliver AGDM....................................................... 329.4 269.8 355.0 327.4 292.4 235.7 71.6
Onefour CDA....................................................... 240.1 204.5 202.4 413.1 273.5 159.0 66.2
Oyen AGDM....................................................... 242.6 223.6 263.2 224.4 263.5 220.5 90.9
Peoria AGDM....................................................... 323.6 380.1 267.6 319.2 169.4 167.5 51.8
Pincher Creek Cr10.......................................................363.0 327.8 267.6 441.8 352.3 261.0 71.9
Stettler AGDM....................................................... 335.3 287.6 279.4 313.5 321.0 327.0 97.5
Valleyview AGDM....................................................... 342.5 348.0 291.5 284.1 212.1 249.7 72.9
Vegreville....................................................... 293.7 266.7 326.1 228.2 307.9 235.7 80.3
Vilna AGCM....................................................... 329.2 271.7 346.6 243.4 344.2 262.3 79.7
Violet Grove CS....................................................... 437.3 406.7 426.2 329.1 300.4 318.8 72.9
Wainwright CFB Airfield 21.......................................................294.1 172.7 347.2 264.6 316.1 273.2 92.9
Wetaskiwin AGCM.......................................................357.5 315.2 365.7 280.4 294.9 237.3 66.4
2009 2010 2011 2012 2013 2014r 2015p
Insured - Number of Contracts.....................…......……..……....…......……..……13,049 13,297 12,825 12,730 12,660 12,087 11,871
Acres Insured - '000..............….......................................................…...........…12,930 13,292 13,538 14,261 14,682 14,539 14,731
Premiums - $'000..............…....................................................…..............…315,495 306,251 398,726 429,679 488,916 364,325 368,861
Liability - $'000..............….......................................................…...........…2,656,514 3,128,183 3,790,961 4,547,037 4,270,367 3,430,349 3,913,877
Indeminities - $'000..................................................................……..............…257,863 208,991 129,560 153,824 37,670 109,257 204,289
Source: Agriculture Financial Services Corporation
Note: This table only includes the basic crop insurance program, covering principal field crops, processing vegetables, honey, corn heat units, silage and
greenfeed. It does not include the Hail Endorsement, Spring Price Endorsement, Revenue Insurance Coverage, Straight Hail Insurance, Forage Insurance, the
Wildlife and Waterfowl Compensation Program or the Income Stabilization programs (Canadian Agricultural Income Stabilization (CAIS) or AgriStability programs).
Table 104: Precipitation at Selected Alberta Weather Stations(1),
2011-2015
Millimetres (April 1 to September 30)
(1) See reference map on the following page.
Note: Data was provided through the Agro Climatic Information Service (ACIS) and is subject to revision. The latest data for these and other stations can be found
on ACIS, at www.agric.gov.ab.ca/acis, by clicking on Station Data.
Source: Alberta Agriculture and Forestry, Environmental Stewardship Branch, Agrometerology Application and Modeling Unit
Table 105: Alberta Crop Insurance, 2009-2015 (as of March 31, 2016)
Alberta Agriculture Statistics Yearbook, 2015 - 124 -

x
Compiled by Alberta Agriculture and Forestry, Environmental Stewardship Branch, Land Use Unit
- 125 - Alberta Agriculture Statistics Yearbook, 2015

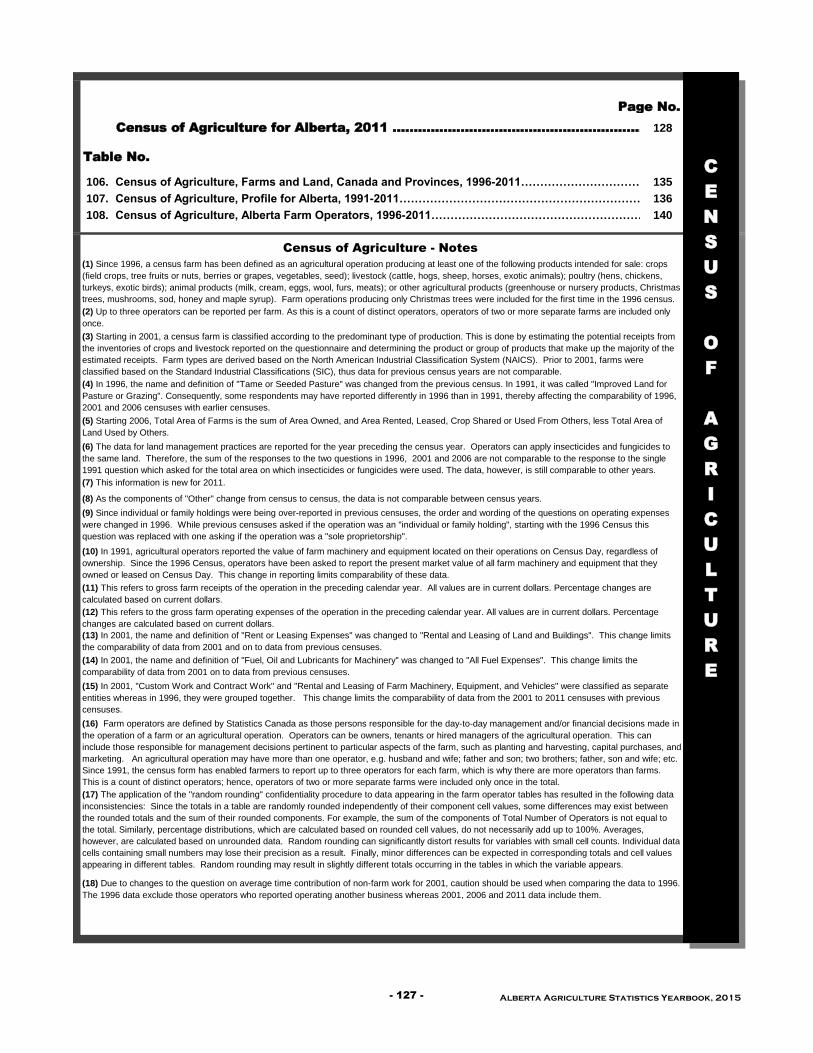
Page No.
Census of Agriculture for Alberta, 2011 …………………………………………………..…………………………………….128
Table No.
106. Census of Agriculture, Farms and Land, Canada and Provinces, 1996-2011…………………………………………………………………………………………………………………………………………………………………………………………………………….. .135
107. Census of Agriculture, Profile for Alberta, 1991-2011…………………………………………………………………………………………………………………………………………………………………………………………………………….. .136
108. Census of Agriculture, Alberta Farm Operators, 1996-2011…………………………………………………………………………………………………………………………………………………………………………………………………………….. .140
Census of Agriculture - Notes
(1) Since 1996, a census farm has been defined as an agricultural operation producing at least one of the following products intended for sale: crops
(field crops, tree fruits or nuts, berries or grapes, vegetables, seed); livestock (cattle, hogs, sheep, horses, exotic animals); poultry (hens, chickens,
turkeys, exotic birds); animal products (milk, cream, eggs, wool, furs, meats); or other agricultural products (greenhouse or nursery products, Christmas
trees, mushrooms, sod, honey and maple syrup). Farm operations producing only Christmas trees were included for the first time in the 1996 census.
(2) Up to three operators can be reported per farm. As this is a count of distinct operators, operators of two or more separate farms are included only
once.
(3) Starting in 2001, a census farm is classified according to the predominant type of production. This is done by estimating the potential receipts from
the inventories of crops and livestock reported on the questionnaire and determining the product or group of products that make up the majority of the
estimated receipts. Farm types are derived based on the North American Industrial Classification System (NAICS). Prior to 2001, farms were
classified based on the Standard Industrial Classifications (SIC), thus data for previous census years are not comparable.
(4) In 1996, the name and definition of "Tame or Seeded Pasture" was changed from the previous census. In 1991, it was called "Improved Land for
Pasture or Grazing". Consequently, some respondents may have reported differently in 1996 than in 1991, thereby affecting the comparability of 1996,
2001 and 2006 censuses with earlier censuses.
(5) Starting 2006, Total Area of Farms is the sum of Area Owned, and Area Rented, Leased, Crop Shared or Used From Others, less Total Area of
Land Used by Others.
(6) The data for land management practices are reported for the year preceding the census year. Operators can apply insecticides and fungicides to
the same land. Therefore, the sum of the responses to the two questions in 1996, 2001 and 2006 are not comparable to the response to the single
1991 question which asked for the total area on which insecticides or fungicides were used. The data, however, is still comparable to other years.
(7) This information is new for 2011.
(8) As the components of "Other" change from census to census, the data is not comparable between census years.
(9) Since individual or family holdings were being over-reported in previous censuses, the order and wording of the questions on operating expenses
were changed in 1996. While previous censuses asked if the operation was an "individual or family holding", starting with the 1996 Census this
question was replaced with one asking if the operation was a "sole proprietorship".
(10) In 1991, agricultural operators reported the value of farm machinery and equipment located on their operations on Census Day, regardless of
ownership. Since the 1996 Census, operators have been asked to report the present market value of all farm machinery and equipment that they
owned or leased on Census Day. This change in reporting limits comparability of these data.
(17) The application of the "random rounding" confidentiality procedure to data appearing in the farm operator tables has resulted in the following data
inconsistencies: Since the totals in a table are randomly rounded independently of their component cell values, some differences may exist between
the rounded totals and the sum of their rounded components. For example, the sum of the components of Total Number of Operators is not equal to
the total. Similarly, percentage distributions, which are calculated based on rounded cell values, do not necessarily add up to 100%. Averages,
however, are calculated based on unrounded data. Random rounding can significantly distort results for variables with small cell counts. Individual data
cells containing small numbers may lose their precision as a result. Finally, minor differences can be expected in corresponding totals and cell values
appearing in different tables. Random rounding may result in slightly different totals occurring in the tables in which the variable appears.
(18) Due to changes to the question on average time contribution of non-farm work for 2001, caution should be used when comparing the data to 1996.
The 1996 data exclude those operators who reported operating another business whereas 2001, 2006 and 2011 data include them.
(11) This refers to gross farm receipts of the operation in the preceding calendar year. All values are in current dollars. Percentage changes are
calculated based on current dollars.
(12) This refers to the gross farm operating expenses of the operation in the preceding calendar year. All values are in current dollars. Percentage
changes are calculated based on current dollars.
(13) In 2001, the name and definition of "Rent or Leasing Expenses" was changed to "Rental and Leasing of Land and Buildings". This change limits
the comparability of data from 2001 and on to data from previous censuses.
(14) In 2001, the name and definition of "Fuel, Oil and Lubricants for Machinery" was changed to "All Fuel Expenses". This change limits the
comparability of data from 2001 on to data from previous censuses.
(15) In 2001, "Custom Work and Contract Work" and "Rental and Leasing of Farm Machinery, Equipment, and Vehicles" were classified as separate
entities whereas in 1996, they were grouped together. This change limits the comparability of data from the 2001 to 2011 censuses with previous
censuses.
(16) Farm operators are defined by Statistics Canada as those persons responsible for the day-to-day management and/or financial decisions made in
the operation of a farm or an agricultural operation. Operators can be owners, tenants or hired managers of the agricultural operation. This can
include those responsible for management decisions pertinent to particular aspects of the farm, such as planting and harvesting, capital purchases, and
marketing. An agricultural operation may have more than one operator, e.g. husband and wife; father and son; two brothers; father, son and wife; etc.
Since 1991, the census form has enabled farmers to report up to three operators for each farm, which is why there are more operators than farms.
This is a count of distinct operators; hence, operators of two or more separate farms were included only once in the total.
C
E
N
S
U
S
O
F
A
G
R
I
C
U
L
T
U
R
E
- 127 - Alberta Agriculture Statistics Yearbook, 2015
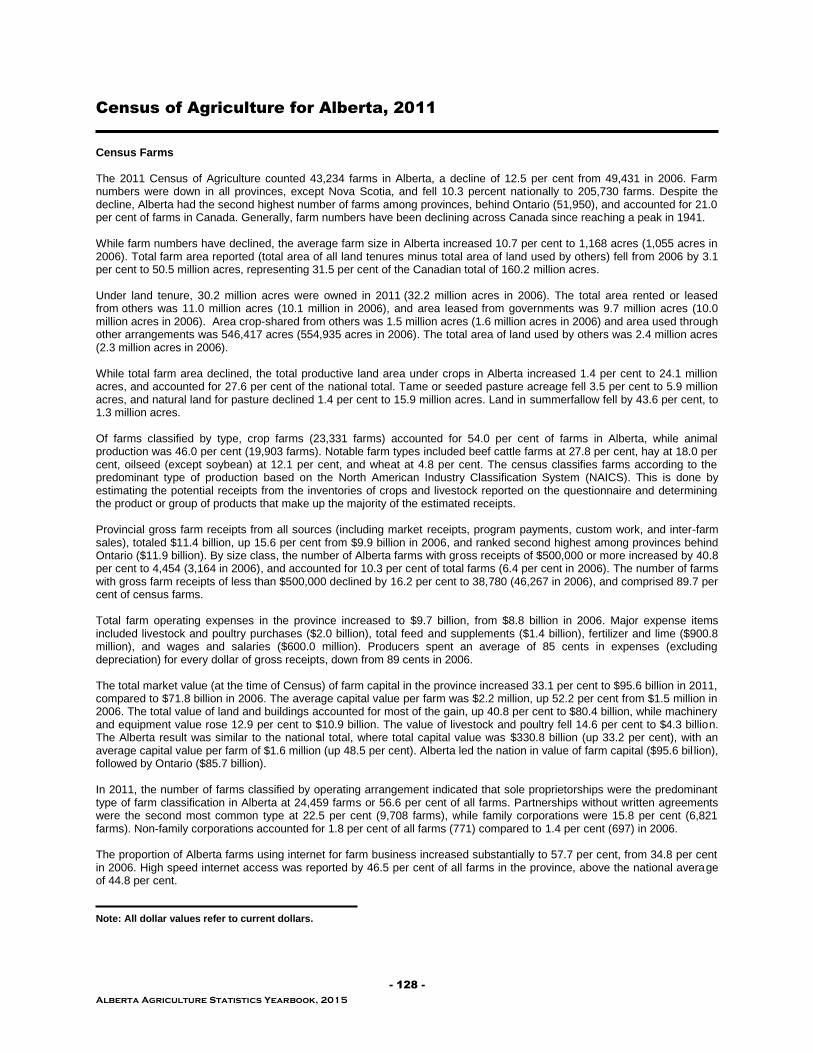
Alberta Agriculture Statistics Yearbook, 2015
- 128 -
Census of Agriculture for Alberta, 2011
Census Farms The 2011 Census of Agriculture counted 43,234 farms in Alberta, a decline of 12.5 per cent from 49,431 in 2006. Farm numbers were down in all provinces, except Nova Scotia, and fell 10.3 percent nationally to 205,730 farms. Despite the decline, Alberta had the second highest number of farms among provinces, behind Ontario (51,950), and accounted for 21.0 per cent of farms in Canada. Generally, farm numbers have been declining across Canada since reaching a peak in 1941. While farm numbers have declined, the average farm size in Alberta increased 10.7 per cent to 1,168 acres (1,055 acres in 2006). Total farm area reported (total area of all land tenures minus total area of land used by others) fell from 2006 by 3.1 per cent to 50.5 million acres, representing 31.5 per cent of the Canadian total of 160.2 million acres. Under land tenure, 30.2 million acres were owned in 2011 (32.2 million acres in 2006). The total area rented or leased from others was 11.0 million acres (10.1 million in 2006), and area leased from governments was 9.7 million acres (10.0 million acres in 2006). Area crop-shared from others was 1.5 million acres (1.6 million acres in 2006) and area used through other arrangements was 546,417 acres (554,935 acres in 2006). The total area of land used by others was 2.4 million acres (2.3 million acres in 2006). While total farm area declined, the total productive land area under crops in Alberta increased 1.4 per cent to 24.1 million acres, and accounted for 27.6 per cent of the national total. Tame or seeded pasture acreage fell 3.5 per cent to 5.9 million acres, and natural land for pasture declined 1.4 per cent to 15.9 million acres. Land in summerfallow fell by 43.6 per cent, to 1.3 million acres. Of farms classified by type, crop farms (23,331 farms) accounted for 54.0 per cent of farms in Alberta, while animal production was 46.0 per cent (19,903 farms). Notable farm types included beef cattle farms at 27.8 per cent, hay at 18.0 per cent, oilseed (except soybean) at 12.1 per cent, and wheat at 4.8 per cent. The census classifies farms according to the predominant type of production based on the North American Industry Classification System (NAICS). This is done by estimating the potential receipts from the inventories of crops and livestock reported on the questionnaire and determining the product or group of products that make up the majority of the estimated receipts. Provincial gross farm receipts from all sources (including market receipts, program payments, custom work, and inter-farm sales), totaled $11.4 billion, up 15.6 per cent from $9.9 billion in 2006, and ranked second highest among provinces behind Ontario ($11.9 billion). By size class, the number of Alberta farms with gross receipts of $500,000 or more increased by 40.8 per cent to 4,454 (3,164 in 2006), and accounted for 10.3 per cent of total farms (6.4 per cent in 2006). The number of farms with gross farm receipts of less than $500,000 declined by 16.2 per cent to 38,780 (46,267 in 2006), and comprised 89.7 per cent of census farms. Total farm operating expenses in the province increased to $9.7 billion, from $8.8 billion in 2006. Major expense items included livestock and poultry purchases ($2.0 billion), total feed and supplements ($1.4 billion), fertilizer and lime ($900.8 million), and wages and salaries ($600.0 million). Producers spent an average of 85 cents in expenses (excluding depreciation) for every dollar of gross receipts, down from 89 cents in 2006. The total market value (at the time of Census) of farm capital in the province increased 33.1 per cent to $95.6 billion in 2011, compared to $71.8 billion in 2006. The average capital value per farm was $2.2 million, up 52.2 per cent from $1.5 million in 2006. The total value of land and buildings accounted for most of the gain, up 40.8 per cent to $80.4 billion, while machinery and equipment value rose 12.9 per cent to $10.9 billion. The value of livestock and poultry fell 14.6 per cent to $4.3 billion. The Alberta result was similar to the national total, where total capital value was $330.8 billion (up 33.2 per cent), with an average capital value per farm of $1.6 million (up 48.5 per cent). Alberta led the nation in value of farm capital ($95.6 bil lion), followed by Ontario ($85.7 billion). In 2011, the number of farms classified by operating arrangement indicated that sole proprietorships were the predominant type of farm classification in Alberta at 24,459 farms or 56.6 per cent of all farms. Partnerships without written agreements were the second most common type at 22.5 per cent (9,708 farms), while family corporations were 15.8 per cent (6,821 farms). Non-family corporations accounted for 1.8 per cent of all farms (771) compared to 1.4 per cent (697) in 2006. The proportion of Alberta farms using internet for farm business increased substantially to 57.7 per cent, from 34.8 per cent in 2006. High speed internet access was reported by 46.5 per cent of all farms in the province, above the national average of 44.8 per cent. Note: All dollar values refer to current dollars.

Alberta Agriculture Statistics Yearbook, 2015
- 129 -
Alberta farms continued to adopt usage of environmentally friendly practices (no-till seeding and conservation tillage). No-till methods were used on 64.8 per cent of land prepared for seeding in 2011, up from 47.8 per cent in 2006. Conservation tillage was used on 22.5 per cent of the land prepared for seeding, down from 27.7 per cent five years previous. Conventional tillage fell to 12.8 per cent, from 24.5 per cent in 2006. There were 11,164 farms that indicated crop residue was baled, accounting for 2.2 million acres, or 9.3 per cent of the total provincial area in crops. This was the largest area reported in the country, at 38.0 per cent of the national total (5.9 million acres). The number of acres where herbicides, insecticides and/or fungicides were applied increased to 22.1 million acres (18.7 million acres in 2006). Application of commercial fertilizer rose 2.1 per cent to 17.6 million acres in 2011 (17.2 million acres in 2006). In 2011, there were 326 farms with certified organic and/or transitional production in the province. This represented 0.8 per cent of Alberta farms, below the national average of 2.0 per cent of farms reporting this type of production. Hay and field crop production were the most common, reported by 84 per cent of the organic farms. Farm Operators The number of farm operators in Alberta fell 13.4 per cent in 2011, to 62,050 (from 71,660 in 2006), in line with lower farm numbers. The decline in farm operators was not unique to Alberta and was evident across the other provinces, except Nova Scotia and British Columbia. Nationally, farm operator numbers dropped 10.1 per cent to 293,925. The average age of Alberta farm operators in 2011 was 54.5 years, up from 52.2 years in 2006. This was quite similar to the national trend where average age was 54.0 years, up from 52.0 years in 2006. The proportion of operators “55 years and over” has been increasing, and accounted for 49.6 per cent of operators in 2011 (41.1 per cent in 2006), while the proportion “under 35 years of age” has continued to decline, accounting for 7.3 per cent in 2011 (8.8 per cent in 2006). Operators in the “35 to 54 years” age class fell to 43.1 per cent (50.1 per cent in 2006). In 2011, there were 17,975 (29.0 per cent) female and 44,075 (79.0 per cent) male farm operators in the province. For Canada, the split was 27.4 per cent female and 72.6 per cent male. Among provinces, Alberta had the second highest proportion of female operators behind British Columbia (36.5 per cent). Of the 62,050 farm operators in Alberta, 40.5 per cent were on single operator farms (39.1 per cent in 2006), while 59.5 per cent were on farms with two or more operators (60.9 per cent in 2006). The percentage of Alberta farm operators reporting paid non-farm work declined from the previous census. Fifty-two per cent of Alberta farm operators (32,245) had paid non-farm work in the calendar year prior to the census, down from 54.6 per cent in 2006. For those that reported paid non-farm work, the majority of operators (60.1 per cent) worked 40 or fewer hours per week, while the remainder (39.9 per cent) had non-farm work of more than 40 hours per week. Nationally, there were 137,755 farm operators that reported paid non-farm work (46.9 per cent of total operators), down from 158,255 (48.4 per cent of total operators) in 2006. A total of 12,798 Alberta farms (29.6 per cent of all farms) reported having a total of 37,852 year-round, seasonal, or temporary employees. Of total employees, 58.8 per cent were seasonal or temporary, while 41.2 per cent were year-round (full or part-time). No data is available for 2006 as this was a new question.

Fig. 36 Number and Average Size of Alberta Farms, 1961-2011
Source: Statistics Canada, Census of Agriculture, 1961-2011
Fig. 37 Alberta Farms Classified by Total Farm Area, 1986-2011
Source: Statistics Canada, Census of Agriculture, 1986-2011
0
200
400
600
800
1,000
1,200
1,400
0
10
20
30
40
50
60
70
80
1961 1966 1971 1976 1981 1986 1991 1996 2001 2006 2011
Av
era
ge
Fa
rm S
ize
(A
cre
s)
Nu
mb
er
of
Fa
rms
(T
ho
us
an
ds
)
Number of Farms Average Farm Size (Acres)
1986 1991 1996 2001 2006 2011
7.6% 7.7% 10.1% 9.7% 11.4% 10.4%
36.9% 38.1%39.2% 38.5% 37.3% 37.8%
34.1% 32.2% 29.5% 28.4% 26.3% 25.2%
8.9% 9.1% 8.2% 8.2% 7.9% 7.7%
12.4% 13.0% 13.0% 15.2% 17.1% 18.8%
Per Cent Distribution
1,600 Acres and Over
1,120 -1,599 Acres
400 -1,119 Acres
70 - 399 Acres
Under 70 Acres
The number of census farms in Alberta has trended downwards over the years, while average farm size has trendedupwards. Between 1961 and 2011, farm numbers decreased 40.9 per cent, from 73,212 to 43,234. Average farm sizeincreased 81.1 per cent from 645 acres to 1,168 acres per farm.
Between 1986 and 2011, the percentage of farms sized 1,600 acres or more increased from 12.4 per cent to 18.8 percent, while the proportion of farms between 1,120 and 1,599 acres slightly decreased from 8.9 per cent to 7.7 per cent.During the same period, the percentage of farms between 400 and 1,119 acres dropped significantly from 34.1 per centto 25.2 per cent. While the percentage of farms between 70 and 399 acres has remained fairly steady at around 38 percent, farms less than 70 acres increased from 7.6 per cent to 10.4 per cent.
Alberta Agriculture Statistics Yearbook, 2015 - 130 -
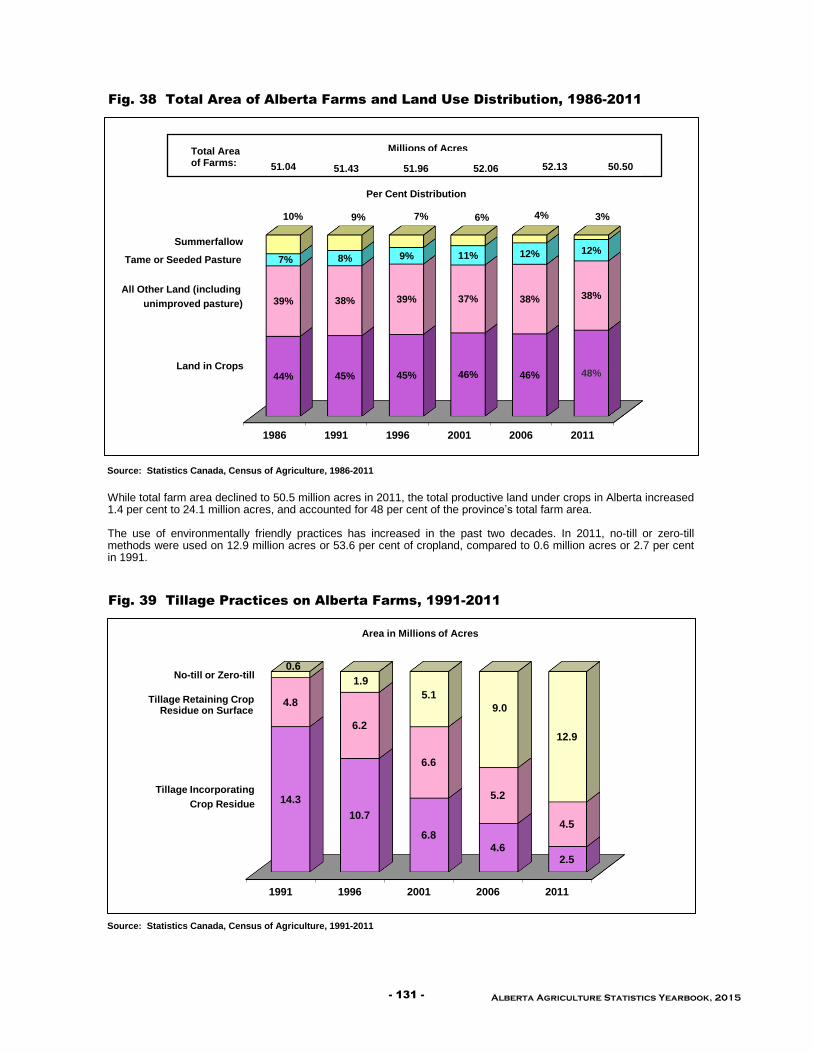
Fig. 38 Total Area of Alberta Farms and Land Use Distribution, 1986-2011
Source: Statistics Canada, Census of Agriculture, 1986-2011
Fig. 39 Tillage Practices on Alberta Farms, 1991-2011
Source: Statistics Canada, Census of Agriculture, 1991-2011
1991 1996 2001 2006 2011
14.3
10.7
6.8
4.62.5
4.8
6.2
6.6
5.2
4.5
0.6
1.9
5.1
9.0
12.9
1986 1991 1996 2001 2006 2011
44% 45% 45% 46% 46% 48%
39% 38% 39% 37% 38% 38%
7% 8% 9% 11% 12% 12%
10% 9% 7% 6% 4% 3%
51.04 51.43 51.96 52.06 52.13
Total Area of Farms:
Millions of Acres
Tillage Incorporating
Tillage Retaining Crop
No-till or Zero-till
Area in Millions of Acres
Land in Crops
All Other Land (including
Tame or Seeded Pasture
Summerfallow
Per Cent Distribution
While total farm area declined to 50.5 million acres in 2011, the total productive land under crops in Alberta increased1.4 per cent to 24.1 million acres, and accounted for 48 per cent of the province’s total farm area.
The use of environmentally friendly practices has increased in the past two decades. In 2011, no-till or zero-tillmethods were used on 12.9 million acres or 53.6 per cent of cropland, compared to 0.6 million acres or 2.7 per centin 1991.
50.50
Crop Residue
Residue on Surface
unimproved pasture)
- 131 - Alberta Agriculture Statistics Yearbook, 2015

Fig. 40 Alberta Farms Classified by Operating Arrangement, 1991-2011
Source: Statistics Canada, Census of Agriculture, 1991-2011
1991 1996 2001 2006 2011
62.7% 60.9% 56.7% 56.3% 56.6%
25.0% 23.7% 26.1% 25.2% 22.5%
4.3% 4.5% 4.0% 2.9% 2.9%
6.4% 8.9% 11.4% 13.6% 15.8%
1.1% 1.6% 1.4% 1.4% 1.8%
0.6% 0.3% 0.4% 0.6% 0.5%
* Includes institutions, community pastures, etc.
Source: Statistics Canada, Census of Agriculture, 1991-2011
1. Total Wheat
Spring wheat
Durum Wheat
Winter Wheat
2. Canola
3. Hay and Fodder Crops
4. Barley
5. Oats
6. Dry Field Peas
7. Mixed Grains
8. Forage Seed
9. Flaxseed
10. Mustard Seed
Source: Statistics Canada, Census of Agriculture, 2011
Family Corporation
62,958
Total (Top Ten Crops)
TOTAL (ALL CROPS)
23,669,541
24,102,289
201,511
131,933
69,743
6,703,703
Sole Proprietorship
Partnership With No
Written Agreement
Partnership With a
Written Agreement
706,726
891,580
Non-Family Corporation
Other Types*
6,071,744
Acres
Top Ten Crops Grown in Alberta, 2011
5,219,532
3,610,111
5,971,359
536,018
196,326
1991 1996 2001 2006 2011
62.7% 60.9% 56.7% 56.3% 56.6%
25.0%23.7%
26.1% 25.2% 22.5%
6.4% 8.9% 11.4% 13.6% 15.8%
Per Cent Distribution
Sole Proprietorship
Partnership With No Written Agreement
Partnership With a WrittenAgreement
Family Corporation
Non-family CorporationOther Types
Farm classified by operating arrangement indicatesthat sole proprietorships remained the predominanttype of farm operating arrangement in Alberta.However, the proportion has declined over theyears from 62.7 per cent in 1991 to 56.6 per cent in2011, while the proportions of partnerships andcorporations have increased. In 2011, partnershipswithout written agreements were the second mostcommon type, accounting for 22.5 per cent of farmsin the province, while the proportion of familycorporations was 15.8 per cent. Non-familycorporations accounted for 1.8 per cent of all farmscompared to 1.1 per cent in 1991.
In 2011, the top ten crops grown in Albertaaccounted for 98.2 per cent of the total area ofland in crops. While total wheat remains theprovince's leading field crop at 6.7 million acres,canola acreage increased significantly since2006, by 49.2 per cent, to 6.1 million acres, takingthe second place of the top ten crops.
For the first time, canola acreage surpassed theacreage of spring wheat (6.0 million acres), themajor component of total wheat.
Some specialty crops and pulses also sawmarked increases. These included dry peas (up20.3 per cent to 706,726 acres), lentils (up 803.2per cent to 97,775 acres), and sunflowers (up236.8 per cent to 6,035 acres).
Alberta Agriculture Statistics Yearbook, 2015 - 132 -
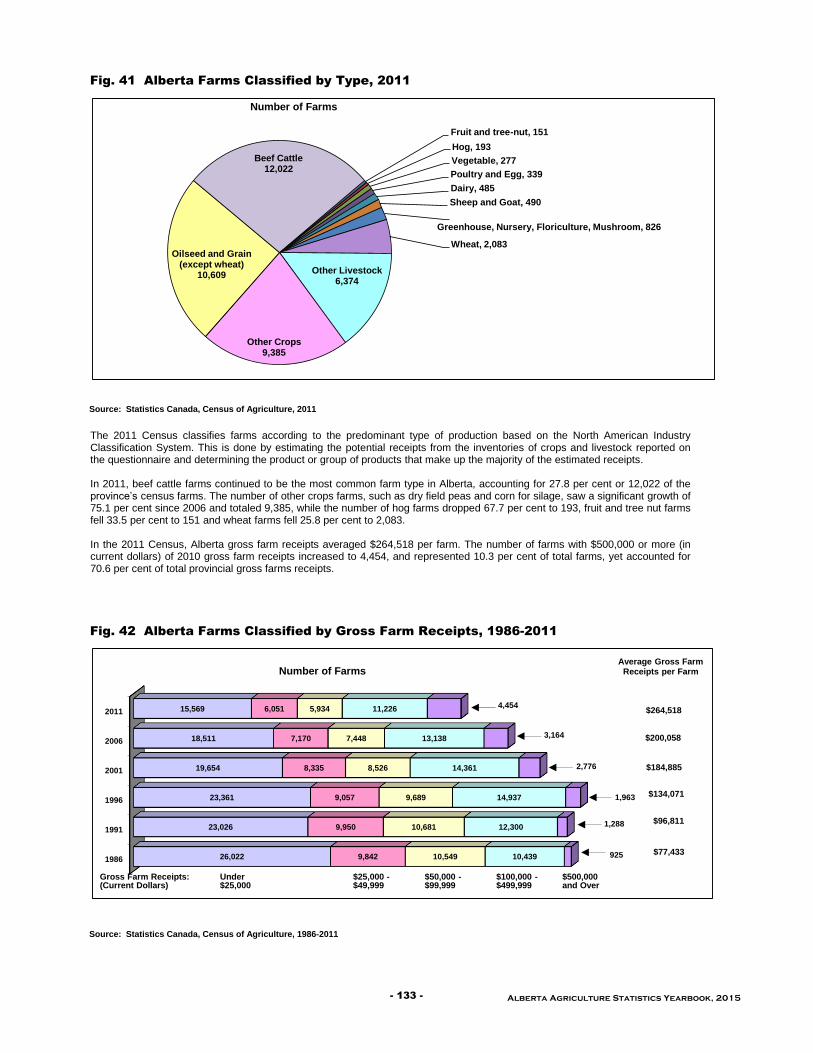
Fig. 41 Alberta Farms Classified by Type, 2011
Source: Statistics Canada, Census of Agriculture, 2011
Fig. 42 Alberta Farms Classified by Gross Farm Receipts, 1986-2011
Source: Statistics Canada, Census of Agriculture, 1986-2011
Fruit and tree-nut, 151
Hog, 193
Vegetable, 277
Poultry and Egg, 339
Dairy, 485
Sheep and Goat, 490
Wheat, 2,083
Other Livestock 6,374
Other Crops 9,385
Oilseed and Grain (except wheat)
10,609
Beef Cattle12,022
Greenhouse, Nursery, Floriculture, Mushroom, 826
Number of Farms
The 2011 Census classifies farms according to the predominant type of production based on the North American IndustryClassification System. This is done by estimating the potential receipts from the inventories of crops and livestock reported onthe questionnaire and determining the product or group of products that make up the majority of the estimated receipts.
In 2011, beef cattle farms continued to be the most common farm type in Alberta, accounting for 27.8 per cent or 12,022 of theprovince’s census farms. The number of other crops farms, such as dry field peas and corn for silage, saw a significant growth of75.1 per cent since 2006 and totaled 9,385, while the number of hog farms dropped 67.7 per cent to 193, fruit and tree nut farmsfell 33.5 per cent to 151 and wheat farms fell 25.8 per cent to 2,083.
In the 2011 Census, Alberta gross farm receipts averaged $264,518 per farm. The number of farms with $500,000 or more (incurrent dollars) of 2010 gross farm receipts increased to 4,454, and represented 10.3 per cent of total farms, yet accounted for70.6 per cent of total provincial gross farms receipts.
1986
1991
1996
2001
2006
2011
26,022
23,026
23,361
19,654
18,511
15,569
9,842
9,950
9,057
8,335
7,170
6,051
10,549
10,681
9,689
8,526
7,448
5,934
10,439
12,300
14,937
14,361
13,138
11,226
925
1,288
1,963
2,776
3,164
4,454
Under $25,000
$25,000 -$49,999
$50,000 -$99,999
$100,000 -$499,999
$500,000 and Over
Gross Farm Receipts:(Current Dollars)
Number of Farms
$200,058
$184,885
$134,071
$96,811
$77,433
Average Gross Farm Receipts per Farm
$264,518
- 133 - Alberta Agriculture Statistics Yearbook, 2015

Fig. 43 Average Age and Number of Alberta Farm Operators by Age, 1981-2011
Source: Statistics Canada, Census of Agriculture, 1981-2011
Fig. 44 Alberta Farms Using Internet For Farm Business, 2001-2011
Source: Statistics Canada, Census of Agriculture, 2001-2011
Census data show the average age of farm operators rising in recent years. In 2011, the average age of Alberta farm operatorswas 54.5 years, up from 52.2 years in 2006. This was quite similar to the national trend where average age was 54.0 years in2011, compared to 52.0 years in 2006.
For the first time, operators aged 55 and over represented the largest share of total farm operators, accounting for 49.6 per centof Alberta’s 62,050 farm operators in 2011. The number of farm operators between 35 to 54 years old dropped to 35,935 andrepresented 43.1 per cent of total farm operators, while the group under 35 years old fell to 6,290 or 7.3 per cent.
40.0
42.0
44.0
46.0
48.0
50.0
52.0
54.0
56.0
0
5
10
15
20
25
30
35
40
45
1981 1986 1991 1996 2001 2006 2011
Avera
ge
Ag
e (
Years
)
Nu
mb
er
of
Fa
rm O
pera
tors
(T
ho
us
an
ds
)
Under 35 years 35 to 54 years 55 years and over Average Age
15,65817,195
24,928
2001 2006 2011
The proportion of Alberta farms using Internetincreased substantially in recent years to 57.7 percent (24,928), compared to 29.1 per cent (15,658)in 2001. High-speed internet access was reportedby 46.5 per cent of all farms in the province in2011, above the national proportion of 44.8 percent.
Number of Farms
Alberta Agriculture Statistics Yearbook, 2015 - 134 -
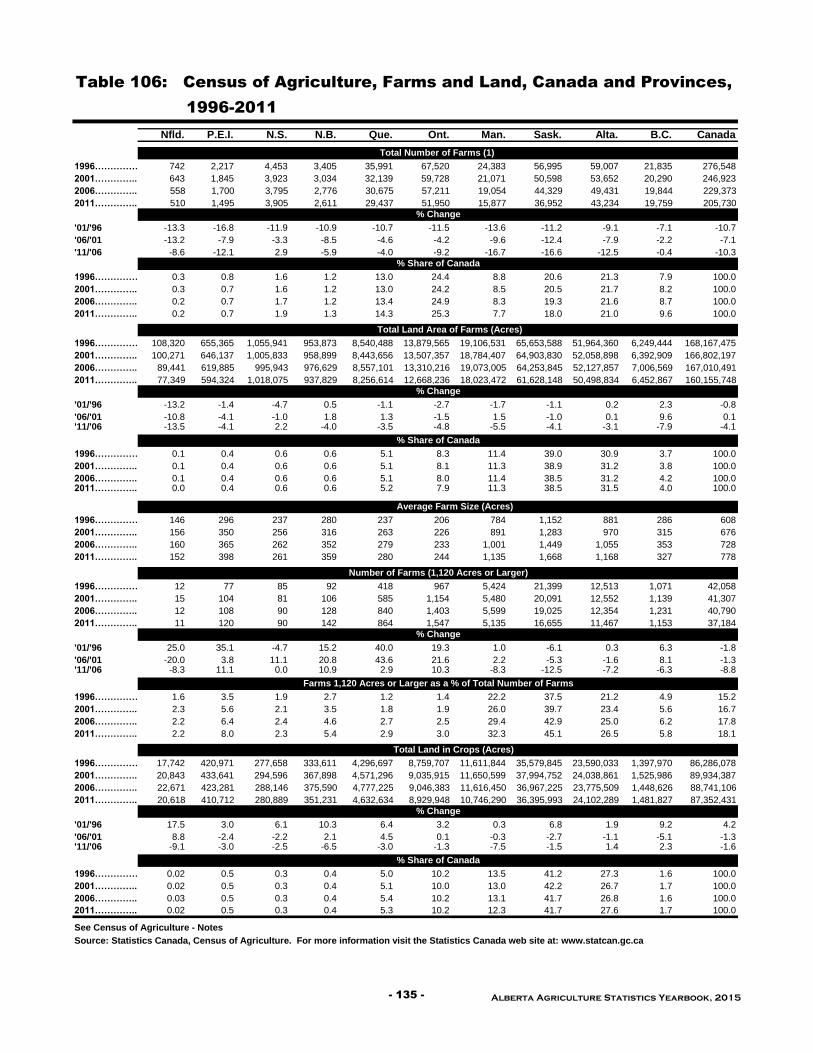
Nfld. P.E.I. N.S. N.B. Que. Ont. Man. Sask. Alta. B.C. Canada
1996……………. 742 2,217 4,453 3,405 35,991 67,520 24,383 56,995 59,007 21,835 276,548
2001………….. 643 1,845 3,923 3,034 32,139 59,728 21,071 50,598 53,652 20,290 246,923
2006………….. 558 1,700 3,795 2,776 30,675 57,211 19,054 44,329 49,431 19,844 229,373
2011………….. 510 1,495 3,905 2,611 29,437 51,950 15,877 36,952 43,234 19,759 205,730
'01/'96 -13.3 -16.8 -11.9 -10.9 -10.7 -11.5 -13.6 -11.2 -9.1 -7.1 -10.7
'06/'01 -13.2 -7.9 -3.3 -8.5 -4.6 -4.2 -9.6 -12.4 -7.9 -2.2 -7.1
'11/'06 -8.6 -12.1 2.9 -5.9 -4.0 -9.2 -16.7 -16.6 -12.5 -0.4 -10.3
1996……………. 0.3 0.8 1.6 1.2 13.0 24.4 8.8 20.6 21.3 7.9 100.0
2001………….. 0.3 0.7 1.6 1.2 13.0 24.2 8.5 20.5 21.7 8.2 100.0
2006………….. 0.2 0.7 1.7 1.2 13.4 24.9 8.3 19.3 21.6 8.7 100.0
2011………….. 0.2 0.7 1.9 1.3 14.3 25.3 7.7 18.0 21.0 9.6 100.0
1996……………. 108,320 655,365 1,055,941 953,873 8,540,488 13,879,565 19,106,531 65,653,588 51,964,360 6,249,444 168,167,475
2001………….. 100,271 646,137 1,005,833 958,899 8,443,656 13,507,357 18,784,407 64,903,830 52,058,898 6,392,909 166,802,197
2006………….. 89,441 619,885 995,943 976,629 8,557,101 13,310,216 19,073,005 64,253,845 52,127,857 7,006,569 167,010,491
2011………….. 77,349 594,324 1,018,075 937,829 8,256,614 12,668,236 18,023,472 61,628,148 50,498,834 6,452,867 160,155,748
'01/'96 -13.2 -1.4 -4.7 0.5 -1.1 -2.7 -1.7 -1.1 0.2 2.3 -0.8
'06/'01 -10.8 -4.1 -1.0 1.8 1.3 -1.5 1.5 -1.0 0.1 9.6 0.1'11/'06 -13.5 -4.1 2.2 -4.0 -3.5 -4.8 -5.5 -4.1 -3.1 -7.9 -4.1
1996……………. 0.1 0.4 0.6 0.6 5.1 8.3 11.4 39.0 30.9 3.7 100.0
2001………….. 0.1 0.4 0.6 0.6 5.1 8.1 11.3 38.9 31.2 3.8 100.0
2006………….. 0.1 0.4 0.6 0.6 5.1 8.0 11.4 38.5 31.2 4.2 100.02011………….. 0.0 0.4 0.6 0.6 5.2 7.9 11.3 38.5 31.5 4.0 100.0
1996……………. 146 296 237 280 237 206 784 1,152 881 286 608
2001………….. 156 350 256 316 263 226 891 1,283 970 315 676
2006………….. 160 365 262 352 279 233 1,001 1,449 1,055 353 728
2011………….. 152 398 261 359 280 244 1,135 1,668 1,168 327 778
1996……………. 12 77 85 92 418 967 5,424 21,399 12,513 1,071 42,058
2001………….. 15 104 81 106 585 1,154 5,480 20,091 12,552 1,139 41,307
2006………….. 12 108 90 128 840 1,403 5,599 19,025 12,354 1,231 40,790
2011………….. 11 120 90 142 864 1,547 5,135 16,655 11,467 1,153 37,184
'01/'96 25.0 35.1 -4.7 15.2 40.0 19.3 1.0 -6.1 0.3 6.3 -1.8
'06/'01 -20.0 3.8 11.1 20.8 43.6 21.6 2.2 -5.3 -1.6 8.1 -1.3'11/'06 -8.3 11.1 0.0 10.9 2.9 10.3 -8.3 -12.5 -7.2 -6.3 -8.8
1996……………. 1.6 3.5 1.9 2.7 1.2 1.4 22.2 37.5 21.2 4.9 15.2
2001………….. 2.3 5.6 2.1 3.5 1.8 1.9 26.0 39.7 23.4 5.6 16.7
2006………….. 2.2 6.4 2.4 4.6 2.7 2.5 29.4 42.9 25.0 6.2 17.8
2011………….. 2.2 8.0 2.3 5.4 2.9 3.0 32.3 45.1 26.5 5.8 18.1
1996……………. 17,742 420,971 277,658 333,611 4,296,697 8,759,707 11,611,844 35,579,845 23,590,033 1,397,970 86,286,078
2001………….. 20,843 433,641 294,596 367,898 4,571,296 9,035,915 11,650,599 37,994,752 24,038,861 1,525,986 89,934,387
2006………….. 22,671 423,281 288,146 375,590 4,777,225 9,046,383 11,616,450 36,967,225 23,775,509 1,448,626 88,741,106
2011………….. 20,618 410,712 280,889 351,231 4,632,634 8,929,948 10,746,290 36,395,993 24,102,289 1,481,827 87,352,431
'01/'96 17.5 3.0 6.1 10.3 6.4 3.2 0.3 6.8 1.9 9.2 4.2
'06/'01 8.8 -2.4 -2.2 2.1 4.5 0.1 -0.3 -2.7 -1.1 -5.1 -1.3'11/'06 -9.1 -3.0 -2.5 -6.5 -3.0 -1.3 -7.5 -1.5 1.4 2.3 -1.6
1996……………. 0.02 0.5 0.3 0.4 5.0 10.2 13.5 41.2 27.3 1.6 100.0
2001………….. 0.02 0.5 0.3 0.4 5.1 10.0 13.0 42.2 26.7 1.7 100.0
2006………….. 0.03 0.5 0.3 0.4 5.4 10.2 13.1 41.7 26.8 1.6 100.0
2011………….. 0.02 0.5 0.3 0.4 5.3 10.2 12.3 41.7 27.6 1.7 100.0
See Census of Agriculture - Notes
Source: Statistics Canada, Census of Agriculture. For more information visit the Statistics Canada web site at: www.statcan.gc.ca
% Share of Canada
% Change
% Share of Canada
Number of Farms (1,120 Acres or Larger)
% Change
Farms 1,120 Acres or Larger as a % of Total Number of Farms
Total Land in Crops (Acres)
Total Land Area of Farms (Acres)
% Change
% Share of Canada
Average Farm Size (Acres)
Table 106: Census of Agriculture, Farms and Land, Canada and Provinces,
1996-2011
Total Number of Farms (1)
% Change
- 135 - Alberta Agriculture Statistics Yearbook, 2015
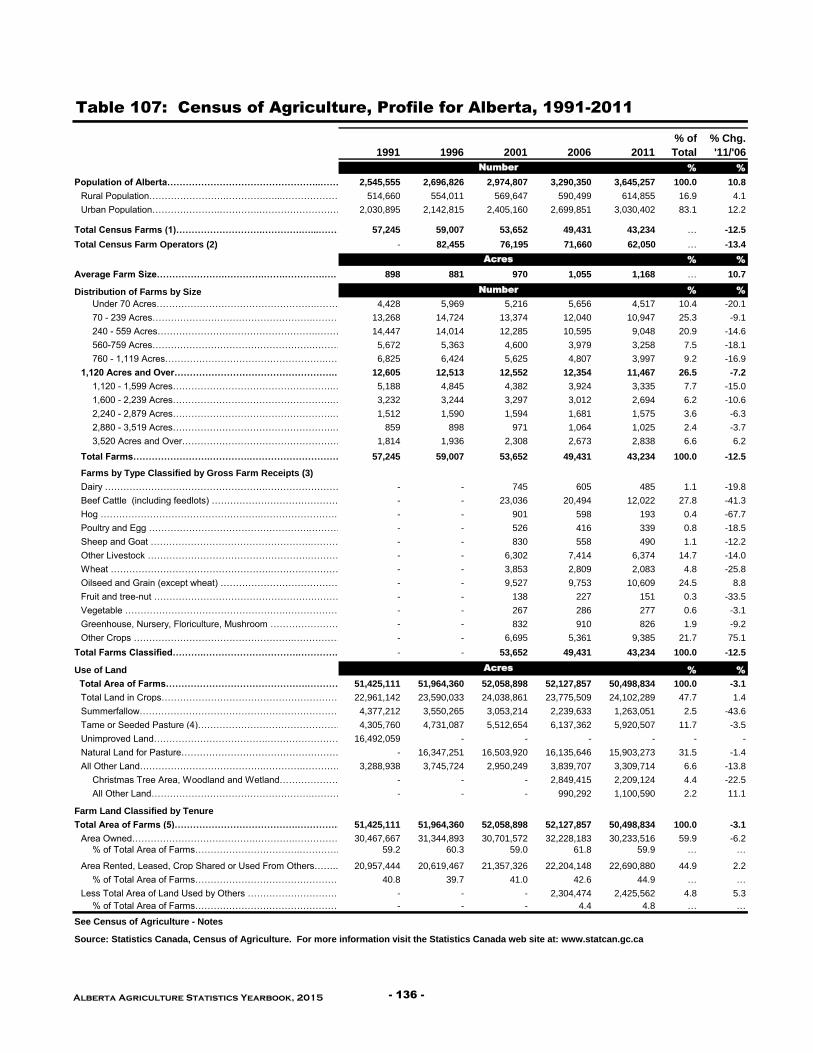
1991 1996 2001 2006 2011
% of
Total
% Chg.
'11/'06
% %
Population of Alberta…………………………………………..…… 2,545,555 2,696,826 2,974,807 3,290,350 3,645,257 100.0 10.8
Rural Population…………………….………….…...……………………………..………514,660 554,011 569,647 590,499 614,855 16.9 4.1
Urban Population………………….………….…………………………...………..…..2,030,895 2,142,815 2,405,160 2,699,851 3,030,402 83.1 12.2
Total Census Farms (1)……………………….………….…...……………………………………………...….57,245 59,007 53,652 49,431 43,234 … -12.5
Total Census Farm Operators (2) - 82,455 76,195 71,660 62,050 … -13.4
% %
Average Farm Size………………….………….…….………….…. 898 881 970 1,055 1,168 … 10.7
Distribution of Farms by Size % %
Under 70 Acres…………………………………………….…………………….………….…………………………….……4,428 5,969 5,216 5,656 4,517 10.4 -20.1
70 - 239 Acres…………………………………………….…………………….………….…………………………….……13,268 14,724 13,374 12,040 10,947 25.3 -9.1
240 - 559 Acres…………………………………………….…………………….………….…………………………….……14,447 14,014 12,285 10,595 9,048 20.9 -14.6
560-759 Acres…………………………………………….…………………….………….…………………………….……5,672 5,363 4,600 3,979 3,258 7.5 -18.1
760 - 1,119 Acres…………………………………………….…………………….………….…………………………….……6,825 6,424 5,625 4,807 3,997 9.2 -16.9
1,120 Acres and Over…………………………………………….…………………….………….…………………………….……12,605 12,513 12,552 12,354 11,467 26.5 -7.2
1,120 - 1,599 Acres…………………………………………….…………………….………….…………………………….……5,188 4,845 4,382 3,924 3,335 7.7 -15.0
1,600 - 2,239 Acres…………………………………………….…………………….………….…………………………….……3,232 3,244 3,297 3,012 2,694 6.2 -10.6
2,240 - 2,879 Acres…………………………………………….…………………….………….…………………………….……1,512 1,590 1,594 1,681 1,575 3.6 -6.3
2,880 - 3,519 Acres…………………………………………….…………………….………….…………………………….……859 898 971 1,064 1,025 2.4 -3.7
3,520 Acres and Over…………………………………………….…………………….………….…………………………….……1,814 1,936 2,308 2,673 2,838 6.6 6.2
Total Farms…………………….………….………………………….…………………………….....57,245 59,007 53,652 49,431 43,234 100.0 -12.5
Farms by Type Classified by Gross Farm Receipts (3)
Dairy …………………………………………….…………………….………….…………………………….……- - 745 605 485 1.1 -19.8
Beef Cattle (including feedlots) …………………………………………….…………………….………….…………………………….……- - 23,036 20,494 12,022 27.8 -41.3
Hog …………………………………………….…………………….………….…………………………….……- - 901 598 193 0.4 -67.7
Poultry and Egg …………………………………………….…………………….………….…………………………….……- - 526 416 339 0.8 -18.5
Sheep and Goat …………………………………………….…………………….………….…………………………….……- - 830 558 490 1.1 -12.2
Other Livestock …………………………………………….…………………….………….…………………………….……- - 6,302 7,414 6,374 14.7 -14.0
Wheat …………………………………………….…………………….………….…………………………….……- - 3,853 2,809 2,083 4.8 -25.8
Oilseed and Grain (except wheat) …………………………………………….…………………….………….…………………………….……- - 9,527 9,753 10,609 24.5 8.8
Fruit and tree-nut …………………………………………….…………………….………….…………………………….…… - - 138 227 151 0.3 -33.5
Vegetable …………………………………………….…………………….………….…………………………….……- - 267 286 277 0.6 -3.1
Greenhouse, Nursery, Floriculture, Mushroom …………………………………………….…………………….………….…………………………….……- - 832 910 826 1.9 -9.2
Other Crops …………………………………………….…………………….………….…………………………….……- - 6,695 5,361 9,385 21.7 75.1
Total Farms Classified……….………………………….………….…………………………...- - 53,652 49,431 43,234 100.0 -12.5
Use of Land % %
Total Area of Farms……………………………………….……………………………………….………….……………………………..….. 51,425,111 51,964,360 52,058,898 52,127,857 50,498,834 100.0 -3.1
Total Land in Crops…………………………………………………….…………………….………….…………………………….…….22,961,142 23,590,033 24,038,861 23,775,509 24,102,289 47.7 1.4
Summerfallow……………………………………………………………….………………….………….…………………………………….4,377,212 3,550,265 3,053,214 2,239,633 1,263,051 2.5 -43.6
Tame or Seeded Pasture (4)…………………………………………….…………………….………….……………………………………4,305,760 4,731,087 5,512,654 6,137,362 5,920,507 11.7 -3.5
Unimproved Land……………………………….…………………………….……………….…………………………………16,492,059 - - - - - -
Natural Land for Pasture…………………………………………………….…………………………….………….…………………………………….- 16,347,251 16,503,920 16,135,646 15,903,273 31.5 -1.4
All Other Land………………………………….………….……………………………………..………………3,288,938 3,745,724 2,950,249 3,839,707 3,309,714 6.6 -13.8
Christmas Tree Area, Woodland and Wetland…………………………………………….………….………………………………- - - 2,849,415 2,209,124 4.4 -22.5
All Other Land…………………………………………….………….………………………………- - - 990,292 1,100,590 2.2 11.1
Farm Land Classified by Tenure
Total Area of Farms (5)………………………………….………….………………………...……………....51,425,111 51,964,360 52,058,898 52,127,857 50,498,834 100.0 -3.1
Area Owned………………………………….………….……………………………………….……..30,467,667 31,344,893 30,701,572 32,228,183 30,233,516 59.9 -6.2
% of Total Area of Farms…………………………….………….……………………………...………59.2 60.3 59.0 61.8 59.9 … …
Area Rented, Leased, Crop Shared or Used From Others…….……………………….………….……………………….20,957,444 20,619,467 21,357,326 22,204,148 22,690,880 44.9 2.2
% of Total Area of Farms………………………………………….………….………………………….……40.8 39.7 41.0 42.6 44.9 … …
Less Total Area of Land Used by Others ……………………………………….………….………………………….……- - - 2,304,474 2,425,562 4.8 5.3
% of Total Area of Farms………………………………………….………….………………………….……- - - 4.4 4.8 … …
See Census of Agriculture - Notes
Source: Statistics Canada, Census of Agriculture. For more information visit the Statistics Canada web site at: www.statcan.gc.ca
Number
Acres
Acres
Number
Table 107: Census of Agriculture, Profile for Alberta, 1991-2011
Alberta Agriculture Statistics Yearbook, 2015 - 136 -
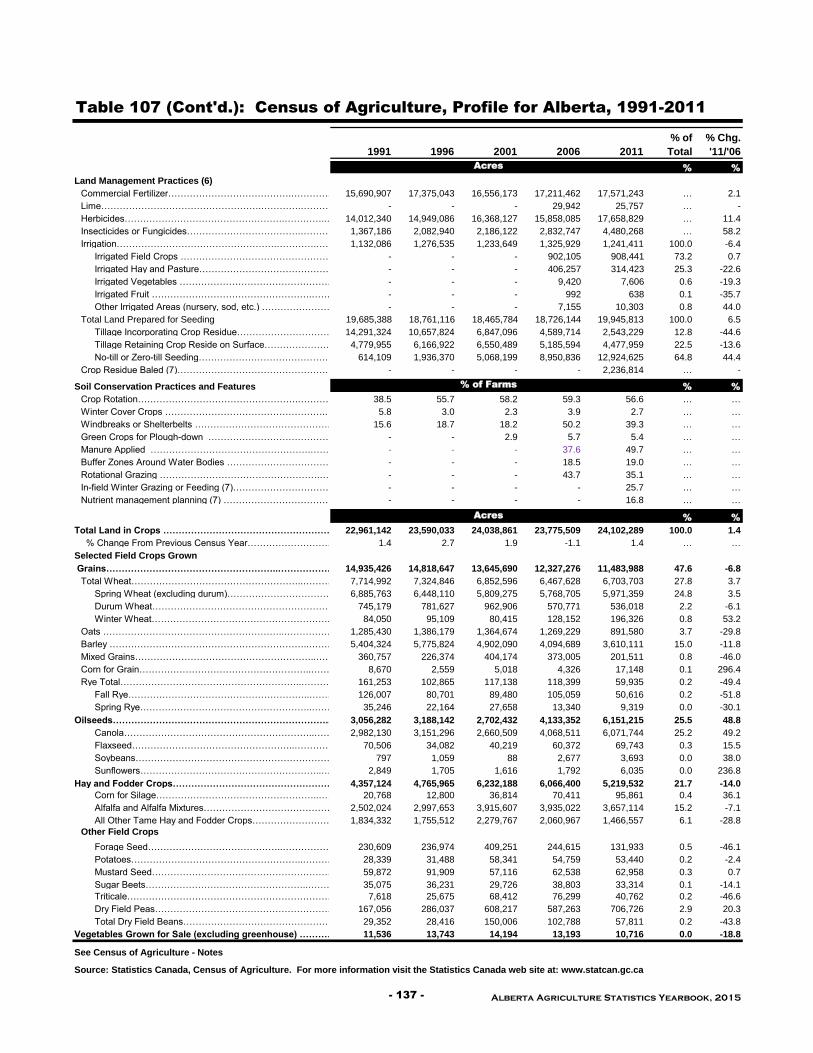
Table 107 (Cont'd.): Census of Agriculture, Profile for Alberta, 1991-2011
1991 1996 2001 2006 2011
% of
Total
% Chg.
'11/'06
% %
Land Management Practices (6)
Commercial Fertilizer………………………………….………….…………………………………..………..15,690,907 17,375,043 16,556,173 17,211,462 17,571,243 … 2.1
Lime…………………………………………….………….…………………………………………- - - 29,942 25,757 … -
Herbicides…………………………………………….………….…………………………………………….14,012,340 14,949,086 16,368,127 15,858,085 17,658,829 … 11.4
Insecticides or Fungicides……………………………….………….……………………………………1,367,186 2,082,940 2,186,122 2,832,747 4,480,268 … 58.2
Irrigation…………………………………………….………….…………………………………………….1,132,086 1,276,535 1,233,649 1,325,929 1,241,411 100.0 -6.4
Irrigated Field Crops …………………………………………….………….……………………………………- - - 902,105 908,441 73.2 0.7
Irrigated Hay and Pasture…………………………………………….………….……………………………………- - - 406,257 314,423 25.3 -22.6
Irrigated Vegetables …………………………………………….………….……………………………………- - - 9,420 7,606 0.6 -19.3
Irrigated Fruit …………………………………………….………….……………………………………- - - 992 638 0.1 -35.7
Other Irrigated Areas (nursery, sod, etc.) …………………………………………….………….……………………………………- - - 7,155 10,303 0.8 44.0
Total Land Prepared for Seeding 19,685,388 18,761,116 18,465,784 18,726,144 19,945,813 100.0 6.5
Tillage Incorporating Crop Residue…………………………………………….………….…………………………………………….14,291,324 10,657,824 6,847,096 4,589,714 2,543,229 12.8 -44.6
Tillage Retaining Crop Reside on Surface…………………………………………….………….…………………………………………….4,779,955 6,166,922 6,550,489 5,185,594 4,477,959 22.5 -13.6
No-till or Zero-till Seeding…………………………………………….………….…………………………………………….614,109 1,936,370 5,068,199 8,950,836 12,924,625 64.8 44.4
Crop Residue Baled (7)………………………………………….………….…………………………………………- - - - 2,236,814 … -
Soil Conservation Practices and Features % %
Crop Rotation…………………………………………….………….…………………………………………38.5 55.7 58.2 59.3 56.6 … …
Winter Cover Crops …………………………………………….………….…………………………………………5.8 3.0 2.3 3.9 2.7 … …
Windbreaks or Shelterbelts …………………………………………….………….…………………………………………15.6 18.7 18.2 50.2 39.3 … …
Green Crops for Plough-down …………………………………………….………….…………………………………………Green Crops for Plough-down . . . . . . . . . . . . . . . . . . . . . . . . . . . . . . . . . . . . . . . Green Crops for Plough-down . . . . . . . . . . . . . . . . . . . . . . . . . . . . . . . . . . . . . . .- - 2.9 5.7 5.4 … …
Manure Applied …………………………………………….………….…………………………………………- - - 37.6 49.7 … …
Buffer Zones Around Water Bodies …………………………………………….………….…………………………………………- - - 18.5 19.0 … …
Rotational Grazing …………………………………………….………….…………………………………………- - - 43.7 35.1 … …
In-field Winter Grazing or Feeding (7)…………………………………………….………….…………………………………………- - - - 25.7 … …
Nutrient management planning (7) ………………………………………….………….…………………………………………- - - - 16.8 … …
% %
Total Land in Crops ………………………………………………..………………….22,961,142 23,590,033 24,038,861 23,775,509 24,102,289 100.0 1.4
% Change From Previous Census Year………………………………………..1.4 2.7 1.9 -1.1 1.4 … …
Selected Field Crops Grown
Grains………………………………………………..………………………………………14,935,426 14,818,647 13,645,690 12,327,276 11,483,988 47.6 -6.8
Total Wheat………………………………………………..…………………………..7,714,992 7,324,846 6,852,596 6,467,628 6,703,703 27.8 3.7
Spring Wheat (excluding durum)…………………………………………………..………………………………6,885,763 6,448,110 5,809,275 5,768,705 5,971,359 24.8 3.5
Durum Wheat………………………………………………………..……………………………………………………..745,179 781,627 962,906 570,771 536,018 2.2 -6.1
Winter Wheat…………………………………………………..………………………………………………….84,050 95,109 80,415 128,152 196,326 0.8 53.2
Oats …………………………………………………..……………………………………………. 1,285,430 1,386,179 1,364,674 1,269,229 891,580 3.7 -29.8
Barley ………………………………………………………..…………………………………………………5,404,324 5,775,824 4,902,090 4,094,689 3,610,111 15.0 -11.8
Mixed Grains…………………………………………………..………………………………………………………….360,757 226,374 404,174 373,005 201,511 0.8 -46.0
Corn for Grain………………………………………………..………………………………………………….8,670 2,559 5,018 4,326 17,148 0.1 296.4
Rye Total…………………………………………………..……………………………………………………………161,253 102,865 117,138 118,399 59,935 0.2 -49.4
Fall Rye…………………………………………………..……………………………………………………….126,007 80,701 89,480 105,059 50,616 0.2 -51.8
Spring Rye………………………………………………..………………………………………………………35,246 22,164 27,658 13,340 9,319 0.0 -30.1
Oilseeds……………………………………………………………..…………………………………………..3,056,282 3,188,142 2,702,432 4,133,352 6,151,215 25.5 48.8
Canola……………………………………………………..…………………………………………………………..2,982,130 3,151,296 2,660,509 4,068,511 6,071,744 25.2 49.2
Flaxseed……………………………………………..………………………………………………………………70,506 34,082 40,219 60,372 69,743 0.3 15.5
Soybeans………………………………………………………..……………………………………………….797 1,059 88 2,677 3,693 0.0 38.0
Sunflowers…………………………………………………..………………………………………………………2,849 1,705 1,616 1,792 6,035 0.0 236.8
Hay and Fodder Crops……………………………………………………..…………………………….4,357,124 4,765,965 6,232,188 6,066,400 5,219,532 21.7 -14.0
Corn for Silage……………………………………………..………………………………………………………..20,768 12,800 36,814 70,411 95,861 0.4 36.1
Alfalfa and Alfalfa Mixtures…………………………………………..………………………2,502,024 2,997,653 3,915,607 3,935,022 3,657,114 15.2 -7.1
All Other Tame Hay and Fodder Crops…………………………………………..………………………1,834,332 1,755,512 2,279,767 2,060,967 1,466,557 6.1 -28.8
Other Field Crops
Forage Seed……………………………………..………………………………………………..………………………230,609 236,974 409,251 244,615 131,933 0.5 -46.1
Potatoes………………………………………………..……………………………………………………………….28,339 31,488 58,341 54,759 53,440 0.2 -2.4
Mustard Seed……………………………………………………..………………………………………………….59,872 91,909 57,116 62,538 62,958 0.3 0.7
Sugar Beets……………………………………………..……………………………………………………………35,075 36,231 29,726 38,803 33,314 0.1 -14.1
Triticale…………………………………………………………..……………………………..………………………7,618 25,675 68,412 76,299 40,762 0.2 -46.6
Dry Field Peas…………………………………………………..…………………………………………………………..167,056 286,037 608,217 587,263 706,726 2.9 20.3
Total Dry Field Beans…………………………………………………..………………………………………………….29,352 28,416 150,006 102,788 57,811 0.2 -43.8
Vegetables Grown for Sale (excluding greenhouse) ……………………………………………………11,536 13,743 14,194 13,193 10,716 0.0 -18.8
See Census of Agriculture - Notes
Source: Statistics Canada, Census of Agriculture. For more information visit the Statistics Canada web site at: www.statcan.gc.ca
Acres
Acres
% of Farms
- 137 - Alberta Agriculture Statistics Yearbook, 2015
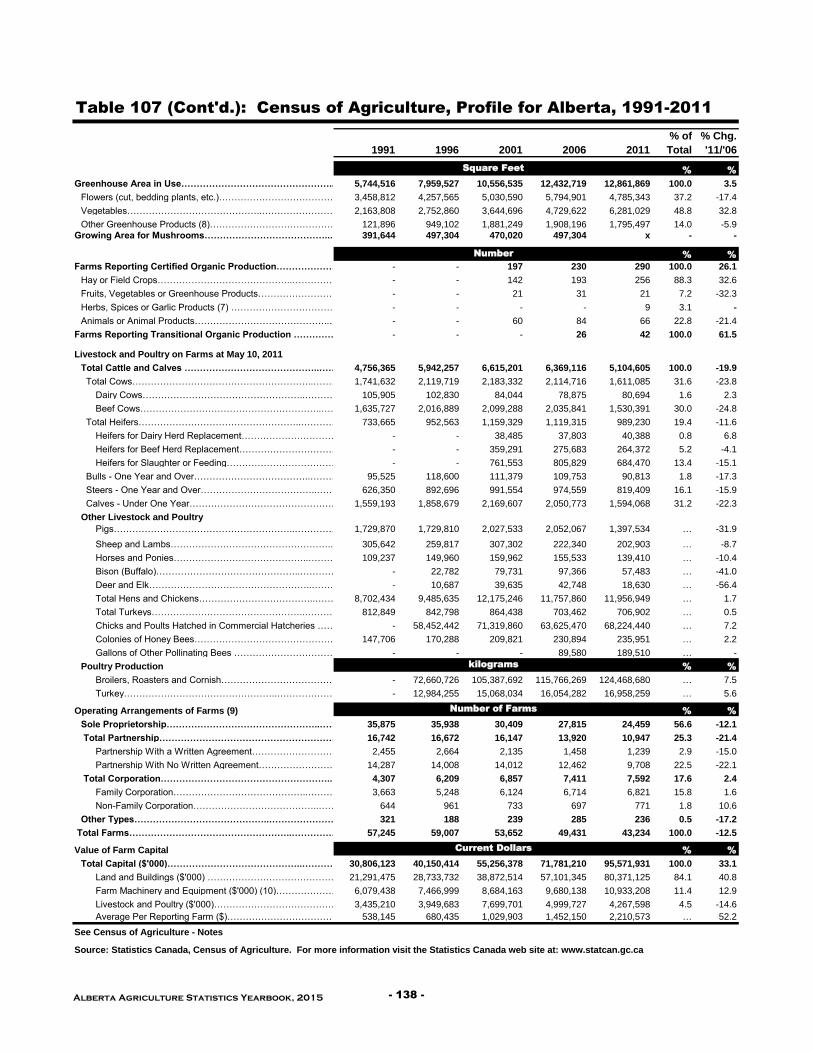
1991 1996 2001 2006 2011
% of
Total
% Chg.
'11/'06
% %
Greenhouse Area in Use…………………………………………..………………………………………..…………………………………5,744,516 7,959,527 10,556,535 12,432,719 12,861,869 100.0 3.5
Flowers (cut, bedding plants, etc.)……………………………………..………………………………………..……………………3,458,812 4,257,565 5,030,590 5,794,901 4,785,343 37.2 -17.4
Vegetables……………………………………..………………………………………..……………………2,163,808 2,752,860 3,644,696 4,729,622 6,281,029 48.8 32.8
Other Greenhouse Products (8)……………………………………..………………………………………..……………………121,896 949,102 1,881,249 1,908,196 1,795,497 14.0 -5.9
Growing Area for Mushrooms…………………………………..……………………………………………..…………391,644 497,304 470,020 497,304 x - -
% %
Farms Reporting Certified Organic Production……………………………………..………………………………………..…………………………………- - 197 230 290 100.0 26.1
Hay or Field Crops……………………………………..………………………………………..…………………………………- - 142 193 256 88.3 32.6
Fruits, Vegetables or Greenhouse Products……………………………………..………………………………………..…………………………………- - 21 31 21 7.2 -32.3
Herbs, Spices or Garlic Products (7) …………………………………..………………………………………..……………………………- - - - 9 3.1 -
Animals or Animal Products……………………………………..………………………………………..…………………………………- - 60 84 66 22.8 -21.4
Farms Reporting Transitional Organic Production ……………………………………..………………………………………..…………………………………- - - 26 42 100.0 61.5
Livestock and Poultry on Farms at May 10, 2011
Total Cattle and Calves ……………………………………..…………………………………..4,756,365 5,942,257 6,615,201 6,369,116 5,104,605 100.0 -19.9
Total Cows…………………………………………………..…………………………………………1,741,632 2,119,719 2,183,332 2,114,716 1,611,085 31.6 -23.8
Dairy Cows……………………………………………..………………………………..……………………………………………………..105,905 102,830 84,044 78,875 80,694 1.6 2.3
Beef Cows…………………………………………………..……………………………..……………………………………………………..1,635,727 2,016,889 2,099,288 2,035,841 1,530,391 30.0 -24.8
Total Heifers……………………………………………..……………………………………………………733,665 952,563 1,159,329 1,119,315 989,230 19.4 -11.6
Heifers for Dairy Herd Replacement……………………………………………..……………………………………………………- - 38,485 37,803 40,388 0.8 6.8
Heifers for Beef Herd Replacement……………………………………………..……………………………………………………- - 359,291 275,683 264,372 5.2 -4.1
Heifers for Slaughter or Feeding……………………………………………..……………………………………………………- - 761,553 805,829 684,470 13.4 -15.1
Bulls - One Year and Over………………………………..……………………………………………………………..………………………………………….95,525 118,600 111,379 109,753 90,813 1.8 -17.3
Steers - One Year and Over………………………………..………………………………………………………………..……………………………………….626,350 892,696 991,554 974,559 819,409 16.1 -15.9
Calves - Under One Year…………………………………………………………..…………………………………………..……………………………………………………1,559,193 1,858,679 2,169,607 2,050,773 1,594,068 31.2 -22.3
Other Livestock and Poultry
Pigs…………………………………………………..………………………………………………………………………..………………………………………….1,729,870 1,729,810 2,027,533 2,052,067 1,397,534 … -31.9
Sheep and Lambs……………………………………………..…………………………………………………………..……………………………………….……305,642 259,817 307,302 222,340 202,903 … -8.7
Horses and Ponies……………………………………..…………………………………………………………………..………………………………………..109,237 149,960 159,962 155,533 139,410 … -10.4
Bison (Buffalo)………………………………………..……………………………………………………………..………………………………………………………….- 22,782 79,731 97,366 57,483 … -41.0
Deer and Elk……………………………………………..…………………………………………………………..……………………………………………..- 10,687 39,635 42,748 18,630 … -56.4
Total Hens and Chickens………………………………..…………………………………………………………………..………………………………………8,702,434 9,485,635 12,175,246 11,757,860 11,956,949 … 1.7
Total Turkeys…………………………………………..……………………………………………812,849 842,798 864,438 703,462 706,902 … 0.5
Chicks and Poults Hatched in Commercial Hatcheries …………………..………………………- 58,452,442 71,319,860 63,625,470 68,224,440 … 7.2
Colonies of Honey Bees…………………………………………..……………………………………………147,706 170,288 209,821 230,894 235,951 … 2.2
Gallons of Other Pollinating Bees …………………………………………..……………………………………………- - - 89,580 189,510 … -
Poultry Production % %
Broilers, Roasters and Cornish…………………………………………..……………………………………………- 72,660,726 105,387,692 115,766,269 124,468,680 … 7.5
Turkey…………………………………………..……………………………………………- 12,984,255 15,068,034 16,054,282 16,958,259 … 5.6
Operating Arrangements of Farms (9) % %
Sole Proprietorship…………………………………………..……………………………………………35,875 35,938 30,409 27,815 24,459 56.6 -12.1
Total Partnership……………………………………………………… 16,742 16,672 16,147 13,920 10,947 25.3 -21.4
Partnership With a Written Agreement………………………………..……………………………………………………………2,455 2,664 2,135 1,458 1,239 2.9 -15.0
Partnership With No Written Agreement……………………………………..……………………………………………………14,287 14,008 14,012 12,462 9,708 22.5 -22.1
Total Corporation………………………………………………..……………………………………………………………………………..4,307 6,209 6,857 7,411 7,592 17.6 2.4
Family Corporation……………………………………..………………………………………………………………………….3,663 5,248 6,124 6,714 6,821 15.8 1.6
Non-Family Corporation…………………………………..………………………………………………………………………..644 961 733 697 771 1.8 10.6
Other Types……………………………………..……………………………………………………………………………………321 188 239 285 236 0.5 -17.2
Total Farms……………………………………………..………………………………………………………………..57,245 59,007 53,652 49,431 43,234 100.0 -12.5
Value of Farm Capital % %
Total Capital ($'000)……………………………………..…………………………………………………………………………..30,806,123 40,150,414 55,256,378 71,781,210 95,571,931 100.0 33.1
Land and Buildings ($'000) ………………………………………..………………………………………………………………………21,291,475 28,733,732 38,872,514 57,101,345 80,371,125 84.1 40.8
Farm Machinery and Equipment ($'000) (10)………………………………………..……………………………………………6,079,438 7,466,999 8,684,163 9,680,138 10,933,208 11.4 12.9
Livestock and Poultry ($'000)……………………………………………..………………………………………………………………….3,435,210 3,949,683 7,699,701 4,999,727 4,267,598 4.5 -14.6
Average Per Reporting Farm ($)……………………………………………..……………………………………………………..538,145 680,435 1,029,903 1,452,150 2,210,573 … 52.2
See Census of Agriculture - Notes
Source: Statistics Canada, Census of Agriculture. For more information visit the Statistics Canada web site at: www.statcan.gc.ca
Square Feet
Number
kilograms
Number of Farms
Current Dollars
Table 107 (Cont'd.): Census of Agriculture, Profile for Alberta, 1991-2011
Alberta Agriculture Statistics Yearbook, 2015 - 138 -
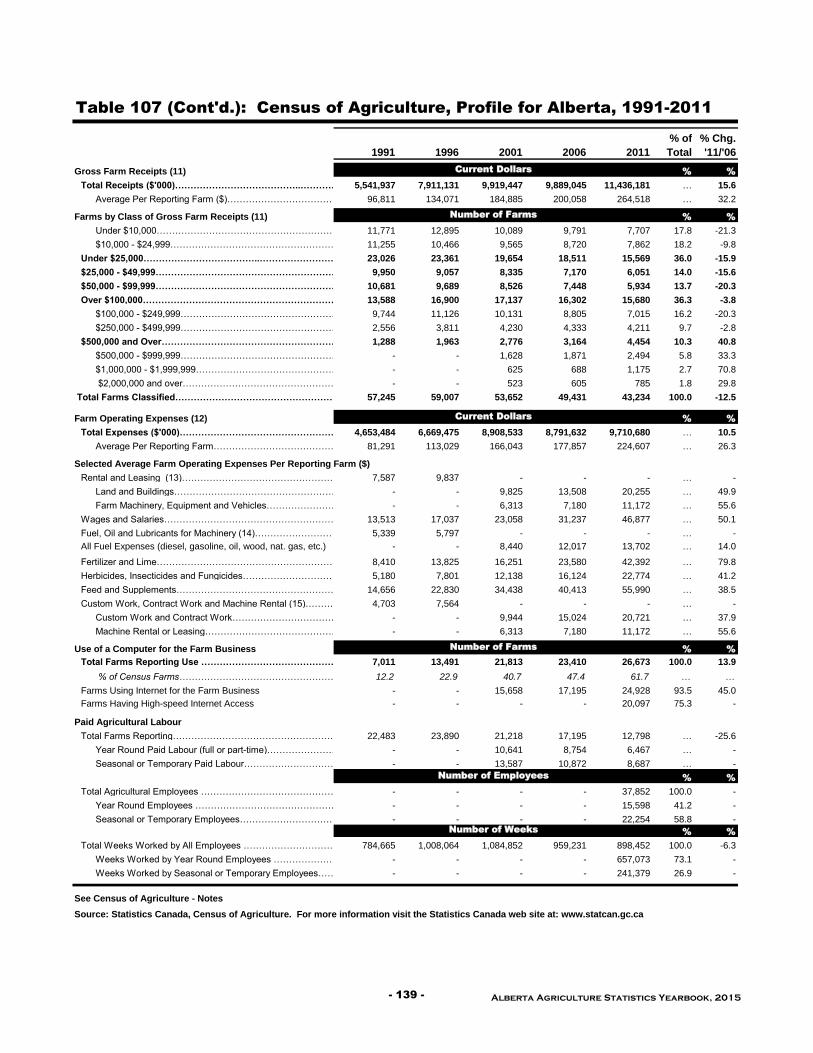
Table 107 (Cont'd.): Census of Agriculture, Profile for Alberta, 1991-2011
1991 1996 2001 2006 2011
% of
Total
% Chg.
'11/'06
Gross Farm Receipts (11) % %
Total Receipts ($'000)…………………………………..…………………………………………………………………….5,541,937 7,911,131 9,919,447 9,889,045 11,436,181 … 15.6
Average Per Reporting Farm ($)…………………………………..…………………………………………………………….96,811 134,071 184,885 200,058 264,518 … 32.2
Farms by Class of Gross Farm Receipts (11) % %
Under $10,000…………………………………………………………………………………………………………………11,771 12,895 10,089 9,791 7,707 17.8 -21.3
$10,000 - $24,999…………………………………………………………………………………………………………11,255 10,466 9,565 8,720 7,862 18.2 -9.8
Under $25,000………………………………..…………………………………………………………………………………23,026 23,361 19,654 18,511 15,569 36.0 -15.9
$25,000 - $49,999………………………………………………………………………………………………………………9,950 9,057 8,335 7,170 6,051 14.0 -15.6
$50,000 - $99,999……………………………………………………………………………………………………………..10,681 9,689 8,526 7,448 5,934 13.7 -20.3
Over $100,000…………………………………………………………… 13,588 16,900 17,137 16,302 15,680 36.3 -3.8
$100,000 - $249,999…………………………………………………… 9,744 11,126 10,131 8,805 7,015 16.2 -20.3
$250,000 - $499,999………………………………………………… 2,556 3,811 4,230 4,333 4,211 9.7 -2.8
$500,000 and Over………………………………………………… 1,288 1,963 2,776 3,164 4,454 10.3 40.8
$500,000 - $999,999……………………………………………………………………………………………………- - 1,628 1,871 2,494 5.8 33.3
$1,000,000 - $1,999,999……………………………………………………………………………………………………- - 625 688 1,175 2.7 70.8
$2,000,000 and over……………………………………………………………………………………………………- - 523 605 785 1.8 29.8
Total Farms Classified………………………………………………………………………………………………….57,245 59,007 53,652 49,431 43,234 100.0 -12.5
Farm Operating Expenses (12) % %
Total Expenses ($'000)…………………………………………………………..4,653,484 6,669,475 8,908,533 8,791,632 9,710,680 … 10.5
Average Per Reporting Farm………………………………………………………………………………………………………………….81,291 113,029 166,043 177,857 224,607 … 26.3
Selected Average Farm Operating Expenses Per Reporting Farm ($)
Rental and Leasing (13)………………………………………………………..7,587 9,837 - - - … -
Land and Buildings…………………………………………………….. - - 9,825 13,508 20,255 … 49.9
Farm Machinery, Equipment and Vehicles……………………………………………………..- - 6,313 7,180 11,172 … 55.6
Wages and Salaries………………………………………………………………13,513 17,037 23,058 31,237 46,877 … 50.1
Fuel, Oil and Lubricants for Machinery (14)…………………………………………………………………………………………………5,339 5,797 - - - … -
All Fuel Expenses (diesel, gasoline, oil, wood, nat. gas, etc.) - - 8,440 12,017 13,702 … 14.0
Fertilizer and Lime………………………………………………………………………….8,410 13,825 16,251 23,580 42,392 … 79.8
Herbicides, Insecticides and Fungicides……………………………………………………………..5,180 7,801 12,138 16,124 22,774 … 41.2
Feed and Supplements…………………………………………………………………..14,656 22,830 34,438 40,413 55,990 … 38.5
Custom Work, Contract Work and Machine Rental (15)……………………………………………………………………………………..4,703 7,564 - - - … -
Custom Work and Contract Work…………………………………………………- - 9,944 15,024 20,721 … 37.9
Machine Rental or Leasing…………………………………………………………- - 6,313 7,180 11,172 … 55.6
Use of a Computer for the Farm Business % %
Total Farms Reporting Use ………………………………………………….……….7,011 13,491 21,813 23,410 26,673 100.0 13.9
% of Census Farms…………………………………………………………………………………………………………………………………..12.2 22.9 40.7 47.4 61.7 … …
Farms Using Internet for the Farm Business - - 15,658 17,195 24,928 93.5 45.0
Farms Having High-speed Internet Access - - - - 20,097 75.3 -
Paid Agricultural Labour
Total Farms Reporting…………………………………………………………….22,483 23,890 21,218 17,195 12,798 … -25.6
Year Round Paid Labour (full or part-time)…………………………………………………………….- - 10,641 8,754 6,467 … -
Seasonal or Temporary Paid Labour…………………………………………………………….- - 13,587 10,872 8,687 … -
% %
Total Agricultural Employees ……………………………………………………………- - - - 37,852 100.0 -
Year Round Employees ……………………………………………………………- - - - 15,598 41.2 -
Seasonal or Temporary Employees……………………………………………………………- - - - 22,254 58.8 -
% %
Total Weeks Worked by All Employees ……………………………………………………………784,665 1,008,064 1,084,852 959,231 898,452 100.0 -6.3
Weeks Worked by Year Round Employees ……………………………………………………………- - - - 657,073 73.1 -
Weeks Worked by Seasonal or Temporary Employees……………………………………………………………- - - - 241,379 26.9 -
See Census of Agriculture - Notes
Source: Statistics Canada, Census of Agriculture. For more information visit the Statistics Canada web site at: www.statcan.gc.ca
Number of Employees
Current Dollars
Number of Farms
Number of Weeks
Number of Farms
Current Dollars
- 139 - Alberta Agriculture Statistics Yearbook, 2015

1996 2001 2006 2011
% of
Total
% Chg.
'11/'06
% %
Total Census Farms……………………………………………………………………………………………………………59,005 53,652 49,431 43,234 100.0 -12.5
Total Farm Operators (16) (17)…………………………………………………………………………………………………………82,455 76,195 71,660 62,050 100.0 -13.4
Total Operators on Farms with One Operator……………………………………………………………………………………………………………35,435 32,025 28,045 25,155 40.5 -10.3
Total Operators on Farms with Two or More Operators……………………………………………………………………………………………………………47,020 44,170 43,620 36,890 59.5 -15.4
Average Age of Farm Operators % %
All Farm Operators……………………………………………………………………………………………………………48.2 49.9 52.2 54.5 … 4.4
On Farms With One Operator……………………………………………………………………………………………………………50.2 51.7 53.8 56.2 … 4.5
On Farms With Two or More Operators……………………………………………………………………………………………………………46.7 48.6 51.2 53.3 … 4.1
% %
Total Operators on All Farms 82,455 76,195 71,660 62,050 100.0 -13.4
Male…………………………………………………………………………………………………………………………………………………………………………………………………………………………60,585 54,565 50,190 44,075 71.0 -12.2
Female…………………………………………………………………………………………………………………………………………………………………………………………………………………………21,870 21,635 21,470 17,975 29.0 -16.3
Total Operators on Farms With One Operator 35,435 32,025 28,045 25,155 100.0 -10.3
Male…………………………………………………………………………………………………………………………………………………………………………………………………………………………33,110 29,530 25,670 23,010 91.5 -10.4
Female…………………………………………………………………………………………………………………………………………………………………………………………………………………………2,320 2,490 2,370 2,145 8.5 -9.5
Total Operators on Farms With Two or More Operators 47,020 44,170 43,620 36,890 100.0 -15.4
Male…………………………………………………………………………………………………………………………………………………………………………………………………………………………27,470 25,040 24,525 21,065 57.1 -14.1
Female…………………………………………………………………………………………………………………………………………………………………………………………………………………………19,550 19,135 19,095 15,830 42.9 -17.1
Operators by Age on All Farms 82,455 76,195 71,660 62,050 100.0 -13.4
Under 35 years…………………………………………………………………………………………………………………………………………………………………………………13,485 8,900 6,290 4,550 7.3 -27.7
35 to 54 years…………………………………………………………………………………………………………………………………………………………………………………42,315 40,430 35,935 26,720 43.1 -25.6
55 years and over…………………………………………………………………………………………………………………………………………………………………………………26,655 26,875 29,440 30,785 49.6 4.6
Operators by Age on Farms With One Operator 35,435 32,025 28,045 25,155 100.0 -10.3
Under 35 years…………………………………………………………………………………………………………………………………………………………………………………4,830 3,070 2,045 1,370 5.4 -33.0
35 to 54 years…………………………………………………………………………………………………………………………………………………………………………………17,055 16,130 13,335 10,125 40.3 -24.1
55 years and over…………………………………………………………………………………………………………………………………………………………………………………13,550 12,815 12,665 13,665 54.3 7.9
Operators by Age on Farms With Two or More Operators 47,020 44,170 43,620 36,890 100.0 -15.4
Under 35 years…………………………………………………………………………………………………………………………………………………………………………………8,650 5,825 4,245 3,180 8.6 -25.1
35 to 54 years…………………………………………………………………………………………………………………………………………………………………………………25,265 24,295 22,605 16,595 45.0 -26.6
55 years and over…………………………………………………………………………………………………………………………………………………………………………………13,105 14,050 16,780 17,120 46.4 2.0
Operators by Average Hours Per Week Worked for the Agricultural Operation
Less than 20 hours………………………………………………………………………………………………………………………………19,675 18,965 20,465 19,660 31.7 -3.9
20 to 40 hours ……………………………………………………………………………………………………………………………21,825 21,935 19,970 18,905 30.5 -5.3
20 to 29 hours ……………………………………………………………………………………………………………………………- - - 10,195 16.4 -
30 to 40 hours……………………………………………………………………………………………………………………………- - - 8,710 14.0 -
More than 40 hours………………………………………………………………………………………………………………………………40,960 35,290 31,225 23,480 37.8 -24.8
Operators Reporting Paid Non-Farm Work (18)
None………………………………………………………………………………………………………………………………56,230 38,720 32,560 29,805 48.0 -8.5
Less than 20 hours per week………………………………………………………………………………………………………………………………6,500 7,380 7,560 5,860 9.4 -22.5
20 to 40 hours per week………………………………………………………………………………………………………………………………10,915 14,750 14,190 13,520 21.8 -4.7
20 to 29 hours ……………………………………………………………………………………………………………………………- - - 4,680 7.5 -
30 to 40 hours……………………………………………………………………………………………………………………………- - - 8,840 14.2 -
More than 40 hours per week………………………………………………………………………………………………………………………………8,805 15,345 17,355 12,865 20.7 -25.9
See Census of Agriculture - Notes
Source: Statistics Canada, Census of Agriculture. For more information visit the Statistics Canada web site at: www.statcan.gc.ca
Table 108: Census of Agriculture, Alberta Farm Operators, 1996-2011
Number
Years
Number
Alberta Agriculture Statistics Yearbook, 2015 - 140 -