agro & food industry / food & beverage cpf price (b.) 52 ... · xd 03/05/17 cg report: €...
TRANSCRIPT

XD 03/05/17CG Report: 5
P/E (X) P/BV (X)14.61 1.59
Date/Time
27/02/2017 08:3127/02/2017 08:2127/02/2017 08:1927/02/2017 08:1820/02/2017 09:41
17/1/1978 Listed Date 21/12/1987
47.25% 61,427 53.27% 65,41321.39% @ 17/03/2017 Foreign Limit 40.00%9.53% @ 17/03/2017
Share %
Compare to Stock
(%)
Compare to Sector
(%)
Compare to Market
(%)
1 2,092,881,740 27.03 -1.77 -3.04 -3.1
2 853,660,460 11.03 -1.77 0.64 -0.71
3 742,018,766 9.58 -0.89 1.07 -3.34
4 236,066,800 3.05 -11.2 -11.21 -15.86
5 203,859,940 2.63 -5.93 -1.8 -7.02
6 195,662,200 2.53 14.61 20.95 17.21
7 152,229,530 1.97 1.59 2.6 1.91
8 144,555,000 1.87 0.32 0.42 0.41
9 121,309,412 1.5710 120,550,000 1.56
YTD 2016 2015 17/03/2017 30/12/2016 30/12/2015
1 7,742.94 7,742.94 7,742.942 1 1 13 214,866.64 228,416.79 141,695.844 27.75 29.5 18.35 17.41 15.99 15.646 1.59 1.84 1.177 14.61 15.74 13.738 15.56 103.51 809 663.19 898.73 559.18
1011 YTD 2016 2015 12 -5.93 61.2 -32.8413 3.42 2.54 4.114 0.5 0.4 0.561516
Dividend/Share Unit Payment Date Type
0.5 Baht 08/09/16 Cash0.45 Baht 19/05/2016 Cash0.3 Baht 10/09/15 Cash
0.45 Baht 21/05/2015 Cash0.3 Baht 12/09/14 Cash
0.25 Baht 23/05/2014 Cash
Auditor F/S Year ended 31/12
2016 2015 2014 2013 (01/01/16 - 31/12/16) (01/01/15 - 31/12/15) (01/01/14 - 31/12/14) (01/01/13 - 31/12/13)
34,100.38 36,460.82 33,551.55 19,457.3030,678.92 26,155.92 24,953.33 24,240.4354,991.07 52,111.81 49,036.02 48,469.15
166,368.87 159,993.38 146,253.45 124,243.51176,176.78 149,599.24 124,460.81 110,930.84
582,179.03 494,262.74 416,763.86 365,003.12
68,389.28 88,018.61 63,686.59 61,861.1831,561.94 28,022.33 25,632.14 21,887.6923,189.80 49,454.73 13,432.37 14,994.64
190,498.50 186,290.69 123,284.69 115,001.47197,974.12 134,247.10 129,512.92 120,429.08
388,472.62 320,537.79 252,797.61 235,430.55
7,742.94 7,742.94 7,742.94 7,742.947,742.94 7,742.94 7,742.94 7,742.94
36,462.88 36,462.88 36,462.88 36,462.887,466.44 7,462.57 - 3,572.57
75,603.15 66,739.67 60,951.48 54,313.321,135.15 1,135.15 1,135.15 1,135.15
133,697.68 116,364.68 117,532.26 109,794.60
60,008.73 57,360.28 46,433.99 19,777.972016 2015 2014 2013
(01/01/16 - 31/12/16) (01/01/15 - 31/12/15) (01/01/14 - 31/12/14) (01/01/13 - 31/12/13) 464,464.89 421,354.83 426,039.45 389,251.03
5,705.31 12,838.14 7,462.55 10,326.06
476,682.69 439,413.85 438,370.73 404,524.58
391,822.15 363,287.02 368,759.67 350,393.9245,472.86 46,889.24 42,837.19 36,962.93
438,183.87 409,772.08 411,611.80 387,051.85
57,006.83 45,487.58 36,724.12 26,017.1318,508.00 15,845.80 9,965.19 8,544.4138,498.83 29,641.78 26,758.93 17,472.73
14,702.82 11,058.74 10,561.70 7,065.25
1.99 1.5 1.43 0.962016 2015 2014 2013
(01/01/16 - 31/12/16) (01/01/15 - 31/12/15) (01/01/14 - 31/12/14) (01/01/13 - 31/12/13) 31,231.10 20,862.44 23,185.16 9,451.59
-62,783.61 -51,868.47 -33,163.74 -24,221.7129,618.50 30,755.01 23,533.24 17,792.05
-1,934.01 -251.02 13,554.67 3,021.93
2016 2015 2014 0.87 0.86 1.19
11.76 9.46 9.297.15 6.51 6.852.91 2.75 2.150.89 0.96 1.12
15.64 13.78 13.448.08 6.75 6.13.08 2.52 2.41
2016 2015 2014 10.23 -1.1 9.457.85 -1.48 5.248.48 0.24 8.376.93 -0.45 6.35
32.95 4.71 49.49
2016 2015 2014 16.34 16.49 17.3222.33 22.14 21.077.32 7.18 7.56
49.89 50.81 48.2613.15 13.54 15.5227.75 26.95 23.5244.46 46 45.81
Remark:
CA Type Changed paid up share Paid up share Par
Price (B.) 52 week High/Low Paid-up (MB.) Market Cap (MB.) EV (MB.) EBITDA (MB.) EV/EBITDA
CPFAgro & Food Industry / Food & BeverageSET50/SETHD
CHAROEN POKPHAND FOODS PUBLIC COMPANY LIMITED
11.23
News 3 Yr PerformanceSubject
Notification of Board of Directors' resolutions regarding the dividend payment, schedule for Annual General Shareholders' Meeting No. Management Discussion and Analysis Yearly Ending 31 Dec 2016
27.75 33.50 / 21.20 7,742.94 214,866.64 629,247.61 57,006.83
Company Profile
Address C.P. TOWER, FLOOR 15, 313 SILOM ROAD, BANG RAK Bangkok 10500
Telephone 0-2625-8000, 0-2625-8353-4, 0-2638-2935-6
Audited Yearly and Consolidated F/S (F45-3)Financial Statement Yearly 2016 (Audited)Disclosure of the Acquisition of Additional Equity Interest in a Subsidiary in China
Annual Report 2015
Establish DateIPO Price (Baht) N/A
Fax 0-2638-2942
URL http://www.cpfworldwide.com
Market/Industry/Sector ChangeEffective Date 01/04/2010
IPO Financial Advisory N/ALast Par Change Old 10.00 : New 1.00 @ 27/09/2001
Business TypeThe Company engages in agro-industrial and food conglomerate with 3 product catagories : 1) Feed business involving in production and sale of anminal feed, 2) Farm
Previous Market/Industry/Sector SET / Agro & Food Industry / AgribusinessCurrent Market/Industry/Sector SET / Agro & Food Industry / Food & Beverage
% / ShareholdersForeign ShareholdersNVDR Shareholders
Free Float 15/03/2016 13/03/2015
6 Months
บรษัิท ซพีเีอฟ (ประเทศไทย) จ ำกัด (มหำชน) YTD
WORTH ACCESS TRADING LIMITED P/E (X)
CHASE NOMINEES LIMITED P/BV (X)
Top 10 Major Shareholders (@ 15/03/2017) Price Performance (Adjusted Price)
บรษัิท เครอืเจรญิโภคภัณฑ ์จ ำกัด 5 Days
บรษัิท เจรญิโภคภัณฑโ์ฮลดิง้ จ ำกัด 1 Month
บรษัิท ไทยเอ็นวดีอีำร ์จ ำกัด 3 Months
ส ำนักงำนประกันสงัคม
StatisticsManagement Position
Mr. DHANIN CHEARAVANONT CHAIRMAN Listed share (M.)
CREATIVE LIGHT INVESTMENTS LIMITED Turnover Ratio (%)
STATE STREET BANK EUROPE LIMITEDUBS AG HONG KONG BRANCH Accumulated: Turnover Ratio, Value Trade/Day
MR. MIN TIEANWORN VICE PRESIDENT Price (B./share)Mr. CHINGCHAI LOHAWATANAKUL VICE PRESIDENT BVPS (B./Share)
Mr. ADIREK SRIPRATAK CHAIRMAN OF THE EXECUTIVE COMMITTEE / Par Value (B.)Mr. PRASERT POONGKUMARN VICE CHAIRMAN Market Cap (MB.)
Mr. PONG VISEDPAITOON DIRECTOR Turnover Ratio (%)Mr. SUNTHORN ARUNANONDCHAI DIRECTOR Value Trade/Day (MB.)
Mr. PHONGTHEP CHIARAVANONT DIRECTOR P/BV (X)Mr. VEERAVAT KANCHANADUL DIRECTOR P/E (X)
Mrs. SUPAPUN RUTTANAPORN INDEPENDENT DIRECTOR / AUDIT COMMITTEE Price Change (%)Mr. CHAIYAWAT WIBULSWASDI INDEPENDENT DIRECTOR / CHAIRMAN OF THE AUDIT Dividend Yield (%)
Mrs. ARUNEE WATCHARANANAN DIRECTORMr. ARSA SARASIN INDEPENDENT DIRECTOR Rate of Return
Approximately 50% of net profit after tax and statutory reserve (with additional conditions)POL. GEN. PHATCHARAVAT WONGSUWAN INDEPENDENT DIRECTOR
Dividend (Last 3 Year)
Mr. PONGSAK ANGKASITH INDEPENDENT DIRECTOR / AUDIT COMMITTEE Payout RatioMr. RUNGSON SRIWORASAT INDEPENDENT DIRECTOR / AUDIT COMMITTEE Dividend Policy
01/01/2015 - 01/07/2014 - 01/01/2014 -
Operation Period
01/01/2016 - 01/01/2015 -
Financial Data
Statement of Financial Position (MB.)
CashA/R NetInventories
01/07/2013 -
MISS SUJITRA MASENA / KPMG PHOOMCHAI AUDIT LIMITEDMR. VEERACHAI RATANAJARATKUL / KPMG PHOOMCHAI AUDIT LIMITEDMR. CHAROEN PHOSAMRITLERT / KPMG PHOOMCHAI AUDIT LIMITED
Current LiabilitiesNon-Current Liabilities
Total Liabilities
Authorized CapitalPaid-Up CapitalPremium (Discount) on Share Capital
Current AssetsPP&E Net
Total Assets
ODA/P NetCurrent portion of LT
SalesOther Income
Total Revenues
COGsSG&A
Total Expenses
Other Surplus (Deficit)Retained Earnings (Deficit)Treasury Stock
Shareholders' Equity
Minority InterestStatement of Comprehensive Income
(MB.)
Operating Cash FlowInvesting Cash FlowFinancing Cash Flow
Net Cash FlowAnnualized: ROE, ROA
Ratios
EBITDADepre. & Amor.EBIT
Net Profit
EPS (B.)Statement of Cash Flow (MB.)
EBIT Margin (%)Net Profit Margin (%)
Growth Rate (%)Sales Growth
Current Ratio (X)ROE (%)ROA (%)D/E (X)Total Asset Turnover (X)Gross Profit Margin (%)
Cash CycleA/R Turnover (Times)Avg. Collection Period (Days)Inventory Turnover (Times)Avg. Inventory Period (Days)A/P Turnover (Times)
COGs GrowthTotal Revenue GrowthTotal Expense GrowthNet Profit Growth
Annualized
Avg. Payment Period (Days)Cash Cycle (Days)
Presented and calculated from the consolidated statement and displayed as cumulative quarterly statement by fiscal year (Company
statement will be presented and calculated incase consolidated statement is not available.)
Information on the financial statements is presented according to the information that the listed companies submit on that period. The
investors should study additional information from the companies' financial statements since some companies may restate the comparing
financial statements on the latest financial statements.Information only PP, PO, XR and XD
No Information Found
Trading Sign Posted Date Lifted DateTrading Sign (Latest)
Only Preferred Share and WarrantsCapital Movement (Last 3 Year) Other Securities
Date Securities Name -
Source: SETSMART (Copyright © The Stock Exchange of Thailand)
No Information FoundMarket Alert (Latest)
No Information Found
CG Report: 5
P/E (X) P/BV (X)11.96 1.48
Date/Time
17/03/2017 18:1917/03/2017 18:1417/03/2017 18:1214/03/2017 19:5413/03/2017 18:47
01/10/01 Listed Date 06/12/0135
48.87% 44,789 48.86% 34,45915.97% @ 17/03/2017 Foreign Limit 30.00%6.95% @ 17/03/2017
Share %
Compare to Stock
(%)
Compare to Sector
(%)
Compare to Market
(%)
1 1,459,885,575 51.11 1.54 -0.3 0.17
2 211,927,800 7.42 - 0.69 1.08
3 211,927,800 7.42 9.09 6.52 6.4
4 189,837,203 6.65 21.47 7.79 15.1
5 84,930,326 2.97 6.45 5.8 5.22
6 41,304,768 1.45 11.96 13.8 17.21
7 33,421,100 1.17 1.48 1.45 1.91
8 30,137,700 1.06 0.19 0.13 0.41
9 28,260,000 0.9910 21,629,500 0.76
YTD 2016 2015 17/03/2017 30/12/2016 30/12/2015
1 2,856.30 2,856.30 2,856.302 10 10 103 1,131,094.65 1,062,543.46 696,937.114 396 372 2445 267.11 258.21 244.826 1.48 1.44 17 11.96 14.03 N/A8 10.92 59.01 519 2,382.20 2,052.51 1,805.62
1011 YTD 2016 2015 12 6.45 52.46 -24.6913 2.53 2.69 4.5114 0.3 0.38 N/A15
Dividend/Shar
e Unit Payment Date Type
6 Baht 16/09/2016 Cash4 Baht 29/04/2016 Cash6 Baht 25/09/2015 Cash5 Baht 24/04/2015 Cash6 Baht 02/10/14 Cash
Auditor F/S Year ended 31/12
2016 2015 2014 2013 (01/01/16 - 31/12/16) (01/01/15 - 31/12/15) (01/01/14 - 31/12/14) (01/01/13 - 31/12/13)
215,566.41 239,977.95 203,785.43 157,683.49143,191.06 141,978.78 179,391.41 277,590.16116,883.54 84,085.26 27,514.09 44,172.41741,490.62 679,702.20 491,962.68 523,143.66
1,098,229.96 1,118,677.24 720,335.10 740,648.76
2,232,331.08 2,173,996.19 1,779,179.16 1,801,721.57
30,527.00 26,475.15 22,321.31 14,336.40159,526.62 149,107.65 183,616.62 271,145.2964,055.69 54,618.35 62,711.30 45,943.60
339,592.21 315,385.06 344,450.31 406,407.78721,141.86 770,923.75 567,386.73 572,135.59
1,060,734.07 1,086,308.81 911,837.04 978,543.37
28,572.46 28,572.46 28,572.46 28,572.4628,563.00 28,563.00 28,563.00 28,563.0029,211.13 29,211.13 29,211.13 29,211.13
- - - -9,787.33698,394.20 634,386.09 648,689.57 634,287.68
- - - -
762,947.65 697,147.03 697,578.41 682,646.66
408,649.36 390,540.35 169,763.71 140,531.552016 2015 2014 2013
(01/01/16 - 31/12/16) (01/01/15 - 31/12/15) (01/01/14 - 31/12/14) (01/01/13 - 31/12/13) 1,718,846.04 2,026,911.57 2,834,732.18 2,842,688.00
14,155.33 30,784.17 29,209.16 14,139.22
1,737,144.57 2,063,727.44 2,866,883.40 2,883,905.98
1,476,612.95 1,818,795.58 2,634,814.90 2,618,297.9765,307.53 71,496.47 94,914.20 49,031.53
1,552,961.23 1,978,063.92 2,741,138.98 2,700,694.30
313,940.36 234,549.07 242,751.44 259,526.24129,757.01 148,885.55 117,007.02 76,314.56184,183.35 85,663.52 125,744.42 183,211.68
94,609.08 19,936.42 55,794.93 94,652.27
32.68 6.73 19.33 33.072016 2015 2014 2013
(01/01/16 - 31/12/16) (01/01/15 - 31/12/15) (01/01/14 - 31/12/14) (01/01/13 - 31/12/13) 270,435.23 293,284.61 235,367.50 165,326.85
-178,914.39 -133,042.98 -144,061.07 -95,363.66-116,203.41 -163,813.33 -47,315.43 -55,790.36
-24,682.56 -3,344.22 43,763.51 14,172.83
2016 2015 2014 2.18 2.16 1.43
12.96 2.86 8.088.36 4.33 7.021.39 1.56 1.310.79 1.04 1.6
14.09 10.27 7.0510.6 4.15 4.395.45 0.97 1.95
2016 2015 2014 -15.2 -28.5 -0.28
-18.81 -30.97 0.63-15.82 -28.01 -0.59-21.49 -27.84 1.5374.55 -64.27 -41.05
2016 2015 2014 12.05 12.61 12.4130.28 28.94 29.4214.69 32.6 73.5124.84 11.2 4.979.57 10.93 11.59
38.15 33.39 31.516.97 6.75 2.89
Remark:
CA Type Changed paid up share Paid up share Par
Price (B.) 52 week High/Low Paid-up (MB.) Market Cap (MB.) EV (MB.) EBITDA (MB.) EV/EBITDA
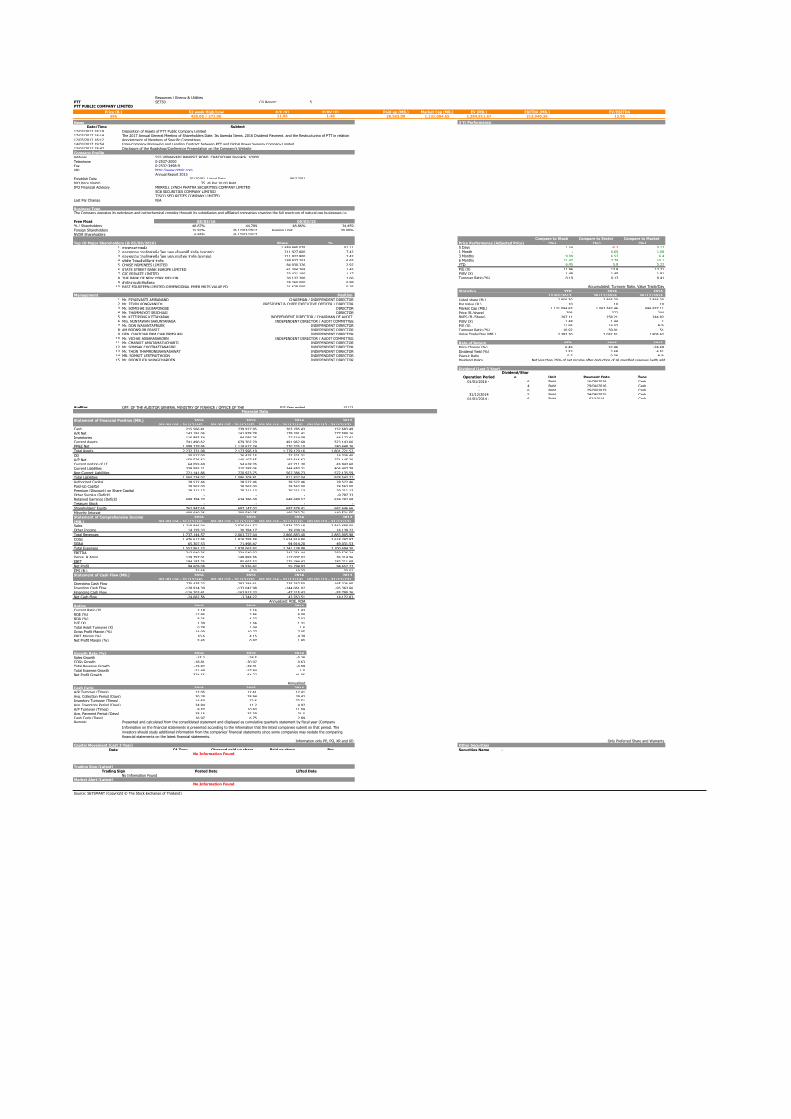
PTTResources / Energy & UtilitiesSET50
PTT PUBLIC COMPANY LIMITED
12.95
News 3 Yr PerformanceSubject
Disposition of Assets of PTT Public Company LimitedThe 2017 Annual General Meeting of Shareholders Date, Its Agenda Items, 2016 Dividend Payment, and the Restructuring of PTT in relation
396 430.00 / 272.00 28,563.00 1,131,094.65 2,384,911.67 313,940.36
Company Profile
Address 555 VIBHAVADI RANGSIT ROAD, CHATUCHAK Bangkok 10900
Telephone 0-2537-2000
Appointment of Members of Specific CommitteesInter-Company Borrowing and Lending Contract between PTT and Global Power Synergy Company LimitedDisclosure of the Roadshow/Conference Presentation on the Company's Website
Annual Report 2015
Establish DateIPO Price (Baht) @ Par 10.00 Baht
Fax 0-2537-3498-9
URL http://www.pttplc.com
Last Par Change N/A
Business Type
IPO Financial Advisory MERRILL LYNCH PHATRA SECURITIES COMPANY LIMITEDSCB SECURITIES COMPANY LIMITEDTISCO SECURITIES COMPANY LIMITED
% / ShareholdersForeign ShareholdersNVDR Shareholders
The Company operates its petroleum and petrochemical complex through its subsidiaries and affiliated companies covering the full spectrum of natural gas businesses i.e.
Free Float 08/03/16 09/03/15
Top 10 Major Shareholders (@ 05/09/2016) Price Performance (Adjusted Price)
กระทรวงกำรคลงั 5 Days
กองทนุรวม วำยภัุกษ์หนึง่ โดย บลจ.เอ็มเอฟซ ีจ ำกัด (มหำชน) 1 Month
กองทนุรวม วำยภัุกษ์หนึง่ โดย บลจ.กรุงไทย จ ำกัด (มหำชน) 3 Months
บรษัิท ไทยเอ็นวดีอีำร ์จ ำกัด
THE BANK OF NEW YORK MELLON Turnover Ratio (%)
ส ำนักงำนประกันสงัคมEAST FOURTEEN LIMITED-DIMENSIONAL EMER MKTS VALUE FD Accumulated: Turnover Ratio, Value Trade/Day
6 Months
CHASE NOMINEES LIMITED YTD
STATE STREET BANK EUROPE LIMITED P/E (X)
GIC PRIVATE LIMITED P/BV (X)
Mr. TEVIN VONGVANICH PRESIDENT & CHIEF EXECUTIVE OFFICER / DIRECTOR Par Value (B.)Mr. SOMCHAI SUJJAPONGSE DIRECTOR Market Cap (MB.)
StatisticsManagement Position
Mr. PIYASVASTI AMRANAND CHAIRMAN / INDEPENDENT DIRECTOR Listed share (M.)
Mrs. NUNTAWAN SAKUNTANAGA INDEPENDENT DIRECTOR / AUDIT COMMITTEE P/BV (X)Mr. DON WASANTAPRUEK INDEPENDENT DIRECTOR P/E (X)
Mr. THAMMAYOT SRICHUAI DIRECTOR Price (B./share)Mr. KITTIPONG KITTAYARAK INDEPENDENT DIRECTOR / CHAIRMAN OF AUDIT BVPS (B./Share)
Mr. VICHAI ASSARASAKORN INDEPENDENT DIRECTOR / AUDIT COMMITTEEMr. CHANVIT AMATAMATUCHARTI INDEPENDENT DIRECTOR Rate of Return
AM BOONSUIB PRASIT INDEPENDENT DIRECTOR Turnover Ratio (%)GEN. CHATCHALERM CHALERMSUKH INDEPENDENT DIRECTOR Value Trade/Day (MB.)
MR. SOMKIT LERTPAITHOON INDEPENDENT DIRECTOR Payout RatioMr. BOONTUCK WUNGCHAROEN INDEPENDENT DIRECTOR Dividend Policy
Mr. SOMSAK CHOTRATTANASIRI INDEPENDENT DIRECTOR Price Change (%)Mr. THON THAMRONGNAWASAWAT INDEPENDENT DIRECTOR Dividend Yield (%)
01/01/2016 - --
Not less than 25% of net income after deduction of all specified reserves (with additional conditions)
Dividend (Last 3 Year)
Operation Period
Financial Data
Statement of Financial Position (MB.)
CashA/R NetInventories
31/12/201401/01/2014 -
OFF. OF THE AUDITOR GENERAL MINISTRY OF FINANCE / OFFICE OF THE
Current LiabilitiesNon-Current Liabilities
Total Liabilities
Authorized CapitalPaid-Up CapitalPremium (Discount) on Share Capital
Current AssetsPP&E Net
Total Assets
ODA/P NetCurrent portion of LT
SalesOther Income
Total Revenues
COGsSG&A
Total Expenses
Other Surplus (Deficit)Retained Earnings (Deficit)Treasury Stock
Shareholders' Equity
Minority InterestStatement of Comprehensive Income
(MB.)
Operating Cash FlowInvesting Cash FlowFinancing Cash Flow
Net Cash FlowAnnualized: ROE, ROA
Ratios
EBITDADepre. & Amor.EBIT
Net Profit
EPS (B.)Statement of Cash Flow (MB.)
EBIT Margin (%)Net Profit Margin (%)
Growth Rate (%)Sales Growth
Current Ratio (X)ROE (%)ROA (%)D/E (X)Total Asset Turnover (X)Gross Profit Margin (%)
Cash CycleA/R Turnover (Times)Avg. Collection Period (Days)Inventory Turnover (Times)Avg. Inventory Period (Days)A/P Turnover (Times)
COGs GrowthTotal Revenue GrowthTotal Expense GrowthNet Profit Growth
Annualized
Avg. Payment Period (Days)Cash Cycle (Days)
Presented and calculated from the consolidated statement and displayed as cumulative quarterly statement by fiscal year (Company
Information on the financial statements is presented according to the information that the listed companies submit on that period. The
investors should study additional information from the companies' financial statements since some companies may restate the comparing
financial statements on the latest financial statements.Information only PP, PO, XR and XD
No Information Found
Trading Sign Posted Date Lifted DateTrading Sign (Latest)
Only Preferred Share and WarrantsCapital Movement (Last 3 Year) Other Securities
Date Securities Name -
Source: SETSMART (Copyright © The Stock Exchange of Thailand)
No Information FoundMarket Alert (Latest)
No Information Found

CG Report: 4
P/E (X) P/BV (X)27.25 3.45
Date/Time
17/03/2017 07:22
14/03/2017 19:44
14/03/2017 08:51
13/03/2017 19:34
10/03/17 21:30
06/05/86 Listed Date 13/10/2004
12
44.40% 3,787 33.11% 2,123
49.00% @ 17/03/2017 Foreign Limit 49.00%
15.76% @ 17/03/2017
Share % Compare to Stock (%) Compare to Sector (%) Compare to Market (%)
1 402,565,553 26.39 -24.75 -24.07 -25.77
2 194,884,702 12.78 -68.2 -61.45 -67.86
3 185,846,489 12.18 -72.46 -67.12 -73.14
4 158,911,191 10.42 -47.59 -51.21 -50.34
5 98,597,757 6.46 -66.81 -62.18 -67.2
6 67,000,000 4.39 27.25 17.73 17.21
7 53,503,635 3.51 3.45 2.61 1.91
8 40,715,663 2.67 7.97 0.68 0.41
9 36,504,600 2.39
10 35,719,900 2.34
YTD 2016 2015
17/03/2017 30/12/2016 30/12/2015
1 1,525.54 1,525.51 1,427.29
2 0.5 0.5 0.5
3 28,985.22 87,335.45 25,976.59
4 19 57.25 18.2
5 5.51 5.17 4.05
6 3.45 11.08 5.01
7 27.25 93.72 53.77
8 143.27 156.82 125.34
9 1,197.86 325.07 83.15
10
11 YTD 2016 2015
12 -66.81 214.56 216.52
0.82 0.27 0.26
0.22 0.26 0.14
Dividend/Share Unit Payment Date Type
0.156 Baht 26/05/2016 Cash
0.0625 Baht 26/05/2015 Cash
0.0568 Baht 28/05/2014 Cash
Auditor F/S Year ended 31/12
2016 2015 2014 2013
(01/01/16 - 31/12/16) (01/01/15 - 31/12/15) (01/01/14 - 31/12/14) (01/01/13 - 31/12/13)
2,551.22 1,044.89 357.45 320.55
- - - -
3,021.78 - - -
10,336.39 8,946.02 6,149.59 4,610.12
- - 6,149.59 4,610.12
- - - -
50.89 32.95 23.6 21.15
130.67 115.98 100.64 70.88
17,265.67 10,765.12 7,270.62 5,496.51
- - - -
1,358.79 2,415.61 4,129.65 3,111.07
560.66 353.17 269.8 13.55
8,764.76 3,183.66 4,758.35 3,235.42
922.55 769.59 720.93 720.93
762.75 713.64 542.88 512.35
- - - -
762.75 713.64 542.88 512.35
5,191.56 4,254.63 1,084.25 933.68
- - 3.58 2.22
2,193.68 1,360.78 845.3 787.49
- - - -
8,408.62 7,581.46 2,512.27 2,261.08
92.3 - - -
2016 2015 2014 2013
(01/01/16 - 31/12/16) (01/01/15 - 31/12/15) (01/01/14 - 31/12/14) (01/01/13 - 31/12/13)
2,576.51 2,099.49 1,666.74 1,258.28
116.93 - - -
272.75 266.77 250.42 145.71
- - - -
2,303.76 1,832.73 1,416.32 1,112.57
313.27 356.57 494.86 343.64
- - - -
63.78 316.53 205.33 213.26
281.85 72.68 - -
- - - -
- - - -
232.25 355.03 431.82 314.39
- - - -
- - - -
887.38 784.37 561.14 362.84
- - - -
- - - -
1,264.85 725.97 133.84 304.97
1,063.84 582.89 114.7 240.31
0.7 0.49 0.11 0.25
2016 2015 2014 2013
(01/01/16 - 31/12/16) (01/01/15 - 31/12/15) (01/01/14 - 31/12/14) (01/01/13 - 31/12/13)
-490.12 518.61 -39.78 -1,243.39
-3,218.02 -2,586.31 -678.83 -214.33
5,238.21 2,515.91 746.44 1,745.67
1,530.07 448.21 27.82 287.95
2016 2015 2014
13.31 11.55 4.81
9.02 8.05 2.1
36.41 23.42 6.13
2016 2015 2014
N/A N/A N/A
N/A N/A N/A
82.51 408.17 -52.27
Remark:
CA Type Changed paid up share Paid up share Par
GL
Financials / Finance & Securities
SET
GROUP LEASE PUBLIC COMPANY LIMITED
Clarification of News or Information concerning the Repurchase of shares(Treasury Stock)
Clarification of details on auditor's attention to the notes on loans and interest receivables(Revised)
Clarification of News or Information
Price (B.) 52 week High/Low Paid-up (MB.) Market Cap (MB.)
19 69.75 / 12.40 762.77 28,985.22
Top 10 Major Shareholders (@ 15/11/2016) Price Performance (Adjusted Price)
Business Type-
Free Float 31/03/2016 30/03/2015
% / Shareholders
Establish Date
IPO Price (Baht) @ Par 5.00 Baht
IPO Financial Advisory SIAM CITY SECURITIES CO., LTD.
Last Par Change Old 5.00 : New 0.50 @ 15/05/2013
Fax 0-2954-2902-3
URL http://www.grouplease.co.th
Annual Report 2014
บรษัิท ศนูยรั์บฝำกหลักทรัพย ์(ประเทศไทย) จ ำกดั เพือ่ผูฝ้ำก
บรษัิท คกูำร ์แปซฟิิค โฮลดิง้ส ์จ ำกดั
MERRILL LYNCH,PIERCE,FENNER & SMITH INC.
นำย ประยงค ์วนชิสวุรรณ
Management Position
ENGINE HOLDINGS ASIA PTE.LTD.
บรษัิท ไทยเอ็นวดีอีำร ์จ ำกดั
SIX SIS LTD
บรษัิท เอ.พ.ีเอฟ. โฮลดิง้ส ์จ ำกดั
DBS VICKERS SECURITIES (SINGAPORE) PTE LTD A/C CLIENTS
นำย สทุธพิงษ์ เวศยว์รตุม์
Mr. PATRICK FISHER DIRECTOR
Mr. RIKI ISHIGAMI DIRECTOR
Mr. YUSUKE KOZUMA DIRECTOR
Mr. MITSUJI KONOSHITA CHAIRMAN OF THE BOARD OF DIRECTORS / CHIEF
Mr. TATSUYA KONOSHITA CHAIRMAN OF EXECUTIVE BOARD / DIRECTOR
Mr. MUNEO TASHIRO DIRECTOR
Mr. KRIT PHANRATANAMALA INDEPENDENT DIRECTOR / AUDIT COMMITTEE
Mr. PHOLDEJ THERDPHITHAKVANIJ INDEPENDENT DIRECTOR / AUDIT COMMITTEE
Mr. SONIT PICHYANGKUL INDEPENDENT DIRECTOR / AUDIT COMMITTEE
Mr. REGIS MARTIN DIRECTOR
Mr. ALAIN DUFES DIRECTOR
GEN. SUEBSAN DARDARANANDA INDEPENDENT DIRECTOR / CHAIRMAN OF THE AUDIT
P/BV (X)
Turnover Ratio (%)
Accumulated: Turnover Ratio, Value Trade/Day
Statistics
Listed share (M.)
5 Days
1 Month
3 Months
6 Months
YTD
P/E (X)
Rate of Return
Price Change (%)
Dividend Yield (%)
Par Value (B.)
Market Cap (MB.)
Price (B./share)
BVPS (B./Share)
P/BV (X)
P/E (X)
MR. SOPHON PERMSIRIVALLOP / E Y OFFICE COMPANY LIMITED
Statement of Financial Position (MB.)
Cash
Interbank & Money Mkt.
Investment Net
Net Loans and Accured Int.
Financial Data
01/01/2014 - 31/12/2014
01/07/2013 - 31/12/2013
MISS ROSAPORN DECHARKOM / E Y OFFICE COMPANY LIMITED
MISS PIMJAI MANITKAJOHNKIT / E Y OFFICE COMPANY LIMITED
MR. CHAYAPOL SUPPASEDTANON / E Y OFFICE COMPANY LIMITED
MISS RUNGNAPA LERTSUWANKUL / E Y OFFICE COMPANY LIMITED
Borrowings
- ST-Borrowing
Total Liabilities
Authorized Capital
Paid-Up Capital
- Preferred Shares
- Loans & Receivables
- Allowance for Doubtful Acct
Assets Forclosed-Net
PP&E Net
Total Assets
Deposits
Minority Interest
Statement of Comprehensive Income (MB.)
Interest & Div. Income
- Loans
Interest Expense
- Deposits
- Ordinary Shares
Premium (Discount) On Share Capital
Other Surplus (Deficit)
Retained Earnings (Deficit)
Treasury Stock
Shareholders' Equity
Gain on Exchange
Non-Interest Expenses
- Personnel Expenses
- Premises & Equip Expenses
- Fees & Service Expenses
- Loss on Investments
Net Interest & Div Income
Bad Debt & Doubtful Acct.
Loss on Debt Restructuring
Non-Interest Income
Fees & Service Income
Gain on Investments
Investing Cash Flow
Financing Cash Flow
Net Cash Flow
Annualized: ROE, ROA
Ratios
ROE (%)
- Loss on Exchange
Net Income before Tax
Net Profit
EPS (B.)
Statement of Cash Flow (MB.)
Operating Cash Flow
Net Profit Growth
Presented and calculated from the consolidated statement and displayed as cumulative quarterly statement by fiscal year (Company
statement will be presented and calculated incase consolidated statement is not available.)
Information on the financial statements is presented according to the information that the listed companies submit on that period. The
investors should study additional information from the companies' financial statements since some companies may restate the comparing
financial statements on the latest financial statements.
Information only PP, PO, XR and XD
Capital Movement (Last 3 Year)
Date
ROA (%)
Net Profit Margin (%)
Growth Rate (%)
Loan Growth
Deposit Growth
Only Preferred Share and Warrants
Other Securities
Securities Name GL-W4
No Information Found
Trading Sign (Latest)
Trading Sign Posted Date Lifted Date
Foreign Shareholders
NVDR Shareholders
3 Yr Performance
To inform exercise date of GL-W4 (no.8)
eddddddddddddddddd
Address 63 SOI 1, THETSABANNIMITAI ROAD, LADYAO, CHATUCHAK Bangkok 10900
Telephone 0-2580-7555
NewsSubject
Clarification of details on auditor's attention to the notes on loans and interest receivables(Revised 2)
Payout Ratio
Dividend Policy Shareholders who have invested in the Company?s shares will receive the benefits in forms of dividend and the value of shares which may be higher. The Company has a dividend policy as its Board of Directors (with additional conditions)
Dividend (Last 3 Year)
Operation Period
01/01/2015 - 31/12/2015
Turnover Ratio (%)
Value Trade/Day (MB.)
Source: SETSMART (Copyright © The Stock Exchange of Thailand)
No Information Found
Market Alert (Latest)
Cash Balance 13/03/2017 - 21/04/2017

CG Report: 5
P/E (X) P/BV (X)27.78 0.88
Date/Time
03/03/17 19:2224/02/2017 17:2523/02/2017 18:4916/02/2017 19:2016/02/2017 19:16
20/6/1985 Listed Date 10/06/9333
34.68% 55,632 34.68% 46,55714.32% @ 17/03/2017 Foreign Limit 40.00%6.40% @ 17/03/2017
Share %
Compare to Stock
(%)
Compare to Sector
(%)
Compare to Market
(%)
1 2,591,860,489 65.29 1.41 -0.43 0.04
2 268,431,744 6.76 -1.91 -1.23 -0.85
3 146,416,470 3.69 -1.37 -3.69 -3.8
4 62,368,607 1.57 14.29 1.41 8.29
5 37,516,877 0.95 -6.49 -7.07 -7.57
6 25,777,791 0.65 27.78 13.8 17.21
7 23,398,806 0.59 0.88 1.45 1.91
8 22,573,800 0.57 0.15 0.13 0.41
9 21,880,100 0.5510 21,798,803 0.55
YTD 2016 2015 17/03/2017 30/12/2016 30/12/2015
1 3,969.99 3,969.99 3,969.992 1 1 13 357,298.69 382,111.09 227,281.664 90 96.25 57.255 102.77 99.81 102.646 0.88 0.96 0.567 27.78 20.74 N/A8 14.05 105.9 48.19 1,023.10 1,272.54 719.45
1011 YTD 2016 2015 12 -6.49 68.12 -48.8813 3.61 3.12 7.8614 1 0.65 N/A15
Dividend/Shar
e Unit Payment Date Type
2.5 Baht 10/04/17 Cash0.75 Baht 25/08/2016 Cash
2 Baht 11/04/16 Cash1 Baht 21/08/2015 Cash
1.5 Baht 09/04/15 Cash3 Baht 22/08/2014 Cash
Auditor F/S Year ended 31/12
2016 2015 2014 2013 (01/01/16 - 31/12/16) (01/01/15 - 31/12/15) (01/01/14 - 31/12/14) (01/01/13 - 31/12/13)
73,076.52 108,099.81 129,739.77 77,342.822,722.90 3,040.51 5,088.38 4,992.251,345.37 1,703.87 1,025.60 1,489.29
185,972.83 169,641.79 184,129.97 134,718.96305,781.99 348,341.60 379,319.74 415,809.03
676,889.53 708,863.56 767,725.02 707,866.94
- - - -3,005.71 4,269.36 4,292.53 4,328.64
- - 24,696.43 11,698.8039,442.94 50,804.43 94,925.77 86,383.41
229,462.67 249,248.10 259,179.37 236,629.03
268,905.61 300,052.53 354,105.14 323,012.43
3,969.99 3,969.99 3,969.99 3,969.993,969.99 3,969.99 3,969.99 3,969.99
105,417.62 105,417.62 105,417.62 105,417.62- - - -
222,068.84 222,043.95 264,353.63 267,378.50- - - -
407,983.92 408,811.04 413,619.88 384,854.51
- - - -2016 2015 2014 2013
(01/01/16 - 31/12/16) (01/01/15 - 31/12/15) (01/01/14 - 31/12/14) (01/01/13 - 31/12/13) 150,217.05 185,770.57 247,817.12 224,972.69
2,528.17 7,497.14 12,459.43 3,768.12
153,046.65 193,578.62 260,388.92 228,931.21
12,464.25 14,320.32 25,508.12 25,077.2128,290.87 33,890.31 39,452.62 35,839.29
122,744.89 199,708.36 194,928.90 119,889.62
104,693.01 91,816.02 157,598.86 161,833.2374,391.25 97,945.77 92,138.83 52,791.6330,301.76 -6,129.75 65,460.03 109,041.60
12,859.72 -31,590.49 21,490.45 56,154.77
2.76 -8.24 5.19 14.072016 2015 2014 2013
(01/01/16 - 31/12/16) (01/01/15 - 31/12/15) (01/01/14 - 31/12/14) (01/01/13 - 31/12/13) 80,480.38 98,754.13 140,208.58 114,597.99
-95,999.99 -73,028.81 -97,633.00 -89,286.38-19,211.30 -56,821.37 8,289.94 -21,643.47
-34,730.90 -31,096.04 50,865.51 3,668.13
2016 2015 2014 4.71 3.34 1.943.15 -7.68 5.384.37 -0.83 8.870.66 0.73 0.860.22 0.26 0.3591.7 92.29 89.7119.8 -3.17 25.148.4 -16.32 8.25
2016 2015 2014 -19.14 -25.04 10.15-12.96 -43.86 1.72-20.94 -25.66 13.74-38.54 2.45 62.59
N/A N/A -61.73
2016 2015 2014 52.13 45.71 49.17
7 7.99 7.428.18 10.49 20.29
44.65 34.78 17.993.43 3.35 5.92
106.52 109.11 61.68-54.87 -66.34 -36.26
Remark:
CA Type Changed paid up share Paid up share Par
Price (B.) 52 week High/Low Paid-up (MB.) Market Cap (MB.) EV (MB.) EBITDA (MB.) EV/EBITDA
PTTEPResources / Energy & UtilitiesSET50
PTT EXPLORATION AND PRODUCTION PUBLIC COMPANY LIMITED
18.25
News 3 Yr PerformanceSubject
TOTAL's participation in the Myanmar MD-7 ProjectClosing of the Registration for Interest Payment of Debentures (PTEP183A)
90 102.00 / 66.00 3,969.99 357,298.69 553,127.78 104,693.01
Company Profile
Address Energy Complex Building A, Floors 6, 19-36, 555/1 Vibhavadi Rangsit Road, Chatuchak Bangkok 10900
Telephone 0-2537-4000
Financial Statement Yearly 2016 [Revised] (Audited)Agendas, and Publication of the Meeting Notice for the 2017 Annual General Shareholders' MeetingManagement Discussion and Analysis Yearly Ending 31 Dec 2016
Annual Report 2016
Establish DateIPO Price (Baht) @ Par 10.00 Baht
Fax 0-2537-4444
URL http://www.pttep.com
Business TypeThe principal business operations of the the Group are exploration and production of petroleum in Thailand and overseas, foreign gas pipeline transportation, and
IPO Financial Advisory PHATRA THANAKIT PUBLIC COMPANY LIMITEDKGI SECURITIES (THAILAND) PUBLIC COMPANY LIMITED
Last Par Change Old 5.00 : New 1.00 @ 24/04/2006
% / ShareholdersForeign ShareholdersNVDR Shareholders
Free Float 12/02/16 13/02/2015
6 Months
ส ำนักงำนประกันสงัคม YTD
STATE STREET BANK AND TRUST COMPANY P/E (X)
HSBC (SINGAPORE) NOMINEES PTE LTD P/BV (X)
Top 10 Major Shareholders (@ 10/02/2017) Price Performance (Adjusted Price)
บรษัิท ปตท. จ ำกัด (มหำชน) 5 Days
บรษัิท ไทยเอ็นวดีอีำร ์จ ำกัด 1 Month
CHASE NOMINEES LIMITED 3 Months
STATE STREET BANK EUROPE LIMITED
StatisticsManagement Position
Mr. PRAJYA PHINYAWAT CHAIRMAN OF THE BOARD OF DIRECTORS / Listed share (M.)
PEOPLE'S BANK OF CHINA Turnover Ratio (%)
EAST FOURTEEN LIMITED-DIMENSIONAL EMER MKTS VALUE FDTHE BANK OF NEW YORK MELLON Accumulated: Turnover Ratio, Value Trade/Day
Mr. TEVIN VONGVANICH DIRECTOR Price (B./share)Mr. WIRAT UANARUMIT DIRECTOR BVPS (B./Share)
Mr. SOMPORN VONGVUTHIPORNCHAI PRESIDENT AND CHIEF EXECUTIVE OFFICER / Par Value (B.)Mr. MANAS JAMVEHA DIRECTOR Market Cap (MB.)
Mr. AMPON KITTIAMPON INDEPENDENT DIRECTOR / CHAIRMAN OF THE AUDIT Turnover Ratio (%)Mr. ACHPORN CHARUCHINDA INDEPENDENT DIRECTOR / AUDIT COMMITTEE Value Trade/Day (MB.)
Mr. TWARATH SUTABUTR DIRECTOR P/BV (X)Mr. PITIPAN TEPARTIMARGORN DIRECTOR P/E (X)
Col. NIMIT SUWANNARAT INDEPENDENT DIRECTOR Price Change (%)Mr. PITI TANTAKASEM INDEPENDENT DIRECTOR Dividend Yield (%)
ADM. TANARAT UBOL INDEPENDENT DIRECTORMr. SETHAPUT SUTHIWART-NARUEPUT INDEPENDENT DIRECTOR / AUDIT COMMITTEE Rate of Return
Minimum of 30% of net profit after tax annually (with additional conditions)
Dividend (Last 3 Year)
Operation Period
Mr. SONGSAK SAICHEUA INDEPENDENT DIRECTOR Payout RatioMiss PANADA KANOKWAT AUDIT COMMITTEE Dividend Policy
01/01/2015 - 01/07/2014 - 01/01/2014 -
-01/01/2016 -
-
A/R NetInventoriesCurrent AssetsPP&E Net
Total Assets
OD
OFF. OF THE AUDITOR GENERAL MINISTRY OF FINANCE / OFFICE OF THE Financial Data
Statement of Financial Position (MB.)
Cash
Paid-Up CapitalPremium (Discount) on Share CapitalOther Surplus (Deficit)Retained Earnings (Deficit)Treasury Stock
Shareholders' Equity
A/P NetCurrent portion of LTCurrent LiabilitiesNon-Current Liabilities
Total Liabilities
Authorized Capital
SG&A
Total Expenses
EBITDADepre. & Amor.EBIT
Net Profit
Minority InterestStatement of Comprehensive Income
(MB.)SalesOther Income
Total Revenues
COGs
Annualized: ROE, ROA
RatiosCurrent Ratio (X)ROE (%)ROA (%)D/E (X)
EPS (B.)Statement of Cash Flow (MB.)
Operating Cash FlowInvesting Cash FlowFinancing Cash Flow
Net Cash Flow
Growth Rate (%)Sales GrowthCOGs GrowthTotal Revenue GrowthTotal Expense GrowthNet Profit Growth
Total Asset Turnover (X)Gross Profit Margin (%)
EBIT Margin (%)Net Profit Margin (%)
Avg. Inventory Period (Days)A/P Turnover (Times)Avg. Payment Period (Days)Cash Cycle (Days)
Presented and calculated from the consolidated statement and displayed as cumulative quarterly statement by fiscal year (Company
Information on the financial statements is presented according to the information that the listed companies submit on that period. The
investors should study additional information from the companies' financial statements since some companies may restate the comparing
financial statements on the latest financial statements.
Annualized
Cash CycleA/R Turnover (Times)Avg. Collection Period (Days)Inventory Turnover (Times)
Information only PP, PO, XR and XD Only Preferred Share and WarrantsCapital Movement (Last 3 Year) Other Securities
Date Securities Name -No Information Found
Market Alert (Latest)No Information Found
Source: SETSMART (Copyright © The Stock Exchange of Thailand)
Trading Sign Posted Date Lifted DateNo Information Found
Trading Sign (Latest)

XD 10/04/17CG Report: 4
P/E (X) P/BV (X)58.54 1.24
Date/Time
17/03/2017 17:3714/03/2017 13:0210/03/17 17:1509/03/17 7:4308/03/17 8:28
16/5/1983 Listed Date 16/06/198972
85.14% 45,420 85.29% 43,75612.39% @ 17/03/2017 Foreign Limit 40.00%7.79% @ 17/03/2017
Share %
Compare to Stock
(%)
Compare to Sector
(%)
Compare to Market
(%)
1 405,395,119 8.01 2.11 0.26 0.73
2 288,309,528 5.7 -0.51 0.18 0.56
3 124,032,000 2.45 3.74 1.3 1.19
4 118,508,880 2.34 29.33 14.76 22.55
5 108,690,100 2.15 1.04 0.42 -0.13
6 94,292,420 1.86 58.54 13.8 17.21
7 93,803,000 1.85 1.24 1.45 1.91
8 69,292,226 1.37 0.54 0.13 0.41
9 62,785,356 1.2410 60,635,370 1.2
YTD 2016 2015 17/03/2017 30/12/2016 30/12/2015
1 5,060.63 4,937.17 2,581.882 1 1 13 98,176.30 94,793.66 41,310.064 19.4 19.2 12.085 15.98 14.61 24.456 1.24 1.33 0.657 58.54 N/A 4,980.128 65.04 497.73 108.229 1,213.94 1,236.35 278.31
1011 YTD 2016 2015 12 1.04 58.88 -35.74
2.24 2.72 7.51.31 N/A 373.51
Dividend/Share Unit Payment Date Type
0.25 Baht 23/09/2016 Cash0.5 Baht 13/05/2016 Cash0.5 Baht 25/09/2015 Cash0.7 Baht 29/04/2015 Cash0.5 Baht 26/09/2014 Cash0.7 Baht 29/04/2014 Cash
Auditor F/S Year ended 31/12
2016 2015 2014 2013 (01/01/16 - 31/12/16) (01/01/15 - 31/12/15) (01/01/14 - 31/12/14) (01/01/13 - 31/12/13)
16,300.97 14,295.64 12,887.67 14,632.117,674.13 6,705.94 10,107.33 9,208.753,936.04 5,763.49 6,859.70 6,987.80
36,667.91 37,043.59 44,739.71 49,793.0346,000.91 42,588.13 43,883.06 47,769.34
249,849.89 236,484.81 227,434.23 236,670.98
10,138.90 8,316.94 2,086.89 4,973.441,993.64 1,322.73 1,232.85 2,309.49
11,817.34 8,778.42 7,779.49 11,408.6841,354.14 37,877.94 33,030.90 40,744.51
110,393.30 124,077.90 115,292.18 110,867.24
151,747.43 161,955.85 148,323.07 151,611.75
5,163.76 3,404.91 3,404.91 3,540.514,937.17 2,581.88 2,581.88 2,717.48
14,479.49 5,058.33 5,058.33 5,058.335.6 - - -
61,969.08 62,747.54 67,668.31 73,922.45- - - 3,958.57
78,875.00 63,206.93 67,774.46 73,556.63
19,227.45 11,322.04 11,336.70 11,502.602016 2015 2014 2013
(01/01/16 - 31/12/16) (01/01/15 - 31/12/15) (01/01/14 - 31/12/14) (01/01/13 - 31/12/13) 79,737.48 84,649.68 102,121.74 102,943.791,174.75 1,757.73 1,533.95 2,485.90
85,092.29 88,168.04 106,461.16 108,338.55
61,050.77 65,330.90 79,272.40 79,859.4812,017.01 13,557.73 14,637.91 15,264.70
74,627.89 80,992.98 94,072.17 95,904.59
16,923.29 13,620.34 19,554.16 19,381.646,458.89 6,445.28 7,165.17 6,947.68
10,464.40 7,175.06 12,388.99 12,433.96
1,677.12 -1,534.25 2,679.63 3,151.00
0.46 -0.59 1.04 1.222016 2015 2014 2013
(01/01/16 - 31/12/16) (01/01/15 - 31/12/15) (01/01/14 - 31/12/14) (01/01/13 - 31/12/13) 4,728.26 9,138.56 6,280.86 1,624.27
-18,373.38 -10,922.16 -4,146.67 -2,604.8215,610.92 3,138.10 -3,698.18 -6,592.74
1,965.79 1,354.50 -1,563.99 -7,573.29
2016 2015 2014 0.89 0.98 1.352.36 -2.34 3.794.3 3.09 5.34
1.92 2.56 2.190.35 0.38 0.46
23.44 22.82 22.3712.3 8.14 11.641.97 -1.74 2.52
2016 2015 2014 -5.8 -17.11 -0.8
-6.55 -17.59 -0.74-3.49 -17.18 -1.73-7.86 -13.9 -1.91
N/A N/A -14.96
2016 2015 2014 11.09 10.07 10.5732.91 36.25 34.5212.59 10.35 11.4528.99 35.26 31.8836.82 51.13 44.769.91 7.14 8.16
51.99 64.37 58.24
Remark:
CA Type Changed paid up share Paid up share ParXR 1,290,939,275 3,872,817,825 1
Price (B.) 52 week High/Low Paid-up (MB.) Market Cap (MB.) EV (MB.) EBITDA (MB.) EV/EBITDA
BANPUResources / Energy & UtilitiesSET50
BANPU PUBLIC COMPANY LIMITED
24.16
News 3 Yr PerformanceSubject
Additional acquisition in shale gas tenementsRevised the no.of new shares to be reserved for the exercise right to purchase new ordinary shares of BANPU-W3(revised on PDF)
19.4 21.00 / 11.50 5,060.63 98,176.30 252,850.22 16,923.29
Company Profile
Address THANAPOOM TOWER BLDG., FLOOR 25-28, 1550 NEW PETCHABURI ROAD, MAKKASAN, RATCHATHEWI Bangkok
Telephone 0-2694-6600
Announcement of 2017 Annual General Shareholders' MeetingResult from third exercise of warrant BANPU-W3 and increase in paid-in capitalNew shares of BANPU to be traded on March 9, 2017
Annual Report 2015
Establish DateIPO Price (Baht) @ Par 10.00 Baht
Fax 0-2207-0696
URL http://www.banpu.com
Business TypeThe principal business of the Company are: 1) Coal-mining business from its venture in Indonesian, China and Australian coal mines, 2) Power business; producing and
IPO Financial Advisory N/ALast Par Change Old 10.00 : New 1.00 @ 26/09/2013
% / ShareholdersForeign ShareholdersNVDR Shareholders
Free Float 28/03/2016 06/03/15
Top 10 Major Shareholders (@ 10/03/2017) Price Performance (Adjusted Price)
บรษัิท ไทยเอ็นวดีอีำร ์จ ำกัด 5 Days
บรษัิท น ้ำตำลมติรผล จ ำกัด 1 Month
บรษัิท ทเีอ็มอ ีแคปิตอล จ ำกัด 3 Months
นำย อสิระ วอ่งกศุลกจิ
UBS AG SINGAPORE BRANCH Turnover Ratio (%)
CHASE NOMINEES LIMITEDHSBC (SINGAPORE) NOMINEES PTE LTD Accumulated: Turnover Ratio, Value Trade/Day
6 Months
กองทนุเปิด บวัหลวงหุน้ระยะยำว YTD
นำย กมล วอ่งกศุลกจิ P/E (X)
ส ำนักงำนประกันสงัคม P/BV (X)
Mrs. SOMRUEDEE CHAIMONGKOL CHIEF EXECUTIVE OFFICER / DIRECTOR Par Value (B.)Mr. RUTT PHANIJPHAND VICE CHAIRMAN / INDEPENDENT DIRECTOR / AUDIT Market Cap (MB.)
StatisticsManagement Position
Mr. CHANIN VONGKUSOLKIT CHAIRMAN OF THE BOARD Listed share (M.)
Mr. VERAJET VONGKUSOLKIT DIRECTOR P/BV (X)Mr. RAWI CORSIRI DIRECTOR P/E (X)
MR. METEE AUAPINYAKUL DIRECTOR Price (B./share)Mr. ONGART AUAPINYAKUL DIRECTOR BVPS (B./Share)
Mr. TEERANA BHONGMAKAPAT INDEPENDENT DIRECTOR / CHAIRMAN OF THE AUDIT Mr. SUTHAD SETBOONSARNG INDEPENDENT DIRECTOR / AUDIT COMMITTEE Rate of Return
Mr. BUNTOENG VONGKUSOLKIT DIRECTOR Turnover Ratio (%)Mr. ANON SIRISAENGTAKSIN DIRECTOR Value Trade/Day (MB.)
Dividend Policy At least 50% of net profit after tax and legal reserve (with additional conditions)
Dividend (Last 3 Year)
Mr. SUDIARSO PRASETIO INDEPENDENT DIRECTOR Price Change (%)Dividend Yield (%)Payout Ratio
01/01/2015 - 31/12/2014
-
Operation Period
01/01/2016 - 01/07/2015 -
Financial Data
Statement of Financial Position (MB.)
CashA/R NetInventories
31/12/2013
MISS SUKHUMAPORN WONG-ARIYAPORN / PRICEWATERHOUSE COOPERS ABAS MS. AMORNRAT PEARMPOONVATANASUK / PRICEWATERHOUSE COOPERS ABAS MR. VICHIEN KHINGMONTRI / PRICEWATERHOUSE COOPERS ABAS LIMITED
Current LiabilitiesNon-Current Liabilities
Total Liabilities
Authorized CapitalPaid-Up CapitalPremium (Discount) on Share Capital
Current AssetsPP&E Net
Total Assets
ODA/P NetCurrent portion of LT
SalesOther Income
Total Revenues
COGsSG&A
Total Expenses
Other Surplus (Deficit)Retained Earnings (Deficit)Treasury Stock
Shareholders' Equity
Minority InterestStatement of Comprehensive Income
(MB.)
Operating Cash FlowInvesting Cash FlowFinancing Cash Flow
Net Cash FlowAnnualized: ROE, ROA
Ratios
EBITDADepre. & Amor.EBIT
Net Profit
EPS (B.)Statement of Cash Flow (MB.)
EBIT Margin (%)Net Profit Margin (%)
Growth Rate (%)Sales Growth
Current Ratio (X)ROE (%)ROA (%)D/E (X)Total Asset Turnover (X)Gross Profit Margin (%)
Cash CycleA/R Turnover (Times)Avg. Collection Period (Days)Inventory Turnover (Times)Avg. Inventory Period (Days)A/P Turnover (Times)
COGs GrowthTotal Revenue GrowthTotal Expense GrowthNet Profit Growth
Annualized
Avg. Payment Period (Days)Cash Cycle (Days)
Presented and calculated from the consolidated statement and displayed as cumulative quarterly statement by fiscal year (Company
statement will be presented and calculated incase consolidated statement is not available.)
Information on the financial statements is presented according to the information that the listed companies submit on that period. The
investors should study additional information from the companies' financial statements since some companies may restate the comparing
financial statements on the latest financial statements.Information only PP, PO, XR and XD
31/05/2016
Trading Sign Posted Date Lifted DateTrading Sign (Latest)
Only Preferred Share and WarrantsCapital Movement (Last 3 Year) Other Securities
Date Securities Name BANPU-W3
Source: SETSMART (Copyright © The Stock Exchange of Thailand)
No Information FoundMarket Alert (Latest)
No Information Found

XD 20/04/2017CG Report: 4
P/E (X) P/BV (X)10.98 0.92
Date/Time
24/03/2017 17:3821/03/2017 18:4520/03/2017 17:1210/03/17 18:2623/02/2017 22:05
01/12/44 Listed Date 25/04/1975
97.24% 42,359 97.47% 39,73825.00% @ 24/03/2017 Foreign Limit 25.00%32.31% @ 24/03/2017
Share %
Compare to Stock
(%)
Compare to Sector
(%)
Compare to Market
(%)
1 618,447,762 32.4 -1.08 -1.12 -1.87
2 98,277,967 5.15 3.68 0.89 3.09
3 70,085,787 3.67 15.82 4.19 11.15
4 47,851,700 2.51 9.58 1.67 3.97
5 44,489,311 2.33 14.73 5.79 12.5
6 34,097,030 1.79 10.98 11.3 17.36
7 33,857,170 1.77 0.92 1.27 1.93
8 30,843,385 1.62 0.16 0.12 0.29
9 28,921,324 1.5210 25,794,629 1.35
YTD 2016 2015 24/03/2017 30/12/2016 30/12/2015
1 1,908.84 1,908.84 1,908.842 10 10 103 349,318.25 304,460.44 291,098.544 183 159.5 152.55 198.56 194.3 1866 0.92 0.82 0.827 10.98 9.75 8.268 14.63 87.08 76.979 871.25 1,108.64 1,063.04
10 1.13 1.14 0.671112 YTD 2016 2015 13 14.73 4.59 -21.3914 3.55 4.08 4.2615 0.39 0.4 0.351617
Dividend/Share Unit Payment Date Type
2 Baht 23/09/2016 Cash4.5 Baht 11/05/16 Cash
2 Baht 25/09/2015 Cash4.5 Baht 08/05/15 Cash
2 Baht 26/09/2014 Cash4.5 Baht 09/05/14 Cash
Auditor(Effective Until 31/12/2017)
Latest Type of Report Unqualified opinion
2016 2015 2014 2013 (01/01/16 - 31/12/16) (01/01/15 - 31/12/15) (01/01/14 - 31/12/14) (01/01/13 - 31/12/13)
66,338.32 61,431.62 59,898.60 53,550.47- - 532,205.09 407,632.07
547,941.28 520,805.25 383,210.44 378,322.941,826,227.45 1,768,995.23 1,694,540.59 1,664,655.701,941,586.29 1,869,539.54 1,782,848.51 1,753,344.02
116,808.55 101,775.09 89,411.51 89,697.1712,262.49 13,579.26 16,515.65 18,900.9445,230.55 46,108.06 31,454.59 32,275.10
2,944,229.79 2,835,852.16 2,759,890.14 2,596,507.24
2,178,140.78 2,090,964.66 2,058,778.93 1,935,272.48137,815.21 138,402.56 140,844.78 140,147.25
- - - -
2,564,984.91 2,473,821.14 2,436,246.55 2,300,455.55
40,000.00 40,000.00 40,000.00 40,000.0019,088.43 19,088.43 19,088.43 19,088.43
- - - -19,088.43 19,088.43 19,088.43 19,088.4356,346.23 56,346.23 56,346.23 56,346.23
- - - -248,341.53 227,473.95 204,919.54 180,664.06
- - - -
379,015.57 361,832.37 323,491.28 295,935.87
229.31 198.66 152.3 115.822016 2015 2014 2013
(01/01/16 - 31/12/16) (01/01/15 - 31/12/15) (01/01/14 - 31/12/14) (01/01/13 - 31/12/13) 102,443.09 103,813.98 103,479.71 100,405.00
- - - -38,445.33 46,303.60 44,482.60 44,526.16
- - - -63,997.76 57,510.38 58,997.11 55,878.83
- - - -- - - -
5,540.30 7,345.73 6,324.41 5,893.5232,936.18 32,082.33 29,160.73 28,392.70
- - - -- - - -
50,505.17 45,044.93 43,086.90 37,947.0825,247.25 24,227.18 22,254.08 20,820.869,908.83 9,457.90 9,761.81 8,913.358,444.08 8,011.75 7,434.51 7,154.02
- - - -- - - -
39,624.40 43,029.96 45,083.86 44,917.17
31,814.85 34,180.63 36,332.18 35,905.57
16.67 17.91 19.03 18.812016 2015 2014 2013
(01/01/16 - 31/12/16) (01/01/15 - 31/12/15) (01/01/14 - 31/12/14) (01/01/13 - 31/12/13) 1,762.34 146,211.35 -18,047.72 -37,004.77
15,314.09 -116,874.09 36,443.38 27,670.01-12,273.43 -26,861.85 -12,610.82 18,502.65
4,803.00 2,475.42 5,784.84 9,167.89
2016 2015 2014 8.59 9.98 11.731.37 1.54 1.68
22.58 23.86 26.14
2016 2015 2014 N/A N/A N/AN/A N/A N/A
-6.92 -5.92 1.19Remark:
CA Type Changed paid up share Paid up share Par
Market Alert (Latest)No Information Found
Source: SETSMART (Copyright © The Stock Exchange of Thailand)
Trading Sign Posted Date Lifted DateNo Information Found
Trading Sign (Latest)
Information on the financial statements is presented according to the information that the listed companies submit on that period. The
investors should study additional information from the companies' financial statements since some companies may restate the comparing
financial statements on the latest financial statements.Information only PP, PO, XR and XD Only Preferred Share and Warrants
Capital Movement (Last 3 Year) Other Securities
Date Securities Name -
No Information Found
Growth Rate (%)Loan GrowthDeposit GrowthNet Profit Growth
Presented and calculated from the consolidated statement and displayed as cumulative quarterly statement by fiscal year (Company
Annualized: ROE, ROA
RatiosROE (%)ROA (%)Net Profit Margin (%)
EPS (B.)Statement of Cash Flow (MB.)
Operating Cash FlowInvesting Cash FlowFinancing Cash Flow
Net Cash Flow
- Premises & Equip Expenses- Fees & Service Expenses- Loss on Investments- Loss on ExchangeNet Income before Tax
Net Profit
Non-Interest IncomeFees & Service IncomeGain on InvestmentsGain on ExchangeNon-Interest Expenses- Personnel Expenses
- LoansInterest Expense- DepositsNet Interest & Div IncomeBad Debt & Doubtful Acct.Loss on Debt Restructuring
Retained Earnings (Deficit)Treasury Stock
Shareholders' Equity
Minority InterestStatement of Comprehensive Income (MB.)
Interest & Div. Income
Authorized CapitalPaid-Up Capital- Preferred Shares- Ordinary SharesPremium (Discount) On Share CapitalOther Surplus (Deficit)
PP&E Net
Total Assets
DepositsBorrowings- ST-Borrowing
Total Liabilities
Interbank & Money Mkt.Investment NetNet Loans and Accured Int.- Loans & Receivables- Allowance for Doubtful AcctAssets Forclosed-Net
MR. CHAVALA TIENPASERTKIJ / DELOITTE TOUCHE TOHMATSU JAIYOS MR. SUPHAMIT TECHAMONTRIKUL / DELOITTE TOUCHE TOHMATSU JAIYOS
Financial Data
Statement of Financial Position (MB.)
Cash
-31/12/2013
MRS. NISAKORN SONGMANEE / DELOITTE TOUCHE TOHMATSU JAIYOS AUDIT
CO., LTD.
F/S Year ended 31/12
--
31/12/2014
Dividend (Last 3 Year)Operation
Period
-
M.C. MONGKOLCHALEAM YUGALA INDEPENDENT DIRECTOR / AUDIT COMMITTEE Dividend Policy Pays when company has profit (with additional conditions)Mr. ARUN CHIRACHAVALA INDEPENDENT DIRECTOR / AUDIT COMMITTEE
Mrs. GASINEE WITOONCHART INDEPENDENT DIRECTOR / AUDIT COMMITTEE Dividend Yield (%)Mr. KOVIT POSHYANANDA INDEPENDENT DIRECTOR Payout Ratio
ADM. PRACHET SIRIDEJ INDEPENDENT DIRECTOR / CHAIRMAN OF THE AUDIT Rate of ReturnMr. PHORNTHEP PHORNPRAPHA INDEPENDENT DIRECTOR Price Change (%)
Mr. CHANSAK FUANGFU DIRECTOR BetaMr. PAILIN CHUCHOTTAWORN DIRECTOR
Mr. SINGH TANGTASWAS DIRECTOR Turnover Ratio (%)Mr. THAWEELAP RITTAPIROM DIRECTOR Value Trade/Day (MB.)
Mr. AMORN CHANDARASOMBOON DIRECTOR P/BV (X)Mr. SUVARN THANSATHIT DIRECTOR P/E (X)
Mr. DEJA TULANANDA DIRECTOR Price (B./share)Mr. PITI SITHI-AMNUAI DIRECTOR BVPS (B./Share)
Mr. CHARTSIRI SOPHONPANICH PRESIDENT / DIRECTOR Par Value (B.)Mr. CHARN SOPHONPANICH DIRECTOR Market Cap (MB.)
StatisticsManagement Position
Mr. CHATRI SOPHONPANICH CHAIRMAN OF THE BOARD OF DIRECTORS Listed share (M.)
THE BANK OF NEW YORK (NOMINEES) LIMITED Turnover Ratio (%)
STATE STREET BANK AND TRUST COMPANYMORGAN STANLEY & CO. INTERNATIONAL PLC Accumulated: Turnover Ratio, Value Trade/Day
6 Months
STATE STREET BANK EUROPE LIMITED YTD
บรษัิท กรุงเทพประกันภัย จ ำกัด (มหำชน) P/E (X)
UOB KAY HIAN (HONG KONG) LIMITED - Client Account P/BV (X)
Top 10 Major Shareholders (@ 10/03/2017)
Price Performance (Adjusted
Price)
บรษัิท ไทยเอ็นวดีอีำร ์จ ำกัด 5 Days
บรษัิท ศนูยรั์บฝำกหลักทรัพย ์(ประเทศไทย) จ ำกัด เพือ่ผูฝ้ำก 1 Month
CHASE NOMINEES LIMITED 3 Months
ส ำนักงำนประกันสงัคม
% / ShareholdersForeign ShareholdersNVDR Shareholders
The Bank provides full commercial banking services in corporate SME including retail customer with nationwide network. The Bank's overseas branch network spans
Free Float 11/03/16 13/03/2015
Last Par Change Old 100.00 : New 10.00 @ 29/05/1992
Business Type
IPO Financial Advisory N/APar 10.00 Baht
Annual Report 2016Establish DateIPO Price (Baht) N/A
Fax 0-2231-4890URL http://www.bangkokbank.com
Company ProfileAddress 333 SILOM ROAD, BANG RAK Bangkok 10500Telephone 0-2231-4333
C.B.1.1 As of 28 February 2017Publication of Notice of the Annual Ordinary Meeting of ShareholdersFinancial Statement Yearly 2016 (Audited)
News 3 Yr PerformanceSubject
Appointment of Vice Chairman of the Board of Directors and Chairman of the Board of Executive DirectorsInvestment of common shares in BSS Holdings Company Limited
Price (B.) 52 week High/Low Paid-up (MB.) Market Cap (MB.)
183 186.00 / 151.00 19,088.43 349,318.25
BBLFinancials / BankingSET50/SETHD
BANGKOK BANK PUBLIC COMPANY LIMITED

XD 07/04/17
CG Report: 5
P/E (X) P/BV (X)11.38 1.42
Date/Time
21/03/2017 17:06
02/03/17 12:52
23/02/2017 17:10
23/02/2017 17:10
23/02/2017 17:09
08/06/45 Listed Date 09/02/76
320
66.02% 56,365 78.45% 42,558
48.98% @ 24/03/2017 Foreign Limit 48.98%
25.45% @ 24/03/2017
Share %
Compare to Stock
(%)
Compare to Sector
(%)
Compare to Market
(%)
1 621,345,496 25.96 -1.04 -1.08 -1.82
2 254,786,950 10.65 0.79 -1.93 0.22
3 179,361,404 7.49 10.4 -0.69 5.95
4 138,449,415 5.78 1.87 -5.49 -3.35
5 45,814,823 1.91 7.61 -0.79 5.52
6 41,594,481 1.74 11.38 11.3 17.36
7 40,163,900 1.68 1.42 1.27 1.93
8 37,473,000 1.57 0.19 0.12 0.29
9 31,522,550 1.32
10 21,663,752 0.91
YTD 2016 2015
24/03/2017 30/12/2016 30/12/2015
1 2,393.26 2,393.26 2,393.26
2 10 10 10
3 457,112.70 424,803.68 360,185.66
4 191 177.5 150.5
5 134.44 129.77 117.36
6 1.42 1.37 1.28
7 11.38 12 8.19
8 19.26 126.22 101.47
9 1,539.10 2,167.90 1,923.69
10 1.2 1.26 1.17
11
12 YTD 2016 2015
13 7.61 17.94 -34.28
14 2.09 2.25 2.66
15 0.24 0.27 0.22
16
17
18Dividend/Share Unit Payment Date Type
0.5 Baht 23/09/2016 Cash
3.5 Baht 27/04/2016 Cash
0.5 Baht 25/09/2015 Cash
3.5 Baht 30/04/2015 Cash
0.5 Baht 26/09/2014 Cash
3 Baht 30/04/2014 Cash
Auditor
(Effective Until
31/12/2017)
Latest Type of Report Unqualified opinion
2016 2015 2014 2013
(01/01/16 - 31/12/16) (01/01/15 - 31/12/15) (01/01/14 - 31/12/14) (01/01/13 - 31/12/13)
60,588.80 56,226.23 58,005.65 40,609.92
349,206.52 308,744.50 135,518.41 203,282.32
650,378.89 477,862.40 567,706.07 496,931.81
1,615,860.52 1,548,657.96 1,479,113.16 1,396,806.62
1,707,234.70 1,619,526.59 1,537,027.49 1,448,311.37
82,418.06 60,901.54 47,434.10 39,864.33
15,443.88 14,196.58 11,788.38 10,854.69
49,727.87 45,284.43 44,608.69 40,838.58
2,845,867.58 2,555,305.37 2,389,136.59 2,290,045.29
1,794,835.10 1,705,379.02 1,629,831.11 1,529,835.08
96,375.83 85,577.77 87,313.76 71,517.58
- - - -
2,491,955.98 2,243,092.42 2,108,450.74 2,053,037.87
30,486.15 30,486.15 30,486.15 30,486.15
23,932.60 23,932.60 23,932.60 23,932.60
- - - -
23,932.60 23,932.60 23,932.60 23,932.60
18,103.11 18,103.11 18,103.11 18,103.11
- - - -
259,924.04 228,920.85 199,200.42 163,018.83
- - - -
321,746.11 285,799.72 257,059.24 219,232.30
32,165.48 26,413.23 23,626.62 17,775.11
2016 2015 2014 2013
(01/01/16 - 31/12/16) (01/01/15 - 31/12/15) (01/01/14 - 31/12/14) (01/01/13 - 31/12/13)
115,872.88 114,353.84 113,578.39 106,225.54
- - - -
26,195.09 29,341.41 30,446.14 33,428.40
- - - -
89,677.79 85,012.43 83,132.25 72,797.14
- - - -
- - - -
14,335.19 15,214.71 14,179.08 11,691.20
48,631.26 46,412.95 42,690.36 37,246.07
- - - -
- - - -
63,854.38 66,656.15 61,419.01 52,902.84
30,201.49 28,928.69 28,124.47 23,233.60
12,433.82 13,234.83 12,213.23 10,664.98
9,687.94 8,886.90 8,746.41 7,803.04
- - - -
- - - -
55,795.69 54,481.69 62,993.76 56,303.50
40,174.10 39,473.64 46,153.41 41,324.81
16.79 16.49 19.28 17.27
2016 2015 2014 2013
(01/01/16 - 31/12/16) (01/01/15 - 31/12/15) (01/01/14 - 31/12/14) (01/01/13 - 31/12/13)
171,419.92 -56,530.31 68,566.99 146,246.58
-171,972.65 71,772.51 -66,851.90 -115,650.59
4,912.88 -17,023.20 15,678.19 -25,113.13
4,360.15 -1,781.00 17,393.28 5,482.85
2016 2015 2014
13.23 14.54 19.38
2.07 2.2 2.69
22.46 22.43 27.08
2016 2015 2014
N/A N/A N/A
N/A N/A N/A
1.77 -14.47 11.68Remark:
CA Type Changed paid up share Paid up share Par
Market Alert (Latest)
No Information Found
Source: SETSMART (Copyright © The Stock Exchange of Thailand)
Trading Sign Posted Date Lifted Date
No Information Found
Trading Sign (Latest)
Information on the financial statements is presented according to the information that the listed companies submit on that period. The
investors should study additional information from the companies' financial statements since some companies may restate the
comparing financial statements on the latest financial statements.
Information only PP, PO, XR and XD Only Preferred Share and Warrants
Capital Movement (Last 3 Year) Other Securities
Date Securities Name -
No Information Found
Growth Rate (%)
Loan Growth
Deposit Growth
Net Profit GrowthPresented and calculated from the consolidated statement and displayed as cumulative quarterly statement by fiscal year (Company
Annualized: ROE, ROA
Ratios
ROE (%)
ROA (%)
Net Profit Margin (%)
EPS (B.)
Statement of Cash Flow (MB.)
Operating Cash Flow
Investing Cash Flow
Financing Cash Flow
Net Cash Flow
- Premises & Equip Expenses
- Fees & Service Expenses
- Loss on Investments
- Loss on Exchange
Net Income before Tax
Net Profit
Non-Interest Income
Fees & Service Income
Gain on Investments
Gain on Exchange
Non-Interest Expenses
- Personnel Expenses
- Loans
Interest Expense
- Deposits
Net Interest & Div Income
Bad Debt & Doubtful Acct.
Loss on Debt Restructuring
Retained Earnings (Deficit)
Treasury Stock
Shareholders' Equity
Minority Interest
Statement of Comprehensive Income (MB.)
Interest & Div. Income
Authorized Capital
Paid-Up Capital
- Preferred Shares
- Ordinary Shares
Premium (Discount) On Share Capital
Other Surplus (Deficit)
PP&E Net
Total Assets
Deposits
Borrowings
- ST-Borrowing
Total Liabilities
Interbank & Money Mkt.
Investment Net
Net Loans and Accured Int.
- Loans & Receivables
- Allowance for Doubtful Acct
Assets Forclosed-Net
MR. CHAROEN PHOSAMRITLERT / KPMG PHOOMCHAI AUDIT LIMITED
MRS. WILAI BURANAKITTISOPON / KPMG PHOOMCHAI AUDIT LIMITED
Financial Data
Statement of Financial Position (MB.)
Cash
-
01/07/2013 - 31/12/2013
MR. CHANCHAI SAKULKOEDSIN / KPMG PHOOMCHAI AUDIT LIMITED F/S Year ended 31/12
-
-
31/12/2014
Mrs. SUPHAJEE SUTHUMPUN INDEPENDENT DIRECTOR / AUDIT COMMITTEE Dividend (Last 3 Year)Operation Period
-
Mr. WIBOON KHUSAKUL INDEPENDENT DIRECTOR Dividend Policy Depends upon company's performance and long-term returns to shareholders (with additional conditions)
Mr. YONGYUTH YUTHAVONG INDEPENDENT DIRECTOR
Mr. KALIN SARASIN INDEPENDENT DIRECTOR Dividend Yield (%)
Mrs. PUNTIP SURATHIN INDEPENDENT DIRECTOR / AUDIT COMMITTEE Payout Ratio
Mr. SARAVOOT YOOVIDHYA INDEPENDENT DIRECTOR / AUDIT COMMITTEE Rate of Return
Mr. PIYASVASTI AMRANAND INDEPENDENT DIRECTOR / CHAIRMAN OF THE AUDIT Price Change (%)
Mr. PAIRASH THAJCHAYAPONG INDEPENDENT DIRECTOR Beta
Sqn.Ldr. NALINEE PAIBOON INDEPENDENT DIRECTOR
Mr. ABHIJAI CHANDRASEN DIRECTOR Turnover Ratio (%)
Mr. SARA LAMSAM DIRECTOR Value Trade/Day (MB.)
Miss KATTIYA INDARAVIJAYA PRESIDENT / DIRECTOR P/BV (X)
Mr. PIPIT ANEAKNITHI PRESIDENT / DIRECTOR P/E (X)
Mr. PREDEE DAOCHAI PRESIDENT / DIRECTOR Price (B./share)
Mr. TEERANUN SRIHONG PRESIDENT / DIRECTOR BVPS (B./Share)
Khunying SUCHADA KIRANANDANA VICE CHAIRPERSON OF THE BOARD OF DIRECTOR / Par Value (B.)
Mrs. SUJITPAN LAMSAM VICE CHAIRPERSON OF THE BOARD OF DIRECTOR Market Cap (MB.)
StatisticsManagement Position
Mr. BANTHOON LAMSAM CHAIRMAN OF THE BOARD OF DIRECTORS / CHIEF Listed share (M.)
LITTLEDOWN NOMINEES LIMITED Turnover Ratio (%)
THE BANK OF NEW YORK MELLON
NORBAX, INC. Accumulated: Turnover Ratio, Value Trade/Day
6 Months
NORTRUST NOMINEES LIMITED-NT0 SEC LENDING THAILAND CL AC YTD
GIC PRIVATE LIMITED P/E (X)
ส ำนักงำนประกนัสังคม P/BV (X)
Top 10 Major Shareholders (@ 10/03/2017) Price Performance (Adjusted Price)
บรษัิท ไทยเอ็นวดีอีำร ์จ ำกดั 5 Days
STATE STREET BANK EUROPE LIMITED 1 Month
CHASE NOMINEES LIMITED 3 Months
STATE STREET BANK AND TRUST COMPANY
% / Shareholders
Foreign Shareholders
NVDR Shareholders
KASIKORNBANK PCL. (KBank) conducts commercial banking, securities and other related businesses per the Financial Institutions Business Act, Securities and Exchange
Free Float 11/03/16 13/03/2015
Last Par Change Old 100.00 : New 10.00 @ 26/05/1993
Business Type
IPO Financial Advisory N/A
Par 10.00 Baht
Annual Report 2016
Establish Date
IPO Price (Baht) @ Par 100.00 Baht
Fax 0-2470-1144
URL http://www.kasikornbank.com
Company Profile
Address 1 Soi Ratburana 27/1 Ratburana Road, Bangkok 10140
Telephone 0-2222-0000, 0-2888-8888
Submittal of Management Discussion and Analysis (MD&A) Report for the year ended 31 December 2016
Management Discussion and Analysis Yearly Ending 31 Dec 2016
Submittal of the audited Financial Statements for the year ended 31 December 2016
News 3 Yr Performance
Subject
Summary Statement of Assets and Liabilities as of 28 February 2017
Notice of the General Meeting of Shareholders No.105 on Website
Price (B.) 52 week High/Low Paid-up (MB.) Market Cap (MB.)
191 203.00 / 154.00 23,932.60 457,112.70
KBANK
Financials / Banking
SET50
KASIKORNBANK PUBLIC COMPANY LIMITED

CG Report: 4
P/E (X) P/BV (X)13.49 3.45
Date/Time
08/03/17 12:3616/02/2017 17:1015/02/2017 19:5115/02/2017 19:0815/02/2017 18:01
15/6/1979 Listed Date 01/03/9165
36.10% 12,279 36.14% 3,05036.85% @ 17/03/2017 Foreign Limit 39.00%5.93% @ 17/03/2017
Share %
Compare to Stock
(%)
Compare to Sector
(%)
Compare to Market
(%)
1 490,731,040 31.58 0.93 -1.18 -0.43
2 369,881,660 23.8 8 5.15 9.17
3 89,043,265 5.73 52.54 37.83 48.78
4 28,600,000 1.84 31.71 27.14 24.8
5 17,000,000 1.09 42.11 31.51 40.46
6 15,400,000 0.99 13.49 13.47 17.21
7 14,040,700 0.9 3.45 2.47 1.91
8 13,000,000 0.84 0.88 0.28 0.41
9 10,680,000 0.6910 10,500,000 0.68
YTD 2016 2015 17/03/2017 30/12/2016 30/12/2015
1 1,553.91 1,553.00 1,543.852 1 1 13 41,955.50 29,506.96 62,525.934 27 19 40.55 7.83 7.14 6.136 3.45 2.66 6.617 13.49 8.68 14.168 93.86 285.29 470.719 676.6 449.9 538.22
1011 YTD 2016 2015 12 42.11 -53.09 523.0813 3.33 4.71 0.4914 0.45 0.41 0.0715
Dividend/Shar
e Unit Payment Date Type
0.6 Baht 28/04/2017 Cash0.3 Baht 02/09/16 Cash0.4 Baht 29/04/2016 Cash0.2 Baht 09/12/15 Cash0.3 Baht 10/09/15 Cash
1 Baht 29/04/2015 Cash1 Baht 15/12/2014 Cash
Auditor F/S Year ended 31/12
2016 2015 2014 2013 (01/01/16 - 31/12/16) (01/01/15 - 31/12/15) (01/01/14 - 31/12/14) (01/01/13 - 31/12/13)
1,333.23 1,353.52 276.99 495.443,491.35 3,271.78 4,017.94 3,966.573,769.64 2,402.52 3,817.83 9,349.429,360.93 8,807.23 8,409.47 14,218.598,690.38 7,075.70 5,652.54 5,246.62
19,502.62 16,869.30 15,145.12 20,273.52
1,468.29 36.09 4,094.13 9,416.464,053.19 2,253.63 1,314.38 1,611.82
378.5 439.37 788.02 695.836,311.66 4,118.89 6,683.43 12,094.41
925.89 2,185.93 2,336.67 2,288.17
7,237.55 6,304.82 9,020.10 14,382.58
1,579.34 1,578.74 1,721.23 1,710.601,553.00 1,543.85 1,532.78 1,525.811,008.95 969.63 916.25 887.82
- - - -10,045.86 8,016.09 3,883.88 2,844.18
- - - -
12,154.44 10,328.87 5,955.32 5,241.71
110.63 235.62 169.7 649.232016 2015 2014 2013
(01/01/16 - 31/12/16) (01/01/15 - 31/12/15) (01/01/14 - 31/12/14) (01/01/13 - 31/12/13) 24,037.77 37,136.77 45,727.31 33,934.92
256.98 355.53 472.91 159.25
24,392.47 37,580.11 46,249.06 34,140.37
19,348.23 29,632.81 43,722.79 32,194.941,304.85 1,145.08 797.29 785.33
20,500.05 31,044.03 44,693.77 32,962.36
4,718.65 7,111.81 2,048.85 1,612.38826.22 575.73 493.56 434.36
3,892.43 6,536.08 1,555.30 1,178.02
3,110.13 5,078.76 1,200.43 831.45
2.01 3.3 7.85 5.452016 2015 2014 2013
(01/01/16 - 31/12/16) (01/01/15 - 31/12/15) (01/01/14 - 31/12/14) (01/01/13 - 31/12/13) 4,835.26 8,359.31 6,763.71 -78.13
-2,738.94 -1,602.34 -814.08 -788.61-2,146.43 -5,623.15 -6,092.17 621.76
-50.11 1,133.82 -142.54 -244.98
2016 2015 2014 1.48 2.14 1.26
27.67 62.38 21.4421.4 40.83 8.780.6 0.61 1.51
1.34 2.35 2.6119.51 20.21 4.3815.96 17.39 3.3612.75 13.51 2.6
2016 2015 2014 -35.27 -18.79 34.75-34.71 -32.23 35.81-35.09 -18.74 35.47-33.96 -30.54 35.59-38.76 323.08 44.38
2016 2015 2014 7.11 10.19 11.45
51.35 35.82 31.876.27 9.53 6.64
58.22 38.31 54.966.14 16.61 29.88
59.49 21.97 12.2150.08 52.16 74.61
Remark:
CA Type Changed paid up share Paid up share Par
Price (B.) 52 week High/Low Paid-up (MB.) Market Cap (MB.) EV (MB.) EBITDA (MB.) EV/EBITDA
TASCOProperty & Construction / Construction MaterialsSET100/SETHD
TIPCO ASPHALT PUBLIC COMPANY LIMITED
10.17
News 3 Yr PerformanceSubject
Disclosure of Notice of Annual General Meeting of Shareholders No. 1/2017 on the Company's WebsiteResolutions of the BOD No. 2/2017 relating to the AGM No. 1/2017 and dividend (Revised)
27 29.00 / 15.10 1,553.91 41,955.50 47,970.45 4,718.65
Company Profile
Address 118/1 RAMA VI ROAD, SAMSENNAI, PHAYA THAI Bangkok 10400
Telephone 0-2273-6000
Resolutions of the BOD No. 2/2017 relating to the AGM No. 1/2017 and dividendManagement Discussion and Analysis Yearly Ending 31 Dec 2016Audited Yearly and Consolidated F/S (F45-3)
Annual Report 2016
Establish DateIPO Price (Baht) @ Par 10.00 Baht
Fax 0-2273-6030
URL http://www.tipcoasphalt.com
Business TypeThe Company produces and distributes various types of asphalt products for road construction and maintenance, i.e., for highways and runway surfaces. The Company
IPO Financial Advisory PRIME FINANCE & SECURITIES PUBLIC COMPANY LIMITEDLast Par Change Old 10.00 : New 1.00 @ 22/04/2015
% / ShareholdersForeign ShareholdersNVDR Shareholders
Free Float 04/03/16 11/03/15
6 Months
น.ส. รวมสนิ ทรัพยส์ำคร YTD
นำย สทิธลิำภ ทรัพยส์ำคร P/E (X)
นำย กฤษฎิ ์เศรษฐนิ P/BV (X)
Top 10 Major Shareholders (@ 03/03/2017) Price Performance (Adjusted Price)
BNP PARIBAS SECURITIES (ASIA) LTD-FOR COLAS 5 Days
บรษัิท ทปิโกฟ้ดูส ์จ ำกัด (มหำชน) 1 Month
บรษัิท ไทยเอ็นวดีอีำร ์จ ำกัด 3 Months
นำย สมจติต ์เศรษฐนิ
StatisticsManagement Position
Mr. CHAINOI PUANKOSOOM CHAIRMAN OF THE BOARD OF DIRECTORS / Listed share (M.)
น.ส. ลกัษณำ ทรัพยส์ำคร Turnover Ratio (%)
นำย ธวชัชยั เทยีมทันน.ส. ปิยะรัตน ์ทรัพยส์ำคร Accumulated: Turnover Ratio, Value Trade/Day
Mr. CHAIWAT SRIVALWAT MANAGING DIRECTOR / DIRECTOR Price (B./share)Mr. SITILARB SUPSAKORN DIRECTOR BVPS (B./Share)
Mr. KOH BAN HENG VICE CHAIRMAN OF THE BOARD OF DIRECTORS / Par Value (B.)Mr. SOMCHIT SERTTHIN CHIEF EXECUTIVE OFFICER / DIRECTOR Market Cap (MB.)
Mr. JACQUES LEOST DIRECTOR Turnover Ratio (%)Mr. JACQUES MARCEL PASTOR DIRECTOR Value Trade/Day (MB.)
Mr. JACQUES MARECHAL DIRECTOR P/BV (X)Mr. HERVE LE BOUC DIRECTOR P/E (X)
Mr. NOPPORN THEPSITHAR INDEPENDENT DIRECTOR / AUDIT COMMITTEE Price Change (%)MR. PHIRASILP SUBHAPHOLSIRI INDEPENDENT DIRECTOR / CHAIRMAN OF THE AUDIT Dividend Yield (%)
Miss LAKSANA SUPSAKORN DIRECTORMr. NIPHON SUTHIMAI INDEPENDENT DIRECTOR Rate of Return
Not less than 60 per cent of the Company's own net profit in each fiscal year. However, the actual dividend payment depends on cash flow, investment plans of the Company (with additional conditions)
Dividend (Last 3 Year)
Operation Period
Mr. PARNCHALERM SUTATAM INDEPENDENT DIRECTOR / AUDIT COMMITTEE Payout RatioMrs. ANNE-MARIE MACHET INDEPENDENT DIRECTOR Dividend Policy
--
01/01/2014 -
01/01/2016 - -
01/01/2015 -
Financial Data
Statement of Financial Position (MB.)
CashA/R NetInventories
-
MISS SUPANNEE TRIYANANTAKUL / E Y OFFICE COMPANY LIMITEDMR. SUPACHAI PHANYAWATTANO / E Y OFFICE COMPANY LIMITEDMISS SIRAPORN OUAANUNKUN / E Y OFFICE COMPANY LIMITED
Current LiabilitiesNon-Current Liabilities
Total Liabilities
Authorized CapitalPaid-Up CapitalPremium (Discount) on Share Capital
Current AssetsPP&E Net
Total Assets
ODA/P NetCurrent portion of LT
SalesOther Income
Total Revenues
COGsSG&A
Total Expenses
Other Surplus (Deficit)Retained Earnings (Deficit)Treasury Stock
Shareholders' Equity
Minority InterestStatement of Comprehensive Income
(MB.)
Operating Cash FlowInvesting Cash FlowFinancing Cash Flow
Net Cash FlowAnnualized: ROE, ROA
Ratios
EBITDADepre. & Amor.EBIT
Net Profit
EPS (B.)Statement of Cash Flow (MB.)
EBIT Margin (%)Net Profit Margin (%)
Growth Rate (%)Sales Growth
Current Ratio (X)ROE (%)ROA (%)D/E (X)Total Asset Turnover (X)Gross Profit Margin (%)
Cash CycleA/R Turnover (Times)Avg. Collection Period (Days)Inventory Turnover (Times)Avg. Inventory Period (Days)A/P Turnover (Times)
COGs GrowthTotal Revenue GrowthTotal Expense GrowthNet Profit Growth
Annualized
Avg. Payment Period (Days)Cash Cycle (Days)
Presented and calculated from the consolidated statement and displayed as cumulative quarterly statement by fiscal year (Company
statement will be presented and calculated incase consolidated statement is not available.)
Information on the financial statements is presented according to the information that the listed companies submit on that period. The
investors should study additional information from the companies' financial statements since some companies may restate the comparing
financial statements on the latest financial statements.Information only PP, PO, XR and XD
No Information Found
Trading Sign Posted Date Lifted DateTrading Sign (Latest)
Only Preferred Share and WarrantsCapital Movement (Last 3 Year) Other Securities
Date Securities Name -
Source: SETSMART (Copyright © The Stock Exchange of Thailand)
No Information FoundMarket Alert (Latest)
No Information Found

CG Report: 5
P/E (X) P/BV (X)28.35 4.49
Date/Time
28/02/2017 17:0828/02/2017 12:3915/02/2017 19:5614/02/2017 12:3614/02/2017 12:36
03/03/79 Listed Date 11/03/0442
29.99% 24,427 29.99% 17,50912.56% @ 24/03/2017 Foreign Limit 30.00%3.88% @ 24/03/2017
Share %
Compare to Stock
(%)
Compare to Sector
(%)
Compare to Market
(%)
1 1,000,000,000 70 2.58 0.78 1.76
2 49,548,504 3.47 2.58 0.71 2
3 27,325,682 1.91 2.45 1.16 -1.69
4 19,053,600 1.33 0.13 2.36 -5
5 18,267,347 1.28 -0.13 0.48 -2.07
6 17,919,700 1.25 28.35 45.73 17.36
7 17,275,900 1.21 4.49 2.52 1.93
8 12,686,607 0.89 0.1 0.31 0.29
9 11,460,000 0.810 9,059,600 0.63
YTD 2016 2015 24/03/2017 30/12/2016 30/12/2015
1 14,285.70 1,428.57 1,428.572 1 10 103 567,856.58 568,570.86 494,285.224 39.75 39.8 34.65 8.85 84.93 76.016 4.49 4.69 4.557 28.35 29.05 26.398 18.29 59.79 57.159 1,738.00 1,357.40 990.42
10 1.08 0.97 1.011112 YTD 2016 2015 13 -0.13 15.03 22.7
1.72 1.72 1.890.49 0.5 0.5
Dividend/Share Unit Payment Date Type
6.83 Baht 09/02/17 Cash5 Baht 04/02/16 Cash
1.54 Baht 18/06/2015 Cash3.4 Baht 05/02/15 Cash
Auditor(Effective Until
30/09/2017)
Latest Type of Report Unqualified opinion with an emphasis of matters
3M/2017 3M/2016 2016 2015 2014 (01/10/16 - 31/12/16) (01/10/15 - 31/12/15) (01/10/15 - 30/09/16) (01/10/14 - 30/09/15) (01/10/13 - 30/09/14)
6,577.04 4,525.15 5,886.26 3,086.20 7,048.833,032.38 3,005.39 2,870.96 2,355.83 2,094.42
232.33 223.44 261.07 237.85 195.4467,676.72 55,537.78 64,157.71 51,924.66 47,355.4590,847.53 94,040.28 91,692.24 95,252.59 81,624.19
172,537.32 161,925.57 172,216.39 159,623.66 153,788.84
30 30 30 20 11.39803.49 592.25 1,370.27 1,150.50 1,443.79
4,349.25 4,197.33 4,766.81 4,207.70 3,959.8316,048.09 14,429.48 18,428.59 15,853.91 18,508.0929,831.08 33,938.47 32,209.24 34,957.61 38,033.35
45,879.17 48,367.95 50,637.84 50,811.52 56,541.44
14,285.70 14,285.70 14,285.70 14,285.70 14,285.7014,285.70 14,285.70 14,285.70 14,285.70 14,285.7012,567.67 12,567.67 12,567.67 12,567.67 12,567.67
- - - - -98,637.01 85,749.61 93,552.79 81,123.60 69,451.50
- - - - -
126,387.25 113,323.16 121,321.87 108,587.57 97,044.25
270.91 234.46 256.68 224.57 203.163M/2017 3M/2016 2016 2015 2014
(01/10/16 - 31/12/16) (01/10/15 - 31/12/15) (01/10/15 - 30/09/16) (01/10/14 - 30/09/15) (01/10/13 - 30/09/14) 12,612.88 11,814.11 50,961.95 43,968.99 37,585.46
572.91 363.02 1,821.39 1,804.38 2,185.27
13,185.79 12,177.13 52,783.34 45,773.37 39,770.73
- - - - -4,350.37 3,713.10 17,791.66 15,267.28 14,265.70
6,449.50 5,951.27 26,982.09 20,833.06 22,665.57
8,165.64 7,806.38 32,205.30 31,128.32 22,755.371,429.35 1,580.52 6,404.05 6,188.02 5,650.226,736.29 6,225.86 25,801.25 24,940.30 17,105.16
5,084.22 4,626.01 19,571.46 18,728.65 12,220.37
3.56 3.24 13.7 13.11 8.553M/2017 3M/2016 2016 2015 2014
(01/10/16 - 31/12/16) (01/10/15 - 31/12/15) (01/10/15 - 30/09/16) (01/10/14 - 30/09/15) (01/10/13 - 30/09/14) 4,063.79 5,195.60 30,325.83 24,905.67 18,940.70
-2,490.33 -2,890.72 -14,722.28 -16,078.72 -5,931.67-882.69 -865.93 -12,803.49 -12,778.21 -12,584.42
690.78 1,438.95 2,800.06 -3,951.25 424.61
3M/2017 3M/2016 2016 2015 4.22 3.85 3.48 3.28
16.71 18.16 17.03 18.2215.73 16.27 15.55 15.920.36 0.43 0.42 0.470.32 0.3 0.32 0.29100 100 100 100
51.09 51.13 48.88 54.4938.56 37.99 37.08 40.92
3M/2017 3M/2016 2016 2015 6.76 12.08 15.9 16.98N/A N/A N/A N/A8.28 9.82 15.31 15.098.37 5.62 29.52 -8.099.91 18.22 4.5 53.26
3M/2017 3M/2016 2016 2015 17.15 16.73 19.5 19.7621.29 21.82 18.72 18.47
- - - -N/A N/A N/A N/A
- - - -N/A N/A N/A N/A
21.29 21.82 18.72 18.47
Remark:
CA Type Changed paid up share Paid up share Par
Source: SETSMART (Copyright © The Stock Exchange of Thailand)
No Information FoundMarket Alert (Latest)
No Information Found
Trading Sign (Latest)
Only Preferred Share and WarrantsCapital Movement (Last 3 Year) Other Securities
Date Securities Name -
Avg. Payment Period (Days)Cash Cycle (Days)
Presented and calculated from the consolidated statement and displayed as cumulative quarterly statement by fiscal year (Company statement will be presented
and calculated incase consolidated statement is not available.)
Information on the financial statements is presented according to the information that the listed companies submit on that period. The investors should study
additional information from the companies' financial statements since some companies may restate the comparing financial statements on the latest financial
statements.Information only PP, PO, XR and XD
No Information Found
Trading Sign Posted Date Lifted Date
Cash CycleA/R Turnover (Times)Avg. Collection Period (Days)Inventory Turnover (Times)Avg. Inventory Period (Days)A/P Turnover (Times)
COGs GrowthTotal Revenue GrowthTotal Expense GrowthNet Profit Growth
Annualized
EBIT Margin (%)Net Profit Margin (%)
Growth Rate (%)Sales Growth
Current Ratio (X)ROE (%)ROA (%)D/E (X)Total Asset Turnover (X)Gross Profit Margin (%)
Operating Cash FlowInvesting Cash FlowFinancing Cash Flow
Net Cash FlowAnnualized: ROE, ROA
Ratios
EBITDADepre. & Amor.EBIT
Net Profit
EPS (B.)Statement of Cash Flow (MB.)
SalesOther Income
Total Revenues
COGsSG&A
Total Expenses
Other Surplus (Deficit)Retained Earnings (Deficit)Treasury Stock
Shareholders' Equity
Minority InterestStatement of Comprehensive Income (MB.)
Current LiabilitiesNon-Current Liabilities
Total Liabilities
Authorized CapitalPaid-Up CapitalPremium (Discount) on Share Capital
Current AssetsPP&E Net
Total Assets
ODA/P NetCurrent portion of LT
Financial Data
Statement of Financial Position (MB.)
CashA/R NetInventories
01/10/2013 - 30/09/2014
OFF. OF THE AUDITOR GENERAL MINISTRY OF FINANCE / OFFICE OF THE AUDITOR GENERAL
MINISTRY OF FINANCE
F/S Year ended 30/9
01/10/2015 - 30/09/201601/10/2014 - 30/09/201501/10/2014 - 31/03/2015
Not less than 25% of net profits after deduction of all specified reserves, subject to the investment plans and other considerations that the board of directors deems appropriate
Dividend (Last 3 Year)Operation Period
Dividend Yield (%)Payout RatioDividend Policy
Mr. MANAS JAMVEHA INDEPENDENT DIRECTOR Rate of ReturnPol.Lt.Gen. MANOO MEKMOK INDEPENDENT DIRECTOR Price Change (%)
Mr. MANIT NITIPRATEEP INDEPENDENT DIRECTOR / AUDIT COMMITTEE BetaMr. SARAWUT BENJAKUL INDEPENDENT DIRECTOR
AM PRAKIT SKUNASINGHA INDEPENDENT DIRECTOR / CHAIRMAN OF THE Turnover Ratio (%)Mrs. RAWEWAN NETRAKAVESNA INDEPENDENT DIRECTOR Value Trade/Day (MB.)
MR. THAWATCHAI ARUNYIK INDEPENDENT DIRECTOR P/BV (X)Mr. WARA TONGPRASIN INDEPENDENT DIRECTOR / AUDIT COMMITTEE P/E (X)
Mr. THANIN PA-EM DIRECTOR Price (B./share)Sqn.Ldr. PRAJAK SAJJASOPHON INDEPENDENT DIRECTOR BVPS (B./Share)
Mr. NITINAI SIRISMATTHAKARN PRESIDENT / DIRECTOR Par Value (B.)Miss SUTTIRAT RATTANACHOT DIRECTOR Market Cap (MB.)
StatisticsManagement Position
Mr. PRASONG POONTANEAT CHAIRMAN OF THE BOARD OF DIRECTORS Listed share (M.)
NORBAX, INC. Turnover Ratio (%)
นำย อัยยวัฒน์ ศรวีัฒนประภำน.ส. วรมำศ ศรวีัฒนประภำ Accumulated: Turnover Ratio, Value Trade/Day
6 Months
CHASE NOMINEES LIMITED YTD
THE BANK OF NEW YORK MELLON P/E (X)
ส ำนักงำนประกนัสังคม P/BV (X)
Top 10 Major Shareholders (@ 14/12/2016) Price Performance (Adjusted Price)
กระทรวงกำรคลัง 5 Days
บรษัิท ไทยเอ็นวดีอีำร ์จ ำกดั 1 Month
STATE STREET BANK EUROPE LIMITED 3 Months
LITTLEDOWN NOMINEES LIMITED
% / ShareholdersForeign ShareholdersNVDR Shareholders
AOT is the operator of airport business in Thailand, the core tasks of which are airport management and development of country's 6 international airports, namely Suvarnabhumi, Don Mueang,
Free Float 14/12/2016 17/12/2015
Last Par Change Old 10.00 : New 1.00 @ 09/02/2017
Business Type
IPO Financial Advisory PHATRA SECURITIES PUBLIC COMPANY LIMITEDPar 1.00 Baht
Annual Report 2016Establish DateIPO Price (Baht) @ Par 10.00 Baht
Fax 0-2531-5559, 0-2535-4061URL http://www.airportthai.co.th
Company ProfileAddress 333 CHERDWUTAGARD ROAD DON MUEANG Bangkok 10210Telephone 0-2535-1111
Additional Information on Financial Statement Q1 Ended 31 Dec 2016Reviewed Quarter 1 and Consolidated F/S (F45-3)Management Discussion and Analysis Quarter 1 Ending 31 Dec 2016
18.65
News 3 Yr PerformanceSubject
Resignation of DirectorElection of Chairman of AOT's Board of Directors
39.75 42.50 / 30.00 14,285.70 567,856.58 607,429.61 8,165.64Price (B.) 52 week High/Low Paid-up (MB.) Market Cap (MB.) EV (MB.) EBITDA (MB.) EV/EBITDA
AOTServices / Transportation & LogisticsSET50
AIRPORTS OF THAILAND PUBLIC COMPANY LIMITED

CG Report: 4
P/E (X) P/BV (X)N/A 1.63
Date/Time
01/03/17 17:5528/02/2017 17:4628/02/2017 17:4428/02/2017 17:4228/02/2017 17:34
13/11/1990 Listed Date 22/12/199355
30.42% 67,767 30.86% 47,93242.00% @ 17/03/2017 Foreign Limit 49.00%6.22% @ 17/03/2017
Share %
Compare to Stock
(%)
Compare to Sector
(%)
Compare to Market
(%)
1 6,917,117,736 28.11 2.4 -0.6 1.02
2 4,429,427,068 18 3.23 3.33 4.34
3 1,782,914,929 7.25 -9.86 -16.68 -12.08
4 1,335,197,471 5.43 -10.49 -13.79 -15.19
5 992,346,186 4.03 -10.49 -17.06 -11.52
6 819,801,797 3.33 N/A 21.93 17.21
7 750,434,341 3.05 1.63 3.01 1.91
8 352,682,862 1.43 0.33 0.4 0.41
9 341,650,187 1.3910 327,073,000 1.33
YTD 2016 2015 17/03/2017 30/12/2016 30/12/2015
1 33,368.20 33,368.20 24,607.932 4 4 43 213,556.45 238,582.60 164,873.124 6.4 7.15 6.65 3.93 3.99 3.026 1.63 1.79 2.227 N/A N/A 27.498 23.25 150.63 124.899 991.35 1,344.56 1,448.19
1011 YTD 2016 2015 12 -10.49 8.32 -39.6413 N/A 0.07 N/A14 N/A N/A N/A15161718 Dividend/Shar
e Unit Payment Date Type
19 200 : 3 Share 04/05/16 Stock0.00667 Baht 04/05/16 Cash
Auditor F/S Year ended 31/12
2016 2015 2014 2013 (01/01/16 - 31/12/16) (01/01/15 - 31/12/15) (01/01/14 - 31/12/14) (01/01/13 - 31/12/13)
50,183.81 10,590.38 6,611.59 14,726.2832,749.15 32,808.15 58,856.58 34,560.9111,251.97 8,294.58 4,294.13 6,069.54
122,678.32 77,860.69 88,066.08 71,078.15143,688.35 98,456.93 75,084.95 72,161.58
448,960.46 282,844.27 234,570.46 205,852.17
37,571.67 29,927.21 2,977.09 3,742.8564,421.77 40,619.90 37,389.55 33,217.0620,653.96 12,602.57 8,872.85 9,894.13
160,843.81 111,800.59 117,649.30 107,347.66156,388.71 95,837.14 45,980.44 93,772.37
317,232.52 207,637.73 163,629.74 201,120.03
133,474.62 98,431.71 246,079.28 153,332.07133,472.78 98,431.71 246,079.28 145,302.1526,384.07 - -110,563.60 -74,638.59-1,809.49 -1,806.54 -1,784.71 -1,778.44
-27,005.06 -22,086.96 -63,389.92 -64,815.20- - - -
131,052.21 74,547.45 70,349.64 4,081.11
675.73 659.08 591.09 651.022016 2015 2014 2013
(01/01/16 - 31/12/16) (01/01/15 - 31/12/15) (01/01/14 - 31/12/14) (01/01/13 - 31/12/13) 124,719.20 118,780.68 109,216.04 96,213.70
1,830.08 2,754.73 2,223.48 8,122.42
131,157.90 122,949.39 117,659.99 104,398.41
95,599.65 90,577.40 84,520.15 77,369.6327,815.71 23,022.26 20,568.65 21,494.22
127,308.91 114,769.03 111,906.07 102,241.58
31,928.75 28,125.36 31,127.87 24,365.8128,079.76 19,945.00 25,373.94 22,208.983,848.99 8,180.36 5,753.92 2,156.83
-2,814.35 4,411.52 1,425.28 -9,062.75
-0.09 0.18 0.07 -0.622016 2015 2014 2013
(01/01/16 - 31/12/16) (01/01/15 - 31/12/15) (01/01/14 - 31/12/14) (01/01/13 - 31/12/13) 8,096.13 3,333.05 -3,643.80 22,677.97
-45,411.98 -49,753.59 -21,436.41 -2,829.3676,965.76 50,353.77 16,978.67 -11,230.10
39,649.91 3,933.22 -8,101.54 8,618.51
2016 2015 2014 0.76 0.7 0.75
-2.74 6.09 3.831.05 3.16 2.612.42 2.79 2.330.36 0.48 0.53
23.35 23.74 22.612.93 6.65 4.89
-2.15 3.59 1.21
2016 2015 2014 5 8.76 13.51
5.54 7.17 9.246.68 4.5 12.7
10.93 2.56 9.45N/A 209.52 N/A
2016 2015 2014 3.8 2.59 2.34
95.93 140.84 156.19.78 14.39 16.31
37.31 25.36 22.381.82 2.32 2.39
200.52 157.18 152.46-67.28 9.02 26.02
Remark:
CA Type Changed paid up share Paid up share ParXR 1,462,100,610 26,439,114,253 4XD 369,085,493 24,977,013,643 4PP 4,429,427,068 24,607,928,150 10XR 5,648,285,816 20,178,501,082 10
Price (B.) 52 week High/Low Paid-up (MB.) Market Cap (MB.) EV (MB.) EBITDA (MB.) EV/EBITDA
TRUETechnology / Information & Communication TechnologySET50
TRUE CORPORATION PUBLIC COMPANY LIMITED
125.04
News 3 Yr PerformanceSubject
Notification of the Dissolution of SubsidiaryManagement Discussion and Analysis Yearly Ending 31 Dec 2016
6.4 9.30 / 5.50 133,472.78 213,556.45 481,280.89 31,928.75
Company Profile
Address TRUE TOWER, 18 RATCHADAPHISEK ROAD, HUAI KHWANG Bangkok 10310
Telephone 0-2643-1111
Audited Yearly and Consolidated F/S (F45-3)Financial Statement Yearly 2016 (Audited)Notification of Resolutions of the Board of Directors Meeting on the Date fixed for the Annual General Meeting of the Shareholders for the
Annual Report 2015
Establish DateIPO Price (Baht) @ Par 10.00 Baht
Fax 0-2643-1651
URL http://www.truecorp.co.th
Last Par Change Old 10.00 : New 4.00 @ 01/10/2015
Business Type
IPO Financial Advisory MEC FAR EAST INTERNATIONAL PUBLIC COMPANY LIMITEDPHATRA THANAKIT PUBLIC COMPANY LIMITEDTHANACHART CAPITAL PUBLIC COMPANY LIMITED
% / ShareholdersForeign ShareholdersNVDR Shareholders
True Group?s core businesses have been organized into the three following categories: (1) Online business under TrueOnline, comprising fixed-line phone and value-added
Free Float 15/03/2016 17/03/2015
Top 10 Major Shareholders (@ 22/04/2016) Price Performance (Adjusted Price)
บรษัิท เครอืเจรญิโภคภัณฑ ์จ ำกัด 5 Days
CHINA MOBILE INTERNATIONAL HOLDINGS LIMITED 1 Month
บรษัิท ยนูคี เน็ตเวริค์ จ ำกัด 3 Months
บรษัิท ไทยเอ็นวดีอีำร ์จ ำกัด
CREDIT SUISSE AG, SINGAPORE BRANCH Turnover Ratio (%)
บรษัิท เจรญิโภคภัณฑโ์ฮลดิง้ จ ำกัดCREATIVE LIGHT INVESTMENTS LIMITED Accumulated: Turnover Ratio, Value Trade/Day
6 Months
บรษัิท ไวด ์บรอด คำสท ์จ ำกัด YTD
บรษัิท ซ.ีพ.ี อนิเตอรฟ์ู้ด (ไทยแลนด)์ จ ำกัด P/E (X)
WORTH ACCESS TRADING LIMITED P/BV (X)
Mr. SUPHACHAI CHEARAVANONT CHAIRMAN OF THE EXECUTIVE COMMITTEE / DIRECTOR Par Value (B.)Mr. AJVA TAULANANDA VICE CHAIRMAN Market Cap (MB.)
StatisticsManagement Position
Mr. DHANIN CHEARAVANONT CHAIRMAN Listed share (M.)
Mr. VICHAOW RAKPHONGPHAIROJ PRESIDENT / DIRECTOR P/BV (X)Mr. ADHIRUTH THOTHAVEESANSUK PRESIDENT P/E (X)
Mr. ATHUECK ASVANUND VICE CHAIRMAN Price (B./share)Mr. ZHENGMAO LI VICE CHAIRMAN OF THE BOARD BVPS (B./Share)
Mr. CHATCHAVAL JIARAVANON DIRECTORMr. SOOPAKIJ CHEARAVANONT DIRECTOR Rate of Return
Mr. WARAPATR TODHANAKASEM DIRECTOR Turnover Ratio (%)Mr. UMROONG SANPHASITVONG DIRECTOR Value Trade/Day (MB.)
Mr. VITTHYA VEJJAJIVA INDEPENDENT DIRECTOR / CHAIRMAN OF THE AUDIT Payout RatioMr. KOSOL PETCHSUWAN INDEPENDENT DIRECTOR / AUDIT COMMITTEE Dividend Policy
Mr. NARONG CHEARAVANONT DIRECTOR Price Change (%)Mr. XIA BING DIRECTOR Dividend Yield (%)
Mr. HARALD LINK INDEPENDENT DIRECTOROperation Period
Mr. GENLUO XU INDEPENDENT DIRECTOR 01/01/2015 -
At least 50% of net profit of the Company statement in each year (with additional conditions)Mr. JOTI BHOKAVANIJ INDEPENDENT DIRECTOR / AUDIT COMMITTEEMr. RAWAT CHAMCHALERM INDEPENDENT DIRECTOR Dividend (Last 3 Year)
Financial Data
Statement of Financial Position (MB.)
CashA/R NetInventories
01/01/2015 -
MR. PRASIT YUENGSRIKUL / PRICEWATERHOUSE COOPERS ABAS LIMITEDMR. PISIT THANGTANAGUL / PRICEWATERHOUSE COOPERS ABAS LIMITEDMR. CHANCHAI CHAIPRASIT / PRICEWATERHOUSE COOPERS ABAS LIMITED
Current LiabilitiesNon-Current Liabilities
Total Liabilities
Authorized CapitalPaid-Up CapitalPremium (Discount) on Share Capital
Current AssetsPP&E Net
Total Assets
ODA/P NetCurrent portion of LT
SalesOther Income
Total Revenues
COGsSG&A
Total Expenses
Other Surplus (Deficit)Retained Earnings (Deficit)Treasury Stock
Shareholders' Equity
Minority InterestStatement of Comprehensive Income
(MB.)
Operating Cash FlowInvesting Cash FlowFinancing Cash Flow
Net Cash FlowAnnualized: ROE, ROA
Ratios
EBITDADepre. & Amor.EBIT
Net Profit
EPS (B.)Statement of Cash Flow (MB.)
EBIT Margin (%)Net Profit Margin (%)
Growth Rate (%)Sales Growth
Current Ratio (X)ROE (%)ROA (%)D/E (X)Total Asset Turnover (X)Gross Profit Margin (%)
Cash CycleA/R Turnover (Times)Avg. Collection Period (Days)Inventory Turnover (Times)Avg. Inventory Period (Days)A/P Turnover (Times)
COGs GrowthTotal Revenue GrowthTotal Expense GrowthNet Profit Growth
Annualized
Avg. Payment Period (Days)Cash Cycle (Days)
Presented and calculated from the consolidated statement and displayed as cumulative quarterly statement by fiscal year (Company Information on the financial statements is presented according to the information that the listed companies submit on that period. The
Information only PP, PO, XR and XD
21/06/2016
No Information Found
11/05/1602/09/14
28/08/2014
Only Preferred Share and WarrantsCapital Movement (Last 3 Year) Other Securities
Date Securities Name -
Source: SETSMART (Copyright © The Stock Exchange of Thailand)
Market Alert (Latest)No Information Found
Trading Sign (Latest)Trading Sign Posted Date Lifted Date

XD 26/04/2017
CG Report: 4
P/E (X) P/BV (X)49.9 9
Date/Time
20/03/2017 18:03
13/03/2017 13:01
27/02/2017 12:42
27/02/2017 07:29
27/02/2017 07:29
1986 Listed Date 16/05/2013
6.3
39.49% 7,185 37.87% 3,207
5.59% @ 24/03/2017 Foreign Limit 49.00%
2.76% @ 24/03/2017
Share %
Compare to Stock
(%)
Compare to Sector
(%)
Compare to Market
(%)
1 1,994,750,400 18.13 4.07 3.13 3.24
2 1,127,189,050 10.25 -3.76 -3.34 -4.3
3 932,656,600 8.48 -9.22 -4.39 -12.89
4 775,393,100 7.05 0.79 3.94 -4.38
5 399,655,300 3.63 -10.49 -3.19 -12.23
6 368,587,850 3.35 49.9 37.85 17.36
7 313,064,393 2.85 9 5.85 1.93
8 284,725,300 2.59 0.15 0.1 0.29
9 253,720,200 2.31
10 187,816,550 1.71
YTD 2016 2015
24/03/2017 30/12/2016 30/12/2015
1 11,000.00 11,000.00 11,000.00
2 0.1 0.1 0.1
3 28,160.00 31,460.00 29,260.00
4 2.56 2.86 2.66
5 0.28 0.28 0.27
6 9 10.04 9.9
7 49.9 54.71 57.6
8 23.68 111.81 72.15
9 125.13 137.16 55.16
10 1.56 1.38 0.94
11
12 YTD 2016 2015
-10.49 7.52 47.78
1.41 1.26 1.13
0.7 0.69 0.65
Dividend/Share Unit Payment Date Type
0.012 Baht 09/12/16 Cash
0.012 Baht 09/09/16 Cash
0.012 Baht - Cash
0.012 Baht 09/12/15 Cash
0.012 Baht 10/09/15 Cash
0.1 Baht - Cash
0.1 Baht 09/12/14 Cash
0.1 Baht 10/09/14 Cash
0.09 Baht - Cash
Auditor
(Effective Until
31/12/2017)
Latest Type of Report Unqualified opinion
2016 2015 2014 2013
(01/01/16 - 31/12/16) (01/01/15 - 31/12/15) (01/01/14 - 31/12/14) (01/01/13 - 31/12/13)
441.36 439.78 678.46 495.64
279.67 228.88 161.72 562.55
109.64 103.09 86.56 74.98
1,334.91 1,353.33 1,522.13 1,766.95
2,935.79 1,987.14 1,557.33 1,081.55
4,517.88 3,559.61 3,265.67 2,994.48
637 52 30 -
365.99 404 327.96 268.9
11.13 2.41 2.27 1.12
1,096.16 540 433.97 340.54
198.2 50.56 27.37 15.3
1,294.36 590.56 461.34 355.84
1,100.00 1,100.00 1,100.00 1,100.00
1,100.00 1,100.00 1,100.00 1,100.00
1,146.08 1,146.08 1,146.08 1,146.09
- - - -
884.35 718.92 554.17 392.55
- - - -
3,130.37 2,965.01 2,800.26 2,638.64
93.15 4.04 4.07 -
2016 2015 2014 2013
(01/01/16 - 31/12/16) (01/01/15 - 31/12/15) (01/01/14 - 31/12/14) (01/01/13 - 31/12/13)
3,636.77 3,154.92 2,671.70 2,221.49
21.11 23.91 43.08 33.16
3,657.88 3,178.83 2,714.78 2,254.65
2,468.54 2,082.17 1,756.02 1,446.44
493.82 425.89 359.33 287.25
2,962.37 2,508.07 2,115.34 1,733.71
908.69 835.19 735.36 631.8
213.18 164.43 135.93 110.86
695.51 670.76 599.43 520.93
564.29 538.38 480.62 414.38
0.05 0.05 0.44 0.41
2016 2015 2014 2013
(01/01/16 - 31/12/16) (01/01/15 - 31/12/15) (01/01/14 - 31/12/14) (01/01/13 - 31/12/13)
705.26 697.54 446.83 308.95
-1,027.66 -608.3 25.77 -1,041.04
323.98 -327.92 -289.78 994.3
1.57 -238.68 182.82 262.21
2016 2015 2014
1.22 2.51 3.51
18.52 18.68 17.67
17.22 19.66 19.15
0.41 0.2 0.16
0.91 0.93 0.87
32.12 34 34.27
19.01 21.1 22.08
15.43 16.94 17.7
2016 2015 2014
15.27 18.09 20.27
18.56 18.57 21.4
15.07 17.09 20.41
18.11 18.57 22.01
4.81 12.02 15.99
2016 2015 2014
14.3 16.15 7.38
25.52 22.59 49.47
23.21 21.96 21.74
15.73 16.62 16.79
6.41 5.69 5.88
56.93 64.16 62.03
-15.68 -24.94 4.23
Remark:
CA Type Changed paid up share Paid up share Par
Market Alert (Latest)
No Information Found
Source: SETSMART (Copyright © The Stock Exchange of Thailand)
Trading Sign Posted Date Lifted Date
No Information Found
Trading Sign (Latest)
Information only PP, PO, XR and XD Only Preferred Share and Warrants
Capital Movement (Last 3 Year) Other Securities
Date Securities Name -
No Information Found
Avg. Inventory Period (Days)
A/P Turnover (Times)
Avg. Payment Period (Days)
Cash Cycle (Days)
Presented and calculated from the consolidated statement and displayed as cumulative quarterly statement by fiscal year (Company
statement will be presented and calculated incase consolidated statement is not available.)
Information on the financial statements is presented according to the information that the listed companies submit on that period. The
investors should study additional information from the companies' financial statements since some companies may restate the comparing
financial statements on the latest financial statements.
Annualized
Cash Cycle
A/R Turnover (Times)
Avg. Collection Period (Days)
Inventory Turnover (Times)
Growth Rate (%)
Sales Growth
COGs Growth
Total Revenue Growth
Total Expense Growth
Net Profit Growth
Total Asset Turnover (X)
Gross Profit Margin (%)
EBIT Margin (%)
Net Profit Margin (%)
Annualized: ROE, ROA
Ratios
Current Ratio (X)
ROE (%)
ROA (%)
D/E (X)
EPS (B.)
Statement of Cash Flow (MB.)
Operating Cash Flow
Investing Cash Flow
Financing Cash Flow
Net Cash Flow
SG&A
Total Expenses
EBITDA
Depre. & Amor.
EBIT
Net Profit
Minority Interest
Statement of Comprehensive Income (MB.)
Sales
Other Income
Total Revenues
COGs
Paid-Up Capital
Premium (Discount) on Share Capital
Other Surplus (Deficit)
Retained Earnings (Deficit)
Treasury Stock
Shareholders' Equity
A/P Net
Current portion of LT
Current Liabilities
Non-Current Liabilities
Total Liabilities
Authorized Capital
A/R Net
Inventories
Current Assets
PP&E Net
Total Assets
OD
MR. KHITSADA LERDWANA / E Y OFFICE COMPANY LIMITED
MISS SUMALEE REEWARABUNDIT / E Y OFFICE COMPANY LIMITED
Financial Data
Statement of Financial Position (MB.)
Cash
01/01/2014 - 30/06/2014
01/10/2013 - 31/12/2013
Miss MANEE RATTANABUNNAKIT / E Y OFFICE COMPANY LIMITED F/S Year ended 31/12
01/01/2015 - 30/06/2015
01/10/2014 - 31/12/2014
01/07/2014 - 30/09/2014
01/01/2016 - 30/06/2016
01/01/2015 - 31/12/2015
01/01/2015 - 30/09/2015
Dividend (Last 3 Year)
Operation Period
01/01/2016 - 30/09/2016
Payout Ratio
Dividend Policy Not less than 50% of net profit based on the Company?s consolidated financial statement after deduction of reserves
Mr. PINIT KULLAVANIJAYA INDEPENDENT DIRECTOR Rate of Return
Price Change (%)
Dividend Yield (%)
Mr. SOMYOS YAN-UBOL INDEPENDENT DIRECTOR / AUDIT COMMITTEE Beta
Mr. CHAYAWAT PISESSITH INDEPENDENT DIRECTOR / AUDIT COMMITTEE
Miss KANNIKAR PLUSSIND DIRECTOR Turnover Ratio (%)
Mr. MANIT JEERADIT INDEPENDENT DIRECTOR / CHAIRMAN OF AUDIT Value Trade/Day (MB.)
Mrs. KOBKUL PANYAPHOL DIRECTOR P/BV (X)
Mr. YANYONG AMORNPITAKKUL DIRECTOR P/E (X)
Mr. WICHIT SIRITATTAMRONG DIRECTOR Price (B./share)
Mr. SUCHAI LAOVERAWAT DIRECTOR BVPS (B./Share)
Mr. KUMPOL PLUSSIND MANAGING DIRECTOR Par Value (B.)
Mr. APIRUM PANYAPHOL DIRECTOR Market Cap (MB.)
StatisticsManagement Position
Mr. KRIENGSAK PLUSSIND CHAIRMAN OF THE BOARD Listed share (M.)
นำง สวุมิล อธกิจิ Turnover Ratio (%)
นำย ก ำพล พลสัสนิทร์
นำย ธชัชยั รตพิำณชิยว์งศ์ Accumulated: Turnover Ratio, Value Trade/Day
6 Months
คณุหญงิ ปัทมำ ลสีวสัดิต์ระกลู YTD
นำย เกรยีงศกัดิ ์พลสัสนิทร์ P/E (X)
บรษัิท ไทยเอ็นวดีอีำร ์จ ำกัด P/BV (X)
Top 10 Major Shareholders (@ 13/03/2017) Price Performance (Adjusted Price)
น.ส. กรรณกิำ พลสัสนิทร์ 5 Days
นำย อภริุม ปัญญำพล 1 Month
นำง กอบกลุ ปัญญำพล 3 Months
นำย ณรัณ รตพิำณชิยว์งศ์
% / Shareholders
Foreign Shareholders
NVDR Shareholders
CHG and its subsidiaries, i.e. Convenience Hospital Co., Ltd. and Bang Pakong Vejchakij Co., Ltd. operates healthcare business covering the eastern part of Bangkok and its
Free Float 14/03/2016 11/03/15
Last Par Change Old 1.00 : New 0.10 @ 11/05/2015
Business Type
IPO Financial Advisory THANACHART SECURITIES PUBLIC COMPANY LIMITED
Par 0.10 Baht
Annual Report 2014
Establish Date
IPO Price (Baht) @ Par 1.00 Baht
Fax 0-2769-2967
URL http://www.chularat.com
Company Profile
Address 88/8-9 Moo 11, Bang Pla, Bang Phli Samut Prakarn 10540
Telephone 0-2769-2900
Dividend payment and schedule of the 2017 Annual General Meeting of Shareholders(Revised)
Financial Statement Yearly 2016 (Audited)
Audited Yearly and Consolidated F/S (F45-3)
32.03
News 3 Yr Performance
Subject
Publicity of Minutes of the Shareholders' Annual General Meeting Year 2017
Result of the Rights for Shareholders to Propose AGM Agenda and Nominated Candidates as the Company
2.56 3.32 / 2.06 1,100.00 28,160.00 29,106.16 908.69
Price (B.) 52 week High/Low Paid-up (MB.) Market Cap (MB.) EV (MB.) EBITDA (MB.) EV/EBITDA
CHG
Services / Health Care Services
SET100
CHULARAT HOSPITAL PUBLIC COMPANY LIMITED

XD 24/03/2017CG Report: -
P/E (X) P/BV (X)17.83 5.23
Date/Time
15/03/2017 12:3520/02/2017 19:1820/02/2017 12:4320/02/2017 12:4220/02/2017 12:41
03/12/82 Listed Date 07/07/94345
73.66% 51,924 71.59% 44,2917.11% @ 17/03/2017 Foreign Limit 49.00%2.36% @ 17/03/2017
Share %
Compare to Stock
(%)
Compare to Sector
(%)
Compare to Market
(%)
1 4,295,246,452 60.18 1.79 -1.19 0.41
2 1,200,000,000 16.81 -10 -9.91 -9.03
3 234,509,588 3.29 -0.58 -8.11 -3.03
4 63,498,100 0.89 28.57 23.83 21.82
5 59,658,800 0.84 8.23 0.28 6.98
6 54,000,000 0.76 17.83 21.93 17.21
7 40,000,000 0.56 5.23 3.01 1.91
8 36,207,200 0.51 1.97 0.4 0.41
1 YTD 2016 2015 2 17/03/2017 30/12/2016 30/12/2015 3 6,260.79 5,936.96 7,133.474 0.5 0.5 0.55 53,529.72 46,901.96 23,112.456 8.55 7.9 3.247 1.72 1.51 2.238 5.23 5.25 1.489 17.83 15.01 1.49
10 78.01 1,024.75 978.8611 829.28 1,381.14 1,603.61
YTD 2016 2015 8.23 143.83 -55.926.25 28.45 4.541.11 4.27 0.07
Dividend/Share Unit Payment Date Type
0.15 Baht 09/12/16 Cash0.15 Baht 20/07/2016 Cash0.3 Baht 27/05/2016 Cash0.1 Baht 27/11/2015 Cash
0.15 Baht 27/05/2015 Cash1.5 Baht 18/03/2015 Cash
Auditor F/S Year ended 31/12
2016 2015 2014 2013 (01/01/16 - 31/12/16) (01/01/15 - 31/12/15) (01/01/14 - 31/12/14) (01/01/13 - 31/12/13)
2,481.80 7,879.72 1,500.91 2,997.083,020.26 3,088.27 3,169.30 3,673.38
- 21.2 27.37 39.527,389.81 17,026.69 9,209.47 8,259.64
27,976.17 18,957.71 12,501.71 12,288.19
47,594.12 50,795.57 22,981.81 21,733.39
2,229.12 1,518.73 2,457.99 982.553,949.94 3,753.22 2,950.26 2,636.572,227.60 164.81 1,463.49 1,761.39
11,990.29 18,278.99 8,559.46 6,667.1624,336.46 15,506.37 1,495.62 2,596.98
36,326.75 33,785.37 10,055.07 9,264.14
4,646.00 5,246.00 3,568.70 3,568.702,968.48 3,566.74 3,568.70 3,568.70
314.81 302.92 -224.55 -224.55- - - -
5,430.37 11,753.60 9,275.54 7,789.01- - 991.66 -
10,236.06 15,881.68 11,886.20 11,391.33
1,031.30 1,128.52 1,040.53 1,077.922016 2015 2014 2013
(01/01/16 - 31/12/16) (01/01/15 - 31/12/15) (01/01/14 - 31/12/14) (01/01/13 - 31/12/13) 15,619.26 13,982.68 12,268.49 11,122.972,531.58 19,444.46 142.55 137.11
18,150.84 33,427.14 12,411.19 11,260.21
9,711.22 8,406.51 4,713.23 4,474.843,925.78 3,347.14 2,889.03 2,562.97
13,901.49 11,307.12 8,112.09 7,266.45
6,861.80 24,151.94 6,361.72 5,893.862,612.45 2,031.93 2,062.62 1,900.104,249.35 22,120.02 4,299.11 3,993.76
3,001.61 15,710.41 3,270.86 3,002.51
0.46 2.23 0.46 0.422016 2015 2014 2013
(01/01/16 - 31/12/16) (01/01/15 - 31/12/15) (01/01/14 - 31/12/14) (01/01/13 - 31/12/13) -2,480.14 -2,707.72 6,809.30 5,624.872,845.68 28,389.80 -2,761.28 -1,565.80
-5,763.47 -19,303.27 -5,544.18 -2,540.53
-5,397.92 6,378.81 -1,496.16 1,518.55
2016 2015 2014 0.62 0.93 1.08
22.99 113.16 28.18.64 59.96 19.233.55 2.13 0.850.37 0.91 0.56
37.83 39.88 61.5823.41 66.17 34.6416.54 47 26.35
2016 2015 2014 11.7 13.97 10.3
15.52 78.36 5.33-45.7 169.33 10.2222.94 39.39 11.64
-80.89 380.31 8.94
2016 2015 2014 5.11 4.47 3.59
71.37 81.67 101.79N/A 346.13 140.91N/A 1.05 2.59
2.52 2.51 1.69144.76 145.53 216.33-73.39 -62.8 -111.95
Remark:
CA Type Changed paid up share Paid up share Par
Price (B.) 52 week High/Low Paid-up (MB.) Market Cap (MB.) EV (MB.) EBITDA (MB.) EV/EBITDA
JASTechnology / Information & Communication TechnologySET
JASMINE INTERNATIONAL PUBLIC COMPANY LIMITED
12.88
News 3 Yr PerformanceSubject
Schedule for the Exercise of Rights to Purchase Ordinary Shares of Jasmine International Public Company Limited under JAS-W3Report on the Board of Directors' meeting resolutions, the date of the 2017 Annual General Meeting of Shareholders and the dividend
8.55 10.20 / 3.20 3,130.39 53,529.72 88,405.97 6,861.80
Company Profile
Address JASMINE INTERNATIONAL BUILDING, FLOOR 29-30, MOO 4, CHAENGWATTHANA RD, PAK KRET Nonthaburi 11120
Telephone 0-2100-3000
Financial Statement Yearly 2016 (Audited)Dividend Payment for the year 2016Audited Yearly and Consolidated F/S (F45-3)
Annual Report 2015
Establish DateIPO Price (Baht) @ Par 10.00 Baht
Fax 0-2100-3150-2
URL http://www.jasmine.com
Business TypeThe businesses are grouped into 4 categories : 1. Broadband Business 2. Telecom Network & Service Provider Business 3. System Integration Business 4. Other
IPO Financial Advisory ASSET PLUS SECURITIES PUBLIC CO.,LTD.Last Par Change Old 1.00 : New 0.50 @ 25/09/2008
% / ShareholdersForeign ShareholdersNVDR Shareholders
Free Float 07/04/16 16/03/2015
Top 10 Major Shareholders (@ 25/11/2016) Price Performance (Adjusted Price)
นำย พชิญ ์โพธำรำมกิ โพธำรำมกิ 5 Days
บรษัิท จัสมนิ อนิเตอรเ์นชัน่แนล จ ำกัด (มหำชน) 1 Month
บรษัิท ไทยเอ็นวดีอีำร ์จ ำกัด 3 Months
นำย เกรกิไกร ไตรบญัญัตกิลุ
CHASE NOMINEES LIMITED Turnover Ratio (%)
Management Position Accumulated: Turnover Ratio, Value Trade/Day
6 Months
HSBC (SINGAPORE) NOMINEES PTE LTD YTD
นำย ทศิชวน นำนำวรำทร P/E (X)
นำย วชิำญ วชริพงศ์ P/BV (X)
Miss SAIJAI KITSIN PRESIDENT / DIRECTOR Listed share (M.)Mr. SOMBOON PATCHARASOPAK DIRECTOR Par Value (B.)
Mr. SUDHITHAM CHIRATHIVAT CHAIRMAN / INDEPENDENT DIRECTOR StatisticsMr. PETE BODHARAMIK CHIEF EXECUTIVE OFFICER / DIRECTOR
Mr. PLEUMJAI SINARKORN DIRECTOR BVPS (B./Share)Mr. YORDCHAI ASAWATHONGCHAI DIRECTOR P/BV (X)
Mr. SUBHOJ SUNYABHISITHKUL DIRECTOR Market Cap (MB.)Mr. TERASAK JERAUSWAPONG DIRECTOR Price (B./share)
Mrs. CHANTRA PURNARIKSHA INDEPENDENT DIRECTOR / AUDIT COMMITTEE Value Trade/Day (MB.)
Rate of Return
Mr. VICHIT YAMBOONRUANG INDEPENDENT DIRECTOR / CHAIRMAN OF AUDIT P/E (X)Mr. YODHIN ANAVIL INDEPENDENT DIRECTOR / AUDIT COMMITTEE Turnover Ratio (%)
Dividend Policy Not less than 50 percent of the net profits pursuant to the separated financial statement of the Company after tax deductions
Dividend (Last 3 Year)
Price Change (%)Dividend Yield (%)Payout Ratio
01/01/2015 - 01/01/2015 - 01/01/2014 -
Operation Period
--
Financial Data
Statement of Financial Position (MB.)
CashA/R NetInventories
01/01/2015 -
MRS. CHONLAROS SUNTIASVARAPORN / E Y OFFICE COMPANY LIMITEDMISS SUPANNEE TRIYANANTAKUL / E Y OFFICE COMPANY LIMITEDMR. SUPACHAI PHANYAWATTANO / E Y OFFICE COMPANY LIMITED
Current LiabilitiesNon-Current Liabilities
Total Liabilities
Authorized CapitalPaid-Up CapitalPremium (Discount) on Share Capital
Current AssetsPP&E Net
Total Assets
ODA/P NetCurrent portion of LT
SalesOther Income
Total Revenues
COGsSG&A
Total Expenses
Other Surplus (Deficit)Retained Earnings (Deficit)Treasury Stock
Shareholders' Equity
Minority InterestStatement of Comprehensive Income
(MB.)
Operating Cash FlowInvesting Cash FlowFinancing Cash Flow
Net Cash FlowAnnualized: ROE, ROA
Ratios
EBITDADepre. & Amor.EBIT
Net Profit
EPS (B.)Statement of Cash Flow (MB.)
EBIT Margin (%)Net Profit Margin (%)
Growth Rate (%)Sales Growth
Current Ratio (X)ROE (%)ROA (%)D/E (X)Total Asset Turnover (X)Gross Profit Margin (%)
Cash CycleA/R Turnover (Times)Avg. Collection Period (Days)Inventory Turnover (Times)Avg. Inventory Period (Days)A/P Turnover (Times)
COGs GrowthTotal Revenue GrowthTotal Expense GrowthNet Profit Growth
Annualized
Avg. Payment Period (Days)Cash Cycle (Days)
Presented and calculated from the consolidated statement and displayed as cumulative quarterly statement by fiscal year (Company
statement will be presented and calculated incase consolidated statement is not available.)
Information on the financial statements is presented according to the information that the listed companies submit on that period. The
investors should study additional information from the companies' financial statements since some companies may restate the comparing
financial statements on the latest financial statements.Information only PP, PO, XR and XD
No Information Found
Trading Sign Posted Date Lifted Date
No Information Found
Trading Sign (Latest)
Only Preferred Share and WarrantsCapital Movement (Last 3 Year) Other Securities
Date Securities Name JAS-W3
H 19/09/2016 19/09/2016SP 22/03/2016 23/03/2016
Source: SETSMART (Copyright © The Stock Exchange of Thailand)
NP 15/08/2003 -Market Alert (Latest)

CG Report: 5
P/E (X) P/BV (X)13.88 2.14
Date/Time
01/03/17 17:07
22/02/2017 13:28
22/02/2017 12:56
22/02/2017 12:56
22/02/2017 12:52
25/11/1981 Listed Date 27/03/1992
45
44.19% 5,556 39.40% 6,427
15.18% @ 24/03/2017 Foreign Limit 49.00%
6.24% @ 24/03/2017
Share %
Compare to Stock
(%)
Compare to Sector
(%)
Compare to Market
(%)
1 79,447,169 6.34 8.98 6.37 8.11
2 68,000,000 5.42 21.33 19.66 20.65
3 64,000,000 5.1 25.52 17.21 20.45
4 60,000,000 4.79 22.97 -9.66 16.67
5 59,701,080 4.76 23.81 21.86 21.4
6 56,716,050 4.52 13.88 39.92 17.36
7 46,012,100 3.67 2.14 1.64 1.93
8 40,000,000 3.19 1.48 0.58 0.29
9 37,457,000 2.99
10 37,400,000 2.98
YTD 2016 2015
24/03/2017 30/12/2016 30/12/2015
1 1,253.82 1,253.82 1,253.82
2 1 1 1
3 22,819.54 18,431.17 12,412.83
4 18.2 14.7 9.9
5 8.5 8.11 7.08
6 2.14 1.81 1.4
7 13.88 11.51 11.15
8 22.44 86.9 46.34
9 79.74 61.3 30.46
1.19 1.03 0.91
YTD 2016 2015
23.81 48.48 -44.38
1.65 1.7 4.04
0.23 0.2 0.45
Dividend/Shar
e Unit Payment Date Type
0.3 Baht 28/04/2017 Cash
0.25 Baht 28/04/2016 Cash
0.4 Baht 28/04/2015 Cash
Auditor
(Effective Until
31/12/2017)
Latest Type of Report Unqualified opinion
2016 2015 2014 2013
(01/01/16 - 31/12/16) (01/01/15 - 31/12/15) (01/01/14 - 31/12/14) (01/01/13 - 31/12/13)
310.87 592.49 269.73 310.6
932.66 1,026.63 905.35 1,100.75
3,653.33 3,173.50 3,274.30 3,216.94
4,915.00 4,808.89 4,468.79 4,645.81
7,430.75 6,735.99 6,145.94 5,686.34
16,160.33 14,976.32 13,737.41 13,103.15
1,931.38 1,787.10 1,177.05 2,046.89
886.47 813.54 895.46 921.12
208.32 283.32 230 2,080.00
3,198.37 2,952.56 2,338.93 5,075.58
2,182.87 2,580.51 2,665.49 569.81
5,381.24 5,533.07 5,004.43 5,645.39
1,400.00 1,400.00 1,400.00 1,400.00
1,253.82 1,253.82 1,253.82 1,253.82
525 525 525 525
8.97 8.32 7.25 3.01
8,869.98 7,539.60 6,847.19 5,587.97
- - - -
10,657.77 9,326.74 8,633.26 7,369.81
121.32 116.51 99.72 87.95
2016 2015 2014 2013
(01/01/16 - 31/12/16) (01/01/15 - 31/12/15) (01/01/14 - 31/12/14) (01/01/13 - 31/12/13)
16,693.02 16,466.51 17,828.68 16,699.03
329.9 235.16 246.78 311.65
17,394.11 16,950.47 18,401.01 17,231.40
14,191.28 14,463.26 15,334.15 14,418.32
1,242.64 1,170.39 1,165.28 1,097.20
15,433.92 15,633.65 16,499.43 15,515.53
2,558.57 1,905.21 2,466.21 2,242.32
598.38 588.4 564.64 526.45
1,960.19 1,316.82 1,901.58 1,715.87
1,643.70 1,194.92 1,779.59 1,503.62
1.31 0.95 1.42 1.2
2016 2015 2014 2013
(01/01/16 - 31/12/16) (01/01/15 - 31/12/15) (01/01/14 - 31/12/14) (01/01/13 - 31/12/13)
2,088.82 1,763.84 2,513.23 3,071.85
-1,613.11 -1,386.42 -1,340.07 -1,292.47
-757.33 -54.66 -1,214.03 -1,751.75
-281.62 322.76 -40.87 27.63
2016 2015 2014
1.54 1.63 1.91
16.45 13.31 22.24
12.59 9.17 14.17
0.5 0.59 0.58
1.12 1.18 1.37
14.99 12.17 13.99
11.27 7.77 10.33
9.45 7.05 9.67
2016 2015 2014
1.38 -7.64 6.76
-1.88 -5.68 6.35
2.62 -7.88 6.79
-1.28 -5.25 6.34
37.56 -32.85 18.35
2016 2015 2014
17.04 17.05 17.77
21.42 21.41 20.54
4.16 4.49 4.72
87.79 81.36 77.26
16.7 16.93 16.88
21.86 21.56 21.62
87.35 81.21 76.17
Remark:
CA Type Changed paid up share Paid up share Par
Market Alert (Latest)
No Information Found
Source: SETSMART (Copyright © The Stock Exchange of Thailand)
Trading Sign Posted Date Lifted Date
No Information Found
Trading Sign (Latest)
Information only PP, PO, XR and XD Only Preferred Share and Warrants
Capital Movement (Last 3 Year) Other Securities
Date Securities Name -
No Information Found
Avg. Inventory Period (Days)
A/P Turnover (Times)
Avg. Payment Period (Days)
Cash Cycle (Days)
Presented and calculated from the consolidated statement and displayed as cumulative quarterly statement by fiscal year (Company
statement will be presented and calculated incase consolidated statement is not available.)
Information on the financial statements is presented according to the information that the listed companies submit on that period. The
investors should study additional information from the companies' financial statements since some companies may restate the comparing
financial statements on the latest financial statements.
Annualized
Cash Cycle
A/R Turnover (Times)
Avg. Collection Period (Days)
Inventory Turnover (Times)
Growth Rate (%)
Sales Growth
COGs Growth
Total Revenue Growth
Total Expense Growth
Net Profit Growth
Total Asset Turnover (X)
Gross Profit Margin (%)
EBIT Margin (%)
Net Profit Margin (%)
Annualized: ROE, ROA
Ratios
Current Ratio (X)
ROE (%)
ROA (%)
D/E (X)
EPS (B.)
Statement of Cash Flow (MB.)
Operating Cash Flow
Investing Cash Flow
Financing Cash Flow
Net Cash Flow
SG&A
Total Expenses
EBITDA
Depre. & Amor.
EBIT
Net Profit
Minority Interest
Statement of Comprehensive Income (MB.)
Sales
Other Income
Total Revenues
COGs
Paid-Up Capital
Premium (Discount) on Share Capital
Other Surplus (Deficit)
Retained Earnings (Deficit)
Treasury Stock
Shareholders' Equity
A/P Net
Current portion of LT
Current Liabilities
Non-Current Liabilities
Total Liabilities
Authorized Capital
A/R Net
Inventories
Current Assets
PP&E Net
Total Assets
OD
MISS PRAPHASRI LEELASUPHA / SAMNAK-NGAN A.M.C. CO., LTD.
MR. AMPOL CHAMNONGWAT / SAMNAK-NGAN A.M.C. CO., LTD.
Financial Data
Statement of Financial Position (MB.)
Cash
31/12/2014
MR. NARIS SAOWALAGSAKUL / SAMNAK-NGAN A.M.C. CO., LTD. F/S Year ended 31/12
Operation Period
-
-
Dividend Policy Not more than 50% of net profit of Company's separated financial statement after deductions of any reserved portion required by law or the Company (with additional conditions)
Dividend (Last 3 Year)
Price Change (%)
Dividend Yield (%)
Payout Ratio
Beta
Rate of Return
Mr. PARAMET HETRAKUL INDEPENDENT DIRECTOR / AUDIT COMMITTEE Turnover Ratio (%)
Mr. THANATHIP PICHEDVANICHOK INDEPENDENT DIRECTOR / AUDIT COMMITTEE Value Trade/Day (MB.)
Mr. SUJIN SIRIMONGKOLKASEM DIRECTOR P/BV (X)
Mr. SATHIT KARANES INDEPENDENT DIRECTOR / CHAIRMAN OF AUDIT P/E (X)
Mrs. SOMSIRI INGPOCHAI DIRECTOR Price (B./share)
Miss WANNEE SIRIMONGKOLKASEM DIRECTOR BVPS (B./Share)
Mr. ANAN SIRIMONGKOLKASEM CHAIRMAN OF EXECUTIVE COMMITTEE / DIRECTOR Par Value (B.)
Mr. VIRACH SIRIMONGKOLKASEM VICE CHAIRMAN / MANAGING DIRECTOR Market Cap (MB.)
StatisticsManagement Position
Mr. PRASIT SIRIMONGKOLKASEM CHAIRMAN Listed share (M.)
น.ส. วรรณงำม กจิธนำมงคลชยั Turnover Ratio (%)
นำย เจษฎำ ศริมิงคลเกษม
นำย กติตชิยั ศริมิงคลเกษม Accumulated: Turnover Ratio, Value Trade/Day
6 Months
นำย สจุนิ ศริมิงคลเกษม YTD
NICHIREI FOODS INC. P/E (X)
น.ส. นสิำ ศริมิงคลเกษม P/BV (X)
Top 10 Major Shareholders (@ 10/03/2017) Price Performance (Adjusted Price)
บรษัิท ไทยเอ็นวดีอีำร ์จ ำกัด 5 Days
นำย พษิณุ ศริมิงคลเกษม 1 Month
นำง ชลลดำ ศริมิงคลเกษม 3 Months
นำย วงศกร ศริมิงคลเกษม
% / Shareholders
Foreign Shareholders
NVDR Shareholders
The Group operates integrated poultry business including feed mill, breeder farm, hatchery farm, broiler farm, chicken evisceration and processed food. Main products of the
Free Float 10/03/16 11/03/15
Last Par Change Old 10.00 : New 1.00 @ 17/05/2010
Business Type
IPO Financial Advisory FINANCE ONE PUBLIC COMPANY LIMITED
PHATRA THANAKIT PUBLIC COMPANY LIMITED
Par 1.00 Baht
Annual Report 2015
Establish Date
IPO Price (Baht) @ Par 10.00 Baht
Fax 0-2473-8392, 0-2473-8384
URL http://www.gfpt.co.th
Company Profile
Address 312 Rama 2 Road, Bangmod, Jomthong Bangkok 10150
Telephone 0-2473-8000
Management Discussion and Analysis Yearly Ending 31 Dec 2016
Dividend Payment and the Date and Agenda of 2017 Annual General Meeting of Shareholders (AGM)
Audited Yearly and Consolidated F/S (F45-3)
10.95
News 3 Yr Performance
Subject
Publication of the Invitation to Attend the 2017 Annual General Shareholders' Meeting
Dividend Payment and the Date and Agenda of 2017 Annual General Meeting of Shareholders (AGM) (Edited file PDF)
18.2 18.20 / 10.70 1,253.82 22,819.54 28,011.23 2,558.57
Price (B.) 52 week High/Low Paid-up (MB.) Market Cap (MB.) EV (MB.) EBITDA (MB.) EV/EBITDA
GFPT
Agro & Food Industry / Agribusiness
SET
GFPT PUBLIC COMPANY LIMITED

CG Report: -
P/E (X) P/BV (X)21.18 3.04
Date/Time
06/03/17 17:5401/03/17 8:1701/03/17 8:0628/02/2017 22:3528/02/2017 22:27
10/05/01 Listed Date 26/10/20163.2
48.19% 4,5112.91% @ 17/03/2017 Foreign Limit 49.00%0.99% @ 17/03/2017
Share % Compare to Stock (%) Compare to Sector (%) Compare to Market (%)
1 228,750,000 20.24 1.68 0.8 0.31
2 85,000,000 7.52 22.47 27.36 23.79
3 76,000,000 6.73 46.14 54.28 42.53
4 70,000,000 6.19 N/A N/A N/A
5 49,000,000 4.34 46.84 55.49 45.15
6 40,000,100 3.54 21.18 24.86 17.21
7 29,000,100 2.57 3.04 2.24 1.91
8 25,000,000 2.21 4.29 0.38 0.41
9 25,000,000 2.2110 25,000,000 2.21
YTD 2016 17/03/2017 30/12/2016
1 1,130.00 1,130.002 1 13 6,836.50 4,655.604 6.05 4.125 1.99 N/A6 3.04 -7 21.18 18.038 177.18 292.029 195.78 302.17
1011 YTD 2016 12 46.84 28.75
N/A N/A- -
Dividend/Share Unit Payment Date Type
Auditor F/S Year ended 31/12
2016 2015 (01/01/16 - 31/12/16) (01/01/15 - 31/12/15)
920.86 82.34838.35 607.15135.09 83.23
2,255.31 918.043,641.40 3,480.35
6,003.96 4,489.05
400 126.51568.47 625.92474.68 222.03
1,735.92 1,431.772,017.46 2,317.64
3,753.38 3,749.41
1,150.00 1,000.001,130.00 750
803.51 -- 18.82
293.54 -29.17- -
2,250.58 739.64
0 02016 2015
(01/01/16 - 31/12/16) (01/01/15 - 31/12/15) 2,890.71 1,867.72
20.79 5.65
2,911.50 1,873.37
2,062.78 1,377.83291.08 284.31
2,353.86 1,662.14
1,169.92 683.17612.28 471.94557.64 211.23
322.71 88.74
0.39 0.122016 2015
(01/01/16 - 31/12/16) (01/01/15 - 31/12/15) 404.75 735.46
-690.03 -1,719.391,123.79 998.68
838.52 14.74
2016 1.3
21.5810.631.670.55
28.6419.1511.08
2016 N/AN/AN/AN/AN/A
2016 4
91.2618.9
19.323.45
105.674.9
Remark:
CA Type Changed paid up share Paid up share Par
Price (B.) 52 week High/Low Paid-up (MB.) Market Cap (MB.) EV (MB.) EBITDA (MB.) EV/EBITDA
SQProperty & Construction / Construction ServicesSET
SAHAKOL EQUIPMENT PUBLIC COMPANY LIMITED
Audited Yearly and Consolidated F/S (F45-3) revised 1Financial Statement Yearly 2016 (Audited)Audited Yearly and Consolidated F/S (F45-3)
17.34
News 3 Yr PerformanceSubject
Invitation to shareholders to propose AGM agenda and to nominate candidate(s) to be elected as the Company's director(s) for the year 2017Financial Statement Yearly 2016 (Audited) revised note to FS no.38 (approval date)
6.05 6.25 / 3.92 1,130.00 6,836.50 9,669.02 1,169.92
Fax 0-2941-0881URL http://www.sahakol.com
Company ProfileAddress 47/10 Soi Amorphan 4 Vibhavadirangsit Road Chatuchak Bangkok 10900Telephone 0-2941-0888
Last Par Change N/A
Business Type
Establish DateIPO Price (Baht) @ Par 1.00 BahtIPO Financial Advisory MAYBANK KIM ENG SECURITIES (THAILAND) PUBLIC COMPANY LIMITED
THE SIAM COMMERCIAL BANK PUBLIC COMPANY LIMITED
% / ShareholdersForeign ShareholdersNVDR Shareholders
The company operates in mining service business, with current operations in open-pit mining including Mine Planning and Logistics, Open-pit Mining Operations, Mining Consultancy and Heavy-
Free Float 19/10/2016
Top 10 Major Shareholders (@ 19/10/2016) Price Performance (Adjusted Price)
บรษัิท เอสวพีเีค จ ำกัด 5 Days
นำย สชุำต ิอำรกีุล 1 Month
นำย อังสรัุสมิ ์อำรกีุล 3 Months
มรว ปรดียิำธร เทวกุล
นำย ภำคย ์ศรสีัตยำกุล Turnover Ratio (%)
นำย นพพันธป์ เมอืงโคตรKim Eng Securities (Hong Kong) Limited Accumulated: Turnover Ratio, Value Trade/Day
6 Months
นำง ฆรณี อำรกีุล YTD
นำย ศริพิงษ์ รุง่โรจน์กติยิศ P/E (X)
นำง อภญิญำ ศริสิรรพ์ P/BV (X)
Mr. NOPPUN MUANGKOTE CHAIRMAN OF EXECUTIVE COMMITTEE / VICE Par Value (B.)MR. SASAVAT SIRISON DIRECTOR Market Cap (MB.)
StatisticsManagement Position
MR. SOMBOON MANEENAWA CHAIRMAN OF THE BOARD Listed share (M.)
Mr. KAVIT SIRISON DIRECTOR P/BV (X)MR. CHALEE RUKSUTHEE DIRECTOR P/E (X)
MR. VITAVAT SIRISON DIRECTOR Price (B./share)MR. PAVAT SIRISON DIRECTOR BVPS (B./Share)
MR. SIRICHAI TOVIRIYAVET INDEPENDENT DIRECTOR / CHAIRMAN OF AUDIT Mrs. KINGTHIEN BANG-OR INDEPENDENT DIRECTOR / AUDIT COMMITTEE Rate of Return
MR. KITTIRAT THAVILAB DIRECTOR Turnover Ratio (%)MRS. WANPEN KOSITRUENGCHAI DIRECTOR Value Trade/Day (MB.)
Dividend Policy At least approximately 40% of its net profit after taxes as shown in the Company?s separate financial statements after all required reserves specified in law and the Company?s article of association (with additional conditions)
Dividend (Last 3 Year)
Mr. MONGKON LAOWORAPONG INDEPENDENT DIRECTOR / AUDIT COMMITTEE Price Change (%)Dividend Yield (%)Payout Ratio
Financial Data
Statement of Financial Position (MB.)
CashA/R NetInventories
Operation PeriodNo Information Found
MR. TEERASAK CHUASRISAKUL / GRANT THORNTON CO., LTD.
Current LiabilitiesNon-Current Liabilities
Total Liabilities
Authorized CapitalPaid-Up CapitalPremium (Discount) on Share Capital
Current AssetsPP&E Net
Total Assets
ODA/P NetCurrent portion of LT
SalesOther Income
Total Revenues
COGsSG&A
Total Expenses
Other Surplus (Deficit)Retained Earnings (Deficit)Treasury Stock
Shareholders' Equity
Minority InterestStatement of Comprehensive Income (MB.)
Operating Cash FlowInvesting Cash FlowFinancing Cash Flow
Net Cash FlowAnnualized: ROE, ROA
Ratios
EBITDADepre. & Amor.EBIT
Net Profit
EPS (B.)Statement of Cash Flow (MB.)
EBIT Margin (%)Net Profit Margin (%)
Growth Rate (%)Sales Growth
Current Ratio (X)ROE (%)ROA (%)D/E (X)Total Asset Turnover (X)Gross Profit Margin (%)
Cash CycleA/R Turnover (Times)Avg. Collection Period (Days)Inventory Turnover (Times)Avg. Inventory Period (Days)A/P Turnover (Times)
COGs GrowthTotal Revenue GrowthTotal Expense GrowthNet Profit Growth
Annualized
Avg. Payment Period (Days)Cash Cycle (Days)
Presented and calculated from the consolidated statement and displayed as cumulative quarterly statement by fiscal year (Company statement will be presented and
calculated incase consolidated statement is not available.)
Information on the financial statements is presented according to the information that the listed companies submit on that period. The investors should study additional
information from the companies' financial statements since some companies may restate the comparing financial statements on the latest financial statements.Information only PP, PO, XR and XD
No Information Found
Trading Sign Posted Date Lifted DateTrading Sign (Latest)
Only Preferred Share and WarrantsCapital Movement (Last 3 Year) Other Securities
Date Securities Name -
Source: SETSMART (Copyright © The Stock Exchange of Thailand)
No Information FoundMarket Alert (Latest)
No Information Found

XD 03/05/17CG Report: 4
P/E (X) P/BV (X)N/A 1.2
Date/Time
22/03/2017 17:1422/03/2017 17:0616/03/2017 18:0514/03/2017 17:2214/03/2017 17:21
23/4/1987 Listed Date 22/08/199160
54.59% 11,866 54.39% 12,48616.25% @ 24/03/2017 Foreign Limit 49.00%2.64% @ 24/03/2017
Share %
Compare to Stock
(%)
Compare to Sector
(%)
Compare to Market
(%)
1 283,152,760 22.12 -1.59 -3.94 -2.37
2 135,660,070 10.6 -8.37 -9.64 -8.89
3 67,353,683 5.26 -11 -16.89 -14.6
4 45,335,800 3.54 56.3 14.83 48.29
5 37,632,830 2.94 -19.13 -20.41 -20.7
6 22,791,000 1.78 N/A 39.92 17.36
7 22,456,300 1.75 1.2 1.64 1.93
8 22,400,000 1.75 1.29 0.58 0.29
9 21,726,050 1.710 21,000,000 1.64
YTD 2016 2015 24/03/2017 30/12/2016 30/12/2015
1 1,280.00 1,280.00 1,280.002 1 1 13 23,808.00 29,440.00 12,928.004 18.6 23 10.15 15.51 16.54 16.626 1.2 1.39 0.617 N/A 59.12 10.988 104.32 100.4 36.019 539.46 86.76 24.64
10 1.25 0.96 0.711112 YTD 2016 2015
-19.13 127.72 -21.092.15 1.74 3.96N/A 1.03 0.43
Dividend/Share Unit Payment Date Type
0.4 Baht 27/05/2016 Cash0.4 Baht 27/05/2015 Cash
0.65 Baht 29/05/2014 Cash
Auditor(Effective Until
31/12/2017)
Latest Type of Report Unqualified opinion
2016 2015 2014 2013 (01/01/16 - 31/12/16) (01/01/15 - 31/12/15) (01/01/14 - 31/12/14) (01/01/13 - 31/12/13)
1,674.62 2,197.24 2,131.62 1,892.738,093.26 3,854.23 4,688.38 7,441.24
20,931.00 13,959.75 10,029.94 16,581.9431,811.88 21,530.63 17,684.38 26,598.4115,765.51 15,185.49 14,355.03 12,925.86
55,958.55 43,878.63 37,790.53 44,320.10
23,433.81 13,446.23 9,408.41 14,223.083,167.84 2,687.39 2,579.50 3,932.115,406.13 1,326.45 170.31 1,731.28
32,836.07 17,835.55 12,463.96 20,486.293,210.57 4,709.17 4,734.71 3,767.51
36,046.64 22,544.72 17,198.66 24,253.80
1,280.00 1,280.00 1,280.00 1,280.001,280.00 1,280.00 1,280.00 1,280.008,550.99 8,550.99 8,550.99 8,550.991,136.48 1,261.50 1,316.27 1,041.709,164.07 10,415.73 9,790.26 9,558.73
- - - -
19,847.54 21,239.67 20,491.67 19,978.03
64.38 94.24 100.2 88.272016 2015 2014 2013
(01/01/16 - 31/12/16) (01/01/15 - 31/12/15) (01/01/14 - 31/12/14) (01/01/13 - 31/12/13) 77,265.52 61,291.78 75,529.87 92,185.18
239.21 1,495.80 1,676.76 957.17
77,907.50 63,436.41 77,741.72 93,637.93
71,852.02 57,770.59 72,181.56 86,996.065,435.96 3,713.40 3,820.40 3,589.19
78,273.13 61,483.99 76,001.96 90,585.25
829.59 3,007.52 2,617.23 3,793.071,195.23 1,055.10 877.48 740.39-365.64 1,952.42 1,739.76 3,052.68
-757.99 1,118.03 1,037.76 1,811.60
-0.59 0.87 0.81 1.422016 2015 2014 2013
(01/01/16 - 31/12/16) (01/01/15 - 31/12/15) (01/01/14 - 31/12/14) (01/01/13 - 31/12/13) -10,214.60 -2,074.43 9,269.87 -363.56-2,343.28 -2,464.43 -2,371.74 -3,087.8412,035.27 4,604.48 -6,659.24 3,810.10
-522.62 65.62 238.89 358.7
2016 2015 2014 0.97 1.21 1.42
-3.69 5.36 5.13-0.73 4.78 4.241.82 1.06 0.841.56 1.55 1.897.01 5.74 4.43
-0.47 3.08 2.24-0.97 1.76 1.33
2016 2015 2014 26.06 -18.85 -18.0724.37 -19.96 -17.0322.81 -18.4 -16.9827.31 -19.1 -16.1
N/A 7.74 -42.72
2016 2015 2014 12.93 14.35 12.4528.22 25.44 29.314.12 4.82 5.42
88.62 75.78 67.2824.54 21.94 22.1714.87 16.64 16.46
101.97 84.58 80.13
Remark:
CA Type Changed paid up share Paid up share Par
Market Alert (Latest)No Information Found
Source: SETSMART (Copyright © The Stock Exchange of Thailand)
Trading Sign Posted Date Lifted DateNo Information Found
Trading Sign (Latest)
Information only PP, PO, XR and XD Only Preferred Share and WarrantsCapital Movement (Last 3 Year) Other Securities
Date Securities Name -
No Information Found
Avg. Inventory Period (Days)A/P Turnover (Times)Avg. Payment Period (Days)Cash Cycle (Days)
Presented and calculated from the consolidated statement and displayed as cumulative quarterly statement by fiscal year (Company
statement will be presented and calculated incase consolidated statement is not available.)
Information on the financial statements is presented according to the information that the listed companies submit on that period.
The investors should study additional information from the companies' financial statements since some companies may restate the
comparing financial statements on the latest financial statements.
Annualized
Cash CycleA/R Turnover (Times)Avg. Collection Period (Days)Inventory Turnover (Times)
Growth Rate (%)Sales GrowthCOGs GrowthTotal Revenue GrowthTotal Expense GrowthNet Profit Growth
Total Asset Turnover (X)Gross Profit Margin (%)
EBIT Margin (%)Net Profit Margin (%)
Annualized: ROE, ROA
RatiosCurrent Ratio (X)ROE (%)ROA (%)D/E (X)
EPS (B.)Statement of Cash Flow (MB.)
Operating Cash FlowInvesting Cash FlowFinancing Cash Flow
Net Cash Flow
SG&A
Total Expenses
EBITDADepre. & Amor.EBIT
Net Profit
Minority InterestStatement of Comprehensive Income (MB.)
SalesOther Income
Total Revenues
COGs
Paid-Up CapitalPremium (Discount) on Share CapitalOther Surplus (Deficit)Retained Earnings (Deficit)Treasury Stock
Shareholders' Equity
A/P NetCurrent portion of LTCurrent LiabilitiesNon-Current Liabilities
Total Liabilities
Authorized Capital
A/R NetInventoriesCurrent AssetsPP&E Net
Total Assets
OD
MR. PAIBOON TUNKOON / PRICEWATERHOUSE COOPERS ABAS LIMITEDMR. PISIT THANGTANAGUL / PRICEWATERHOUSE COOPERS ABAS LIMITED
Financial Data
Statement of Financial Position (MB.)
Cash
01/01/2014 - 31/12/201401/01/2013 - 31/12/2013
MISS SAKUNA YAMSAKUL / PRICEWATERHOUSE COOPERS ABAS LIMITED F/S Year ended 31/12
Dividend (Last 3 Year)Operation Period
01/01/2015 - 31/12/2015
Payout RatioDividend Policy Approximately 30% of net profit (with additional conditions)
Mr. NEO AH CHAP INDEPENDENT DIRECTOR Rate of ReturnPrice Change (%)Dividend Yield (%)
Mr. KRIANG YANYONGDILOK INDEPENDENT DIRECTOR / AUDIT COMMITTEE BetaMr. SAMACHA POTAVORN INDEPENDENT DIRECTOR / AUDIT COMMITTEE
Mr. SHIQIANG LI DIRECTOR Turnover Ratio (%)Mr. CHALERMPOP KHANJAN DIRECTOR Value Trade/Day (MB.)
Mr. PAUL SUMADE LEE DIRECTOR P/BV (X)Mr. PATRAWUT PANITKUL DIRECTOR P/E (X)
Mr. KITICHAI SINCHAROENKUL DIRECTOR Price (B./share)Mr. VEERASITH SINCHAREONKUL DIRECTOR BVPS (B./Share)
Mr. PRAKOB VISITKITJAKARN VICE CHAIRMAN OF THE COMPANY / INDEPENDENT Par Value (B.)Mr. CHAIYOS SINCHAROENKUL DIRECTOR Market Cap (MB.)
StatisticsManagement Position
Mr. VIYAVOOD SINCHAROENKUL CHAIRMAN / MANAGING DIRECTOR Listed share (M.)
นำย วทิยน์ำถ สนิเจรญิกลุ Turnover Ratio (%)
CITIGROUP GLOBAL MARKETS LIMITED-PB CLIENT-NRBS COLLATERALนำย วชิญพ์ล สนิเจรญิกลุ Accumulated: Turnover Ratio, Value Trade/Day
6 Months
บรษัิท ไทยเอ็นวดีอีำร ์จ ำกัด YTD
นำย วรีสทิธิ ์สนิเจรญิกลุ P/E (X)
กองทนุส ำรองเลีย้งชพี เค มำสเตอร ์พลู ฟันด ์ซึง่จดทะเบยีนแลว้ P/BV (X)
Top 10 Major Shareholders (@ 02/02/2017) Price Performance (Adjusted Price)
บรษัิท ศรตีรัง โฮลดิง้ส ์จ ำกัด 5 Days
นำย ไวยวฒุ ิสนิเจรญิกลุ 1 Month
THE CENTRAL DEPOSITORY(PTE)LIMITED-LISTED SECURITIES 3 Months
น.ส. พัณณนิอร ศริสิวุฒัน์
% / ShareholdersForeign ShareholdersNVDR Shareholders
The Company operates as producer and exporter of natural rubber. Its products include natural rubber, ribbed smoked sheets (RSS), block rubber (TSR), concentrated
Free Float 25/03/2016 25/03/2015
Last Par Change Old 5.00 : New 1.00 @ 06/07/2010
Business Type
IPO Financial Advisory THANAPHOL FINANCE AND SECURITIES CO.,LTD.Par 1.00 Baht
Annual Report 2015
Establish DateIPO Price (Baht) @ Par 10.00 Baht
Fax 0-7434-4676, 0-7434-4677, 0-7423-7423
URL http://www.sritranggroup.com
Company Profile
Address 10 SOI 10 PETCHKASEM ROAD, HAT YAI, Songkhla 90110
Telephone 0-7434-4663
Inform the Demerger Completion between the Company and SemperitDisclosure of the presentation of the Extraordinary General Meeting of Shareholders No. 1/2017 on the Company's websiteInform the resolution of Extraordinary General Meeting of Shareholders No. 1/2017
70.21
News 3 Yr PerformanceSubject
Distribution of the invitation letter of the 2017 AGM on Company's websiteDisclosure of the Minutes of EGM No.1/2017 on Company's website
18.6 28.75 / 10.90 1,280.00 23,808.00 58,244.40 829.59Price (B.) 52 week High/Low Paid-up (MB.) Market Cap (MB.) EV (MB.) EBITDA (MB.) EV/EBITDA
STAAgro & Food Industry / AgribusinessSET
SRI TRANG AGRO-INDUSTRY PUBLIC COMPANY LIMITED

XR 24/04/2017CG Report: 4
P/E (X) P/BV (X)35.71 7.59
Date/Time
01/03/17 13:2501/03/17 13:1101/03/17 8:3415/02/2017 08:5515/02/2017 08:47
1998 Listed Date 14/12/20057
67.03% 1,361 51.76% 1,5700.41% @ 17/03/2017 Foreign Limit 49.00%2.14% @ 17/03/2017
Share %
Compare to Stock
(%)
Compare to Sector
(%)
Compare to Market
(%)
1 46,575,250 15.29 11.16 8.59 10.31
2 43,245,000 14.19 -10.27 -5.57 -3.76
3 15,266,000 5.01 10.18 14.56 12.52
4 14,089,125 4.62 173.63 133.07 151.44
5 10,558,200 3.47 14.22 20.42 19.01
6 7,548,075 2.48 35.71 29.24 90.7
7 7,500,000 2.46 7.59 3.69 3.03
8 7,000,000 2.3 0.99 0.22 0.53
9 6,823,900 2.2410 5,734,950 1.88
YTD 2016 2015 17/03/2017 30/12/2016 30/12/2015
1 304.69 304.69 1252 0.5 0.5 13 7,586.76 6,642.23 1,762.504 24.9 21.8 7.055 3.28 3.09 5.276 7.59 8.6 2.677 35.71 61.16 N/A8 78.41 375.73 246.19 108.28 44.62 17.76
10
YTD 2016 2015 14.22 209.22 33.02
N/A N/A N/AN/A N/A N/A
Dividend/Share Unit Payment Date Type
Auditor F/S Year ended 31/12
2016 2015 2014 2013 (01/01/16 - 31/12/16) (01/01/15 - 31/12/15) (01/01/14 - 31/12/14) (01/01/13 - 31/12/13)
72.21 43.64 565.16 479.3830.93 18.09 15.39 13.37
- - - -4,448.66 1,145.69 694.15 732.6
27.97 25.97 31.82 38.93
4,527.69 1,178.87 743.71 791.78
- - - -21.38 9.71 - -1.73 0.6 1.84 4.71
1,588.52 491.4 22.17 27.811,938.99 9.76 24.87 30.3
3,527.51 501.16 47.04 58.11
156.25 125 125 125152.35 125 125 125419.78 337.74 337.74 337.74
- - - -2.15428.06 214.99 236.45 279.42
- - - -
1,000.18 677.73 696.69 740.02
- -0.02 -0.02 -6.352016 2015 2014 2013
(01/01/16 - 31/12/16) (01/01/15 - 31/12/15) (01/01/14 - 31/12/14) (01/01/13 - 31/12/13) 146.9 112.71 89.68 104.24321.9 41.41 77.56 37.86
468.8 154.12 167.23 142.09
124.62 79.6 81.14 106.6471.61 72.8 110.52 93.8
204.02 178.14 208.61 247.08
271.45 -16.59 -30.92 -91.346.66 7.44 10.46 13.65
264.78 -24.02 -41.38 -104.99
212.45 -25.14 -42.98 -107.59
0.84 -0.2 -0.34 -0.882016 2015 2014 2013
(01/01/16 - 31/12/16) (01/01/15 - 31/12/15) (01/01/14 - 31/12/14) (01/01/13 - 31/12/13) -3,092.90 5.39 -74.03 -78.8
-2.69 -973.65 164.84 -53.673,124.17 446.81 -5.14 -129.99
28.58 -521.45 85.67 -262.47
2016 2015 2014 2.8 2.33 31.3
25.32 -3.66 -5.989.28 -2.5 -5.393.53 0.74 0.070.16 0.16 0.22
15.17 29.38 9.5256.48 -15.59 -24.7445.32 -16.31 -25.7
2016 2015 2014 30.34 25.68 -13.9756.57 -1.9 -23.91
204.19 -7.84 17.6914.53 -14.61 -15.57
N/A N/A N/A
2016 2015 2014 5.99 6.73 6.24
60.91 54.21 58.52N/A N/A N/AN/A N/A N/A
8.02 8.2 N/A45.53 44.51 N/A15.38 9.7 58.52
Remark:
CA Type Changed paid up share Paid up share Par
Price (B.) 52 week High/Low Paid-up (MB.) Market Cap (MB.) EV (MB.) EBITDA (MB.) EV/EBITDA
ACAPFinancialsmai
ASIA CAPITAL GROUP PUBLIC COMPANY LIMITED
41.7
News 3 Yr PerformanceSubject
Resolutions of the Board of Directors' Meeting, Addition on Resolutions of Increase the Company's registered capital by issuance new Resolutions of the Board of Directors' Meeting, Addition on Resolutions of Increase the Company's registered capital by issuance new
24.9 29.75 / 7.40 152.34 7,586.76 11,042.06 271.45
Company Profile
Address 349 SJ Infinite I Business Complex 24th Floor, Unit 2401-2405, Vibhavadi Rangsit Road, Chompol, Chatuchak Bangkok
Telephone 0-2793-3888
Resolutions of the Board of Directors' Meeting, Addition on Resolutions of Increase the Company's registered capital by issuance new Resolutions of the Board of Directors' Meeting, Scheduling for 2017 Annual General Meeting of Shareholders (Templates added-2)Resolutions of the Board of Directors' Meeting, Scheduling for 2017 Annual General Meeting of Shareholders (Templates added)
Annual Report 2014
Establish DateIPO Price (Baht) @ Par 1.00 Baht
Fax 0-2793-3944
URL http://www.acap.co.th
Market/Industry/Sector ChangeEffective Date 05/01/2015
IPO Financial Advisory FAR EAST CAPITAL ADVISORY CO., LTD.Last Par Change Old 1.00 : New 0.50 @ 13/05/2016
Business Type-
Previous Market/Industry/Sector mai / MAI Industry / Medium-Sized EnterpriseCurrent Market/Industry/Sector mai / Financials / Financials
% / ShareholdersForeign ShareholdersNVDR Shareholders
Free Float 23/03/2016 07/04/15
Top 10 Major Shareholders (@ 02/03/2017) Price Performance (Adjusted Price)
น.ส. สกุัญญำ สขุเจรญิไกรศรี 5 Days
บรษัิท ไทยลกัซ ์เอ็นเตอรไ์พรส ์จ ำกัด (มหำชน) 1 Month
นำง อนงค ์แดนด ำรงสขุ 3 Months
นำย นธิำน ปิยะรัฐ
นำย อนุโรจน ์เสนยีป์ระกรณ์ไกร Turnover Ratio (%)
นำง สรุรัีตน ์เอีย่มสอำดนำง กิง่กำญจน ์สมติำนนท์ Accumulated: Turnover Ratio, Value Trade/Day
6 Months
นำย สรุศกัดิ ์สขุเจรญิไกรศรี YTD
บรษัิท เน็ทเวริค์ แมนเนจเมนท ์จ ำกัด P/E (X)
นำย ณัฏฐพ์งษ์ ปัญจวรญำณ P/BV (X)
Miss SUGUNYA SUKJAROENKRAISRI CHIEF EXECUTIVE OFFICER / DIRECTOR Par Value (B.)Mr. YIEM CHUNDPRASIT VICE CHAIRMAN OF THE BOARD OF DIRECTORS Market Cap (MB.)
StatisticsManagement Position
GEN. PUDIT TATTIYACHOT CHAIRMAN OF THE BOARD OF DIRECTORS Listed share (M.)
Mr. SOMPHOL TRIPOPNART DIRECTOR P/BV (X)Mr. SUPOT AREVART DIRECTOR P/E (X)
Mr. CHALERMCHAI SIRINOPAWONG DIRECTOR Price (B./share)Mr. PICHARN SUKPARANGSEE DIRECTOR BVPS (B./Share)
Miss PIMWALUN SUWATTIKUL INDEPENDENT DIRECTOR / AUDIT COMMITTEE
Rate of ReturnPrice Change (%)
POL. GEN. AMNAT UNARDNGAM INDEPENDENT DIRECTOR / CHAIRMAN OF AUDIT Turnover Ratio (%)Mr. NATAPORN INGKANINUN INDEPENDENT DIRECTOR / AUDIT COMMITTEE Value Trade/Day (MB.)
Not less than 50% of net profit after deduction of corporate income tax and legal reserve (with additional conditions)
Dividend (Last 3 Year)Operation
Dividend Yield (%)Payout RatioDividend Policy
Financial Data
Statement of Financial Position (MB.)
CashA/R NetInventories
No Information Found
MISS SAKUNA YAMSAKUL / PRICEWATERHOUSE COOPERS ABAS LIMITEDMR. PAIBOON TUNKOON / PRICEWATERHOUSE COOPERS ABAS LIMITEDMRS. ANOTHAI LEEKITWATTANA / PRICEWATERHOUSE COOPERS ABAS
Current LiabilitiesNon-Current Liabilities
Total Liabilities
Authorized CapitalPaid-Up CapitalPremium (Discount) on Share Capital
Current AssetsPP&E Net
Total Assets
ODA/P NetCurrent portion of LT
SalesOther Income
Total Revenues
COGsSG&A
Total Expenses
Other Surplus (Deficit)Retained Earnings (Deficit)Treasury Stock
Shareholders' Equity
Minority InterestStatement of Comprehensive Income
(MB.)
Operating Cash FlowInvesting Cash FlowFinancing Cash Flow
Net Cash FlowAnnualized: ROE, ROA
Ratios
EBITDADepre. & Amor.EBIT
Net Profit
EPS (B.)Statement of Cash Flow (MB.)
EBIT Margin (%)Net Profit Margin (%)
Growth Rate (%)Sales Growth
Current Ratio (X)ROE (%)ROA (%)D/E (X)Total Asset Turnover (X)Gross Profit Margin (%)
Cash CycleA/R Turnover (Times)Avg. Collection Period (Days)Inventory Turnover (Times)Avg. Inventory Period (Days)A/P Turnover (Times)
COGs GrowthTotal Revenue GrowthTotal Expense GrowthNet Profit Growth
Annualized
Avg. Payment Period (Days)Cash Cycle (Days)
Presented and calculated from the consolidated statement and displayed as cumulative quarterly statement by fiscal year (Company
statement will be presented and calculated incase consolidated statement is not available.)
Information on the financial statements is presented according to the information that the listed companies submit on that period. The
investors should study additional information from the companies' financial statements since some companies may restate the comparing
financial statements on the latest financial statements.Information only PP, PO, XR and XD
No Information Found
Trading Sign Posted Date Lifted DateTrading Sign (Latest)
Only Preferred Share and WarrantsCapital Movement (Last 3 Year) Other Securities
Date Securities ACAP-W1
Source: SETSMART (Copyright © The Stock Exchange of Thailand)
No Information FoundMarket Alert (Latest)Cash Balance 14/02/2017 - 03/03/2017

XD 08/05/17CG Report: 5
P/E (X) P/BV (X)23.98 2.76
Date/Time
24/03/2017 08:4820/03/2017 07:3216/03/2017 17:1410/03/17 7:5328/02/2017 08:21
23/07/1997 Listed Date 14/11/20073
83.47% 8,525 82.26% 5,7499.94% @ 24/03/2017 Foreign Limit 49.00%1.79% @ 24/03/2017
Share %
Compare to Stock
(%)
Compare to Sector
(%)
Compare to Market
(%)
1 270,215,912 7.7 2.8 -0.15 1.99
2 183,150,000 5.22 3.77 1.52 3.19
3 151,000,000 4.3 11.68 3.07 7.17
4 96,560,500 2.75 -3.51 1.55 -8.45
5 79,050,953 2.25 10.55 3.13 8.4
6 70,200,001 2 23.98 29.95 17.36
7 61,720,700 1.76 2.76 2.28 1.93
8 47,228,300 1.35 0.75 0.68 0.29
9 45,751,800 1.310 45,700,000 1.3
YTD 2016 2015 24/03/2017 30/12/2016 30/12/2015
1 3,832.12 3,832.12 3,454.022 0.25 0.25 0.253 8,430.66 7,625.91 4,179.364 2.2 1.99 1.215 0.8 0.77 0.636 2.76 2.58 2.097 23.98 23.57 13.668 80.3 931.72 325.339 116.43 297.15 134.34
1.66 1.32 1.26
YTD 2016 2015 10.55 64.46 -11.191.95 1.84 2.30.47 0.43 0.31
Dividend/Share Unit Payment Date Type
0.04 Baht 27/05/2016 Cash0.03 Baht 29/05/2015 Cash0.11 Baht 29/05/2014 Cash
Auditor(Effective Until
31/12/2017)
Latest Type of Report Unqualified opinion
2016 2015 2014 2013 (01/01/16 - 31/12/16) (01/01/15 - 31/12/15) (01/01/14 - 31/12/14) (01/01/13 - 31/12/13)
907.06 717.48 483.65 253.37628.96 475.48 442.17 373.3
- - - -1,659.00 1,268.20 953.57 647.143,726.48 2,389.38 1,755.86 1,710.67
5,450.55 3,782.92 2,825.53 2,478.03
311 332.16 171 162.43181.2 144.58 179.91 201.58
236 150.58 175.44 119.44953.49 846.98 575.31 525.75981.23 351.59 367.81 300.8
1,934.72 1,198.57 943.12 826.55
1,188.63 1,079.63 800 800958.03 863.5 799.72 714.33
1,008.88 536.25 217.34 200.27- - - 73.86
1,013.79 803.24 590.41 475.43- - - -
3,057.72 2,280.45 1,681.33 1,463.98
458.11 303.91 201.08 187.52016 2015 2014 2013
(01/01/16 - 31/12/16) (01/01/15 - 31/12/15) (01/01/14 - 31/12/14) (01/01/13 - 31/12/13) 1,817.73 1,639.11 1,504.23 1,332.88
8.95 55.55 13.97 18.04
1,826.68 1,694.66 1,518.20 1,350.92
1,028.07 975.66 982.01 896.01233.17 228.92 193.22 174.1
1,312.21 1,250.00 1,221.20 1,109.52
796.89 691.81 548.2 449.85282.42 247.15 251.2 208.45514.47 444.66 297 241.4
351.54 308.7 202.95 163.2
0.1 0.1 0.27 0.232016 2015 2014 2013
(01/01/16 - 31/12/16) (01/01/15 - 31/12/15) (01/01/14 - 31/12/14) (01/01/13 - 31/12/13) 569.15 508.01 428.85 391.23
-1,552.88 -820.09 -293.85 -571.371,173.31 545.91 95.28 169.89
189.58 233.83 230.29 -10.26
2016 2015 2014 1.74 1.5 1.66
13.17 15.58 12.911.14 13.46 11.20.63 0.53 0.560.4 0.51 0.57
43.44 40.48 34.7228.16 26.24 19.5619.24 18.22 13.37
2016 2015 2014 10.9 8.97 12.865.37 -0.65 9.67.79 11.62 12.384.98 2.36 10.07
13.88 52.11 24.36
2016 2015 2014 3.29 3.57 3.69
110.89 102.17 98.94N/A N/A N/AN/A N/A N/A
6.31 6.01 5.1557.83 60.7 70.953.05 41.47 28.04
Remark:
CA Type Changed paid up share Paid up share Par
Source: SETSMART (Copyright © The Stock Exchange of Thailand)
Market Alert (Latest)Cash Balance 24/06/2016
Trading Sign Posted Date Lifted DateNo Information Found
Trading Sign (Latest)
Information only PP, PO, XR and XD Only Preferred Share and WarrantsCapital Movement (Last 3 Year) Other Securities
Date Securities Name BWG-W4
No Information Found
Avg. Inventory Period (Days)A/P Turnover (Times)Avg. Payment Period (Days)Cash Cycle (Days)
Presented and calculated from the consolidated statement and displayed as cumulative quarterly statement by fiscal year (Company
statement will be presented and calculated incase consolidated statement is not available.)
Information on the financial statements is presented according to the information that the listed companies submit on that period.
The investors should study additional information from the companies' financial statements since some companies may restate the
comparing financial statements on the latest financial statements.
Annualized
Cash CycleA/R Turnover (Times)Avg. Collection Period (Days)Inventory Turnover (Times)
Growth Rate (%)Sales GrowthCOGs GrowthTotal Revenue GrowthTotal Expense GrowthNet Profit Growth
Total Asset Turnover (X)Gross Profit Margin (%)
EBIT Margin (%)Net Profit Margin (%)
Annualized: ROE, ROA
RatiosCurrent Ratio (X)ROE (%)ROA (%)D/E (X)
EPS (B.)Statement of Cash Flow (MB.)
Operating Cash FlowInvesting Cash FlowFinancing Cash Flow
Net Cash Flow
SG&A
Total Expenses
EBITDADepre. & Amor.EBIT
Net Profit
Minority InterestStatement of Comprehensive Income (MB.)
SalesOther Income
Total Revenues
COGs
Paid-Up CapitalPremium (Discount) on Share CapitalOther Surplus (Deficit)Retained Earnings (Deficit)Treasury Stock
Shareholders' Equity
A/P NetCurrent portion of LTCurrent LiabilitiesNon-Current Liabilities
Total Liabilities
Authorized Capital
A/R NetInventoriesCurrent AssetsPP&E Net
Total Assets
OD
MR. JIROTE SIRIROROTE / KARIN AUDIT COMPANY LIMITEDMR. JADESADA HUNGSAPRUEK / KARIN AUDIT COMPANY LIMITED
Financial Data
Statement of Financial Position (MB.)
Cash
01/01/2013 - 31/12/2013
MISS KANNIKA WIPANURAT / KARIN AUDIT COMPANY LIMITED F/S Year ended 31/12
Operation Period
01/01/2015 - 31/12/201501/01/2014 - 31/12/2014
Dividend Policy Approximately 50% of net profit after tax, after legal reserve and various reserves, except if any necessities exist
Dividend (Last 3 Year)
Price Change (%)Dividend Yield (%)Payout Ratio
Beta
Rate of Return
Mr. BOONYABARAMEE SAWANGWONG INDEPENDENT DIRECTOR / AUDIT COMMITTEE Turnover Ratio (%)Mrs. NARTRUIDEE THAMMAWON INDEPENDENT DIRECTOR / AUDIT COMMITTEE Value Trade/Day (MB.)
Mr. SUTHAT BOONYAUDOMSART DIRECTOR P/BV (X)Mrs. TASANEE THONGDEE DIRECTOR P/E (X)
Mr. AKARAWIT KHANKAEW VICE CHAIRMAN OF THE BOARD Price (B./share)Mr. WORADIT TANAPAT DIRECTOR BVPS (B./Share)
Mr. SUWAT LUENGVIRIYA PRESIDENT / CHIEF EXECUTIVE OFFICER / Par Value (B.)Mr. THAMNOON ANANTHOTHAI VICE CHAIRMAN / INDEPENDENT DIRECTOR / Market Cap (MB.)
StatisticsManagement Position
Mr. VICHARN VITHAYASAI CHAIRMAN OF THE BOARD Listed share (M.)
นำย สชุำต ิเมฆทรัพย์ Turnover Ratio (%)
นำง สริมิำ เนตรจำรุนำย ธติพิงษ์ เจนทวพีรกลุ Accumulated: Turnover Ratio, Value Trade/Day
6 Months
STATE STREET BANK AND TRUST COMPANY YTD
นำย วรัิช พันธส์ขุมุธนำ P/E (X)
น.ส. พรเพ็ญ กรรณกิำกร P/BV (X)
Top 10 Major Shareholders (@ 17/05/2016) Price Performance (Adjusted Price)
บรษัิท ไทยเอ็นวดีอีำร ์จ ำกัด 5 Days
นำย สวุฒัน ์เหลอืงวริยิะ 1 Month
นำย ก ำพล วริะเทพสภุรณ์ 3 Months
นำย พงษ์ศกัดิ ์อัตถนันท์
% / ShareholdersForeign ShareholdersNVDR Shareholders
The Company provides administrative and management services for industrial wastes, hazardous wastes, waste water treatment, waste treatment for sustainable fuel
Free Float 05/04/16 09/04/15
Last Par Change Old 1.00 : New 0.25 @ 12/05/2015
Business Type
IPO Financial Advisory KTB SECURITIES CO., LTD.Par 0.25 Baht
Annual Report 2011
Establish DateIPO Price (Baht) @ Par 1.00 Baht
Fax 0-2731-2574, 0-2731-1125
URL http://www.betterworldgreen.com
Company Profile
Address 2674/1 SOI DRIVE-IN 2, MOO 2, LADPRAO ROAD, KLONGCHAN, BANG KAPI Bangkok 10240
Telephone 0-2731-0080-1, 0-2731-1815
Report on the results of the sale of securities (F53-5)Notification of commercial operation (COD)Audited Yearly and Consolidated F/S (F45-3) (Edit)
12.44
News 3 Yr PerformanceSubject
To distribute the invitation of the AGM uploaded on the Company's websiteApproval for Dividend Payment, Capital Increase by General Mandate and AGM 2017
2.2 2.82 / 1.52 958.03 8,430.66 9,916.43 796.89Price (B.) 52 week High/Low Paid-up (MB.) Market Cap (MB.) EV (MB.) EBITDA (MB.) EV/EBITDA
BWGServices / Professional ServicesSET
BETTER WORLD GREEN PUBLIC COMPANY LIMITED
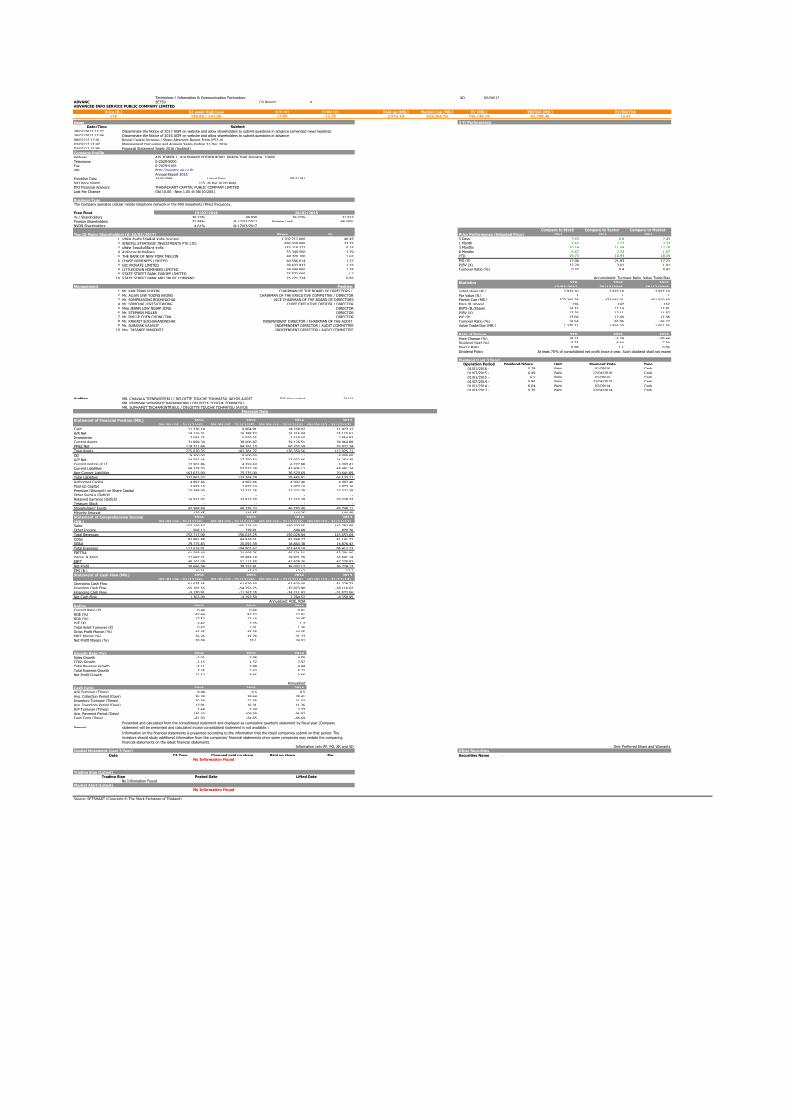
XD 05/04/17CG Report: 4
P/E (X) P/BV (X)17.06 12.29
Date/Time
28/02/2017 17:2128/02/2017 17:0608/02/17 17:0103/02/17 17:4703/02/17 17:45
24/4/1986 Listed Date 05/11/91115
36.22% 49,930 36.22% 31,51337.88% @ 17/03/2017 Foreign Limit 48.30%4.61% @ 17/03/2017
Share %
Compare to Stock
(%)
Compare to Sector
(%)
Compare to Market
(%)
1 1,202,712,000 40.45 3.83 0.8 2.43
2 693,359,000 23.32 2.62 2.73 3.73
3 153,218,372 5.15 20.14 11.04 17.18
4 53,349,500 1.79 6.67 2.74 1.07
5 48,320,100 1.63 19.73 10.94 18.34
6 40,596,014 1.37 17.06 21.93 17.21
7 39,632,937 1.33 12.29 3.01 1.91
8 38,044,800 1.28 0.32 0.4 0.41
9 35,573,096 1.210 25,221,224 0.85
YTD 2016 2015 17/03/2017 30/12/2016 30/12/2015
1 2,973.10 2,973.10 2,973.102 1 1 13 523,264.78 437,045.01 451,910.494 176 147 1525 14.32 12.14 12.816 12.29 12.11 11.877 17.06 12.49 12.068 14.54 92.96 56.229 1,370.31 1,826.20 1,501.36
10
YTD 2016 2015 19.73 -3.29 -39.445.73 8.84 7.890.98 1.1 0.95
Dividend/Share Unit Payment Date Type
5.79 Baht 01/09/16 Cash6.49 Baht 22/04/2016 Cash6.5 Baht 01/09/15 Cash
5.96 Baht 22/04/2015 Cash6.04 Baht 02/09/14 Cash5.75 Baht 22/04/2014 Cash
Auditor F/S Year ended 31/12
2016 2015 2014 2013 (01/01/16 - 31/12/16) (01/01/15 - 31/12/15) (01/01/14 - 31/12/14) (01/01/13 - 31/12/13)
11,226.14 9,864.91 14,258.07 11,473.1214,116.31 16,388.53 16,316.04 15,115.613,085.25 5,059.25 2,519.50 2,864.93
31,899.34 38,006.87 39,126.51 34,964.88118,271.44 84,291.10 60,702.59 35,922.24
275,670.35 181,761.27 126,350.56 112,025.71
9,200.00 8,500.00 - 4,000.0034,292.06 27,750.54 23,092.06 21,254.3812,501.86 4,355.63 6,227.88 5,303.4169,328.03 57,533.29 42,906.12 45,491.24
163,633.99 75,735.00 36,579.69 20,641.89
232,962.02 133,268.29 79,485.81 66,133.12
4,997.46 4,997.46 4,997.46 4,997.462,973.10 2,973.10 2,973.10 2,973.10
22,388.09 22,372.28 22,372.28 22,372.28- - - -
16,971.02 22,813.20 21,210.29 20,229.33- - - -
42,568.88 48,376.33 46,750.40 45,748.11
139.45 116.65 114.36 144.482016 2015 2014 2013
(01/01/16 - 31/12/16) (01/01/15 - 31/12/15) (01/01/14 - 31/12/14) (01/01/13 - 31/12/13) 152,149.87 155,276.44 149,329.05 142,782.88
568.13 738.81 699.89 870.76
152,717.99 156,015.25 150,028.94 143,653.64
82,991.88 84,819.01 83,548.27 81,141.2229,775.83 20,091.39 18,860.38 14,876.42
112,616.91 104,901.67 102,419.18 96,413.73
61,768.40 71,608.76 66,531.51 63,781.0621,667.31 20,495.18 18,921.75 16,541.1440,101.08 51,113.58 47,609.76 47,239.92
30,666.54 39,152.41 36,033.17 36,274.13
10.31 13.17 12.12 12.22016 2015 2014 2013
(01/01/16 - 31/12/16) (01/01/15 - 31/12/15) (01/01/14 - 31/12/14) (01/01/13 - 31/12/13) 61,635.46 61,629.40 62,820.40 51,328.73
-55,101.55 -54,755.75 -35,823.90 -28,116.62-5,170.91 -11,267.25 -24,211.93 -31,572.06
1,363.00 -4,393.59 2,784.57 -8,359.95
2016 2015 2014 0.46 0.66 0.91
67.44 82.32 77.9117.53 33.18 39.955.47 2.75 1.70.67 1.01 1.26
45.45 45.38 44.0526.26 32.76 31.7320.08 25.1 24.02
2016 2015 2014 -2.01 3.98 4.58-2.15 1.52 2.97-2.11 3.99 4.447.35 2.42 6.23
-21.67 8.66 -0.66
2016 2015 2014 9.98 9.5 9.5
36.59 38.44 38.4120.38 22.38 31.0317.91 16.31 11.762.68 3.34 3.77
136.43 109.39 96.87-81.93 -54.65 -46.69
Remark:
CA Type Changed paid up share Paid up share Par
Price (B.) 52 week High/Low Paid-up (MB.) Market Cap (MB.) EV (MB.) EBITDA (MB.) EV/EBITDA
ADVANCTechnology / Information & Communication TechnologySET50
ADVANCED INFO SERVICE PUBLIC COMPANY LIMITED
13.41
News 3 Yr PerformanceSubject
Disseminate the Notice of 2017 AGM on website and allow shareholders to submit questions in advance (amended news heading)Disseminate the Notice of 2016 AGM on website and allow shareholders to submit questions in advance
176 190.00 / 141.00 2,973.10 523,264.78 745,140.10 61,768.40
Company Profile
Address AIS TOWER 1, 414 PHAHOLYOTHIN ROAD, PHAYA THAI Bangkok 10400
Telephone 0-2029-5000
Revise Capital Increase / Share Allotment Report Form (F53-4)Management Discussion and Analysis Yearly Ending 31 Dec 2016Financial Statement Yearly 2016 (Audited)
Annual Report 2015
Establish DateIPO Price (Baht) @ Par 10.00 Baht
Fax 0-2029-5165
URL http://investor.ais.co.th
Business TypeThe Company operates cellular mobile telephone network in the 900 megahertz (MHz) frequency.
IPO Financial Advisory THANACHART CAPITAL PUBLIC COMPANY LIMITEDLast Par Change Old 10.00 : New 1.00 @ 08/10/2001
% / ShareholdersForeign ShareholdersNVDR Shareholders
Free Float 19/02/2016 20/02/2015
Top 10 Major Shareholders (@ 20/02/2017) Price Performance (Adjusted Price)
บรษัิท อนิทัช โฮลดิง้ส ์จ ำกัด (มหำชน) 5 Days
SINGTEL STRATEGIC INVESTMENTS PTE LTD. 1 Month
บรษัิท ไทยเอ็นวดีอีำร ์จ ำกัด 3 Months
ส ำนักงำนประกันสงัคม
LITTLEDOWN NOMINEES LIMITED Turnover Ratio (%)
STATE STREET BANK EUROPE LIMITEDSTATE STREET BANK AND TRUST COMPANY Accumulated: Turnover Ratio, Value Trade/Day
6 Months
THE BANK OF NEW YORK MELLON YTD
CHASE NOMINEES LIMITED P/E (X)
GIC PRIVATE LIMITED P/BV (X)
Mr. ALLEN LEW YOONG KEONG CHAIRMAN OF THE EXECUTIVE COMMITTEE / DIRECTOR Par Value (B.)Mr. SOMPRASONG BOONYACHAI VICE CHAIRMAN OF THE BOARD OF DIRECTORS Market Cap (MB.)
StatisticsManagement Position
Mr. KAN TRAKULHOON CHAIRMAN OF THE BOARD OF DIRECTORS / Listed share (M.)
Mr. STEPHEN MILLER DIRECTOR P/BV (X)Mr. PHILIP CHEN CHONG TAN DIRECTOR P/E (X)
Mr. SOMCHAI LERTSUTIWONG CHIEF EXECUTIVE OFFICER / DIRECTOR Price (B./share)Miss JEANN LOW NGIAP JONG DIRECTOR BVPS (B./Share)
Mrs. TASANEE MANOROT INDEPENDENT DIRECTOR / AUDIT COMMITTEE
Rate of ReturnPrice Change (%)
Mr. KRAIRIT EUCHUKANONCHAI INDEPENDENT DIRECTOR / CHAIRMAN OF THE AUDIT Turnover Ratio (%)Mr. SURASAK VAJASIT INDEPENDENT DIRECTOR / AUDIT COMMITTEE Value Trade/Day (MB.)
At least 70% of consolidated net profit twice a year. Such dividend shall not exceed the retained earnings of the Company financial statements nor adversely affect the Company and subsidiaries ongoing operations
Dividend (Last 3 Year)Operation Period
Dividend Yield (%)Payout RatioDividend Policy
01/07/2014 - 01/01/2014 - 01/07/2013 -
01/01/2016 - 01/07/2015 - 01/01/2015 -
Statement of Financial Position (MB.)
CashA/R NetInventoriesCurrent AssetsPP&E Net
MR. CHAVALA TIENPASERTKIJ / DELOITTE TOUCHE TOHMATSU JAIYOS AUDIT MR. PERMSAK WONGPATCHARAPAKORN / DELOITTE TOUCHE TOHMATSU MR. SUPHAMIT TECHAMONTRIKUL / DELOITTE TOUCHE TOHMATSU JAIYOS
Financial Data
Total Liabilities
Authorized CapitalPaid-Up CapitalPremium (Discount) on Share CapitalOther Surplus (Deficit)Retained Earnings (Deficit)
Total Assets
ODA/P NetCurrent portion of LTCurrent LiabilitiesNon-Current Liabilities
Total Revenues
COGsSG&A
Total Expenses
EBITDADepre. & Amor.
Treasury Stock
Shareholders' Equity
Minority InterestStatement of Comprehensive Income
(MB.)SalesOther Income
Financing Cash Flow
Net Cash FlowAnnualized: ROE, ROA
RatiosCurrent Ratio (X)ROE (%)
EBIT
Net Profit
EPS (B.)Statement of Cash Flow (MB.)
Operating Cash FlowInvesting Cash Flow
Growth Rate (%)Sales GrowthCOGs GrowthTotal Revenue Growth
ROA (%)D/E (X)Total Asset Turnover (X)Gross Profit Margin (%)
EBIT Margin (%)Net Profit Margin (%)
Avg. Collection Period (Days)Inventory Turnover (Times)Avg. Inventory Period (Days)A/P Turnover (Times)Avg. Payment Period (Days)Cash Cycle (Days)
Total Expense GrowthNet Profit Growth
Annualized
Cash CycleA/R Turnover (Times)
No Information Found
Presented and calculated from the consolidated statement and displayed as cumulative quarterly statement by fiscal year (Company
statement will be presented and calculated incase consolidated statement is not available.)
Information on the financial statements is presented according to the information that the listed companies submit on that period. The
investors should study additional information from the companies' financial statements since some companies may restate the comparing
financial statements on the latest financial statements.Information only PP, PO, XR and XD Only Preferred Share and Warrants
Capital Movement (Last 3 Year) Other Securities
Date Securities Name -
Source: SETSMART (Copyright © The Stock Exchange of Thailand)
No Information FoundMarket Alert (Latest)
No Information Found
Trading Sign (Latest)Trading Sign Posted Date Lifted Date

CG Report: 5
P/E (X) P/BV (X)11.97 1.91
Date/Time
15/03/2017 08:23
01/03/17 8:15
07/02/17 22:24
07/02/17 22:21
07/02/17 22:19
Mar-94 Listed Date 21/10/2004
3.8
48.39% 3,854 44.26% 3,581
4.57% @ 24/03/2017 Foreign Limit 49.00%
3.99% @ 24/03/2017
Share %
Compare to Stock
(%)
Compare to Sector
(%)
Compare to Market
(%)
1 91,000,100 31.62 - -0.74 -0.8
2 12,063,200 4.19 7.05 7.37 6.44
3 11,480,722 3.99 12.84 8.32 8.28
4 10,835,500 3.77 21.01 13.85 14.81
5 8,000,000 2.78 11.33 7.06 9.17
6 6,543,200 2.27 11.97 23.15 17.36
7 4,020,000 1.4 1.91 1.42 1.93
8 4,002,800 1.39 2.6 0.32 0.29
9 3,550,000 1.23
10 3,000,000 1.04
YTD 2016 2015
24/03/2017 30/12/2016 30/12/2015
1 287.78 287.78 287.78
2 1 1 1
3 4,805.88 4,316.66 3,942.55
4 16.7 15 13.7
5 8.74 8.48 7.95
6 1.91 1.77 1.72
7 11.97 10.38 9.92
8 88.97 61.13 60.32
9 73.41 10.65 11
0.54 0.64 0.84
YTD 2016 2015
11.33 9.49 -2.14
5.39 6 4.82
0.64 0.62 0.48
Dividend/Shar
e Unit Payment Date Type
0.4 Baht 28/04/2017 Cash
0.5 Baht 31/08/2016 Cash
0.4 Baht 29/04/2016 Cash
0.5 Baht 28/08/2015 Cash
0.36 Baht 24/04/2015 Cash
0.3 Baht 29/08/2014 Cash
Auditor
(Effective Until
31/12/2017)
Latest Type of Report Unqualified opinion
2016 2015 2014 2013
(01/01/16 - 31/12/16) (01/01/15 - 31/12/15) (01/01/14 - 31/12/14) (01/01/13 - 31/12/13)
404.85 378.19 348.95 372.48
1,236.13 1,016.53 1,173.13 959.62
424.38 281.33 280.81 247.29
2,213.72 1,834.00 1,932.12 1,697.50
2,686.93 1,918.57 1,921.37 1,846.38
5,219.85 4,138.60 4,165.67 3,821.00
535 20 70 273
1,363.63 1,229.26 1,381.79 1,152.41
167.45 56.03 38.64 13.68
2,127.26 1,410.62 1,544.32 1,648.03
361.78 267.89 310.38 66.88
2,489.03 1,678.51 1,854.70 1,714.91
287.78 287.78 287.78 287.78
287.78 287.78 287.78 287.78
1,213.60 1,213.60 1,213.60 1,213.60
- - - -
1,014.11 877.42 715.08 539.16
- - - -
2,515.48 2,372.77 2,216.45 2,040.53
215.34 87.32 94.52 65.56
2016 2015 2014 2013
(01/01/16 - 31/12/16) (01/01/15 - 31/12/15) (01/01/14 - 31/12/14) (01/01/13 - 31/12/13)
7,468.16 8,140.25 7,404.79 7,154.77
59.04 42.99 38.43 45.99
7,527.19 8,186.81 7,443.22 7,200.76
6,503.39 7,274.58 6,583.18 6,305.95
487.89 366.11 345.75 321.32
7,079.41 7,731.75 7,022.20 6,742.24
755.62 738.87 687.49 694.37
307.83 283.82 266.48 235.85
447.78 455.05 421.02 458.52
401.65 409.86 377.36 423.21
1.4 1.42 1.31 1.47
2016 2015 2014 2013
(01/01/16 - 31/12/16) (01/01/15 - 31/12/15) (01/01/14 - 31/12/14) (01/01/13 - 31/12/13)
417.61 702.06 667.11 575.42
-765.42 -308.91 -553.6 -687.86
374.47 -363.91 -137.04 -92.54
26.66 29.24 -23.53 -204.97
2016 2015 2014
1.04 1.3 1.25
16.43 17.86 17.73
9.57 10.96 10.54
0.99 0.71 0.84
1.61 1.97 1.86
12.92 10.63 11.1
5.95 5.56 5.66
5.34 5.01 5.07
2016 2015 2014
-8.26 9.93 3.49
-10.6 10.5 4.4
-8.06 9.99 3.37
-8.44 10.1 4.15
-2 8.61 -10.83
2016 2015 2014
6.63 7.44 6.94
55.05 49.09 52.56
18.43 25.88 24.93
19.8 14.1 14.64
5.02 5.57 5.2
72.76 65.5 70.25
2.09 -2.31 -3.05
Remark:
CA Type Changed paid up share Paid up share Par
Market Alert (Latest)
No Information Found
Source: SETSMART (Copyright © The Stock Exchange of Thailand)
Trading Sign Posted Date Lifted Date
No Information Found
Trading Sign (Latest)
Information only PP, PO, XR and XD Only Preferred Share and Warrants
Capital Movement (Last 3 Year) Other Securities
Date Securities Name -
No Information Found
Avg. Inventory Period (Days)
A/P Turnover (Times)
Avg. Payment Period (Days)
Cash Cycle (Days)
Presented and calculated from the consolidated statement and displayed as cumulative quarterly statement by fiscal year (Company
statement will be presented and calculated incase consolidated statement is not available.)
Information on the financial statements is presented according to the information that the listed companies submit on that period. The
investors should study additional information from the companies' financial statements since some companies may restate the comparing
financial statements on the latest financial statements.
Annualized
Cash Cycle
A/R Turnover (Times)
Avg. Collection Period (Days)
Inventory Turnover (Times)
Growth Rate (%)
Sales Growth
COGs Growth
Total Revenue Growth
Total Expense Growth
Net Profit Growth
Total Asset Turnover (X)
Gross Profit Margin (%)
EBIT Margin (%)
Net Profit Margin (%)
Annualized: ROE, ROA
Ratios
Current Ratio (X)
ROE (%)
ROA (%)
D/E (X)
EPS (B.)
Statement of Cash Flow (MB.)
Operating Cash Flow
Investing Cash Flow
Financing Cash Flow
Net Cash Flow
SG&A
Total Expenses
EBITDA
Depre. & Amor.
EBIT
Net Profit
Minority Interest
Statement of Comprehensive Income (MB.)
Sales
Other Income
Total Revenues
COGs
Paid-Up Capital
Premium (Discount) on Share Capital
Other Surplus (Deficit)
Retained Earnings (Deficit)
Treasury Stock
Shareholders' Equity
A/P Net
Current portion of LT
Current Liabilities
Non-Current Liabilities
Total Liabilities
Authorized Capital
A/R Net
Inventories
Current Assets
PP&E Net
Total Assets
OD
MR. EKKASIT CHUTHAMSATID / KPMG PHOOMCHAI AUDIT LIMITED
MISS ORAWAN SIRIRATTANAWONG / KPMG PHOOMCHAI AUDIT LIMITED
Financial Data
Statement of Financial Position (MB.)
Cash
-
MR. SAKDA KAOTHANTHONG / KPMG PHOOMCHAI AUDIT LIMITED F/S Year ended 31/12
01/07/2015 - 31/12/2015
01/01/2015 - 30/06/2015
01/01/2014 - 31/12/2014
Operation Period
01/07/2016 - 31/12/2016
01/01/2016 - 30/06/2016
Dividend Policy Minimum of 50% of net profit after tax and statutory reserve (with additional conditions)
Dividend (Last 3 Year)
Price Change (%)
Dividend Yield (%)
Payout Ratio
Beta
Rate of Return
Mrs. CHANISA CHUTIPAT INDEPENDENT DIRECTOR / AUDIT COMMITTEE Turnover Ratio (%)
POL. MAJ. GEN. NOPSAK POOVATANASEDJ INDEPENDENT DIRECTOR Value Trade/Day (MB.)
Mr. WISAN WUTHISAKSILP INDEPENDENT DIRECTOR P/BV (X)
Mr. SUCHAT BOONBANJERDSRI INDEPENDENT DIRECTOR / CHAIRMAN OF THE AUDIT P/E (X)
Mr. SOMBOON GURDLIN DIRECTOR Price (B./share)
Mr. CHAISAK ANGKASUWAN INDEPENDENT DIRECTOR / AUDIT COMMITTEE BVPS (B./Share)
Mr. SOMCHAI THAISANGUANVORAKUN CHAIRMAN OF THE EXECUTIVE COMMITTEE / Par Value (B.)
Mr. SAMITT PALITAGRAM MANAGING DIRECTOR / DIRECTOR Market Cap (MB.)
StatisticsManagement Position
Mr. SATIT CHANJAVANAKUL CHAIRMAN OF THE BOARD OF DIRECTORS / Listed share (M.)
HSBC (SINGAPORE) NOMINEES PTE LTD Turnover Ratio (%)
นำย ชยัวฒัน ์วชิชำวธุ
นำย สชุำต ิจรยิกชกร Accumulated: Turnover Ratio, Value Trade/Day
6 Months
ASIA INVESTMENT PARTNERS LIMITED YTD
น.ส. สนินีำรถ ไทยสงวนวรกลุ P/E (X)
นำย พทัิกษ์ พเิศษสทิธิ์ P/BV (X)
Top 10 Major Shareholders (@ 22/02/2017) Price Performance (Adjusted Price)
บรษัิท เอสเอ็นซ ีโฮลดิง้ จ ำกัด 5 Days
บรษัิท ไทยเอ็นวดีอีำร ์จ ำกัด 1 Month
นำย สมชยั ไทยสงวนวรกลุ 3 Months
นำย อนุชำ กจิธนำมงคลชยั
% / Shareholders
Foreign Shareholders
NVDR Shareholders
The Company and subsidiaries are principally engaged in the production of component parts for air-conditioners for automobile and cooling machines and contract
Free Float 18/02/2016 19/02/2015
Current Market/Industry/Sector SET / Industrials / Industrial Materials & Machinery
Business Type
Effective Date 03/07/2006
Previous Market/Industry/Sector SET / Technology / Electrical Products and Computer
Last Par Change N/A
Market/Industry/Sector Change
IPO Financial Advisory ASIA PLUS GROUP HOLDINGS PUBLIC COMPANY LIMITED
Par 1.00 Baht
Annual Report 2016
Establish Date
IPO Price (Baht) @ Par 1.00 Baht
Fax 0-2108-0367-8
URL http://www.sncformer.com
Company Profile
Address 333/3 Moo 6, Bangpreang District, Amphur Bangbo Samut Prakarn 10560
Telephone 0-2108-0360-6
Financial Statement Yearly 2016 (Audited)
Dividend payment and AGM No.23/2017
Operating Result Yearly Ending 31 Dec 2016
9.4
News 3 Yr Performance
Subject
Transportation provided for the AGM No. 23/2017
Publication of the invitation letter for the Annual General Meeting of shareholders No. 23/2017
16.7 17.70 / 12.70 287.78 4,805.88 7,105.40 755.62
Price (B.) 52 week High/Low Paid-up (MB.) Market Cap (MB.) EV (MB.) EBITDA (MB.) EV/EBITDA
SNC
Industrials / Industrial Materials & Machinery
SET
SNC FORMER PUBLIC COMPANY LIMITED

CG Report: -
P/E (X) P/BV (X)101.34 3.2
Date/Time
20/03/2017 19:4614/03/2017 18:2914/03/2017 18:2808/03/17 18:1906/03/17 17:38
20/12/1994 Listed Date 19/04/20054.9
51.45% 15,783 51.10% 10,5152.45% @ 24/03/2017 Foreign Limit 49.00%1.79% @ 24/03/2017
Share %
Compare to Stock
(%)
Compare to Sector
(%)
Compare to Market
(%)
1 5,631,494,736 20.59 5.51 4.23 4.67
2 2,821,682,328 10.32 -0.74 -1.22 -1.3
3 2,109,331,614 7.71 -12.42 -15.84 -15.95
4 1,952,269,459 7.14 -11.26 -20.8 -15.81
5 1,130,490,047 4.13 -11.84 -13.45 -13.55
6 1,023,880,846 3.74 101.34 13.97 17.36
7 799,953,124 2.92 3.2 1.47 1.93
8 721,000,000 2.64 0.22 0.08 0.29
9 622,721,098 2.2810 540,950,612 1.98
YTD 2016 2015 24/03/2017 30/12/2016 30/12/2015
1 27,349.46 27,349.46 27,349.462 0.1 0.1 0.13 36,648.27 41,571.18 31,998.874 1.34 1.52 1.175 0.42 0.42 0.35
3.2 3.66 3.8101.34 N/A N/A16.16 171.7 121.11
109.67 305.44 242.141.83 1.35 1.21
YTD 2016 2015 -11.84 29.91 -31.09
N/A N/A N/AN/A N/A N/A
Dividend/Shar
e Unit Payment Date Type
Auditor(Effective Until
31/12/2017)
Latest Type of Report Unqualified opinion with an emphasis of matters
2016 2015 2014 2013 (01/01/16 - 31/12/16) (01/01/15 - 31/12/15) (01/01/14 - 31/12/14) (01/01/13 - 31/12/13)
146.47 844.06 135.21 353.931,290.96 2,563.28 847.94 263.98
1.13 1.97 1.93 0.891,682.73 3,507.54 2,670.20 673.71
39,550.13 28,981.87 1,901.58 53.8
48,059.79 39,440.10 5,203.35 746.76
906.02 439.39 29.87 -5,030.89 10,999.36 207.75 132,548.99 1,121.76 100.45 0.949,266.29 13,278.89 453.85 16.85
24,097.60 13,913.23 519.22 6.06
33,363.89 27,192.12 973.07 22.91
3,137.41 3,137.41 2,630.60 1,679.112,734.95 2,734.95 2,014.93 975.299,763.54 9,763.54 2,900.21 345.39
- - - --1,053.02 -1,415.44 -703.02 -613.47
- - - -
11,445.15 11,083.05 4,212.11 707.21
3,250.75 1,164.93 18.17 16.652016 2015 2014 2013
(01/01/16 - 31/12/16) (01/01/15 - 31/12/15) (01/01/14 - 31/12/14) (01/01/13 - 31/12/13) 3,448.79 396.22 205.05 91.04
267.38 12.89 18.32 17.94
3,802.04 409.11 223.37 108.98
1,556.31 223.26 128.43 61.66538.72 762.21 145.62 29.83
2,095.03 989.58 274.05 91.48
3,079.26 -443.49 12.37 30.761,372.25 136.98 63.05 13.261,707.00 -580.47 -50.68 17.5
361.62 -712.52 -89.55 62.16
0.01 -0.03 -0.01 0.092016 2015 2014 2013
(01/01/16 - 31/12/16) (01/01/15 - 31/12/15) (01/01/14 - 31/12/14) (01/01/13 - 31/12/13) 3,318.87 -2,861.44 -2,525.03 -303.7
-16,669.09 -20,011.74 -1,727.69 473.3612,649.91 23,582.04 4,034.00 155.32
-700.31 708.86 -218.72 324.97
2016 2015 2014 0.18 0.26 5.883.21 -9.32 -3.643.9 -2.6 -1.7
2.92 2.45 0.230.09 0.02 0.08
54.87 43.65 37.3744.9 -141.88 -22.699.51 -174.16 -40.09
2016 2015 2014 770.42 93.23 125.23597.1 73.83 108.3
829.34 83.15 104.96111.71 261.1 199.56
N/A N/A N/A
2016 2015 2014 1.79 0.23 0.37
203.96 1,571.20 989.621,005.57 114.43 90.94
0.36 3.19 4.010.19 0.04 1.16
1,879.78 9,161.22 313.69-1,675.46 -7,586.83 679.95
Remark:
CA Type Changed paid up share Paid up share Par
XR 1,007,391,465 21,223,170,936 0.1XR 335,816,430 2,014,925,322 1PP 218,447,643 1,679,108,892 1PP 122,697,800 1,460,661,249 1PP 135,512,187 1,337,963,449 1PP 45,000,000 1,202,451,262 1PP 46,500,000 1,157,451,262 1PP 135,658,915 1,110,951,262 1
Source: SETSMART (Copyright © The Stock Exchange of Thailand)
Market Alert (Latest)Cash Balance 11/07/2016 - 29/07/2016
Trading Sign Posted Date Lifted DateNo Information Found
Trading Sign (Latest)
08/04/1421/03/201419/02/2014
19/05/201414/05/201422/04/2014
Only Preferred Share and WarrantsCapital Movement (Last 3 Year) Other Securities
Date Securities Name SUPER-W3
27/03/201522/08/2014
A/P Turnover (Times)Avg. Payment Period (Days)Cash Cycle (Days)
Presented and calculated from the consolidated statement and displayed as cumulative quarterly statement by fiscal year (Company statement will be presented
and calculated incase consolidated statement is not available.)
Information on the financial statements is presented according to the information that the listed companies submit on that period. The investors should study
additional information from the companies' financial statements since some companies may restate the comparing financial statements on the latest financial
statements.Information only PP, PO, XR and XD
Annualized
Cash CycleA/R Turnover (Times)Avg. Collection Period (Days)Inventory Turnover (Times)Avg. Inventory Period (Days)
Sales GrowthCOGs GrowthTotal Revenue GrowthTotal Expense GrowthNet Profit Growth
Gross Profit Margin (%)
EBIT Margin (%)Net Profit Margin (%)
Growth Rate (%)
RatiosCurrent Ratio (X)ROE (%)ROA (%)D/E (X)Total Asset Turnover (X)
Statement of Cash Flow (MB.)
Operating Cash FlowInvesting Cash FlowFinancing Cash Flow
Net Cash FlowAnnualized: ROE, ROA
Total Expenses
EBITDADepre. & Amor.EBIT
Net Profit
EPS (B.)
Statement of Comprehensive Income (MB.)
SalesOther Income
Total Revenues
COGsSG&A
Premium (Discount) on Share CapitalOther Surplus (Deficit)Retained Earnings (Deficit)Treasury Stock
Shareholders' Equity
Minority Interest
Current portion of LTCurrent LiabilitiesNon-Current Liabilities
Total Liabilities
Authorized CapitalPaid-Up Capital
InventoriesCurrent AssetsPP&E Net
Total Assets
ODA/P Net
MR. SUPHAMIT TECHAMONTRIKUL / DELOITTE TOUCHE TOHMATSU JAIYOS AUDIT CO., LTD.
Financial Data
Statement of Financial Position (MB.)
CashA/R Net
MRS. NISAKORN SONGMANEE / DELOITTE TOUCHE TOHMATSU JAIYOS AUDIT CO., LTD. F/S Year ended 31/12
MR. CHOOPONG SURACHUTIKARN / DELOITTE TOUCHE TOHMATSU JAIYOS AUDIT CO., LTD.MR. CHAVALA TIENPASERTKIJ / DELOITTE TOUCHE TOHMATSU JAIYOS AUDIT CO., LTD.
Dividend (Last 3 Year)
Operation PeriodNo Information Found
Payout RatioDividend Policy Not more than 50 percent of net profit of separate financial statements for each accounting period after deducting legal reserves and accumulated losses and may not be necessary in others
Rate of ReturnPrice Change (%)Dividend Yield (%)
Value Trade/Day (MB.)Beta
P/BV (X)P/E (X)Turnover Ratio (%)
Miss VANIDA MAJJIMANONDA INDEPENDENT DIRECTOR / VICE CHAIRMAN OF Price (B./share)Mrs. TEERAWADEE SANESESTA INDEPENDENT DIRECTOR / AUDIT COMMITTEE BVPS (B./Share)
Mr. KAMTORN UDOMRITTHIRUJ VICE CHAIRMAN OF THE BOARD / INDEPENDENT Par Value (B.)Miss WARINTHIP CHAISUNGKA DIRECTOR Market Cap (MB.)
StatisticsManagement Position
Mr. JORMSUP LOCHAYA CHAIRMAN OF THE BOARD / MANAGING DIRECTOR Listed share (M.)
นำย กลุทปี พชิติสงิห์ Turnover Ratio (%)
นำย ก ำธร กติตอิสิรำนนท์บรษัิท แอ็ดวำนซ ์แอสเซท แมเนจเมนท ์เซอรว์สิ จ ำกดั Accumulated: Turnover Ratio, Value Trade/Day
6 Months
นำง ดำรำณี อตัตะนันทน์ YTD
น.ส. เจนจริำ กติตอิสิรำนนท์ P/E (X)
น.ส. นันทดิำ กติตอิสิรำนนท์ P/BV (X)
Top 10 Major Shareholders (@ 17/03/2016) Price Performance (Adjusted Price)
บรษัิท สุวนิทวงศ ์โกลด ์แอสเซท็ จ ำกดั 5 Days
นำย ประเดช กติตอิสิรำนนท์ 1 Month
บรษัิท ดดี ีมำรท์ โฮลดิง้ จ ำกดั 3 Months
นำย จอมทรัพย ์โลจำยะ
% / ShareholdersForeign ShareholdersNVDR Shareholders
Free Float 17/03/2016 17/03/2015
Business TypeNow , Superblock PCL. (?SUPER?) is an investment to holds shares in the any company (Holding Company), that?s invested in two business as follows:1. Solar power business the investment and
Previous Market/Industry/Sector SET / Property & Construction / Construction MaterialsCurrent Market/Industry/Sector SET / Resources / Energy & Utilities
Market/Industry/Sector ChangeEffective Date 02/07/2015
Par 0.10 BahtLast Par Change Old 1.00 : New 0.10 @ 03/03/2015
Establish DateIPO Price (Baht) @ Par 1.00 BahtIPO Financial Advisory TRINITY ADVISORY 2001 CO., LTD.
Fax 0-2361-5036
URL http://www.superblockthailand.com
Company Profile
Address 223/61 Country Complex Tower A,14th Floor, Sumpawut Road, Bangna Bangkok 10260
Telephone 0-2361-5599
Resolution of the Board of Directors' Meeting No. 3/2017, the transfer of appropriated legal reserve and share premium to compensate the deficit of the Commercial Operation for government agencies and agricultural cooperatives 5.0 MWOmission of Dividend Payment, a transfer of share premium to compensate the deficit of the Company ,The issuance of debenturesand the Annual General
23.74
News 3 Yr PerformanceSubject
Resolution of the Board of Directors' Meeting No. 4/2017, the capital increase of subsidiaryOmission of Dividend Payment, the transfer of appropriated legal reserve and share premium to compensate the deficit,The issuance of debenturesand the
1.34 2.08 / 1.00 2,734.95 36,648.27 73,116.45 3,079.26
Price (B.) 52 week High/Low Paid-up (MB.) Market Cap (MB.) EV (MB.) EBITDA (MB.) EV/EBITDA
SUPERResources / Energy & UtilitiesSET100
SUPERBLOCK PUBLIC COMPANY LIMITED