ahd7287 rural and urban
TRANSCRIPT

aHD7287 • 82 United States . D5K3 Department of
Agriculture
Economic Research Service
Agriculture and Rural Econonny Division
Rural and Urban Housing, 1930-80 Ronald E. Kampe Gail D. Roman

RURAL AND URBAN HOUSING, 1930-80. By Ronald E. Kampe and Gail D. Roman. Agriculture and Rural Economy Division, Economic Research Service, U.S. Department of Agriculture. Staff Report No. AGES871210.
ABSTRACT
During 1930-80, the number of urban households increased about five times as fast as the number of rural households. Home ownership increased in both areas, but was more prevalent in rural areas. More blacks and other minorities lived in urban areas and owned their homes in 1980 compared with 1930. Rural housing has traditionally lagged urban housing in quality and amenities, but the gap narrowed considerably from 1930 to 1980. In 1980, the median rural home was newer than the median urban home, and had more rooms and fewer occupants.
Keywords: housing, rural, urban, housing costs, crowding.
This Chartbook, whi based on published Estimates may vary reporting units. Fo occupied housing,
rbán housing trends over five decades, is ¿rimarily from the decennial censuses,
le [because of nonresponse and different estimates reflect vacated as well as
imatet are based on occupied units only.
******************************************************
* This report was reproduced for limited distribution to the research * * commxinity outside the U.S. Department of Agriculture. * *********** ***********
1301 New York A\ Washington, DC Í )ecember 1988
11

CONTENTS
Page
Glossary iii Siiinmary iv Housing and the Population 1 The Quality of Available Housing 21 Housing Costs 45
GLOSSARY
Complete kitchen. Includes an installed sink with piped water, a range or a cookstove, and a mechanical refrigerator.
Complete plumbing. Includes hot and cold piped water, a sink and a flush toilet, and a bathtub or shower inside the structure for the exclusive use of the occupants.
Metro area. A county, or groups of contiguous counties, integrated according to certain social and economic criteria, with a city of 50,000 or more inhabitants; or two contiguous cities with a combined population of at least 50,000.
Nonmetro area. A county with no central city of 50,000 or more inhabitants and not part of a metro area.
Rural area. An area not classified as urban. Rural is not synonymous with nonmetro.
Urban area. A city or village of 2,500 or more inhabitants.
Ill

SUMMARY
During 1930-80, the number of urban households increased about five times as fast as the number of rural households. Homeownership increased in both areas, but was more prevalent in rural areas. More blacks and other minorities lived in urban areas and owned their homes in 1980 compared with 1930. Rural housing has traditionally lagged urban housing in quality and amenities, but the gap narrowed considerably from 1930 to 1980. In 1980, the median rural home was newer than the median urban home, and had more rooms and fewer occupants.
Rural and urban homes multiplied faster than population, accommodating smaller families and families that were either younger or older than those in the 1930*s. However, the median size of the urban household surpassed the median size of the rural household for the first time in 1980.
All races shared the explosive increase in homeownership in urban areas that began during the 1940*s. The biggest jumps in rural homeownership occurred during the I960's and 1970*s. Blacks increased their share of urban housing but decreased their share of rural housing. Asian households increased rapidly from 1960 to 1980, mainly in urban areas.
By almost every measurement, housing improved dramatically during 1930-80. Quality of structures and living conditions improved, as measured by plumbing and heating systems, kitchen facilities, and space per inhabitant. Lack of these amenities are problems of relatively few households.
Blacks and other minorities lagged whites in occupying adequate housing, and in owning their homes. Although much of the quality gap between urban and rural homes disappeared, rural homes continued to lag urban homes.
Compared with 1940, homes in 1980 were newer, had higher values and rented for more, had more rooms, more often were equipped with central heating, complete plumbing, and kitchens, and more often used convenient heating fuels (such as gas and fuel oil).
During the 1980*s, high home values and mortgage interest rates, accompanied by high rents, made owning or renting a home difficult for many lower income families. Housing costs for both owners and renters increased faster than incomes, and delinquency rates increased to historically high levels.
The 1949 National Housing Act set the goal of a decent home and suitable environment for every American family. Housing has always been a top priority for American families. The charts shown here of urban and rural housing trends illustrate that great strides have been made in reaching this goal after 1930. Solving the affordability problem will go far in addressing the problems that remain in achieving a decent home in a suitable environment for every American family.
IV

Rural and Urban Housing, 1930-80
Ronald E. Kampe Gail D. Roman
HOUSING AND THE POPULATION
Both the niimber of households and the population increased dramatically between 1930 and 1980. These measures grew considerably faster in urban areas than in rural areas.
The share of homeowners increased more than the share of renters in both urban and rural areas during 1930-80. Black, Hispanic, and Asian households lived mainly in urban areas. Rural households were mainly whites and American Indians. The share of household heads who were either younger (aged 25 and younger) or older (aged 65 and older) was greater in 1980 than in 1930, and households were more likely to be headed by a female.
The charts in this section illustrate that:
o The number of urban households grew almost five times as fast as the number of rural households, although part of the urban gains resulted from some rural areas being reclassified as urban areas.
o The size of households in both urban and rural areas decreased between 1930 and 1980. However, the median size of the urban household first surpassed that of the rural household in 1980.
o The low number of housing starts during the Great Depression and World War II was more than offset during the boom periods around 1950, 1970, and 1980. Breaking ground for the construction of a new, privately owned house constitutes a housing start.
o Homeownership increased in both urban and rural areas, except during the 1930's.
o Between 1930 and 1980, the proportion of homes occupied by whites declined in urban areas. In rural areas, whites retained their share of owned homes during this period and increased their share of rented homes.
o Blacks increased their share of urban housing and decreased their share of rural housing during 1930-80.
o Housing occupied by other minorities, mainly Asians, increased rapidly from 1960 to 1980, mainly in urban areas.
o Heads of household in 1980 were younger (aged 25 and younger) and older (aged 65 and older) than were heads of household in 1930.
o The proportion of households headed by women doubled between 1930 and 1980.
1

Population Climbed More Dramatically In Urban Areas
The number of households grew faster than population in both rural and urban areas from 1930 to 1980, and both grew faster in urban areas than in rural areas. Urban households increased 249 percent during this period, while population in urban areas increased 144 percent. In rural areas, households increased 58 percent, while population increased only 11 percent. Part of this urban gain and rural loss occurred because some rural areas were reclassified as urban areas.
Rural and urban population grew at about the same rate during the 1930's. But during the 1940's and 1950's, urban population increased dramatically compared with rural population, which fell below the 1930's level of 54 million. However, rural population slowly resumed growth in the I960's. During the 1970's, the 10-percent rural population growth nearly matched the 12-percent urban population growth.
Although many factors contributed to this rural growth turnaround, the completion of the interstate highway system opened rural areas to industrial development and extended urban commuting patterns into rural areas.
§ Urban population
_Rural population .
"CJrban households
Rural households
1930 —k—
1940 1
1990 I960 1970 1
19BO

Table l"Ho« lany people and households «ere in arban and rural areas?
Itei 1)30 1940 1950 1960 1970 1980
Urban: Population Households
lural: Population Households
Urban: Population Households
Rural: Population Households
68,954,823 17,372,524
53,820,223 12,532,139
7.9 16.6
6.4 13.8
Huiber
74,423,702 20,596,500
57,245,573 14,258,032
92,414,222 28,492,186
52,616,666 14,334,095
129,952,660 38,320,370
52,420,642 14,703,505
149,334,020 47,567,732
53,878,857 15,887,820
24.2 38.3
-8.1 .5
Percent change per decade
40.6 34.5
167,050,992 60,551,717
59,494,813 19,837,956
-.4 2.6
14.9 24.1
2.8 8.0
11.9 27.3
10.4 24.9
Source: U.S. Departient of Couerce, Bureau of the Census.

Household Size Decreased in Both Rurai and Urban Areas
Households were smaller in 1980 than in 1930, and urban households were smaller than rural households. The median household size decreased by about one person in both urban and rural areas from 1930 to 1980.
In 1930, the most common rural household contained six or more persons. By 1980, the typical rural household consisted of only two persons. Two-person households dominated in urban areas during 1930-80, while the percentage of urban households of six or more persons steadily declined.
Single-person households increased in both rural and urban areas, contributing to the lower household size. In 1930, 8 percent of all households in both rural and urban areas were single-person households. The percentage grew more in urban areas than in rural areas through 1980, when 25 percent of urban households and 17 percent of rural households were single-person households.
4.0T
1930 1940 1950 1960 1970 1980

Table 2-tfhat size «ere rural and urban households?
Itei 1930 1940 : 1950 : 1960 1970 : 1980
Mniber of households
Urban: 1 Person 1,396,650 1,671,300 2,838,526 5,684,858 9,051,766 14,933,061 2 : 4,363,754 5,441,258 8,340,199 10,865,551 14,015,667 18,910,563 3 3,844,186 4,800,597 6,727,191 7,295,948 8,163,606 10,334,844 4 3,149,934 3,800,367 5,287,354 6,574,645 7,253,927 6,643,040 5 2,015,526 2,270,674 2,812,741 4,087,575 4,498,811 4,327,963 6 or lore 2,602,474 2,612,304 2,486,175 3,811,793 4,583,395 3,202,226 Total
Households 17,372,524 20,596,500 28,492,186 38,320,370 47,567,372 60,551,717 Median Ho. Persons 3.2 3.2 3.0 2.9 2.6 2.3
Rural: 1 Person 960,813 1,005,981 1,154,873 1,390,113 2,098,897 3,314,475 2 2,619,081 3,169,203 3,682,666 3,993,195 4,766,765 6,265,024 3 2,382,333 2,995,571 3,035,340 2,711,230 2,744,046 3,637,639 4 2,084,762 2,524,156 2,590,709 2,555,802 2,545,826 3,528,361 5 1,558,836 1,741,851 1,653,551 1,790,492 1,698,303 1,792,626 6 or lore : 2,926,314 2,801,268 2,216,756 2,262,673 2,023,963 1,299,831 Total
Households 12,532,139 14,258,032 14,334,095 14,703,505 15,877,820 19,837,956 Median No. Persons 3.7 3.5 3.3 3.2 2.9 2.6
Percent of households Urban:
1 Person 8.0 8.1 10.0 14.8 19.0 24.7 2 25.1 26.4 29.3 28.4 29.5 31.2 3 : 22.1 23.3 23.6 19.0 17.2 17.1 4 18.1 16.5 16.6 17.2 15.2 14.6 5 : 11.6 11.0 9.9 10.7 9.5 7.1 6 or lore 15.0 12.7 6.7 9.9 9.6 5.3
Rural: 1 Person 7.7 7.1 8.1 9.5 13.2 16.7 2 20.9 22.4 25.7 27.2 30.0 31.6 3 : 19.0 21.0 21.2 18.4 17.3 If.3 4 16.6 17.7 16.1 17.4 16.0 17.8 5 : 12.4 12.2 11.5 12.2 10.7 9.0 6 or lore 23.4 19.6 15.5 15.4 12.7 6.6
Source: U.S. Departnent of Cooaerce, Bureau of the Census.

Privately Owned Housing Starts Rose, Especiaily in Urban Areas
Breaking ground for the construction of a new, privately owned house constitutes a housing start. Housing starts in rural and urban areas during 1930-40 and in metro and nonmetro areas during 1960-80 followed similar trends. Annual housing starts decreased during the Great Depression years of the 1930's, but rallied to about 600,000 starts by the early 1940's when World War II caused another drop in annual housing starts to fewer than 150,000. After World War II, housing starts increased rapidly and reached a record 1.9 million in 1950. In 1972, the existing record of 2.4 million starts was established.
During the I960's and 1970's, nonmetro starts ranged between 27 percent and 32 percent of all housing starts. Part of this reduction may have resulted from the reclassification of some faster growing nonmetro areas as metro areas.
M Urban-ü
o Rural4i
M M
X X X XK
111111
x^ K <
xx o
I I I I I I I I I I I I I I I I I I I I I I I I I I I I I I I I
1930 1Q4-0 1950 1960 1970
*Rural/UrbQn.1Q30-40: M«tro/Nonm«tro.1 «60-00j eth«r yarm unovotlabl«
■» I I I I I 1980

Table 3-How lany privately owned houses were started each year?
Year Total Urban : Rural Year Total Hetrol/ : Honietroi/
1,000 houses 1,000 houses
1930 330.0 236.0 94.0 1960 1,230.1 863.0 367.1 1931 : 254.0 174.0 80.0 1961 1,284.8 912.1 372.7 1932 134.0 64.0 70.0 1962 1,439.0 1,033.0 406.0 1933 93.0 45.0 48.0 1963 1,581.7 1,126.6 455.0 1934 126.0 49.0 77.0 1964 . 1,530.4 1,098.5 431.9 1935 : 215.7 112.6 103.1 1965 1,472.8 1,011.9 460.9 1936 . 304.2 197.6 106.6 1966 : 1,164.8 787.7 377.1 1937 332.4 214.4 118.0 1967 1,291.6 902.9 388.7 1938 : 399.3 255.3 144.0 1968 : 1,507.6 1,096.4 411.2 1939 458.4 303.5 154.9 1969 1,466.7 1,078.7 388.0 1940 : 529.6 333.2 196.4 1970 : 1,433.6 1,017.9 415.7 1941 619.5 369.5 250.0 1971 2,052.2 1,501.8 550.4 1942 : 301.2 184.9 116.3 1972 : 2,356.6 1,720.4 636.2 1943 183.7 119.7 64.0 1973 2,045.3 1,495.4 549.9 1944 ■ 138.7 93.2 45.5 1974 : 1,337.8 922.5 415.3 1945 325.0 H/A N/A 1975 1,160.4 760.3 400.1 1946 : 1,015.0 N/A N/A 1976 : 1,537.6 1,043.5 494.1 1947 1,265.0 N/A N/A 1977 1,987.1 1,377.3 609.8 1948 : 1,344.0 N/A N/A 1978 : 2,020.3 1,432.1 588.2 1949 1,430.0 N/A N/A 1979 1,745.2 1,240.6 504.6 1950 : 1,908.0 N/A N/A 1980 : 1,292.3 913.6 378.7 1951 1,420.0 N/A N/A 1952 : 1,446.0 N/A H/A 1953 1,402.0 N/A N/A 1954 : 1,532.0 N/A N/A 1955 1,627.0 N/A H/A 1956 : 1,325.0 N/A H/A 1957 1,175.0 N/A H/A 1958 : 1,314.0 N/A H/A 1959 1,494.6 1,054.0 440.6
N/A = Not available.
y Urban and rural classification changed to letro and nonietro classification beginning in 1959.
Source: U.S. Departnent of Coiierce, Bureau of the Census.

Rural Residents Were More Likely to Own Their Homes
Homeownership increased In both urban and rural areas in all decades except the 1930's. Homeownership is more prevalent in rural areas than in urban areas because more homes in rural areas are detached, single-family houses that are more readily owned by the occupant than are multifamily structures. Following a drop in homeownership during the 1930's that resulted from the Depression, the percentage of owned homes increased beginning in the 1940's. The increase was most rapid in the 1940's in both urban and rural areas, and increased at a more moderate rate thereafter.
Urban owned
Rufxil owned
1930 1940 1950 1960 1970 1980

Table 4--How lany hoies were owned or rented?
Itei 1930 1940 : 1950 : 1960 1970 : 1980
Ruiber of hoies
Urban: Ovned 7,432,554 7,714,960 14,376,594 22,334,781 27,785,109 35,946,411 Rented 9,681,359 12,881,540 14,115,592 15,985,589 19,782,623 24,605,306 Total 17,113,913 20,596,500 28,492,186 38,320,370 47,567,732 60,551,717
Rural: Otined 6,569,520 7,480,803 9,183,372 10,461,939 12,100,436 15,848,134 Rented 5,638,45B 6,777,229 5,150,723 4,241,566 3,777,384 3,989,822 Total : 12,207,978 14,258,032 14,334,095 14,703,505
Percent
15,877,820 19,837,956
Urban: Owned 43.4 37.5 50.5 58.3 58.4 59.4 Rented 56.6 62.5 49.5 41.7 41.6 40.6
Rural: Owned 53.8 52.5 64.1 71.2 76.2 79.9 Rented 46.2 47,5 35.9 28.8 23.8 20.1
Source: U.S. Departient of Coiierce, Bureau of the Census.

Black-Occupied Units Decreased in Rurai Areas and increased in Urban Areas
From 1930 to 1980, white-occupied households lost some of their share of homes in urban areas to minorities, mainly blacks that had migrated from the rural South to urban areas. During the same period, however, the share of rural housing occupied by whites increased.
Blacks increased their share of urban housing from 7.6 percent in 1930 to 12.1 percent in 1980. During the same period, the share of rural housing occupied by blacks decreased from 11.7 percent to 5.3 percent. Housing of other minorities, mainly Asians and others, was only a small percentage prior to their population expansion in the United States in the I960's. Although expansion occurred in both urban and rural areas, that in urban areas was more
rapid.
Table 5--H0W lany units were occupied by whites, blacks, and other linority households?
itei 1930
Urban: : Hhite 15,779,013 Black 1,294,383 Other 40,517
Total 17,113,913
Rural: Hhite 10,713,243 Black 1,425,479 Other 69,256
Total : 12,207,976
Urban: Hhite 92.2 Black 7.6 Other .2
Rural: Hhite 87.8 Black : 11.7 other .6
1940 1950 1960 1970
Nuiber of households
1960
18,868,480 1,671,667
56,133 20,596,500
26,000,960 2,417,346
73,878 26,492,186
34,342,040 3,716,516 261,814
38,320,370
41,755,348 5,216,926 590,407
47,562,681
50,407,924 7,320,420 2,823,373 60,551,717
12,692,646 1,464,656
80,728 14,258,032
13,042,635 1,216,132
75,328 14,334,095
13,537,776 1,052,442 113,287
14,703,505
Percent
14,774,026 963,334 149,706
15,667,066
18,402,199 1,061,248 374,509
19,837,956
91.6 8.1 .3
91.3 8.5 .3
89.6 9.7 .7
87.8 11.0 1.2
83.2 12.1 4.7
89.0 10.4
.6
91.0 6.5 .5
92.1 7.2 .8
93.0 6.1 .9
92.8 5.3 1.9
Source: U.S. Departient of Coiierce, Bureau of the Census.
10

Black-Occupied Units Decreased in Rural Areas and Increased in Urban Areas
IOOT
TO..
10--
IOOT
TO..
to«-
m
Urban
^
i
m
I
^ 1930 104O 1950 I960 1970
Rural
1
<^
1
m i^
1 i ■
1930 1940 1900 I960
il
m 1980
1
^ 1970 1980
Other
Black
White
Other
Black
White

Racial Patterns of Homeownership Were Vastly Different in Rural and Urban Areas
Between 1930 and 1980, the proportion of urban whites that owned homes was greater than that for urban blacks or other minorities. Beginning with the I960's, the share of other minorities' homes :hat were owned surpassed the share for urban blacks. By 1980, however, the gap had converged. The pattern of ownership by race is dramatically different in rural areas. In the early decades, rural homeownership by other minorities equaled or surpassed that of rural whites, dropping in the 1950's. Black homeownership in rural areas started a steady rise after 1960, reaching its peak in 1980.
12

Racial Patterns of Homeownership Were Vastly Different In Rural and Urt>an Areas
TO--
10-•
Urban
TO--
10--
CZ] Oth^r
BiQok
White
1930 1Q40 1950 I960 1970 1980
Rural
1930 1940 1950 I960 1970 1980
13

Table 6--Ho\í iiany whites, blacks, and other ainorities owned or rented their urban hones?
Itei 1930 : 1940 1950 : 1960 : 1970 : 1980
Huiber «bites: Owned 7,112,277 7,372,835 13,566,716 20,894,518 25,505,971 31,785,642
Rented S,66,736 11,495,645 12,434,244 13,447,522 16,249,377 18,622,282
Total : 15,779,013 18,868,480 26,000,960 34,342,040 41,755,348 50,407,924
Blacks: ONned 315,584 333,467 787,489 1,340,885 2,023,119 2,997,731
Rented 978,799 1,338,420 1,629,859 2,375,631 3,193,807 4,322,689
Total • 1,294,383 1,671,887 2,417,348 3,716,516 5,216,926 7,320,420
Otber linorities Owned 4,693 8,658 22,389 99,378 249,000 1,163,038
Rented 35,824 47,475 51,489 162,436 341,407 1,660,335
Total 40,517 56,133 73,878 261,814 590,407 2,823,373
Percent
Hbites: Owned 45.0 39.1 JZ i ¿ 60.8 61.1 62.1
Rented : 55.0 60.9 47.8 39.2 38.9 36.9
Blacks: Owned 24.4 20.0 j¿ I b 36.1 38.8 41.0
Rented 75.6 80.0 67.4 63.9 61.2 59.0
Other ■inorities Owned 11.6 15.4 JO • J 38.0 42.2 41.2
Rented 88.4 84.6 69.7 62.0 57.6 58.8
Source: D.S. Departient of Coiierce, Bureau of the Census.
14

Table 7--H0V lany vhites, blacks, and other línoríties ovned or rented their rural hoies?
Itei 1930 1940 : 1950 *: 1960 : 1970 : 1980
«bites: Nuibei
Owned Rented Total
: 6,176,152 : 4,537,091 : 10,713,243
7,045,257 5,647,389
12,692,646
8,674,254 4,368,381
13,042,635
9,928,676 3,609,100
13,537,776
11,472,680 3,301,346
14,774,026
14,885,133 3,517,066
18,402,199
Blacks: Owned Rented Total
354,061 : 1,071,418
1,425,479
386,304 1,098,354 1,484,658
464,614 751,518
1,216,132
472,471 579,971
1,052,442
544,801 418,533 963,334
726,520 334,728
1,061,248
Other linorities Owned Rented Total :
39,307 29,949 69,256
49,242 31,486 80,728
44,504 30,824 75,328
Percent
60,792 52,495
113,287
89,609 60,097
149,706
236,481 138,028 374,509
Vhites: Owned Rented
57.6 42.4
55.5 44.5
66.5 33.5
73.3 26.7
77.7 22.3
80.9 19.1
Blacks: : Owned Rented
24.8 75.2
26.0 74.0
38.2 61.8
44.9 55.1
56.6 43.4
68.5 31.5
Other : linorities: Owned Rented :
56.8 43.2
61.0 39.0
59.1 40.9
53.7 46.3
59.9 40.1
63.1 36.9
Source: U.S. Departient of Couerce, Bureau of the Census.
15

Percentage of Older Household Heads Grew Steadily
A larger percentage of heads of household in 1980 were younger (under 25 years old) and older (65 years old or older) than in 1930. Younger households increased from 4 percent of urban and 6 percent of rural households in 1930 to 9 percent of urban and 7 percent of rural households in 1980. Older households increased from 8 percent of urban and 11 percent of rural households in 1930 to 20 and 21 percent during the same period. One in five heads of household were age 55 or older in 1980.
The combined total of younger and older household heads accounted for 12 percent of urban households and 17 percent of rural households in 1930. By 1980, these proportions had more than doubled--to 29 percent for urban heads and to 28 percent for rural heads.
I»-*
10--
Rural 65 and over
Urban 65 and over
Rural less than 25
—1_
1930 1940 1950 •— I960 1970
1— 1980
16

Table 8--H0W old were the beads of household?
Location and age ; 1930 1/ 1940 1950 : 1960 1970 1980
Nuiber
Urban: Under 25 612,201 713,232 1,319,775 2,035,297 3,735,975 5,392,388 25-34 : 3,500,898 4,122,488 5,895,425 7,194,624 8,887,032 14,101,711 35-44 4,269,793 5,032,678 6,451,065 8,554,098 8,808,428 10,228,611 45-64 ; 5,171,499 8,147,277 10,491,255 14,049,390 17,232,224 18,840,954 65 or lore 1,153,653 2,632,757 4,026,050 6,487,012 8,899,022 11,988,053
Total 14,708,044 20,648,432 28,183,570 38,320,421 47,562,681 60,551,717
Rural; Under 25 653,855 659,622 693,890 663,448 897,618 1,316,475 25-34 2,377,813 2,886,984 2,784,720 2,572,667 2,755,703 4,248,968 35-44 2,812,598 3,132,157 3,159,665 3,152,687 2,967,222 3,719,825 45-64 4,252,567 5,419,966 5,028,000 5,509,682 5,926,114 6,406,752 65 or lore: 1,288,539 2,201,505 2,401,570 2,805,030 3,340,409 4,145,916
Total 11,385,372 14,300,234 14,067,845
Percent
14,703,514 15,887,066 19,837,936
Urban: Under 25 : 4.2 3.5 4.7 5.3 7.9 8.9 25-34 23.8 20.0 20.9 18.8 18.7 23.3 35-44 29.0 24.4 22.9 22.3 18.5 16.9 45-64 35.2 39.5 37.2 36.7 36.2 31.1 65 or lore; 7.8 12.8 14.3 16.9 18.7 19.8
Rural; Under 25 ; 5.7 4.6 4.9 4.5 5.6 6.6 25-34 20.9 20.2 19.8 17.5 17.3 21.4 35-44 24.7 21.9 22.5 21.4 18.7 18.8 45-64 37,4 37.9 35.7 37.5 37.3 32.3 65 or lore; 11.3 15.4 17.1 19.1 21.0 20.9
y Male heads only.
Source: U.S. Departnent of Coiierce, Bureau of the Census.
17

Incidence of Female-Headed Households on the Rise
The share of households headed by women doubled between 1930 and 1980, and women-headed households were more prevalent in urban areas than in rural areas. Men have continued to head households more often than women over the decades. However, with the trend toward more single-parent and individual households, households headed by women have increased dramatically.
Households headed by women in urban areas increased 606 percent from 1930 to 1980, while households headed by men increased 184 percent. The increase was not as great in rural areas, but again, the number of women heading households increased faster (234 percent) than the number of men (41 percent).
•«T
1030 1940 19SO 1960 1970 1980
18

Table 9--H0V lany households were headed by fenales or nales?
Itei : 1930 1940 : 1950 : 1960 1970 : 1980
Nuiber of households
Urban: Male Feiale Total
14,720,340 : 2,652,184
17,372,524
16,916,050 3,732,382
20,648,432
23,252,480 4,931,090
28,183,570
30,928,421 7,392,000
38,320,421
36,553,872 11,013,497 47,567,369
41,831,074 18,720,643 60,551,717
Rural: Male Feiale Total
11,391,421 : 1,140,718
12,532,139
12,763,668 1,536,566
14,300,234
12,610,420 1,457,425
14,067,845
12,944,649 1,758,865
14,703,514
Percent
13,545,374 2,341,692
15,887,066
16,031,846 3,806,110
19,837,956
Urban: Male feiale
84.7 15.3
81.9 18.1
82.5 17.5
80.7 19.3
76.8 23.2
69.1 30.9
Rural: Hale Feiale
90.9 9.1
89.3 10.7
89.6 10.4
88.0 12.0
85.3 14.7
80.8 19.2
Source: U.S. Departient of Coiierce, Bureau of the Census.
19

THE QUALITY OF AVAILABLE HOUSING
Homes were newer and larger, and were more often equipped with central heating units, complete plumbing, and complete kitchens in 1980 than in 1940. In 1980, homes were less likely to be crowded and heating fuels more likely to be convenient, easy-to-use fuels such as natural gas and fuel oil.
Charts in this section illustrate that:
o Homes were newer in 1980 than in 1940, and rural homes were newer than urban homes.
o Single-family structures were the most popular type of structure in both rural and urban areas, especially in rural areas.
o Homes had more rooms in 1980 than in 1940, and rural homes had more rooms than urban homes.
o More homes were equipped with warm air central heating in 1980 than in 1940.
o Natural gas was the most popular heating fuel in urban areas and fuel oil in rural areas in 1980, replacing coal and wood in 1940.
o Almost all homes now have complete plumbing and complete kitchens.
o Crowding, or an average of more than one person per room, in homes decreased dramatically, especially in rural areas.
21

Median Age of Housing Units Pealced at Midcentury
More homes were recently built in 1980 than in 1940, and rural homes were slightly newer in 1980 than urban homes. The proportion of rural homes more than 30 years old increased to a high of 45 percent by 1960, but declined to 36 percent by 1980, as many new homes were built and many older homes were abandoned or destroyed.
Urban homes were slightly older than rural homes in every decade studied except the 1970's. The number of urban homes more than 30 years old increased 11 million in 1950 to 1980, while that for rural homes increased less than 1 million during this period.
1940 1990 1960 1970 1980
22

Table IO--H0W old were rural and urban housing units?
Location and age 1940 : 1950 : 1960 : 1970 ': 1980
MuBber of units Urban:
0-5 years 1,215,295 3,365,835 5,769,459 6,008,549 7,367,522 6-10 : 977,927 2,154,140 5,505,168 6,009,254 7,816,069 11-20 5,488,337 3,303,470 5,880,565 11,422,906 13,175,682 21-30 3,784,521 6,464,445 4,460,240 6,752,688 12,170,545 31 or older 8,281,768 13,259,180 19,141,385 19,809,083 24,136,612
Total 1/ 19,747,848 28,547,070 40,756,817 50,002,480 64,666,430
Rural: 0-5 years 1,974,969 2,580,355 2,720,255 2,865,739 4,028,646 6-10 : 1,359,905 1,074,305 2,051,122 2,072,533 3,532,150 11-20 3,026,927 2,594,155 2,759,344 3,076,251 3,910,991 21-30 2,660,959 2,429,270 2,051,310 2,033,298 2,700,551 31 or older 5,893,731 7,004,690 7,979,449 7,648,783 7,919,949
Total 1/ : 14,916,491 15,682,775 17,561,480
Percent
17,696,604 22,092,287
Urban: 0-5 years 6.2 11.8 14.2 12.0 11.4 6-10 5.0 7.5 13.5 12.0 12.1 11-20 : 27.8 11.6 14.4 22.8 20.4 21-30 19.2 22.6 10.9 13.5 18.8 31 or older 41.9 46.4 47.0 39.6 37.3
Rural: 0-5 years 13.2 16.5 15.5 16.2 18.2 6-10 9.1 6.9 11.7 11.7 16.0 11-20 20.3 16.5 15.7 17.4 17.7 21-30 : 17.8 15.5 11.7 11.5 12.2 31 or older 39.5 44.7 45.4 43.2 35.8
1/ Indicates the total occupied and vacant housing units for which age was reported.
Source: U.S. Departnent of Coioerce, Bureau of the Census.
23

Single-Family Housing Units Predominate in Both Urban and Rural Areas
The single-family, detached home has always been predominant in rural areas, never accounting for less than 90 percent of all homes, including mobile homes. Since the 1940's, mobile homes have gained in popularity, especially in rural areas. In 1980, mobile homes totaled 12 percent of rural housing. The percentage of housing in mobile homes is lower in urban areas.
Less than half of urban homes were single-family units in the 1940's and 1950's. From 1960 to 1980, when they gained in popularity, single-family homes predominated. By 1980, almost 60 percent of urban homes were single- family homes.
Table ll--Vhat types of housing units were predoiinant in urban and rural areas?
Itei 1930 : 1940 1950 1960 : 1970 : 1980
Muiber of units Urban: 1-faiily 11,101,861 9,684,186 14,470,522 24,102,735 29,452,382 36,185,077 2-faiily 2,861,140 5,201,308 6,885,959 7,278,586 6,819,444 8,068,811 3-faiily or aore 3,509,523 6,654,056 8,038,114 9,000,538 12,919,754 18,724,101 Mobile N/A H/A 174,478 372,006 810,900 1,688,441 Total y 17,472,524 21,539,550 29,569,073 40,753,865 50,002,480 64,666,430
Rural: 1-faiily 11,831,249 14,046,451 14,645,176 16,000,611 15,348,302 17,410,509 2-faiily 595,034 1,098,150 1,214,423 840,840 614,333 826,715 3-faiily or lore 105,856 474,344 413,986 324,909 471,982 1,127,530 Mobile H/A H/A 140,740 394,559 1,261,987 2,727,533 Total 1/ 12,532,139 15,618,945 16,414,325 17,560,919
Percent
17,696,604 22,092,287
Urban: 1-faiily 63.3 45.0 48.9 59.1 58.9 56.0
2-faHily 16.5 24.1 23.3 17.9 13.6 12.5
3-faiily or tore 20.2 30.9 27.2 22.1 25.8 29.0
Mobile H/A H/A .6 .9 1.6 2.6
Rural: 1-faiily 94.4 89.9 89.2 91.1 86.7 78.8
2-faiily : 4.7 7.0 7.4 4.8 3.5 3.7 3-faiily or lore .8 3.0 2.5 1.9 2.7 5.1 Mobile H/A H/A .9 2.2 7.1 12.3
N/A ■- Hot available.
1/ Includes vacant units except units in 1930.
Source: U.S. Departient of Coiierce, Bureau of the Census.
24

Urban
Mobile
3-FamîIy or More
2-FamIly
1 -Family
1930 194-0 1Q50 1960 1970 1980
Rural
70--
40"
to--
11 I I
^
I I I
11
I 1
Mobile
3-FamIly or More
2-FamIly
1 -Family
1930 19^40 1950 1960 1970 1980
25
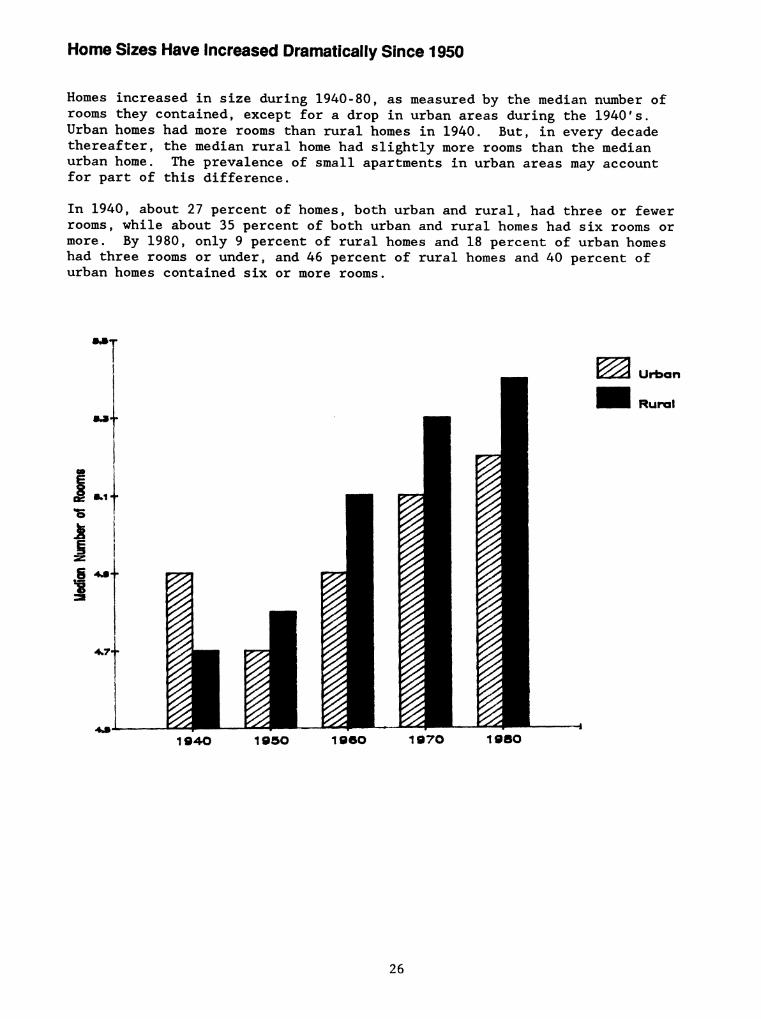
Home Sizes Have Increased Dramatically Since 1950
Homes increased in size during 1940-80, as measured by the median number of rooms they contained, except for a drop in urban areas during the 1940's. Urban homes had more rooms than rural homes in 1940. But, in every decade thereafter, the median rural home had slightly more rooms than the median urban home. The prevalence of small apartments in urban areas may account for part of this difference.
In 1940, about 27 percent of homes, both urban and rural, had three or fewer rooms, while about 35 percent of both urban and rural homes had six rooms or more. By 1980, only 9 percent of rural homes and 18 percent of urban homes had three rooms or under, and 46 percent of rural homes and 40 percent of urban homes contained six or more rooms.
MMT
1940 1950 1960 1970 1980
26

Table 12--H0W lany roois were in urban and rural housing units?
Itea 1940 1950 : 1960 : 1970 : 1980
Nuiber of units Urlian;
1-2 rooBs : 2,471,295 3,069,417 3,264,996 3,004,804 3,931,577 3 : 3,104,302 4,581,659 5,308,694 6,195,199 7,722,146 4 3,815,290 6,194,988 8,460,117 10,233,304 12,608,467 5 4,648,797 6,486,395 10,221,562 12,299,290 14,339,116 6 4,001,856 5,044,138 7,863,042 9,918,037 12,281,343 7 or lore : 3,297,888 3,667,652 5,638,406 8,351,846 13,754,170 Total 21,339,428 29,044,249 40,756,817 50,002,480 64,636,819
Median No. of rooas : 4.9 4.7 4.9 5.1 5.2
Rural : 1-2 roots 3 4 5 6 7 or lore Total
Hedian No.
Urban: 1-2 3 4 5 6 7 or lore
Rural : 1-2 3 4 5 6 7 or lore
of roois
2,051,472 1,610,473 1,144,276 578,794 620,387 2,227,270 2,088,345 1,681,052 1,249,873 1,324,358 3,076,700 3,619,174 3,974,979 3,879,664 4,360,143 2,653,256 3,035,170 4,101,560 4,698,846 5,677,739 2,319,774 2,520,602 3,278,421 3,691,314 4,663,918 3,164,266 2,979,729 3,381,192 3,598,113 5,409,459
15,492,758 15,853,493 17,561,480 17,696,604 22,056,004 4.7 4.8 5.1
Percent
5.3 5.4
11.6 10.6 8.0 6.0 6.1 14.5 15.8 13.0 12.4 11.9 17.9 21.3 20.8 20.5 19.5 21.8 22.3 25.1 24.6 22.2 18.8 17.4 19.3 19.8 19.0 15.5 12.6 13.8 16.7 21.3
13.2 10.2 6.5 3.3 2.8 14.4 13.2 9.6 7.1 6.0 19.9 22.8 22.6 21.9 19.8 17.1 19.1 23.4 26.6 25.7 15.0 15.9 18.7 20.9 21.1 20.4 18.8 19.3 20.3 24.5
Source; U.S. Departaent of Coiaerce, Bureau of the Census.
27

Warm Air and Electric Heating Systems Grew IMore Popuiar in Both Rural and Urban Homes
Heating equipment in rural homes has evolved more and more to central type units, that is, units that distribute heat to various rooms of a house by steam or hot water pipes or by warm air ducts. "Other" heating equipment includes floor or wall-furnaces, stoves, portable heaters, and fireplaces that mainly heat the room where they are located. Rural homes with central heating increased from only 15 percent of all rural homes in 1940 to 51 percent in 1980. Most of this increase was with warm air systems that can also be used for air conditioning. In contrast, over one-half of urban homes were equipped with central heating systems in 1940, increasing to 70 percent by 1980.
28

Warm Air and Electric Heating Systems Grew IMore Popuiar in Both Rurai and Urban Homes
IOOT
TO--
40--
10"
IOOT
70--
40--
1
Urban
19A-0 1950 1960 1970
Rural
19^40 1950 I960 1970
«Inelud«» Rrsplae«, Stev«» Portobl« H«ot«r ana Non«.
1
m 1980
1980
fvvsl Other
Electricity
Warm Aîr
^ Steam/Water
Other*
Electricity
IHH Warm Aîr
íbvvl Steam/Water
29

Table 13--Vhat types of heating systeis were used in urban hoies?
Itei 1940 : 1950 : 1960 1970 1980
Nuiber of hoies
Steal or hot water 6,619,331 8,921,785 11,302,204 12,109,359 12,822,588 Warn air furnace : 4,472,616 8,636,665 13,988,890 22,067,865 32,572,990 Other leans: 9,098,356 10,064,880 14,915,326 15,434,497 18,722,524
Floor, wall, or pipeless furnace 657,648 " 5,134,789 4,769,472 4,157,355 Built-in electric equipient -- -- 450,149 2,354,241 6,917,269 Other neans with flue : 7,081,478 6,689,870 5,521,636 4,825,120 4,415,701 Other leans without flue 1,359,230 3,375,010 3,808,752 2,263,277 1,903,634 Fireplace, stove. or portable heater -- " • a 1,222,387 1,328,565
None -- 421,890 550,397 390,759 548,328
Total : 20,190,303 28,045,220 40,756,817
Percent
50,002,480 64,666,430
Steal or hot water 32.8 31.8 27.7 24.2 19.8 Wan air furnace 22.2 30.8 34.3 44.1 50.4 Other leans: 45.1 35.9 36.6 30.9 29.0
Floor, wall, or pipeless furnace : (3.3) " (12.6) (9.5) (6.4) Built-in electric equipient as " (1.1) (4.7) (10.7) Other leans with flue : (35.1) (23.9) (13.5) (9.6) (6.8) Other leans without flue (6.7) (12.0) (9.3) (4.5) (2.9) Fireplace, stove. or portable : heater " " " (2.4) (2.1)
None "" (1.5) (1.4) (.8) (.8)
" = None, negligible, or not counted.
Note: Data in parentheses total to "other lean."
Source: U.S. Departient of Coiierce, Bureau of the Census.
30

Table 14--tfhat types of heating systeis «ere used in rural hoies?
Itei : 1940 : 1950 : 1960 1970 1980
Ruiber of hoies
Steal or hot water 808,423 968,515 1,391,479 1,711,114 1,899,054 Van air furnace : 1,252,778 2,664,305 4,366,263 6,703,954 9,380,477 Other leans: 11,897,561 10,229,745 11,334,273 9,091,463 10,607,327
floor, wall, or pipeless furnace 536,039 " 1,393,155 1,108,118 869,083 Built-in electric equipient -- " 294,926 1,165,739 3,207,022 Other leans with flue 8,846,845 8,431,775 7,629,949 3,084,562 2,290,549 Other leans without flue 2,514,677 1,797,970 2,016,243 1,686,143 1,138,942 Fireplace, stove, or portable heater — " " 2,046,901 3,101,731
None " 148,365 469,465 190,073 205,429 Total : 13,958,762 14,010,930 17,561,480
Percent
17,696,604 22,092,287
Steal or hot water 5.8 6.9 7.9 9.7 8.6 Van air furnace 9.0 19.0 24.9 37.9 42.5 Other leans: 85.2 73.0 64.5 51.4 48.0
Floor, wall, or pipeless furnace : (3.8) " (7.9) (6.3) (3.9) Built-in electric equipient " — (1.7) (6.6) (14.5) Other leans with flue : (63.4) (60.2) (43.4) (17.4) (10.4) Other leans without flue (18.0) (12.8) (11.5) (9.5) (5.2) Fireplace, stove. or portable : heater -- " " (11.6) (H.O)
None "■ 1.1 2.7 1.0 .9
" = None, negligible, or not counted.
Note: Data in parentheses total to "other lean."
Source: U.S. Departient of Coiierce, Bureau of the Census.
31

Use of Gas as a Heating Fuel Increased Markedly While Coal Use Plummeted
Heating fuels went from coal and wood in 1940, which required much household attention and labor, to natural gas, oil, and electricity in 1980, which required little attention and labor.
Gas was the most popular heating fuel used in urban areas. Coal use decreased dramatically after 1940. From 1950 to 1980, electricity use increased more than the use of other heating fuels. Electricity is not, in itself, a fuel but rather a convenient form of energy generated from fuel sources in power plants. These fuel sources include coal, gas, oil, or nuclear fuel, some of which are fuels now or were previously available for use by homeowners.
As in urban areas, gas and fuel oil surpassed coal and wood to become the most frequently used fuels in rural homes during 1940-80. Electricity use as a heating agent increased from less than 1 percent in 1950 to 21 percent in 1980. However, in rural areas during 1970-80, many fuel use trends reversed. Gas and fuel oil use decreased, while wood use as a fuel trended upward in rural areas, following a steady decline after 1940.
32

Use of Gas as a Heating Fuel Increased Markedly While Coal Use Plummeted
Urban IOOT
TO--
10--
WM 19^ lO 1950 I960 1970
utnny ond bottled 1 *wn»» and
R ural IOOT
40--
ao--
10-■
1940 1950
«InoludttB utHlty ond bottled« tank.
1980
Other/nont
El^otriot^
Wood
Coal
Fuel oil
GOB'«'
I I Oth«r/non«
Eleotrlol^
Wood
Coal
Fuol oil
Oaa«
33

Table 15-Vhat fuels «ere used to heat hoies in urban areas?
Itei 1940 : 1950 : 1960 : 1970 : 1980
Nuiber of hoies
utility gas : 3,123,475 9,799,490 20,418,120 30,909,115 38,058,374
Fuel oil and kerosene 2,592,557 6,363,845 11,960,754 10,862,337 9,705,504
Coal or coke : 12,822,112 9,806,965 3,716,314 889,679 178,275
Hood 1,182,884 618,210 271,331 93,701 446,608
Electricity -- 134,795 586,612 3,401,015 10,541,659
Bottled, tank, or LP gas " 230,145 822,068 919,655 1,030,406
Other fuel : 93,700 485,565 161,370 238,370 133,414
None 161,466 421,890 382,979 335,542 462,894
Total : 19,976,194 27,860,905 38,319,548
Percent
47,649,414 60,557,134
Utility gas 15.6 35.2 53.3 64.9 62.8
Fuel oil and kerosene : 13.0 22.8 31.2 22.8 16.0
Coal or coke 64.2 35.2 9.7 1.9 .3 Vood : 5.9 2.2 .7 .2 .7 Electricity " .5 1.5 7.1 17.4
Bottled, tank, or LP gas " .8 2.1 1.9 1.7
Other fuel : .5 1.7 .4 .5 .2 None .8 1.5 1.0 .7 .8
-- : None, negligible, or not counted.
Source: U.S. Departient of Coiierce, Bureau of the Census.
34

Table I6»Vhat fuels «ere used to heat hoies in rural areas?
Itei 1940 1950 : 1960 : 1970 1980
Nuiber of hoies
utility gas 714,493 1,322,370 2,433,096 4,104,630 4,599,251 Fuel oil and kerosene 801,902 3,096,715 5,197,647 5,611,133 4,949,950 Coal or coke 5,703,478 4,676,455 2,739,251 931,273 325,897 Hood 6,552,593 3,553,480 1,965,535 700,207 2,128,952 Electricity " 141,445 346,411 1,475,023 4,226,459 Bottled, tank, or
LF gas — 745,290 1,863,702 2,887,293 3,504,419 Other fuel 34,537 283,825 61,645 27,916 19,229 None 101,182 148,365 95,222 59,752 78,382
Total 13,908,185 13,967,945 14,702,509
Percent
15,797,227 19,832,539
utility gas 5.1 9.5 16.5 26.0 23.2 fuel oil and kerosene 5.8 22.2 35.4 35.5 25.0 Coal or coke : 41.0 33.5 18.6 5.9 1.6 Hood 47.1 25.4 13.4 4.4 10.7 Electricity : " 1.0 2.4 9.3 21.3 Bottled, tank, or
LP gas — 5.3 12.7 18.3 17,7 Other fuel .2 2.0 .4 , ¿ .1 None .7 1.1 .6
■* .4
" = None, negligible, or not counted.
Source: U.S. Departnent of Comerce, Bureau of the Census.
35

Incidence of Crowding in Urban and Rural Area Homes Decreased Steadily
Crowding, or an average of more than one person per room in a home, is an accepted indicator of inadequate housing. Crowding indicates inadequate housing for the occupants more than it indicates housing quality.
Crowding was a more serious problem in 1940 than in 1980. Only 4 percent of urban homes and 5 percent of rural homes were classified as crowded in 1980, compared with 16 percent of urban homes and 27 percent of rural homes in 1940.
ioo<
TO--
19^4.0 1950 1960 1970 1980
36

Table 17-How lany urban and rural hoies were crowded?!/
Persons per rooB 1940 ': 1950 ": 1960 : 1970 : 1980
Nuiber of hoies
urban: 1.00 or less : 1.01-1.50 1.51 or lore
Total
17,135,254 2,058,996 1,170,633 20,364,883
24,364,138 2,425,860 1,307,635 28,097,633
34,429,617 2,793,337 1,097,416 36,320,370
44,074,383 2,657,578
835,411 47,567,372
57,834,687 1,823,273
893,757 60,551,717
Rural: 1.00 or less 1.01-1.50 1.51 or lore
Total
10,346,884 1,819,976 1,915,289 14,082,149
11,162,613 1,594,115 1,300,082 14,056,810
12,480,785 1,417,213 805,507
14,703,505
Percent
14,310,341 1,124,327 443,152
15,877,820
18,906,541 690,553 240,862
19,837,956
Urban: 1.00 or less 1.01-1.50 1.51 or lore
84.1 : 10.1 : 5.7
86.7 8.6 4.7
89.8 7.3 2.9
92.7 5.6 1.8
95.5 3.0 1.5
Rural: 1.00 or less 1.01-1.50 1.51 or lore
: 73.5 12.9
: 13.6
79,4 11.3 9.2
84.9 9.6 5.5
90.1 7.1 2.8
95.3 3.5 1.2
1/ Crowding is defined as an average of lore than one person per rooi in a hoae.
Source: U.S. Departaent of Coaaerce, Bureau of the Census.
37

Percentage of Homes that Lacked Complete Plumbing Systems Declined Steadily
In 1940, 75 percent of rural housing and 23 percent of urban housing lacked complete plumbing. Plumbing systems improved dramatically over the decades until 1980, when only 6 percent of rural housing and 2 percent of urban housing lacked complete plumbing for exclusive use of the household.
too
Urbon
Rural
1940 1950 I960 1970 1980
38

Table I8--H0W lany urban and rural hoies lacked coiplete pluibing systeis?
Itei : 1940 1950 : 1960 ": 1970 : 1980
Nuiber of hoies
Urban: Coiplete Lacking Total
15,389,671 : 4,673,900
20,063,571
22,491,886 5,614,641
27,806,527
36,489,509 2,876,509
39,366,018
48,465,098 1,537,382
50,002,480
63,605,896 1,030,923
64,636,819
Rural: Coiplete Lacking Total :
3,784,673 11,178,198 14,962,871
5,340,521 8,586,097
13,926,618
11,237,596 4,822,816
16,060,414
Percent
14,836,225 2,860,379
17,696,604
20,753,237 1,302,767
22,056,004
Urban: Coiplete Lacking
76.7 23.3
79.8 20.2
92.7 7.3
96.9 3.1
98.4 1.6
Rural: Coiplete Lacking :
25.3 74.7
38.3 61.7
70.0 30.0
83.8 16.2
94.1 5.9
Source: U.S. Departient of Coiierce, Bureau of the Census.
39

Percentage of Rural Homes with Running Water IMore Than Doubled
Rural homeowners made great strides between 1940 and 1970 toward closing the plumbing gap that existed between rural and urban homes in 1940. Rural homes with piped-in water increased from 37 percent of rural homes in 1940 to 92 percent in 1970. Urban homes with piped-in water increased from 94 percent in 1940 to almost 100 percent by 1970.
Because homes lacking plumbing facilities have become almost nonexistent, the 1980 census of housing eliminated most questions on plumbing.
IOOT
70--
40--
30--
ao+
10--
Urban
Rural
1940 19SO 1960 1970
40

Table 19-Hov lany hoies had indoor running water? 1/
Itei 1940 : 1950 : 1960 : 1970
1 iluiber of hoies urban: RHIS 2/ 19,999,176 28,171,341 40,324,109 49,873,326 Other/none : 1,381,954 1,068,971 432,708 129,154 Total 21,381,130 29,240,312 40,756,817 50,002,480
Rural: RKIS 2/ 5,797,138 9,333,562 13,866,521 16,216,813 Other/none 9,722,546 6,714,767 3,694,959 1,479,791 Total 15,519,684 16,048,329 17,561,480
Percent
17,696,604
Urban: RWIS 2/ 93.5 96.3 98.9 99.7 Other/none 6.5 3.7 1.1 .3
Rural: R«IS 2/ 37.4 58.2 79.0 91.6 Other/none 62.6 41.8 21.0 8.4
y Data not collected in 1980. 2/ RVIS : Running water in structure.
Source: U.S. Departnent of Coiierce, Bureau of the Census.
41

Rural Homes with Flush Toilets Tripled During 1940-70
Installation of flush toilets in homes increased almost as fast as did piped-in water. Flush toilets in rural homes increased from 29 percent in 1940 to 87 percent by 1970. Installation of flush toilets, however, lagged installation of piped water in rural homes, as flush toilets require a sewer system in addition to piped-in water, which was sometimes difficult to install in rural areas. Urban homes with indoor flush toilets increased from 91 percent in 1940 to 99 percent in 1970.
IOOT
TO*-
4 i
•f I i
»I I
4 I
4 i
1940 1950 1060 1970
42

Table 20-How lany hones had indoor flush toilets? 1/
Itei 1940 : 1950 : 1960 : 1970
Nuiber of hoies
Urban: Exclusive 17,694,398 25,363,475 38,412,077 49,150,191 Shared 1,667,479 1,654,570 1,577,791 564,155 Other/none 1,949,263 2,186,216 766,949 288,134
Total 21,311,140 29,204,261 40,756,817 50,002,480
Rural: Exclusive 4,272,480 6,971,356 12,196,467 15,331,292 Shared 159,483 184,782 153,701 39,973 Other/none 11,026,507 8,900,641 5,211,312 2,325,339
Total 15,458,470 16,056,779 17,561,480
Percent
17,696,604
Urban: Exclusive or shared 90.9 92.5 98.1 99.4 Other/none : 9.1 7.5 1.9 .6
Rural: Exclusive or shared 28.7 44.6 70.3 86.9 Other/none : 71.3 55.4 29.7 13.1
V Ma not collected in 1980.
Source: U.S. Departient of Conierce, Bureau of the Census.
43

HOUSING COSTS
Home values and rents increased steadily over the decades. This increase, combined with high mortgage interest rates in 1970 and 1980, made owning or renting a home difficult for many families.
Charts in this section illustrate that:
o Real median home values in rural areas increased faster than those in urban areas, but urban home values were still higher than rural values in 1980.
o From 1940 to 1980, real median rural rent increased faster than that in urban areas.
o Mortgage interest rates stabilized at below 5 percent for many years, increased during the I960's and 1970's, and exploded to double-digit rates in the 1980's.
o The proportion of Federal Housing Administration (FHA) and Veterans Administration (VA) loans in foreclosure more than doubled from 1961 to 1980.
45

Median Home Values Escalated Between 1940 and 1970
Changes in both the housing inventory mix and dollar values made it difficult to compare housing values during 1940-80. However, deflating the nominal median housing value by the Consumer Price Index (1967 = 100) yields real median housing values, which can readily be compared.
Median home values in rural areas increased faster than those in urban areas, but urban home values remained higher. Real median owner-occupied home values in urban areas increased 140 percent between 1940 and 1980, while housing values in rural areas increased 300 percent during that time. The most rapid increase occurred during the 1940's and 1970's.
ao-r
46

Table 21--H0W luch were hones worth?
Itei 1930 1940 1950 1960 1970 1980
Nuilier of hoies Urban:
Less than (1,000 $1,000-$1,499 (1,500-11,999 |2,000-$2,999 13,000-14,999 (5,000-$7,499 $7,500-19,999 $10,000-(14,999 (15,000-il9,999 (20,000-t24,999 $25,000-(34,999 $35,000-(49,999 (50,000-$59,999 |60,D00-(79,999 (80,000-199,999 (100,000-(149,999 (150,000-(199,999 (200,000 or lore
231,285 232,448 257,130 669,458
1,688,542 1,898,247
879,361 810,623 306,953 311,864 4/
588,511 507,715 590,975
1,353,741 2,240,538 1,325,322
381,284 253,020 82,693 75,993 4/
445,674 1/ 397,101 "
1,293,609 2,485,987 2,178,400 2,576,673
872,724 614,851 4/
1,452,225 2/ 2,055,979 " 2,686,631 6,293,418 4,055,390 1,628,103 1,049,069
649,992 5/
808,202 2/ 1,336,187 " 1,843,050 4,890,893 5,209,960 3,872,141 3,737,685 1,732,192
841,408 6/
Dollars
700,880 3/ 912,672 "
1,327,062 1,717,720 3,988,666 6,421,603 3,663,102 5,245,886 2,526,815 2,099,143
605,136 490,093
Median 5,743 3,501 8,380 12,900 18,100 49,500 Real ledian 7/ -- 8,336 11,623 14,538 15,566 20,097
Huiber of hoies
Rural-nonfara: 8/ Less than (1,000 563,439 1,181,168 " " " (1,000-(1,499 337,599 475,037 " " " (1,500-(1,999 274,147 360,219 719,670 1/ " " (2,000-(2,999 497,867 566,297 459,940 " -- " (3,000-(4,999 655,227 611,319 904,246 1,729,397 2/ 1,126,181 2/ " (5,000-(7,499 398,782 276,221 916,450 1,144,974 " 956,618 " " (7,500-(9,999 110,107 67,776 439,190 858,965 830,439 648,858 3/ (10,000-(14,999 95,934 49,174 418,344 1,338,756 1,511,963 552,099 " $15,000-(19,999 : 32,582 16,454 134,956 667,723 1,225,439 635,116 (20,00D-(24,999 42,473 4/ 18,260 4/ 115,887 4/ 271,488 801,639 776,769 (25,000-(34,999 178,150 698,640 1,522,621 (35,000-(49,999 : " 111,512 5/ 313,104 2,074,190 (50,000-(59,999 a* 154,710 6/ 1,056,136 (60,000-(79,999 " -- 1,351,625 (80,000-(99,999 : " " 538,879 (100,000-(149,999 -- -- 432,984 $150,000-(199,999 : -- " 108,559 (200,000 or lore 74,042
Continued ■-
47

Table 21--How auch were hoies worth?--continued
Itei 1930 1940 1950 1960 1970 : 1980
Dollars
Median 2,661 1,715 4,878 8,300 12,600 40,200 Real ledian 7/ "" 4,083 6,766 9,354 10,836 16,321
-- : None, negligible, or not counted.
Less tban $2,000. Less tban $5,000. Less tban $10,000. $20,000 or lore. $35,000 or lore. $50,000 or lore. Real ledian is expressed in 1967 dollars. Honfari values reflect bousing units on 10 acres or less.
Source: U.S. Departient of Coiierce, Bureau of tbe Census.
48

FHA Mortgage Interest Rates Reached New Highs After 1965
Real housing values and mortgage interest rates increased, and both added to the problem of the purchaser's ability to buy a home. FHA mortgage interest rates remained relatively stable (below 5 percent for many years), gradually increasing during the I960's and 1970's. But in the 1980's, mortgage interest rates exploded to double-digit rates, as the Federal Reserve restricted the money supply.
11T
10--
•-•
•-- I •t
j i
•t (
1 I m ^ZLJ^ I YZà. I i
I I
I 1935 19AO 1945 1950 1955 1960 1965 1970 1975 1980
Table 23—What interest rates were paid for mortgages? 1/
Year : Average
1935 5.0 1940 : 4.5 1945 4.5 1950 : 4.25 1955 4.5
1960 : 5.75 1965 5.25 1970 : 8.5 1975 8.5 1980 : 11.5
1/ Rates for Government-insured FHA mortgages.
49

Delinquency Rates for Mortgage Loans Continued to Rise
As mortgage payments increased,so did their delinquency rates. Delinquency rates of mortgage payments increased steadily from about 2.4 percent of loans in 1960 to 5.6 percent in 1980. As might be expected, the largest percentage of delinquency loans were delinquent for 30 days. However, mortgage payments delinquent for 60 and 90 days were increasing at a faster rate than were those delinquent for 30 days.
4.0r
3.S'-
3.0 ■
a.s-
2.0-
1.5 ' •
1.0 •
.S"
Days Post Du«
30-59
60-89
90 or More
I I I I I I 1995
I I I I I I I I I I I I I I I I
1969 1979 I960 1970 1980
50

Table 24—Were mortgage payments made on time?
Days past due Year : Total 30 : 60 : 90 or
days : days : more days
Percent
1953 : 2.38 1.88 0.34 0.17 1954 : 2.34 1.79 .37 .19
1955 : 2.10 1.64 .30 .16 1956 : 2.22 1.72 .33 .18 1957 2.08 1.60 .30 .18 1958 : 2.25 1.66 .36 .23 1959 2.18 1.61 .34 .24
1960 2.41 1.73 .38 .30 1961 : 2.87 1.99 .47 .42 1962 2.81 2.07 .47 .28 1963 : 3.15 2.26 .56 .34 1964 3.02 2.19 .53 .31
1965 3.10 2.23 .54 .33 1966 : 3.11 2.27 .52 .32 1967 3.12 2.33 .52 .28 1968 ! 2.96 2.24 .48 .23 1969 : 2.89 2.18 .47 .25
1970 : 3.13 2.35 .53 .31 1971 3.50 2.50 .59 .42 1972 : 3.70 2.67 .63 .40 1973 4.13 2.96 .72 .45 1974 : 4.24 3.04 .76 .44
1975 : 4.37 3.10 .79 .49 1976 4.59 3.28 .78 .54 1977 : 4.62 3.25 .76 .53 1978 4.58 3.30 .77 .51 1979 : 4.63 3.39 .76 .49
1980 : 4.98 3.55 .85 .58
Source: Mortgage Bankers Association of America.
51

Median Monthly Rentals Continued to Rise
Median home rent (adjusted by the Constimer Price Index, 1967 = 100) increased in both urban and rural areas between 1940 and 1980; however, rural rent increased faster than urban rent. Real urban rent increased 42 percent, compared with 140 percent for real rural rent.
As with housing values, the percentage difference in urban and rural rent decreased from 1940 to 1980. In 1940, real urban rent was 146 percent higher than real rural rent, but, by 1980, the difference was only 43 percent.
194-0 1950
«M«dfon monthly r«nt. 10S7 dollor«.
1960 1970
Urban
Rural
i9ao
52

Table 22-How luch rent was paid?
Locatioo/rent 1930 1940 : 1950 : 1960 1970 1980
Huiber of hoies DrliaD: less than $10 510,114 1,210,681 298,220 " " " $10-19 : 1,744,792 3,376,870 1,492,242 391,658 1/ " " $20-29 : 2,178,212 3,438,220 2,549,530 1,013,441" 571,670 2/ " $30-59 • 3,000,786 4,183,516 6,755,888 6,053,104 3,099,387" 1,005,115 3/ $60-99 1,798,587 469,322 1,815,140 6,129,916 6,767,891 1,867,591" $100-149 157,436 74,817 341,116 4/ 1,427,847 5,250,992 3,362,933 $150-199 44,613 19,942 347,992 5/ 2,192,278 4,953,002 $200-249 44,108 6/ 17,105 6/ — 549,523 4,500,627 $250-299 " " 417,409 7/ 3,364,097 $300-399 " -- — " 2,903,228 $400-499 " " — " " 828,785 $500 OT lore " -- " -- -- 500,539
Dollars
Hedían rent 32 25 38 61 92 205 Real nedian 8/ 59 52 69 79 83
Nuiber of hoies
Rural-nonfari 9/ Less than $10 - 1,053,838 1,611,716 339,529 " " " $10-19 888,522 1,120,393 673,310 544,030 1/ " " $20-29 366,996 414,510 497,841 451,898" 426,843 2/ " $30-59 181,649 213,076 602,226 999,219 691,370" 366,290 3/ $60-99 47,885 21,641 115,801 445,192 631,006 366,945" $100-149 5,856 4,374 22,012 4/ 81,567 293,681 583,821 $150-199 1,684 969 22,060 5/ 81,767 536,463 $200-249 1,642 6/ 613 6/ " 19,608 313,890 $250-299 " " 13,006 7/ 167,490 $300-399 " " " " 123,442 $400-499 " " " " " 33,907 $500 or «ore
Dollars
il,972
Hedían rent 12 10 22 37 58 142 Real ledian 8/ 24 30 42 50 58
" = Hone, negligible, or not counted.
y Less than $20. 2/ Less than $30. 3/ Less than $60. 4/ $100 or lore. 5/ $150 or lore. 6/ $200 or aore. 7/ $250 or lore. 6/ Real ledian is expressed in 1967 dollars. y Nonfari rents reflect housing rents on 10 acres or less.
Source: U.S. Departient of Coaierce, Bureau of the Census.
53 îî-U.S. Government Printing Office : 19S8 -241-793/80334