ahmed elyamany, phd
TRANSCRIPT

Cost Control
Ahmed Elyamany, PhD

Project Monitoring and Control
2
� Monitoring
� Collecting, recording, and reporting information concerning project performance that project manger and others wish to know
� Controlling
� Uses data from monitor activity to bring actual performance to planned performance

Project Monitoring and Control
3
� Why do we monitor?
� What do we monitor?
� When to we monitor?
� How do we monitor?

Why do we monitor?
4
� Simply because we know that things don’t always go according to plan (no matter how much we prepare)
� To detect and react appropriately to deviations and changes to plans

What do we monitor?
5
� Men (human resources)
� Machines
� Materials
� Money
� Space
� Time
� Tasks
� Quality/Technical Performance

What do we monitor?
� Time
� Money
� Resources
� Material Usage
� Tasks
� Quality/Technical Performance
� Progress
� Costs
� Job starts
� Job completion
� Engineering / Design changes
� Variation order (VO)
6
Inputs Outputs

When do we monitor?
7
� End of the project
� Continuously
� Regularly
� Logically
� While there is still time to react
� As soon as possible
� At task completion
� At pre-planned decision points (milestones)

How do we monitor
8
� Through meetings with clients, contractor, supplier, etc.
� For schedule – Update CPM, PERT, and Gantt Charts
� Using Earned Value Analysis
� Calculate Critical Ratios
� Milestones
� Reports
� Tests and inspections
� Delivery

Monitoring issues
9
� What problems do you have and what is being done to correct them?
� What problems do you anticipate in the future?
� Do you need any resources you do not yet have?
� Do you know anything that will give you schedule difficulties?
� Any possibility your task will finish early/late?
� Will your task be completed under/over/on budget?

Project Control
10
� Control – process and activities needed to correct deviations from plan
� Control the constraints
� Time (schedule)
� Cost (budget, expenses, etc)
� Performance (specifications, testing results, etc.)

Project Control Cycle
11
PLAN
MONITOR
COMPARE
ACTION
Specifications
Project Schedule
Project budget
Resource planVendor contracts
Record statusReport progress / cost
Actual status against planSchedule / Cost
Correct deviations from planRE-PLAN as necessary

Techniques for monitoring and control
12
� Earned Value Analysis
� A way of measuring overall performance (not individual task) is using an aggregate performance measure - Earned Value

Project Control
13
� Control the constraints
� Time (schedule)
� Cost (budget, expenses, etc)
� Performance (specifications, testing results, etc.)

Cost Control
� The process of influencing factors that create variances, and controlling changes
to the project budget.
14
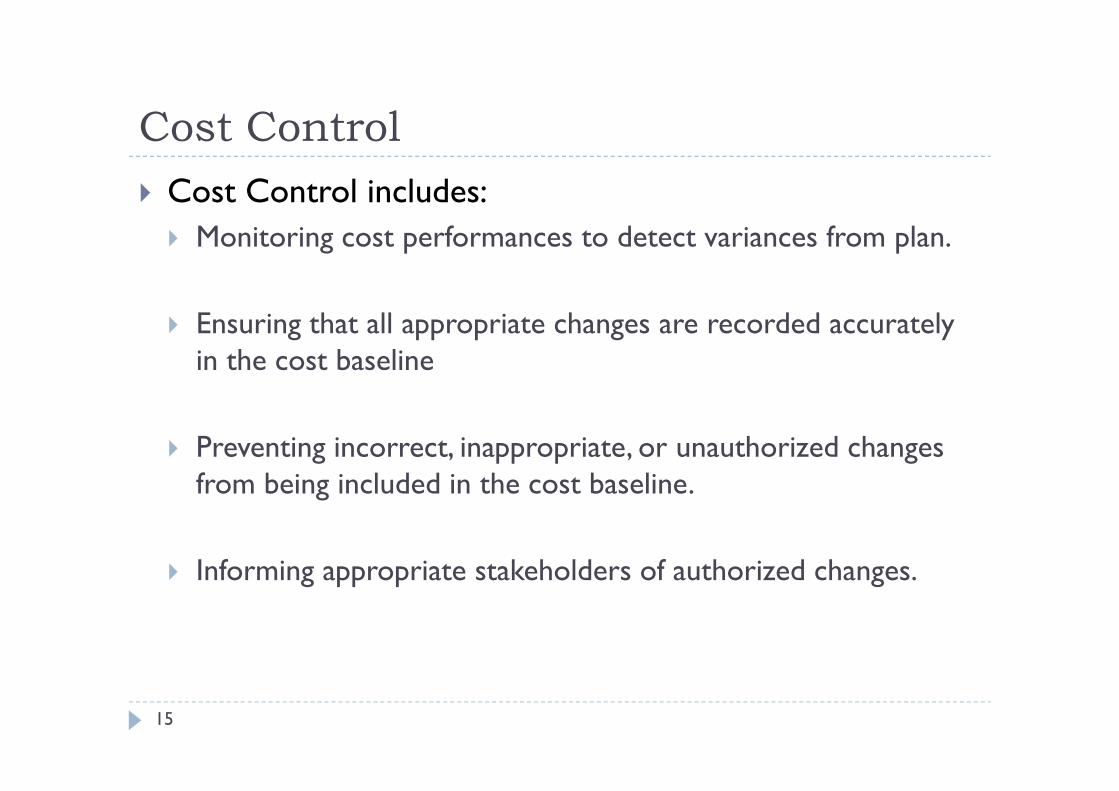
Cost Control
� Cost Control includes:
� Monitoring cost performances to detect variances from plan.
� Ensuring that all appropriate changes are recorded accurately in the cost baseline
� Preventing incorrect, inappropriate, or unauthorized changes from being included in the cost baseline.
� Informing appropriate stakeholders of authorized changes.
15

Objects of Cost Control
1) To have a knowledge of the profit and loss of the project throughout the:
� Project Profits1. Client payments.
2. Sale of surplus or scrap material and plant
3. Payments for plants or labor by others
� Project Losses1. Labor and site office costs2. Plant costs
3. Site overheads i.e. site facilities, access roads and office etc
4. Cost of tendering including bonds, insurance, etc.5. Material costs.
6. Head office overheads proportioned over all current projects.
7. Duration of the project.
16

Objects of Cost Control
2) To have a comparison between the actual project performance and the original project plan.
3) Provides feedback data on actual project performance to future project planning
4) Predicting Project final cost and completion date
17

Inputs to Cost Control
� Cost Baseline
� Performance Reports� Provide information about cost performance such as which
budgets have been met and which have not.
� It also alerts the project team to issues which may cause problems in the future.
� Change Requests� These may occur in many forms-oral or written, direct or
indirect, externally or internally initiated, and legally mandated or optional. These may require increasing the budget or may allow decreasing it.
18

Outputs from Cost Control
� Revised Cost Estimates
� Budget Updates
� Corrective Action
� Estimate at Completion� It is a forecast of total project costs based on project
performance.
� Lessons Learned
19
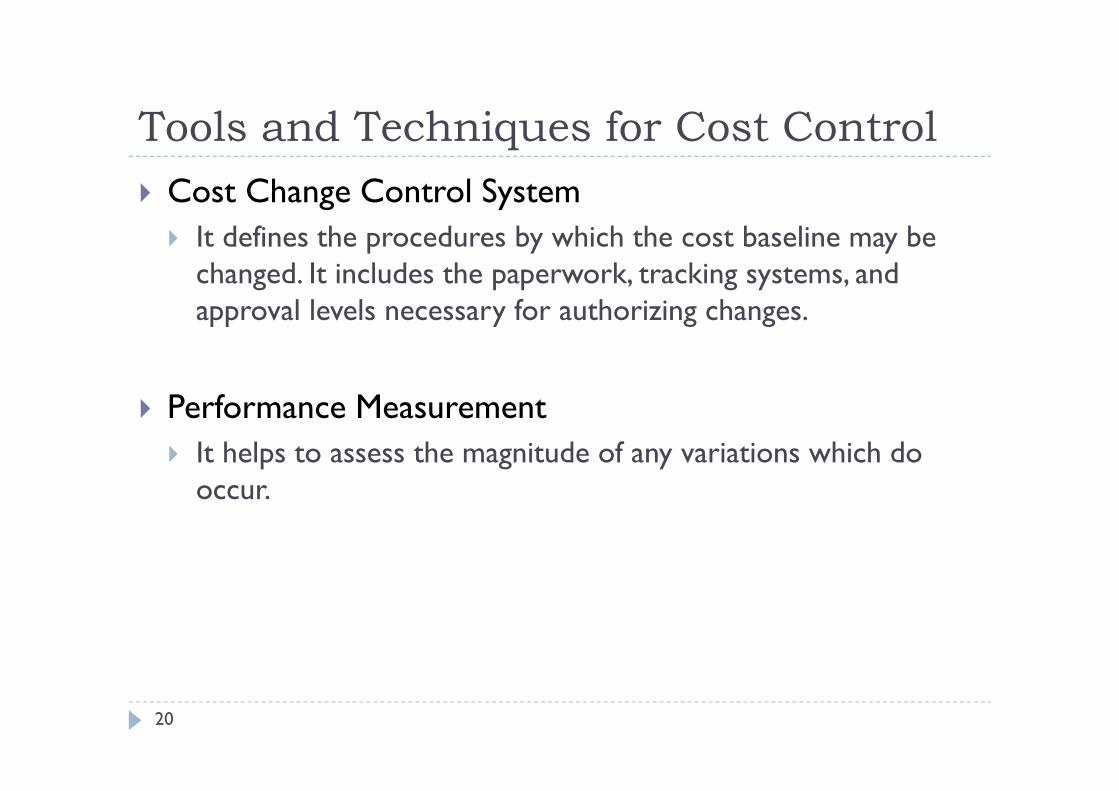
Tools and Techniques for Cost Control
� Cost Change Control System
� It defines the procedures by which the cost baseline may be changed. It includes the paperwork, tracking systems, and approval levels necessary for authorizing changes.
� Performance Measurement
� It helps to assess the magnitude of any variations which do occur.
20

Tools and Techniques for Cost Control
� Additional Planning
� Perspective changes may require new or revised cost estimates or analysis of alternate approaches.
� Computerized Tools
21

Earned Value analysis
� A method of integrating scope, schedule, and resources, and for measuring project performance.
� It compares the amount of work that was planned with what was actually earned with what was actually spent to determine if cost and schedule performance are as planned.
22

Earned Value analysis
� What is needed for Earned Value analysis?
� A baseline plan
� A project budget (BAC – Budget at Completion)
� A project end date
� Tasks are identified & scheduled
� Each task has a budget or effort (resource loaded / weighting)
� Actual tracked
23

Earned Value analysis
� To perform Earned Value analysis, three values need to be determined
� Planned Value (PV or BCWS)
� Actual Costs (AC or ACWP)
� Earned Value (EV or BCWP)
24

Planned Value (PV)
� What are the budgeted costs of the work scheduled?
� Time phased based on baseline budget
� Only changes when baseline is changed
� Also referred as “BCWS” & “BAC”
25

Actual Costs (AC)
� What are the actual costs of the work performed?
� Based on the actual completion of work packages
� Actual costs for reported work
� Also referred as “ACWP”
26

Earned Value (EV)
� What are the budgeted costs of the work performed?
� Based on the actual completion of work packages
� Baseline value of the reported work
� Also referred as “BCWP”
27

Earned Value analysis Example
� Task – Drill 10 piles
� Budget - $100,000 ($10,000 per piles)
� Time – 10 weeks (1 pile per week)
� At week 5:� 4 piles drilled
� $47,500 spent to date
� PV = $50,000
� AC = $47,500
� EV = $40,000
28

Earned Value analysis
� Calculating Earned Value and interpreting results
� To measure the progress of the project
� Help identify trends
� Forecast costs
� Identify ways to correct/mitigate project pitfalls.
29

Cost Variance (CV)
� CV = EV - AC
� Good News: If CV value is +ve, the project is currently under budget (spending less than planned for the work)
� Bad News: If CV value is -ve, the project is currently over budget (spending more than planned for the work)
30

Cost Performance Index (CPI)
� CPI = EV / AC
� Good News: If CPI value is >1 or =1, the project cost trend is currently under or at planned budget
� Bad News: If CPI value <1, the project cost trend is currently over budget
31

Schedule Variance (SV)
� SV = EV – PV
� Good News: If SV value is +ve, the project is currently ahead of schedule
� Bad News: If SV value is -ve, the project is currently behind schedule
32

Schedule Performance Index (SPI)
� SPI = EV / PV
� Good News: If SPI value is >1 or =1, the project schedule trend is currently ahead or on planned schedule
� Bad News: If SPI value <1, the project schedule trend is currently behind schedule
33

Estimate at Completion (EAC)
� Actual costs to date plus remaining budget modified by a performance factor (CPI) (current variances are viewed as typical of future variances).
� EAC = BAC / CPI
34
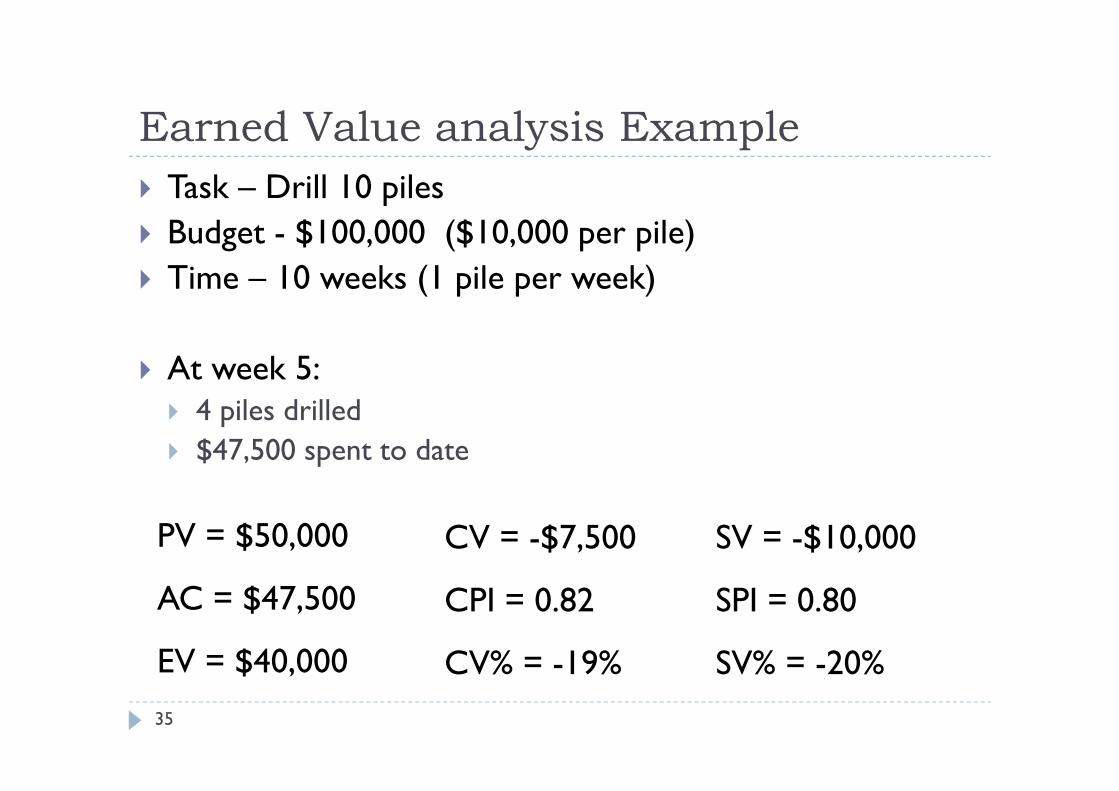
PV = $50,000
AC = $47,500
EV = $40,000
CV = -$7,500
CPI = 0.82
CV% = -19%
SV = -$10,000
SPI = 0.80
SV% = -20%
Earned Value analysis Example
� Task – Drill 10 piles
� Budget - $100,000 ($10,000 per pile)
� Time – 10 weeks (1 pile per week)
� At week 5:� 4 piles drilled
� $47,500 spent to date
35

Earned Value Scenario
36

Earned Value Scenario
37

Earned Value Scenario
38

Earned Value Scenario
39

Earned Value Scenario
� BAC = $100,000 (current project budget)
� EV = $42,000 (42% of project completed, $100,000 planned)
� PV = $56,000 (56% of project planned $100,000 completed – initial aging report)
� AC = $48,000 (from actual expenditures reporting)
� Is this project on schedule / budget? Or is it in trouble?
40

Earned Value Scenario
� Cost Variance (CV):
� CV = EV – AC
� = $42,000 - $48,000
� = - $6,000
� Cost Performance Index (CPI):
� CPI = EV / AC
� = $42,000 / $48,000
� = 0.875
41

Earned Value Scenario
� Schedule Variance (SV):
� SV = EV – PV
� = $42,000 - $56,000
� = - $14,000
� Schedule Performance Index (SPI):
� SPI = EV / PV
� = $42,000 / $56,000
� = 0.750
42

Earned Value Scenario
� Estimate to Complete (ETC):
� EAC = BAC / CPI
� = $100,000 / 0.875
� = $114,285
� (Change Management for $14,285 funds request)
43

Earned Value Scenario
44

1w 2w 3w 4w 5w 6w 7w 8w 9w 10w
$10K
$20K
$30K
$40K
$50K
$60K
Graphing Earned Value
45

Graphing Earned Value – week 1
� Task A started on time – 30% complete
� Task B started 2 days late – 30% complete
� Task C started 1 day late – 25% complete
� Tasks D, E, F, G, H, and J have not started
� Project Management is on-going
� Actual Costs reported for week 1 = $5000
46

1w 2w 3w 4w 5w 6w 7w 8w 9w 10w
$10K
$20K
$30K
$40K
$50K
$60K
Schedule
Variance
Cost
Variance
Graphing Earned Value – week 1
47

Questions
48