ahp salary report - ahp.org · healthcare philanthropy (ahp) retained mckinley advisors to conduct...
TRANSCRIPT
AHP SALARY REPORT
C A N A D A , 2 0 1 8
TABLE OF CONTENTS
EXECUTIVE SUMMARY .. . . . . . . . . . . . . . . . . . . . . . . . . . . 3
INTRODUCTION ... . . . . . . . . . . . . . . . . . . . . . . . . . . . . . . . . 4
METHODOLOGY .. . . . . . . . . . . . . . . . . . . . . . . . . . . . . . . . . . 4
RESPONDENT PROFILE . . . . . . . . . . . . . . . . . . . . . . . . . . . 5
ANNUAL SALARY .. . . . . . . . . . . . . . . . . . . . . . . . . . . . . . . 10
COMPENSATION AND BENEFITS . . . . . . . . . . . . 18
EMPLOYEE PERCEPTIONS .. . . . . . . . . . . . . . . . . . . . . 26
PROFILES . . . . . . . . . . . . . . . . . . . . . . . . . . . . . . . . . . . . . . . . . . 36
APPENDIX . . . . . . . . . . . . . . . . . . . . . . . . . . . . . . . . . . . . . . . . . 49
2018 AHP Salary and Compensation SurveyKey Findings and Recommendations – Canada
Prepared byMcKinley Advisors
December 2018
AHP SALARY REPORT | CANADA, 2018 3
EXECUTIVE SUMMARY
The Association for Healthcare Philanthropy’s 2018 Salary Report examines salary levels in Canada for 21 career categories (plus “Other”) in the field of health care philanthropy. Most respondents held one of the following six positions: Executive Director, President/CEO, Vice President, Director of Development, Development Officer and Major Gifts Officer.
The highest median salary reported in 2018 was for President/CEO at $185,000. The Vice President earned the second highest median salary of $135,750 and Executive Director earned the third highest median salary at $93,000. The Director of Development reported a median annual salary of $88,888, and the Major Gifts Officer earned $75,000. The Development Officer earned a median annual salary of $68,500. It should be noted that the number of respondents for some of these positions is low, and caution should be used when interpreting these data.
The survey measured several factors influencing pay, including the number of areas in which theindividuals work, respondents’ age, gender, education level, professional designations (e.g., CFRE,FAHP), number of staffed beds and type of institution employing them (e.g., academic, community,children’s hospital, etc.). Also examined for their impact on salary are the number of years respondents have been employed in health care fundraising and in their current position, the number of full-time equivalent staff in their development office and the number of people they supervise.
Other key findings from the survey include:
• There is a marked difference in salary for those with a master’s degree. While the median difference in salary between respondents with an associate degree ($85,000) and a bachelor’s degree ($95,000) is about $10,000, respondents with a master’s degree reported a median annual salary of $120,000.
• Male respondents earn more than their female colleagues (median annual salary of $115,000 compared to $82,000 for female respondents).
• Respondents with a designation (such as the CFRE or FAHP) reported much higher median salaries than those without a designation. In fact, FAHP holders reported a median salary of $145,000 compared to $105,000 for those who hold the CFRE, and $72,750 for those with no designations.
• Respondents in academic settings and long-term care facilities reported the highest median annual salaries ($117,500 and $122,690, respectively).
• Respondents in suburban settings reported the highest median salary ($117,550) compared to $92,000 from those in urban settings and $68,000 for respondents in rural settings.
AHP SALARY REPORT | CANADA, 2018 4
In its ongoing effort to serve as the source for education, networking, information and research in health care philanthropy, the Association for Healthcare Philanthropy (AHP) retained McKinley Advisors to conduct the 2018 AHP Salary Survey—a biennial research effort that provides data surrounding individual and institutional salary and compensation for fundraising professionals in health care environments. The following report is based on findings from the survey and sponsored by AHP. Using job descriptions developed by AHP, respondents were asked to provide several key data points, including individual and institutional characteristics, current and previous year salaries and bonus or additional compensation paid in 2017.
Results from this year’s study are detailed in the following pages, with comparisons to the 2016 AHP Salary Report when applicable. Similar to previous reports, annual salary data is available by job position. Profiles with detailed salary information have been included for positions with robust response rates, and descriptions for each position may be found in the Appendix. While no new positions were included, there were variations in question type included in this year’s survey. A few additional questions about benefits were added for more nuanced information and a new section of questions was added at the end of the survey to explore employment satisfaction and general impressions of the healthcare field. Data presented has been analyzed in full and according to various demographic factors, such as gender, professional tenure, organizational size and operating budget.
METHODOLOGY
The survey launched on August 14, 2018 and closed September 10, 2018, fielding for 28 days. There were 187 total responses, with 116 complete responses and 71 partial responses. The response rate was 14.8%. This report contains responses for Canadian respondents and all dollar amounts reflect Canadian Dollars.
Please note that throughout this report, percentages have been rounded to the nearest whole number. In cases where rounding has occurred, percent totals may not equal 100%. For the questions in which respondents can select more than one answer option, the percentages represent the percentage of respondents that selected that answer option as one of their answers. Those areas marked as “N/A” (not applicable) represent values that could not be calculated from the data collected due to factors such as incomplete responses. DESCRIPTION OF STATISTICS
• Count – The number of respondents who provided data for the question.
• Mean – The sum of all values divided by the number of values.
• Median – The mid-point of reported values, where half the reported values are lower, and half are higher, than this point. This also represents the second quartile (50%).
• Quartiles/Percentiles – Portions of the data that identify what points are greater than one-quarter (25%) and three-quarters (75%).
• Median percent change – The percentage difference from the last reported median in the 2016 AHP Salary Report.
JOB TITLES
The following job titles were included in this survey: Executive DirectorPresident/CEOVice PresidentChief Development OfficerChief Financial OfficerChief Operating OfficerDirector of DevelopmentDevelopment OfficerAnnual Giving OfficerMajor Gifts OfficerPlanned Giving Officer
INTRODUCTION
Philanthropy OperationsHuman ResourcesGrant WriterAdministrative AssistantDevelopment CoordinatorCampaign OfficerProspect ResearcherSpecial Events OfficerDatabase ManagerDonor Relations Coordinator
AHP SALARY REPORT | CANADA, 2018 5
RESPONDENT PROFILE
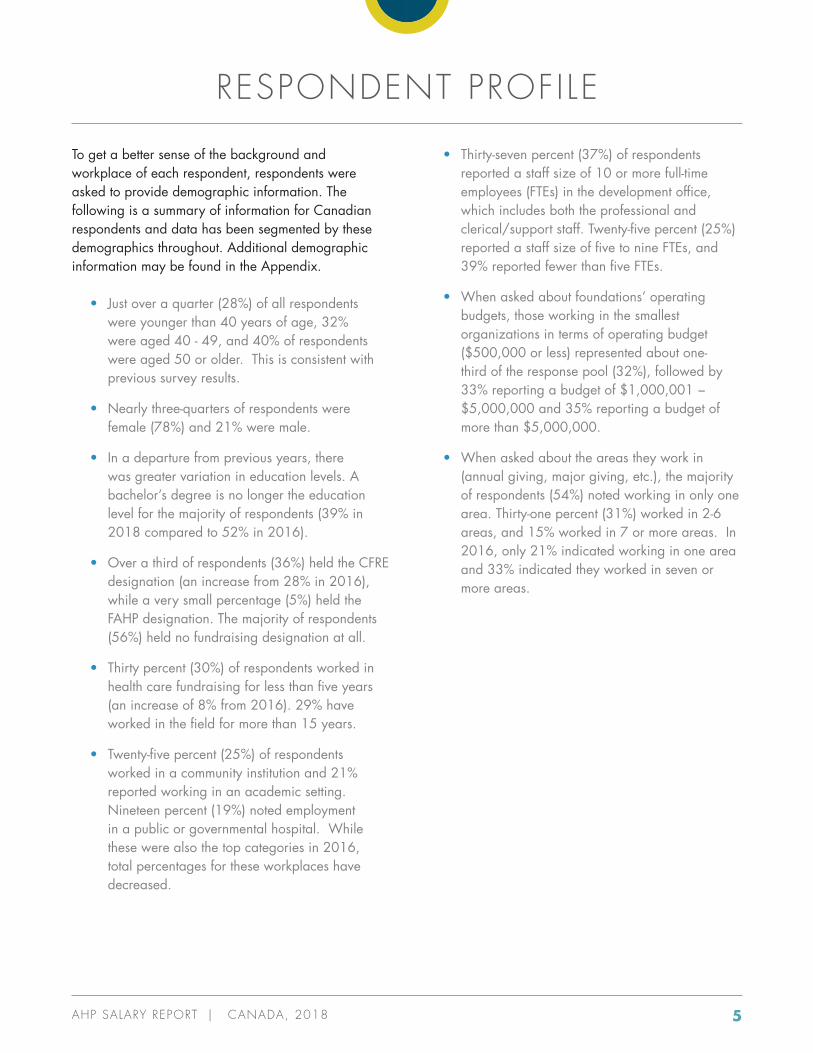
To get a better sense of the background and workplace of each respondent, respondents were asked to provide demographic information. The following is a summary of information for Canadian respondents and data has been segmented by these demographics throughout. Additional demographic information may be found in the Appendix.
• Just over a quarter (28%) of all respondents were younger than 40 years of age, 32% were aged 40 - 49, and 40% of respondents were aged 50 or older. This is consistent with previous survey results.
• Nearly three-quarters of respondents were female (78%) and 21% were male.
• In a departure from previous years, there was greater variation in education levels. A bachelor’s degree is no longer the education level for the majority of respondents (39% in 2018 compared to 52% in 2016).
• Over a third of respondents (36%) held the CFRE designation (an increase from 28% in 2016), while a very small percentage (5%) held the FAHP designation. The majority of respondents (56%) held no fundraising designation at all.
• Thirty percent (30%) of respondents worked in health care fundraising for less than five years (an increase of 8% from 2016). 29% have worked in the field for more than 15 years.
• Twenty-five percent (25%) of respondents worked in a community institution and 21% reported working in an academic setting. Nineteen percent (19%) noted employment in a public or governmental hospital. While these were also the top categories in 2016, total percentages for these workplaces have decreased.
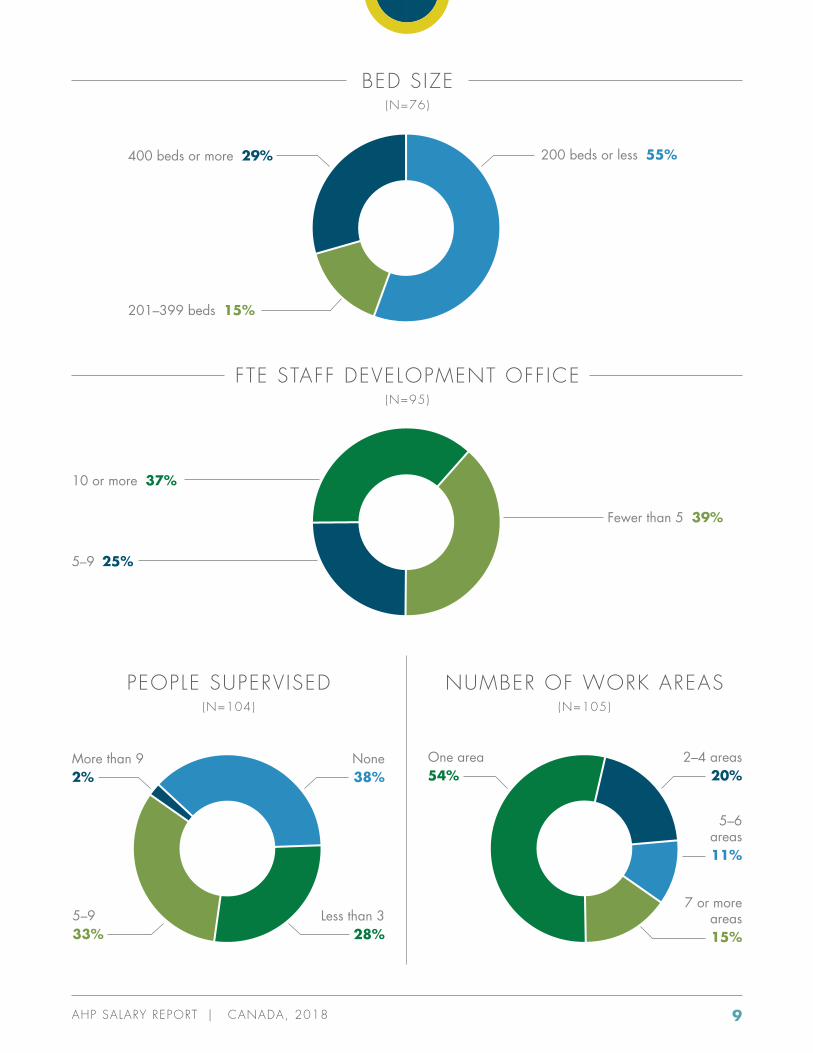
• Thirty-seven percent (37%) of respondents reported a staff size of 10 or more full-time employees (FTEs) in the development office, which includes both the professional and clerical/support staff. Twenty-five percent (25%) reported a staff size of five to nine FTEs, and 39% reported fewer than five FTEs.
• When asked about foundations’ operating budgets, those working in the smallest organizations in terms of operating budget ($500,000 or less) represented about one-third of the response pool (32%), followed by 33% reporting a budget of $1,000,001 − $5,000,000 and 35% reporting a budget of more than $5,000,000.
• When asked about the areas they work in (annual giving, major giving, etc.), the majority of respondents (54%) noted working in only one area. Thirty-one percent (31%) worked in 2-6 areas, and 15% worked in 7 or more areas. In 2016, only 21% indicated working in one area and 33% indicated they worked in seven or more areas.
AHP SALARY REPORT | CANADA, 2018 6
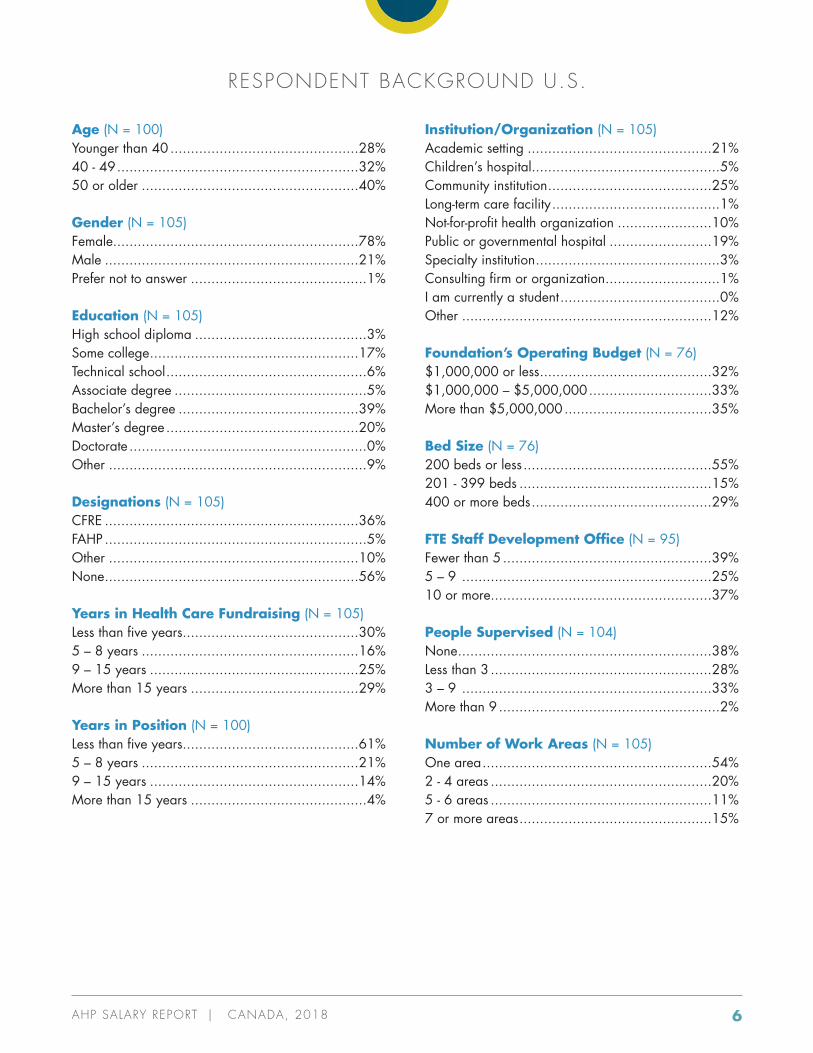
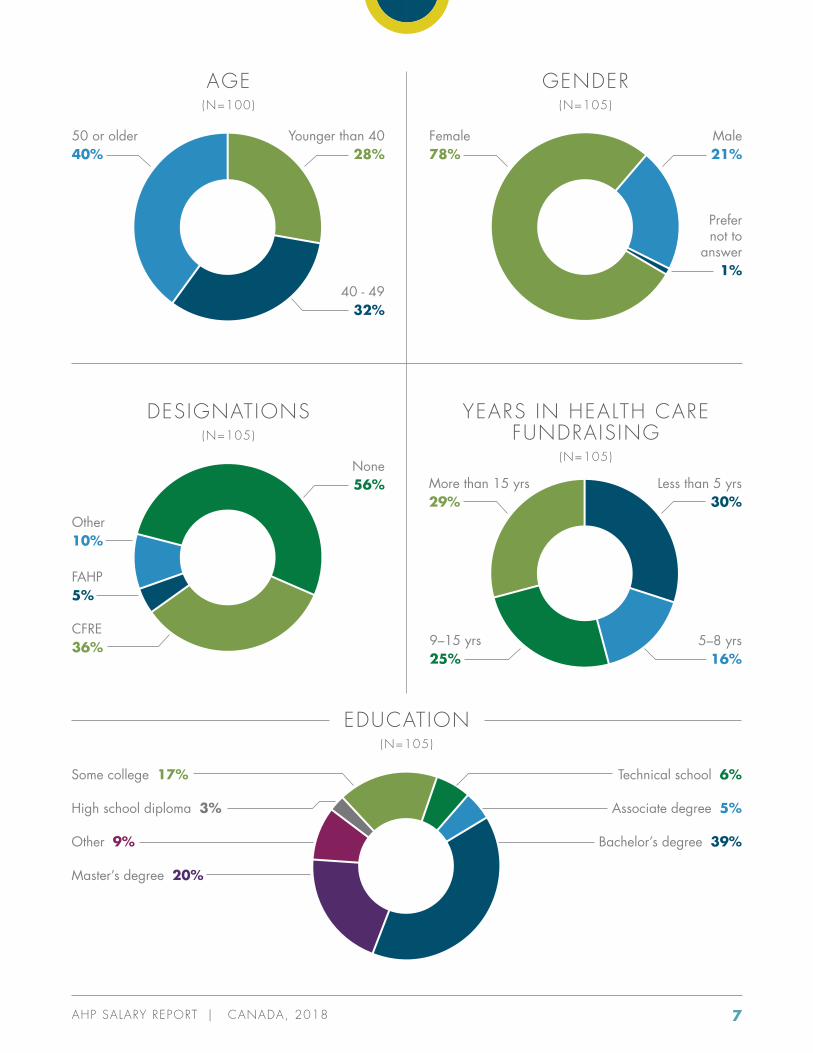
Age (N = 100)Younger than 40 ..............................................28%40 - 49 ...........................................................32%50 or older .....................................................40%
Gender (N = 105)Female............................................................78%Male ..............................................................21%Prefer not to answer ...........................................1%
Education (N = 105)High school diploma ..........................................3% Some college ...................................................17%Technical school .................................................6%Associate degree ...............................................5%Bachelor’s degree ............................................39%Master’s degree ...............................................20%Doctorate ..........................................................0%Other ...............................................................9%
Designations (N = 105)CFRE ..............................................................36% FAHP ................................................................5%Other .............................................................10%None ..............................................................56%
Years in Health Care Fundraising (N = 105)Less than five years...........................................30%5 – 8 years .....................................................16%9 – 15 years ...................................................25%More than 15 years .........................................29%
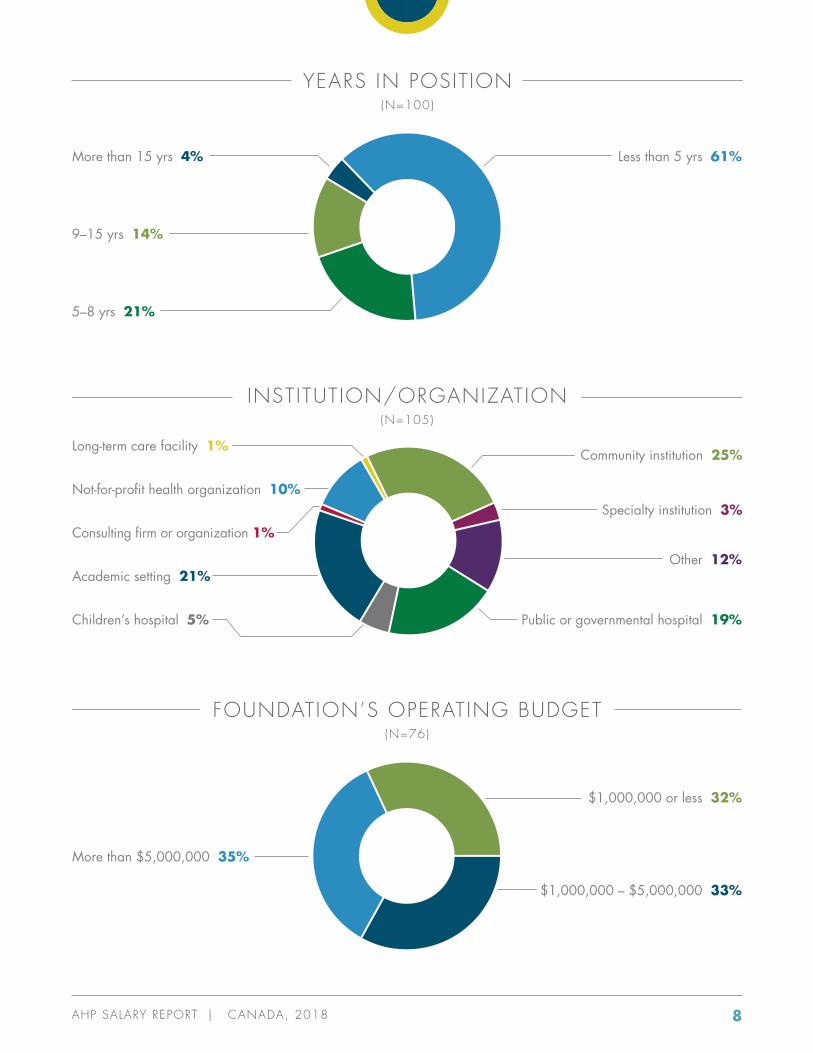
Years in Position (N = 100)Less than five years...........................................61%5 – 8 years .....................................................21%9 – 15 years ...................................................14%More than 15 years ...........................................4%
Institution/Organization (N = 105)Academic setting .............................................21%Children’s hospital..............................................5%Community institution ........................................25%Long-term care facility .........................................1%Not-for-profit health organization .......................10%Public or governmental hospital .........................19%Specialty institution .............................................3%Consulting firm or organization ............................1%I am currently a student .......................................0%Other .............................................................12%
Foundation’s Operating Budget (N = 76)$1,000,000 or less ..........................................32%$1,000,000 – $5,000,000 ..............................33%More than $5,000,000 ....................................35%
Bed Size (N = 76)200 beds or less ..............................................55%201 - 399 beds ...............................................15%400 or more beds ............................................29%
FTE Staff Development Office (N = 95)Fewer than 5 ...................................................39%5 – 9 .............................................................25%10 or more......................................................37%
People Supervised (N = 104)None ..............................................................38%Less than 3 ......................................................28%3 – 9 .............................................................33%More than 9 ......................................................2%
Number of Work Areas (N = 105)One area ........................................................54%2 - 4 areas ......................................................20%5 - 6 areas ......................................................11%7 or more areas ...............................................15%
RESPONDENT BACKGROUND U.S.
AHP SALARY REPORT | CANADA, 2018 7
Some college 17%
High school diploma 3%
Other 9%
Master’s degree 20%
EDUCATION (N=105)
Technical school 6%
Associate degree 5%
Bachelor’s degree 39%
AGE (N=100)
50 or older 40%
Younger than 4028%
40 - 4932%
GENDER (N=105)
Female 78%
Male21%
Prefer not to
answer1%
DESIGNATIONS (N=105)
Other 10%
FAHP 5%
CFRE 36%
None56%
9–15 yrs 25%
YEARS IN HEALTH CARE FUNDRAISING
(N=105)
More than 15 yrs 29%
Less than 5 yrs30%
5–8 yrs16%
AHP SALARY REPORT | CANADA, 2018 8
Academic setting 21%
Children’s hospital 5%
INSTITUTION/ORGANIZATION (N=105)
Community institution 25%Long-term care facility 1%
Not-for-profit health organization 10%
Other 12%
Public or governmental hospital 19%
Specialty institution 3%
Consulting firm or organization 1%
YEARS IN POSIT ION (N=100)
More than 15 yrs 4%
9–15 yrs 14%
5–8 yrs 21%
Less than 5 yrs 61%
FOUNDATION’S OPERATING BUDGET (N=76)
More than $5,000,000 35%
$1,000,000 or less 32%
$1,000,000 – $5,000,000 33%
AHP SALARY REPORT | CANADA, 2018 9
7 or more areas 15%
BED SIZE (N=76)
400 beds or more 29%
201–399 beds 15%
200 beds or less 55%
FTE STAFF DEVELOPMENT OFFICE (N=95)
5–9 25%
10 or more 37%
Fewer than 5 39%
5–9 33%
PEOPLE SUPERVISED (N=104)
More than 9 2%
None38%
Less than 328%
One area 54%
2–4 areas 20%
5–6 areas 11%
NUMBER OF WORK AREAS (N=105)
AHP SALARY REPORT | CANADA, 2018 10
ANNUAL SALARY
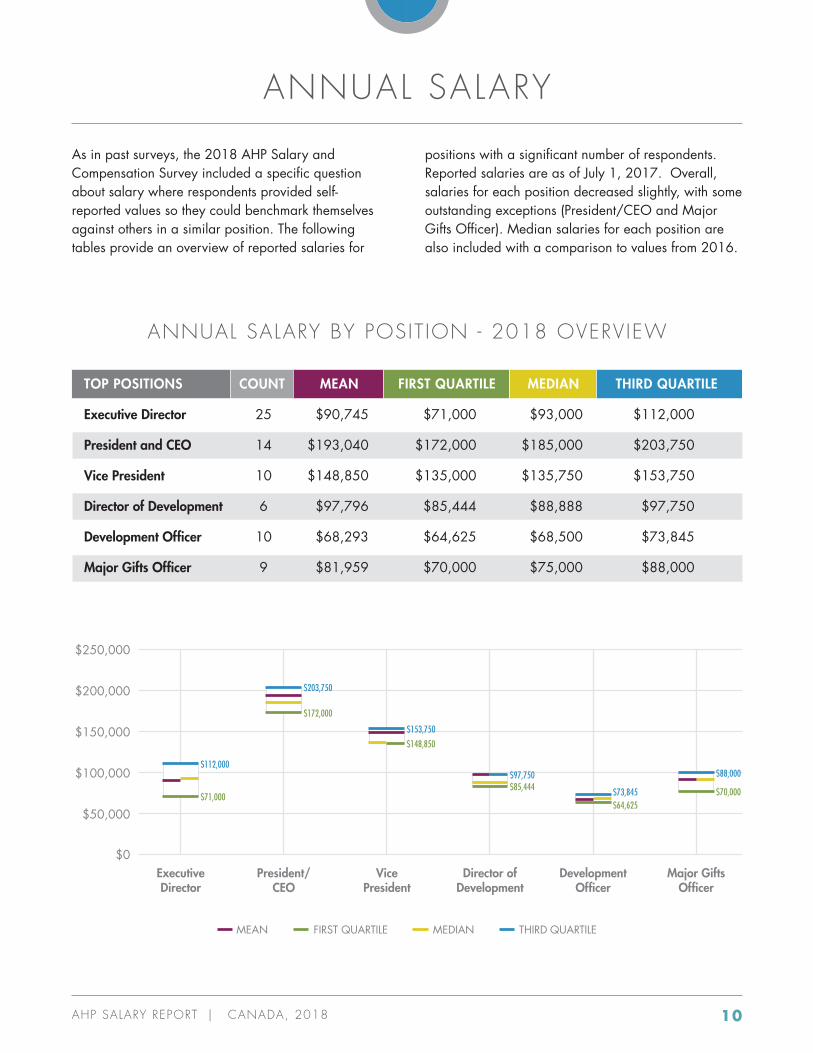
As in past surveys, the 2018 AHP Salary and Compensation Survey included a specific question about salary where respondents provided self-reported values so they could benchmark themselves against others in a similar position. The following tables provide an overview of reported salaries for
positions with a significant number of respondents. Reported salaries are as of July 1, 2017. Overall, salaries for each position decreased slightly, with some outstanding exceptions (President/CEO and Major Gifts Officer). Median salaries for each position are also included with a comparison to values from 2016.
TOP POSITIONS COUNT MEAN FIRST QUARTILE MEDIAN THIRD QUARTILE
Executive Director 25 $90,745 $71,000 $93,000 $112,000
President and CEO 14 $193,040 $172,000 $185,000 $203,750
Vice President 10 $148,850 $135,000 $135,750 $153,750
Director of Development 6 $97,796 $85,444 $88,888 $97,750
Development Officer 10 $68,293 $64,625 $68,500 $73,845
Major Gifts Officer 9 $81,959 $70,000 $75,000 $88,000
ANNUAL SALARY BY POSIT ION - 2018 OVERVIEW
$0
$50,000
$100,000
$150,000
$200,000
$250,000
Executive Director
President/ CEO
Vice President
Director of Development
Development Officer
Major Gifts Officer
$112,000
$203,750
$71,000
$172,000
MEAN FIRST QUARTILE THIRD QUARTILEMEDIAN
$153,750
$97,750
$148,850
$85,444 $73,845$64,625
$88,000
$70,000
AHP SALARY REPORT | CANADA, 2018 11
POSITION 2018 COUNT 2016 MEDIAN 2018 MEDIAN % CHANGE
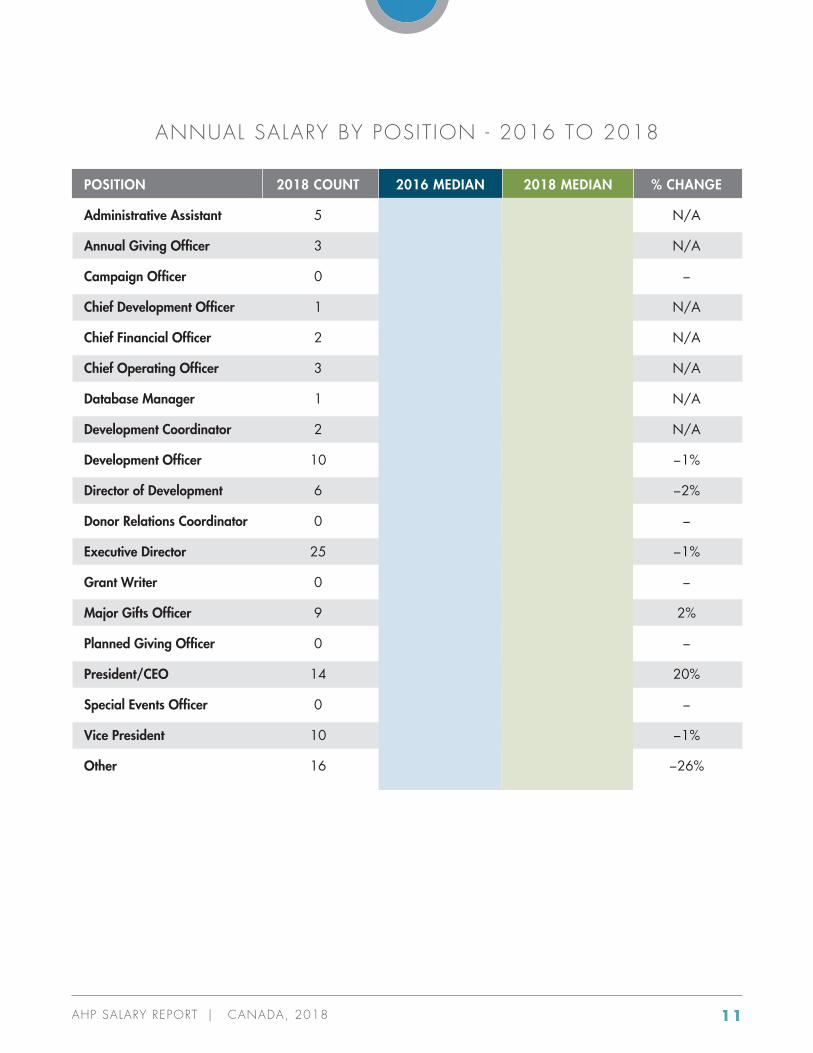
Administrative Assistant 5 N/A N/A N/A
Annual Giving Officer 3 N/A N/A N/A
Campaign Officer 0 − − −
Chief Development Officer 1 N/A N/A N/A
Chief Financial Officer 2 N/A N/A N/A
Chief Operating Officer 3 N/A N/A N/A
Database Manager 1 N/A N/A N/A
Development Coordinator 2 N/A N/A N/A
Development Officer 10 $69,000 $68,500 −1%
Director of Development 6 $90,250 $88,888 −2%
Donor Relations Coordinator 0 − − −
Executive Director 25 $94,000 $93,000 −1%
Grant Writer 0 − − −
Major Gifts Officer 9 $73,500 $75,000 2%
Planned Giving Officer 0 − − −
President/CEO 14 $154,500 $185,000 20%
Special Events Officer 0 − − −
Vice President 10 $137,500 $135,750 −1%
Other 16 $88,470 $65,896 −26%
ANNUAL SALARY BY POSIT ION - 2016 TO 2018
AHP SALARY REPORT | CANADA, 2018 12
ANNUAL SALARY BY POSIT ION - 2016 TO 2018
2018 MEDIAN
2016 MEDIAN
Director of Development
Development Officer
Executive Director
Major Gifts Officer
President/CEO
Vice President
Other
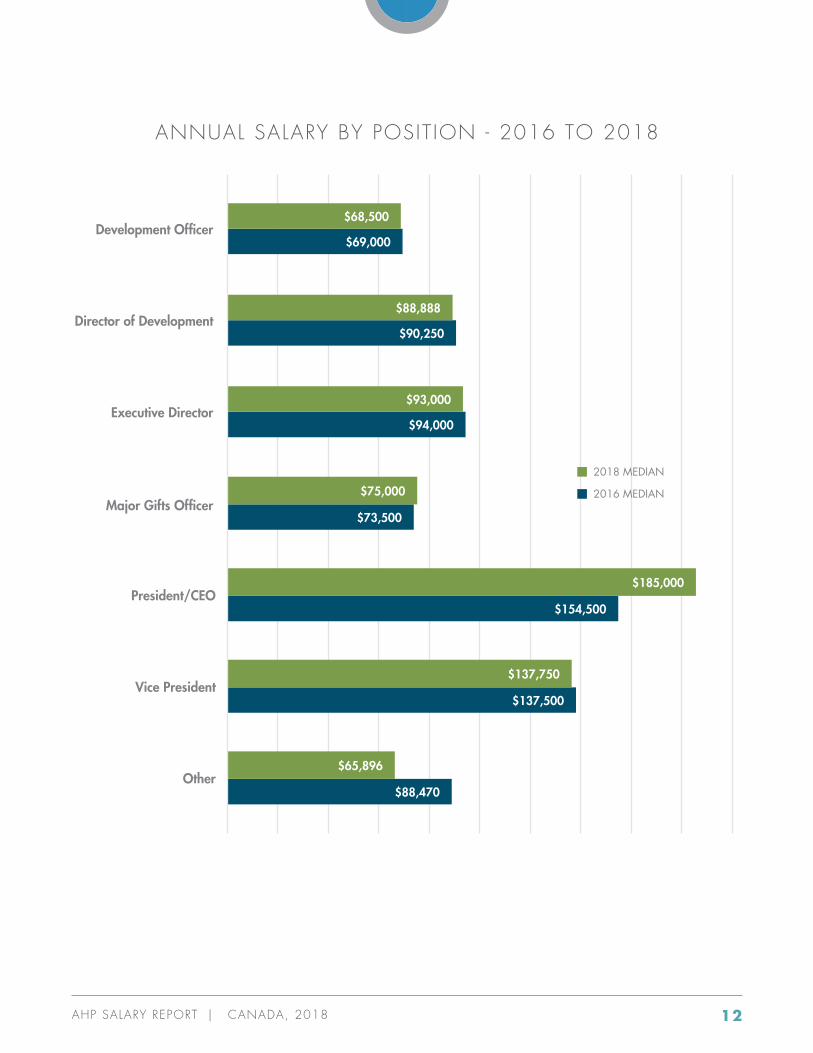
$69,000
$68,500
$90,250
$88,888
$94,000
$93,000
$73,500
$75,000
$154,500
$185,000
$137,500
$137,750
$88,470
$65,896
AHP SALARY REPORT | CANADA, 2018 13
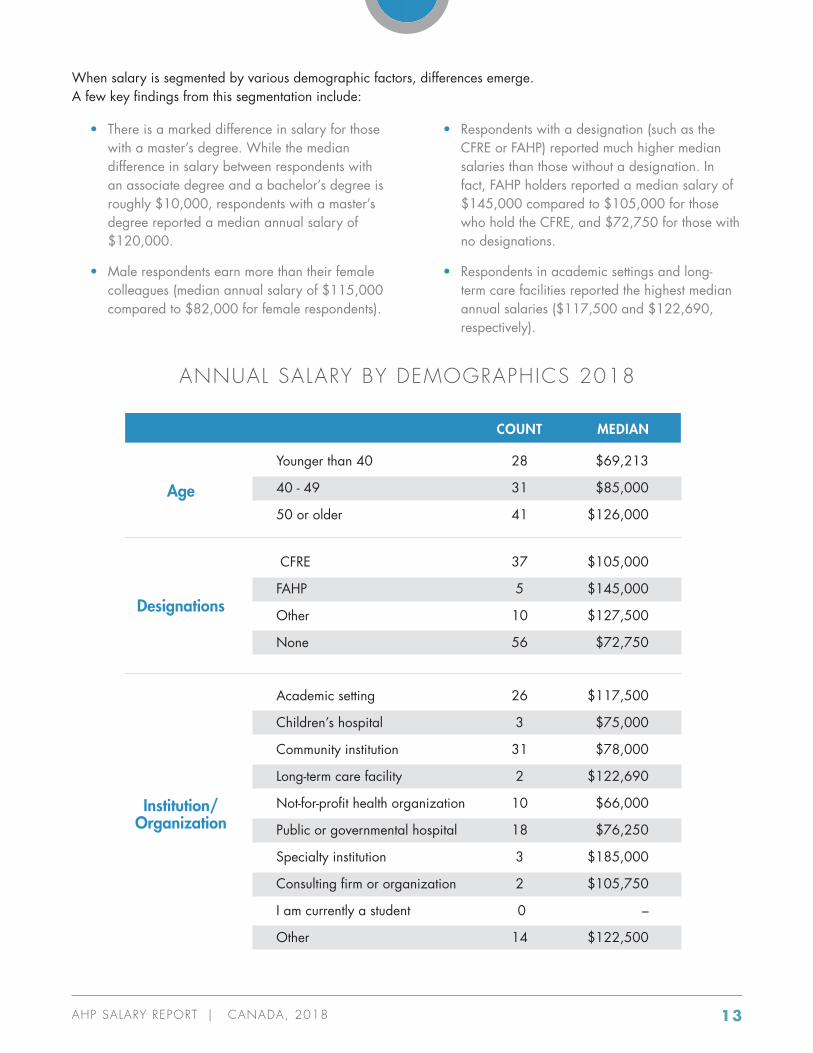
When salary is segmented by various demographic factors, differences emerge. A few key findings from this segmentation include:
• There is a marked difference in salary for those with a master’s degree. While the median difference in salary between respondents with an associate degree and a bachelor’s degree is roughly $10,000, respondents with a master’s degree reported a median annual salary of $120,000.
• Male respondents earn more than their female colleagues (median annual salary of $115,000 compared to $82,000 for female respondents).
• Respondents with a designation (such as the CFRE or FAHP) reported much higher median salaries than those without a designation. In fact, FAHP holders reported a median salary of $145,000 compared to $105,000 for those who hold the CFRE, and $72,750 for those with no designations.
• Respondents in academic settings and long-term care facilities reported the highest median annual salaries ($117,500 and $122,690, respectively).
ANNUAL SALARY BY DEMOGRAPHICS 2018
Age
Designations
Institution/ Organization
COUNT MEDIAN
Younger than 40 28 $69,213
40 - 49 31 $85,000
50 or older 41 $126,000
CFRE 37 $105,000
FAHP 5 $145,000
Other 10 $127,500
None 56 $72,750
Academic setting 26 $117,500
Children’s hospital 3 $75,000
Community institution 31 $78,000
Long-term care facility 2 $122,690
Not-for-profit health organization 10 $66,000
Public or governmental hospital 18 $76,250
Specialty institution 3 $185,000
Consulting firm or organization 2 $105,750
I am currently a student 0 –
Other 14 $122,500
AHP SALARY REPORT | CANADA, 2018 14
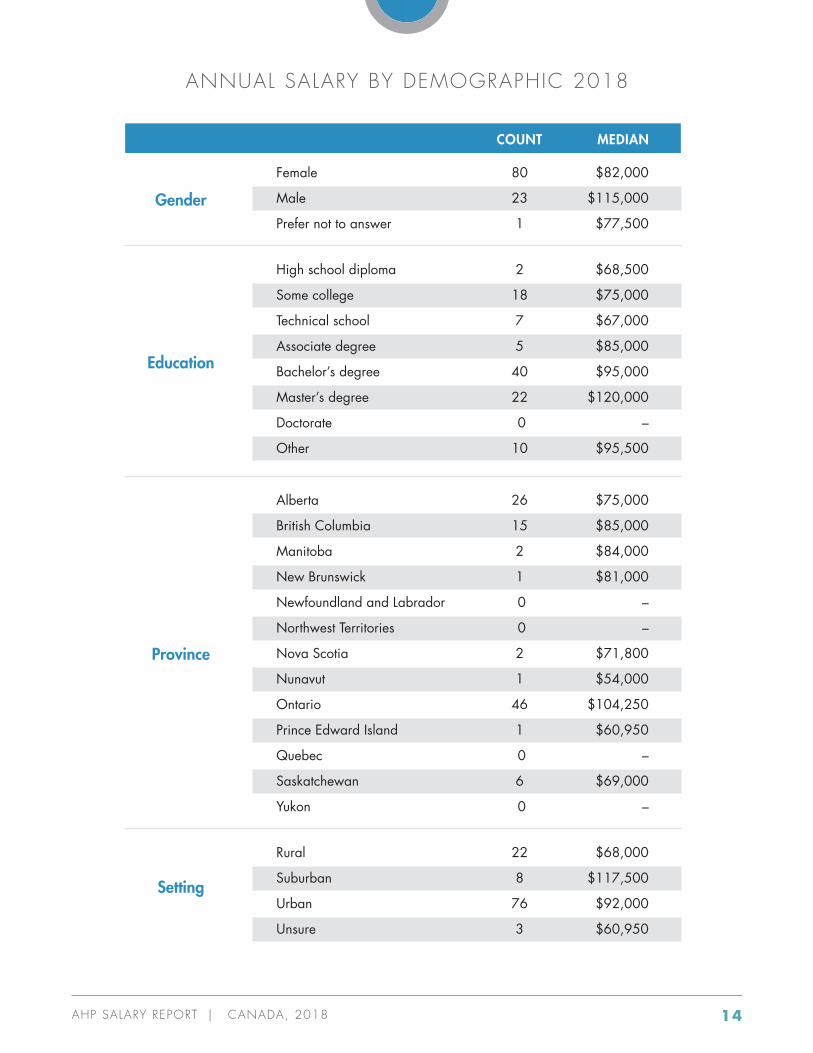
ANNUAL SALARY BY DEMOGRAPHIC 2018
Gender
Education
Province
Setting
COUNT MEDIAN
Female 80 $82,000
Male 23 $115,000
Prefer not to answer 1 $77,500
High school diploma 2 $68,500
Some college 18 $75,000
Technical school 7 $67,000
Associate degree 5 $85,000
Bachelor’s degree 40 $95,000
Master’s degree 22 $120,000
Doctorate 0 –
Other 10 $95,500
Alberta 26 $75,000
British Columbia 15 $85,000
Manitoba 2 $84,000
New Brunswick 1 $81,000
Newfoundland and Labrador 0 –
Northwest Territories 0 –
Nova Scotia 2 $71,800
Nunavut 1 $54,000
Ontario 46 $104,250
Prince Edward Island 1 $60,950
Quebec 0 –
Saskatchewan 6 $69,000
Yukon 0 –
Rural 22 $68,000
Suburban 8 $117,500
Urban 76 $92,000
Unsure 3 $60,950
AHP SALARY REPORT | CANADA, 2018 15
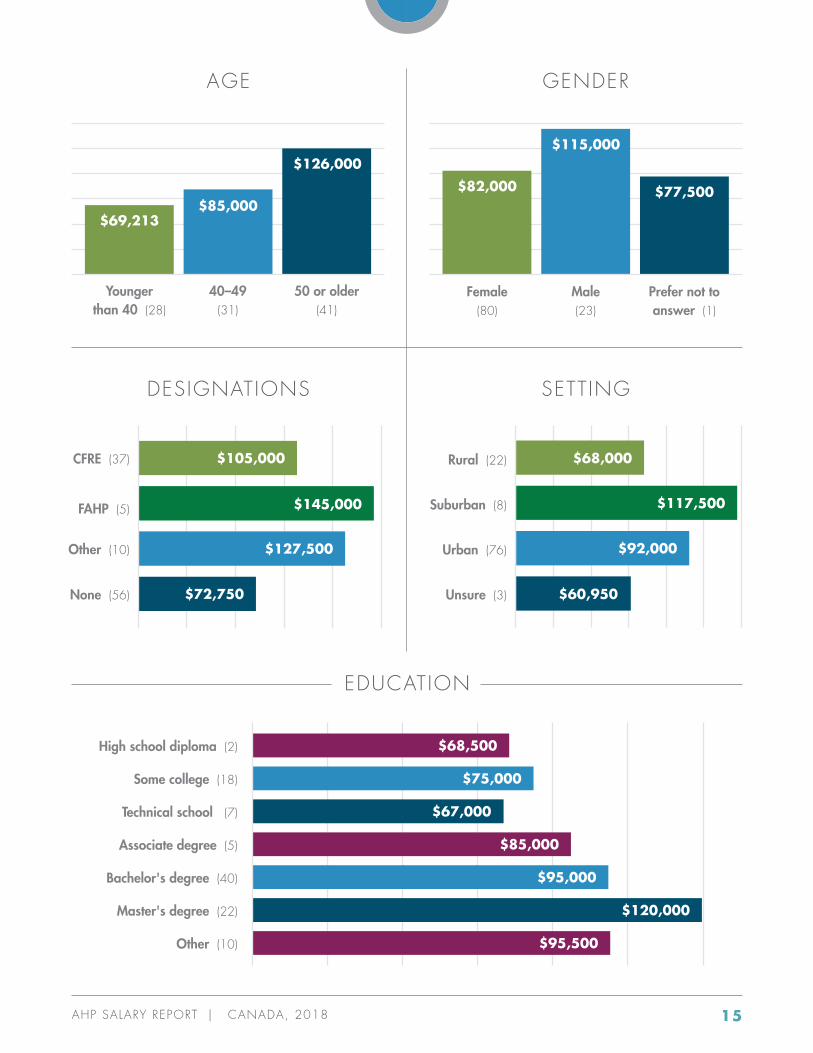
EDUCATION
GENDER
Female (80)
Male (23)
Prefer not to answer (1)
$82,000
$115,000
$77,500
AGE
50 or older(41)
40–49 (31)
Younger than 40 (28)
$69,213$85,000
$126,000
DESIGNATIONS
CFRE (37)
FAHP (5)
Other (10)
None (56)
$105,000
$145,000
$127,500
$72,750
SETTING
Rural (22)
Suburban (8)
Urban (76)
Unsure (3)
$68,000
$117,500
$92,000
$60,950
High school diploma (2) $68,500
Some college (18) $75,000
Technical school (7) $67,000
Associate degree (5) $85,000
Bachelor's degree (40) $95,000
Master's degree (22) $120,000
Other (10) $95,500
AHP SALARY REPORT | CANADA, 2018 16
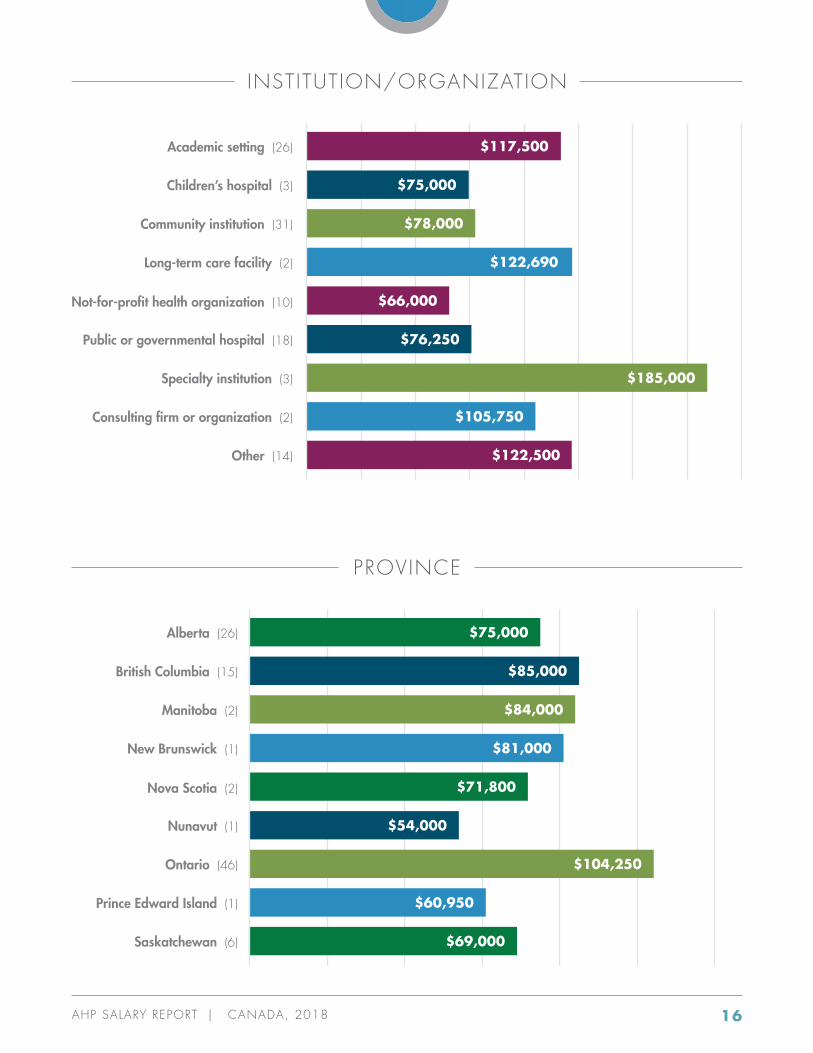
INSTITUTION/ORGANIZATION
PROVINCE
Other (14)
Saskatchewan (6)
Consulting firm or organization (2)
Prince Edward Island (1)
Specialty institution (3)
Ontario (46)
Public or governmental hospital (18)
Nunavut (1)
Not-for-profit health organization (10)
Nova Scotia (2)
Long-term care facility (2)
New Brunswick (1)
Community institution (31)
Manitoba (2)
Children’s hospital (3)
British Columbia (15)
Academic setting (26)
Alberta (26)
$117,500
$75,000
$75,000
$85,000
$78,000
$84,000
$122,690
$81,000
$66,000
$71,800
$76,250
$54,000
$185,000
$104,250
$105,750
$60,950
$122,500
$69,000
AHP SALARY REPORT | CANADA, 2018 17
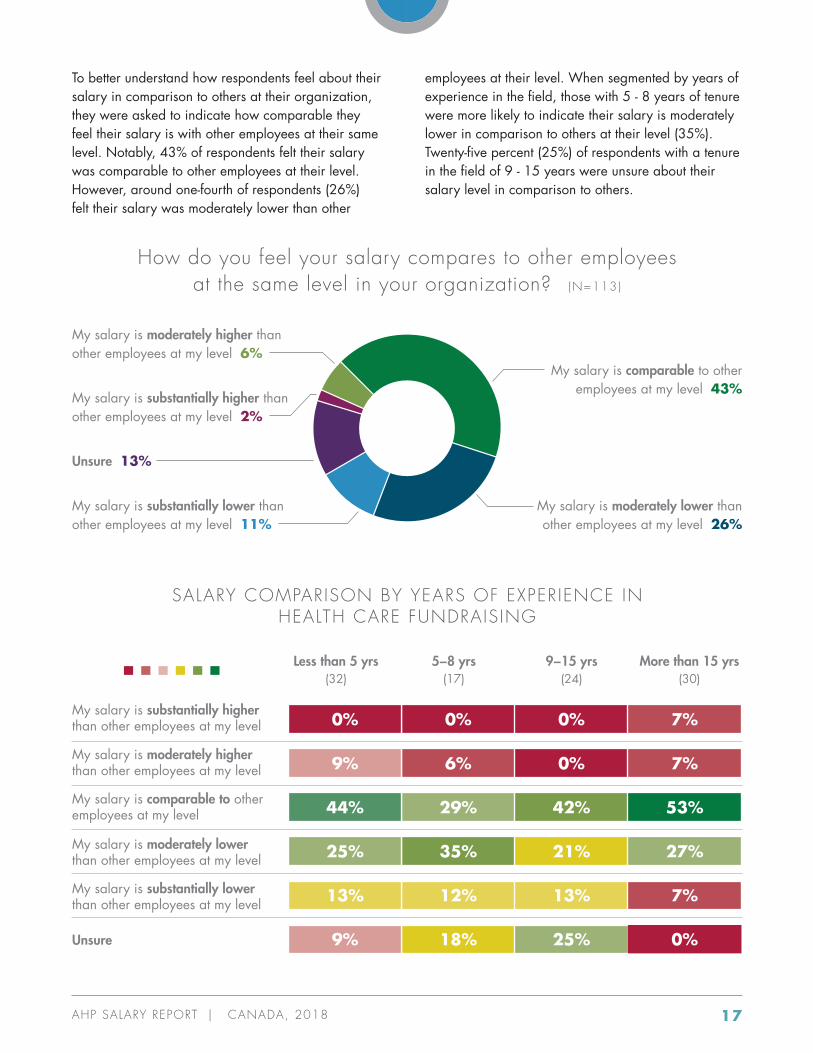
To better understand how respondents feel about their salary in comparison to others at their organization, they were asked to indicate how comparable they feel their salary is with other employees at their same level. Notably, 43% of respondents felt their salary was comparable to other employees at their level. However, around one-fourth of respondents (26%) felt their salary was moderately lower than other
employees at their level. When segmented by years of experience in the field, those with 5 - 8 years of tenure were more likely to indicate their salary is moderately lower in comparison to others at their level (35%). Twenty-five percent (25%) of respondents with a tenure in the field of 9 - 15 years were unsure about their salary level in comparison to others.
How do you feel your salary compares to other employees at the same level in your organization? (N=113)
SALARY COMPARISON BY YEARS OF EXPERIENCE IN HEALTH CARE FUNDRAISING
My salary is substantially higher than other employees at my level 2%
My salary is moderately higher than other employees at my level 6%
My salary is substantially lower than other employees at my level 11%
Unsure 13%
My salary is moderately lower than other employees at my level 26%
My salary is comparable to other employees at my level 43%
My salary is substantially higher than other employees at my level
My salary is moderately higher than other employees at my level
My salary is comparable to other employees at my level
My salary is moderately lower than other employees at my level
My salary is substantially lower than other employees at my level
Unsure
0%0% 0% 7%
6%9% 0% 7%
29%44% 42% 53%
35%25% 21% 27%
12%13% 13% 7%
18%9% 25% 0%
Less than 5 yrs (32)
5−8 yrs (17)
9−15 yrs (24)
More than 15 yrs (30)
AHP SALARY REPORT | CANADA, 2018 18
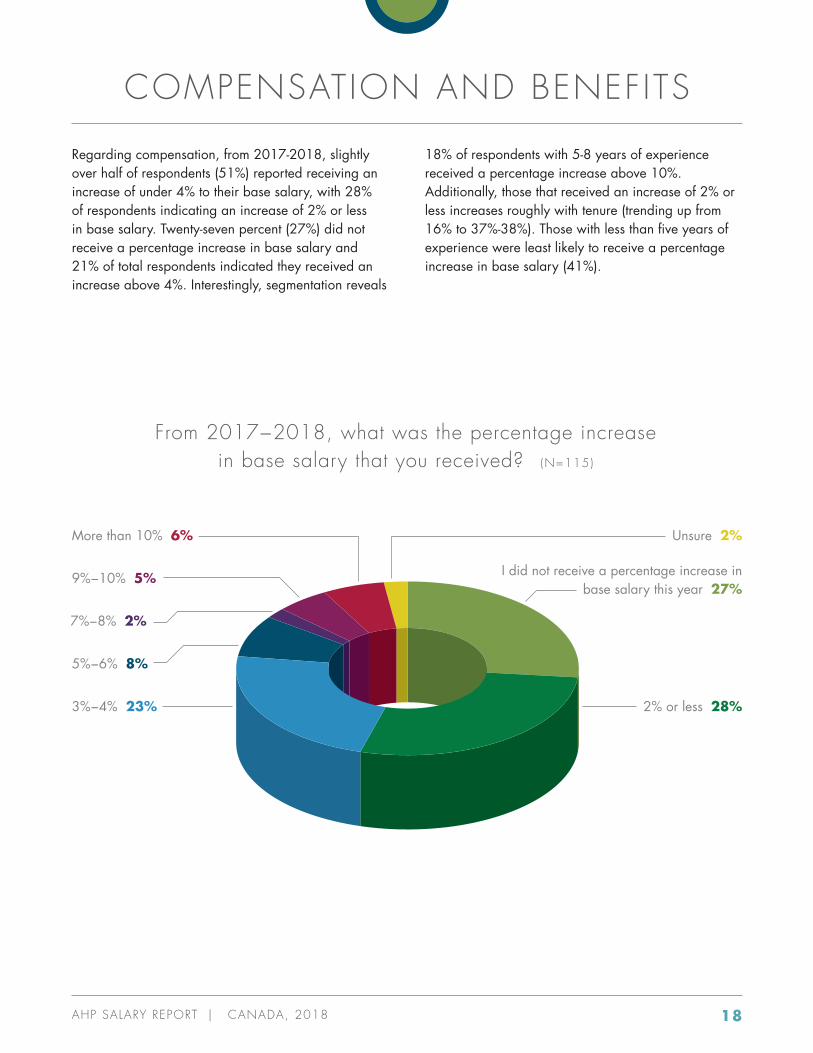
COMPENSATION AND BENEFITS
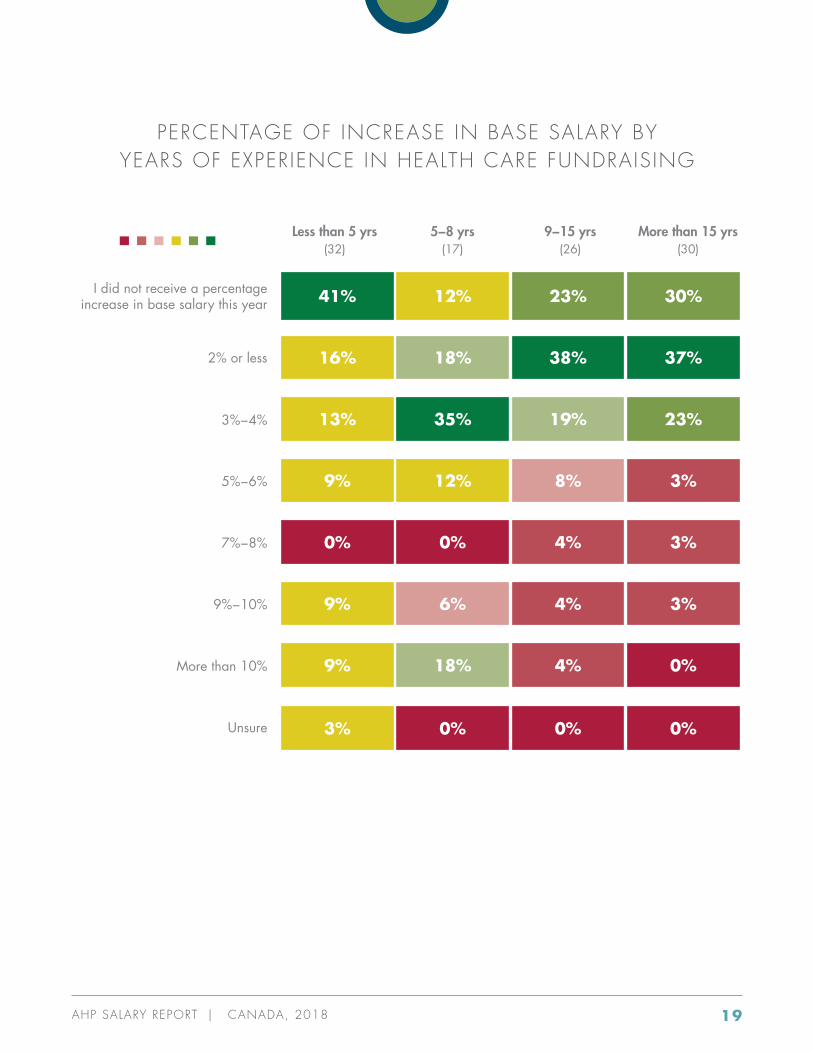
Regarding compensation, from 2017-2018, slightly over half of respondents (51%) reported receiving an increase of under 4% to their base salary, with 28% of respondents indicating an increase of 2% or less in base salary. Twenty-seven percent (27%) did not receive a percentage increase in base salary and 21% of total respondents indicated they received an increase above 4%. Interestingly, segmentation reveals
18% of respondents with 5-8 years of experience received a percentage increase above 10%. Additionally, those that received an increase of 2% or less increases roughly with tenure (trending up from 16% to 37%-38%). Those with less than five years of experience were least likely to receive a percentage increase in base salary (41%).
I did not receive a percentage increase in base salary this year 27%
7%−8% 2%
2% or less 28%
Unsure 2%More than 10% 6%
9%−10% 5%
5%−6% 8%
3%−4% 23%
From 2017−2018, what was the percentage increase in base salary that you received? (N=115)
AHP SALARY REPORT | CANADA, 2018 19
PERCENTAGE OF INCREASE IN BASE SALARY BYYEARS OF EXPERIENCE IN HEALTH CARE FUNDRAISING
Less than 5 yrs (32)
5−8 yrs (17)
9−15 yrs (26)
More than 15 yrs (30)
I did not receive a percentage increase in base salary this year
2% or less
3%−4%
5%−6%
7%−8%
9%−10%
More than 10%
Unsure
41%
16%
13%
9%
0%
9%
12%
18%
35%
12%
0%
6%
23%
38%
19%
8%
4%
4%
30%
37%
23%
3%
3%
3%
9% 18% 4% 0%
3% 0% 0% 0%
AHP SALARY REPORT | CANADA, 2018 20
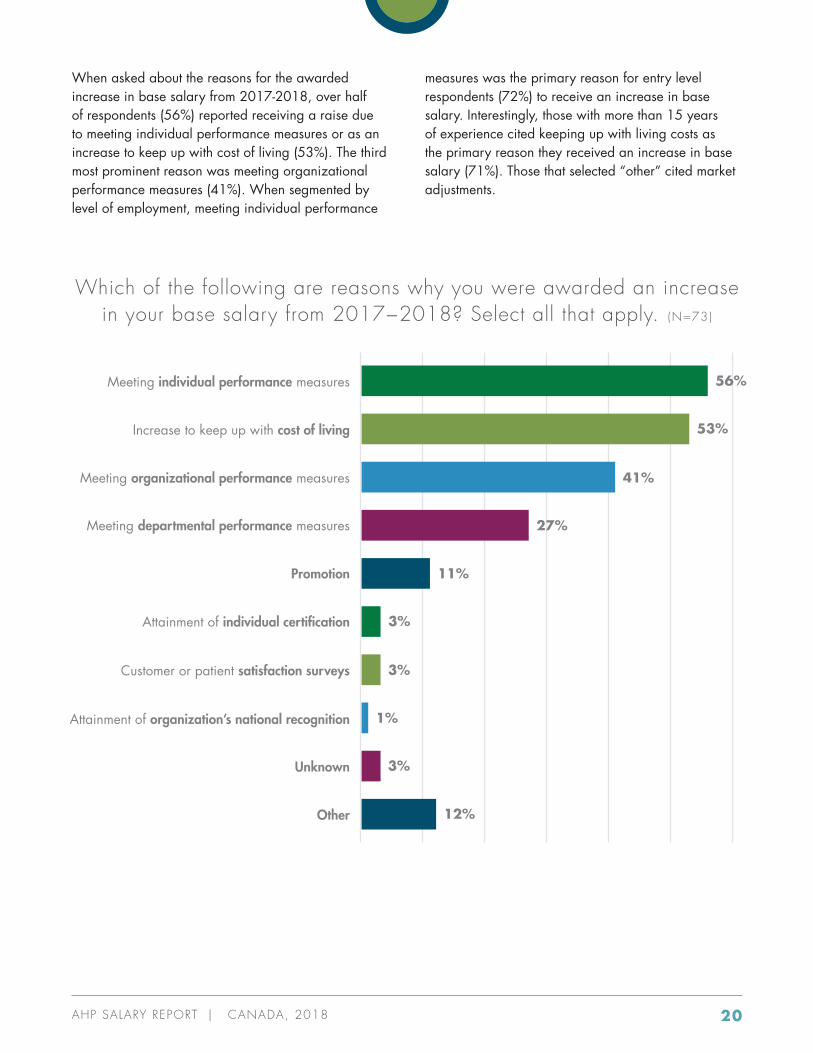
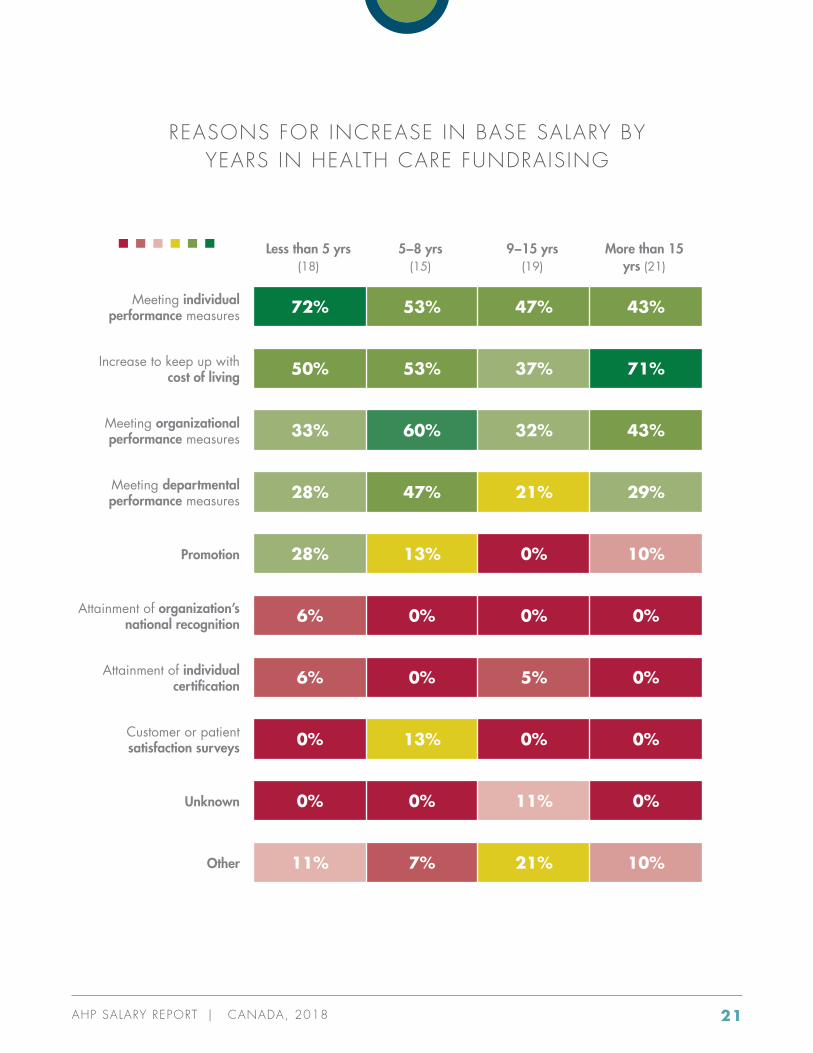
When asked about the reasons for the awarded increase in base salary from 2017-2018, over half of respondents (56%) reported receiving a raise due to meeting individual performance measures or as an increase to keep up with cost of living (53%). The third most prominent reason was meeting organizational performance measures (41%). When segmented by level of employment, meeting individual performance
measures was the primary reason for entry level respondents (72%) to receive an increase in base salary. Interestingly, those with more than 15 years of experience cited keeping up with living costs as the primary reason they received an increase in base salary (71%). Those that selected “other” cited market adjustments.
Which of the following are reasons why you were awarded an increase in your base salary from 2017−2018? Select all that apply. (N=73)
Promotion
Meeting individual performance measures
Increase to keep up with cost of living
Meeting organizational performance measures
Meeting departmental performance measures
Attainment of individual certification
Customer or patient satisfaction surveys
Attainment of organization’s national recognition
Unknown
Other
$101,750 56%
53%
41%
27%
11%
3%
3%
1%
3%
12%
AHP SALARY REPORT | CANADA, 2018 21
REASONS FOR INCREASE IN BASE SALARY BY YEARS IN HEALTH CARE FUNDRAISING
Meeting individual performance measures 53%72% 47% 43%
Increase to keep up with cost of living 53%50% 37% 71%
Meeting organizational performance measures 60%33% 32% 43%
Meeting departmental performance measures 47%28% 21% 29%
Promotion 13%28% 0% 10%
Attainment of organization’s national recognition 0%6% 0% 0%
Attainment of individual certification 0%6% 5% 0%
Customer or patient satisfaction surveys 13%0% 0% 0%
Unknown 0%0% 11% 0%
Other 7%11% 21% 10%
Less than 5 yrs (18)
5−8 yrs (15)
9−15 yrs (19)
More than 15 yrs (21)
AHP SALARY REPORT | CANADA, 2018 22
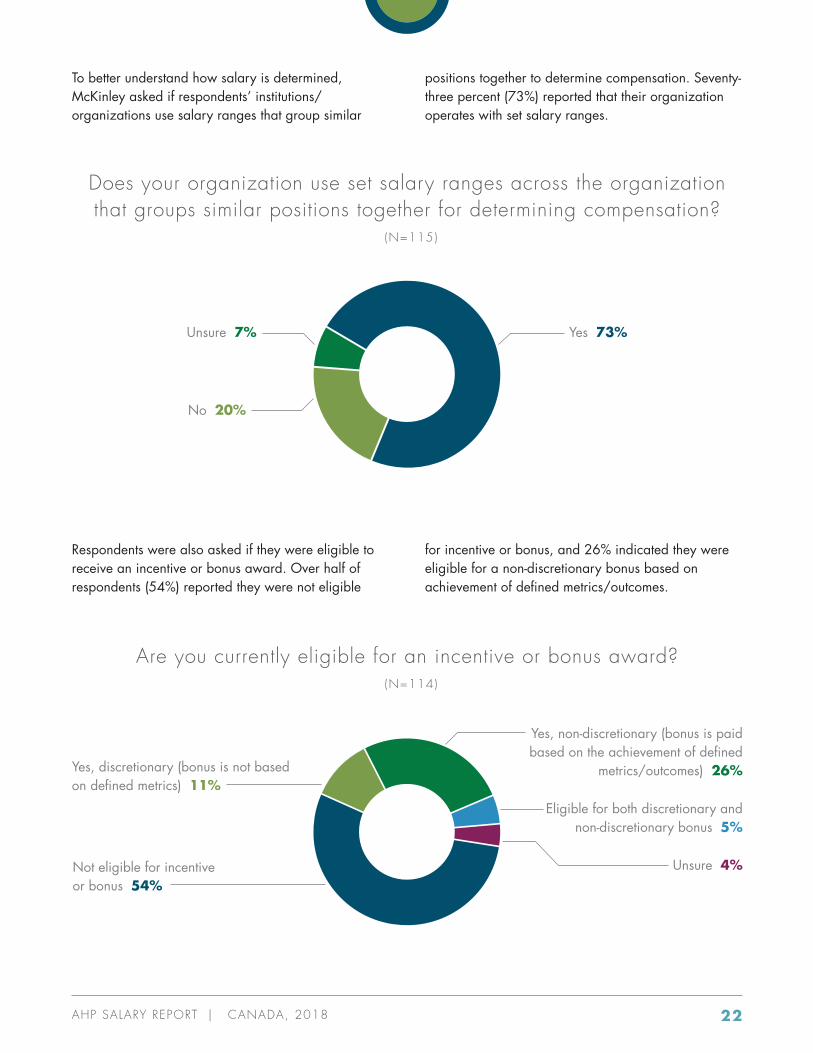
To better understand how salary is determined, McKinley asked if respondents’ institutions/organizations use salary ranges that group similar
positions together to determine compensation. Seventy-three percent (73%) reported that their organization operates with set salary ranges.
Respondents were also asked if they were eligible to receive an incentive or bonus award. Over half of respondents (54%) reported they were not eligible
for incentive or bonus, and 26% indicated they were eligible for a non-discretionary bonus based on achievement of defined metrics/outcomes.
Does your organization use set salary ranges across the organization that groups similar positions together for determining compensation?
(N=115)
Are you currently eligible for an incentive or bonus award? (N=114)
Yes 73%Unsure 7%
Yes, discretionary (bonus is not based on defined metrics) 11%
Yes, non-discretionary (bonus is paid based on the achievement of defined
metrics/outcomes) 26%
Not eligible for incentive or bonus 54%
Unsure 4%
Eligible for both discretionary and non-discretionary bonus 5%
No 20%
AHP SALARY REPORT | CANADA, 2018 23
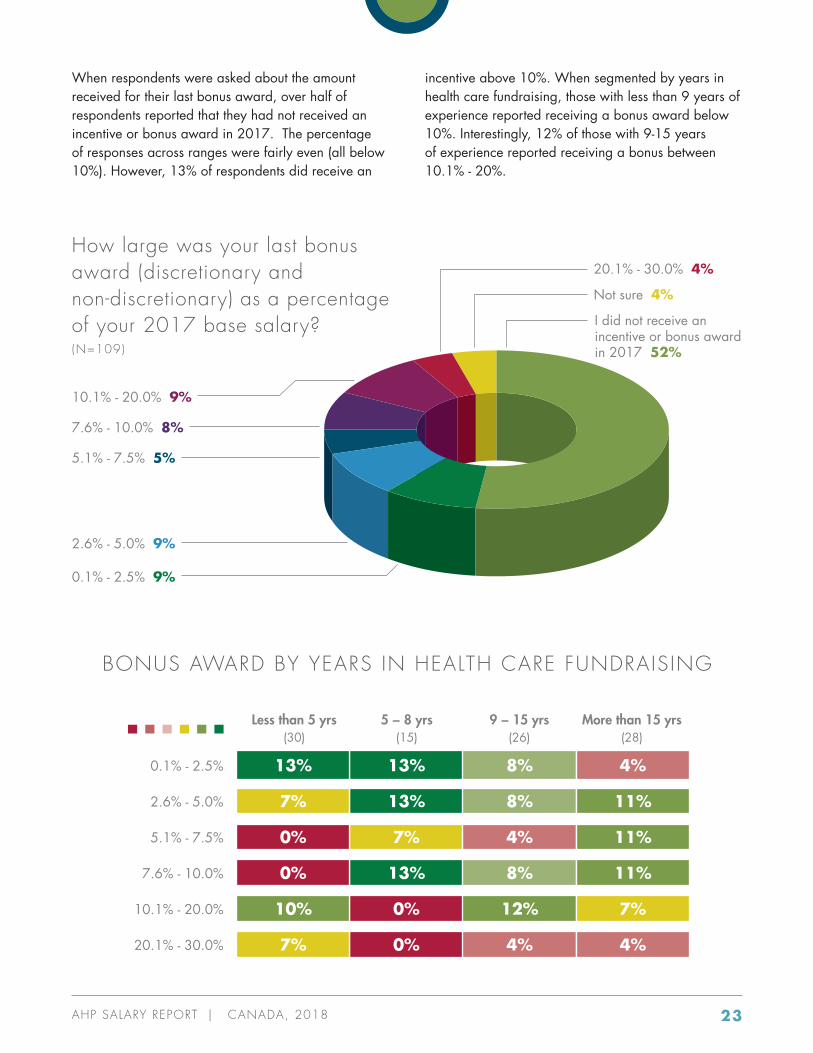
When respondents were asked about the amount received for their last bonus award, over half of respondents reported that they had not received an incentive or bonus award in 2017. The percentage of responses across ranges were fairly even (all below 10%). However, 13% of respondents did receive an
incentive above 10%. When segmented by years in health care fundraising, those with less than 9 years of experience reported receiving a bonus award below 10%. Interestingly, 12% of those with 9-15 years of experience reported receiving a bonus between 10.1% - 20%.
BONUS AWARD BY YEARS IN HEALTH CARE FUNDRAISING
Less than 5 yrs (30)
5 − 8 yrs (15)
9 − 15 yrs (26)
More than 15 yrs (28)
0.1% - 2.5% 13%13% 8% 4%
5.1% - 7.5% 7%0% 4% 11%
13%2.6% - 5.0% 7% 8% 11%
7.6% - 10.0% 13%0% 8% 11%
10.1% - 20.0% 0%10% 12% 7%
20.1% - 30.0% 0%7% 4% 4%
How large was your last bonus award (discretionary and non-discretionary) as a percentage of your 2017 base salary? (N=109)
I did not receive an incentive or bonus award in 2017 52%
Not sure 4%
20.1% - 30.0% 4%
10.1% - 20.0% 9%
7.6% - 10.0% 8%
5.1% - 7.5% 5%
2.6% - 5.0% 9%
0.1% - 2.5% 9%
AHP SALARY REPORT | CANADA, 2018 24
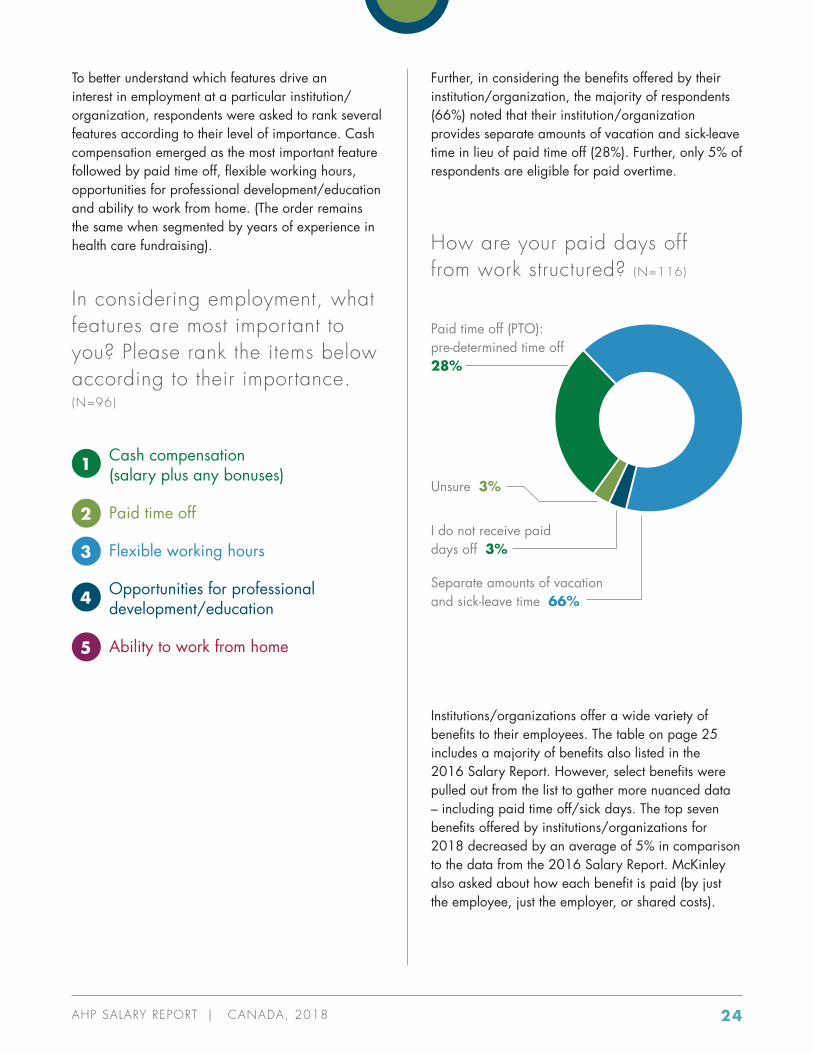
To better understand which features drive an interest in employment at a particular institution/ organization, respondents were asked to rank several features according to their level of importance. Cash compensation emerged as the most important feature followed by paid time off, flexible working hours, opportunities for professional development/education and ability to work from home. (The order remains the same when segmented by years of experience in health care fundraising).
Further, in considering the benefits offered by their institution/organization, the majority of respondents (66%) noted that their institution/organization provides separate amounts of vacation and sick-leave time in lieu of paid time off (28%). Further, only 5% of respondents are eligible for paid overtime.
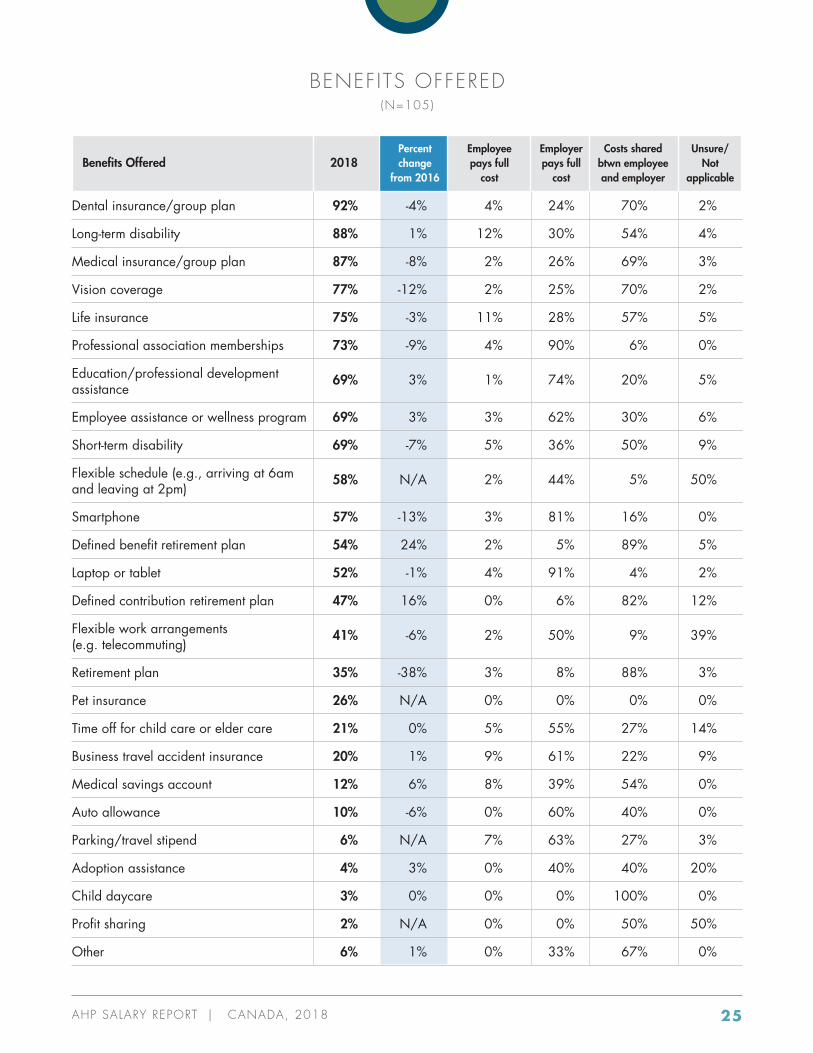
Institutions/organizations offer a wide variety of benefits to their employees. The table on page 25 includes a majority of benefits also listed in the 2016 Salary Report. However, select benefits were pulled out from the list to gather more nuanced data – including paid time off/sick days. The top seven benefits offered by institutions/organizations for 2018 decreased by an average of 5% in comparison to the data from the 2016 Salary Report. McKinley also asked about how each benefit is paid (by just the employee, just the employer, or shared costs).
In considering employment, what features are most important to you? Please rank the items below according to their importance. (N=96)
How are your paid days off from work structured? (N=116)
1 Cash compensation
(salary plus any bonuses)
2 Paid time off
3 Flexible working hours
4 Opportunities for professional
development/education
5 Ability to work from home
Separate amounts of vacation and sick-leave time 66%
Paid time off (PTO): pre-determined time off 28%
I do not receive paid days off 3%
Unsure 3%
AHP SALARY REPORT | CANADA, 2018 25
Percent Employee Employer Costs shared Unsure/ Benefits Offered 2018 change pays full pays full btwn employee Not from 2016 cost cost and employer applicable
Dental insurance/group plan 92% -4% 4% 24% 70% 2%
Long-term disability 88% 1% 12% 30% 54% 4%
Medical insurance/group plan 87% -8% 2% 26% 69% 3%
Vision coverage 77% -12% 2% 25% 70% 2%
Life insurance 75% -3% 11% 28% 57% 5%
Professional association memberships 73% -9% 4% 90% 6% 0%
Education/professional development assistance
69% 3% 1% 74% 20% 5%
Employee assistance or wellness program 69% 3% 3% 62% 30% 6%
Short-term disability 69% -7% 5% 36% 50% 9%
Flexible schedule (e.g., arriving at 6am and leaving at 2pm)
58% N/A 2% 44% 5% 50%
Smartphone 57% -13% 3% 81% 16% 0%
Defined benefit retirement plan 54% 24% 2% 5% 89% 5%
Laptop or tablet 52% -1% 4% 91% 4% 2%
Defined contribution retirement plan 47% 16% 0% 6% 82% 12%
Flexible work arrangements (e.g. telecommuting)
41% -6% 2% 50% 9% 39%
Retirement plan 35% -38% 3% 8% 88% 3%
Pet insurance 26% N/A 0% 0% 0% 0%
Time off for child care or elder care 21% 0% 5% 55% 27% 14%
Business travel accident insurance 20% 1% 9% 61% 22% 9%
Medical savings account 12% 6% 8% 39% 54% 0%
Auto allowance 10% -6% 0% 60% 40% 0%
Parking/travel stipend 6% N/A 7% 63% 27% 3%
Adoption assistance 4% 3% 0% 40% 40% 20%
Child daycare 3% 0% 0% 0% 100% 0%
Profit sharing 2% N/A 0% 0% 50% 50%
Other 6% 1% 0% 33% 67% 0%
BENEFITS OFFERED (N=105)
AHP SALARY REPORT | CANADA, 2018 26
EMPLOYEE PERCEPTIONS
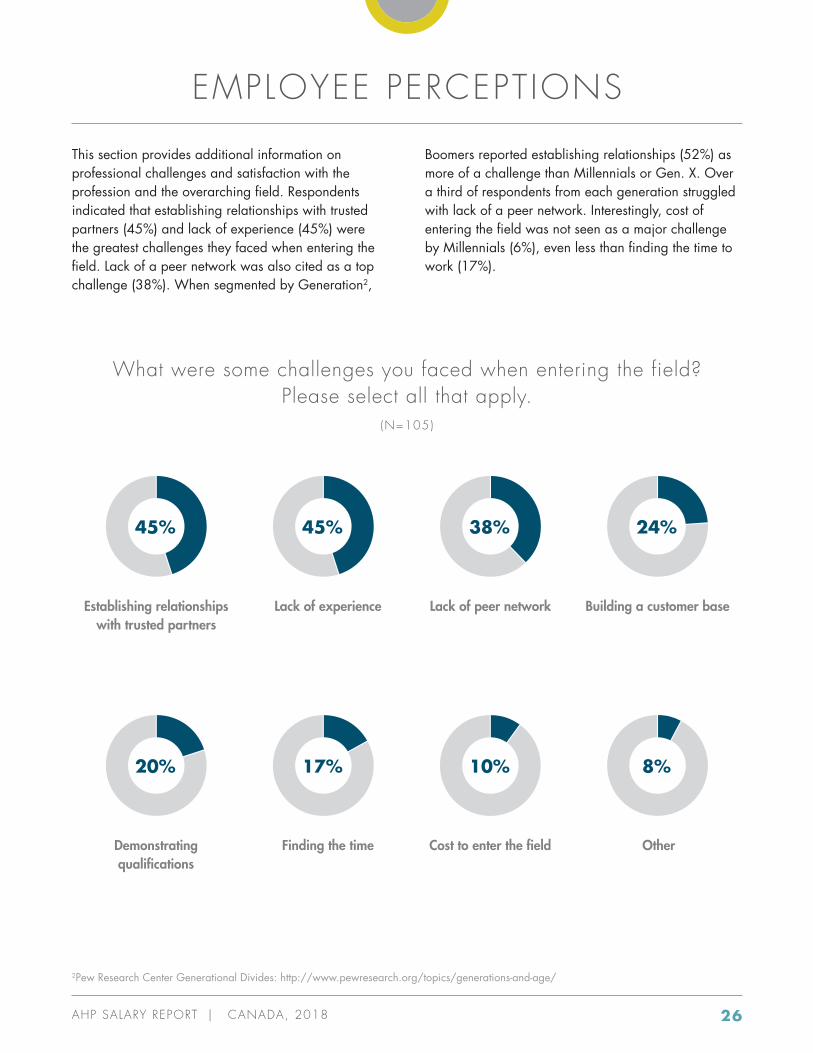
This section provides additional information on professional challenges and satisfaction with the profession and the overarching field. Respondents indicated that establishing relationships with trusted partners (45%) and lack of experience (45%) were the greatest challenges they faced when entering the field. Lack of a peer network was also cited as a top challenge (38%). When segmented by Generation2,
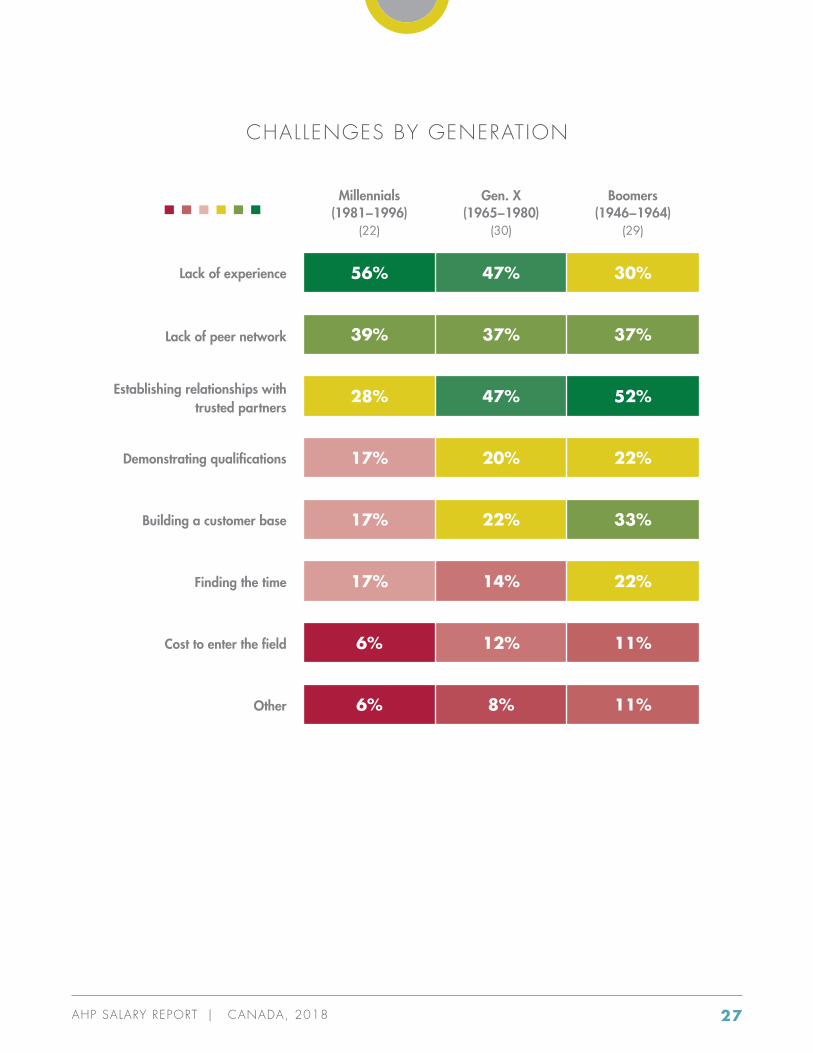
Boomers reported establishing relationships (52%) as more of a challenge than Millennials or Gen. X. Over a third of respondents from each generation struggled with lack of a peer network. Interestingly, cost of entering the field was not seen as a major challenge by Millennials (6%), even less than finding the time to work (17%).
2Pew Research Center Generational Divides: http://www.pewresearch.org/topics/generations-and-age/
What were some challenges you faced when entering the field?Please select all that apply.
(N=105)
45% 45% 38% 24%
20% 17% 10% 8%
Establishing relationships with trusted partners
Lack of peer network Building a customer base
Cost to enter the field Other
Lack of experience
Demonstrating qualifications
Finding the time
AHP SALARY REPORT | CANADA, 2018 27
CHALLENGES BY GENERATION
Millennials (1981−1996)
(22)
Gen. X (1965−1980)
(30)
Boomers(1946−1964)
(29)
Lack of experience 47%56% 30%
Lack of peer network 37%39% 37%
Establishing relationships with trusted partners
47%28% 52%
Demonstrating qualifications 20%17% 22%
Building a customer base 22%17% 33%
Finding the time 14%17% 22%
Cost to enter the field 12%6% 11%
Other 8%6% 11%
AHP SALARY REPORT | CANADA, 2018 28
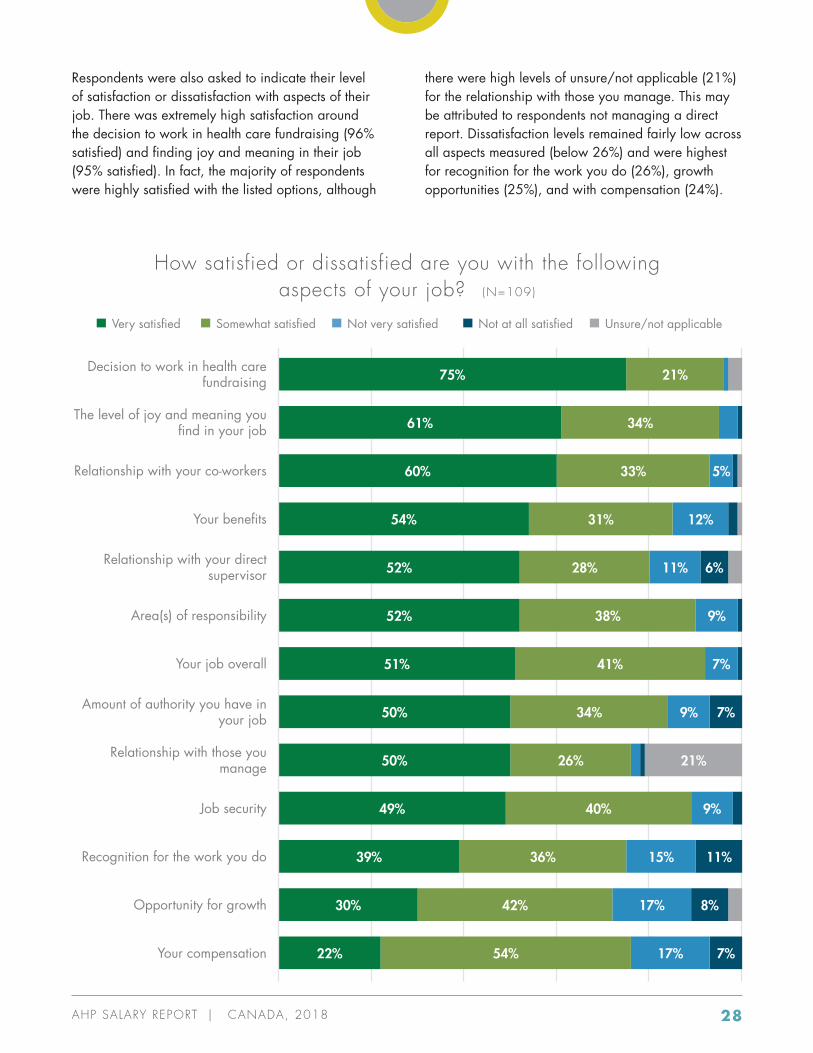
Respondents were also asked to indicate their level of satisfaction or dissatisfaction with aspects of their job. There was extremely high satisfaction around the decision to work in health care fundraising (96% satisfied) and finding joy and meaning in their job (95% satisfied). In fact, the majority of respondents were highly satisfied with the listed options, although
there were high levels of unsure/not applicable (21%) for the relationship with those you manage. This may be attributed to respondents not managing a direct report. Dissatisfaction levels remained fairly low across all aspects measured (below 26%) and were highest for recognition for the work you do (26%), growth opportunities (25%), and with compensation (24%).
How satisfied or dissatisfied are you with the following aspects of your job? (N=109)
25% 37% 23% 13%
Decision to work in health care fundraising
The level of joy and meaning you find in your job
Relationship with your co-workers
Your benefits
Relationship with your direct supervisor
Area(s) of responsibility
Your job overall
Amount of authority you have in your job
Relationship with those you manage
Job security
Recognition for the work you do
Opportunity for growth
Your compensation
Very satisfied Somewhat satisfied Not very satisfied Not at all satisfied Unsure/not applicable
21%75%
34%61%
5%33%60%
12%31%54%
9%38%52%
7%41%51%
7%9%34%50%
21%26%50%
9%40%49%
11%15%36%39%
8%17%42%30%
7%17%54%22%
6%11%28%52%
AHP SALARY REPORT | CANADA, 2018 29
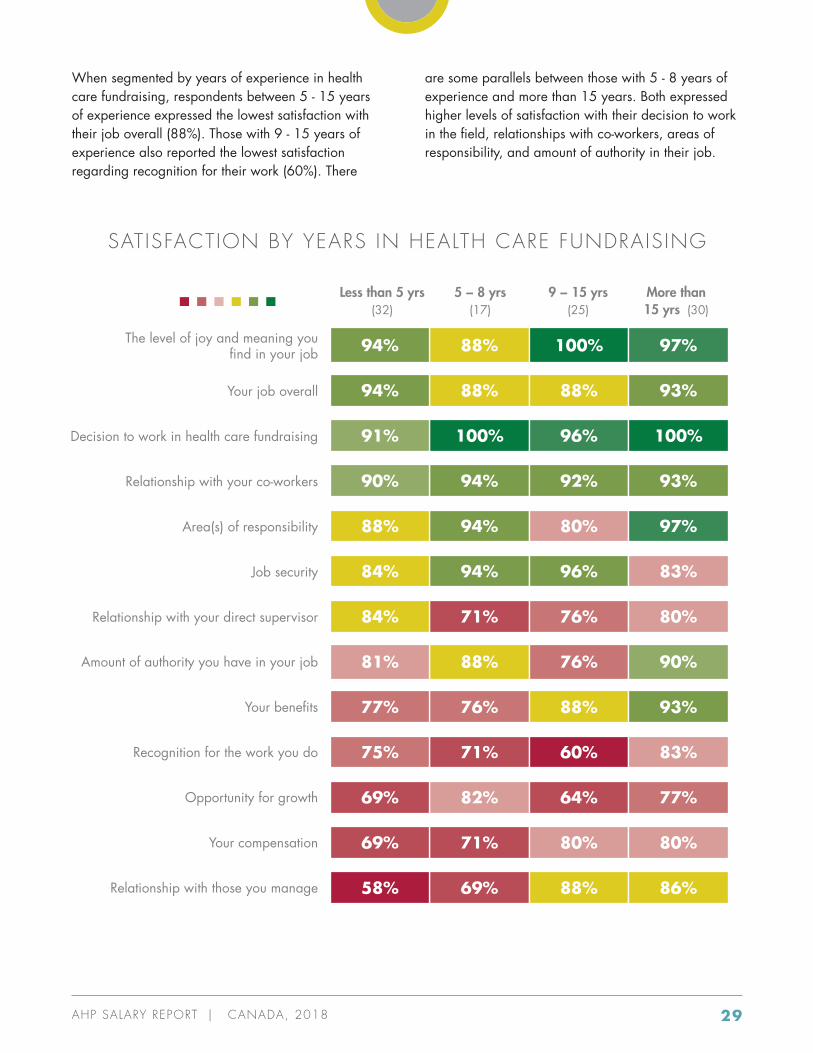
When segmented by years of experience in health care fundraising, respondents between 5 - 15 years of experience expressed the lowest satisfaction with their job overall (88%). Those with 9 - 15 years of experience also reported the lowest satisfaction regarding recognition for their work (60%). There
are some parallels between those with 5 - 8 years of experience and more than 15 years. Both expressed higher levels of satisfaction with their decision to work in the field, relationships with co-workers, areas of responsibility, and amount of authority in their job.
SATISFACTION BY YEARS IN HEALTH CARE FUNDRAISING
The level of joy and meaning you find in your job
Relationship with your co-workers
Relationship with your direct supervisor
Your benefits
Your job overall
Area(s) of responsibility
Recognition for the work you do
Decision to work in health care fundraising
Job security
Amount of authority you have in your job
Opportunity for growth
Your compensation
Relationship with those you manage
88%94% 100% 97%
100%91% 96% 100%
88%94% 88% 93%
94%90% 92% 93%
94%88% 80% 97%
94%84% 96% 83%
71%84% 76% 80%
88%81% 76% 90%
71%75% 60% 83%
76%77% 88% 93%
82%69% 64% 77%
71%69% 80% 80%
69%58% 88% 86%
Less than 5 yrs (32)
5 − 8 yrs (17)
9 − 15 yrs (25)
More than 15 yrs (30)
AHP SALARY REPORT | CANADA, 2018 30
96%95% 93%
90%90% 97%
96%95% 97%
86%90% 93%
92%86% 93%
94%86% 79%
76%86% 76%
80%76% 93%
92%67% 85%
72%71% 72%
74%67% 83%
78%57% 72%
75%55% 90%
SATISFACTION BY GENERATION
Millennials (1981−1996)
(21)
Gen. X (1965−1980)
(50)
Boomers(1946−1964)
(29)
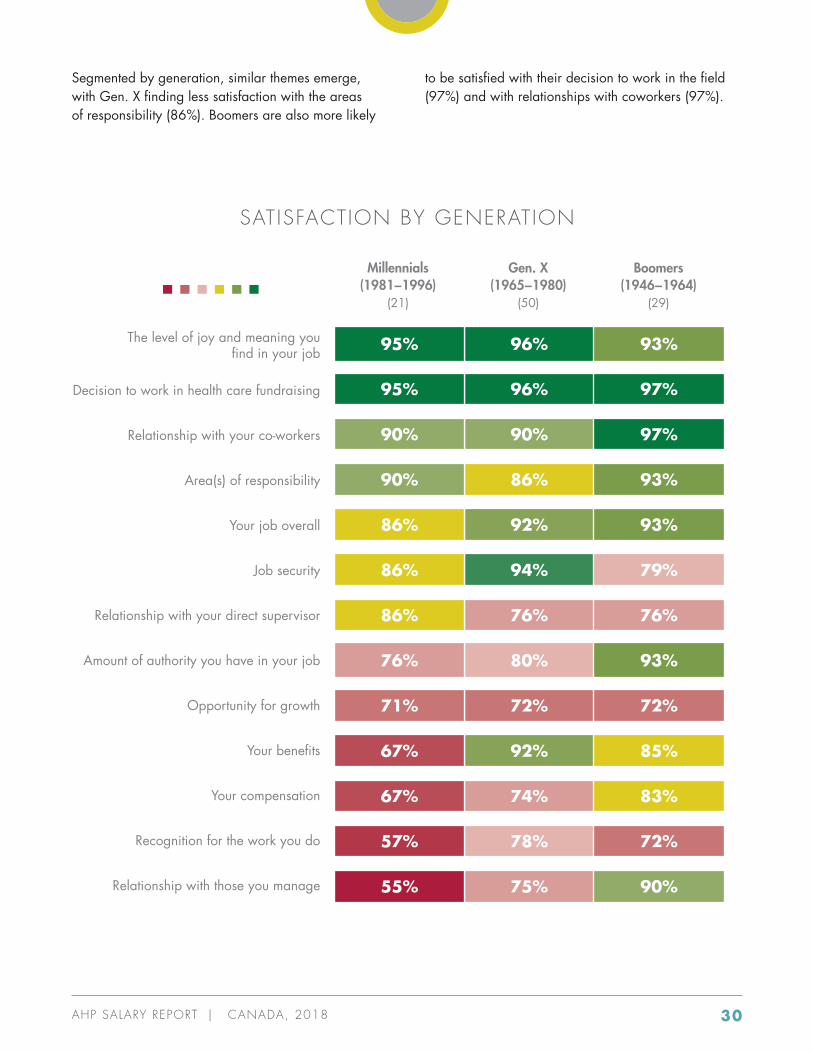
Segmented by generation, similar themes emerge, with Gen. X finding less satisfaction with the areas of responsibility (86%). Boomers are also more likely
to be satisfied with their decision to work in the field (97%) and with relationships with coworkers (97%).
The level of joy and meaning you find in your job
Relationship with your co-workers
Relationship with your direct supervisor
Your benefits
Your job overall
Area(s) of responsibility
Recognition for the work you do
Decision to work in health care fundraising
Job security
Amount of authority you have in your job
Opportunity for growth
Your compensation
Relationship with those you manage
AHP SALARY REPORT | CANADA, 2018 31
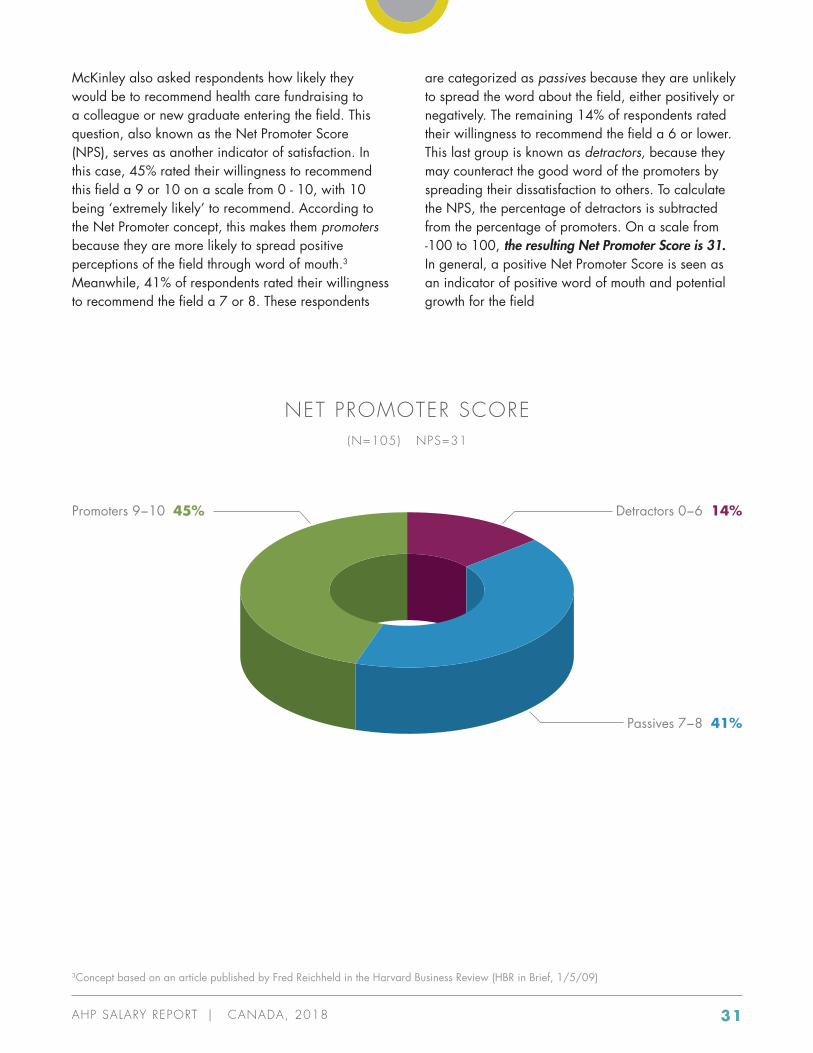
McKinley also asked respondents how likely they would be to recommend health care fundraising to a colleague or new graduate entering the field. This question, also known as the Net Promoter Score (NPS), serves as another indicator of satisfaction. In this case, 45% rated their willingness to recommend this field a 9 or 10 on a scale from 0 - 10, with 10 being ‘extremely likely’ to recommend. According to the Net Promoter concept, this makes them promoters because they are more likely to spread positive perceptions of the field through word of mouth.3 Meanwhile, 41% of respondents rated their willingness to recommend the field a 7 or 8. These respondents
are categorized as passives because they are unlikely to spread the word about the field, either positively or negatively. The remaining 14% of respondents rated their willingness to recommend the field a 6 or lower. This last group is known as detractors, because they may counteract the good word of the promoters by spreading their dissatisfaction to others. To calculate the NPS, the percentage of detractors is subtracted from the percentage of promoters. On a scale from -100 to 100, the resulting Net Promoter Score is 31. In general, a positive Net Promoter Score is seen as an indicator of positive word of mouth and potential growth for the field
Promoters 9−10 45% Detractors 0−6 14%
Passives 7−8 41%
NET PROMOTER SCORE(N=105) NPS=31
3Concept based on an article published by Fred Reichheld in the Harvard Business Review (HBR in Brief, 1/5/09)
AHP SALARY REPORT | CANADA, 2018 32
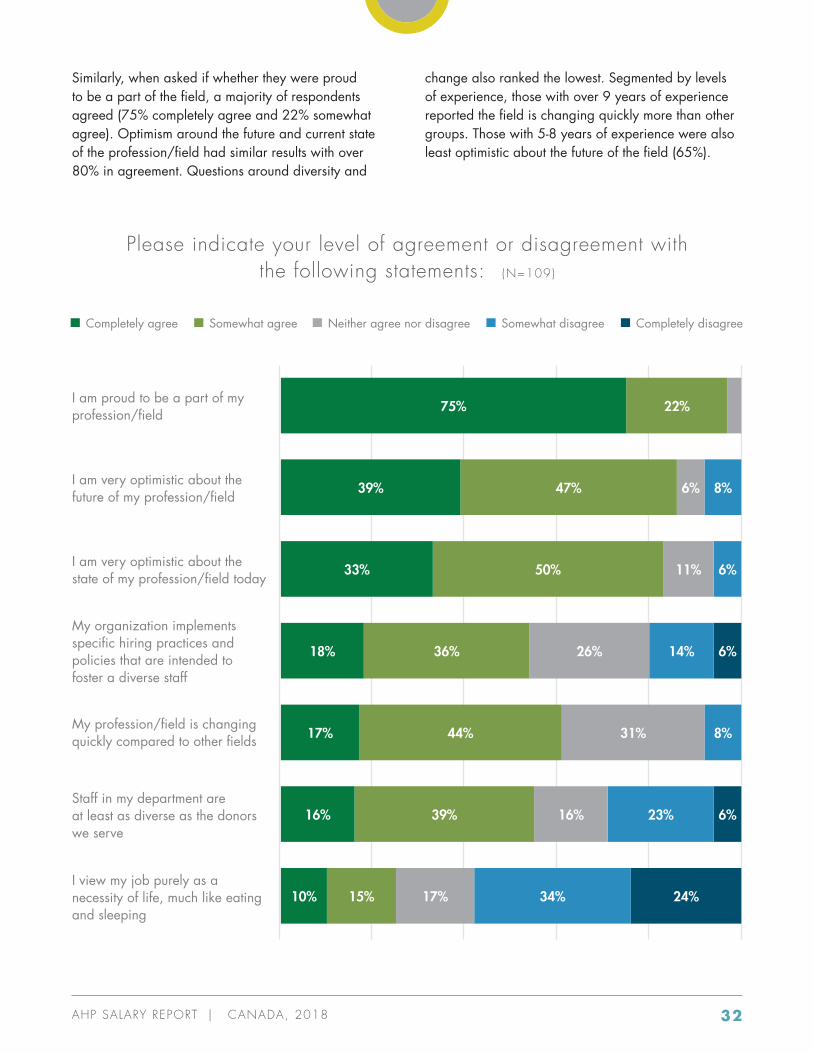
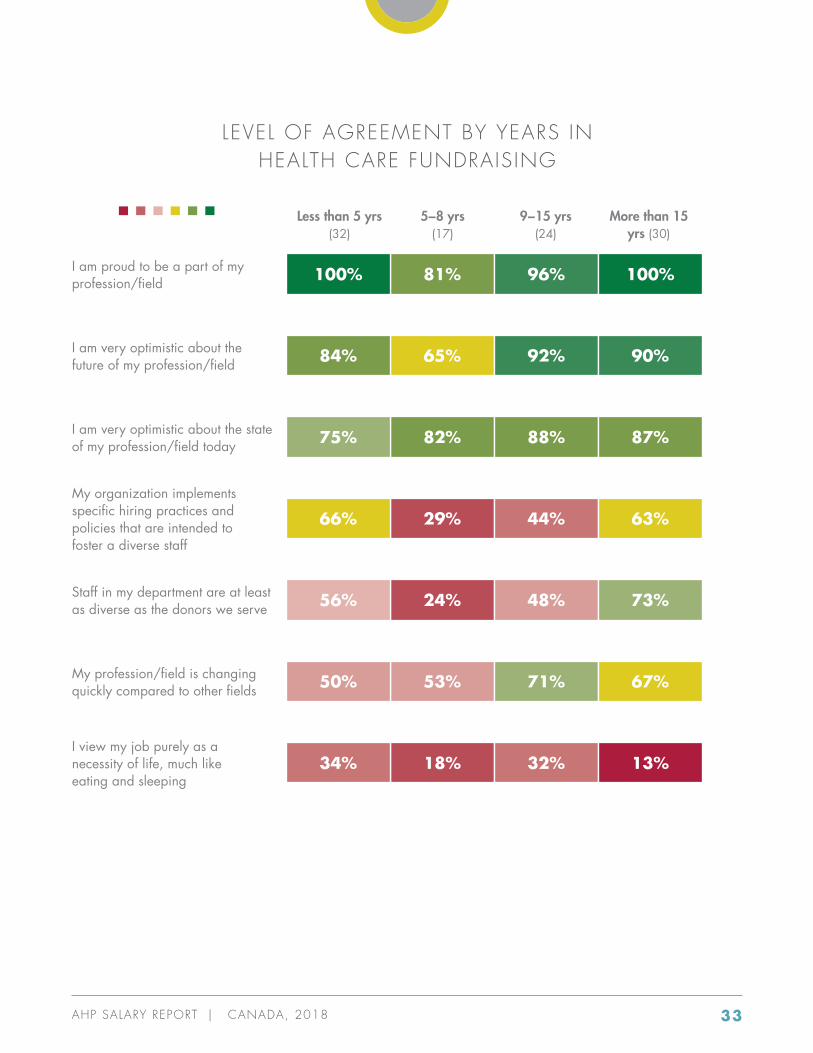
Similarly, when asked if whether they were proud to be a part of the field, a majority of respondents agreed (75% completely agree and 22% somewhat agree). Optimism around the future and current state of the profession/field had similar results with over 80% in agreement. Questions around diversity and
change also ranked the lowest. Segmented by levels of experience, those with over 9 years of experience reported the field is changing quickly more than other groups. Those with 5-8 years of experience were also least optimistic about the future of the field (65%).
Please indicate your level of agreement or disagreement with the following statements: (N=109)
Completely agree Somewhat agree Neither agree nor disagree Somewhat disagree Completely disagree
I am proud to be a part of my profession/field
I am very optimistic about the future of my profession/field
I am very optimistic about the state of my profession/field today
My organization implements specific hiring practices and policies that are intended to foster a diverse staff
My profession/field is changing quickly compared to other fields
Staff in my department are at least as diverse as the donors we serve
I view my job purely as a necessity of life, much like eating and sleeping
22%75%
8%6%47%39%
6%11%50%33%
6%14%26%36%18%
8%31%44%17%
6%23%16%39%16%
24%34%17%15%10%
AHP SALARY REPORT | CANADA, 2018 33
LEVEL OF AGREEMENT BY YEARS IN HEALTH CARE FUNDRAISING
I am proud to be a part of my profession/field 81%100% 96% 100%
I am very optimistic about the future of my profession/field 65%84% 92% 90%
I am very optimistic about the state of my profession/field today 82%75% 88% 87%
My organization implements specific hiring practices and policies that are intended to foster a diverse staff
29%66% 44% 63%
Staff in my department are at least as diverse as the donors we serve 24%56% 48% 73%
My profession/field is changing quickly compared to other fields 53%50% 71% 67%
I view my job purely as a necessity of life, much like eating and sleeping
18%34% 32% 13%
Less than 5 yrs (32)
5−8 yrs (17)
9−15 yrs (24)
More than 15 yrs (30)
AHP SALARY REPORT | CANADA, 2018 34
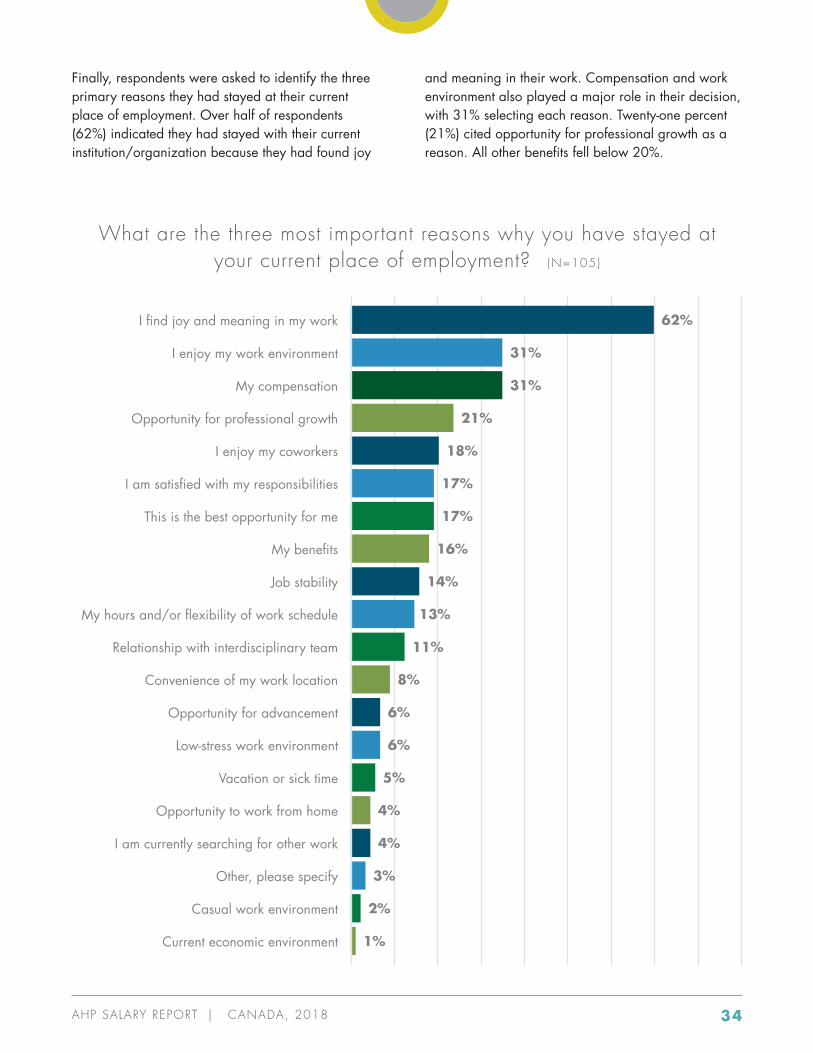
Finally, respondents were asked to identify the three primary reasons they had stayed at their current place of employment. Over half of respondents (62%) indicated they had stayed with their current institution/organization because they had found joy
and meaning in their work. Compensation and work environment also played a major role in their decision, with 31% selecting each reason. Twenty-one percent (21%) cited opportunity for professional growth as a reason. All other benefits fell below 20%.
What are the three most important reasons why you have stayed at your current place of employment? (N=105)
I find joy and meaning in my work
My benefits
I enjoy my work environment
Job stability
My compensation
My hours and/or flexibility of work schedule
Opportunity for professional growth
Relationship with interdisciplinary team
Vacation or sick time
I enjoy my coworkers
Convenience of my work location
Opportunity to work from home
I am satisfied with my responsibilities
Opportunity for advancement
I am currently searching for other work
Casual work environment
This is the best opportunity for me
Low-stress work environment
Other, please specify
Current economic environment
62%
31%
31%
21%
18%
17%
17%
16%
14%
13%
11%
8%
6%
6%
5%
4%
4%
3%
2%
1%
AHP SALARY REPORT | CANADA, 2018 35
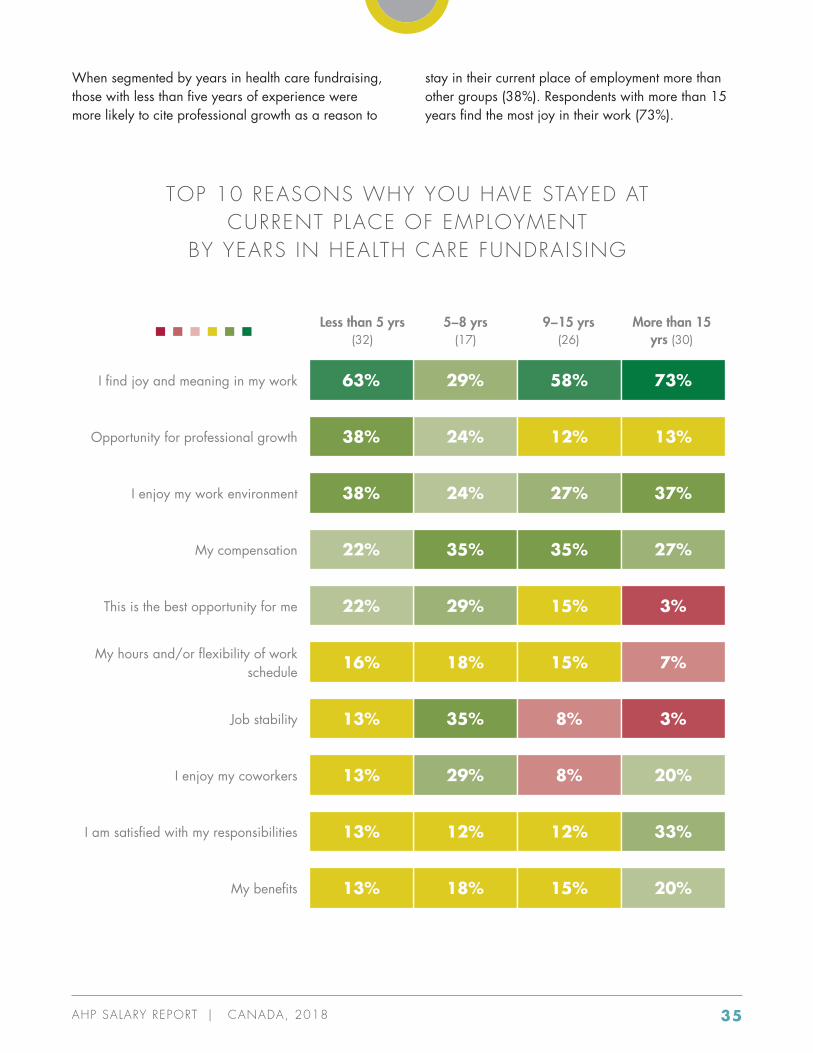
When segmented by years in health care fundraising, those with less than five years of experience were more likely to cite professional growth as a reason to
stay in their current place of employment more than other groups (38%). Respondents with more than 15 years find the most joy in their work (73%).
TOP 10 REASONS WHY YOU HAVE STAYED AT CURRENT PLACE OF EMPLOYMENT
BY YEARS IN HEALTH CARE FUNDRAISING
I find joy and meaning in my work
I enjoy my coworkers
Opportunity for professional growth
I am satisfied with my responsibilities
I enjoy my work environment
My benefits
My compensation
This is the best opportunity for me
My hours and/or flexibility of work schedule
Job stability
29%63% 58% 73%
24%38% 12% 13%
24%38% 27% 37%
35%22% 35% 27%
29%22% 15% 3%
18%16% 15% 7%
35%13% 8% 3%
29%13% 8% 20%
12%13% 12% 33%
18%13% 15% 20%
Less than 5 yrs (32)
5−8 yrs (17)
9−15 yrs (26)
More than 15 yrs (30)
AHP SALARY REPORT | CANADA, 2018 36
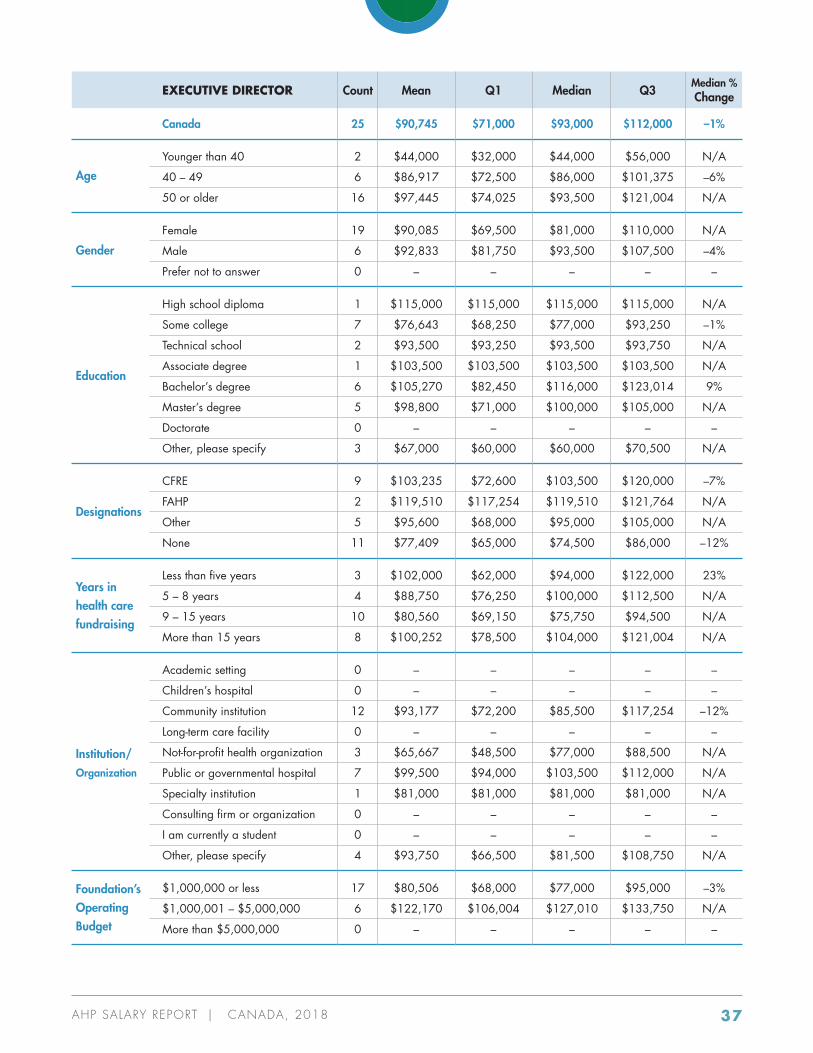
PROFILES
The following section presents demographic trends for annual salaries based on position. The following positions had sufficient responses to generate a unique profile:
• Executive Director
• President and CEO
• Vice President
• Director of Development
• Development Officer
• Major Gifts Officer
Each profile includes columns with the following:
• Count – The number of respondents who provided data for the question.
• Mean – The sum of all values divided by the number of values.
• Median – The mid-point of reported values, where half the reported values are lower, and half are higher, than this point. This also represents the second quartile (50%).
• Quartiles/Percentiles – Portions of the data that identify what points are greater than one-quarter (25%) and three-quarters (75%).
• Median percent change – The percentage difference from the last reported median in the 2016 AHP Salary Report.
Please note that each category count (age, education, years in health care fundraising, etc.) may not add up to the overall counts for each position with a profile due to factors such as incomplete responses.
AHP SALARY REPORT | CANADA, 2018 37
EXECUTIVE DIRECTOR Count Mean Q1 Median Q3
Median % Change
Canada 25 $90,745 $71,000 $93,000 $112,000 –1%
Younger than 40 2 $44,000 $32,000 $44,000 $56,000 N/A
40 – 49 6 $86,917 $72,500 $86,000 $101,375 –6%
50 or older 16 $97,445 $74,025 $93,500 $121,004 N/A
Female 19 $90,085 $69,500 $81,000 $110,000 N/A
Male 6 $92,833 $81,750 $93,500 $107,500 –4%
Prefer not to answer 0 – – – – –
High school diploma 1 $115,000 $115,000 $115,000 $115,000 N/A
Some college 7 $76,643 $68,250 $77,000 $93,250 –1%
Technical school 2 $93,500 $93,250 $93,500 $93,750 N/A
Associate degree 1 $103,500 $103,500 $103,500 $103,500 N/A
Bachelor’s degree 6 $105,270 $82,450 $116,000 $123,014 9%
Master’s degree 5 $98,800 $71,000 $100,000 $105,000 N/A
Doctorate 0 – – – – –
Other, please specify 3 $67,000 $60,000 $60,000 $70,500 N/A
CFRE 9 $103,235 $72,600 $103,500 $120,000 –7%
FAHP 2 $119,510 $117,254 $119,510 $121,764 N/A
Other 5 $95,600 $68,000 $95,000 $105,000 N/A
None 11 $77,409 $65,000 $74,500 $86,000 –12%
Less than five years 3 $102,000 $62,000 $94,000 $122,000 23%
5 – 8 years 4 $88,750 $76,250 $100,000 $112,500 N/A
9 – 15 years 10 $80,560 $69,150 $75,750 $94,500 N/A
More than 15 years 8 $100,252 $78,500 $104,000 $121,004 N/A
Academic setting 0 – – – – –
Children’s hospital 0 – – – – –
Community institution 12 $93,177 $72,200 $85,500 $117,254 –12%
Long-term care facility 0 – – – – –
Not-for-profit health organization 3 $65,667 $48,500 $77,000 $88,500 N/A
Public or governmental hospital 7 $99,500 $94,000 $103,500 $112,000 N/A
Specialty institution 1 $81,000 $81,000 $81,000 $81,000 N/A
Consulting firm or organization 0 – – – – –
I am currently a student 0 – – – – –
Other, please specify 4 $93,750 $66,500 $81,500 $108,750 N/A
$1,000,000 or less 17 $80,506 $68,000 $77,000 $95,000 –3%
$1,000,001 – $5,000,000 6 $122,170 $106,004 $127,010 $133,750 N/A
More than $5,000,000 0 – – – – –
Age
Gender
Education
Designations
Years inhealth carefundraising
Institution/ Organization
Foundation’sOperatingBudget
AHP SALARY REPORT | CANADA, 2018 38
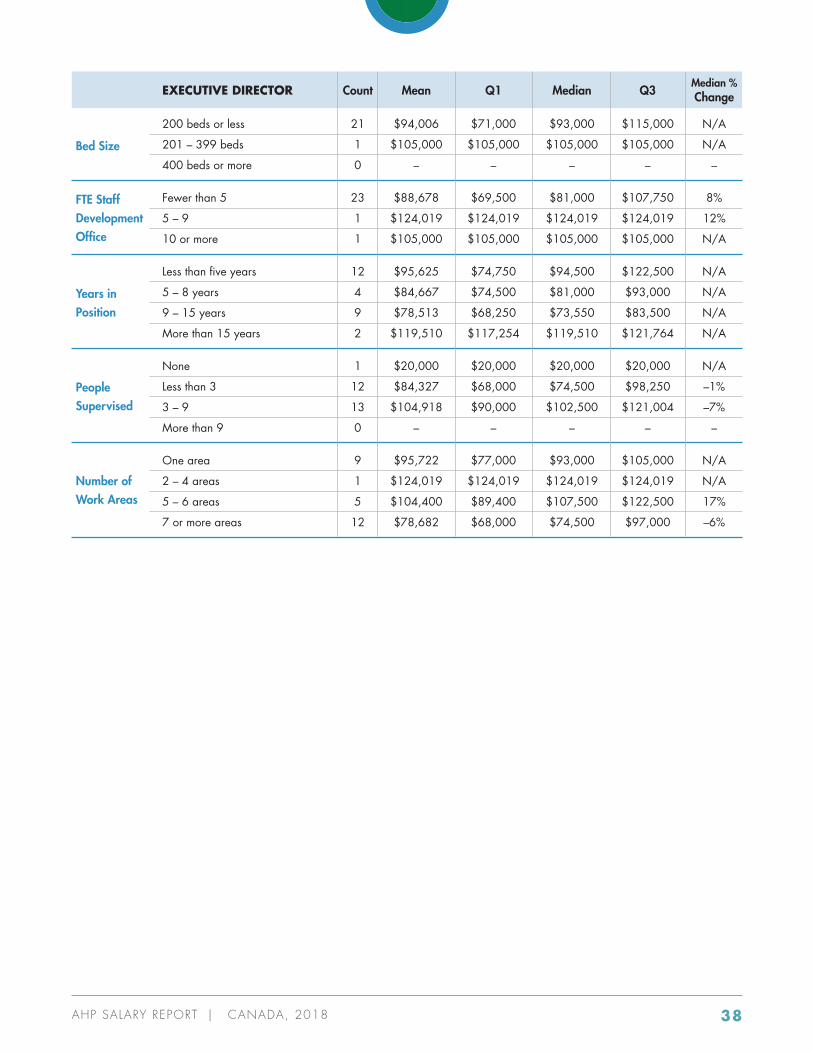
EXECUTIVE DIRECTOR Count Mean Q1 Median Q3
Median % Change
200 beds or less 21 $94,006 $71,000 $93,000 $115,000 N/A
201 – 399 beds 1 $105,000 $105,000 $105,000 $105,000 N/A
400 beds or more 0 – – – – –
Fewer than 5 23 $88,678 $69,500 $81,000 $107,750 8%
5 – 9 1 $124,019 $124,019 $124,019 $124,019 12%
10 or more 1 $105,000 $105,000 $105,000 $105,000 N/A
Less than five years 12 $95,625 $74,750 $94,500 $122,500 N/A
5 – 8 years 4 $84,667 $74,500 $81,000 $93,000 N/A
9 – 15 years 9 $78,513 $68,250 $73,550 $83,500 N/A
More than 15 years 2 $119,510 $117,254 $119,510 $121,764 N/A
None 1 $20,000 $20,000 $20,000 $20,000 N/A
Less than 3 12 $84,327 $68,000 $74,500 $98,250 –1%
3 – 9 13 $104,918 $90,000 $102,500 $121,004 –7%
More than 9 0 – – – – –
One area 9 $95,722 $77,000 $93,000 $105,000 N/A
2 – 4 areas 1 $124,019 $124,019 $124,019 $124,019 N/A
5 – 6 areas 5 $104,400 $89,400 $107,500 $122,500 17%
7 or more areas 12 $78,682 $68,000 $74,500 $97,000 –6%
Bed Size
FTE Staff Development Office
Years in Position
People Supervised
Number of Work Areas
AHP SALARY REPORT | CANADA, 2018 39
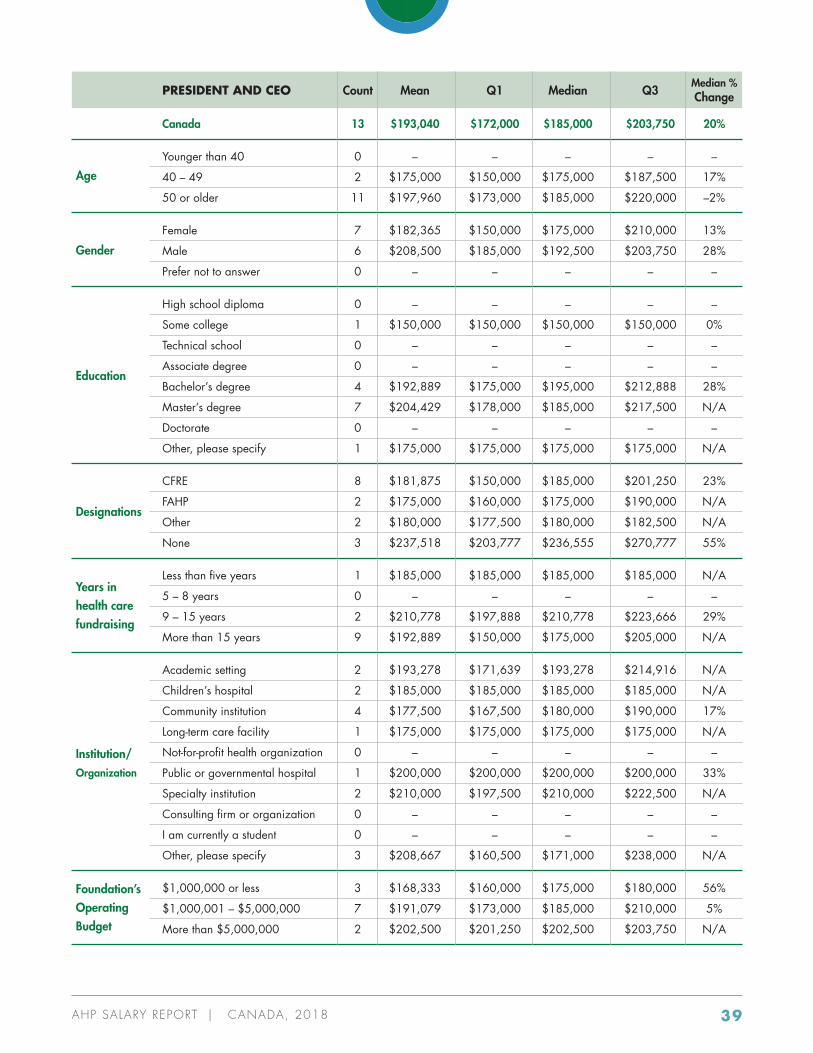
PRESIDENT AND CEO Count Mean Q1 Median Q3
Median % Change
Canada 13 $193,040 $172,000 $185,000 $203,750 20%
Younger than 40 0 – – – – –
40 – 49 2 $175,000 $150,000 $175,000 $187,500 17%
50 or older 11 $197,960 $173,000 $185,000 $220,000 –2%
Female 7 $182,365 $150,000 $175,000 $210,000 13%
Male 6 $208,500 $185,000 $192,500 $203,750 28%
Prefer not to answer 0 – – – – –
High school diploma 0 – – – – –
Some college 1 $150,000 $150,000 $150,000 $150,000 0%
Technical school 0 – – – – –
Associate degree 0 – – – – –
Bachelor’s degree 4 $192,889 $175,000 $195,000 $212,888 28%
Master’s degree 7 $204,429 $178,000 $185,000 $217,500 N/A
Doctorate 0 – – – – –
Other, please specify 1 $175,000 $175,000 $175,000 $175,000 N/A
CFRE 8 $181,875 $150,000 $185,000 $201,250 23%
FAHP 2 $175,000 $160,000 $175,000 $190,000 N/A
Other 2 $180,000 $177,500 $180,000 $182,500 N/A
None 3 $237,518 $203,777 $236,555 $270,777 55%
Less than five years 1 $185,000 $185,000 $185,000 $185,000 N/A
5 – 8 years 0 – – – – –
9 – 15 years 2 $210,778 $197,888 $210,778 $223,666 29%
More than 15 years 9 $192,889 $150,000 $175,000 $205,000 N/A
Academic setting 2 $193,278 $171,639 $193,278 $214,916 N/A
Children’s hospital 2 $185,000 $185,000 $185,000 $185,000 N/A
Community institution 4 $177,500 $167,500 $180,000 $190,000 17%
Long-term care facility 1 $175,000 $175,000 $175,000 $175,000 N/A
Not-for-profit health organization 0 – – – – –
Public or governmental hospital 1 $200,000 $200,000 $200,000 $200,000 33%
Specialty institution 2 $210,000 $197,500 $210,000 $222,500 N/A
Consulting firm or organization 0 – – – – –
I am currently a student 0 – – – – –
Other, please specify 3 $208,667 $160,500 $171,000 $238,000 N/A
$1,000,000 or less 3 $168,333 $160,000 $175,000 $180,000 56%
$1,000,001 – $5,000,000 7 $191,079 $173,000 $185,000 $210,000 5%
More than $5,000,000 2 $202,500 $201,250 $202,500 $203,750 N/A
Age
Gender
Education
Designations
Years inhealth carefundraising
Institution/ Organization
Foundation’sOperatingBudget
AHP SALARY REPORT | CANADA, 2018 40
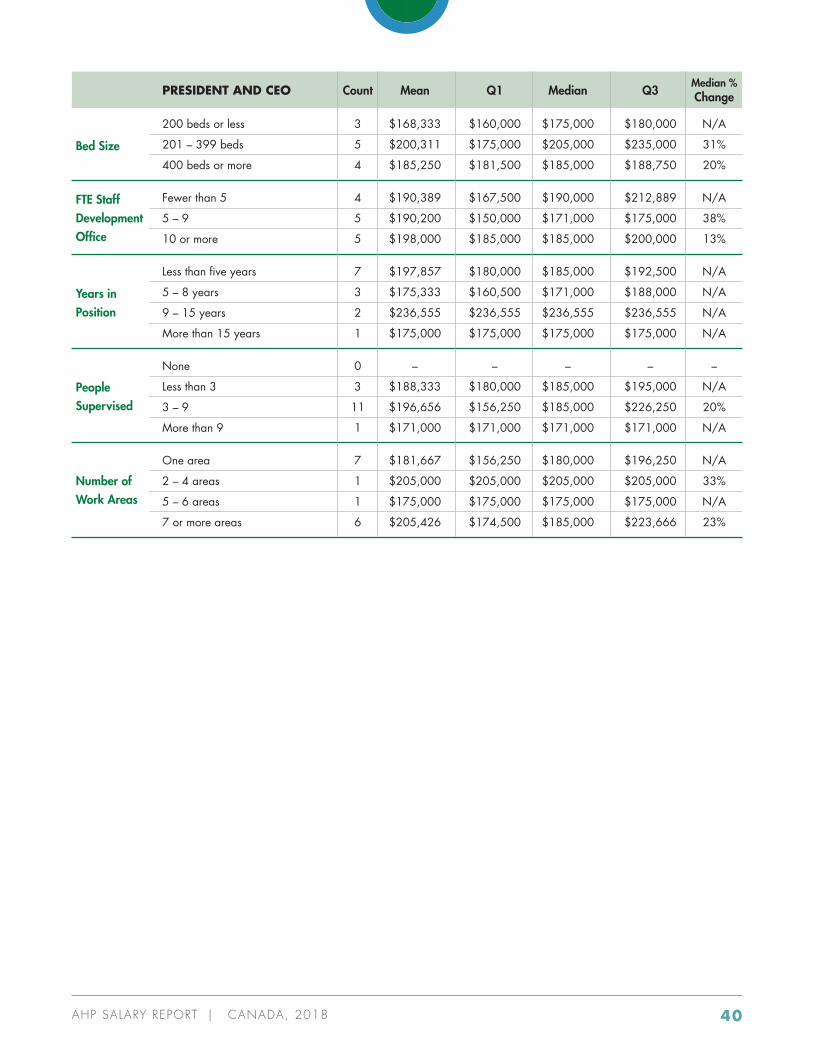
PRESIDENT AND CEO Count Mean Q1 Median Q3
Median % Change
200 beds or less 3 $168,333 $160,000 $175,000 $180,000 N/A
201 – 399 beds 5 $200,311 $175,000 $205,000 $235,000 31%
400 beds or more 4 $185,250 $181,500 $185,000 $188,750 20%
Fewer than 5 4 $190,389 $167,500 $190,000 $212,889 N/A
5 – 9 5 $190,200 $150,000 $171,000 $175,000 38%
10 or more 5 $198,000 $185,000 $185,000 $200,000 13%
Less than five years 7 $197,857 $180,000 $185,000 $192,500 N/A
5 – 8 years 3 $175,333 $160,500 $171,000 $188,000 N/A
9 – 15 years 2 $236,555 $236,555 $236,555 $236,555 N/A
More than 15 years 1 $175,000 $175,000 $175,000 $175,000 N/A
None 0 – – – – –
Less than 3 3 $188,333 $180,000 $185,000 $195,000 N/A
3 – 9 11 $196,656 $156,250 $185,000 $226,250 20%
More than 9 1 $171,000 $171,000 $171,000 $171,000 N/A
One area 7 $181,667 $156,250 $180,000 $196,250 N/A
2 – 4 areas 1 $205,000 $205,000 $205,000 $205,000 33%
5 – 6 areas 1 $175,000 $175,000 $175,000 $175,000 N/A
7 or more areas 6 $205,426 $174,500 $185,000 $223,666 23%
Bed Size
FTE Staff Development Office
Years in Position
People Supervised
Number of Work Areas
AHP SALARY REPORT | CANADA, 2018 41
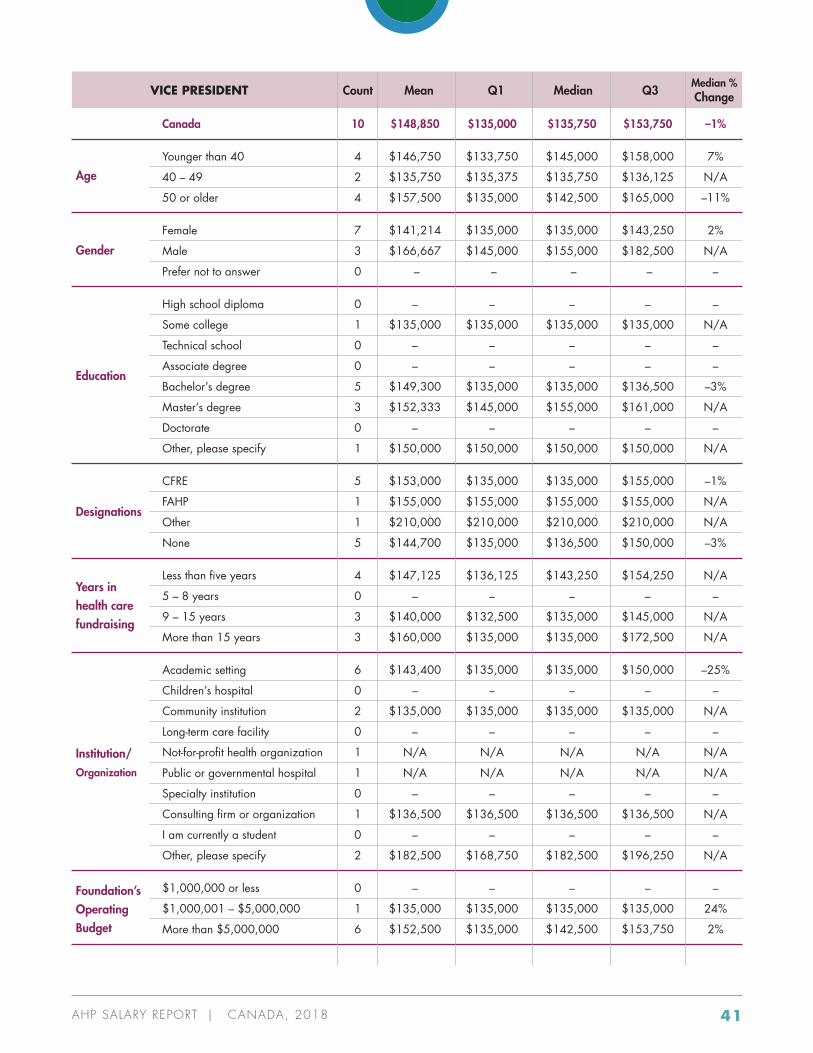
VICE PRESIDENT Count Mean Q1 Median Q3
Median % Change
Canada 10 $148,850 $135,000 $135,750 $153,750 –1%
Younger than 40 4 $146,750 $133,750 $145,000 $158,000 7%
40 – 49 2 $135,750 $135,375 $135,750 $136,125 N/A
50 or older 4 $157,500 $135,000 $142,500 $165,000 –11%
Female 7 $141,214 $135,000 $135,000 $143,250 2%
Male 3 $166,667 $145,000 $155,000 $182,500 N/A
Prefer not to answer 0 – – – – –
High school diploma 0 – – – – –
Some college 1 $135,000 $135,000 $135,000 $135,000 N/A
Technical school 0 – – – – –
Associate degree 0 – – – – –
Bachelor’s degree 5 $149,300 $135,000 $135,000 $136,500 –3%
Master’s degree 3 $152,333 $145,000 $155,000 $161,000 N/A
Doctorate 0 – – – – –
Other, please specify 1 $150,000 $150,000 $150,000 $150,000 N/A
CFRE 5 $153,000 $135,000 $135,000 $155,000 –1%
FAHP 1 $155,000 $155,000 $155,000 $155,000 N/A
Other 1 $210,000 $210,000 $210,000 $210,000 N/A
None 5 $144,700 $135,000 $136,500 $150,000 –3%
Less than five years 4 $147,125 $136,125 $143,250 $154,250 N/A
5 – 8 years 0 – – – – –
9 – 15 years 3 $140,000 $132,500 $135,000 $145,000 N/A
More than 15 years 3 $160,000 $135,000 $135,000 $172,500 N/A
Academic setting 6 $143,400 $135,000 $135,000 $150,000 –25%
Children’s hospital 0 – – – – –
Community institution 2 $135,000 $135,000 $135,000 $135,000 N/A
Long-term care facility 0 – – – – –
Not-for-profit health organization 1 N/A N/A N/A N/A N/A
Public or governmental hospital 1 N/A N/A N/A N/A N/A
Specialty institution 0 – – – – –
Consulting firm or organization 1 $136,500 $136,500 $136,500 $136,500 N/A
I am currently a student 0 – – – – –
Other, please specify 2 $182,500 $168,750 $182,500 $196,250 N/A
$1,000,000 or less 0 – – – – –
$1,000,001 – $5,000,000 1 $135,000 $135,000 $135,000 $135,000 24%
More than $5,000,000 6 $152,500 $135,000 $142,500 $153,750 2%
Age
Gender
Education
Designations
Years inhealth carefundraising
Institution/ Organization
Foundation’sOperatingBudget
AHP SALARY REPORT | CANADA, 2018 42
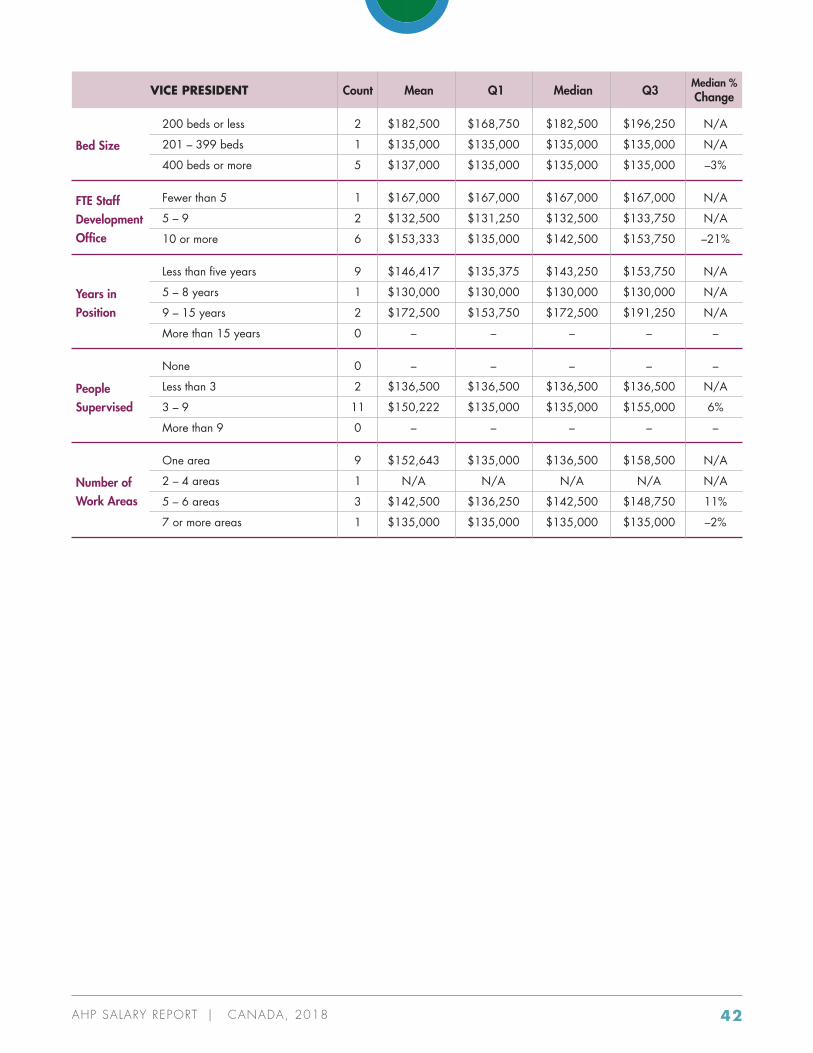
VICE PRESIDENT Count Mean Q1 Median Q3
Median % Change
200 beds or less 2 $182,500 $168,750 $182,500 $196,250 N/A
201 – 399 beds 1 $135,000 $135,000 $135,000 $135,000 N/A
400 beds or more 5 $137,000 $135,000 $135,000 $135,000 –3%
Fewer than 5 1 $167,000 $167,000 $167,000 $167,000 N/A
5 – 9 2 $132,500 $131,250 $132,500 $133,750 N/A
10 or more 6 $153,333 $135,000 $142,500 $153,750 –21%
Less than five years 9 $146,417 $135,375 $143,250 $153,750 N/A
5 – 8 years 1 $130,000 $130,000 $130,000 $130,000 N/A
9 – 15 years 2 $172,500 $153,750 $172,500 $191,250 N/A
More than 15 years 0 – – – – –
None 0 – – – – –
Less than 3 2 $136,500 $136,500 $136,500 $136,500 N/A
3 – 9 11 $150,222 $135,000 $135,000 $155,000 6%
More than 9 0 – – – – –
One area 9 $152,643 $135,000 $136,500 $158,500 N/A
2 – 4 areas 1 N/A N/A N/A N/A N/A
5 – 6 areas 3 $142,500 $136,250 $142,500 $148,750 11%
7 or more areas 1 $135,000 $135,000 $135,000 $135,000 –2%
Bed Size
FTE Staff Development Office
Years in Position
People Supervised
Number of Work Areas
AHP SALARY REPORT | CANADA, 2018 43
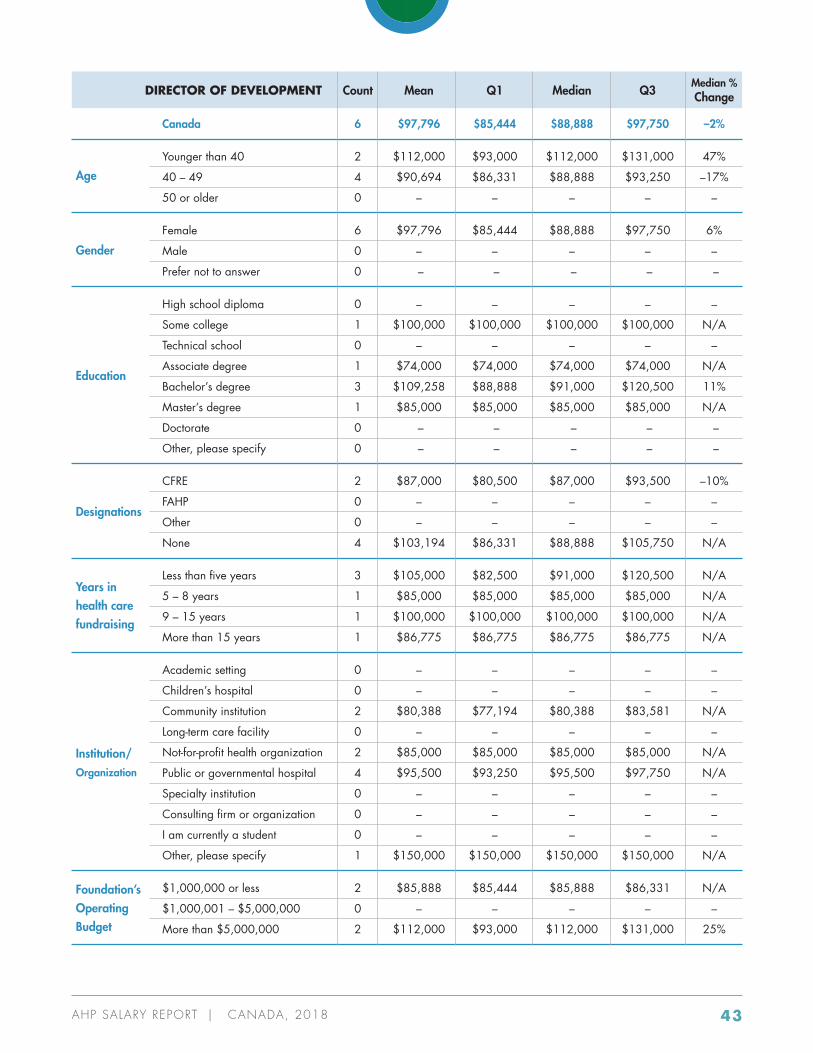
DIRECTOR OF DEVELOPMENT Count Mean Q1 Median Q3
Median % Change
Canada 6 $97,796 $85,444 $88,888 $97,750 –2%
Younger than 40 2 $112,000 $93,000 $112,000 $131,000 47%
40 – 49 4 $90,694 $86,331 $88,888 $93,250 –17%
50 or older 0 – – – – –
Female 6 $97,796 $85,444 $88,888 $97,750 6%
Male 0 – – – – –
Prefer not to answer 0 – – – – –
High school diploma 0 – – – – –
Some college 1 $100,000 $100,000 $100,000 $100,000 N/A
Technical school 0 – – – – –
Associate degree 1 $74,000 $74,000 $74,000 $74,000 N/A
Bachelor’s degree 3 $109,258 $88,888 $91,000 $120,500 11%
Master’s degree 1 $85,000 $85,000 $85,000 $85,000 N/A
Doctorate 0 – – – – –
Other, please specify 0 – – – – –
CFRE 2 $87,000 $80,500 $87,000 $93,500 –10%
FAHP 0 – – – – –
Other 0 – – – – –
None 4 $103,194 $86,331 $88,888 $105,750 N/A
Less than five years 3 $105,000 $82,500 $91,000 $120,500 N/A
5 – 8 years 1 $85,000 $85,000 $85,000 $85,000 N/A
9 – 15 years 1 $100,000 $100,000 $100,000 $100,000 N/A
More than 15 years 1 $86,775 $86,775 $86,775 $86,775 N/A
Academic setting 0 – – – – –
Children’s hospital 0 – – – – –
Community institution 2 $80,388 $77,194 $80,388 $83,581 N/A
Long-term care facility 0 – – – – –
Not-for-profit health organization 2 $85,000 $85,000 $85,000 $85,000 N/A
Public or governmental hospital 4 $95,500 $93,250 $95,500 $97,750 N/A
Specialty institution 0 – – – – –
Consulting firm or organization 0 – – – – –
I am currently a student 0 – – – – –
Other, please specify 1 $150,000 $150,000 $150,000 $150,000 N/A
$1,000,000 or less 2 $85,888 $85,444 $85,888 $86,331 N/A
$1,000,001 – $5,000,000 0 – – – – –
More than $5,000,000 2 $112,000 $93,000 $112,000 $131,000 25%
Age
Gender
Education
Designations
Years inhealth carefundraising
Institution/ Organization
Foundation’sOperatingBudget
AHP SALARY REPORT | CANADA, 2018 44
Number of Work Areas
Bed Size
FTE Staff Development Office
Years in Position
People Supervised
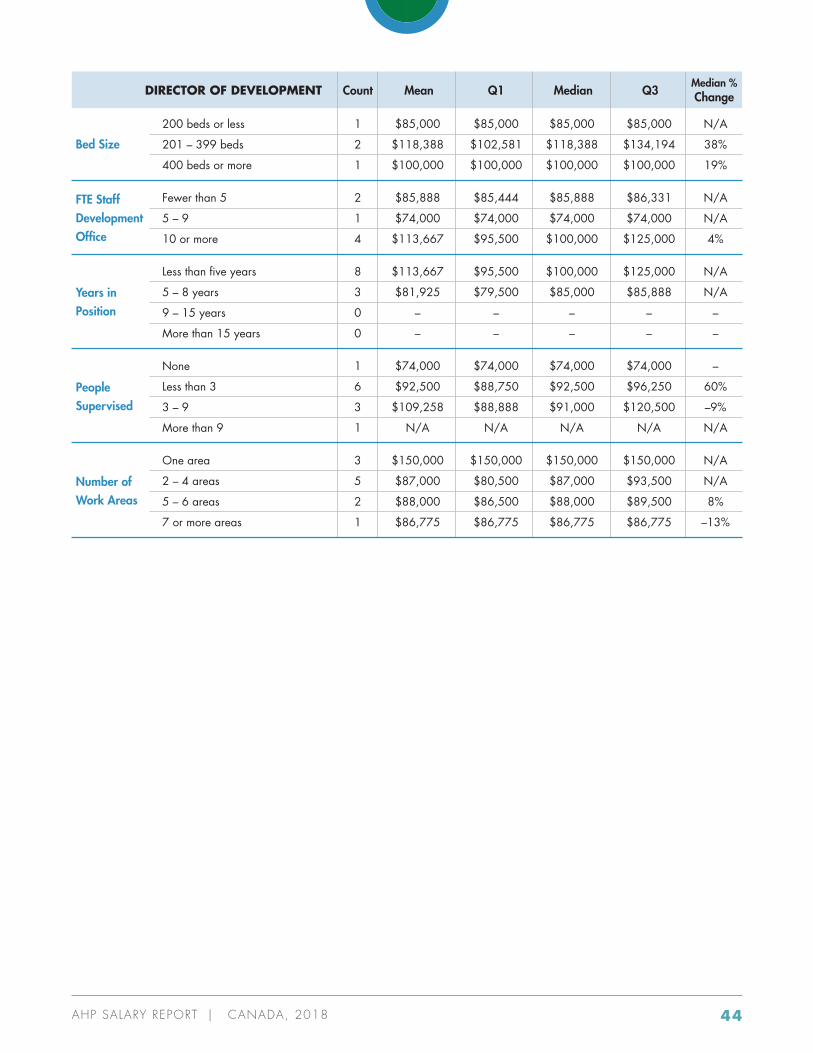
DIRECTOR OF DEVELOPMENT Count Mean Q1 Median Q3
Median % Change
200 beds or less 1 $85,000 $85,000 $85,000 $85,000 N/A
201 – 399 beds 2 $118,388 $102,581 $118,388 $134,194 38%
400 beds or more 1 $100,000 $100,000 $100,000 $100,000 19%
Fewer than 5 2 $85,888 $85,444 $85,888 $86,331 N/A
5 – 9 1 $74,000 $74,000 $74,000 $74,000 N/A
10 or more 4 $113,667 $95,500 $100,000 $125,000 4%
Less than five years 8 $113,667 $95,500 $100,000 $125,000 N/A
5 – 8 years 3 $81,925 $79,500 $85,000 $85,888 N/A
9 – 15 years 0 – – – – –
More than 15 years 0 – – – – –
None 1 $74,000 $74,000 $74,000 $74,000 –
Less than 3 6 $92,500 $88,750 $92,500 $96,250 60%
3 – 9 3 $109,258 $88,888 $91,000 $120,500 –9%
More than 9 1 N/A N/A N/A N/A N/A
One area 3 $150,000 $150,000 $150,000 $150,000 N/A
2 – 4 areas 5 $87,000 $80,500 $87,000 $93,500 N/A
5 – 6 areas 2 $88,000 $86,500 $88,000 $89,500 8%
7 or more areas 1 $86,775 $86,775 $86,775 $86,775 –13%
AHP SALARY REPORT | CANADA, 2018 45
Age
Gender
Education
Designations
Years inhealth carefundraising
Institution/ Organization
Foundation’sOperatingBudget
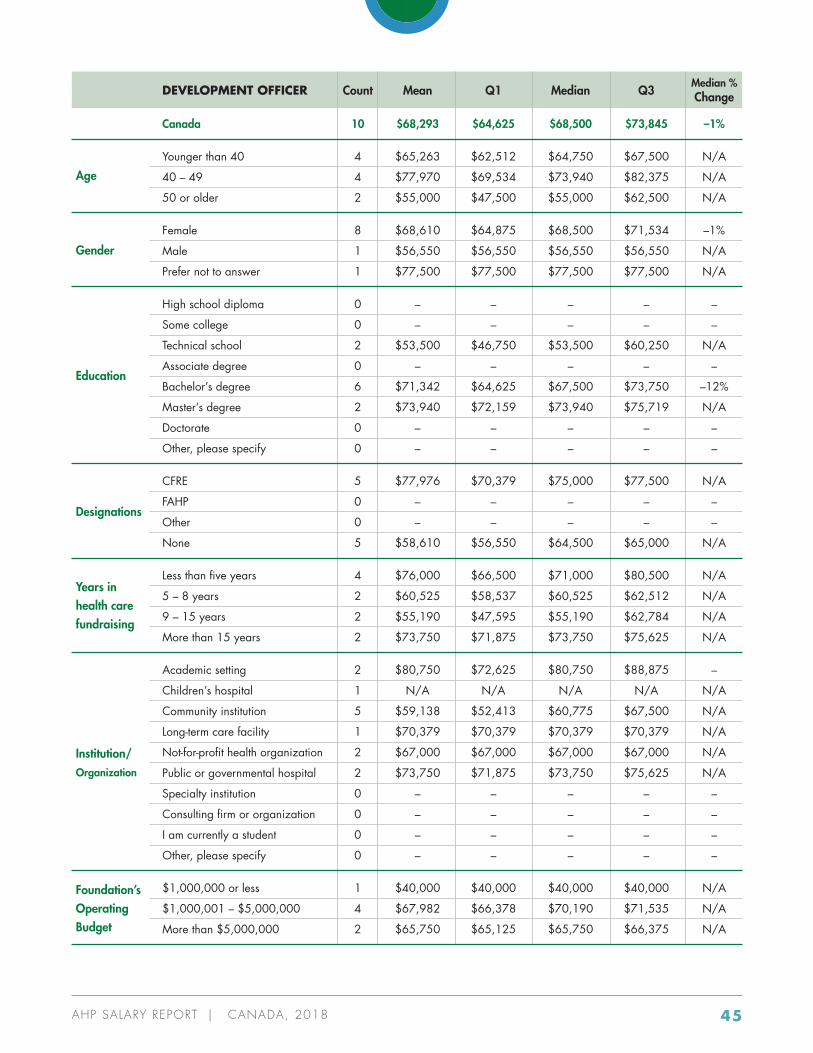
DEVELOPMENT OFFICER Count Mean Q1 Median Q3
Median % Change
Canada 10 $68,293 $64,625 $68,500 $73,845 –1%
Younger than 40 4 $65,263 $62,512 $64,750 $67,500 N/A
40 – 49 4 $77,970 $69,534 $73,940 $82,375 N/A
50 or older 2 $55,000 $47,500 $55,000 $62,500 N/A
Female 8 $68,610 $64,875 $68,500 $71,534 –1%
Male 1 $56,550 $56,550 $56,550 $56,550 N/A
Prefer not to answer 1 $77,500 $77,500 $77,500 $77,500 N/A
High school diploma 0 – – – – –
Some college 0 – – – – –
Technical school 2 $53,500 $46,750 $53,500 $60,250 N/A
Associate degree 0 – – – – –
Bachelor’s degree 6 $71,342 $64,625 $67,500 $73,750 –12%
Master’s degree 2 $73,940 $72,159 $73,940 $75,719 N/A
Doctorate 0 – – – – –
Other, please specify 0 – – – – –
CFRE 5 $77,976 $70,379 $75,000 $77,500 N/A
FAHP 0 – – – – –
Other 0 – – – – –
None 5 $58,610 $56,550 $64,500 $65,000 N/A
Less than five years 4 $76,000 $66,500 $71,000 $80,500 N/A
5 – 8 years 2 $60,525 $58,537 $60,525 $62,512 N/A
9 – 15 years 2 $55,190 $47,595 $55,190 $62,784 N/A
More than 15 years 2 $73,750 $71,875 $73,750 $75,625 N/A
Academic setting 2 $80,750 $72,625 $80,750 $88,875 –
Children’s hospital 1 N/A N/A N/A N/A N/A
Community institution 5 $59,138 $52,413 $60,775 $67,500 N/A
Long-term care facility 1 $70,379 $70,379 $70,379 $70,379 N/A
Not-for-profit health organization 2 $67,000 $67,000 $67,000 $67,000 N/A
Public or governmental hospital 2 $73,750 $71,875 $73,750 $75,625 N/A
Specialty institution 0 – – – – –
Consulting firm or organization 0 – – – – –
I am currently a student 0 – – – – –
Other, please specify 0 – – – – –
$1,000,000 or less 1 $40,000 $40,000 $40,000 $40,000 N/A
$1,000,001 – $5,000,000 4 $67,982 $66,378 $70,190 $71,535 N/A
More than $5,000,000 2 $65,750 $65,125 $65,750 $66,375 N/A
AHP SALARY REPORT | CANADA, 2018 46
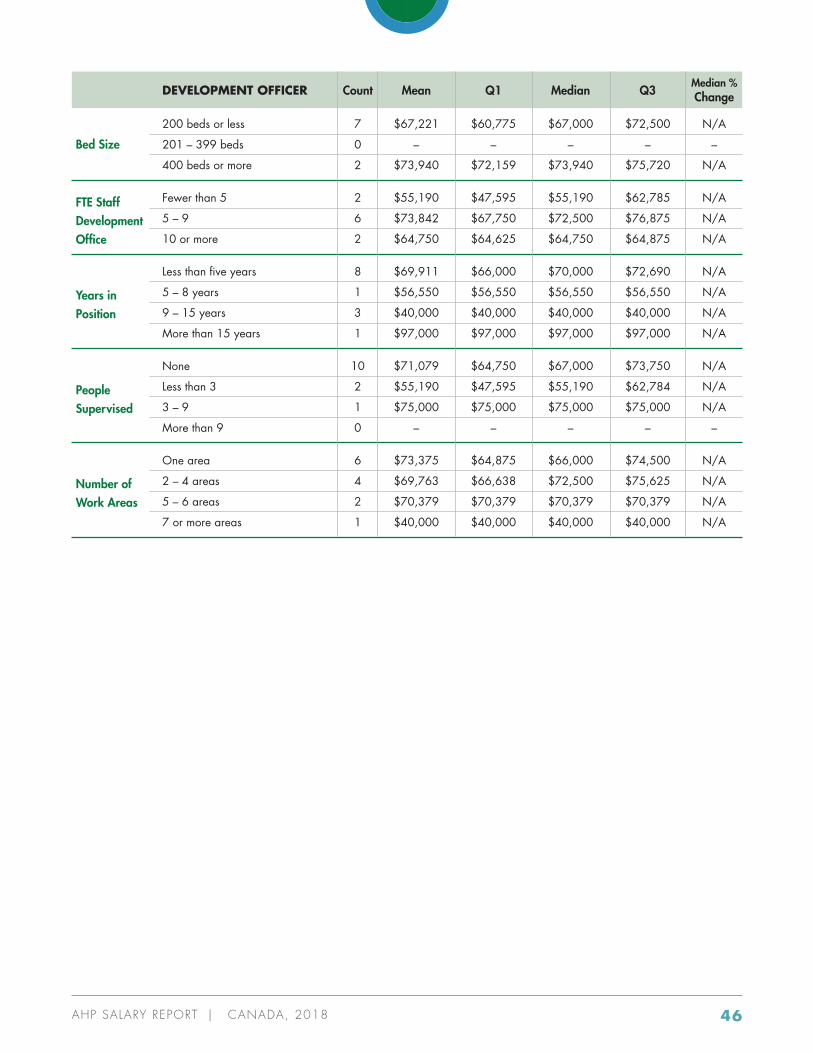
DEVELOPMENT OFFICER Count Mean Q1 Median Q3
Median % Change
200 beds or less 7 $67,221 $60,775 $67,000 $72,500 N/A
201 – 399 beds 0 – – – – –
400 beds or more 2 $73,940 $72,159 $73,940 $75,720 N/A
Fewer than 5 2 $55,190 $47,595 $55,190 $62,785 N/A
5 – 9 6 $73,842 $67,750 $72,500 $76,875 N/A
10 or more 2 $64,750 $64,625 $64,750 $64,875 N/A
Less than five years 8 $69,911 $66,000 $70,000 $72,690 N/A
5 – 8 years 1 $56,550 $56,550 $56,550 $56,550 N/A
9 – 15 years 3 $40,000 $40,000 $40,000 $40,000 N/A
More than 15 years 1 $97,000 $97,000 $97,000 $97,000 N/A
None 10 $71,079 $64,750 $67,000 $73,750 N/A
Less than 3 2 $55,190 $47,595 $55,190 $62,784 N/A
3 – 9 1 $75,000 $75,000 $75,000 $75,000 N/A
More than 9 0 – – – – –
One area 6 $73,375 $64,875 $66,000 $74,500 N/A
2 – 4 areas 4 $69,763 $66,638 $72,500 $75,625 N/A
5 – 6 areas 2 $70,379 $70,379 $70,379 $70,379 N/A
7 or more areas 1 $40,000 $40,000 $40,000 $40,000 N/A
Bed Size
FTE Staff Development Office
Years in Position
People Supervised
Number of Work Areas
AHP SALARY REPORT | CANADA, 2018 47
Age
Gender
Education
Designations
Years inhealth carefundraising
Institution/ Organization
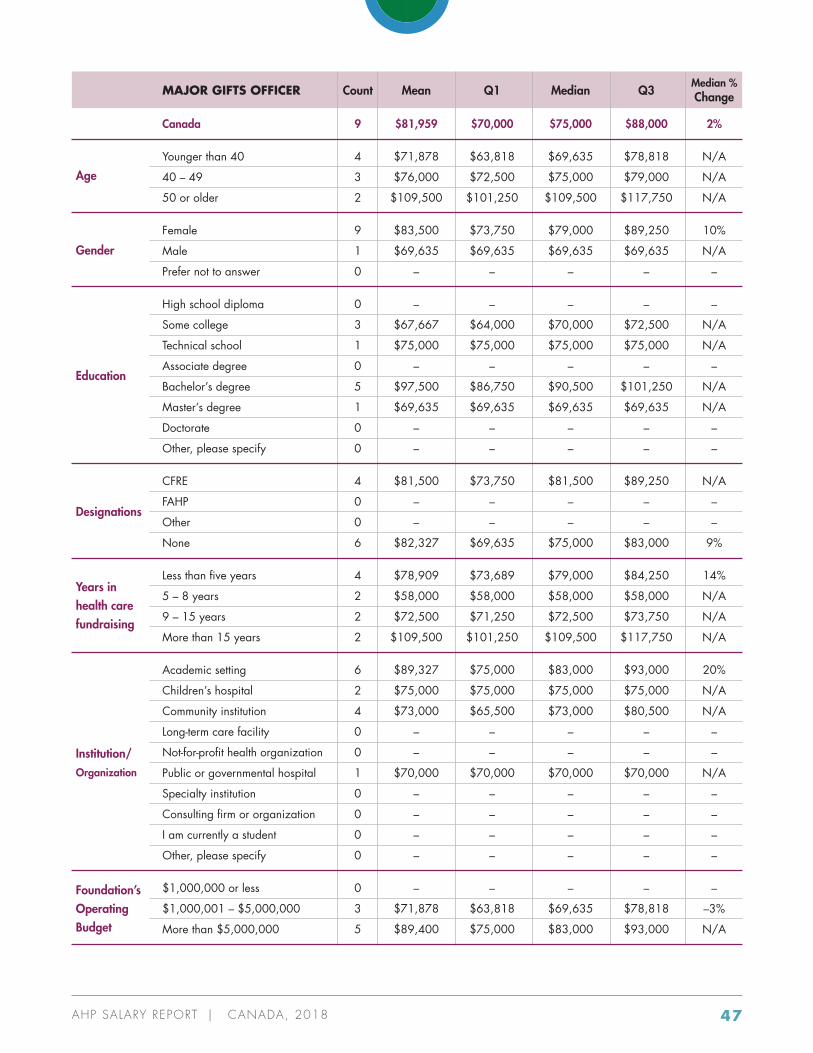
MAJOR GIFTS OFFICER Count Mean Q1 Median Q3
Median % Change
Canada 9 $81,959 $70,000 $75,000 $88,000 2%
Younger than 40 4 $71,878 $63,818 $69,635 $78,818 N/A
40 – 49 3 $76,000 $72,500 $75,000 $79,000 N/A
50 or older 2 $109,500 $101,250 $109,500 $117,750 N/A
Female 9 $83,500 $73,750 $79,000 $89,250 10%
Male 1 $69,635 $69,635 $69,635 $69,635 N/A
Prefer not to answer 0 – – – – –
High school diploma 0 – – – – –
Some college 3 $67,667 $64,000 $70,000 $72,500 N/A
Technical school 1 $75,000 $75,000 $75,000 $75,000 N/A
Associate degree 0 – – – – –
Bachelor’s degree 5 $97,500 $86,750 $90,500 $101,250 N/A
Master’s degree 1 $69,635 $69,635 $69,635 $69,635 N/A
Doctorate 0 – – – – –
Other, please specify 0 – – – – –
CFRE 4 $81,500 $73,750 $81,500 $89,250 N/A
FAHP 0 – – – – –
Other 0 – – – – –
None 6 $82,327 $69,635 $75,000 $83,000 9%
Less than five years 4 $78,909 $73,689 $79,000 $84,250 14%
5 – 8 years 2 $58,000 $58,000 $58,000 $58,000 N/A
9 – 15 years 2 $72,500 $71,250 $72,500 $73,750 N/A
More than 15 years 2 $109,500 $101,250 $109,500 $117,750 N/A
Academic setting 6 $89,327 $75,000 $83,000 $93,000 20%
Children’s hospital 2 $75,000 $75,000 $75,000 $75,000 N/A
Community institution 4 $73,000 $65,500 $73,000 $80,500 N/A
Long-term care facility 0 – – – – –
Not-for-profit health organization 0 – – – – –
Public or governmental hospital 1 $70,000 $70,000 $70,000 $70,000 N/A
Specialty institution 0 – – – – –
Consulting firm or organization 0 – – – – –
I am currently a student 0 – – – – –
Other, please specify 0 – – – – –
$1,000,000 or less 0 – – – – –
$1,000,001 – $5,000,000 3 $71,878 $63,818 $69,635 $78,818 –3%
More than $5,000,000 5 $89,400 $75,000 $83,000 $93,000 N/A
Foundation’sOperatingBudget
AHP SALARY REPORT | CANADA, 2018 48
Bed Size
FTE Staff Development Office
Years in Position
People Supervised
Number of Work Areas
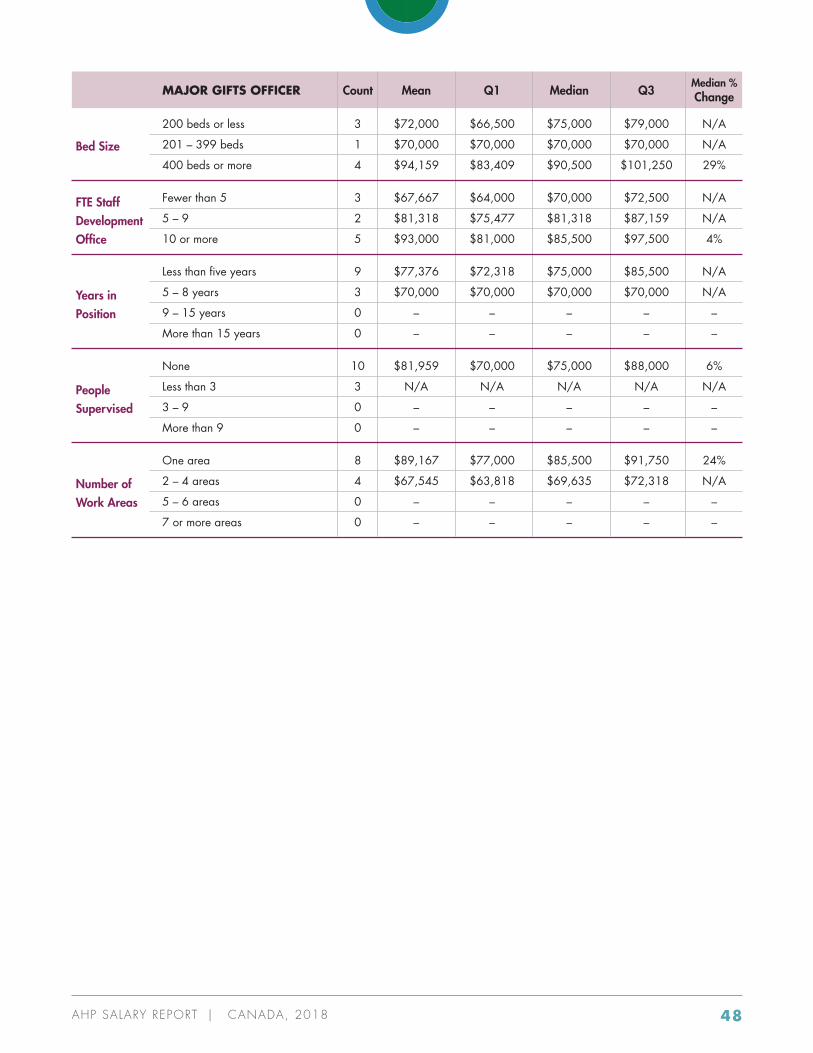
MAJOR GIFTS OFFICER Count Mean Q1 Median Q3
Median % Change
200 beds or less 3 $72,000 $66,500 $75,000 $79,000 N/A
201 – 399 beds 1 $70,000 $70,000 $70,000 $70,000 N/A
400 beds or more 4 $94,159 $83,409 $90,500 $101,250 29%
Fewer than 5 3 $67,667 $64,000 $70,000 $72,500 N/A
5 – 9 2 $81,318 $75,477 $81,318 $87,159 N/A
10 or more 5 $93,000 $81,000 $85,500 $97,500 4%
Less than five years 9 $77,376 $72,318 $75,000 $85,500 N/A
5 – 8 years 3 $70,000 $70,000 $70,000 $70,000 N/A
9 – 15 years 0 – – – – –
More than 15 years 0 – – – – –
None 10 $81,959 $70,000 $75,000 $88,000 6%
Less than 3 3 N/A N/A N/A N/A N/A
3 – 9 0 – – – – –
More than 9 0 – – – – –
One area 8 $89,167 $77,000 $85,500 $91,750 24%
2 – 4 areas 4 $67,545 $63,818 $69,635 $72,318 N/A
5 – 6 areas 0 – – – – –
7 or more areas 0 – – – – –
AHP SALARY REPORT | CANADA, 2018 49
APPENDIX
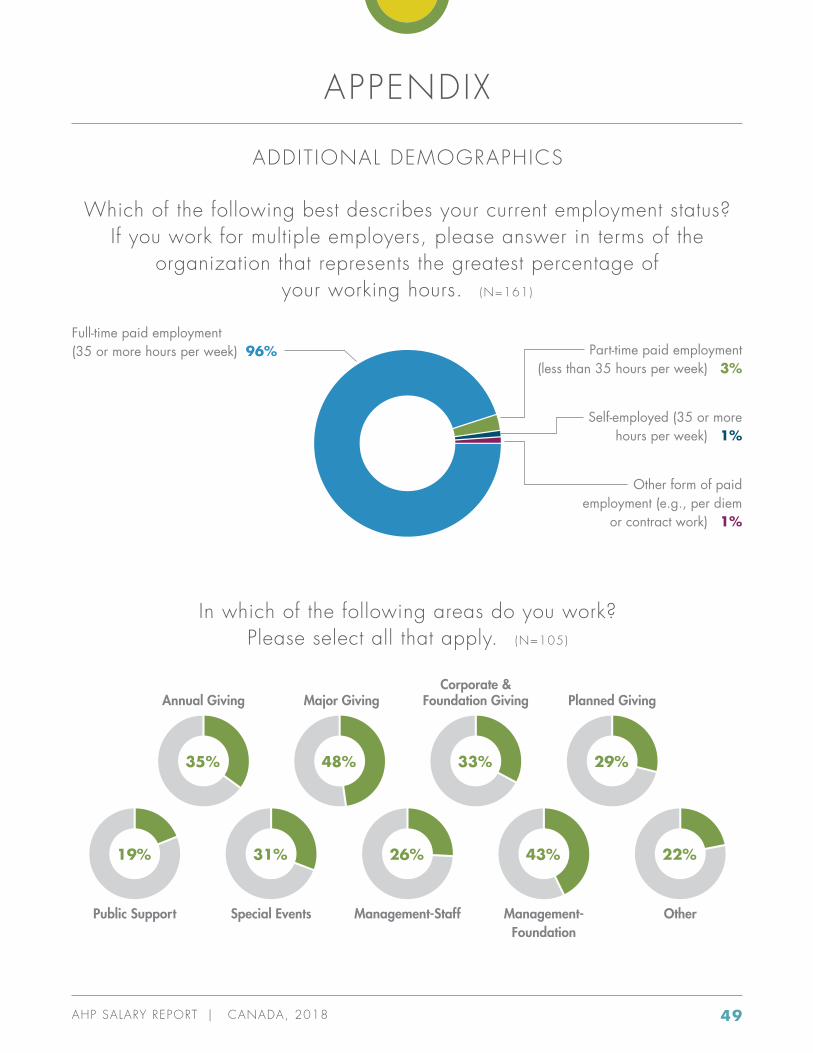
Which of the following best describes your current employment status? If you work for multiple employers, please answer in terms of the
organization that represents the greatest percentage of your working hours. (N=161)
Self-employed (35 or more hours per week) 1%
Part-time paid employment (less than 35 hours per week) 3%
Other form of paid employment (e.g., per diem
or contract work) 1%
Full-time paid employment (35 or more hours per week) 96%
35% 48% 33% 29%
In which of the following areas do you work?Please select all that apply. (N=105)
Annual Giving
19%
Public Support
31%
Special Events
26%
Management-Staff
43%
Management- Foundation
22%
Other
Major GivingCorporate &
Foundation Giving Planned Giving
ADDIT IONAL DEMOGRAPHICS
AHP SALARY REPORT | CANADA, 2018 50
Please choose the job title that best describes your current position. (N = 105)Administrative Assistant .....................................5%Annual Giving Officer .......................................4%Chief Development Officer .................................1%Chief Financial Officer .......................................3%Chief Operating Officer .....................................2%Database Manager ...........................................1%Development Coordinator ..................................2%Development Officer ..........................................8%Director of Development .....................................6%Donor Relations Coordinator ..............................1%Executive Director ...........................................17%Human Resources ..............................................2%Major Gifts Officer ............................................9%President/CEO .................................................9%Prospect Researcher ..........................................2%Special Events Officer ........................................1%Vice President ...................................................9%Other, please specify .......................................17%
What is the average tenure of your: .......YearsAnnual Giving Officer (N = 23) .......................... 4.0Campaign Officer (N = 7) ................................. 4.4Chief Development Officer (N = 14) .................... 8.0Chief Financial Officer (N = 17) ......................... 6.0Chief Operating Officer (N = 7) ......................... 8.0Database Manager (N = 20) ............................. 9.0Development Coordinator (N = 13) ..................... 4.0Development Officer (N = 20) ............................ 4.0Director of Development (N = 16) ....................... 6.0Donor Relations Coordinator (N = 19) ................. 5.0Executive Director (N = 21) ................................ 7.0Grant Writer (N = 6) ......................................... 2.0Human Resources (N = 9) .................................. 3.0Major Gifts Officer (N = 22) .............................. 4.0Planned Giving Officer (N = 17) ......................... 6.0President/CEO (N = 23) .................................. 11.0Prospect Researcher (N = 12) ............................. 4.0Special Events Officer (N = 25) .......................... 5.0Vice President (N = 11) ..................................... 7.0
How many years have you been in your current position? (N = 151)Less than five years ..........................................59%5 – 8 years ....................................................23%9 – 15 years ..................................................14%More than 15 years ..........................................4%
Please indicate the total number of employees that report directly or indirectly to you. Direct reports are employees you directly supervise/manage. Indirect reports are employees that are supervised/managed by one of your direct reports.
Total number of employees reporting directly to you (N = 55) ........................................ 2
Total number of employees reporting indirectly to you (N = 82)...................................... 5
On average, approximately how many hours...
...are you scheduled to work in a typical work week, including days/hours where you work remotely? (N = 103)Less than 40 hours .....................................62%40 - 44 hours ...........................................33%45 - 49 hours .............................................2%50 - 54 hours .............................................2%55 - 59 hours .............................................1%60 - 64 hours .............................................0%65 hours or more ........................................0%Unsure .......................................................1%
...do you work in a typical work week, including days/hours where you work remotely? (N = 102)Less than 40 hours .....................................29%40 - 44 hours ...........................................31%45 - 49 hours ...........................................16%50 - 54 hours ...........................................15%55 - 59 hours .............................................5%60 - 64 hours .............................................2%65 hours or more ........................................1%Unsure .......................................................2%
AHP SALARY REPORT | CANADA, 2018 51
Is your institution/organization part of a health care system? (N = 160)Yes ................................................................75%No ................................................................23%Unsure .............................................................3%
Which type of system do you work for? (N = 118)Local system ...................................................40%Regional system ..............................................51%National system ................................................3%Unsure .............................................................2%Not applicable .................................................5%
Which of the following best describes your institution/organization? (N = 160)
Academic setting (e.g., university-based medical center, medical school, teaching hospital) ..........22%
Children’s hospital .............................................6%
Community institution (e.g., hospital, medical center) ..........................25%
Long-term care facility (e.g., nursing home, assisted-living facility) ........................................1%
Not-for-profit health organization (e.g., visiting nurses, hospice) ...........................10%
Public or governmental hospital ........................19%
Specialty institution (e.g., psychiatric institution, rehabilitation hospital, hospice) ..........................3%
Consulting firm or organization ...........................1%
I am currently a student .......................................0%
Other, please specify .......................................13%
What best describes the setting of your place of employment? If your institution/organization has multiple locations, please select the one that best describes where you currently work. (N = 160)Rural .............................................................14%Suburban .........................................................8%Urban ............................................................74%Unsure .............................................................3%
How many years of experience do you have in health care fundraising? (N = 109)Less than five years ..........................................29%5 – 8 years ....................................................17%9 – 15 years ..................................................25%More than 15 years ........................................29%
When do you plan to leave your current position? (N = 110)Less than five years from now ...........................45%In 5 – 8 years .................................................18%In 9 – 15 years ...............................................16%More than 15 years from now ............................6%Unsure ...........................................................15%
When do you plan to retire? (N = 109)Less than five years from now ...........................15%In 5 – 8 years .................................................12%In 9 – 15 years ...............................................24%More than 15 years from now ..........................50%
Do you have any fundraising designations? Please select all that apply. (N = 105)CFRE .............................................................36%FAHP ...............................................................5%Other, please specify .........................................9%None .............................................................56%
In which province do you work? (N = 109)Alberta ..........................................................26%British Columbia .............................................14%Manitoba .........................................................2%New Brunswick .................................................1%Nova Scotia .....................................................3%Nunavut ...........................................................1%Ontario ..........................................................47%Prince Edward Island .........................................1%Quebec ...........................................................1%Saskatchewan ..................................................6%
AHP SALARY REPORT | CANADA, 2018 52
What is your highest level of education? (N = 113)High school diploma .........................................3%Some college ..................................................17%Technical school ................................................6%Associate degree ..............................................4%Bachelor's degree ...........................................42%Master's degree ..............................................20%Other, please specify .........................................9%
What is your year of birth? (N = 106)1950................................................................1%1953................................................................1%1954................................................................1%1955................................................................3%1956................................................................1%1957................................................................3%1959................................................................6%1960................................................................4%1961................................................................3%1962................................................................3%1964................................................................5%1965................................................................2%1966................................................................4%1967................................................................4%1968................................................................2%1969................................................................5%1970................................................................2%1971................................................................1%1972................................................................2%1973................................................................5%1974................................................................7%1975................................................................2%1976................................................................4%1977................................................................3%1978................................................................3%1979................................................................5%1980................................................................2%1981................................................................2%1982................................................................1%1983................................................................1%1984................................................................1%1985................................................................5%1986................................................................1%
1987................................................................3%1989................................................................1%1990................................................................3%1992................................................................1%1993................................................................2%1996................................................................1%
Please indicate the race or ethnicity with which you most closely identify: (N = 112)African-American / Black ...................................1%Asian / Asian-American ....................................4%Caucasian / White .........................................89%Native American / Alaskan Native .....................1%Prefer not to answer ..........................................5%
What is your gender? (N = 112)Female ...........................................................79%Male .............................................................21%Prefer not to answer ..........................................1%
AHP SALARY REPORT | CANADA, 2018 53
POSIT ION DESCRIPT IONS
Executive Director: This position is responsible for directing fundraising, community awareness and other initiatives of the Foundation and for promoting support for the Foundation and Hospital in the community. He/she assures funds are raised and utilized in accordance with applicable laws, regulations and donor’s wishes. Responsible for the comprehensive development, implementation, administration and evaluation of the Foundation and fundraising efforts, creating campaigns and programs to fund capital needs and service growth, education and capital reserves through annual campaigns, planned giving, endowment campaigns, special events, capital development and community relations. Manages the daily activities of the Foundation, develops and recruits volunteer leaders.
President/CEO: Responsible for leadership and management of the foundation. The President/ CEO reports to and works in partnership with the Administrator of the Hospital and the Foundation board of directors and is responsible for developing and managing the organization’s budget, developing and supervising a paid staff.
Vice President: This position is accountable for planning, organizing and directing all aspects of philanthropic development for the organization consistent with the Mission, Vision and values of the health care organization. The Vice President assists the President/CEO of the foundation and serves on the senior management team.
Chief Development Officer: The CDO will have bottom line responsibility for leading and managing all operational and administrative aspects of the organization. You will be responsible for a comprehensive array of administrative services and operations overseeing all activities pertaining to communications, information technology, human resources, recruiting and hiring, facilities management,
legal affairs and other foundation operations that are required to effectively and efficiently support the organization’s programs, research and development. The CDO will be responsible for organizing, operating, and staffing all operations except those reporting to the CEO.
Chief Financial Officer: The CFO manages the Foundation’s treasury, financial management, and accounting functions. As a member of senior management, the CFO participates in developing broad organizational goals, objectives and policies. The CFO is responsible for accurate and timely accounting and financial reporting for the Foundation, as well as establishing and maintaining a strong system of internal controls.
Chief Operating Officer: This position will be responsible for the development of foundation’s financial management strategy and contribute to the development of the organization’s strategic goals. In addition to the strategic components, the COO will be charged with developing and implementing more sophisticated policies and procedures both in the finance and general operational realms.
Director of Development: Responsible for the planning and implementation of programs, projects and activities designed to seek, receive and administer charitable contributions to the Foundation for the benefit of the Hospital. Plans and executes the Foundation’s annual giving program; works with Executive Director and Board of Directors to plan programs and events designed to increase the awareness of and solicitations of the Foundation; supervises Foundation administrative support staff and manages internal operations for gift receiving, receipting, acknowledging and recording; oversees computer network systems for support of Foundation programs; assists Executive Director in planning and conducting planned giving solicitations.
AHP SALARY REPORT | CANADA, 2018 54
Development Officer: Advances the mission of the Hospital by increasing the level of involvement and philanthropic commitment of patients and people in the Hospital’s service area. This professional position functions as a fundraising generalist with particular emphasis given to the cultivation and solicitation of annual gifts; the grateful patient program; database growth and the management of its integrity; and special events.
Annual Giving Officer: Organizes and develops a sustaining gifts program including direct mail, membership and commemorative gifts. Coordinates ongoing donor cultivation, donor recognition and fundraising events. Oversees the accurate recording, reporting and managing of all donor information. Presents annual giving results to Foundation Board of Trustees periodically.
Major Gifts Officer: Develops and implements cultivation strategies for assigned prospects with the ultimate goal of closing the gift. Manages a pool of 100 top prospects. Identifies new volunteer and financial support opportunities from patients and friends with the goal of expanding the number of viable qualified major gift donors for the Hospital. As a part of the professional development staff, assists with the institution’s efforts to develop significant growth from major gifts. In consultation with the Director, provides personalized stewardship to assigned donors.
Planned Giving Officer: Utilizes knowledge of planned gifts to independently provide donors with specific information on gifting instruments including annuities, trusts, and bequests as well as methods of funding including cash, securities, and real estate. Recruits, coordinates, supports and manages the volunteer advisory committee for Planned Gifts. Facilitates and organizes the mail program to educate prospective planned gift donors. Maintains planned gift data on all planned gifts and expectancies currently in place.
Grant Writer: Duties include performing research utilizing primarily the Internet, but also paper research on grant funds available from public and private sources. He/she will also be responsible for researching, writing, and submitting grant applications for health related projects. Provides personal outreach to funding sources as appropriate.
Administrative Assistant: The incumbent serves as the assistant to the Executive Director of the Foundation, which requires a substantial amount of independent judgment and individual action. Responsibilities including Board, volunteer, meeting, travel and correspondence coordination are exercised under pressure of deadlines from multiple sources characteristic of a sophisticated, comprehensive fundraising program.
Development Coordinator: This position is responsible for the managing and coordinating all office activities and events for the Foundation including transmittals for deposits, correspondence, gift acknowledgments and management of the donor database. The Development Coordinator is accountable for ensuring that mission values are translated and integrated into daily work performance and relationships.
Campaign Officer: This position is responsible for designing, implementing, and coordinating campaigns to successfully achieve established long-term giving objectives.
Prospect Researcher: Develop and implement research methodologies that facilitate identifying prospective donors who have the capacity and potential to provide major gifts to the Foundation. Oversee the records management of donor information within donor database. Coordinate and supervise all prospect research activities using online and hard copy sources. Develop and maintain a system of prospect research and management through effective donor database utilization for the support of campaigns at the organization.
AHP SALARY REPORT | CANADA, 2018 55
Special Events Officer: Coordinates and supervises Foundation special events. Responsible for reporting results of events.
Database Manager: Responsible for all donor information in the computer system assuring accuracy of all additions, changes, and deletions. Supervises daily data input, edits, and postings of all daily contributions. Responsible for providing all necessary analytical reports. Is responsible for the development network of computers and printers assuring that all are maintained in the highest working order. Coordinates the selection of data in preparation of mailings ensuring accuracy of data and oversees the production of all on-site production of letters, envelopes, mailing
labels, and other data required in special formats. Responsible for the prospect management system, including all identification and tracking of major donors. Works with appropriate Program Managers to ensure that cultivation/solicitation schedule is met.
Donor Relations Coordinator: Supports fundraising programs by developing and maintaining an ongoing program to cultivate, service and recognize current donors and solicit new donors through special programs and events. Monitors admissions of major donors to the hospital and arranges to visit. Updates donor recognition on a regular basis and maintains donor walls.
AHP SALARY REPORT | CANADA, 2018 56
SURVEY INSTRUMENT
1. Which of the following best describes your current employment status?
If you work for multiple employers, please answer in terms of the organization that represents the greatest percentage of your working hours.
❑ Full-time paid employment (35 or more hours per week)
❑ Part time paid employment (less than 35 hours per week)
❑ Self-employed (35 or more hours per week)
❑ Self-employed (less than 35 hours per week)
❑ Other form of paid employment (e.g., per diem or contract work)
❑ Not currently in paid employment, but seeking work
❑ Not currently in paid employment, not seeking work and/or retired
2. How long have you been unemployed, but looking for work?
❑ 3 months or less
❑ 4 - 6 months
❑ 7 - 9 months
❑ 10 - 12 months
❑ 1 - 2 years
❑ 3 - 4 years
❑ Longer than 4 years
❑ Unsure
3. In which of the following areas do you work? Please select all that apply.
❑ Annual Giving
❑ Major Giving
❑ Corporate & Foundation Giving
❑ Planned Giving
❑ Public Support
❑ Special Events
❑ Management−Staff
❑ Management−Foundation
❑ Other, please specify
4. Please choose the job title that best describes your current position.
❑ Administrative Assistant
❑ Annual Giving Officer
❑ Campaign Officer
❑ Chief Development Officer
❑ Chief Financial Officer
❑ Chief Operating Officer
❑ Database Manager
❑ Development Coordinator
❑ Development Officer
❑ Director of Development
❑ Donor Relations Coordinator
❑ Executive Director
❑ Grant Writer
❑ Human Resources
❑ Major Gifts Officer
❑ Philanthropy Operations
❑ Planned Giving Officer
❑ President/CEO
❑ Prospect Researcher
❑ Special Events Officer
❑ Vice President
❑ Other, please specify
5. What is the average tenure of your:
Please respond in years. If you are unsure, please leave blank.
_ Annual Giving Officer _ Campaign Officer _ Chief Development Officer _ Chief Financial Officer _ Chief Operating Officer _ Database Manager _ Development Coordinator
_ Development Officer _ Director of Development _ Donor Relations Coordinator _ Executive Director _ Grant Writer _ Human Resources _ Major Gifts Officer
_ Planned Giving Officer _ President/CEO _ Prospect Researcher _ Special Events Officer _ Vice President
AHP SALARY REPORT | CANADA, 2018 57
6. How many years have you been in your current position?
❑ Less than five years
❑ 5 – 8 years
❑ 9 – 15 years
❑ More than 15 years
❑ Unsure
7. Please indicate the total number of employees that report directly or indirectly to you.
Direct reports are employees you directly supervise/manage.
Indirect reports are employees that are supervised/managed by one of your direct reports.
Example: You have 2 employees that report directly to you. One of these positions has 6 employees that fall under his/her span of control. This means you have 2 direct reports, and 6 indirect reports.
_ Total number of employees reporting directly to you _ Total number of employees reporting indirectly to you
8. On average, approximately how many hours:
Are you scheduled to work in a typical work week, including days/hours where you work remotely?
Do you work in a typical work week, including days/hours where you work remotely?
Dropdown List
Less than 40 hours
40 - 44 hours
45 - 49 hours
50 - 54 hours
55 - 59 hours
60 - 64 hours
65 hours or more
Unsure
9. Is your institution/organization part of a healthcare system?
❑ Yes
❑ No
❑ Unsure
10. Which type of system do you work for?
❑ Local system
❑ Regional system
❑ National system
❑ Unsure
❑ Not applicable
AHP SALARY REPORT | CANADA, 2018 58
11. Which of the following best describes your institution/organization?
❑ Academic setting (e.g., university-based medical center, medical school, teaching hospital)
❑ Children’s hospital
❑ Community institution (e.g., hospital, medical center)
❑ Long-term care facility (e.g., nursing home, assisted-living facility)
❑ Not-for-profit health organization (e.g., visiting nurses, hospice)
❑ Public or governmental hospital
❑ Specialty institution (e.g., psychiatric institution, rehabilitation hospital, hospice)
❑ Consulting firm or organization
❑ I am currently a student
❑ Other, please specify
12. What best describes the setting of your place of employment? If your institution/organization has multiple locations, please select the one that best describes where you currently work.
❑ Rural ❑ Suburban ❑ Urban ❑ Unsure
13. In which country is your organization located? ___________________________________________________________________
14. What is your foundation’s current operating budget? ______________________________________________________________
15. How many staffed beds do you have for inpatient care, as reported to HealthCareCAN? ________________________________
16. What is your institution’s/organizations net patient revenue? _______________________________________________________
17. How many full-time staff, including yourself, work in your development office? _ Full-time equivalent professionals _ Full-time equivalent clerical/support staff
18. What is your base annual salary as of July 1, 2018 (excluding benefits and bonuses)? _________________________________
19. Does your organization use set salary ranges across the organization that groups similar positions together for determining compensation (i.e., salary pay grades or “schedules” that determine what an employee of a particular position should make, typically within a range)?
❑ Yes
❑ No
❑ Unsure
20. How do you feel your salary compares to other employees at the same level in your organization/institution?
❑ My salary is substantially higher than other employees at my level
❑ My salary is moderately higher than other employees at my level
❑ My salary is comparable to other employees at my level
❑ My salary is moderately lower than other employees at my level
❑ My salary is substantially lower than other employees at my level
❑ Unsure
AHP SALARY REPORT | CANADA, 2018 59
21. From 2017-2018, what was the percentage increase in base salary that you received?
❑ I did not receive a percentage increase in base salary this year
❑ 2% or less
❑ 3% - 4%
❑ 5% - 6%
❑ 7% - 8%
❑ 9% - 10%
❑ More than 10%
❑ Unsure
22. Which of the following are reasons why you were awarded an increase in your base salary from 2017-2018? Please select all that apply.
❑ Attainment of organization’s national recognition
❑ Attainment of individual certification
❑ Meeting individual performance measures
❑ Meeting departmental performance measures
❑ Meeting organizational performance measures
❑ Customer or patient satisfaction surveys
❑ Increase to keep up with cost of living
❑ Promotion
❑ Other, please specify
❑ Unknown
23. Are you currently eligible for an incentive or bonus award?
❑ Yes, discretionary (bonus is not based on defined metrics)
❑ Yes, non-discretionary (bonus is paid based on the achievement of defined metrics/outcomes)
❑ Eligible for both discretionary and non-discretionary bonus
❑ Not eligible for incentive or bonus
❑ Unsure
24. How large was your last bonus award (discretionary and non-discretionary) as a percentage of your 2017 base salary?
❑ I did not receive an incentive or bonus award in 2017
❑ 0.1% - 2.5%
❑ 2.6% - 5.0%
❑ 5.1% - 7.5%
❑ 7.6% - 10.0%
❑ 10.1% - 20.0%
❑ 20.1% - 30.0%
❑ Over 30.0%
❑ Not Sure
25. Are you eligible for paid overtime?
❑ Yes
❑ No
❑ Unsure
26. Does your organization use set salary ranges across the organization that groups similar positions together for determining compensation (i.e., salary pay grades or “schedules” that determine what an employee of a particular position should make, typically within a range)?
❑ Yes
❑ No
❑ Unsure
27. From 2017-2018, what was the average percentage increase in base salary that development professionals received at your institution/organization?
❑ 2% or less
❑ 3% - 4%
❑ 5% - 6%
❑ 7% - 8%
❑ 9% - 10%
❑ More than 10%
❑ Unsure
AHP SALARY REPORT | CANADA, 2018 60
28. Which of the following are reasons why development professionals are awarded an increase in base salary at your institution/organization? Please select all that apply.
❑ Attainment of organization’s national recognition
❑ Attainment of individual certification
❑ Meeting individual performance measures
❑ Meeting departmental performance measures
❑ Meeting organizational performance measures
❑ Customer or patient satisfaction surveys
❑ Increase to keep up with cost of living
❑ Promotion
❑ Other, please specify
❑ Unknown
29. Are development professionals at your institution/organization eligible for an incentive or bonus award?
❑ Yes, discretionary (bonus is not based on defined metrics)
❑ Yes, non-discretionary (bonus is paid based on the achievement of defined metrics/outcomes)
❑ Eligible for both discretionary and non-discretionary bonus
❑ Not eligible for incentive or bonus
❑ Unsure
30. What is the average bonus award (discretionary and non-discretionary) as a percentage of base salary awarded to development professionals at your institution/organization?
❑ 0.1% - 2.5%
❑ 2.6% - 5.0%
❑ 5.1% - 7.5%
❑ 7.6% - 10.0%
❑ 10.1% - 20.0%
❑ 20.1% - 30.0%
❑ Over 30.0%
❑ Not Sure
31. Are development professionals eligible for paid overtime?
❑ Yes
❑ No
❑ Unsure
32. How are your paid days off from work structured?
❑ Paid time off (PTO): a pre-determined amount of time that can be used as vacation, sick-time, or other unspecified time off
❑ Separate amounts of vacation and sick-leave time
❑ Unsure
❑ I do not receive paid days off
33. How many paid days off do you receive annually in the following categories (excluding paid holidays)? _ Paid time off (PTO) _ Other paid time
34. How many paid days off do you receive annually in the following categories (excluding paid holidays)? _ Paid vacation _ Paid sick time _ Other paid time
AHP SALARY REPORT | CANADA, 2018 61
35. Please indicate the benefits offered to you by your institution. Please select all that apply.
❑ Medical insurance/group plan
❑ Medical savings account
❑ Dental insurance/group plan
❑ Vision coverage
❑ Life insurance
❑ Retirement plan
❑ Long-term disability
❑ Short-term disability
❑ Child daycare
❑ Time off for child care or elder care
❑ Employee assistance or wellness program
❑ Profit sharing
❑ Education/professional development assistance
❑ Professional association memberships
❑ Adoption assistance
❑ Auto Allowance
❑ Smartphone
❑ Laptop or tablet
❑ Flexible work arrangements (e.g. telecommuting)
❑ Flexible schedule (e.g., arriving at 6am and leaving at 2pm)
❑ Business Travel Accident Insurance
❑ Defined Contribution Retirement Plan
❑ Defined Benefit Retirement Plan
❑ Pet insurance
❑ Parking/travel stipend
❑ Other, please specify
36. Are there any other innovative practices or benefits your employer uses to attract candidates? ___________________________ ____________________________________________________________________________________________________________ ________________________________________________________________________________________________________________________________________________________________________________________________________________________
37. In considering employment, what features are most important to you? Please rank the items below according to their importance.
❑ Cash compensation (salary plus any bonuses)
❑ Paid time off
❑ Ability to work from home
❑ Flexible working hours
❑ Opportunities for professional development/education
38. How are your employer-provided benefits paid?
❑ Employee pays full cost
❑ Employer pays full cost
❑ Costs are shared between employee and employer
❑ Unsure/Not applicable
39. What were some challenges you faced when entering the field? Please select all that apply.
❑ Lack of peer network
❑ Establishing relationships with trusted partners
❑ Demonstrating qualifications
❑ Lack of experience
❑ Building a customer base
❑ Finding the time
❑ Cost
❑ Other, please specify _____________________________
AHP SALARY REPORT | CANADA, 2018 62
40. How satisfied or dissatisfied are you with the following aspects of your job?
Very Somewhat Not very Not at all Unsure/ satisfied satisfied satisfied satisfied not applicable
Your job overall ❍ ❍ ❍ ❍ ❍
Your compensation ❍ ❍ ❍ ❍ ❍
Your benefits ❍ ❍ ❍ ❍ ❍
Decision to work in health care fundraising ❍ ❍ ❍ ❍ ❍
Area(s) of responsibility ❍ ❍ ❍ ❍ ❍
Amount of authority you have in your job ❍ ❍ ❍ ❍ ❍
Opportunity for growth ❍ ❍ ❍ ❍ ❍
Job security ❍ ❍ ❍ ❍ ❍
Relationship with your direct supervisor ❍ ❍ ❍ ❍ ❍
Relationship with your co-workers ❍ ❍ ❍ ❍ ❍
Relationship with those you manage ❍ ❍ ❍ ❍ ❍
Recognition for the work you do ❍ ❍ ❍ ❍ ❍
The level of joy and meaning you find in your job ❍ ❍ ❍ ❍ ❍
41. Considering your experience in health care fundraising to date, how likely would you be to recommend health care fundraising to a colleague or new graduate entering the field? ________________________________________
42. Please indicate your level of agreement or disagreement with the following statements:
Completely Somewhat Neither agree Somewhat Completely disagree disagree nor disagree agree agree
My profession/field is changing quickly compared to other fields ❍ ❍ ❍ ❍ ❍
I view my job purely as a necessity of life, much like eating and sleeping ❍ ❍ ❍ ❍ ❍
I am proud to be a part of my profession/field ❍ ❍ ❍ ❍ ❍
I am very optimistic about the state of my profession/field today ❍ ❍ ❍ ❍ ❍
I am very optimistic about the future of my profession/field ❍ ❍ ❍ ❍ ❍
Staff in my department are at least as diverse as the donors we serve ❍ ❍ ❍ ❍ ❍
My organization implements specific hiring practices and policies that are intended to foster a diverse staff ❍ ❍ ❍ ❍ ❍

AHP SALARY REPORT | CANADA, 2018 63
43. What are the three most important reasons why you have stayed at your current place of employment?
❑ This is the best opportunity for me
❑ I enjoy my work environment
❑ I am satisfied with my responsibilities
❑ I enjoy my coworkers
❑ Job stability
❑ My hours and/or flexibility of work schedule
❑ My benefits
❑ My compensation
❑ Vacation or sick time
❑ Casual work environment
❑ Convenience of my work location
❑ Current economic environment
❑ Low-stress work environment
❑ Opportunity to work from home
❑ Opportunity for advancement
❑ Opportunity for professional growth
❑ Relationship with interdisciplinary team
❑ I find joy and meaning in my work
❑ Other, please specify
❑ I am currently searching for other work
44. Please rate your level of agreement or disagreement with the following statements.
Completely Somewhat Neither agree Somewhat Completely disagree disagree nor disagree agree agree
My organization has difficulty recruiting applicants for development positions ❍ ❍ ❍ ❍ ❍
My organization has difficulty retaining development professionals ❍ ❍ ❍ ❍ ❍
Development professionals vary significantly in their level of skill and competency ❍ ❍ ❍ ❍ ❍
My organization is highly selective when hiring development professionals ❍ ❍ ❍ ❍ ❍
My organization implements specific hiring practices and policies that are intended to foster a diverse staff ❍ ❍ ❍ ❍ ❍
45. How important is each of the following when assessing an applicant for an open position in your organization? (Scale 1-5, 1 = not at all important and 5 = extremely important)
_ Education _ Work experience in the field _ Credential in an area of expertise _ Soft skills (communication skills, presentation skills, etc.) _ Problem-solving ability _ Technical Skills _ Scientific knowledge _ Professional ethics/values
46. What do you think will be the critical competencies or skills development professionals will need to have to be successful in the next five years? ___________________________________________________________________ ________________________________________________________________________________________________________________________________________________________________________________________________________________________
AHP SALARY REPORT | CANADA, 2018 64
47. How many years of experience do you have in health care fundraising?
❑ Less than five years
❑ 5 – 8 years
❑ 9 – 15 years
❑ More than 15 years
❑ Unsure
48. When do you plan to leave your current position?
❑ Less than five years from now
❑ In 5 – 8 years
❑ In 9 – 15 years
❑ More than 15 years from now
❑ Unsure
49. When do you plan to retire?
❑ Less than five years from now
❑ In 5 – 8 years
❑ In 9 – 15 years
❑ More than 15 years from now
❑ Unsure
50. Do you have any fundraising designations? Please select all that apply.
❑ CFRE
❑ FAHP
❑ Other, please specify _____________________________________________
❑ None
51. In which state do you work? __________________________________________
52. What is your highest level of education?
❑ High school diploma
❑ Some college
❑ Technical school
❑ Associate degree
❑ Bachelor’s degree
❑ Master’s degree
❑ Doctorate
❑ Other, please specify
_________________________________
53. What is your year of birth? ___________________________________________
54. Please indicate the race or ethnicity with which you most closely identify:
❑ African-American / Black
❑ Native American / Alaskan Native
❑ Asian / Asian-American
❑ Caucasian / White
❑ Hispanic
❑ Non-White Hispanic
❑ Middle Eastern
❑ Pacific Islander / Native Hawaiian
❑ Biracial/Multiracial
❑ Prefer not to answer
55. What is your gender?
❑ Female
❑ Male
❑ Not listed, please specify
❑ Prefer not to answer

2511 Jefferson Davis Hwy, Suite 810Arlington, VA 22202www.ahp.org