aiaa scitech: jan 09, 2018 presenter: dr. stephen b ... · 7 loc risk mitigation via selection of...
TRANSCRIPT
AIAA SciTech: Jan 09, 2018Presenter: Dr. Stephen B. Johnson, DST
Deepak Haste, Sudipto GhoshalQualtech Systems Inc.100 Corporate Place Suite 220, Rocky Hill, CT 06067http://www.teamqsi.com
Stephen B. JohnsonDependable System Technologies, LLC Westminster, CO 80234& Jacobs ESSSA, Huntsville, AL 35812
Craig MooreNASA Marshall Space Flight CenterHuntsville, AL 35812
https://ntrs.nasa.gov/search.jsp?R=20180001132 2019-04-09T12:31:55+00:00Z

2
NASA uses a variety of tools to conduct its Fault Management (FM) activities crucial to ensuring that a system achieves mission goals while functioning within the tolerable limits However, these tools are varied and disjoint, and often require manual
intervention to transfer data from the output of one tool to the input of another. This process is tedious and error-prone and scales poorly for large, complex systems.
This prevents SHM engineers from gaining insight into the overall system level design and characteristics that are the key to transparency, verifiability and efficiency of implementing and testing FM
There is a need for an FM Modeling and Analysis Tool that can Integrate data from multi-domain tools Perform FM architecture trade studies of cost-effective FM design
architectures and operations Employing SHM/FM metrics in Commercial Off-the-Shelf (COTS)
software such as TEAMS® often saves time and money TEAMS® Toolset is already being used in several NASA programs and projects
for SHM/FM-related purposes.
3
Capture diverse and disjoint data products and multi-domain modeling information into TEAMS® for standardizing FM Techniques and Processes Fault Management Requirements: “Multi-discipline FM Interoperation” TEAMS® provides a common modeling framework in which complementary information is fused
into a system-wide model and “standardization of data products, techniques and analyses” related to FM
Integrate multi-domain models/data from various sources into a central TEAMS®
model of a system. Semantics-based model-driven technique to discover legacy systems, generate models from the
source systems, and aggregate and translate models into TEAMS® format. Conduct Architecture Trade Studies focusing on failure detection (abort
trigger) effectiveness with related sensor suite selection Enable NASA FM engineers to study designs related to sensor implication specifically
for improving failure detection (e.g. abort triggers) effectiveness Transition the process from a loosely coupled Excel based and disparate analytic tools
into a central TEAMS® platform utilizing its built-in analytic capabilities Capabilities in TEAMS® to support the main tasks such as assessment of
Failure Effect Propagation timing (FEPT) To account for the time from fault initiation until detection, and from detection until it
affects the end-goal (effect)

4
Utilize TEAMS® for conducting extensive Fault Management (FM) activities Leverage NASA’s existing Systems Engineering (SE) sources as the basis for the TEAMS® models Model-driven approach
Integrate multi-domain data and models into the TEAMS® modeling framework using modern model-discovery/transformation/generation methods such as MoDisco.
The main steps involved in the multi-domain integration are: Discover: A metamodel that describes an existing legacy system is created. Then, based on the
metamodel of the system representation, the underlying legacy model of the system is discovered. Generate: From the discovered model, a generic (domain-independent) model is generated for
viewing and editing. Transform: This step involves converting the generic model to the desired TEAMS® output format.
5
Sources of NASA model repositories for multi-domain integration Channelization Spreadsheets - Documents created by the JSC group in Excel format,
showing bus mapping, wiring information and hardware channelization. Abort Analysis Matrix (AAM) - Contains the Mission & Fault Management (M&FM) group’s
model of Space Launch System (SLS) abort trigger (AT) effectiveness FMEA and Fault Trees from NASA SLS PRA Model (top down): The Probabilistic Risk Assessment (PRA) fault tree model of the Space
Launch System (SLS) is in SAPHIRE format and is created by the S&MA group. Element FMEAs (bottom up): Created by the Reliability Group, these engine specific Failure Mode
and Effect Analysis (FMEA) documents pertain to Core Stage, Main Engine, Upper Stage, etc. The FMEAs for various stages may come from different vendors and could potentially differ in format. The aim is to capture common failure modes and correlations among these disparate FMEAs into an integrated TEAMS model.
Hazard Trees (top down): These are created by the Systems Safety group using tools such as CAFTA. The hazard tree mainly has causal relationships between intermediate and top level effects.
Example Discovery and Transformation from an Excel workbook containing Abort Analysis Matrices into TEAMS® model entities and analyses. Model Discovery – XML Injector using XML metamodels injects Excel file into XML format. Model Translation/Transformation First transformation is based on a simplified subset of Microsoft’s SpreadsheetML metamodel
used to import/export Excel workbook’s data to a SpreadsheetML format. Second transformation is from SpreadsheetML to TEAMS XML format

6
NASA devises FM approaches, architectures, and tools for implementing and testing FM. However, the use of separate, multi-domain modeling and analysis techniques can lead to
expensive, disjoint and sometimes inconsistent analyses. Leverage built-in analytic capabilities of TEAMS® to quantitatively conduct FM architecture
trade studies. Two of the FM architecture trade space studies currently conducted by NASA
can be assimilated into TEAMS® utilizing its analytic capabilities LOC Risk Mitigation Criteria Using appropriate Abort Trigger Suite Abort Trigger “detects” a crew safety-related anomaly and sends recommendation to the Multi-
Purpose Crew Vehicle (MPCV) to initiate an abort response TEAMS® software can apply quantitative criteria to assess the effectiveness of Abort Triggers to
select the most effective sensor (Abort Trigger) suite Abort Trigger FP and FN Quantification with Sensor Data Qualification (SDQ) Effect of SDQ mechanism on False Positive/False Negative metrics of Abort Trigger Leverage “FM Metrics” capability for computing FD/FI Effectiveness for LOC/LOM end effects.
The two trade studies will rely on importing the relevant sensor library, associated parameter, timing and redundancy spreadsheets, FMECA, etc. into TEAMS®
Apply the multi-domain model integration process to perform this assimilation of relevant information into TEAMS® for the trade study Develop appropriate Discoverers and Transformers for model discovery and model
understanding for usage in TEAMS®
7
LOC Risk Mitigation via selection of Abort Trigger Suite An Abort Trigger is the means by which the SLS detects a crew safety-
related failure and sends a recommendation to the Orion vehicle to initiate an abort response.
Most effective detection suite to protect astronauts from catastrophic effects (e.g. Loss of Crew – LOC) of failures in the SLS vehicle.
Typically, failures in the system are identified and quantified using Probabilistic Risk Assessment (PRA) methodologies and FMEA analyses.
Current process of mapping FMEA to end-states (LOC/LOM) is manual Involves cross-referencing voluminous FMEA spreadsheets
Utilize TEAMS® fault trees to enumerate initiating events (failures) and their probabilistic contribution to the end-states (effects)
8
LOC Risk Mitigation via selection of Abort Trigger Suite (contd.) Approach utilizing TEAMS® to assess the effectiveness of the ATs in order to select
the most effective detection suite NASA subject matter experts (SMEs) generate the “AT Tables” containing a library of ATs and
their associated warning times, state estimation metrics (such as FP, FN, etc.), and information about potential redundant failure detections (primary vs. secondary triggers, etc.).
Utilize the multi-domain model integration capability to import AT configuration files and the associated FMECA model.
Import the sensor library and their associated properties including the state estimation metrics associated with the AT algorithms associated with the relevant sensors (such as FP, FN etc. of TEAMS® tests.), FEPT and redundant detection information from the AT Tables into TEAMS®.
Import the top-level effects, mission phases, etc. from the AT Tables into TEAMS®, to form the building blocks of a FMECA model.
Perform Fault Tree analysis in TEAMS® for each LOM scenario by generating cut sets and the initiating failure causes.
Using the FM Metrics capabilities of TEAMS® Designer, generate the Confusion Matrix of the entire AT Suite for the LOM Failure Scenario (top-level effect).
Using the FP/FN calculations for the AT suite, evaluate the risk mitigation criteria in order to determine the suite of ATs that are most suitable for meeting the “LOC Risk Mitigation” criteria Any relevant criteria such as detection effectiveness (fault detection probability), diagnostic
effectiveness (fault isolation probability), etc. of the AT suite for the applicable failure scenarios.
9
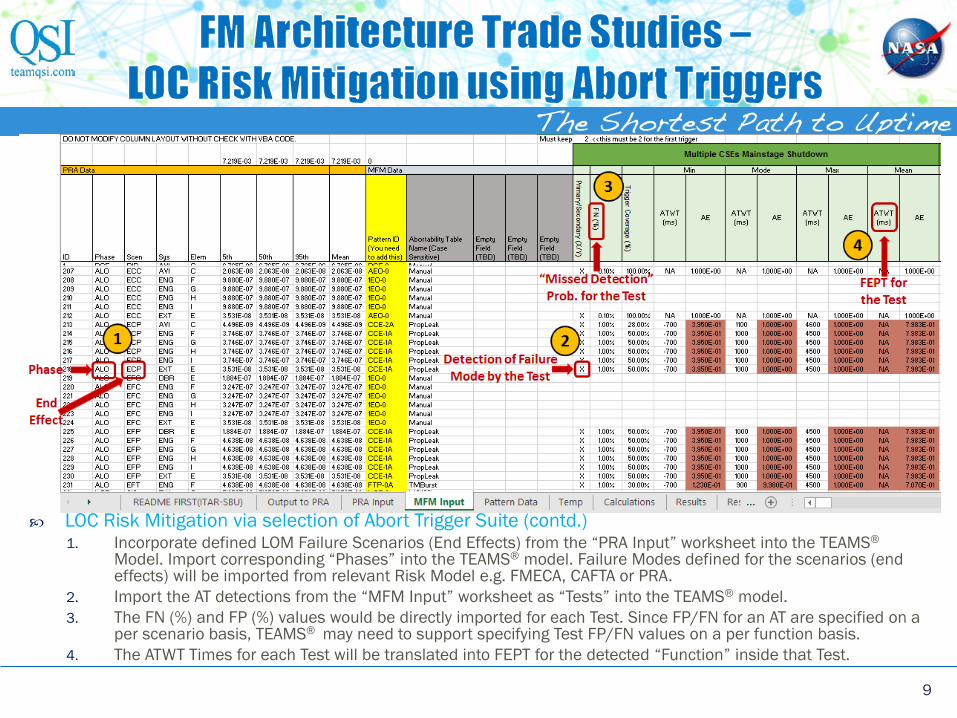
LOC Risk Mitigation via selection of Abort Trigger Suite (contd.)1. Incorporate defined LOM Failure Scenarios (End Effects) from the “PRA Input” worksheet into the TEAMS®
Model. Import corresponding “Phases” into the TEAMS® model. Failure Modes defined for the scenarios (end effects) will be imported from relevant Risk Model e.g. FMECA, CAFTA or PRA.
2. Import the AT detections from the “MFM Input” worksheet as “Tests” into the TEAMS® model.3. The FN (%) and FP (%) values would be directly imported for each Test. Since FP/FN for an AT are specified on a
per scenario basis, TEAMS® may need to support specifying Test FP/FN values on a per function basis.4. The ATWT Times for each Test will be translated into FEPT for the detected “Function” inside that Test.

10
LOC Risk Mitigation via selection of Abort Trigger Suite (contd.) Importing Tests and Effects Effects (and associated Phases) were imported from the Failure Scenarios Failure Modes will be imported from FMEAs and connected to the tests
Average across all detections
Scenario occurring across multiple phases
11
Abort Trigger FP and FN Quantification with SDQ Study quantifies the benefit of having the Sensor Data Qualification
(SDQ) processing module on the detection process for Abort Triggers Incorporates probabilities of failure modes, such as electrical shorts,
high voltage, etc., associated with failed-high (F2FS: failure-to-full-scale)/failed-low (F2Z: failure-to-zero)/failed-intermediate observations;
Incorporates common-cause failures (redundant component failures due to common causes, i.e., cut sets of size 1 or single point failures);
Uses SAPHIRE to compute the Fault Tree of events leading to the FP and FN of the ATs;
Rolls up the probabilities caused by component and common-cause failures to calculate FP, FN of the AT; and
Calculates the minimal cut sets of sizes up to 5 (risk drivers).
12
Abort Trigger FP and FN Quantification with SDQ (contd.) Approach leveraging TEAMS®
Create a TEAMS® Model utilizing the proposed multi-domain model integration capability to import AT configuration (Excel) files and the associated FMECA model.
Top level end-effects in TEAMS® would represent the overall effect due to occurrence of Failure to Zero (F2Z) and Failure to Full Scale (F2FS) (F2ZEffect, F2SEffect).
Failure Modes and their failure rates inside each component of the AT system will be gathered from FMECA documents.
Assign “Functions” (F2Z, F2S, etc.) to Failure Modes based on their contributions to the AT. TEAMS® AND nodes with a “threshold” can be used to specify m-out-of-n redundancy between
the various components in the AT model. Simulate various failure scenarios (e.g. multiple sensor(s) going F2Z, etc.) and compute the
end-effect (LOM, LOC) FP/FN metrics utilizing the methods described in the “FM Metrics and V&V” AIAA SciTech 2017 paper.
TEAMS® Designer computes Fault Trees and Minimal Cut sets for the top-level Effect under different phases/operational modes, taking into account redundancies, and then rolls up probabilities of the implicated faults to the top-level end-effects.
The SDQ mechanism can be considered as series of switches (“System Modes”) that “switch out” certain failure modes from the model due to improved threshold classification. Apply appropriate mode changes to “switch in” the “SDQ mechanism” in the AT system,
Perform “Fault Tree Analysis” in TEAMS® for the F2ZEffect, F2SEffect, etc. End-Effects with applicable “System Modes” to apply various SDQ configurations, as well as the “Mission Duration”, to furnish the resulting “cut-sets” and their probabilities. Observe the top-level effect probabilities and their associated FP and FN reduction.
13
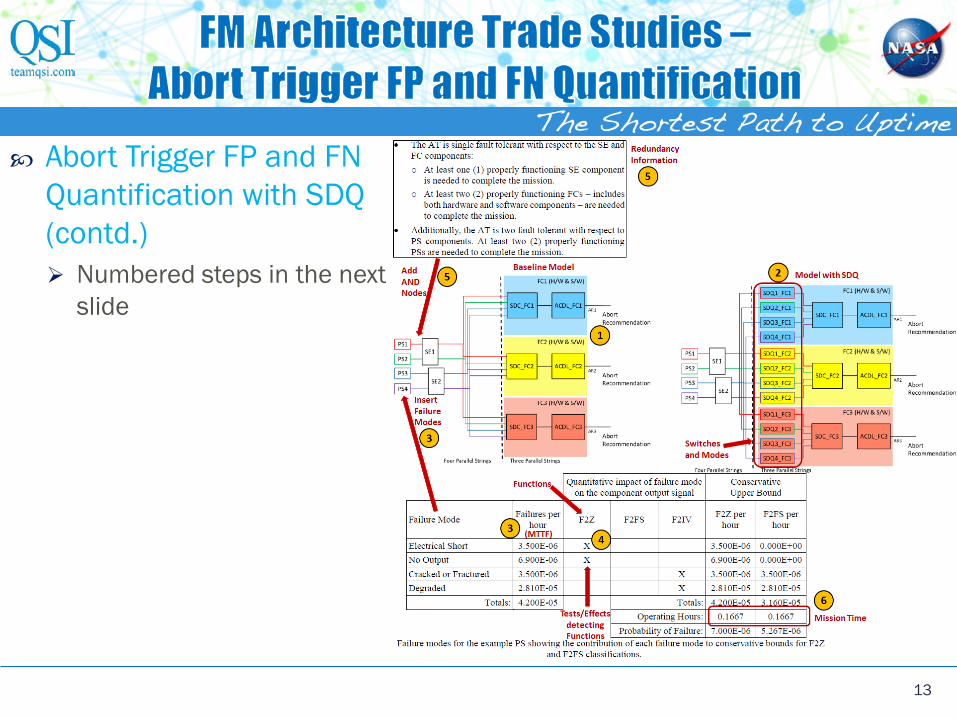
Abort Trigger FP and FN Quantification with SDQ (contd.) Numbered steps in the next
slide
14
Abort Trigger FP and FN Quantification with SDQ (contd.)1. Create a TEAMS® model from the AT schematics, comprising of “Power
System (PS)”, “Sensor Electronics (SE)”, etc. components. If models for the AT exist, use “Multi-domain Model Integration” techniques to create the TEAMS® model.
2. Augment the AT TEAMS® model with SDQ component blocks, and switching mechanisms (“Switch Modes”) to enable/disable SDQ blocks associated with various AT hardware configurations.
3. Add “Failure Modes” of AT components in the TEAMS® model. Use published Mean Time To Failure (MTTFs) numbers. SDQ blocks can have their own Failure Modes.
4. Add “Functions” (F2Z, F2S, etc.) to Failure Modes based on their contributions to the AT. Insert top level “Tests/Effects” detecting the F2Z and F2S Functions (e.g. F2ZEffect, F2SEffect, etc.).
5. Insert “AND Nodes” with “Thresholds” to specify the M-out-of-N fault tolerance.
6. Generate “Fault Trees” for F2ZEffect, F2SEffect, etc. End-Effects and for given “Mission Duration”, with applicable “System Modes” for various SDQ configurations, to get the resulting “cut-sets” and their probabilities.
15
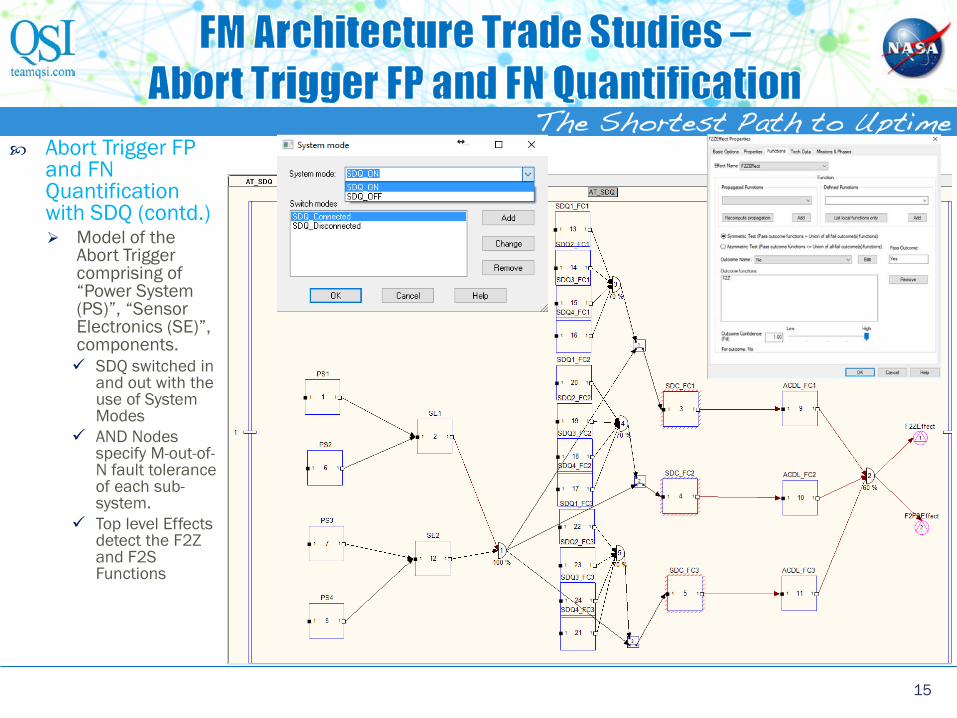
Abort Trigger FP and FN Quantification with SDQ (contd.) Model of the
Abort Trigger comprising of “Power System (PS)”, “Sensor Electronics (SE)”, components. SDQ switched in
and out with the use of System Modes
AND Nodes specify M-out-of-N fault tolerance of each sub-system.
Top level Effects detect the F2Z and F2S Functions
16
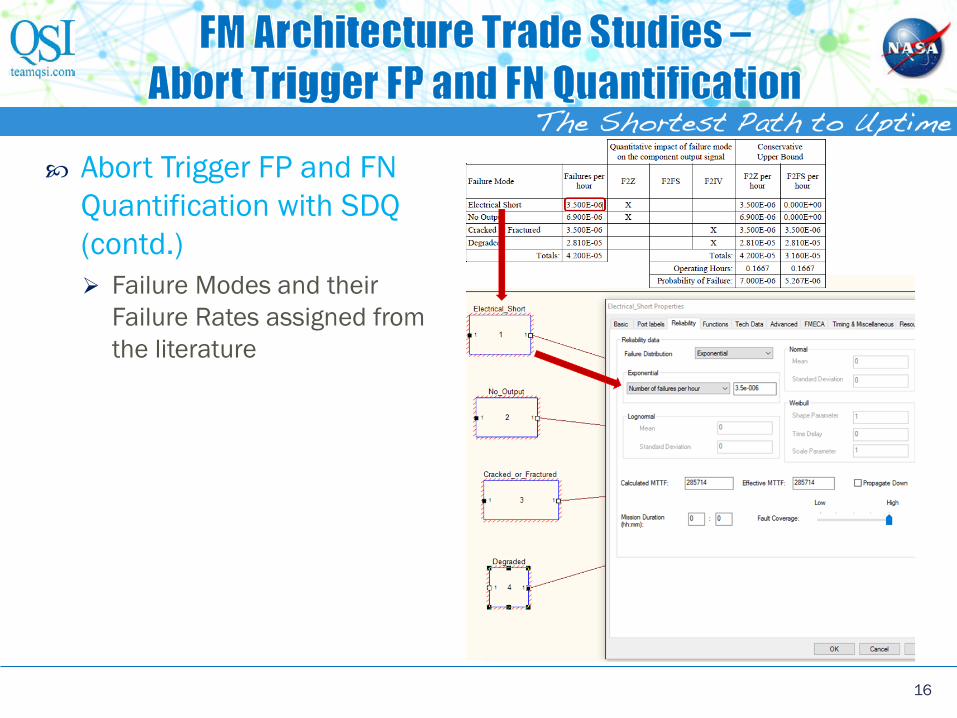
Abort Trigger FP and FN Quantification with SDQ (contd.) Failure Modes and their
Failure Rates assigned from the literature

17
Abort Trigger FP and FN Quantification with SDQ (contd.) Failure Modes are assigned
“Functions” (F2Z, F2S, etc.) based on the component output signals and their contributions to the AT as defined in the study .

18
Abort Trigger FP and FN Quantification with SDQ (contd.) Perform “Fault Tree Analysis” for the
F2ZEffect, F2SEffect End-Effects with applicable “System Modes” to include/exclude the SDQ mechanism, as well as the “Mission Duration”, to furnish the resulting “cut-sets” and their probabilities. The main “contributors” to the top level
effect are the computed “cutsets” and their “probabilities”
Common cause failure (CCF) not modeled
Include Common Cause Failure (CCF) in TEAMS® in the future to facilitate these trade studies

19
Abort Trigger FP and FN Quantification with SDQ (contd.) Results Probability of occurrence F2ZEffect
• With SDQ OFF = 8.46E-10 (cutset size 2) + 6.22E-21 (cutset size 3) • With SDQ ON = 6.46E-10 (cutset size 2)
F2FSEffect• With SDQ OFF = 7.55E-10 (cutset size 2) + 3.66E-16 (cutset size 3) • With SDQ ON = 5.67E-10 (cutset size 2)
Net benefit with SDQ F2ZEffect = 23.64% F2FSEffect = 24.9%
Lower probabilities possibly due to absence of CCFs% benefit numbers roughly double the values but of the same order as in the
study
20
Abort Trigger FP and FN Quantification with SDQ (contd.) Future exercises Alternate SDQ mechanisms can be included using TEAMS® configuration for
the trade space study Leverage effort from the “FM Metrics and V&V” NASA Phase II SBIR to create
“Failure Scenarios” and generate various “Metrics” in a “Batch” fashion for the redundancies present in the AT model.

21
Timing effects are inherently statistical in nature, hence these are really distributions. Allow FEPTs modeled as function-dependent statistical distributions depending upon
available information (e.g., bounds and the mode → Triangle distribution)
FEPT captures the time between a fault origination location and a failure detection as well as a failure effect location
Currently TEAMS® Designer allows for one time to be associated with a node or an arc
Associate Timing information with each relevant function, not just one per node or arc Attach the timing information to
individual “Functions” detected by the outcomes of TEAMS® tests.
Timing report will enhance the Reliability Analysis Reports to include timing information for singletons and doubletons for the selected Effect
22
Inclusion of Common Cause Failure (CCF) In TEAMS®
Several NASA analyses related to Risk Assessment and FM Architecture Studies incorporate Common Cause Failures (CCFs) Defined as the failure of multiple components, some of which could be part of
the designed redundancy, due to shared identical failure modes such as a common manufacturing defect
Given a failure of one of these components, the other common components’ likelihood of failure needs to be adjusted
TEAMS®-Designer and TEAMS-RDS® Capability Enhancements Allow user to define multiple CCF sets and indicate components that are part
of each of the CCF sets Methods for likelihood of failure adjustment for the CCFs Capability to specify the adjustments such as common cause scaling factors
for the CCF components
23
The paper describes FM quantification techniques in TEAMS®
using metrics derived from the theory of SHM and FM. QSI was able to capture the domain knowledge from the AAM
spreadsheet into a sparse but representative TEAMS® model. The TEAMS® analysis results from the AT FP and FN
Quantification with SDQ Architecture Trade Study are in line with the ones from the NASA study.
The difference in results are due to TEAMS® not having Common Cause Failures (CCF) modeling capability.

24