aimd/oce-98-19 budget issues: analysis of long-term fiscal ... · the congressional budget office...
TRANSCRIPT

United States General Accounting Office
GAO Report to Congressional Requesters
October 1997 BUDGET ISSUES
Analysis of Long-TermFiscal Outlook
GAO/AIMD/OCE-98-19


GAO United States
General Accounting Office
Washington, D.C. 20548
Accounting and Information
Management Division
B-278394
October 22, 1997
The Honorable Pete V. DomeniciChairman, Committee on the BudgetUnited States Senate
The Honorable John R. KasichChairman, Committee on the BudgetHouse of Representatives
As you requested, this report updates our previous simulations of thelong-term economic impact of federal budget policy. In 1992, we first useda macroeconomic model to simulate the effects of alternative fiscal policypaths in promoting or inhibiting long-term economic growth and theresults supported the view that deficit reduction was key to our nation’slong-term economic health.1 In 1995, our updated simulations indicatedthat a path of “no action,” under which current policies remain unchanged,could not be sustained over the long run.2 We identified three forcesdriving the long-term growth of the budget deficit—health spending, SocialSecurity, and interest costs. Since our 1995 report was issued, theCongress and the President have taken additional fiscal action to eliminatethe annual deficit, culminating in the recent passage of the BalancedBudget Act of 1997 (BBA). The Congressional Budget Office (CBO) projectsthat these actions, along with the recent strong performance of theeconomy, will eliminate the deficit by 2002 and achieve several years ofbudget surpluses.
In this report, we have updated our work to address the long-term budgetoutlook following passage of BBA to help the Congress assess the long-termconsequences of current policies and alternatives. We used our long-termeconomic growth model to simulate the path resulting from the BBA
through the year 2050 assuming no further policy changes (“no action”).For this path, we adopted CBO’s 10-year budgetary and economicprojections, under which the federal government would run budgetsurpluses from 2002 through 2007, the end of CBO’s forecast period.3
1Budget Policy: Prompt Action Necessary to Avert Long-Term Damage to the Economy(GAO/OCG-92-2, June 5, 1992).
2The Deficit and The Economy: An Update of Long-Term Simulations (GAO/AIMD/OCE-95-119,April 26, 1995).
3CBO’s budget projections, and thus our simulations using CBO data, reflect the net effect of theBalanced Budget Act of 1997 as well as the Taxpayer Relief Act of 1997.
GAO/AIMD/OCE-98-19 Long-Term Fiscal OutlookPage 1

B-278394
In addition to simulating the long-term results of current fiscal policy, wealso developed several alternative fiscal policy paths to illustrate howoverall fiscal policy changes can affect future budgetary and economicoutcomes. While this report discusses the consequences of alternativefiscal paths, it does not suggest any particular course of action, since thechoice of the most appropriate fiscal policy path is a policy decision to bemade by the Congress and the President. As discussed with your office,three alternatives were chosen to represent different degrees of fiscalrestraint. Two of these alternatives follow the “no action” path in the earlyyears of the simulation period but then shift direction once deficitsreemerge in the second decade of the 21st century by maintaining either abudget balance or modest deficits through the remainder of the simulationperiod. A third alternative path would run larger surpluses than the “noaction” path in the near term and for a longer period of time.
Simulations are useful for comparing the potential outcomes of alternativepolicies within a common economic framework but should not beinterpreted as forecasts of the level of economic activity 50 years in thefuture given the range of uncertainty about future economic changes andthe responses to those changes.4 Simulation results provide qualitativeillustrations, not quantitative forecasts, of the budget or economicoutcomes associated with alternative policy paths. In our simulations, weemployed a model originally developed by economists at the FederalReserve Bank of New York (FRBNY) that relates long-term gross domesticproduct (GDP) growth to economic and budget factors. All models requirethe use of assumptions to permit extrapolations to be made. For details ofthe model’s assumptions, see appendix I.
Background Economic growth—which is central to many of our major concerns as asociety—requires investment, which, over the longer term, depends onsaving. The nation’s saving consists of the private saving of householdsand businesses and the saving or dissaving of all levels of government. Ingeneral, government budget deficits represent dissaving—they subtractfrom national saving by absorbing funds that otherwise could be used forinvestment. Conversely, government surpluses add to saving.
Since the 1970s, private saving has declined while federal budget deficitshave consumed a large share of these increasingly scarce savings. The
4The impact of federal spending reduction on aggregate national saving and investment depends onhow consumers respond to such reductions. For example, a reduction in federal Medicaid spendingmay result in greater private spending on nursing home care thereby diminishing the effect on totalnational saving.
GAO/AIMD/OCE-98-19 Long-Term Fiscal OutlookPage 2

B-278394
result has been to decrease the amount of national saving potentiallyavailable for investment.5 Since we last reported on this issue in 1995,private saving has remained low. However, federal budget deficits havedeclined significantly from the levels of the 1980s and early 1990s, freeingup some additional funds for investment. (See figure 1.) Nevertheless, totalnational saving and investment remain significantly below the levelsexperienced in the 1960s and 1970s. Economists have noted that these lowlevels of saving and investment raise concerns for the nation’s futureproductive capacity and future generations’ standard of living. As we havesaid in our earlier reports, the surest way to increase the resourcesavailable for investment is to increase national saving, and the most directway for the federal government to increase national saving is to achieveand maintain a balanced federal budget. Running budget surpluses wouldfurther increase saving and allow the government to reduce the level offederal debt held by the public.
Figure 1: Effect of the Federal BudgetDeficit on Net National Saving(1970-96)
1970-1979 1980-1989 1990-1993 1994-19960
2
4
6
8
10
12
Years
Percent of net national product
Available for capital formation Absorbed by the federal deficit
Note: Entire bar represents nonfederal saving net of capital depreciation. Shaded portion of barrepresents net national saving. Nonfederal saving is comprised of private saving and theaggregate state and local government surplus/deficit.
Source: GAO analysis of U.S. Department of Commerce data.
5The depressing effect of deficits on growth might have been mitigated had they financed higher levelsof public investment. However, as a share of GDP, federal investment spending has actually declinedover the past two decades.
GAO/AIMD/OCE-98-19 Long-Term Fiscal OutlookPage 3

B-278394
Our earlier work concluded that without further policy action,commitments in federal retirement and health programs would togetherbecome progressively unaffordable for the nation over time, and theeconomic consequences would force belated and painful policy choices.Growing deficits and the resulting lower saving would lead to dwindlinginvestment, slower growth, and finally a decline in real GDP. Livingstandards, in turn, would at first stagnate and then fall. These findingssupported our conclusion that action on the deficit might be postponed,but it could not be avoided.
The results of our past work have been very similar to the conclusionsreached by other government entities and private analysts. Most notably,CBO published analyses based on its long-term model work in 1996 and1997 that corresponded with our main findings.6 Also, in 1994-95, theBipartisan Commission on Entitlement and Tax Reform reached similarconclusions in its study of future fiscal trends.
Since our 1995 report, robust economic growth and policy action havecombined to sharply reduce the deficit and are projected by CBO to resultin budget surpluses in the near term. This report addresses the outlook forthe budget over the longer term. We will explore how recent progressaffects this outlook and the fiscal and economic impacts associated withalternative long-term fiscal policy strategies.
Results in Brief Major progress has been made on deficit reduction in the past severalyears, culminating in the passage of the Balanced Budget Act of 1997. Thebalanced budget or surpluses that are projected would represent anenormous improvement in the federal government’s fiscal positionthrough the next 10 years. Moreover, the improvements in national savingand reduced debt and interest costs can be expected to produce tangiblegains in economic growth and budgetary flexibility over the longer term aswell. As a result, the emergence of unsustainable deficits is substantiallydelayed under recently enacted fiscal policy. While our 1995 simulationsshowed deficits exceeding 20 percent of GDP by 2024 if current policieswere not changed, our updated model results show that this point wouldnot be reached until nearly 2050.
Notwithstanding this progress, if no further action were taken, (a “noaction” scenario), our simulations indicate that federal spending would
6Congressional Budget Office, The Economic and Budget Outlook: Fiscal Years 1997-2006, May 1996,and Long-Term Budgetary Pressures and Policy Options, March 1997.
GAO/AIMD/OCE-98-19 Long-Term Fiscal OutlookPage 4

B-278394
grow faster than revenues soon after the baby boom generation begins toretire in 2008. These higher spending levels would be driven by escalatinghealth and Social Security costs. Rising interest costs would compoundthe deficit problem and take up an increasing share of the federal budget.Our simulations show that growing deficits, left unchecked, wouldeventually result in declining investment and capital stock and, inevitably,falling living standards. Over the long term, the “no action” scenario isunsustainable. Timely policy action can avoid these economicconsequences. While a “no action” simulation is not a forecast of what willhappen, it illustrates the nature of future fiscal challenges.
The alternative simulations illustrate the potential fiscal and economicbenefits of achieving a sustainable budget policy. According to oursimulations, a fiscal policy of balance through 2050 or extended periods ofsurplus, for example, could shrink the burden of federal interest costsconsiderably and also result in a larger economy over the long term. All ofthese alternative policies would increase per capita GDP in 2050 by morethan 35 percent over a “no action” policy, but they would requireadditional fiscal policy changes. Some of these changes may be difficult toachieve, but over the long term they would strengthen the nation’seconomy and overall living standards. Early action would permit changesto be phased in and so give those affected by changes in, for example,Social Security or health care benefits, time to adjust.
In considering what fiscal adjustments to make, policymakers need to bepresented with more complete information on the costs of thegovernment’s existing long-term commitments. The budget’s currentstructure and reporting mechanisms have not focused attention on suchcommitments, nor has the budget process facilitated their explicitconsideration. Financial statements are beginning to provide some of thisinformation. Options to change budget reporting and process to improverecognition of these commitments and prompt early action to addresspotential problems warrant further exploration.
Policy ActionContributes toImproved FiscalOutlook
In recent years, the federal deficit has declined substantially from$290 billion in fiscal year 1992—4.7 percent of GDP—to a CBO projectedlevel of $23 billion in fiscal year 1997—0.3 percent of GDP, which would bethe lowest level since 1974. This improvement is due, in part, to deficitreduction initiatives enacted in 1990 and 1993 as well as to subsequent
GAO/AIMD/OCE-98-19 Long-Term Fiscal OutlookPage 5

B-278394
spending restraint.7 The Balanced Budget Act of 1997, coupled with thestrong recent performance of the economy,8 is expected to extend thisrecent progress by achieving a balanced budget in 2002 followed byseveral years of budget surpluses on a unified budget basis.9 The decline inthe deficit has significantly slowed growth in the federal debt held by thepublic. As a share of GDP, this commonly used measure of federal debt isprojected by CBO to decline from about 50 percent in fiscal year 1993 to30 percent in 2007.
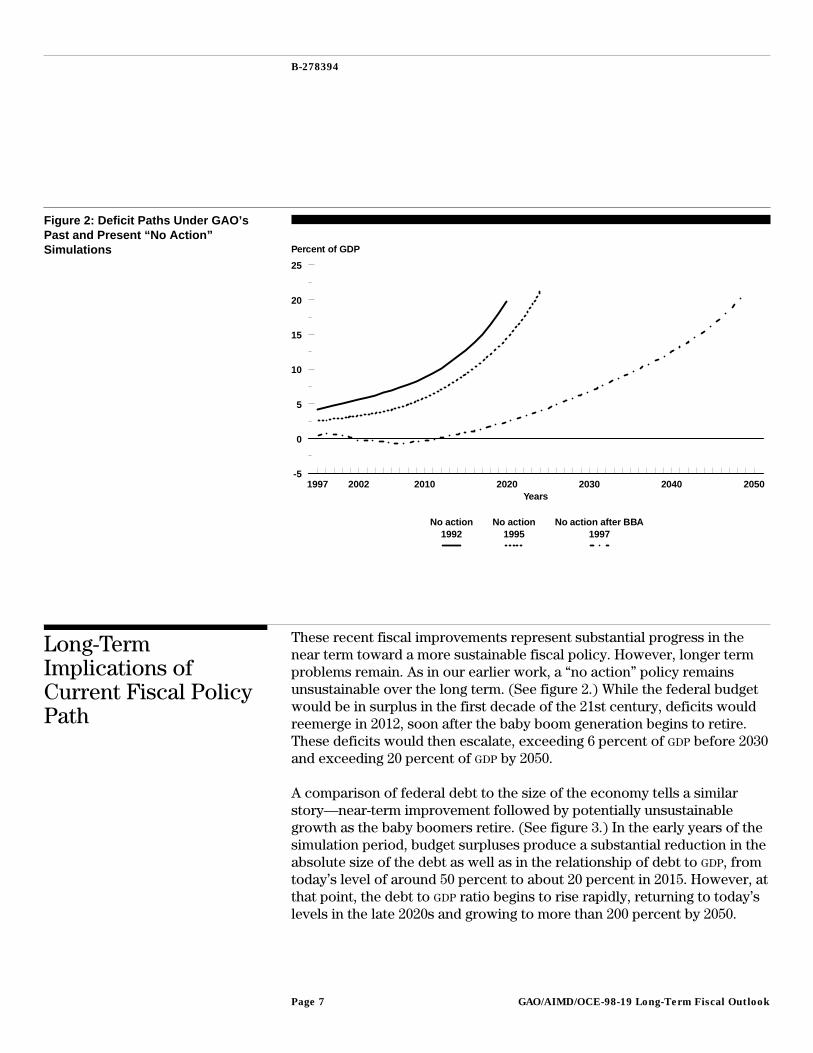
The improving fiscal outlook over the near term carries longer termbenefits as well, as illustrated by comparing our current “no action”simulation with our 1992 and 1995 modeling results. (See figure 2.) Ourinitial modeling work in 1992 indicated that even in the short term,prospective deficits would fuel a rapidly rising debt burden. Interveningeconomic and policy developments led to some improvement by the timewe issued our 1995 report, as shown by a modest shift outward of the “noaction” deficit path. Nonetheless, both our 1992 and 1995 “no action”simulations indicated that deficits would have reached 20 percent of GDP inthe 2020s. In contrast, the 1997 “no action” path—which follows CBO’s10-year forecast—indicates small and shrinking deficits over the next fewyears, followed by a decade of surpluses. Following the enactment of theBBA in 1997, our simulation indicates that deficits would not reach the20-percent level until nearly 2050. For purposes of comparison, the highestdeficit level reached since World War II was 6.1 percent of GDP in 1983.Figure 3 illustrates the improvement in the long-term outlook for thefederal debt as a share of GDP stemming from recent policy actions andeconomic developments.
7Recent legislation attempting to control the deficit included the Omnibus Budget Reconciliation Actof 1990, the Budget Enforcement Act of 1990, and the Omnibus Budget Reconciliation Act of 1993.
8Policy action accounted for about 25 percent of the recent improvement in CBO’s budget estimates.The remainder of the improvement was due primarily to economic factors.
9The unified budget includes annual Social Security trust fund surpluses. These surpluses are expectedto be temporary, peaking at $140 billion (including interest) in 2009 before declining and eventuallyturning to deficits in the following decade. For additional information, see Federal Debt and InterestCosts, CBO, May 1993, and Federal Debt: Answers to Frequently Asked Questions (GAO/AIMD-97-12,November 27, 1996).
GAO/AIMD/OCE-98-19 Long-Term Fiscal OutlookPage 6
B-278394
Figure 2: Deficit Paths Under GAO’sPast and Present “No Action”Simulations
1997 2002 2010 2020 2030 2040 2050-5
0
5
10
15
20
25
Years
Percent of GDP
No action 1992
No action 1995
No action after BBA 1997
Long-TermImplications ofCurrent Fiscal PolicyPath
These recent fiscal improvements represent substantial progress in thenear term toward a more sustainable fiscal policy. However, longer termproblems remain. As in our earlier work, a “no action” policy remainsunsustainable over the long term. (See figure 2.) While the federal budgetwould be in surplus in the first decade of the 21st century, deficits wouldreemerge in 2012, soon after the baby boom generation begins to retire.These deficits would then escalate, exceeding 6 percent of GDP before 2030and exceeding 20 percent of GDP by 2050.
A comparison of federal debt to the size of the economy tells a similarstory—near-term improvement followed by potentially unsustainablegrowth as the baby boomers retire. (See figure 3.) In the early years of thesimulation period, budget surpluses produce a substantial reduction in theabsolute size of the debt as well as in the relationship of debt to GDP, fromtoday’s level of around 50 percent to about 20 percent in 2015. However, atthat point, the debt to GDP ratio begins to rise rapidly, returning to today’slevels in the late 2020s and growing to more than 200 percent by 2050.
GAO/AIMD/OCE-98-19 Long-Term Fiscal OutlookPage 7

B-278394
Figure 3: Debt-to-GDP Ratios UnderGAO’s Past and Present “No Action”Simulations
1997 2010 2020 2030 2040 20500
50
100
150
200
250
Years
Percent of GDP
No action 1992
No action 1995
No action after BBA 1997
Such levels of deficits and debt imply a substantial reduction in nationalsaving, private investment, and the capital stock. Given our labor forceand productivity growth assumptions, GDP would inevitably begin todecline. These negative effects of rapidly increasing deficits and debt onthe economy would force action at some point before the end of thesimulation period. Policymakers would likely act before facing probableconsequences such as rising inflation, higher interest rates, and theunwillingness of foreign investors to invest in a weakening Americaneconomy. Therefore, as we have noted in our past work, the “no action”simulation is not a prediction of what will happen in the future. Rather, itunderscores the need for additional action in the future to address thenation’s long-term fiscal challenges.
The primary causes of the large deficits in the “no action” simulation are(1) the aging of the U.S. population, which corresponds to slower growthin the labor force and faster growth in entitlement program spending, and(2) the rising costs of providing federal health care benefits. In 2008, thefirst baby boomers will be eligible for early retirement benefits. As thisrelatively large generation retires, labor force growth is expected to slow
GAO/AIMD/OCE-98-19 Long-Term Fiscal OutlookPage 8
B-278394
considerably and, eventually, stop altogether. These demographic changesmean fewer workers to support each retiree. Between 1997 and 2025, thenumber of workers per Social Security beneficiary is projected to drop by33 percent. Without a major increase in productivity, low labor forcegrowth will inevitably lead to slower growth in the economy and in federalrevenue. As slow growth in the labor force constrains revenue growth, thelarge retired population will place major expenditure demands on SocialSecurity, Medicare, and Medicaid. In just 15 years, the Social Securitytrustees estimate that the program’s tax revenue is expected to beinsufficient to cover current benefits. While the recent Balanced BudgetAct included some actions to restrain growth in Medicare spending andincrease income from beneficiary premiums, the program is still expectedto grow faster than the economy over the next several years. According toCBO estimates, the Hospital Insurance Trust Fund portion of Medicare willbe depleted in 2007, even before retiring baby boomers begin to swell theranks of Medicare beneficiaries.10 Medicaid spending will also be underincreasing pressure as the population ages because a large share ofprogram spending goes to cover nursing home care.
In the “no action” simulation, Social Security spending as a share of GDP
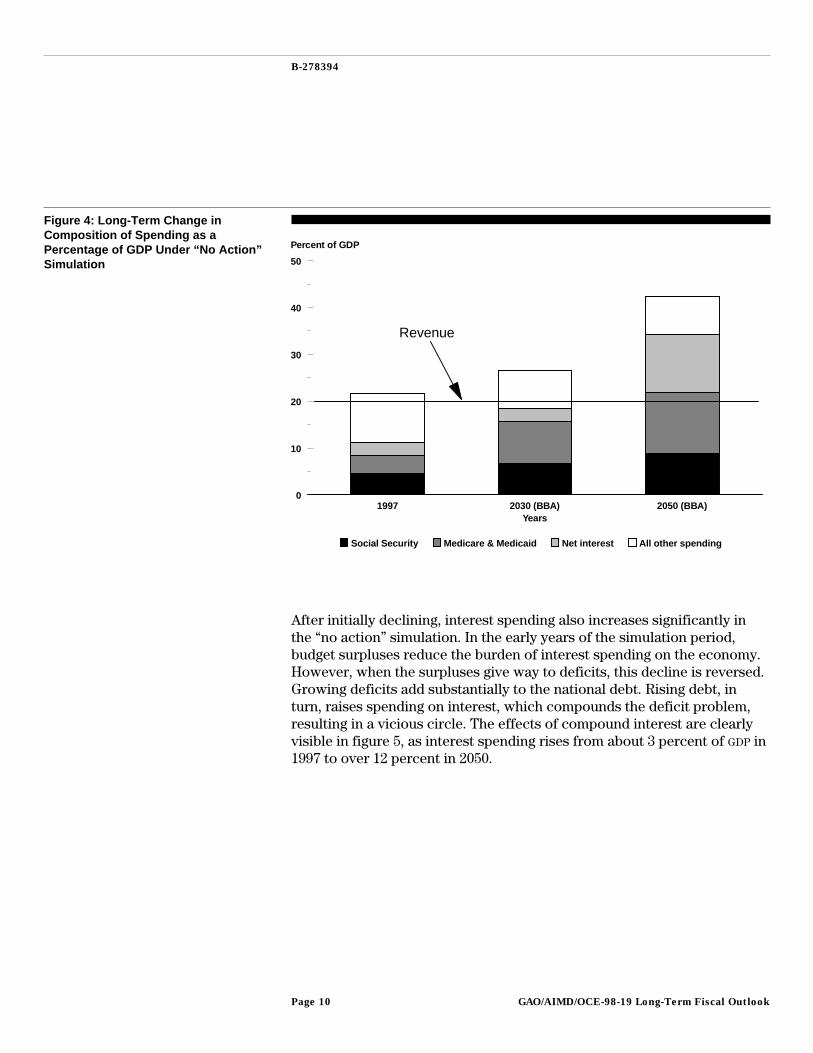
increases by nearly 50 percent between now and 2030. By 2050, itapproaches twice today’s level. Health care spending, fueled by both anincreased number of beneficiaries and (in the early years of the simulationperiod) rising per beneficiary costs, would grow even morerapidly—doubling as a share of GDP by 2030 and tripling by 2050. As SocialSecurity and health spending rise, their share of federal spending growstremendously. (See figure 4.) By the mid-2040s, spending for theseprograms alone would consume more than 100 percent of federalrevenues.
10Congress and the President have recognized the need for further changes in Medicare by establishinga National Bipartisan Commission on the Future of Medicare as part of the BBA.
GAO/AIMD/OCE-98-19 Long-Term Fiscal OutlookPage 9
B-278394
Figure 4: Long-Term Change inComposition of Spending as aPercentage of GDP Under “No Action”Simulation
1997 2030 (BBA) 2050 (BBA)0
10
20
30
40
50
Years
Percent of GDP
Social Security Medicare & Medicaid Net interest All other spending
Revenue
After initially declining, interest spending also increases significantly inthe “no action” simulation. In the early years of the simulation period,budget surpluses reduce the burden of interest spending on the economy.However, when the surpluses give way to deficits, this decline is reversed.Growing deficits add substantially to the national debt. Rising debt, inturn, raises spending on interest, which compounds the deficit problem,resulting in a vicious circle. The effects of compound interest are clearlyvisible in figure 5, as interest spending rises from about 3 percent of GDP in1997 to over 12 percent in 2050.
GAO/AIMD/OCE-98-19 Long-Term Fiscal OutlookPage 10

B-278394
Figure 5: Net Interest as a Percentageof GDP Under “No Action” Simulation
1997 2010 2020 2030 2040 20500
2
4
6
8
10
12
14
Years
Percent of GDP
Alternative FiscalPolicies WouldChange Long-TermEconomic Outcomes
Alternatives to a “no action” policy illustrate the fiscal and economicbenefits associated with maintaining a sustainable course. According toone definition, under a sustainable fiscal policy, existing governmentprograms can be maintained without a continual rise in the debt as a shareof GDP.11 Under an unsustainable policy, such as “no action,” the debtcontinually rises as a share of GDP. As illustrated in our past reports andCBO’s work,12 a number of different policy paths could be sustained overthe long term. In our current work, we tested three different long-termfiscal strategies, one that would allow for modest deficits, one that wouldmaintain a balanced budget, and one that would include an extendedperiod of surpluses. (See figure 6.)
11For a detailed analysis of sustainability, see Olivier Blanchard, Jean-Claude Chouraqui, Robert P.Hagemann, and Nicola Sartor, “The Sustainability of Fiscal Policy: New Answers to an Old Question,”OECD Economic Studies, no. 15 (Autumn 1990). See also The Canadian Institute of CharteredAccountants, Indicators of Government Financial Condition, April 1997.
12Congressional Budget Office, Long-Term Budgetary Pressures and Policy Options, March 1997.
GAO/AIMD/OCE-98-19 Long-Term Fiscal OutlookPage 11

B-278394
Figure 6: Alternate Deficit/SurplusPaths
1997 2002 2010 2020 2030-2
0
2
4
6
8
Years
Percent of GDP
No actionafter BBA
Constantdebt burden*
Maintainbalance
Save SSsurplus**
Note: Overlapping lines enhanced for clarity. As discussed in the text, these lines representidentical paths.
*Debt-GDP ratio is maintained at lowest level reached in “no action.”
**Social Security surpluses (including interest) are saved from 2000-2018, then balance ismaintained.
The “constant debt burden” simulation follows the “no action” paththrough 2015. From this point on, the debt is held constant as a share ofGDP, rather than increasing as in the “no action” simulation.13 To preventthe debt burden from rising from its 2015 level of about 20 percent of GDP,the federal government would have to hold annual deficits to roughly1 percent of GDP. While not insignificant, this deficit level is relatively smallcompared to the federal deficits of recent years or to deficits in otherindustrial nations. For example, the European Union has established adeficit target of 3 percent of GDP for countries participating in the commoncurrency arrangement.
13Prior to 2016, the debt declines as a share of the economy due to the improved fiscal outlook for thenear term.
GAO/AIMD/OCE-98-19 Long-Term Fiscal OutlookPage 12

B-278394
The “maintain balance” simulation also follows the “no action” path for theearly part of the simulation period. In 2012—the year that deficitsreemerge under “no action”—a balanced unified budget would beachieved. Balance would then be sustained through the remainder of thesimulation period.
Going beyond balance by running larger budget surpluses for a longerperiod of time than in the other simulations would yield additionaleconomic benefits by further raising saving and investment levels. For our“surplus” simulation, we chose as a goal ensuring that annual SocialSecurity surpluses (including interest that is credited to the fund) add tonational saving. To achieve this goal, the federal government would rununified budget surpluses equal in size to the annual Social Securitysurpluses—which the Social Security Trustees estimate will peak at$140 billion in 2009. Such a policy means that the rest of the federalgovernment’s budget would be in balance. Social Security’s surpluses(including interest income) are projected to end in 2018. Beginning in2019, our simulation follows a unified budget balance identical to the pathin our balance simulation.
Figure 7 shows the debt-to-GDP paths associated with the varioussimulations. Under the “constant debt burden” simulation, the debt-GDP
ratio remains around 20 percent, which is the lowest point reached in “noaction.” Under both the “balance” and “surplus” simulations, the debt-GDP
measure would decline to less than 10 percent of GDP—levels that theUnited States has not experienced since before World War I.
GAO/AIMD/OCE-98-19 Long-Term Fiscal OutlookPage 13

B-278394
Figure 7: Debt-to-GDP Ratios UnderGAO’s Four Fiscal Policy Simulations
1997 2010 2020 20300
10
20
30
40
50
60
70
Years
Percent of GDP
No action after BBA
Constant debt burden*
Maintain balance
Save SS surplus**
*Debt-GDP ratio is maintained at lowest level reached in “no action.”
**Social Security surpluses (including interest) are saved from 2000-2018, then balance ismaintained.
Each of the alternative simulations would require some combination ofpolicy or program changes that reduce spending and/or increase revenues.We make no assumptions about the mix of those changes in our analysis.We recognize that such actions would not be taken without difficulty.They would require difficult choices resulting in a greater share of nationalincome devoted to saving. While consumption would be reduced in theshort term, it would be increased over the long term. Early action wouldpermit changes to be phased in and so give those affected by changes in,for example, Social Security or health care benefits, time to adjust.
For both the federal government and the economy, any of the threealternative simulations indicates a vast improvement over the “no action”path. Sharply reduced interest costs provide the most striking budgetarybenefit from following a sustainable policy. Currently, interest spendingrepresents about 15 percent of federal spending, a relatively large share
GAO/AIMD/OCE-98-19 Long-Term Fiscal OutlookPage 14
B-278394
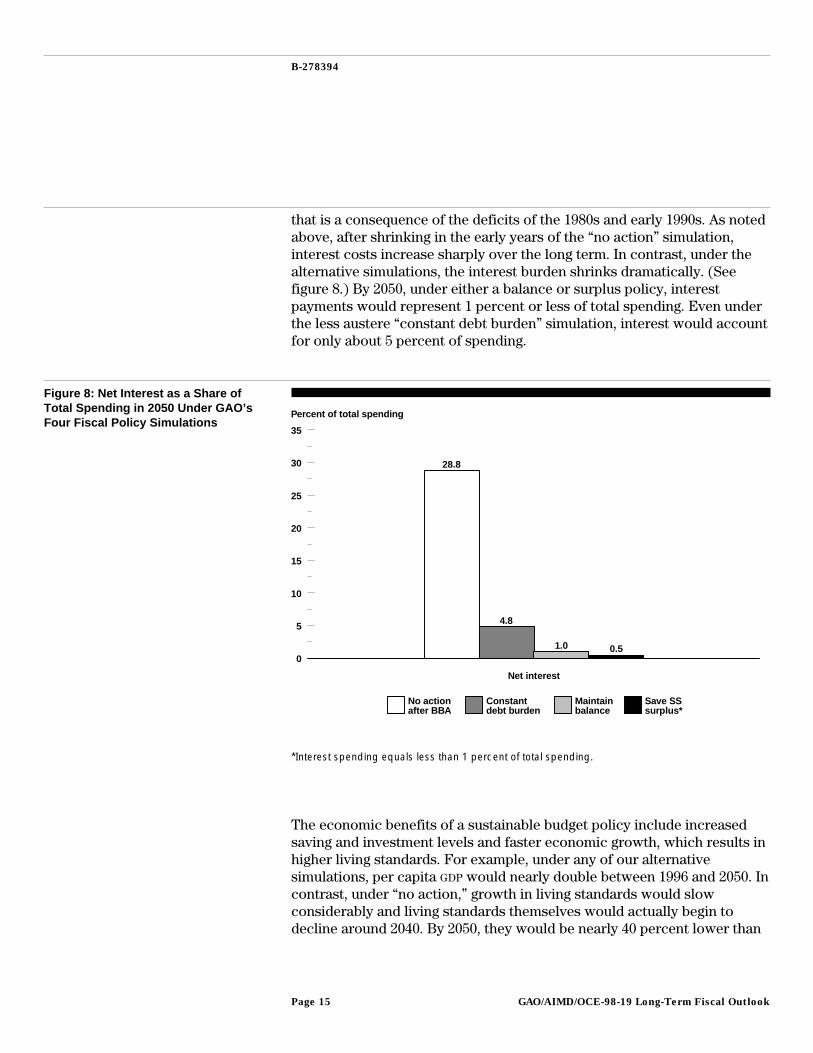
that is a consequence of the deficits of the 1980s and early 1990s. As notedabove, after shrinking in the early years of the “no action” simulation,interest costs increase sharply over the long term. In contrast, under thealternative simulations, the interest burden shrinks dramatically. (Seefigure 8.) By 2050, under either a balance or surplus policy, interestpayments would represent 1 percent or less of total spending. Even underthe less austere “constant debt burden” simulation, interest would accountfor only about 5 percent of spending.
Figure 8: Net Interest as a Share ofTotal Spending in 2050 Under GAO’sFour Fiscal Policy Simulations
0
5
10
15
20
25
30
35
28.8
4.8
1.0 0.5
Net interest
Percent of total spending
No actionafter BBA
Constantdebt burden
Maintainbalance
Save SSsurplus*
*Interest spending equals less than 1 percent of total spending.
The economic benefits of a sustainable budget policy include increasedsaving and investment levels and faster economic growth, which results inhigher living standards. For example, under any of our alternativesimulations, per capita GDP would nearly double between 1996 and 2050. Incontrast, under “no action,” growth in living standards would slowconsiderably and living standards themselves would actually begin todecline around 2040. By 2050, they would be nearly 40 percent lower than
GAO/AIMD/OCE-98-19 Long-Term Fiscal OutlookPage 15

B-278394
under the balance simulation. This difference results from a wide gap inprivate investment. Under “no action,” large deficits eventually driveprivate investment spending down to zero while, for example, a balancedbudget policy could produce a doubling of investment, as shown in table1.14 In the “no action” simulation, capital depreciation would outweighinvestment, resulting in a diminishing capital stock and, eventually,contributing to a falling GDP.
Table 1: The Economy and FiscalPosition in 1996 (Actual) and 2050(Simulated)
In per capita 1997 dollars
19962050—
“No action”2050—
“Balance”
Percent differencebetween “no action”
and “balance” in 2050
Real GDP $29,300 $40,900 $56,500 38%
Debt Held by the Public $14,500 $107,100 $2,400 –98%
Nonfarm businessinvestment $3,000 $0 $6,700 N/A
Nonfarm capital stock $29,400 $17,400 $59,900 244%
Note: Based on Social Security Administration population projections.
Figure 9 compares the path of per capita GDP under “no action” to abalanced budget policy. This difference graphically shows the emerginggap in long-term living standards that results from shifting fiscal policypaths. Although the “maintain balance” path would lead to higher livingstandards, the rate of growth would be significantly lower than thatexperienced over the past 50 years. Such a rate would be extremelydifficult to attain given the slowdown in productivity growth that hasoccurred in recent decades.
14Long-range simulations are quite sensitive to underlying assumptions and involve a large range ofuncertainty. Hence, the amounts in table 1 should not be viewed as precise “point” estimates. Rather,they indicate the general magnitude of the differences that might result from different fiscal policypaths.
GAO/AIMD/OCE-98-19 Long-Term Fiscal OutlookPage 16

B-278394
Figure 9: GDP per Capita ProjectedUnder the “No Action” and “Balance”Simulations
1946 1955 1965 1975 1985 1997 2010 2020 2030 2040 20500
10,000
20,000
30,000
40,000
50,000
60,000
Years
Per capita 1997 dollars
Historical data
No action after BBA
Maintain balance
Source: GAO analysis of 1946-1996 historical data, GAO’s GDP simulations, and Social SecurityAdministration population projections.
Long-TermCommitments NotAdequately Reflectedin Budget Reportingand Process
Long-term economic simulations are a useful tool for examining thebalance between the government’s future obligations and expectedresources. This longer term perspective is necessary to understand thefiscal and spending implications of key government programs andcommitments extending over a longer time horizon.15
The future implications of current policy decisions reflected in oursimulations and in other financial reports are generally not captured in thebudget process. The budget is generally a short-term, cash-based spendingplan focusing on the short- to medium-term cash implications ofgovernment obligations and fiscal decisions. Accordingly, it does notprovide all of the information on the longer term cost implicationsstemming from the government’s commitments when they are made. Whilethe sustainability of the government’s fiscal policy is driven primarily byfuture spending for social security and health care commitments, thefederal government’s commitments and responsibilities extend far beyondthese programs. These commitments may, themselves, result in large costs
15Budget Process: Evolution and Challenges (GAO/T-AIMD-96-129, July 11, 1996).
GAO/AIMD/OCE-98-19 Long-Term Fiscal OutlookPage 17

B-278394
that can encumber future fiscal resources and unknowingly constrain thegovernment’s future financial flexibility to meet all its commitments aswell as any unanticipated or emerging needs.
Information about the cost of some of these commitments will beincreasingly available as agencies produce audited financial statements.We anticipate that they will provide additional information on long-termcommitments, including such items as environmental cleanup andinsurance. For example, in its 1996 financial statements, the Departmentof Energy reported a cost of $229 billion to clean up its existingcontaminated sites. The Department of Defense will also be developingand reporting cleanup costs in financial statements. The Office ofManagement and Budget has estimated that the government is likely tohave to pay $31 billion in future claims resulting from the federalgovernment’s insurance commitments. The first audited governmentwidefinancial statements will be issued for fiscal year 1997. This represents akey step in the government’s efforts to improve financial management andprovide greater transparency and accountability for the costs ofgovernment commitments and programs.
The key challenge facing budget decisionmakers is to integrate thisinformation into the budget process. A range of options can be considered.A logical first step would be to include understandable supplementalfinancial information on the government’s long-term commitments andresponsibilities in the budget. For example, in a recent report weconcluded that supplemental reporting of accrual-based costs of insuranceprograms would improve recognition of the government’s commitments.16
Other options to refine the budget process or budget reporting to improvethe focus on these commitments and prompt early action to addresspotential problems can be explored. For example, long-term simulations ofcurrent or proposed budget policies could be prepared periodically to helpthe Congress and the public assess the future consequences of currentdecisions. Another option, which would supplement the current practiceof tracking budget authority and outlays, would be to provide informationto permit tracking the estimated cost of all long-term commitmentscreated each year in the budget.
16See Budget Issues: Budgeting for Federal Insurance Programs (GAO/AIMD-97-16, September 30,1997).
GAO/AIMD/OCE-98-19 Long-Term Fiscal OutlookPage 18

B-278394
Objectives, Scope andMethodology
In this report, the analysis of alternative fiscal policy paths relies insubstantial part on an economic growth model that we adapted from amodel developed by economists at the FRBNY. The model reflects theinterrelationships between the budget and the economy over the long termand does not capture their interaction during short-term business cycles.
The main influence of budget policy on long-term economic performanceis through the effect of the federal deficit on national saving. Conversely,the rate of economic growth helps determine the overall federal deficit orsurplus through its effect on revenues and spending. Federal deficitsreduce national saving while federal surpluses increase national saving.The level of saving affects investment and, in turn, GDP growth.
Budget assumptions in the model rely, to the extent practicable, upon thebaseline projections in CBO’s September 1997 report, The Economic andBudget Outlook: An Update, through 2006, the last year for which CBO
projections are available in a format usable by our model. These estimatesare used in conjunction with our model’s simulated levels of GDP. ForMedicare, we assumed growth consistent with CBO’s projections and theHealth Care Financing Administration’s long-term intermediateprojections from the Medicare Trustees’ April 1997 report. For Medicaidthrough 2006, we similarly assumed growth consistent with CBO’s budgetprojections. For 2007 and thereafter, we used estimates of Medicaidgrowth from CBO’s March 1997 report, Long-Term Budgetary Pressures andPolicy Options. For Social Security, we used the April 1997 intermediateprojections from the Social Security Trustees throughout the simulationperiod. Other mandatory spending is held constant as a percentage of GDP
after 2006. Discretionary spending and revenues are held constant as ashare of GDP after 2006. Our interest rate assumptions are based on CBO
through 2006 and then move to a fixed rate. (See appendix I for a moredetailed description of the model and the assumptions we used.)
We conducted our work from September to October 1997 in accordancewith generally accepted government auditing standards. We receivedcomments from experts in fiscal and economic policy on a draft of thisreport and have incorporated them as appropriate.
We are sending copies of this report to the Ranking Minority Members ofyour Committees, interested congressional committees, the Director of theCongressional Budget Office, and the Director of the Office ofManagement and Budget. We will make copies available to others upon
GAO/AIMD/OCE-98-19 Long-Term Fiscal OutlookPage 19

B-278394
request. The major contributors to this report are listed in appendix II. Ifyou have any questions concerning this report, please call me at(202) 512-9573.
Paul L. PosnerDirector, Budget Issues
GAO/AIMD/OCE-98-19 Long-Term Fiscal OutlookPage 20

GAO/AIMD/OCE-98-19 Long-Term Fiscal OutlookPage 21
Contents
Letter 1
Appendix I The Economic Modeland Assumptions
24
Appendix II Major Contributors toThis Report
28
Related GAO Products 32
Tables Table 1: The Economy and Fiscal Position in 1996 and 2050 16Table I.1: Key Assumptions 26
Figures Figure 1: Effect of the Federal Budget Deficit on Net NationalSaving
3
Figure 2: Deficit Paths Under GAO’s Past and Present “NoAction” Simulations
7
Figure 3: Debt-to-GDP Ratios Under GAO’s Past and Present “NoAction” Simulations
8
Figure 4: Long-Term Change in Composition of Spending as aPercentage of GDP Under “No Action” Simulation
10
Figure 5: Net Interest as a Percentage of GDP Under “No Action”Simulation
11
Figure 6: Alternate Deficit/Surplus Paths 12Figure 7: Debt-to-GDP Ratios Under GAO’s Four Fiscal Policy
Simulations14
Figure 8: Net Interest as a Share of Total Spending in 2050 UnderGAO’s Four Fiscal Policy Simulations
15
Figure 9: GDP per Capita Projected Under the “No Action” and“Balance” Simulations
17
GAO/AIMD/OCE-98-19 Long-Term Fiscal OutlookPage 22

Contents
Abbreviations
CBO Congressional Budget OfficeFRBNY Federal Reserve Bank of New YorkGDP gross domestic productHCFA Health Care Financing AdministrationNIPA National Income and Product AccountOASDI Old Age Survivors’ and Disability InsuranceBBA Balanced Budget Act of 1997
GAO/AIMD/OCE-98-19 Long-Term Fiscal OutlookPage 23

Appendix I
The Economic Model and Assumptions
This update of GAO’s work1 on the long-term economic and budget outlookrelies in large part on a model of economic growth developed byeconomists at the Federal Reserve Bank of New York (FRBNY). The majordeterminants of economic growth in the model include changes in thelabor force, capital formation, and the growth in total factor productivity.To analyze the long-term effects of fiscal policy, we modified the FRBNY’smodel to include a set of relationships that describe the federal budget andits links to the economy. The simulations generated using the modelprovide qualitative illustrations, not quantitative forecasts, of the budget oreconomic outcomes associated with alternative policy paths. The modeldepicts the links between the budget and the economy over the long term,and does not reflect their interrelationships during short-term businesscycles.
The main influence of budget policy on long-term economic performancein the model is through the effect of the federal deficit or surplus onnational saving. Higher federal deficits reduce national saving while lowerdeficits or surpluses increase national saving. The level of saving affectsinvestment and, hence, gross domestic product (GDP) growth.
GDP is determined by the labor force, capital stock, and total factorproductivity.2 GDP in turn influences nonfederal saving, which consists ofthe saving of the private sector and state and local government surplusesor deficits. Through its effects on federal revenues and spending, GDP alsohelps determine the federal budget deficit or surplus. Nonfederal andfederal saving together constitute national saving, which influences privateinvestment and the next period’s capital stock. Capital combines withlabor and total factor productivity to determine GDP in the next period andthe process continues.
There are also important links between national saving and investmentand the international sector. In an open economy such as the UnitedStates, a decrease in saving due to, for example, an increase in the federalbudget deficit, does not require an equivalent decrease in investment.Instead, part of the saving shortfall may be filled by foreign capital inflows.A portion of the net income that results from such investments flowsabroad. In this update, we retained the assumption in our prior work that
1Budget Policy: Prompt Action Necessary to Avert Long-Term Damage to the Economy(GAO/OCG-92-2, June 5, 1992) and The Deficit and The Economy: An Update of Long-TermSimulations (GAO/AIMD/OCE-95-119, April 26, 1995).
2Total factor productivity reflects sources of growth not captured in aggregate labor and capitalmeasures, including technological change, labor quality improvements, and the reallocation ofresources to more productive uses.
GAO/AIMD/OCE-98-19 Long-Term Fiscal OutlookPage 24
Appendix I
The Economic Model and Assumptions
net foreign capital inflows rise by one-third of any decrease in the nationalsaving rate.
Table I.1 lists the key assumptions incorporated in the model. Theassumptions used tend to provide conservative estimates of the benefit ofreducing deficits or running surpluses and of the harm of increasingdeficits. The interest rate on the national debt is held constant, forexample, even when deficits climb and the national saving rate plummets.Under such conditions, the more likely result would be a rise in the rate ofinterest and a more rapid increase in federal interest payments than ourresults display. Another conservative assumption is that the rate of totalfactor productivity growth is unaffected by the amount of investment.Productivity is assumed to advance 1 percent each year even if investmentcollapses. Such assumptions suggest that changes in deficits or surplusescould have greater effects than our results suggest.
GAO/AIMD/OCE-98-19 Long-Term Fiscal OutlookPage 25

Appendix I
The Economic Model and Assumptions
Table I.1: Key AssumptionsModel inputs Assumptions
Saving rate: gross saving of the privatesector and state and local governmentsector
17.5% of GDP
Labor: growth in hours worked Follows the Social Security Trustees’Alternative II projections
Total factor productivity growth 1%
Inflation rate Follows CBO through 2007; 2.7% thereafter
Interest rate (average on the national debt) Average effective rate implied by CBO’sinterest payment projections through 2006;5.1% thereafter (CBO’s 2006 implied rate)
Surplus/deficit Follows CBO’s budget surplus/deficit as apercentage of GAO’s GDP through 2006;GAO simulations thereafter
Discretionary spending CBO through 2006; increases at the rate ofeconomic growth thereafter
Medicare CBO through 2006; increases at HCFA’sprojected rate thereafter
Medicaid CBO’s projections
OASDI Follows the Social Security Trustees’Alternative II projections
Other mandatory spending CBO’s assumed levels through 2006;increases at the rate of economic growththereafter
Receipts CBO’s assumed levels through 2006; insubsequent years, receipts equal 19.9% ofGDP (2006 ratio)
Note: In our work, all CBO budget projections were converted from a fiscal year to a calendaryear basis. The last year of CBO’s projection period is fiscal year 2007, permitting the calculationof calendar year values through 2006.
We have made several modifications to the model, but the model’sessential structure remains the same as in our previous work. We haveincorporated the change in the definition of government saving in theNational Income and Product Accounts (NIPA) adopted in late 1995 byadding a set of relationships determining government investment, capitalstock, and the consumption of fixed capital.
The more recent data prompted several parameter changes. For example,the long-term inflation rate is now assumed to be 2.7 percent, down from3.4 percent in our 1995 report and 4.0 percent in our 1992 report. In thisupdate, the average federal borrowing rate steadily declines to 5.1 percent,compared to our assumption of 7.2 percent in 1995 and 7.8 percent in 1992.
GAO/AIMD/OCE-98-19 Long-Term Fiscal OutlookPage 26

Appendix I
The Economic Model and Assumptions
Our work also incorporates the marked improvement in the budgetoutlook stemming from the Balanced Budget Act of 1997 reflected in the10-year budget projections that CBO published in September 1997.
The distinction between the mandatory and discretionary components ofthe budget remains important. We adopted CBO’s assumption from theirmost recent 10-year forecast that discretionary spending equals thestatutory caps from fiscal years 1998 through 2002 and increases at therate of inflation from fiscal years 2003 through 2007. We assumed it wouldkeep pace with GDP growth thereafter.
Mandatory spending includes Health (Medicare and Medicaid), Old AgeSurvivors’ and Disability Insurance (OASDI, or Social Security), and aresidual category covering other mandatory spending. Medicare reflectsCBO’s assumptions through 2006 and increases at HCFA’s projected rate insubsequent years. Medicaid is based on CBO’s September 1997assumptions; thereafter, it increases at the rates embodied in CBO’sMarch 1997 report on the long-term budget outlook. OASDI reflects theApril 1997 Social Security Trustees’ Alternative II projections.
Other mandatory spending is a residual category consisting of allnonhealth, non-Social Security mandatory spending. It equals CBO’s NIPA
projection for Transfers, Grants, and Subsidies less Health, OASDI, andother discretionary spending. Through 2006, CBO assumptions are the maindeterminant of other mandatory spending, after which its growth is linkedto that of GDP.
The interest rates for 1997 through 2006 are consistent with the averageeffective rate implied by CBO’s interest payment projections. We assumethat the average rate remains at the 2006 rate of 5.1 percent for the rest ofthe simulation period.
Receipts follow CBO’s dollar projections through 2006. Thereafter, theycontinue at 19.9 percent of GAO’s simulated GDP, which is the rate projectedfor 2006.
As these assumptions differ somewhat from those used in our earlierreports, only general comparisons of the results can be made.
GAO/AIMD/OCE-98-19 Long-Term Fiscal OutlookPage 27

Appendix II
Major Contributors to This Report
Accounting andInformationManagement Division,Washington, D.C.
Christine E. Bonham, Assistant DirectorAndrew D. Eschtruth, Evaluator-in-ChargeJames R. McTigue, Jr., Senior EvaluatorMaryLynn Sergent, Senior Evaluator
Office of the ChiefEconomist
Richard S. Krashevski, Economist
GAO/AIMD/OCE-98-19 Long-Term Fiscal OutlookPage 28

GAO/AIMD/OCE-98-19 Long-Term Fiscal OutlookPage 29

GAO/AIMD/OCE-98-19 Long-Term Fiscal OutlookPage 30

GAO/AIMD/OCE-98-19 Long-Term Fiscal OutlookPage 31

Related GAO Products
Budget Issues: Budgeting for Federal Insurance Programs (GAO/AIMD-97-16,September 30, 1997).
Retirement Income: Implications of Demographic Trends for SocialSecurity and Pension Reform (GAO/HEHS-97-81, July 11, 1997).
Addressing the Deficit: Budgetary Implications of Selected GAO Work forFiscal Year 1998 (GAO/OCG-97-2, March 14, 1997).
Federal Debt: Answers to Frequently Asked Questions (GAO/AIMD-97-12,November 27, 1996).
Budget Process: Evolution and Challenges (GAO/T-AIMD-96-129, July 11, 1996).
Deficit Reduction: Opportunities to Address Long-standing GovernmentPerformance Issues (GAO/T-OCG-95-6, September 13, 1995).
The Deficit and the Economy: An Update of Long-Term Simulations(GAO/AIMD/OCE-95-119, April 26, 1995).
Deficit Reduction: Experiences of Other Nations (GAO/AIMD-95-30,December 13, 1994).
Budget Issues: Incorporating an Investment Component in the FederalBudget (GAO/AIMD-94-40, November 9, 1993).
Budget Policy: Prompt Action Necessary to Avert Long-Term Damage tothe Economy (GAO/OCG-92-2, June 5, 1992).
The Budget Deficit: Outlook, Implications, and Choices (GAO/OCG-90-5,September 12, 1990).
(935248) GAO/AIMD/OCE-98-19 Long-Term Fiscal OutlookPage 32
Ordering Information
The first copy of each GAO report and testimony is free.
Additional copies are $2 each. Orders should be sent to the
following address, accompanied by a check or money order
made out to the Superintendent of Documents, when
necessary. VISA and MasterCard credit cards are accepted, also.
Orders for 100 or more copies to be mailed to a single address
are discounted 25 percent.
Orders by mail:
U.S. General Accounting Office
P.O. Box 37050
Washington, DC 20013
or visit:
Room 1100
700 4th St. NW (corner of 4th and G Sts. NW)
U.S. General Accounting Office
Washington, DC
Orders may also be placed by calling (202) 512-6000
or by using fax number (202) 512-6061, or TDD (202) 512-2537.
Each day, GAO issues a list of newly available reports and
testimony. To receive facsimile copies of the daily list or any
list from the past 30 days, please call (202) 512-6000 using a
touchtone phone. A recorded menu will provide information on
how to obtain these lists.
For information on how to access GAO reports on the INTERNET,
send an e-mail message with "info" in the body to:
or visit GAO’s World Wide Web Home Page at:
http://www.gao.gov
PRINTED ON RECYCLED PAPER

United StatesGeneral Accounting OfficeWashington, D.C. 20548-0001
Official BusinessPenalty for Private Use $300
Address Correction Requested
Bulk RatePostage & Fees Paid
GAOPermit No. G100