air entrainment and turbulent fluctuations in hydraulic jumps365319/article_04_postprint.pdf ·...
TRANSCRIPT

WANG, H., and CHANSON, H. (2015). "Air Entrainment and Turbulent Fluctuations in Hydraulic Jumps." Urban Water Journal, Vol. 12, No. 6, pp. 502-518 (DOI: 10.1080/1573062X.2013.847464) (ISSN 1573-062X (Print), 1744-9006 (Online)).
Air Entrainment and Turbulent Fluctuations in Hydraulic Jumps
H. WANG (a) and H. CHANSON (a)
(a) The University of Queensland, School of Civil Engineering, Brisbane QLD 4072, Australia
Email: [email protected] - Url: http://www.uq.edu.au/~e2hchans/

WANG, H., and CHANSON, H. (2015). "Air Entrainment and Turbulent Fluctuations in Hydraulic Jumps." Urban Water Journal, Vol. 12, No. 6, pp. 502-518 (DOI: 10.1080/1573062X.2013.847464) (ISSN 1573-062X (Print), 1744-9006 (Online)).
Air Entrainment and Turbulent Fluctuations in Hydraulic Jumps
A hydraulic jump is the sudden transition from a high-velocity impinging flow into a turbulent
roller in an open channel. Substantial amounts of air are entrapped at the impingement point,
and significant free-surface fluctuations take place above the roller. In the present study, some
physical modelling was conducted in a relatively large size facility. The flow conditions
included a wide ranges of inflow Froude numbers and Reynolds numbers (3.8 < Fr1 < 10.0,
2.1×10⁴ < Re < 1.6×10⁵). The fluctuating features of free-surface and roller position were
investigated non-intrusively with a series of acoustic displacement meters. The characteristic
frequencies of the fluctuating motions were documented, and some major roller surface
deformation patterns were revealed. The air-water flow properties were investigated with an
intrusive phase-detection probe. The void fraction and bubble count rate data were
documented in the jump roller, together with the interfacial velocity distributions. The rate of
air entrainment was estimated based upon the void fraction and interfacial velocity distribution
data. Some simultaneous measurements of instantaneous void fraction and free-surface
fluctuations as well as longitudinal jump front oscillations were conducted. The relationship
between the rate of air entrainment and turbulent fluctuations is discussed. Both the turbulent
fluctuation and aeration properties are basic design parameters in urban water systems in
which a hydraulic jump may take place. The present work provides relevant information for
water systems including covered channels and partially-filled pipes.
Keywords: hydraulic jumps; turbulent fluctuations; air entrainment; free-surface fluctuations,
physical modelling
1. Introduction
A hydraulic jump is an abrupt transition from a supercritical to subcritical free-surface flow,
associated with a turbulent roller (HENDERSON 1966, LIGGETT 1994). The jump roller is
characterised by spray and splashing with a highly fluctuating free-surface, together with highly-
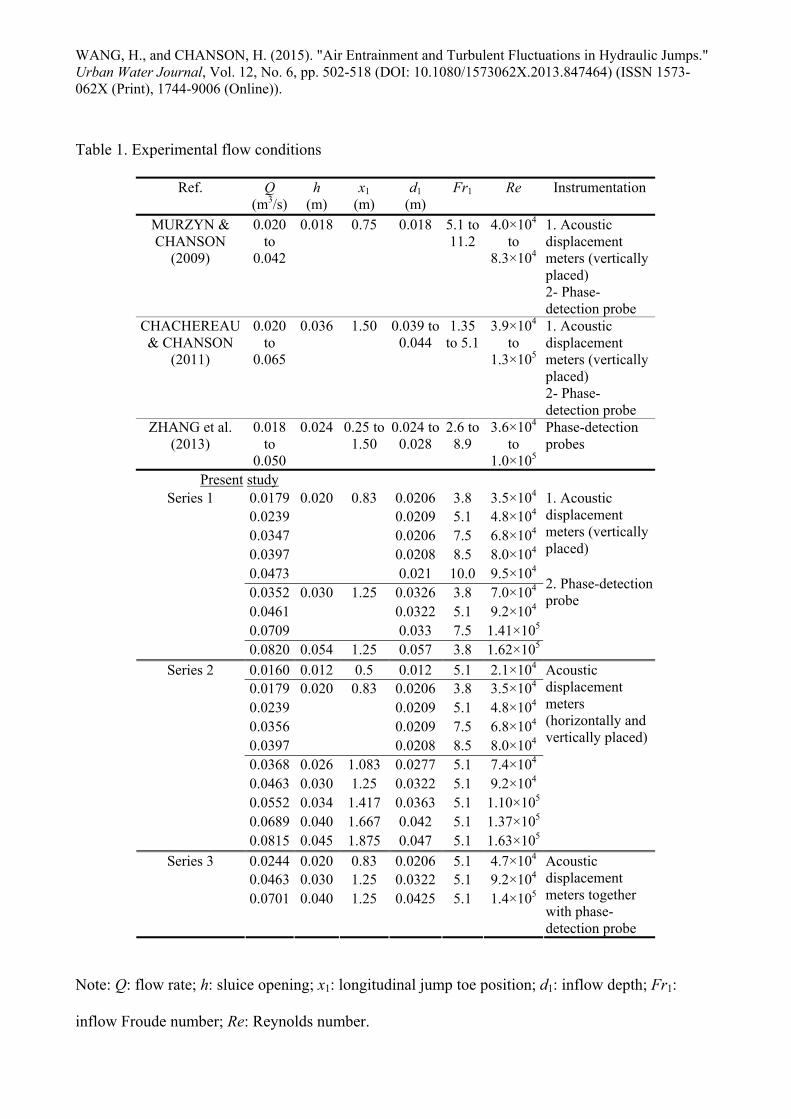
aerated turbulent flow structures within. Besides in rivers and streams, a hydraulic jump is also
commonly experienced in open hydraulic structures, urban sewage systems and water treatment
plants as an energy dissipator, flow aerator and mixer (Fig. 1). Figure 1 shows a hydraulic jump in

WANG, H., and CHANSON, H. (2015). "Air Entrainment and Turbulent Fluctuations in Hydraulic Jumps." Urban Water Journal, Vol. 12, No. 6, pp. 502-518 (DOI: 10.1080/1573062X.2013.847464) (ISSN 1573-062X (Print), 1744-9006 (Online)).
an irrigation channel. The flow regime is complex considering the turbulent, two-phase flow
features which are not fully understood to date (RAJARATNAM 1967, CHANSON 2009).
The application of momentum principle to a hydraulic jump in a horizontal, rectangular
channel yields the ratio of conjugate depths (BÉLANGER 1841):
1Fr81
2
1
d
d 21
1
2 (1)
where d is water depth and the subscripts 1 and 2 refer to the upstream and downstream flow
conditions respectively and Fr1 is the inflow Froude number defined as Fr1 = V1/(g×d1)1/2, with V1
the average inflow velocity and g the gravity acceleration (Fig. 2). For the physical modelling of a
hydraulic jump, a large number of parameters are relevant to the study of hydraulic jumps
(LIGGETT 994). The Froude similarity is implied by the momentum considerations (LIGHTHILL
1978, LIGGETT 1994, CHANSON 2012). Dimensional considerations suggest that the Reynolds
number Re = ×V1×d1/, is another relevant dimensionless number, where ρ and μ are the density
and dynamic viscosity of water (CHANSON 2007b, CHANSON and GUALTIERI 2008).
However, a dynamic similitude with identical Froude and Reynolds numbers cannot be fulfilled if
the same fluids are used in model and prototype. Drastic scale effects were shown in terms of air
entrainment and turbulent dissipation in hydraulic jumps with Froude similitude but different
Reynolds numbers (CHANSON and GUALTIERI 2008, CHANSON and CHACHEREAU 2013).
Experimental studies of hydraulic jumps focusing on detailed two-phase flow measurements
dated back to RAJARATNAM (1962). The influence of inflow conditions on bubble entrainment
process was highlighted by RESCH and LEUTHEUSSER (1972). With partially-developed inflow
conditions, CHANSON (1995) developed an analogy between the air entrainment process in
hydraulic jumps and that in plunging jets. Systematic investigations using intrusive phase-detection
probes were conducted by CHANSON and BRATTBERG (2000), MURZYN et al. (2005) and
CHANSON (2007a, 2010). Air-water flow properties including void fraction, bubble count rate and

WANG, H., and CHANSON, H. (2015). "Air Entrainment and Turbulent Fluctuations in Hydraulic Jumps." Urban Water Journal, Vol. 12, No. 6, pp. 502-518 (DOI: 10.1080/1573062X.2013.847464) (ISSN 1573-062X (Print), 1744-9006 (Online)).
interfacial velocity were presented. New insights into turbulent level and coherent time/length
scales were provided by CHANSON and CAROSI (2007) and ZHANG et al. (2013). The free-
surface profile and fluctuations were recently treated using intrusive wire gauges (MOUAZE et al.
2005, MURZYN et al. 2007) and non-intrusive acoustic displacement meters (MURZYN and
CHANSON 2009, CHACHEREAU and CHANSON 2011).
The purpose of this paper is to broaden the knowledge of fluctuating roller free-surface and
two-phase flow properties in hydraulic jumps. New experiments were conducted with a wide range
of Froude numbers (3.8 < Fr1 < 10.0) and Reynolds numbers (2.1×10⁴ < Re < 1.6×10⁵). The
instantaneous free-surface motions were measured non-intrusively in both vertical and horizontal
directions, and some surface deformation patterns were defined. The two-phase flow measurement
results were presented, some data being collected simultaneously with the free-surface fluctuations.
It is the aim of present work to gain better understanding of the interaction between the air
entrainment and turbulent fluctuations.
2. Experimental setup and data processing
2.1. Experimental facilities and instrumentation
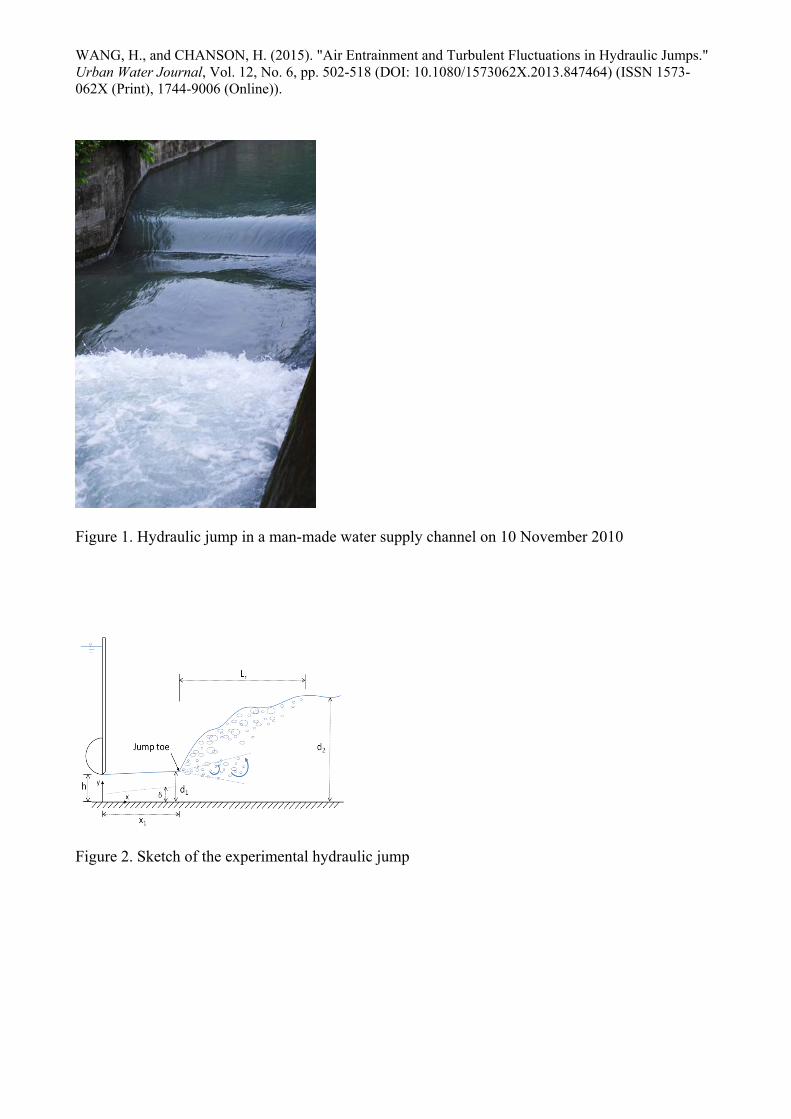
The experiments were performed in a 3.2 m long horizontal channel with a rectangular
cross-section of 0.5 m width. The flow rate was measured with Venturi meters mounted in supply
lines and calibrated on site beforehand. The inflow conditions were controlled by a vertical
undershoot sluice mounted in a head tank upstream of the channel. A horizontal inflow was
generated by a semi-circular (Ø = 0.3 m) undershoot gate at the upstream end (Fig. 2). The
downstream flow conditions were controlled by an overshoot sluice located at the end of channel. A
sketch of an experimental hydraulic jump is shown in Figure 2. Some relevant parameters are

WANG, H., and CHANSON, H. (2015). "Air Entrainment and Turbulent Fluctuations in Hydraulic Jumps." Urban Water Journal, Vol. 12, No. 6, pp. 502-518 (DOI: 10.1080/1573062X.2013.847464) (ISSN 1573-062X (Print), 1744-9006 (Online)).
denoted, including the sluice gate opening h, the inflow water depth d1 and downstream depth d2,
the longitudinal jump toe position x1 and the length of jump roller Lr.
The clear-water flow depths were measured with a point gauge. The instantaneous free-
surface elevations above the hydraulic jump were recorded using acoustic displacement meters
(MicrosonicTM Mic+25/IU/TC & Mic+35/IU/TC). The displacement meters enabled a non-intrusive
measurement of instantaneous water levels by emitting an acoustic beam and receiving the reflected
one. The distance between the sensor and detected water surface was derived from the travel time of
the beam. The measurement range of Mic+25/IU/TC sensors was 30 to 250 mm, with an accuracy
of 0.18 mm and response time less than 50 ms.
A double-tip phase-detection conductivity probe was used to measure the air-water flow
properties. The conductivity probe was an intrusive needle probe discriminating between air and
water phases based upon their different electrical conductivities. The double-tip probe was equipped
with two identical needle sensors with inner diameters Ø = 0.25 mm. The sensors were mounted
parallel with a longitudinal separation distance between the sensor tips Δxtip = 7.46 mm. The
leading and trailing tips were excited simultaneously by an electronic system (model Ref.
UQ82.518). The elevation of the probe was supervised by a MitutoyoTM digimatic scale unit with an
accuracy of 0.1 mm.
2.2. Signal processing
The acoustic displacement meters were sampled at 50 Hz for at least 540 s when the free-
surface fluctuations were measured alone and at 5 kHz for 180 s when they were used together with
the phase-detection probe. The raw output was voltage signals containing some erroneous data
mainly caused by (a) the acoustic beam failed to be captured by the sensor because of some angle of
the water surface, (b) the acoustic beam reflected by a splashing droplet or a water drop stuck at the
sensor head, and (c) some interference by adjacent sensors. The erroneous data resulted in some
meaningless spikes in the signal, which were removed using some simple threshold techniques. A

WANG, H., and CHANSON, H. (2015). "Air Entrainment and Turbulent Fluctuations in Hydraulic Jumps." Urban Water Journal, Vol. 12, No. 6, pp. 502-518 (DOI: 10.1080/1573062X.2013.847464) (ISSN 1573-062X (Print), 1744-9006 (Online)).
sensitivity analysis showed that the standard deviation of post-processed signal was somehow
dependent upon the threshold levels. The despiked signals were converted into water depth data
based upon to the calibration relationships obtained on-site.
The phase-detection probe was sampled at 20 kHz for 45 s for the air-water flow
measurements and at 5 kHz for 180 s for the simultaneous measurements with the acoustic
displacement meters. Voltage signals between -1 and 4.5 V were recorded and processed using a
single-threshold technique, the threshold being set at 50% of the air-water range. The signal
processing followed closely the method of CHANSON and CAROSI (2007).
The simultaneous sampling of the free-surface elevation and instantaneous void fraction
data required further processing, detailed in Section 5.
2.3. Experimental setups and flow conditions
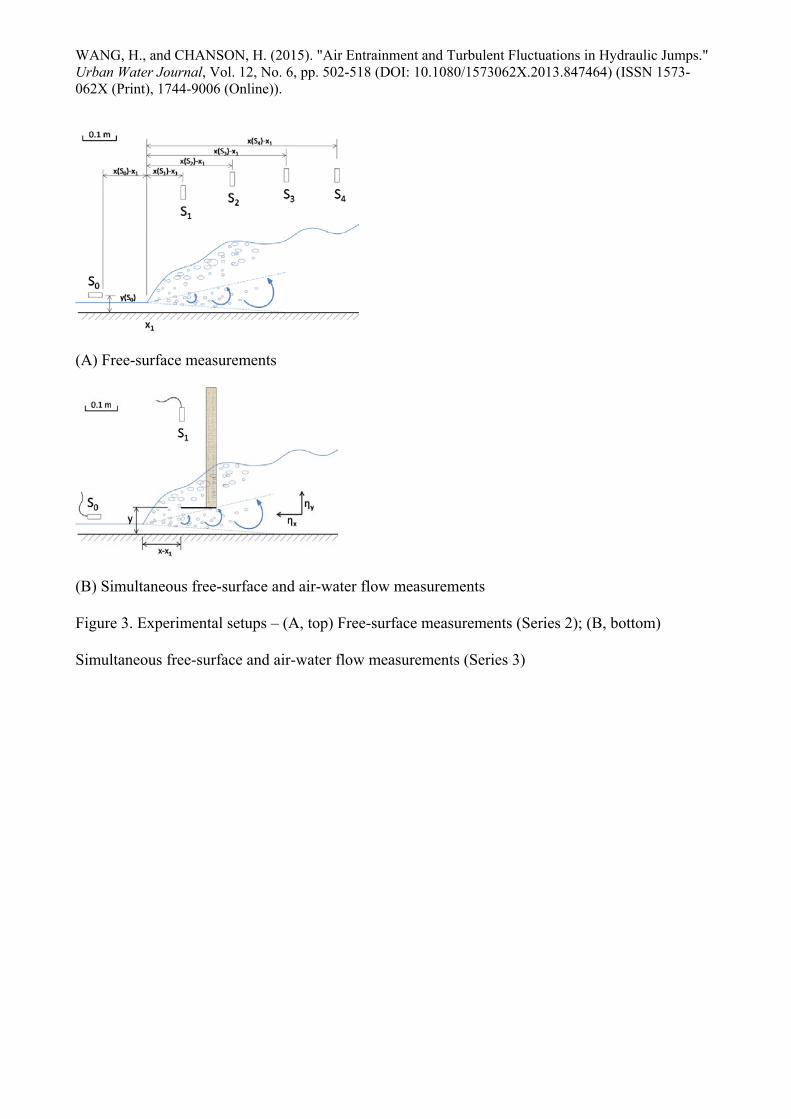
Up to 15 acoustic displacement meters were used simultaneously for the free-surface
measurements at various locations, but only the data obtained on the channel centreline are
presented in this paper. Figure 3 shows the experimental setups on the channel centreline. In Figure
3A, several displacement meters were mounted above the jump, measuring the free-surface profile
and fluctuations. Another sensor was placed horizontally close to the supercritical inflow surface,
with the sensor head facing the jump front from upstream. The horizontal jump front motions were
measured simultaneously with the free-surface fluctuations. Figure 3B illustrates the simultaneous
measurements of free-surface motions and instantaneous void fraction. One vertical and one
horizontal displacement meters were used together with the phase-detection probe. The phase-
detection probe sensor was operated in various elevations y, and the vertical displacement meter
was aligned over the probe leading tip.
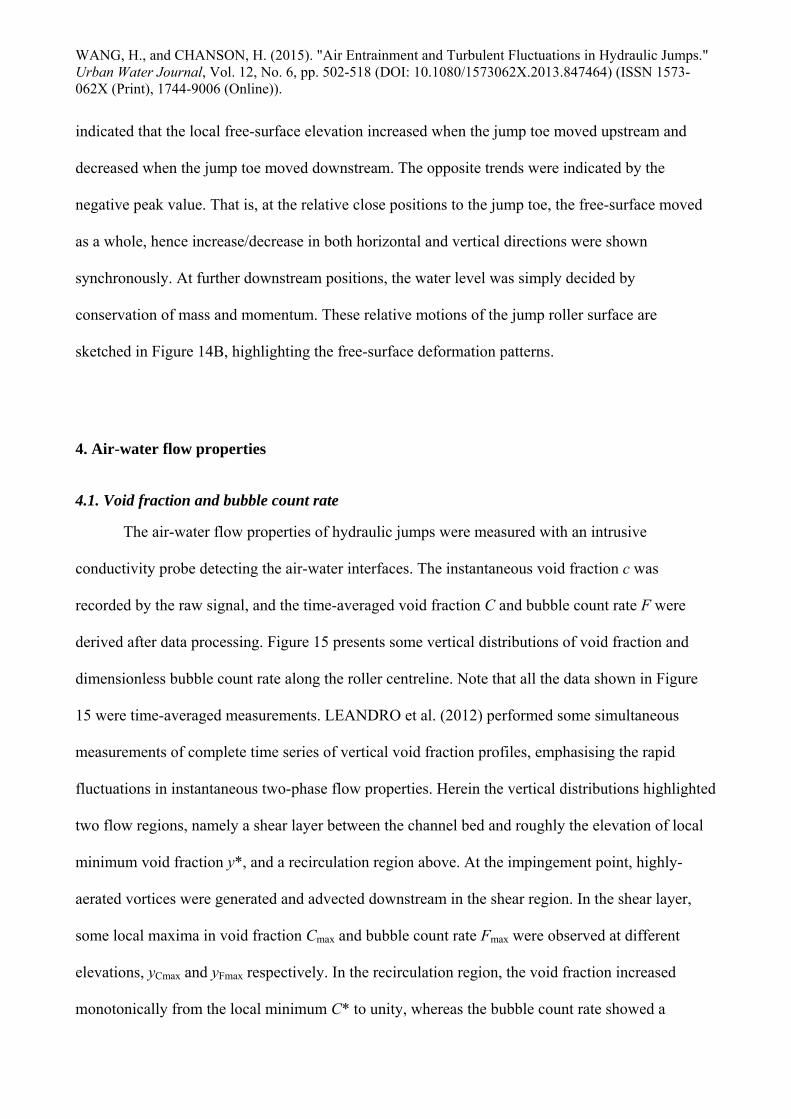
Three series of experiments were conducted corresponding to the different arrangements of
displacement meters and phase-detection probe. The flow conditions are summarised in Table 1,
together with a summary of earlier physical studies. For the data Series 1, the hydraulic jump flows

WANG, H., and CHANSON, H. (2015). "Air Entrainment and Turbulent Fluctuations in Hydraulic Jumps." Urban Water Journal, Vol. 12, No. 6, pp. 502-518 (DOI: 10.1080/1573062X.2013.847464) (ISSN 1573-062X (Print), 1744-9006 (Online)).
were produced by a series of upstream gate openings h with the inflow Froude numbers Fr1 from
3.8 to 10.0. The free-surface and two-phase properties were measured separately. For the data
Series 2, the Froude number was set at Fr1 = 5.1 and a range of gate openings were set to yield
different Reynolds numbers from 2.1×10⁴ to 1.63×10⁵. The data Series 3 were set for three different
Reynolds numbers with the same Froude number (Fr1 = 5.1), and free-surface fluctuations and two-
phase flow properties were recorded simultaneously at two longitudinal positions close to the jump
toe, i.e. (x-x1)/d1 = 4.15 and 8.3.
3. Free-surface characteristics
3.1. Free-surface profile
A hydraulic jump is characterised by a rapid increase in water elevation in the longitudinal
direction together with a recirculation flow region (roller) downstream of the jump toe. The
downstream depth d2 data are presented in Figure 4, where the dimensionless depth d2/d1 is shown
as function of the inflow Froude number Fr1. The data compared well with the solution of the
momentum principle (Eq. (1)). The roller length Lr data are also presented in Figure 4. Herein Lr
was defined as the distance over which the mean free-surface level increased monotonically
(MURZYN et al. 2007, MURZYN and CHANSON 2009). The data indicated an increasing roller
length Lr/d1 with increasing Froude number, and the data trend compared favourably with the
empirical correlations of MURZYN et al. (2007) and HAGER et al. (1990), but for a wider range of
Froude numbers.
The longitudinal free-surface profiles were measured with acoustic displacement meters,
located at six longitudinal positions along the centreline. Figure 5A shows the ratio of time-
averaged water elevation to inflow depth /d1, the data presenting some shapes very similar to the

WANG, H., and CHANSON, H. (2015). "Air Entrainment and Turbulent Fluctuations in Hydraulic Jumps." Urban Water Journal, Vol. 12, No. 6, pp. 502-518 (DOI: 10.1080/1573062X.2013.847464) (ISSN 1573-062X (Print), 1744-9006 (Online)).
visual observations through the sidewalls. The experimental data are plotted in Figure 5B. The free-
surface elevation data showed a self-similar profile of the jump roller, which was best correlated by:
0.54
1 1
2 1 r
d x x
d d L
(2)
for 0 < x-x1 < Lr within the range of experimental flow conditions (Table 1). The data are compared
with Equation (2) in Figure 5B as well as with an earlier correlation proposed by CHANSON
(2011).
3.2. Free-surface fluctuations
3.2.1. Free-surface fluctuations and characteristic fluctuation frequencies
The instantaneous free-surface fluctuations were recorded continuously for a range of flow
conditions (Table 1, series 1 & 2). A typical example is shown in Figure 6 together with an outline
of the time-averaged free-surface profile at t = 0. A relative steady inflow water level is shown
upstream the jump toe (x < x1), and the free-surface above the hydraulic jump roller fluctuated
significantly with different amplitudes (Fig. 6). The measurements showed that the maximum free-
surface fluctuations were observed in the first half of the roller length. This is illustrated in Figure
7A presenting some typical longitudinal distributions of dimensionless standard deviations of water
elevation '/d1 as a functions of the dimensionless distance from the jump toe (x-x1)/Lr. All the data
showed large fluctuations in water elevation above the jump roller (i.e. 0 < (x-x1)/Lr < 1), while the
water level fluctuations downstream of the roller remained larger than those recorded upstream of
the jump toe. The maximum standard deviation of water elevation was consistently observed in the
first half of the roller. The level of free-surface fluctuations tended to increase with increasing
inflow Froude number, which was likely linked with the enhanced air entrapment at jump toe and
air-water projections above the roller. The dimensionless maximum standard deviations 'max/d1

WANG, H., and CHANSON, H. (2015). "Air Entrainment and Turbulent Fluctuations in Hydraulic Jumps." Urban Water Journal, Vol. 12, No. 6, pp. 502-518 (DOI: 10.1080/1573062X.2013.847464) (ISSN 1573-062X (Print), 1744-9006 (Online)).
data are summarised against the inflow Froude number in Figure 7B where they are compared with
the data of MOUAZE et al. (2005), KUCUKALI and CHANSON (2008) and MURZYN and
CHANSON (2009). All the physical data indicated a monotonic increase in maximum free-surface
fluctuations with increasing Froude number for 2 < Fr1 < 10 (Fig. 7B).
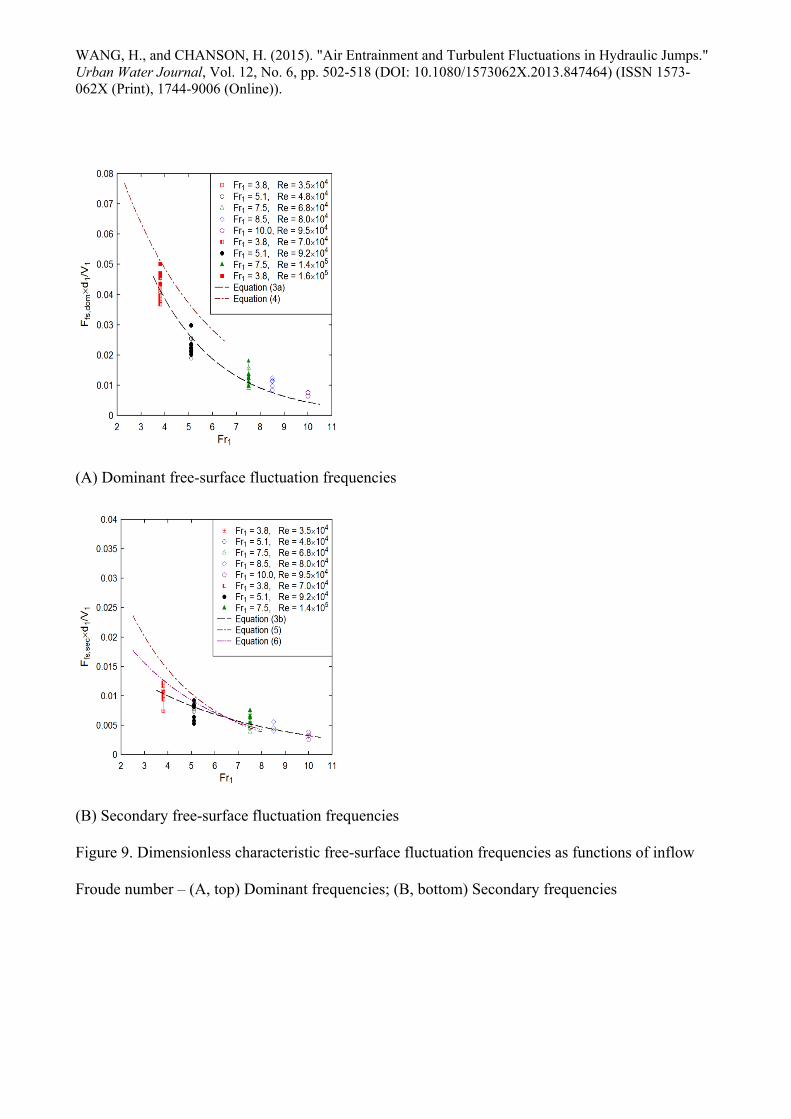
The frequencies of free-surface fluctuations were analysed based upon some displacement
meter signal analyses. A fast Fourier transform yielded a power spectrum density (PSD) function,
and the data showed some dominant characteristic frequency with a marked peak in energy density.
Sometimes some secondary frequencies were seen as well. A typical PSD function is shown in
Figure 8, in which the dominant and secondary free-surface fluctuation frequencies, denoted Ffs.dom
and Ffs.sec respectively, are highlighted. Overall the dominant free-surface fluctuation frequencies
Ffs.dom on the channel centreline were typically between 1.2 and 3.5 Hz and the secondary
frequencies Ffs.sec between 0.5 and 1.2 Hz. The results were close between different longitudinal
positions. The corresponding dimensionless data Ffs×d1/V1 are shown as functions of the inflow
Froude number in Figure 9. Herein two symbols connected by a dash line represent a range of
frequencies when no unique frequency was observed (Fig. 9). Both dimensionless dominant and
secondary frequency data are shown in Figure 9, and the data highlighted a decreasing trend with
increasing Froude number. The present data were best correlated by:
(3a)
(3b)
Equations (3a) and (3b) are compared with the experimental data in Figures 9A and 9B
respectively. CHACHEREAU and CHANSON (2011) measured the free-surface fluctuations with a
similar instrumentation. Their data provided a best fit correlation:

WANG, H., and CHANSON, H. (2015). "Air Entrainment and Turbulent Fluctuations in Hydraulic Jumps." Urban Water Journal, Vol. 12, No. 6, pp. 502-518 (DOI: 10.1080/1573062X.2013.847464) (ISSN 1573-062X (Print), 1744-9006 (Online)).
(4)
which is plotted in Figure 9A for comparison. Altogether Equations (3a) and (4) showed a
comparable trend for a wide range of Froude numbers (2.4 < Fr1 < 10) (Fig. 9A).
The secondary characteristic frequency data showed quantitative results comparable to
previous observations, namely the frequency of longitudinal jump toe oscillations Ftoe and
frequency of downstream ejection of large scale vortices Fej (ZHANG et al. 2013). In a stationary
hydraulic jump, the jump toe oscillated around its mean longitudinal position x1, and large scale
vortices were generated at and advected downstream of the jump toe. ZHANG et al. (2013) showed
some relationships between the oscillation frequency Ftoe and vortices advection frequency Fej, and
the inflow Froude number:
(5)
(6)
Equations (5) and (6) are compared with Equation (3b) in Figure 9B, showing a close agreement. It
is believed that the oscillation of jump toe and the generation and advection of large scale vortices
in the roller are linked (LONG et al. 1991, MOSSA and TOLVE 1998, CHANSON 2010). The
close agreement between all the data (Fig. 9B) may suggest some coupling between the longitudinal
jump toe oscillation, the ejection of large scale vortices and the free-surface fluctuations.
For some experiments performed with the same Froude number (Fr1 = 5.1) and a range of
Reynolds numbers (2.1×10⁴ < Re < 1.63×10⁵), the data indicated little differences in terms of the
dimensionless characteristic frequencies of free-surface fluctuations. The frequency data ranges
were close to the data shown in Figure 9 and yielded: 1.8 < Ffs.dom < 3.7 Hz and 0.4 < Ffs.sec < 1.7

WANG, H., and CHANSON, H. (2015). "Air Entrainment and Turbulent Fluctuations in Hydraulic Jumps." Urban Water Journal, Vol. 12, No. 6, pp. 502-518 (DOI: 10.1080/1573062X.2013.847464) (ISSN 1573-062X (Print), 1744-9006 (Online)).
Hz. Simply the inflow Froude number was the dominant factor affecting the free-surface fluctuation
frequencies, rather than the Reynolds number.
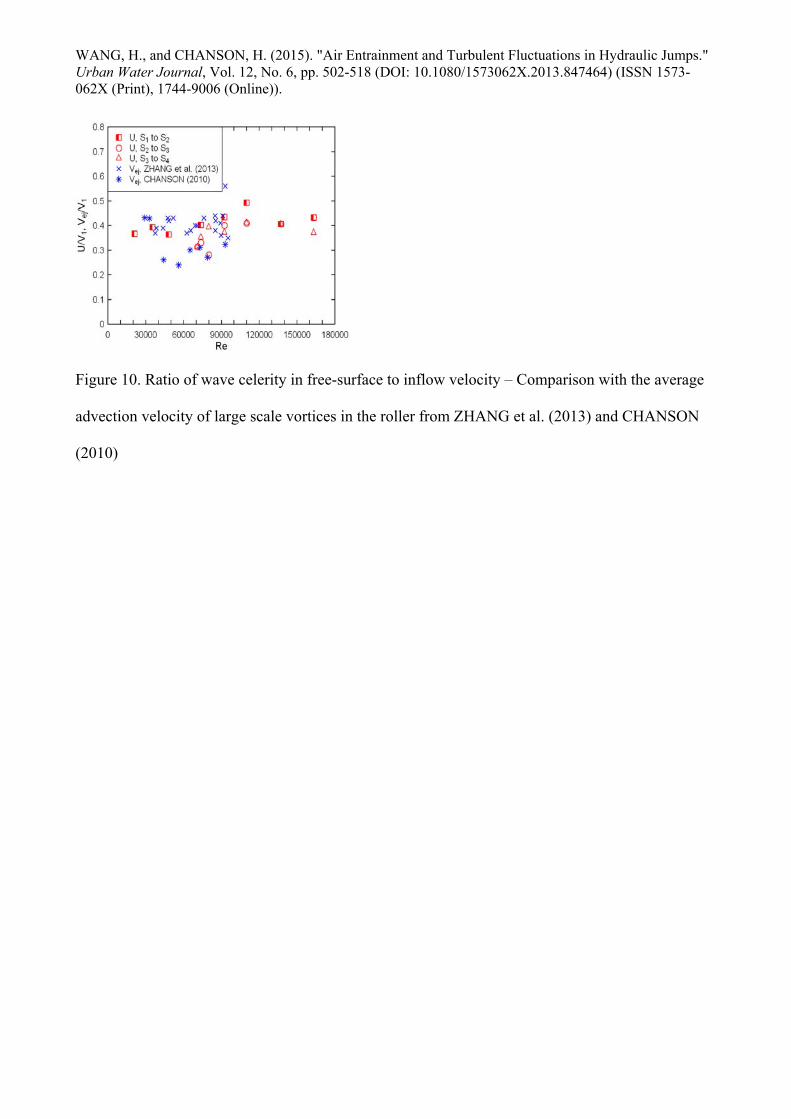
3.2.2. Wave celerity at the roller free-surface
Visually the fluctuations at the free-surface appeared to propagate above the roller in the
downstream direction. Based upon a cross-correlation analysis of displacement meter signals, the
wave celerity at the free-surface was calculated as U = x/t, where x is the longitudinal distance
between two adjacent sensors along the centreline, and t is the time lag for which the cross-
correlation function is maximum. The data are presented in Figure 10 in terms of the ratio of wave
celerity to inflow velocity U/V1. For a given experiment, the results were close between different
sensors on the channel centreline, implying that the free-surface fluctuations propagated at a nearly
constant celerity independently of the longitudinal location. Overall the ratio U/V1 was nearly
independent of the Reynolds number, with an average value U/V1 = 0.39 (Fig. 10). Figure 10
includes also the average advection velocities of large scale vortices in the roller Vej/V1 observed by
CHANSON (2010) and ZHANG et al. (2013). Comparable results are shown, with mean values of
0.32 and 0.41 respectively. Altogether the experimental data implied that the propagation of free-
surface fluctuations at the roller surface was closely linked to the advection of large scale vortices
in the shear layer.
3.3. Longitudinal change in jump toe position
The hydraulic jump location shifted around a position x1 in both fast and slow manners. The
characteristic frequency of the fast longitudinal motion of jump toe position was typically 0.003 <
Ftoe×d1/V1 < 0.025, corresponding to dimensional frequencies between 0.7 and 1.3 Hz (ZHANG et
al. 2013). The slow change in jump position had a frequency typically significantly lower than 0.1
Hz, and limited data were reported to date. In the present study, both the fast and slow fluctuations
in jump toe position were investigated. Some long-term change of jump position was recorded with

WANG, H., and CHANSON, H. (2015). "Air Entrainment and Turbulent Fluctuations in Hydraulic Jumps." Urban Water Journal, Vol. 12, No. 6, pp. 502-518 (DOI: 10.1080/1573062X.2013.847464) (ISSN 1573-062X (Print), 1744-9006 (Online)).
a video camera, while the rapid jump toe oscillations were detected with a horizontal displacement
meter from upstream, as illustrated in Figure 3 (sensor So).
3.3.1. Long-term change in longitudinal roller position
Video observations for up to 160 minutes were conducted for a hydraulic jump with Fr1 =
5.1 and Re = 4.8×10⁴. Some typical video frames are presented in Figure 11. The relative jump toe
position x-x1 was recorded every second, and some typical smoothed data are shown in Figure 12.
The data highlighted some temporary changes of jump toe position ranging from -0.28 m to +0.12
m, with the largest movements being mostly in the form of upstream shifts (x-x1 < 0). The jump toe
tended to stay at the remote positions for 120 to 400 s before returning to its mean position. The
displacements were larger than, and their periods were drastically longer than, those for the rapid
jump toe oscillations. In Figure 12, about 36 major shifts in jump toe positions were recorded
during 160 minutes, corresponding to an average frequency around 0.004 Hz. It is thought that the
relative long-term behaviour might be linked with the hydraulic jump minimising its energy. For
example, an upstream movement of jump roller tended to decrease the downstream water level to
achieve lower potential energy. At the same time, it decreased slightly the inflow depth because of a
lesser developed boundary layer at the channel bed, thus corresponding to a temporary increase in
inflow Froude number, which tended to increase the ratio of conjugate depths d2/d1 according to
momentum considerations (Eq. (1)).
3.3.2. Longitudinal jump toe oscillations
The horizontally placed displacement meter (sensor S0 in Fig. 3) detected the longitudinal
position of roller front which moved together with the jump toe. The characteristic oscillation
frequencies were deduced from the signal analysis and the dominant and secondary frequencies
were denoted Ftoe.dom and Ftoe.sec respectively. The dimensionless frequency data are shown in
Figure 13A as functions of the inflow Froude number and in Figure 13B against the Reynolds

WANG, H., and CHANSON, H. (2015). "Air Entrainment and Turbulent Fluctuations in Hydraulic Jumps." Urban Water Journal, Vol. 12, No. 6, pp. 502-518 (DOI: 10.1080/1573062X.2013.847464) (ISSN 1573-062X (Print), 1744-9006 (Online)).
number. Some visual observations during previous studies are also included for comparison. In
Figure 13A, the data showed that the dimensionless frequencies of horizontal jump fluctuations
were close to the visual observations, but for those of ZHANG et al. (2013) and CHACHEREAU
and CHANSON (2011) at low Froude numbers (Fr1 < 4.4). Some results obtained with an identical
Froude number presented higher dominant frequencies at larger Reynolds numbers, though the
previous observations only focused on Reynolds numbers less than 1.1×10⁵ (Fig. 13B). A reason
for the discrepancy at low Froude and Reynolds numbers might be linked with the difficulty to aim
the displacement meter at the jump front close to the jump toe for small hydraulic jumps.
The approximate frequency ranges are listed in Table 2. The dominant characteristic
frequencies of jump toe oscillation Ftoe.dom were shown within a similar range to the secondary
characteristic frequencies Ffs.sec observed for the free-surface fluctuations, while the secondary jump
toe oscillation frequencies Ftoe.sec were in a range corresponding to the dominant free-surface
fluctuation frequencies Ffs.dom. The findings implied that the vertical free-surface fluctuations and
horizontal roller oscillations were not independent processes. The two motions had different
inherent characteristic frequencies, although they interacted with each other, the influence being
reflected by some secondary frequencies.
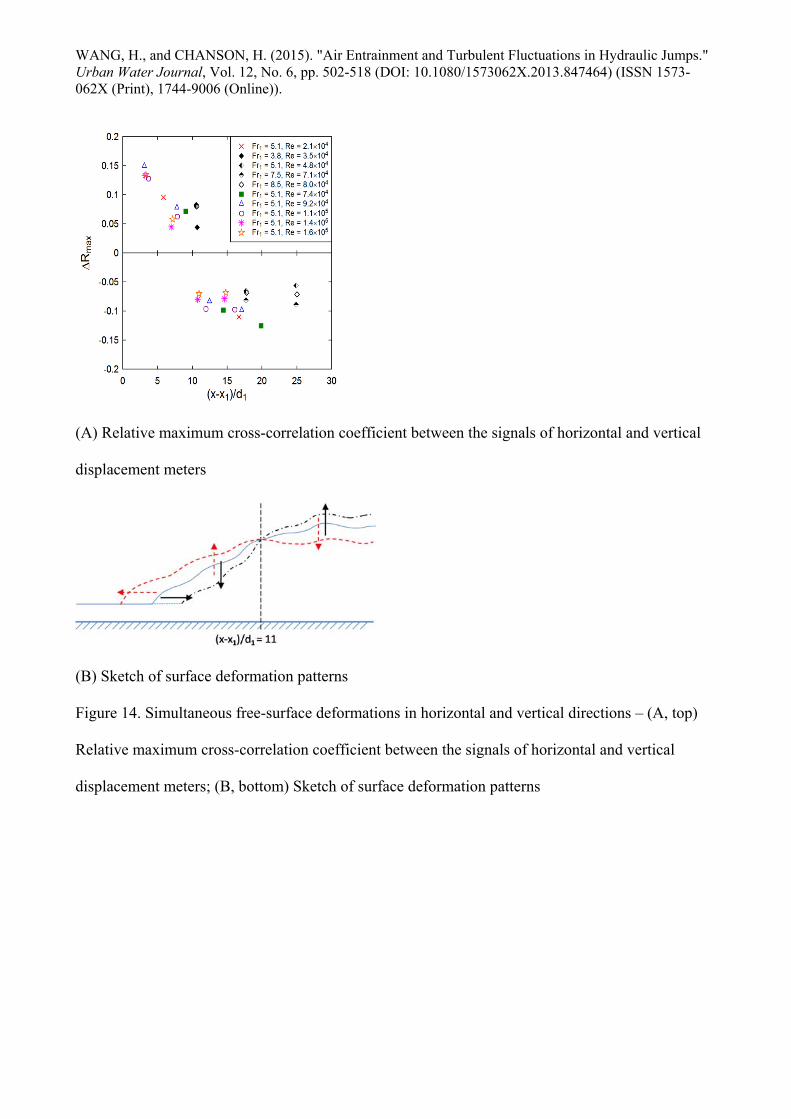
3.4. Simultaneous vertical and horizontal free-surface motions
Some cross-correlation analyses were performed between the horizontal and vertical
displacement meter signals. The relative maximum or minimum correlation coefficients with zero
time lag (τ = 0) characterised some simultaneous fluctuating motions of the roller surface in the two
directions. For a given set of flow conditions, the horizontal jump front position data was correlated
to the water elevation data measured at different longitudinal locations on the centreline. Figure
14A presents the peak correlation coefficients at the corresponding positions of the vertical sensors.
For all data, the relative maximum correlation coefficients Rmax were positive for (x-x1)/d1 < 11 ,
and the relative minimum were less than zero for (x-x1)/d1 > 11 (Fig. 14A). The positive peak
WANG, H., and CHANSON, H. (2015). "Air Entrainment and Turbulent Fluctuations in Hydraulic Jumps." Urban Water Journal, Vol. 12, No. 6, pp. 502-518 (DOI: 10.1080/1573062X.2013.847464) (ISSN 1573-062X (Print), 1744-9006 (Online)).
indicated that the local free-surface elevation increased when the jump toe moved upstream and
decreased when the jump toe moved downstream. The opposite trends were indicated by the
negative peak value. That is, at the relative close positions to the jump toe, the free-surface moved
as a whole, hence increase/decrease in both horizontal and vertical directions were shown
synchronously. At further downstream positions, the water level was simply decided by
conservation of mass and momentum. These relative motions of the jump roller surface are
sketched in Figure 14B, highlighting the free-surface deformation patterns.
4. Air-water flow properties
4.1. Void fraction and bubble count rate
The air-water flow properties of hydraulic jumps were measured with an intrusive
conductivity probe detecting the air-water interfaces. The instantaneous void fraction c was
recorded by the raw signal, and the time-averaged void fraction C and bubble count rate F were
derived after data processing. Figure 15 presents some vertical distributions of void fraction and
dimensionless bubble count rate along the roller centreline. Note that all the data shown in Figure
15 were time-averaged measurements. LEANDRO et al. (2012) performed some simultaneous
measurements of complete time series of vertical void fraction profiles, emphasising the rapid
fluctuations in instantaneous two-phase flow properties. Herein the vertical distributions highlighted
two flow regions, namely a shear layer between the channel bed and roughly the elevation of local
minimum void fraction y*, and a recirculation region above. At the impingement point, highly-
aerated vortices were generated and advected downstream in the shear region. In the shear layer,
some local maxima in void fraction Cmax and bubble count rate Fmax were observed at different
elevations, yCmax and yFmax respectively. In the recirculation region, the void fraction increased
monotonically from the local minimum C* to unity, whereas the bubble count rate showed a

WANG, H., and CHANSON, H. (2015). "Air Entrainment and Turbulent Fluctuations in Hydraulic Jumps." Urban Water Journal, Vol. 12, No. 6, pp. 502-518 (DOI: 10.1080/1573062X.2013.847464) (ISSN 1573-062X (Print), 1744-9006 (Online)).
secondary peak and decreased to zero (Fig. 15). This flow region was characterised by some flow
recirculation motion, together with aeration and deaeration at the upper free-surface.
In the shear region, the void fraction distribution followed an analytical solution of the
advective diffusion equation for air bubbles (CHANSON 1995, 2010):
(7)
where D# is the dimensionless diffusivity: D# = Dt/(V1×d1) with Dt being the air bubble diffusivity.
Equation (7) is compared with experimental data in Figure 15A. The maximum void fraction Cmax
decreased along the longitudinal direction in the roller for a given set of flow conditions. The data
followed an exponential trend:
(8)
where A and B are the best-fitted coefficients functions of the flow conditions . In the present study,
the coefficients A and B were linked to the inflow Froude number, but almost independent of the
Reynolds number:
(9a)
(9b)
Consequently, the maximum void fraction Cmax was a function of the longitudinal position and
inflow Froude number:

WANG, H., and CHANSON, H. (2015). "Air Entrainment and Turbulent Fluctuations in Hydraulic Jumps." Urban Water Journal, Vol. 12, No. 6, pp. 502-518 (DOI: 10.1080/1573062X.2013.847464) (ISSN 1573-062X (Print), 1744-9006 (Online)).
(10)
Similarly, the present data indicated a longitudinal decay in maximum bubble count rate with
increasing distance from the jump toe. The data were best correlated as:
(11)
Equation (10) and (11) indicated that the quantitative levels of the maxima in void fraction
and bubble count rate respectively were functions of the Froude number for void fraction Cmax and
of the Reynolds number for dimensionless bubble count rate Fmax, whereas the decay rates along the
roller were mostly affected by the Froude number in each case. The finding implied that the amount
of entrapped air and the number of air bubbles were related to different physical processes: the
former was likely linked to the inertia force and the latter to the turbulence shear force.
The elevations of maximum void fraction yCmax and maximum bubble count rate yFmax
increased with increasing distance from the jump toe. The data were best fitted by some linear
regressions:
(12)
(13)
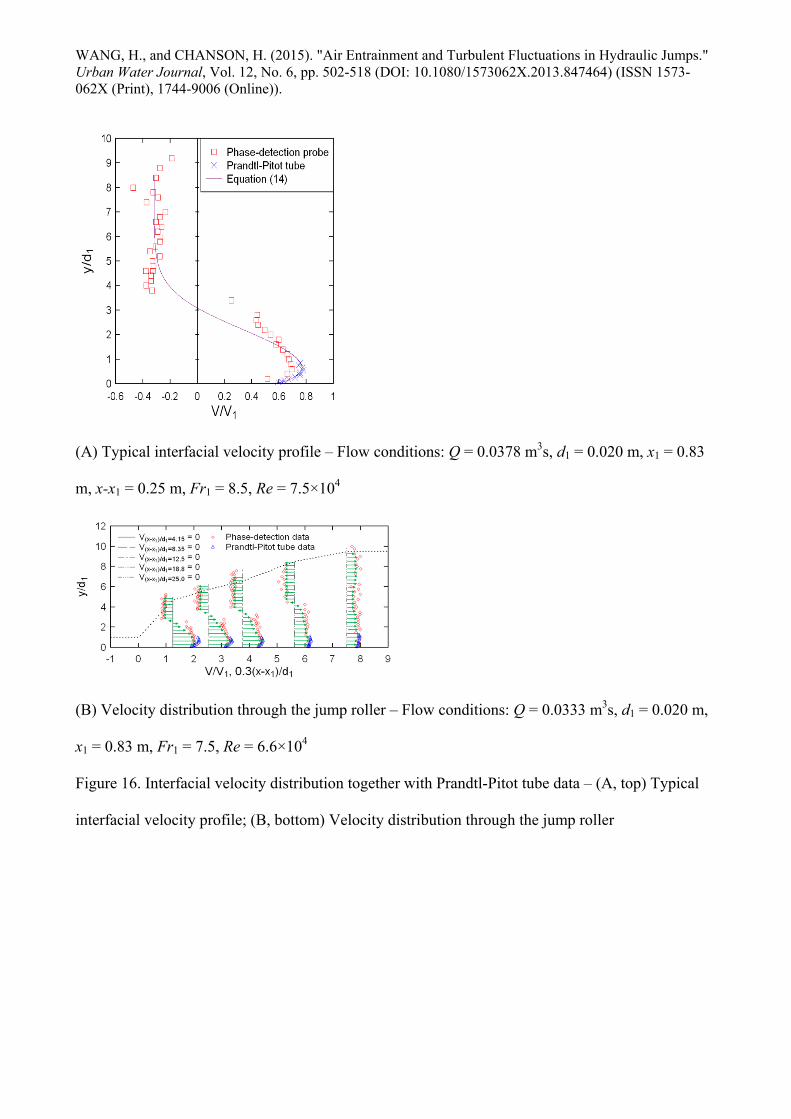
4.2. Interfacial velocity and entrapped air flux
The interfacial velocity was deduced from a cross-correlation analysis of the dual-tip phase-
detection probe signals in the aerated flow region. A Prandtl-Pitot tube was used to measure the
clear-water velocity in the lower shear layer where the void fraction was typically less than 0.05 and
the accuracy of phase-detection probe was limited. A typical velocity profile is shown in Figure

WANG, H., and CHANSON, H. (2015). "Air Entrainment and Turbulent Fluctuations in Hydraulic Jumps." Urban Water Journal, Vol. 12, No. 6, pp. 502-518 (DOI: 10.1080/1573062X.2013.847464) (ISSN 1573-062X (Print), 1744-9006 (Online)).
16A. Altogether, the velocity data exhibited some profiles similar to with a wall jet flow
(RAJARATNAM 1965, CHANSON 2010):
N/1
maxVmax y
y
V
V
for 1
y
y
maxV
(14a)
2
5.0
maxV
recircmax
recirc
yy
yy765.1
2
1exp
VV
VV for 1
y
y
maxV
(14b)
where N is a constant, Vmax is the maximum velocity measured at y = yVmax, Vrecirc is the
recirculation velocity and y0.5 is the elevation where V = 0.5×Vmax. Herein Vrecirc was found nearly
uniform at a given longitudinal position across the recirculation region, while N = 10 typically (Fig.
16A). Although the cross-correlation analysis failed to provide meaningful results in the region
where the interfacial velocity was about zero, some statistical analysis of instantaneous time lag in
the raw probe signals supported the continuous velocity profile prediction by showing small
average velocity close to y(V = 0). Note that the elevation y(V = 0) differed slightly from the
characteristic elevation y*. An example of the longitudinal variations in vertical velocity
distributions is shown in Figure 16B, together with the time-averaged free-surface profile. The
maximum velocity was observed to the channel bed and its magnitude decreased with increasing
distance from the jump toe. Some recirculation motion was shown clearly in the recirculation region
within the upper region of the jump roller.
Based upon the void fraction and velocity measurements, the entrapped air flux in the jump
roller was derived from the equation of conservation of mass for the air phase:
90y
0y
ent dyVCq (15A)

WANG, H., and CHANSON, H. (2015). "Air Entrainment and Turbulent Fluctuations in Hydraulic Jumps." Urban Water Journal, Vol. 12, No. 6, pp. 502-518 (DOI: 10.1080/1573062X.2013.847464) (ISSN 1573-062X (Print), 1744-9006 (Online)).
where y90 is the characteristic distance from the bed where C = 0.90. For the experimental flows
with some distinct flow recirculation in the upper roller region, the air flux qent was calculated in
two flow region: (a) for 0 < y < y(V = 0) and (b) for y(V = 0) < y < y90, where y90 = y(C = 0.9) was
considered as an upper free-surface elevation estimate:
)0V(y
0y
)a(ent dyVCq >0 (15B)
90y
)0V(yy
)b(ent dyVCq <0 (15C)
Equation (15B) characterised the air flow rate entrained in the shear region, while Equation (15C)
described the recirculation air flux in the upper region (b), assuming an uniform recirculation
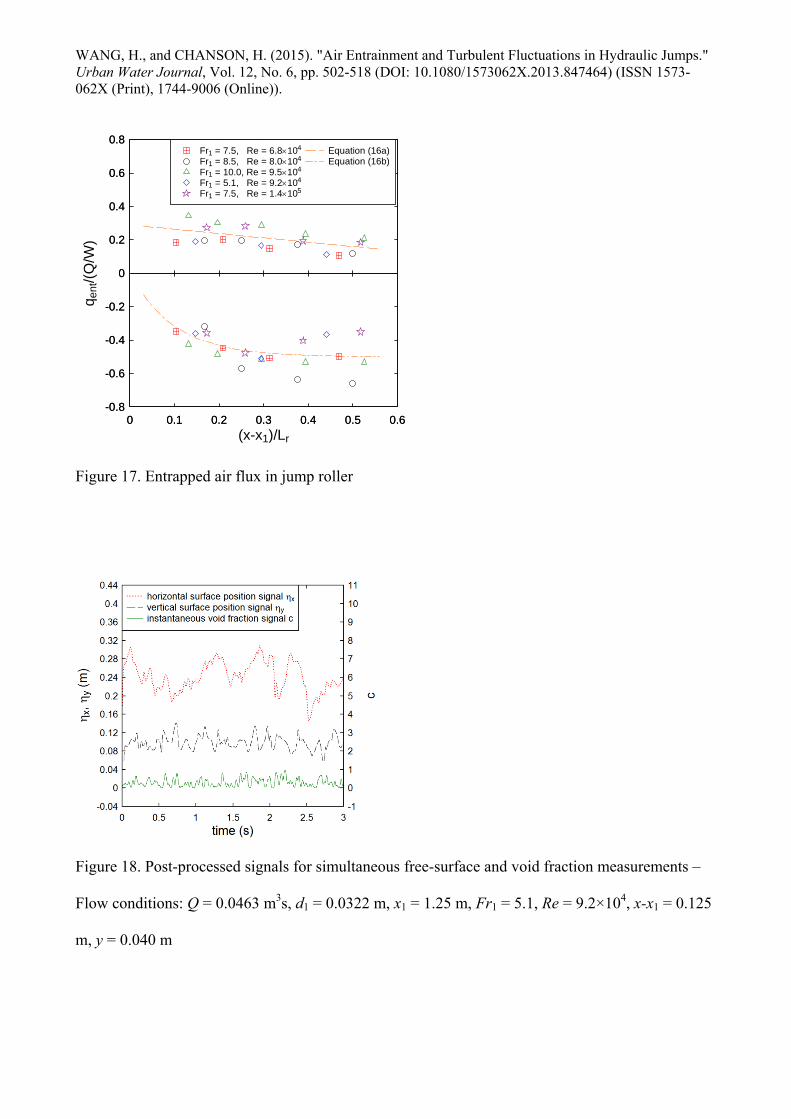
velocity. The longitudinal distributions of entrained and recirculation air fluxes are plotted in Figure
17, together with the best fit correlation functions:
( )
10.29 0.26a
ent
r
q x xQ LW
for 0 < y < y(V = 0) (16a)
( )
10.5 1 exp 10b
ent
r
q x xQ LW
for y(V = 0) < y < y90 (16b)
The positive air flux in the shear region (0 < y < y(V = 0)) was shown to decrease with increasing
distance from the jump toe, as the air bubbles were diffused and dispersed by turbulent shear. Air
bubbles were observed to be driven into the upper recirculation region by buoyancy as they were
advected in the streamwise advection. In the recirculation region (y(V = 0) < y < y90), the air flux
was negative, and its magnitude increased rapidly within 0 < x-x1 < 0.3×Lr, and sightly increased
over the rest roller length. The qualitative trend and quantitative data suggested some significant air

WANG, H., and CHANSON, H. (2015). "Air Entrainment and Turbulent Fluctuations in Hydraulic Jumps." Urban Water Journal, Vol. 12, No. 6, pp. 502-518 (DOI: 10.1080/1573062X.2013.847464) (ISSN 1573-062X (Print), 1744-9006 (Online)).
entrapment at the jump toe. Further downstream, the aeration rate still appeared to be higher than
the de-aeration rate, because the air flux in the recirculation region was larger than that in the shear
layer: the finding implied that the air entrapment flux was not the only source of the recirculating
negative flux.
Overall the data suggested that the flux of air entrapment at jump toe was roughly 30% of
the water discharge for 5.1 < Fr1 < 10 (Fig. 17) and all entrapped air was advected into the shear
layer. In most cases, the total absolute air flux |qent| = |qent(a)|+|qent
(b)| reached a maximum at x-x1 =
0.3×Lr, as additional aeration took place through the free-surface of the roller.
5. Coupling between free-surface and air-water flow property fluctuations
Simultaneous measurements of instantaneous void fraction c and relative roller surface
locations, ηx in horizontal direction and ηy in vertical direction, were conducted as sketched in
Figure 3B. The phase-detection probe and acoustic displacement meters were sampled
synchronously at 5 kHz for 180 s at each phase-detection probe location (x, y). The processed
signals were filtered with a low-pass band (0-25 Hz) to eliminate high-frequency component with a
period less than the response time of the displacement meter (MURZYN and CHANSON 2009).
The low-pass filtered signals were smoothed and Figure 18 shows a typical example. A cross-
correlation function was calculated between the data of horizontal jump front position ηx and
instantaneous void fraction c, as well as between those of water elevation ηy and instantaneous void
fraction, yielding the corresponding cross-correlation correlation functions R(ηxc) and R(ηyc).
The measurements were performed at longitudinal positions close to the jump toe: (x-x1)/d1
= 4 and 8. For a constant Froude number Fr1 = 5.1 and Reynolds numbers from 4.7×10⁴ to 1.4×10⁵,
the measurements and corresponding calculations were performed for a range of phase-detection
elevations 0 < y/d1 < y90/d1. Maximum (or minimum) correlation coefficients R(ηxc)max and
R(ηyc)max were observed at most vertical elevations, giving some measure of the relative

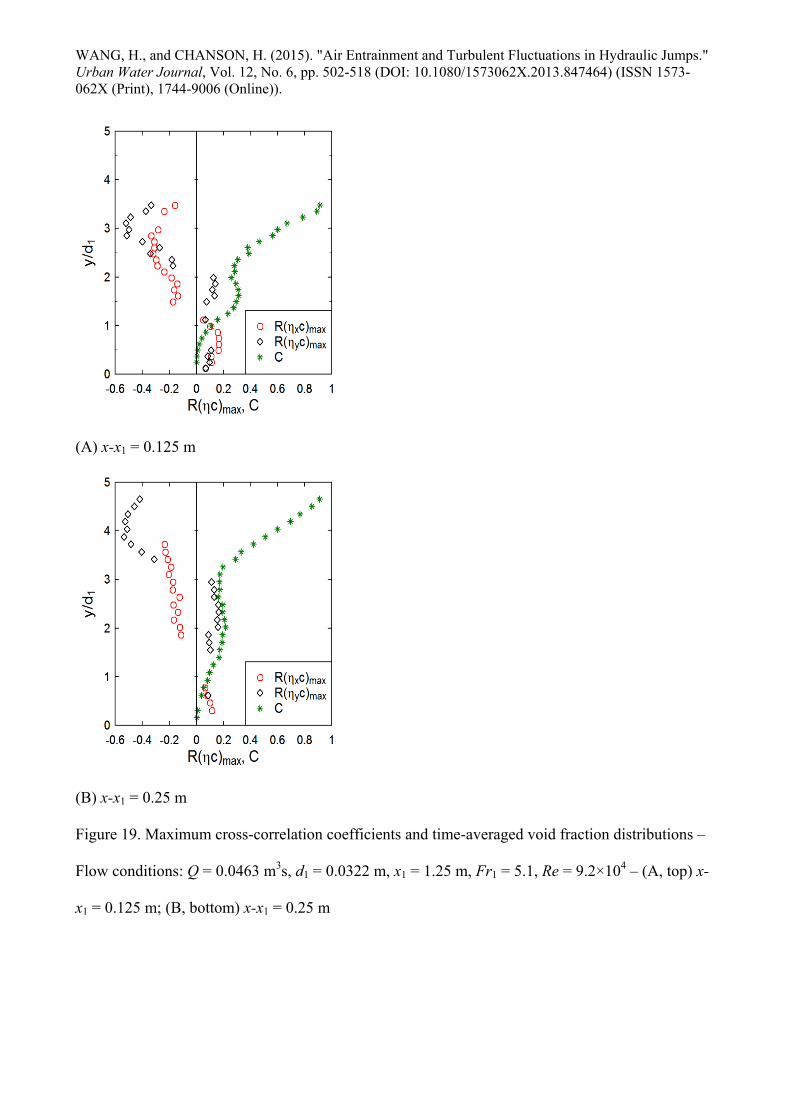
WANG, H., and CHANSON, H. (2015). "Air Entrainment and Turbulent Fluctuations in Hydraulic Jumps." Urban Water Journal, Vol. 12, No. 6, pp. 502-518 (DOI: 10.1080/1573062X.2013.847464) (ISSN 1573-062X (Print), 1744-9006 (Online)).
fluctuations in free-surface position and void fraction. Figure 19 presents some typical vertical
distributions of maximum cross-correlation coefficients at two longitudinal positions in the first half
roller, together with the time-averaged void fraction C distribution.
At a given cross-section, positive maximum correlation coefficients were shown in terms of
R(ηxc) and R(ηyc) in the lower shear layer: i.e., 0 < y < y(C = 0.1). The positive maxima were seen
at about zero time lag (τ = 0), indicating some increasing distance ηx and ηy with increasing local
instantaneous void fraction. The air bubbles in this region were mostly entrapped air advected
downstream of the jump toe. That is, when the diffused air was detected within 0 < y < y(C = 0.1),
the jump roller moved upstream and both water elevation and relative jump front position increased
as sketched in Figure 20C. Similarly, negative maxima were show in terms of both R(ηxc) and R(ηyc)
in the recirculation region (y > y*) (Fig. 19). Note that the negative peak R(ηxc)max was seen with a
negative time lag τ < 0, while the peak R(ηyc)max was observed for τ = 0. The data indicated that the
instantaneous void fraction increased in the recirculation region when the local water level
decreased, followed by a downstream movement of the jump toe (Fig. 20A). Different physical
processes might be involved implied; for example, a negative R(ηyc)max next to the free-surface
might be the result of the probe tip being exposed to air as the water surface elevation dropped and
being re-submerged as the water surface shifted upwards.
In the main air bubble advection zone of shear layer, i.e. y(C = 0.1) < y < y*, the data
indicated maximum cross-correlation coefficients with opposite signs: namely R(ηxc)max < 0 and
R(ηyc)max > 0. The observations corresponded to an increasing void fraction together with a
downstream jump toe motion and an increasing free-surface elevation above. The free-surface
motions might reflect the flow bulking associated with the air entrapment at the jump toe,
detachment and downstream advection of large aerated coherent structures (Fig. 20B), while the
fluctuations in void fraction might correspond to the air entrapped and advected in the large scale
coherent structures. Thus the results implied a coupling between the instantaneous free-surface

WANG, H., and CHANSON, H. (2015). "Air Entrainment and Turbulent Fluctuations in Hydraulic Jumps." Urban Water Journal, Vol. 12, No. 6, pp. 502-518 (DOI: 10.1080/1573062X.2013.847464) (ISSN 1573-062X (Print), 1744-9006 (Online)).
deformations and air-water flow properties linked with the convection of highly-aerated large-scale
vortices. Figure 20A and 20C present some sketches of flow patterns and free-surface deformations
close to those shown in Figure 14B for (x-x1)/d1 < 11. On the other hand, the trend illustrated in
Figure 20B was not revealed by the direct correlation between the free-surface fluctuations (section
3.4).
6. Conclusion
The physical modelling of hydraulic jumps with partially developed inflow conditions was
investigated in a relatively large size facility. A broad range of Froude numbers (3.8 < Fr1 < 10.0)
and Reynolds numbers (2.1×10⁴ < Re < 1.6×10⁵) were tested. The free-surface fluctuations were
measured non-intrusively with acoustic displacement meters, and the air-water flow properties were
measured using an intrusive phase-detection probe.
The time-averaged free-surface profile was well defined on the channel centreline,
presenting some self-similarity within the length of roller. The largest free-surface fluctuations were
observed in the first half roller, and the maximum fluctuations increased with inflow Froude
number. The characteristic free-surface fluctuation frequencies encompassed both dominant and
secondary frequencies. The dimensionless frequencies decreased exponentially with increasing
Froude number. The longitudinal oscillation of the jump roller position exhibited some dominant
and secondary characteristic frequencies. The frequency ranges implied some coupling between the
vertical and horizontal motions of the roller surface, supported by some cross-correlation analysis
of the corresponding signals. The frequency of vertical free-surface fluctuations was mostly
affected by the Froude number, while the horizontal jump toe oscillations were linked with both
Froude and Reynolds numbers within the experimental flow conditions. The type of free-surface
deformation was different at different longitudinal positions. The wave propagation celerity at the
roller free-surface was shown to be close to the advection speed of large vortices in the roller. Some

WANG, H., and CHANSON, H. (2015). "Air Entrainment and Turbulent Fluctuations in Hydraulic Jumps." Urban Water Journal, Vol. 12, No. 6, pp. 502-518 (DOI: 10.1080/1573062X.2013.847464) (ISSN 1573-062X (Print), 1744-9006 (Online)).
slow changes in the roller position were also observed with large jump toe displacement and long
shifting time.
The distributions of void fraction, bubble count rate and interfacial velocity were measured
in the hydraulic jump roller. Maximum void fraction and bubble count rate were observed in the
developing shear layer, but at different elevations. The interfacial velocity profiles showed some
agreement with a wall jet solution. The entrapped air flux was estimated based upon the integration
of the void fraction and velocity data. The results implied some aeration and de-aeration processes
in different flow region. Simultaneous measurements of vertical/horizontal free-surface fluctuations
and instantaneous void fraction highlighted the coupling between the free-surface fluctuations and
local air-water flow properties. The results suggested some non-constant free-surface deformation
patterns linked with variations in void fraction at different locations within the roller. As the roller
moved upstream, the air entrainment increased in the lower shear layer but decreased in the
recirculation region. When more entrapped air was detected in the bulk of the shear layer, the jump
toe tended to move downstream, together with some flow bulking of the roller surface.
The findings provide a range of informations on both turbulent free-surface fluctuations and
two-phase flow properties. New data in terms fluctuation frequencies, surface deformation patterns
and air entrapment estimation were presented, and the study of the interaction between turbulence
development and air entrainment brought further insight to this complex flow. The findings may
have implication into the design of water systems in which hydraulic jumps may occur.
Acknowledgement
The authors thank Jason VAN DER GEVEL and Stewart MATTHEWS (The University of
Queensland) for their technical assistance in laboratory work. The financial support of the
Australian Research Council (Grants DPDP0878922 & DP120100481) is acknowledged.

WANG, H., and CHANSON, H. (2015). "Air Entrainment and Turbulent Fluctuations in Hydraulic Jumps." Urban Water Journal, Vol. 12, No. 6, pp. 502-518 (DOI: 10.1080/1573062X.2013.847464) (ISSN 1573-062X (Print), 1744-9006 (Online)).
References
BÉLANGER, J.B. (1841). "Notes sur l'Hydraulique." ('Notes on Hydraulic Engineering.') Ecole
Royale des Ponts et Chaussées, Paris, France, session 1841-1842, 223 pages (in French).
CHACHEREAU, Y., and CHANSON, H. (2011). "Free-Surface Fluctuations and Turbulence in
Hydraulic Jumps." Experimental Thermal and Fluid Science, Vol. 35, No. 6, pp. 896-909.
CHANSON, H. (1995). "Air Entrainment in Two-Dimensional Turbulent Shear Flows with
Partially Developed Inflow Conditions." Journal of Multiphase Flow, Vol. 21, No. 6, pp. 1107-
1121.
CHANSON, H. (2007a). "Bubbly Flow Structure in Hydraulic Jump." European Journal of
Mechanics - B/Fluids, Vol. 26, No. 3, pp. 367-384.
CHANSON, H. (2007b). "Dynamic Similarity and Scale Effects Affecting Air Bubble Entrainment
in Hydraulic Jumps." Proceedings of 6th International Conference on Multiphase Flow ICMF
2007, Leipzig, Germany, July 9-13, M. Sommerfield Editor. Session 7, Paper
S7_Mon_B_S7_Mon_B_3, 11 pages.
CHANSON, H. (2009). "Current Knowledge In Hydraulic Jumps And Related Phenomena. A
Survey of Experimental Results." European Journal of Mechanics B/Fluids, Vol. 28, No. 2, pp.
191-210 (DOI: 10.1016/j.euromechflu.2008.06.004).
CHANSON, H. (2010). "Convective Transport of Air Bubbles in Strong Hydraulic Jumps."
International Journal of Multiphase Flow, Vol. 36, No. 10, pp. 798-814.
CHANSON, H. (2011). "Hydraulic Jumps: Turbulence and Air Bubble Entrainment." La Houille
Blanche, Vol. 3, pp. 5-16 (DOI: 10.1051/lhb/2011026).
CHANSON, H. (2012). "Momentum Considerations in Hydraulic Jumps and Bores." Journal of
Irrigation and Drainage Engineering, ASCE, Vol. 138, No. 4, pp. 382-385 (DOI
10.1061/(ASCE)IR.1943-4774.0000409).
CHANSON, H., and BRATTBERG, T. (2000). "Experimental Study of the Air-Water Shear Flow
in a Hydraulic Jump." International Journal of Multiphase Flow, Vol. 26, No. 4, pp. 583-607.

WANG, H., and CHANSON, H. (2015). "Air Entrainment and Turbulent Fluctuations in Hydraulic Jumps." Urban Water Journal, Vol. 12, No. 6, pp. 502-518 (DOI: 10.1080/1573062X.2013.847464) (ISSN 1573-062X (Print), 1744-9006 (Online)).
CHANSON, H., and CAROSI, G. (2007). "Advanced Post-Processing and Correlation Analyses in
High-Velocity Air-Water Flows." Environmental Fluid Mechanics, Vol. 7, No. 6, pp. 495-508.
CHANSON, H., and CHACHEREAU, Y. (2013). "Scale Effects Affecting Two-Phase Flow
Properties in Hydraulic Jump with Small Inflow Froude Number." Experimental Thermal and Fluid
Science, Vol. 45, pp. 234-242 (DOI: 10.1016/j.expthermflusci.2012.11.014).
CHANSON, H., and GUALTIERI, C. (2008). "Similitude and Scale Effects of Air Entrainment in
Hydraulic Jumps." Journal of Hydraulic Research, Vol. 46, No. 1, pp. 35-44.
HAGER, W.H., BREMEN, R., and KAWAGOSHI, N. (1990). "Classical Hydraulic Jump: Length
of Roller." Journal of Hydraulic Research, IAHR, Vol. 28, No. 5, pp. 591-608.
HENDERSON, F.M. (1966). "Open Channel Flow." MacMillan Company, New York, USA.
KUCUKALI, S., and CHANSON, H. (2008). "Turbulence Measurements in Hydraulic Jumps with
Partially-Developed Inflow Conditions." Experimental Thermal and Fluid Science, Vol. 33, No. 1,
pp. 41-53 (DOI: 10.1016/j.expthermflusci.2008.06.012).
LEANDRO, J., CARVALHO, R., CHACHEREAU, Y., and CHANSON, H. (2012). "Estimating
Void Fraction in a Hydraulic Jump by Measurements of Pixel Intensity." Experiments in Fluids,
Vol. 52, No. 5, Page 1307-1318 (DOI: 10.1007/s00348-011-1257-1).
LIGGETT, J.A. (1994). "Fluid Mechanics." McGraw-Hill, New York, USA.
LIGHTHILL, J. (1978). "Waves in Fluids." Cambridge University Press, Cambridge, UK, 504
pages.
LONG, D., RAJARATNAM, N., STEFFLER, P.M., and SMY, P.R. (1991). "Structure of Flow in
Hydraulic Jumps." Jl of Hyd. Research, IAHR, Vol. 29, No. 2, pp. 207-218.
MOSSA, M. (1999). "On the Oscillating Characteristics of Hydraulic Jumps." Journal of Hydraulic
Research, Vol. 37, No. 4, pp. 541-558.
MOSSA, M., and TOLVE, U. (1998). "Flow Visualization in Bubbly Two-Phase Hydraulic Jump."
Jl Fluids Eng., ASME, Vol. 120, March, pp. 160-165.

WANG, H., and CHANSON, H. (2015). "Air Entrainment and Turbulent Fluctuations in Hydraulic Jumps." Urban Water Journal, Vol. 12, No. 6, pp. 502-518 (DOI: 10.1080/1573062X.2013.847464) (ISSN 1573-062X (Print), 1744-9006 (Online)).
MOUAZE, D., MURZYN, F., and CHAPLIN, J.R. (2005). "Free Surface Length Scale Estimation
in Hydraulic Jumps." Journal of Fluids Engineering, Transactions ASME, Vol. 127, pp. 1191-1193.
MURZYN, F., and CHANSON, H. (2009). "Experimental Investigation of Bubbly Flow and
Turbulence in Hydraulic Jumps." Environmental Fluid Mechanics, Vol. 9, No. 2, pp. 143-159.
MURZYN, F., MOUAZE, D., and CHAPLIN, J.R. (2005). "Optical Fibre Probe Measurements of
Bubbly Flow in Hydraulic Jumps" International Journal of Multiphase Flow, Vol. 31, No. 1, pp.
141-154.
MURZYN, F., MOUAZE, D., and CHAPLIN, J.R. (2007). "Air-Water Interface Dynamic and Free
Surface Features in Hydraulic Jumps." Journal of Hydraulic Research, IAHR, Vol. 45, No. 5, pp.
679-685.
RAJARATNAM, N. (1962). "An Experimental Study of Air Entrainment Characteristics of the
Hydraulic Jump." Journal of Instruction Engineering India, Vol. 42, No. 7, March, pp. 247-273.
RAJARATNAM, N. (1965). "The Hydraulic Jump as a Wall Jet." Jl of Hyd. Div., ASCE, Vol. 91,
No. HY5, pp. 107-132.
RAJARATNAM, N. (1967). "Hydraulic Jumps." Advances in Hydroscience, Ed. V.T. CHOW,
Academic Press, New York, USA, Vol. 4, pp. 197-280.
RESCH, F.J., and LEUTHEUSSER, H.J. (1972). "Le Ressaut Hydraulique: mesure de Turbulence
dans la Région Diphasique." ('The Hydraulic Jump: Turbulence Measurements in the Two-Phase
Flow Region.') Journal La Houille Blanche, No. 4, pp. 279-293 (in French).
ZHANG, G.F., WANG, H. and CHANSON, H. (2013). "Turbulence and Aeration in Hydraulic
Jumps: Free-Surface Fluctuation and Integral Turbulent Scale Measurements." Environmental Fluid
Mechanics, DOI 10.1007/s10652-012-9254-3. (in print)

WANG, H., and CHANSON, H. (2015). "Air Entrainment and Turbulent Fluctuations in Hydraulic Jumps." Urban Water Journal, Vol. 12, No. 6, pp. 502-518 (DOI: 10.1080/1573062X.2013.847464) (ISSN 1573-062X (Print), 1744-9006 (Online)).
List of table captions
Table 1. Experimental flow conditions.
Table 2. Characteristic frequency Ranges of free-surface fluctuations and jump toe oscillations
measured with acoustic displacement meters at channel centreline.
List of figure captions
Figure 1. Hydraulic jump in a man-made water supply channel in Nov. 2010.
Figure 2. Figure 2. Sketch of the experimental hydraulic jump.
Figure 3. Experimental setups – (A, top) Free-surface measurements (Series 2); (B, bottom)
Simultaneous free-surface and air-water flow measurements (Series 3)
Figure 4. Conjugate depths and roller length of hydraulic jumps. Comparison with the solution of
the momentum equation (1), and empirical correlations of HAGER et al. (1990) and MURZYN et
al. (2007) for the roller length.
Figure 5. Time-averaged free-surface profiles – (A, top) Dimensionless free-surface profiles at the
centreline; (B, bottom) Self-similar free-surface profiles within the roller length – comparison with
Equation (2) and the correlation curve of CHANSON (2011).
Figure 6. Instantaneous fluctuations of free-surface profile – flow conditions: Q = 0.0352 m3/s, d1 =
0.0326 m, x1 = 1.25 m, Fr1 = 3.8, Re = 7.0×10⁴.
Figure 7. Free-surface fluctuations – (A, top) Dimensionless standard deviation of free-surface
profile fluctuations; (B, bottom) Maximum free-surface fluctuations as a function of inflow Froude
number – Comparison with MOUAZE et al. (2005), KUCUKALI and CHANSON (2008) and
MURZYN and CHANSON (2009).
Figure 8. Power spectrum density function of acoustic displacement meter signals – Flow
conditions: Q = 0.0461 m3/s, d1 = 0.0322 m, x1 = 1.25 m, x-x1 = 0.4 m, Fr1 = 5.1, Re = 9.2×10⁴.

WANG, H., and CHANSON, H. (2015). "Air Entrainment and Turbulent Fluctuations in Hydraulic Jumps." Urban Water Journal, Vol. 12, No. 6, pp. 502-518 (DOI: 10.1080/1573062X.2013.847464) (ISSN 1573-062X (Print), 1744-9006 (Online)).
Figure 9. Dimensionless characteristic free-surface fluctuation frequencies as functions of inflow
Froude number – (A, top) Dominant frequencies; (B, bottom) Secondary frequencies.
Figure 10. Ratio of wave celerity in free-surface to inflow velocity – Comparison with the average
advection velocity of large scale vortices in the roller from ZHANG et al. (2013) and CHANSON
(2010).
Figure 11. Video frames of hydraulic jump toe position in side view.
Figure 12. Time-variation of the instantaneous relative jump toe position.
Figure 13. Dimensionless characteristic frequencies of jump toe oscillations – Comparison with
visual observation results of ZHANG et al. (2013), CHANSON (2005, 2010), MURZYN and
CHANSON (2009) and CHACHEREAU and CHANSON (2011) – (A, top) Dimensionless jump
toe oscillation frequencies as functions of inflow Froude number; (B, bottom) Dimensionless jump
toe oscillation frequencies as functions of Reynolds number.
Figure 14. Simultaneous free-surface deformations in horizontal and vertical directions – (A, top)
Relative maximum cross-correlation coefficient between the signals of horizontal and vertical
displacement meters; (B, bottom) Sketch of surface deformation patterns.
Figure 15. Vertical distributions of basic air-water flow properties – Flow conditions: Q = 0.0347
m3/s, d1 = 0.0206 m, x1 = 0.83 m, Fr1 = 7.5, Re = 6.8×10⁴ – (A, top) Void fraction; (B, bottom)
Dimensionless bubble count rate.
Figure 16. Interfacial velocity distribution together with Prandtl-Pitot tube data – (A, top) Typical
interfacial velocity profile; (B, bottom) Velocity distribution through the jump roller.
Figure 17. Entrapped air flux in jump roller.
Figure 18. Post-processed signals for simultaneous free-surface and void fraction measurements –
Flow conditions: Q = 0.0463 m3s, d1 = 0.0322 m, x1 = 1.25 m, Fr1 = 5.1, Re = 9.2×10⁴, x-x1 = 0.125
m, y = 0.040 m.
Figure 19. Maximum cross-correlation coefficients and time-averaged void fraction distributions –
Flow conditions: Q = 0.0463 m3s, d1 = 0.0322 m, x1 = 1.25 m, Fr1 = 5.1, Re = 9.2×10⁴ – (A, top) x-
x1 = 0.125 m; (B, bottom) x-x1 = 0.25 m.

WANG, H., and CHANSON, H. (2015). "Air Entrainment and Turbulent Fluctuations in Hydraulic Jumps." Urban Water Journal, Vol. 12, No. 6, pp. 502-518 (DOI: 10.1080/1573062X.2013.847464) (ISSN 1573-062X (Print), 1744-9006 (Online)).
Figure 20. Sketches of free-surface deformations – (A, top) void fraction measured in recirculation
region; (B, middle) void fraction measured in middle shear layer; (C, bottom) void fraction
measured in lower shear layer.
WANG, H., and CHANSON, H. (2015). "Air Entrainment and Turbulent Fluctuations in Hydraulic Jumps." Urban Water Journal, Vol. 12, No. 6, pp. 502-518 (DOI: 10.1080/1573062X.2013.847464) (ISSN 1573-062X (Print), 1744-9006 (Online)).
Table 1. Experimental flow conditions
Ref. Q h x1 d1 Fr1 Re Instrumentation (m3/s) (m) (m) (m)
MURZYN & CHANSON
(2009)
0.020 to
0.042
0.018 0.75 0.018 5.1 to 11.2
4.0×10⁴ to
8.3×10⁴
1. Acoustic displacement meters (vertically placed) 2- Phase-detection probe
CHACHEREAU & CHANSON
(2011)
0.020 to
0.065
0.036 1.50 0.039 to 0.044
1.35 to 5.1
3.9×10⁴ to
1.3×10⁵
1. Acoustic displacement meters (vertically placed) 2- Phase-detection probe
ZHANG et al. (2013)
0.018 to
0.050
0.024 0.25 to 1.50
0.024 to 0.028
2.6 to 8.9
3.6×10⁴ to
1.0×10⁵
Phase-detection probes
Present study Series 1 0.0179 0.020 0.83 0.0206 3.8 3.5×10⁴
0.0239 0.0209 5.1 4.8×10⁴
0.0347 0.0206 7.5 6.8×10⁴
0.0397 0.0208 8.5 8.0×10⁴
0.0473 0.021 10.0 9.5×10⁴
0.0352 0.030 1.25 0.0326 3.8 7.0×10⁴
0.0461 0.0322 5.1 9.2×10⁴
0.0709 0.033 7.5 1.41×10⁵
0.0820 0.054 1.25 0.057 3.8 1.62×10⁵
1. Acoustic displacement meters (vertically placed) 2. Phase-detection probe
Series 2 0.0160 0.012 0.5 0.012 5.1 2.1×10⁴
0.0179 0.020 0.83 0.0206 3.8 3.5×10⁴
0.0239 0.0209 5.1 4.8×10⁴
0.0356 0.0209 7.5 6.8×10⁴
0.0397 0.0208 8.5 8.0×10⁴
0.0368 0.026 1.083 0.0277 5.1 7.4×10⁴
0.0463 0.030 1.25 0.0322 5.1 9.2×10⁴
0.0552 0.034 1.417 0.0363 5.1 1.10×10⁵
0.0689 0.040 1.667 0.042 5.1 1.37×10⁵
0.0815 0.045 1.875 0.047 5.1 1.63×10⁵
Acoustic displacement meters (horizontally and vertically placed)
Series 3 0.0244 0.020 0.83 0.0206 5.1 4.7×10⁴
0.0463 0.030 1.25 0.0322 5.1 9.2×10⁴
0.0701 0.040 1.25 0.0425 5.1 1.4×10⁵
Acoustic displacement meters together with phase-detection probe
Note: Q: flow rate; h: sluice opening; x1: longitudinal jump toe position; d1: inflow depth; Fr1:
inflow Froude number; Re: Reynolds number.

WANG, H., and CHANSON, H. (2015). "Air Entrainment and Turbulent Fluctuations in Hydraulic Jumps." Urban Water Journal, Vol. 12, No. 6, pp. 502-518 (DOI: 10.1080/1573062X.2013.847464) (ISSN 1573-062X (Print), 1744-9006 (Online)).
Table 2. Characteristic frequency ranges of free-surface fluctuations and jump toe oscillations
measured with acoustic displacement meters at channel centreline (Present study)
Parameter Dominant frequency Secondary frequency (Hz) (Hz)
Free-surface fluctuation (Ffs) 1.2 – 3.5 0.5 – 1.2 Jump toe oscillation (Ftoe) 0.5 – 1.3 0.8 – 2.6
WANG, H., and CHANSON, H. (2015). "Air Entrainment and Turbulent Fluctuations in Hydraulic Jumps." Urban Water Journal, Vol. 12, No. 6, pp. 502-518 (DOI: 10.1080/1573062X.2013.847464) (ISSN 1573-062X (Print), 1744-9006 (Online)).
Figure 1. Hydraulic jump in a man-made water supply channel on 10 November 2010
Figure 2. Sketch of the experimental hydraulic jump
WANG, H., and CHANSON, H. (2015). "Air Entrainment and Turbulent Fluctuations in Hydraulic Jumps." Urban Water Journal, Vol. 12, No. 6, pp. 502-518 (DOI: 10.1080/1573062X.2013.847464) (ISSN 1573-062X (Print), 1744-9006 (Online)).
(A) Free-surface measurements
(B) Simultaneous free-surface and air-water flow measurements
Figure 3. Experimental setups – (A, top) Free-surface measurements (Series 2); (B, bottom)
Simultaneous free-surface and air-water flow measurements (Series 3)

WANG, H., and CHANSON, H. (2015). "Air Entrainment and Turbulent Fluctuations in Hydraulic Jumps." Urban Water Journal, Vol. 12, No. 6, pp. 502-518 (DOI: 10.1080/1573062X.2013.847464) (ISSN 1573-062X (Print), 1744-9006 (Online)).
Fr1
d 2/d
1
L r/d
13 4 5 6 7 8 9 10 11
0 0
3 20
6 40
9 60
12 80
15 100d2/d1, present studyEquation (1)Lr/d1, present studyMurzyn et al (2007)Hager et al (1990)
Figure 4. Conjugate depths and roller length of hydraulic jumps. Comparison with the solution of
the momentum equation (1), and empirical correlations of HAGER et al. (1990) and MURZYN et
al. (2007) for the roller length.

WANG, H., and CHANSON, H. (2015). "Air Entrainment and Turbulent Fluctuations in Hydraulic Jumps." Urban Water Journal, Vol. 12, No. 6, pp. 502-518 (DOI: 10.1080/1573062X.2013.847464) (ISSN 1573-062X (Print), 1744-9006 (Online)).
(x-x1)/d1
/d 1
-5 0 5 10 15 20 25 300
1
2
3
4
5
6
7
8
9
10
11
12
13Fr1 = 3.8, Re = 3.5104
Fr1 = 5.1, Re = 4.8104
Fr1 = 7.5, Re = 6.8104
Fr1 = 8.5, Re = 8.0104
Fr1 = 10.0, Re = 9.5104
Fr1 = 3.8, Re = 7.0104
Fr1 = 5.1, Re = 9.2104
Fr1 = 7.5, Re = 1.4105
Fr1 = 3.8, Re = 1.6105
(A) Dimensionless free-surface profiles at the centreline
(x-x1)/Lr
(-d
1)/
(d2-d
1)
0 0.1 0.2 0.3 0.4 0.5 0.6 0.7 0.8 0.9 10
0.1
0.2
0.3
0.4
0.5
0.6
0.7
0.8
0.9
1Presented dataPoint gage dataEquation (2)CHANSON (2011)
(B) Self-similar free-surface profiles within the roller length
Figure 5. Time-averaged free-surface profiles – (A, top) Dimensionless free-surface profiles at the
centreline; (B, bottom) Self-similar free-surface profiles within the roller length – comparison with
Equation (2) and the correlation curve of CHANSON (2011)

WANG, H., and CHANSON, H. (2015). "Air Entrainment and Turbulent Fluctuations in Hydraulic Jumps." Urban Water Journal, Vol. 12, No. 6, pp. 502-518 (DOI: 10.1080/1573062X.2013.847464) (ISSN 1573-062X (Print), 1744-9006 (Online)).
Figure 6. Instantaneous fluctuations of free-surface profile – flow conditions: Q = 0.0352 m3/s, d1 =
0.0326 m, x1 = 1.25 m, Fr1 = 3.8, Re = 7.0×10⁴

WANG, H., and CHANSON, H. (2015). "Air Entrainment and Turbulent Fluctuations in Hydraulic Jumps." Urban Water Journal, Vol. 12, No. 6, pp. 502-518 (DOI: 10.1080/1573062X.2013.847464) (ISSN 1573-062X (Print), 1744-9006 (Online)).
(x-x1)/Lr
'/d
1
-0.5 0 0.5 1 1.5 2 2.50
0.2
0.4
0.6
0.8
1
1.2
1.4
1.6Fr1 = 3.8, Re = 3.5104
Fr1 = 5.1, Re = 4.8104
Fr1 = 7.5, Re = 6.8104
Fr1 = 8.5, Re = 8.0104
Fr1 = 10.0, Re = 9.5104
Fr1 = 3.8, Re = 7.0104
Fr1 = 5.1, Re = 9.2104
Fr1 = 7.5, Re = 1.4105
Fr1 = 3.8, Re = 1.6105
(A) Dimensionless standard deviation of free-surface profile fluctuations
Fr1
'm
ax/d
1
1 2 3 4 5 6 7 8 9 10 110
0.3
0.6
0.9
1.2
1.5Present studyMURZYN & CHANSON (2009)KUCUKALI & CHANSON (2008)Mouaze et al (2005)
(B, bottom) Maximum free-surface fluctuations as a function of inflow Froude number
Figure 7. Free-surface fluctuations – (A, top) Dimensionless standard deviation of free-surface
profile fluctuations; (B, bottom) Maximum free-surface fluctuations as a function of inflow Froude
number – comparison with MOUAZE et al. (2005), KUCUKALI and CHANSON (2008) and
MURZYN and CHANSON (2009)

WANG, H., and CHANSON, H. (2015). "Air Entrainment and Turbulent Fluctuations in Hydraulic Jumps." Urban Water Journal, Vol. 12, No. 6, pp. 502-518 (DOI: 10.1080/1573062X.2013.847464) (ISSN 1573-062X (Print), 1744-9006 (Online)).
Figure 8. Power spectrum density function of acoustic displacement meter signals – Flow
conditions: Q = 0.0461 m3/s, d1 = 0.0322 m, x1 = 1.25 m, x-x1 = 0.4 m, Fr1 = 5.1, Re = 9.2×10⁴
WANG, H., and CHANSON, H. (2015). "Air Entrainment and Turbulent Fluctuations in Hydraulic Jumps." Urban Water Journal, Vol. 12, No. 6, pp. 502-518 (DOI: 10.1080/1573062X.2013.847464) (ISSN 1573-062X (Print), 1744-9006 (Online)).
(A) Dominant free-surface fluctuation frequencies
(B) Secondary free-surface fluctuation frequencies
Figure 9. Dimensionless characteristic free-surface fluctuation frequencies as functions of inflow
Froude number – (A, top) Dominant frequencies; (B, bottom) Secondary frequencies
WANG, H., and CHANSON, H. (2015). "Air Entrainment and Turbulent Fluctuations in Hydraulic Jumps." Urban Water Journal, Vol. 12, No. 6, pp. 502-518 (DOI: 10.1080/1573062X.2013.847464) (ISSN 1573-062X (Print), 1744-9006 (Online)).
Figure 10. Ratio of wave celerity in free-surface to inflow velocity – Comparison with the average
advection velocity of large scale vortices in the roller from ZHANG et al. (2013) and CHANSON
(2010)

WANG, H., and CHANSON, H. (2015). "Air Entrainment and Turbulent Fluctuations in Hydraulic Jumps." Urban Water Journal, Vol. 12, No. 6, pp. 502-518 (DOI: 10.1080/1573062X.2013.847464) (ISSN 1573-062X (Print), 1744-9006 (Online)).
Figure 11. Video frames of hydraulic jump toe position in side view
Figure 12. Time-variation of the instantaneous relative jump toe position

WANG, H., and CHANSON, H. (2015). "Air Entrainment and Turbulent Fluctuations in Hydraulic Jumps." Urban Water Journal, Vol. 12, No. 6, pp. 502-518 (DOI: 10.1080/1573062X.2013.847464) (ISSN 1573-062X (Print), 1744-9006 (Online)).
(A, top) Dimensionless frequencies as functions of inflow Froude number
(B) Dimensionless frequencies as functions of Reynolds number
Figure 13. Dimensionless characteristic frequencies of jump toe oscillations – Comparison with
visual observation results of ZHANG et al. (2013), CHANSON (2005, 2010), MURZYN and
CHANSON (2009) and CHACHEREAU and CHANSON (2011) – (A, top) Dimensionless
frequencies as functions of inflow Froude number; (B, bottom) Dimensionless frequencies as
functions of Reynolds number
WANG, H., and CHANSON, H. (2015). "Air Entrainment and Turbulent Fluctuations in Hydraulic Jumps." Urban Water Journal, Vol. 12, No. 6, pp. 502-518 (DOI: 10.1080/1573062X.2013.847464) (ISSN 1573-062X (Print), 1744-9006 (Online)).
(A) Relative maximum cross-correlation coefficient between the signals of horizontal and vertical
displacement meters
(B) Sketch of surface deformation patterns
Figure 14. Simultaneous free-surface deformations in horizontal and vertical directions – (A, top)
Relative maximum cross-correlation coefficient between the signals of horizontal and vertical
displacement meters; (B, bottom) Sketch of surface deformation patterns

WANG, H., and CHANSON, H. (2015). "Air Entrainment and Turbulent Fluctuations in Hydraulic Jumps." Urban Water Journal, Vol. 12, No. 6, pp. 502-518 (DOI: 10.1080/1573062X.2013.847464) (ISSN 1573-062X (Print), 1744-9006 (Online)).
(A) Void fraction distributions
(B) Dimensionless bubble count rate distributions
Figure 15. Vertical distributions of basic air-water flow properties – Flow conditions: Q = 0.0347
m3/s, d1 = 0.0206 m, x1 = 0.83 m, Fr1 = 7.5, Re = 6.8×10⁴ – (A, top) Void fraction; (B, bottom)
Dimensionless bubble count rate
WANG, H., and CHANSON, H. (2015). "Air Entrainment and Turbulent Fluctuations in Hydraulic Jumps." Urban Water Journal, Vol. 12, No. 6, pp. 502-518 (DOI: 10.1080/1573062X.2013.847464) (ISSN 1573-062X (Print), 1744-9006 (Online)).
(A) Typical interfacial velocity profile – Flow conditions: Q = 0.0378 m3s, d1 = 0.020 m, x1 = 0.83
m, x-x1 = 0.25 m, Fr1 = 8.5, Re = 7.5×10⁴
(B) Velocity distribution through the jump roller – Flow conditions: Q = 0.0333 m3s, d1 = 0.020 m,
x1 = 0.83 m, Fr1 = 7.5, Re = 6.6×10⁴
Figure 16. Interfacial velocity distribution together with Prandtl-Pitot tube data – (A, top) Typical
interfacial velocity profile; (B, bottom) Velocity distribution through the jump roller
WANG, H., and CHANSON, H. (2015). "Air Entrainment and Turbulent Fluctuations in Hydraulic Jumps." Urban Water Journal, Vol. 12, No. 6, pp. 502-518 (DOI: 10.1080/1573062X.2013.847464) (ISSN 1573-062X (Print), 1744-9006 (Online)).
(x-x1)/Lr
q ent
/(Q
/W)
0 0.1 0.2 0.3 0.4 0.5 0.6-0.8
-0.6
-0.4
-0.2
0
0.2
0.4
0.6
0.8
0 0.1 0.2 0.3 0.4 0.5 0.6-0.8
-0.6
-0.4
-0.2
0
0.2
0.4
0.6
0.8Fr1 = 7.5, Re = 6.8104
Fr1 = 8.5, Re = 8.0104
Fr1 = 10.0, Re = 9.5104
Fr1 = 5.1, Re = 9.2104
Fr1 = 7.5, Re = 1.4105
Equation (16a)Equation (16b)
Figure 17. Entrapped air flux in jump roller
Figure 18. Post-processed signals for simultaneous free-surface and void fraction measurements –
Flow conditions: Q = 0.0463 m3s, d1 = 0.0322 m, x1 = 1.25 m, Fr1 = 5.1, Re = 9.2×10⁴, x-x1 = 0.125
m, y = 0.040 m
WANG, H., and CHANSON, H. (2015). "Air Entrainment and Turbulent Fluctuations in Hydraulic Jumps." Urban Water Journal, Vol. 12, No. 6, pp. 502-518 (DOI: 10.1080/1573062X.2013.847464) (ISSN 1573-062X (Print), 1744-9006 (Online)).
(A) x-x1 = 0.125 m
(B) x-x1 = 0.25 m
Figure 19. Maximum cross-correlation coefficients and time-averaged void fraction distributions –
Flow conditions: Q = 0.0463 m3s, d1 = 0.0322 m, x1 = 1.25 m, Fr1 = 5.1, Re = 9.2×10⁴ – (A, top) x-
x1 = 0.125 m; (B, bottom) x-x1 = 0.25 m

WANG, H., and CHANSON, H. (2015). "Air Entrainment and Turbulent Fluctuations in Hydraulic Jumps." Urban Water Journal, Vol. 12, No. 6, pp. 502-518 (DOI: 10.1080/1573062X.2013.847464) (ISSN 1573-062X (Print), 1744-9006 (Online)).
Figure 20. Sketches of free-surface deformations – (A, top) void fraction measured in recirculation
region; (B, middle) void fraction measured in middle shear layer; (C, bottom) void fraction
measured in lower shear layer