air pollution and environmental health threats in southern ... · christine loh. china environment...
TRANSCRIPT

Christine LohChina Environment Forum, Woodrow Wilson Center
13 February 2007
Air Pollution and Environmental Health Threats in Southern China

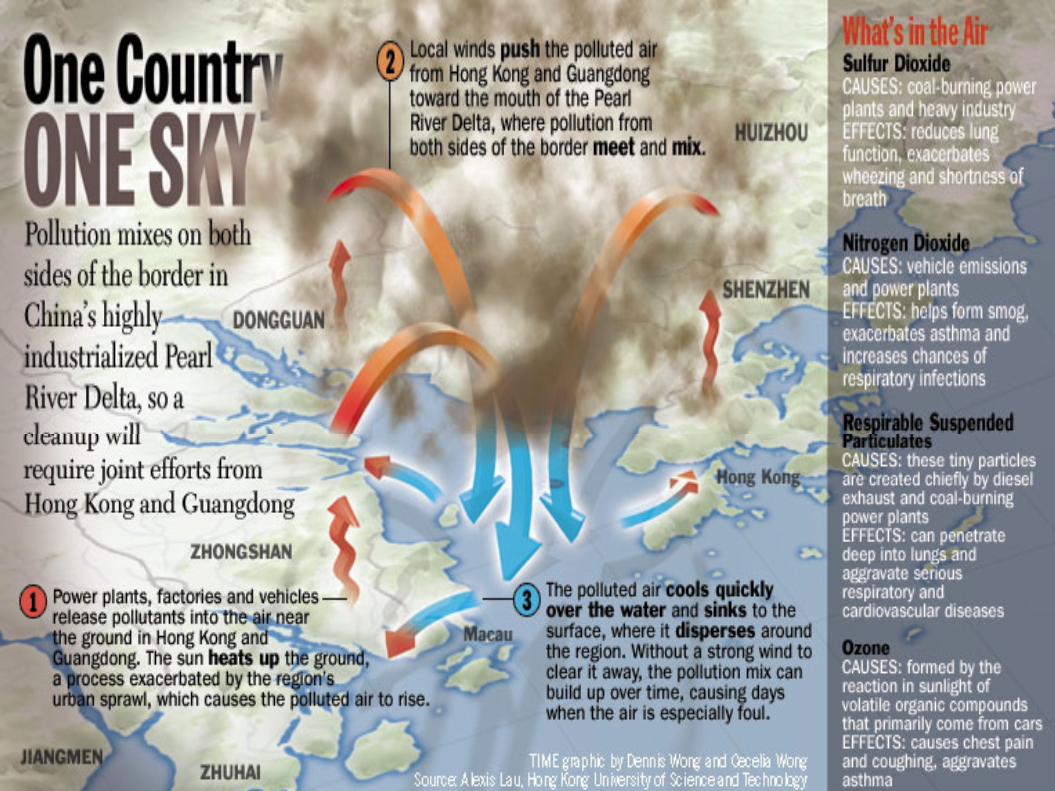
Rapid UrbanisationHong Kong & the Pearl River Delta
1979 2004

Urban land sea-breeze circulation leads to
enhanced trapping of pollutants over PRD
Percentage contribution
for HK
Regional
sources
HK
sources
Ambient
PM~ 80% ~ 20%

Emissions: PRD and Hong Kong (1997)
-
100
200
300
400
500
600
VOC RSP NOx SO2
Pollutant
kilo
tonn
es
PRDEZ
HKSAR
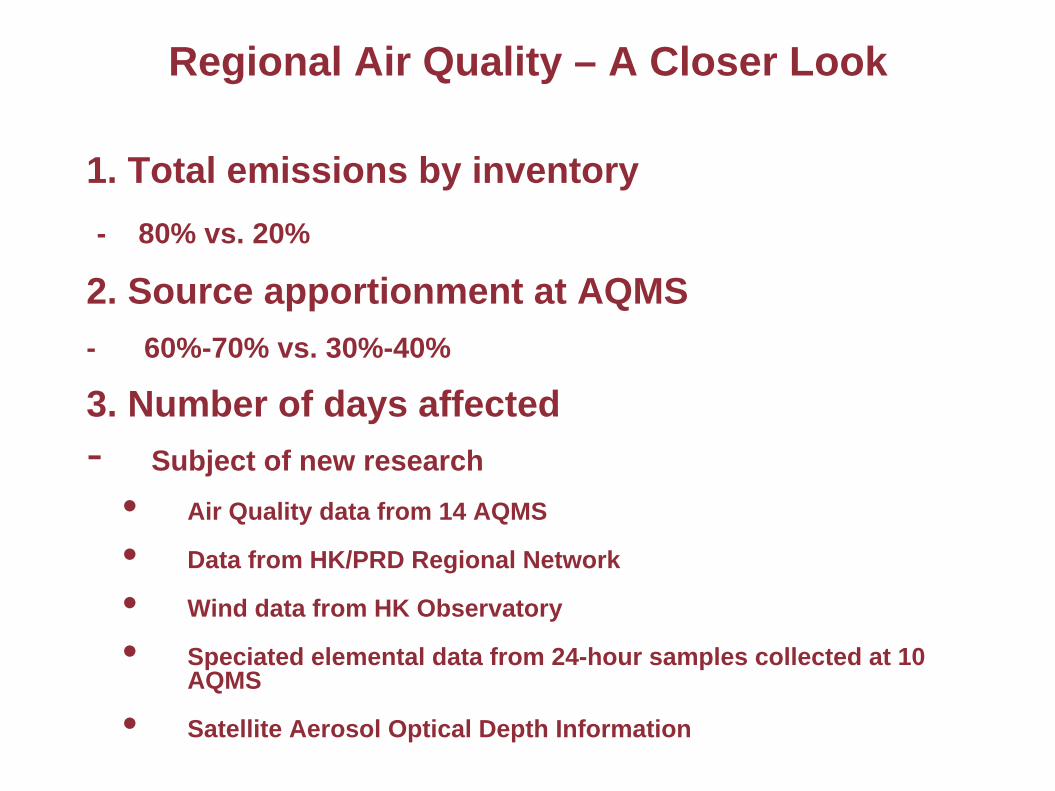
Regional Air Quality – A Closer Look
1. Total emissions by inventory- 80% vs. 20%
2. Source apportionment at AQMS- 60%-70% vs. 30%-40%
3. Number of days affected- Subject of new research
• Air Quality data from 14 AQMS
• Data from HK/PRD Regional Network
• Wind data from HK Observatory
• Speciated elemental data from 24-hour samples collected at 10 AQMS
• Satellite Aerosol Optical Depth Information
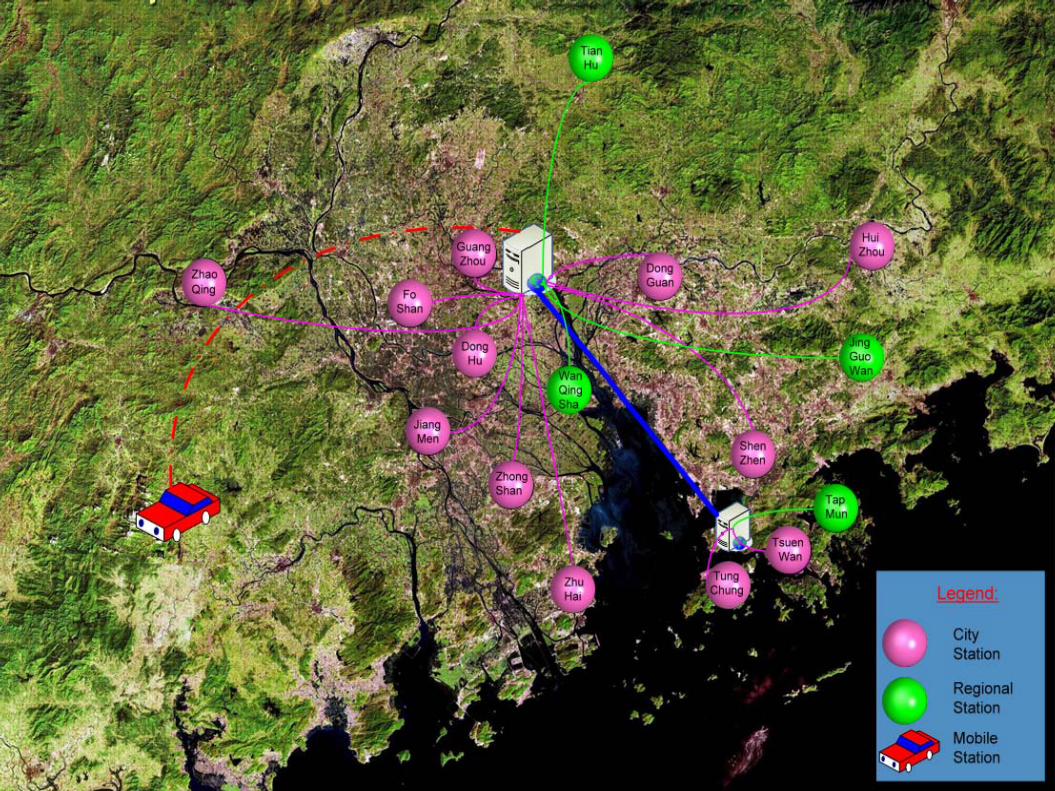
珠珠三三角角區區域空域空氣氣監監測測網網 絡絡

SO2


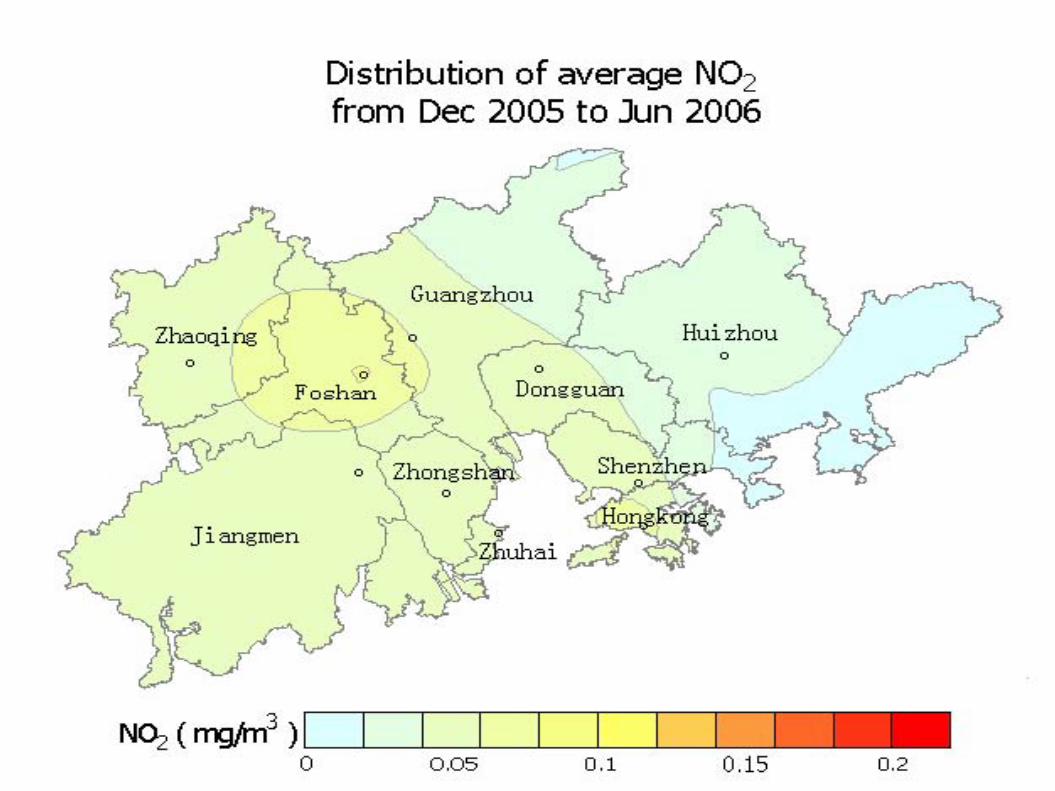
NO2

PM10


Ozone
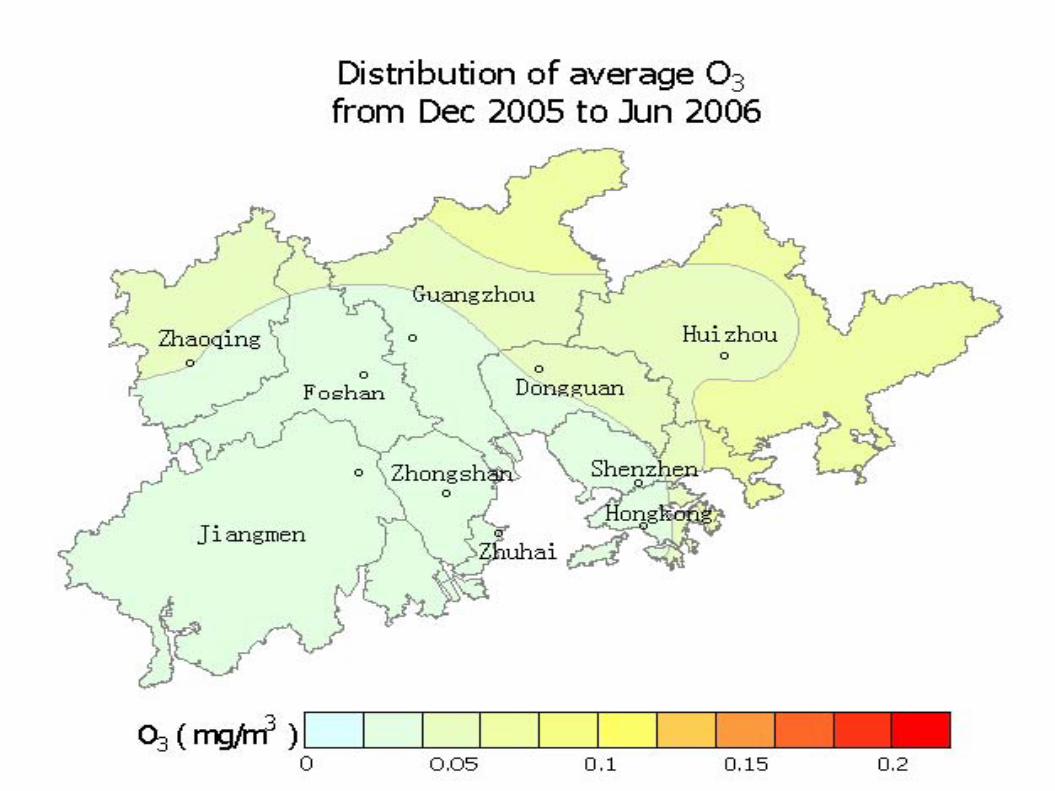
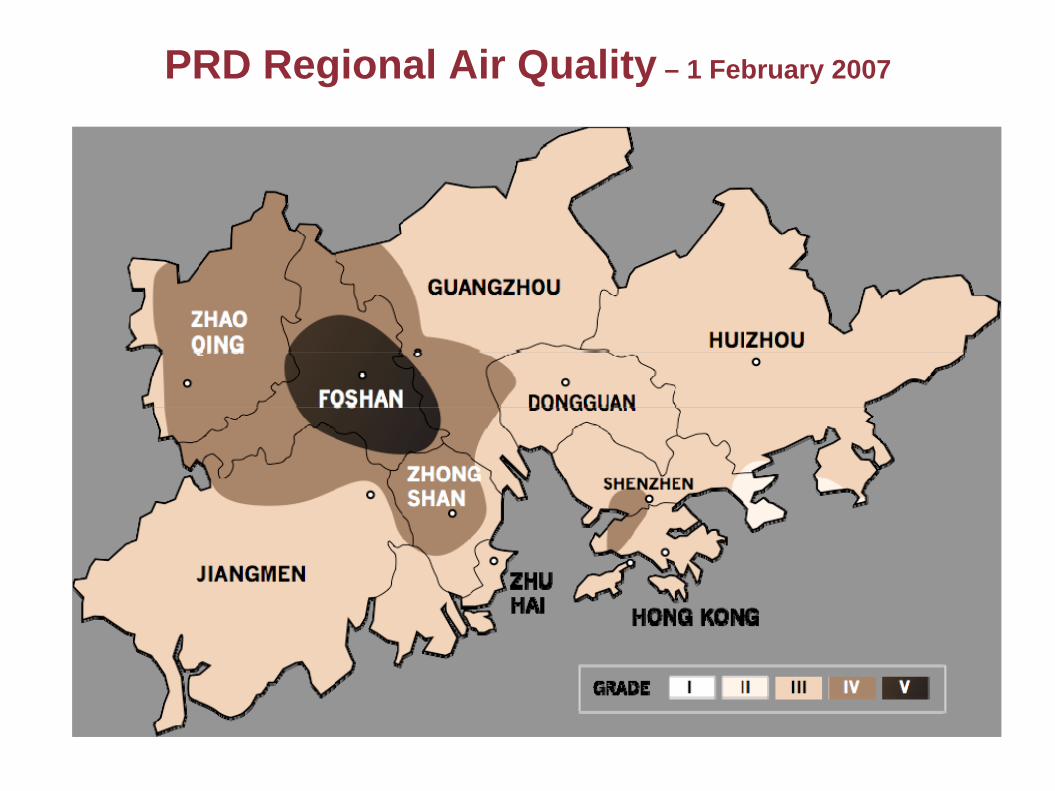
PRD Regional Air Quality – 1 February 2007

Sunday 1 August 2004 Sunday 18 July 2004 Friday 23 July 2004
Tuesday 4 January 2005 Wednesday 20 April 2005 Thursday 16 September 2004
What a Difference … good vs. bad days

Hazy Days per month (1977-2005)

Hong Kong and Shenzhen combined have the largest number of
marine movements in a small space
Ranking of Container Ports of the World


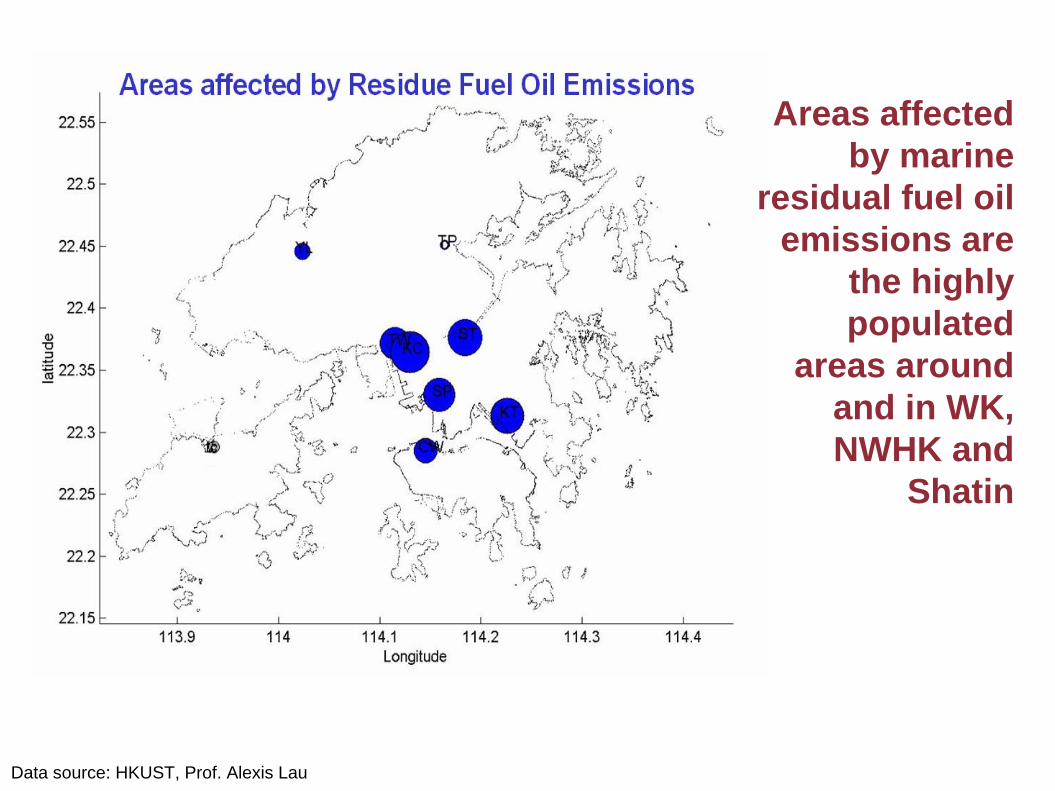
Areas affected by marine
residual fuel oil emissions are
the highly populated
areas around and in WK, NWHK and
Shatin
Data source: HKUST, Prof. Alexis Lau

PRD Regional Air Quality – 1 February 2007

City Planning Impact

Air Pollution and Health Risks
O3
RSPNO2
SO2
ExcessHealthRisks
$$$

WHO Air Quality Guidelines Released October 5th 2006
Department of Community Medicine, School of Public Health, Hong Kong University
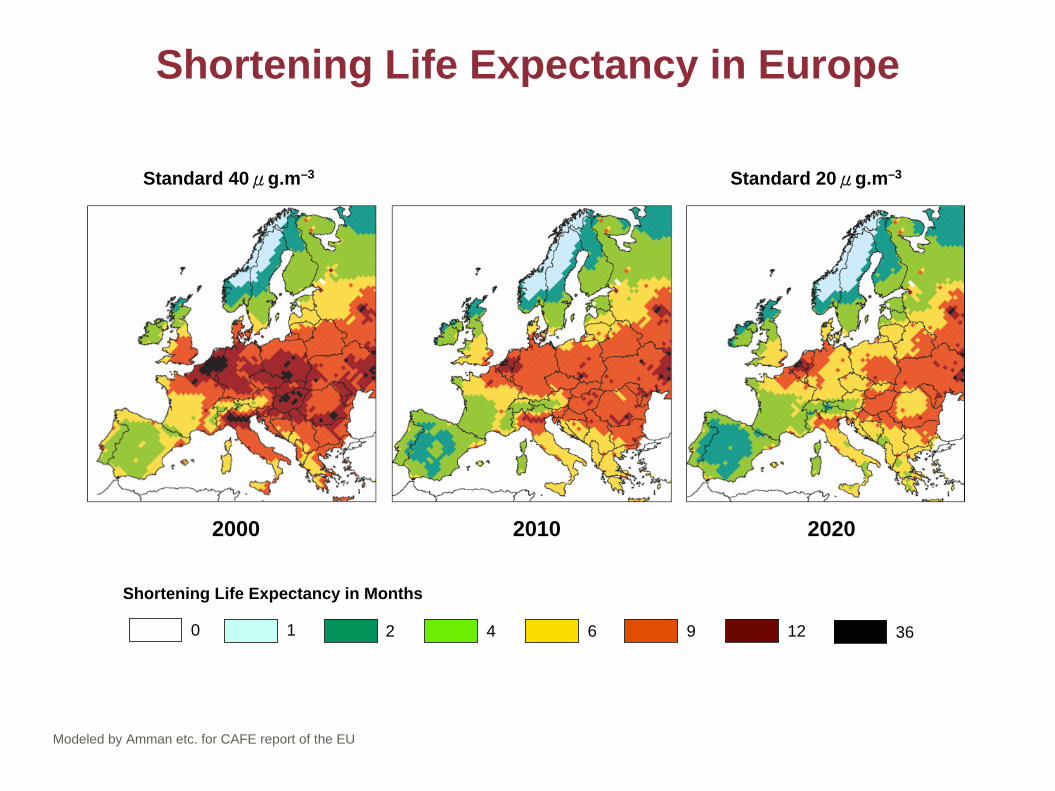
Shortening Life Expectancy in Europe
Modeled by Amman etc. for CAFE report of the EU
2000 2010 2020
Standard 40μg.m–3 Standard 20μg.m–3
Shortening Life Expectancy in Months
0 1 2 4 6 9 12 36

Air Quality Standards Compared (WHO/China /HK)

Air Quality Standards (WHO/HKAQO)

New Air Pollution Index needed

Hong Kong needs: New Air Pollution IndexA low API of “25” is very unusual in Hong Kong – but is it a good indicator of health protection?
Difference in pollutants from WHO
API 25PM10 28 µg/m3 (32% higher)
SO2 40 µg/m3 (100% higher)
Annual avoidable health impact of API 25
ExcessDoctor Visits
Excess Hospital Admissions Deaths
PM10 659,015 3,690 61
SO2 341,563 19,274 867
Total 959,590 20,651 824

SO2 Monthly Concentration (2001-2005)C
once
ntra
tion
(μg/
m3
Proposed WHO (24hr) = 20Hong Kong AQO (annual) = 80
RoadsideGeneral010
2030
40
Jan01 Jan02 Jan03 Jan04 Jan05
AQO
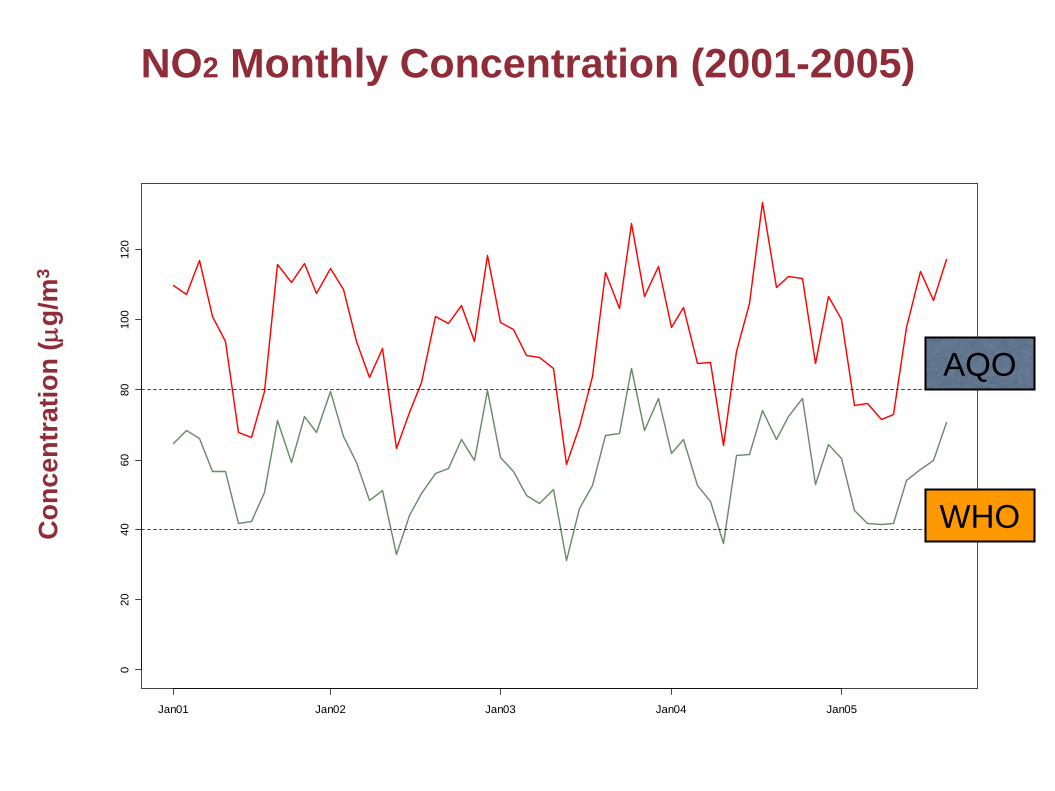
NO2 Monthly Concentration (2001-2005)C
once
ntra
tion
(μg/
m3
Proposed WHO (annual) = 40
Hong Kong AQO (annual) = 80
RoadsideGeneral
020
4060
8010
012
0
Jan01 Jan02 Jan03 Jan04 Jan05
AQO
WHO

Monthly concentration of PM10 (2001-2005)
Where should we be for health protection?

AIR QUALITY … better vs. worse
(microgram per cubic meter)Pollution (RSP)
0
20
40
60
80
100
Vancouver 2004 (13)
Shanghai, Guangzhou 2004 (99)
London 2005 (30)
Paris 2003 (21)New York 2003 (22)
Los Angeles 2003 (44)
Hong Kong 2004 (62)
Hong Kong AQO
WHO AQG

Avoidable Health Risks with Air Quality Improvement
Source: Department of Community Medicine, School of Public Health, University of Hong Kong
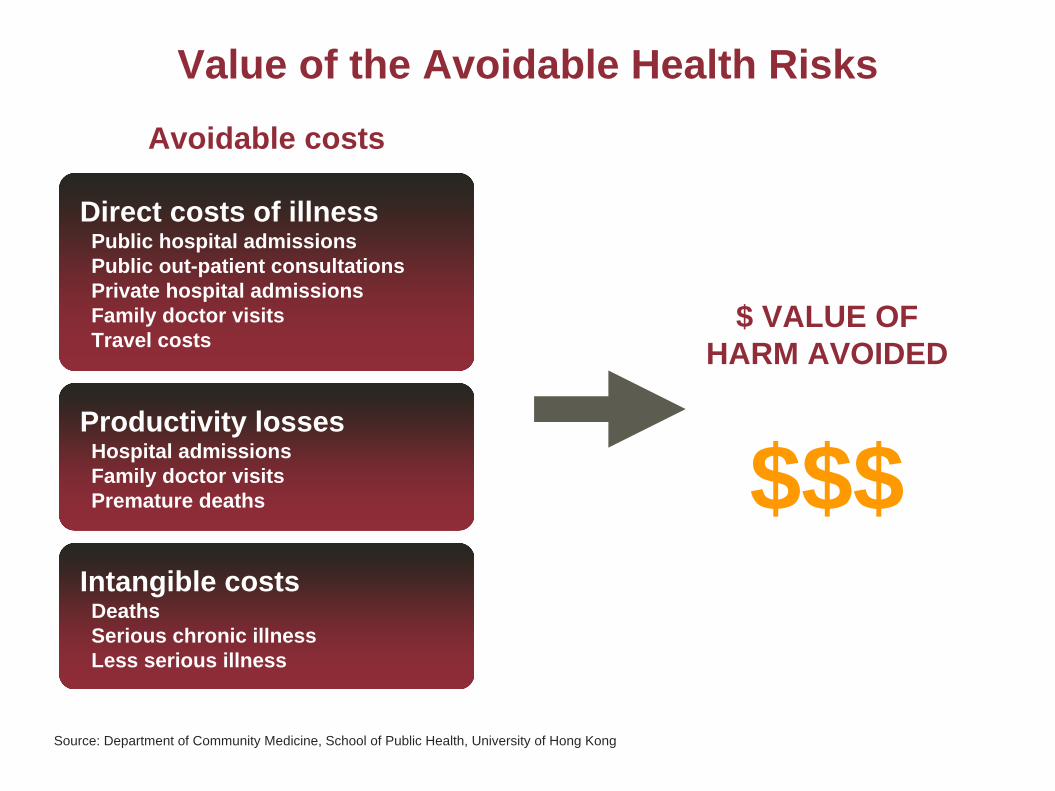
Value of the Avoidable Health RisksAvoidable costs
Direct costs of illnessPublic hospital admissionsPublic out-patient consultationsPrivate hospital admissionsFamily doctor visitsTravel costs
Productivity lossesHospital admissionsFamily doctor visitsPremature deaths
Intangible costsDeathsSerious chronic illnessLess serious illness
$$$
$ VALUE OFHARM AVOIDED
Source: Department of Community Medicine, School of Public Health, University of Hong Kong
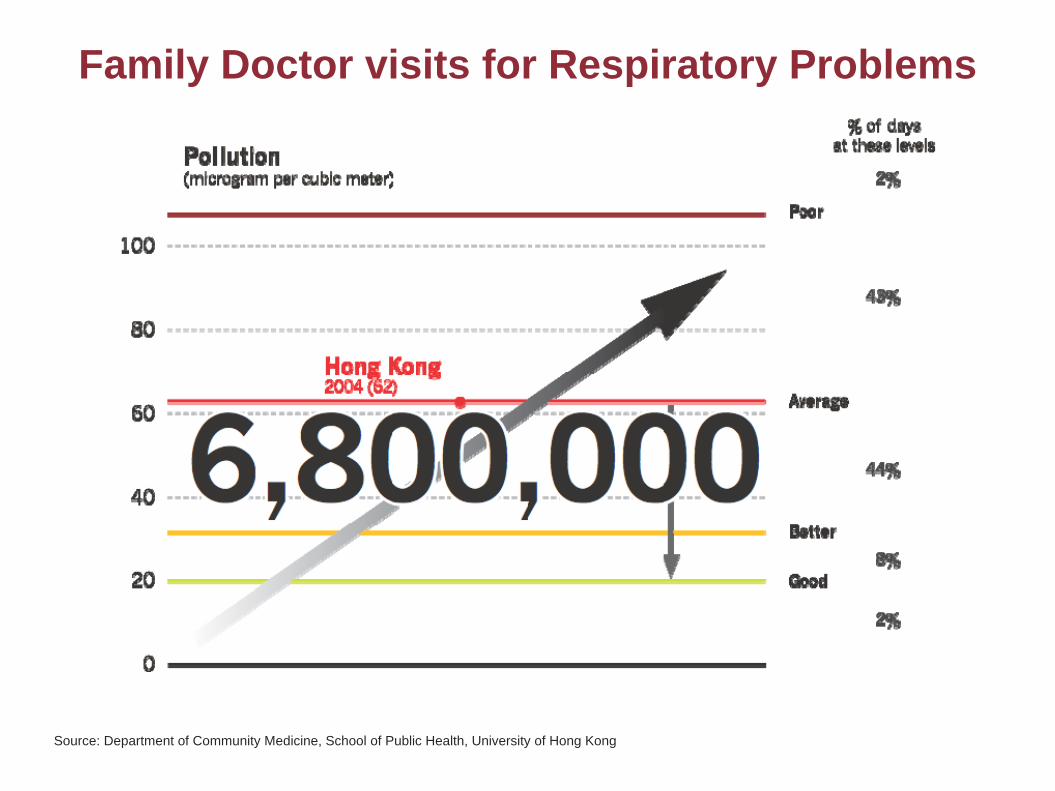
Family Doctor visits for Respiratory Problems
Source: Department of Community Medicine, School of Public Health, University of Hong Kong

Hospital Beds-days Avoided
Source: Department of Community Medicine, School of Public Health, University of Hong Kong

Deaths Avoided
Source: Department of Community Medicine, School of Public Health, University of Hong Kong

$ Benefits of Air Quality Improvement
Source: Department of Community Medicine, School of Public Health, University of Hong Kong
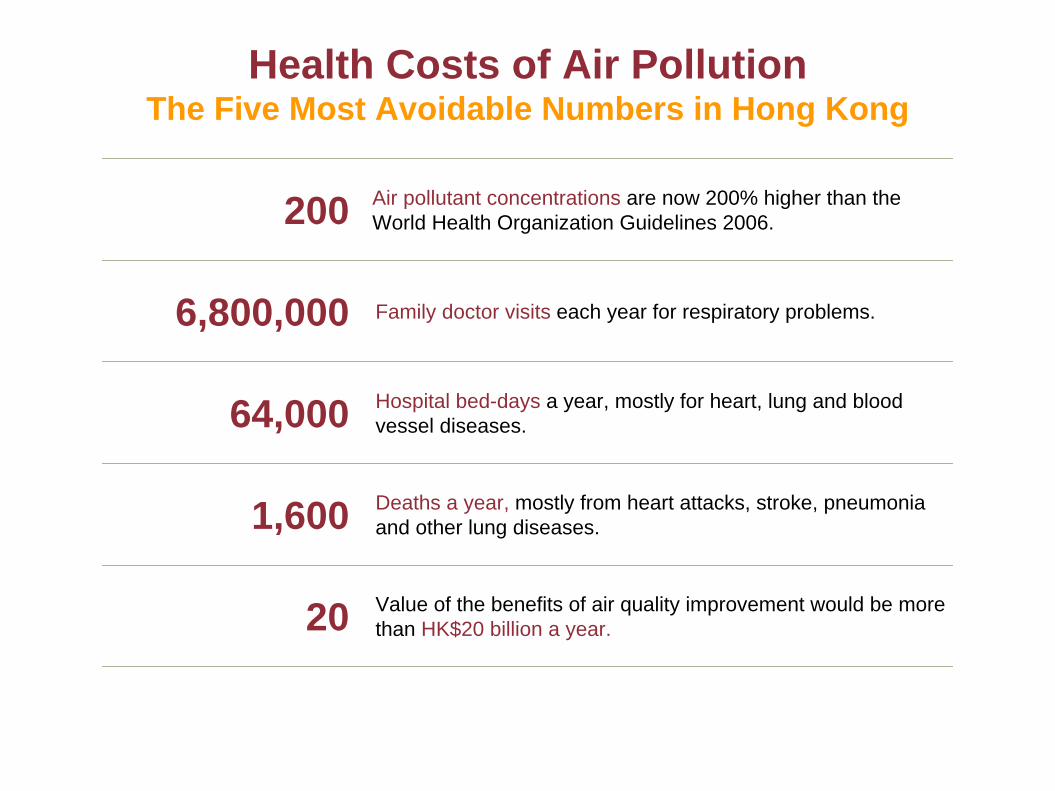
Health Costs of Air PollutionThe Five Most Avoidable Numbers in Hong Kong
200 Air pollutant concentrations are now 200% higher than the World Health Organization Guidelines 2006.
6,800,000 Family doctor visits each year for respiratory problems.
64,000 Hospital bed-days a year, mostly for heart, lung and blood vessel diseases.
1,600 Deaths a year, mostly from heart attacks, stroke, pneumonia and other lung diseases.
20 Value of the benefits of air quality improvement would be more than HK$20 billion a year.

Air Pollutant Concentrations (1988-1995)Half yearly mean level

Reduction in Heart & Lung Disease DeathsAfter 1990 Sulphur Restriction

Some key issues ...
• Hong Kong air quality is poor and is a threat to health.
• Air Quality Objectives (AQOs) should be set at levels that protect public health.
• Current guidelines are inadequate and misleading.
• WHO Air Quality Guidelines (2006) are based on the best scientific information available today and should be adopted in Hong Kong.

View from the Top
“In fact the air is not all that bad … [it] is not inferior to Washington DC … By Asian standards … we are better than Seoul, any of the Mainland cities … better than Taipei … slightly behind Singapore [and] behind Tokyo … I am sure we are going to meet whatever [WHO] standards they put up”.
Donald Tsang said in May 2006 ...
Donald Tsang said in November 2006
“We have the most environmentally friendly place for people, for executives, for Hong Kong people, to live”.

Economy is being affected
“Skilled professionals are departing Hong Kong because of this. More will follow ... Singapore stands to be a major beneficiary and the investment response is clear. Buy (shares in) Singapore office landlords, sell Hong Kong office landlords.”
Merrill Lynch warns 2006 ...
ECA Adapt Rankings 2005/06
SINGAPORE: No. 1 in Asia
HONG KONG: 32 SHANGHAI: 89 BEIJING: 106(down 12 places since 04/05) (down 2 places since 04/05) (down 5 places since 04/05)

HONG KONG-PRD NEED ACOMPREHENSIVE PLAN
Transport andUrban Planning
Shipping andPort Operations
Manufacturing andCleaner Fuels
Photo: Mat Hampson
Power Generation and Demand Management
Market MechanismsTax and Emissions Trading

Civic Exchange Comprehensive AQM Plan 2006

Hong Kong Policy Priorities
• Review and tighten air quality guidelines• Adopt integrated energy policy
• Install FGD equipment in all power plants• Push energy efficiency• Replace old vehicles quickly• Require adding biodiesel at border for trucks• Priortise rail and coordinate bus service and other road usage• Manage density to reduce “street canyon effect”• Operate clean ports and logistics
Create policy drivers to effect change:
Other measures from sharpening policy drivers:
Photo: Steve Cadman

Regional Policy Priorities
TRANSPORTUse cleaner fuels, newer
buses and extend rail
MANUFACTURINGUse cleaner fuels,energy efficiency
POWERClose smaller plants,
improve efficiency andreduce emissions
PORTSUse cleaner fuels onships, vehicles and
equipment
INFORMATIONSustain joint air
monitoringand release full emissions data
COOPERATIONBuild cross-border
planning & regulatory framework, increase
capacity in air management, pilot emissions trading
Photo: Poagao

Super Regional TrendsParticulates Pollution in China (2000)
Courtesy: HKUST, Institute for the Environment

Super Regional TrendsParticulates Pollution in China (2005)
Courtesy: HKUST, Institute for the Environment

What about climate change?
For full report, seewww.civic-exchange.org

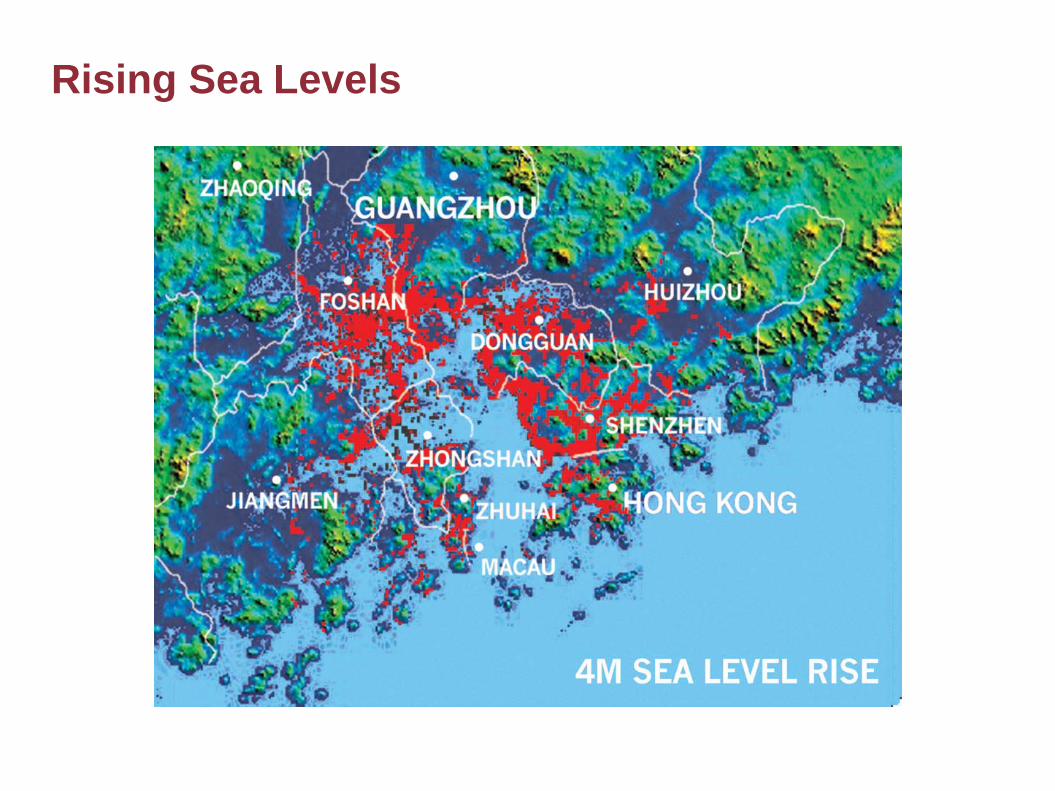
Impact of Climate Change: Rising Sea Levels
Courtesy: HKUST, Institute for the Environment

Rising Sea Levels

Rising Sea Levels
Rising Sea Levels

Rising Sea Levels

Erratic Rainfall
