air pollution and the respiratory system - burning issues
TRANSCRIPT

Air Pollution and the respiratory
system
It matters who breathes it and where and you breathe,
perhaps more than what you
breathe

Mexico City, 2001


The Center for Atmospheric Particle Studies

State of the Air: 2008 ALA, Short-term particle air pollution
• #1 Pittsburgh#2 Los Angeles#3 Fresno#4 Bakersfield#5 Birmingham#6 Logan#7 Salt Lake City#8 Sacramento#9 Detroit#10 D.C./Baltimore

ALA most polluted cities 2009
• #1 Pittsburgh#2 Fresno#3 Bakersfield#4 Los Angeles#5 Birmingham#6 Salt Lake City#7 Sacramento#8 Logan#9 Detroit#9 Chicago

3-hour (1)0.5 ppm(1300 µg/m3)
Annual (Arithmetic Mean)
0.03 ppmSulfur Dioxide
Same as Primary1-hour (8)
(Applies only in limited areas)
0.12 ppm
Same as Primary 8-hour (7)0.08 ppm (1997 std)
Same as Primary 8-hour (6)0.075 ppm (2008 std) Ozone
Same as Primary24-hour (5)35 µg/m3
Same as PrimaryAnnual (4)
(Arithmetic Mean)15.0 µg/m3Particulate
Matter (PM2.5)
Same as Primary24-hour (3)150 µg/m3Particulate Matter (PM10)
Same as PrimaryAnnual (Arithmetic Mean)
0.053 ppm(100 µg/m3)
Nitrogen Dioxide
Same as PrimaryQuarterly Average1.5 µg/m3
Same as PrimaryRolling 3-Month Average0.15 µg/m3 (2)Lead
1-hour (1)35 ppm(40 mg/m3)
None
8-hour (1)9 ppm(10 mg/m3)
Carbon Monoxide
Averaging Time
LevelAveraging TimeLevelPollutant
Secondary StandardsPrimary Standards
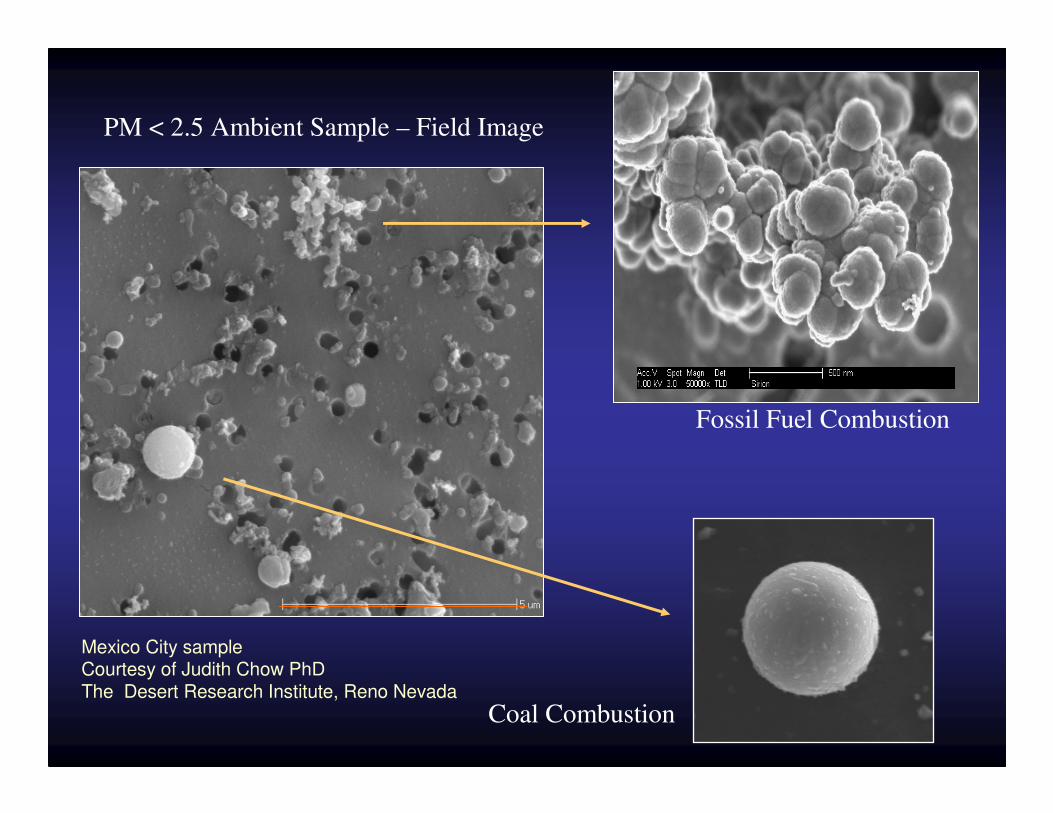
PM < 2.5 Ambient Sample – Field Image
Coal Combustion
Fossil Fuel Combustion
Mexico City sample Courtesy of Judith Chow PhD The Desert Research Institute, Reno Nevada

AHA, Particulate Matter and Cardiovascular Disease, Circulation

Dockery and Pope NEJM, January 22, 2009


Things we know
• Increase frequency and severity of respiratory symptoms
• Increased healthcare utilization
– Hospitalizations
– Emergency room visits
– Loss of work/school days
– Increased rates of lower and upper respiratory
tract infections
– Increased mortality rates

Things we have recently learned
• Mechanisms
– Airway inflammation
– Chronic effects
– Asthma incidence
– Susceptibility: Genetic and individual factors
• Traffic, the only threshold?
• Reducing the exposure, reducing the health burden

Air pollution concentration
RISK
In epidemiologic studies of air pollution levels and health outcomes, there are no
thresholds!
NAAQS

PM2.5 exposure – relative risk relationship
Pope et al, JAMA 2002

Proximity from the exposure source (Major road, highway)
RISK
In epidemiologic studies of traffic-related emissions and health outcomes, there may
be a threshold!
Closer Further
50 ±meters?

Near the road, particle exposure is unique
JAMWA, Sept 2002

PM2.5 dispersion from a major road
At 100 m distance from the avenue, PM2.5 levels decreased by
9.5 microg/m3 (40.6%) when compared to median levels registered on the avenue. The results showed a highly significant negative correlation between PM2.5 measurements and the distance from the avenue (r=-0.70, n=20 and p=0.0005).
Cortez Lugo et al. Salud Publica Mex. 2004 Nov-Dec;46(6):534-7.

Passage of Inhaled Particles Into Human
CirculationInhaled ultrafine
particles PM <
1.0 µm
99mTc-labeled
Radioactivity
was detectedin blood at 1
minute
Tmax between 10
and 20 minutes maintained 60
minsCirculation. 2002;105:411-414.

Atlanta: Black Carbon DataMay 27-29, 2002
0
1000
2000
3000
4000
5000
6000
7000
09
:30
11
:10
12
:50
14
:30
16
:10
17
:50
19
:30
21
:10
22
:50
00
:30
02
:10
03
:50
05
:30
07
:10
08
:50
10
:30
12
:10
13
:50
15
:30
17
:10
18
:50
20
:30
22
:10
23
:50
01
:30
03
:10
04
:50
06
:30
08
:10
Time
Co
nc
en
tra
tio
n (
ng
/m3
)
Smoky truck
in front of bus
Bus Ride
Activity
Lunch

PM
2.5
(µg/m
3)
Time
0.0
10.0
20.0
30.0
40.0
50.0
60.0
7:01
7:03
7:05
7:07
7:09
7:11
7:13
7:15
7:17
7:19
7:21
7:23
7:25
7:27
7:29
7:31
7:33
7:35
7:37
7:39
7:41
7:43
7:45
7:47
7:49
7:51
7:53
7:55
7:57
7:59
PM
2.5
(µg/m
3)
Time
0.0
10.0
20.0
30.0
40.0
50.0
60.0
7:01
7:03
7:05
7:07
7:09
7:11
7:13
7:15
7:17
7:19
7:21
7:23
7:25
7:27
7:29
7:31
7:33
7:35
7:37
7:39
7:41
7:43
7:45
7:47
7:49
7:51
7:53
7:55
7:57
7:59
Figure 1.
Behind truck
Windows closed
Figure 1, for example, shows typical results from an hour-
long commute (7am–8am), (mean in-vehicle PM2.5: 27 mg/m3; maximum: 49 mg/m3; concurrent ambient PM2.5: 11.7 mg/m3).


McCreanor J et al. N Engl J Med 2007;357:2348-2358
Mean Percent Changes in FEV1 and FVC during and after Exposure on Oxford Street and in Hyde Park


Schools
Houses
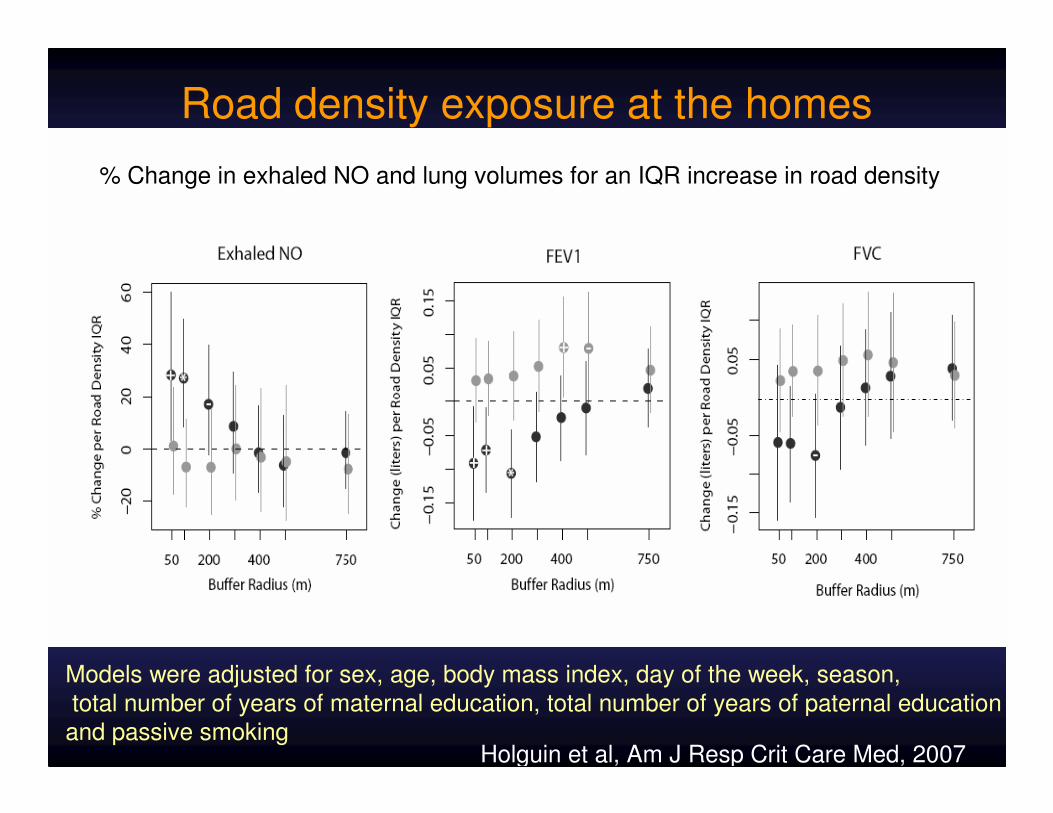
Models were adjusted for sex, age, body mass index, day of the week, season,
total number of years of maternal education, total number of years of paternal education and passive smoking
Road density exposure at the homes
% Change in exhaled NO and lung volumes for an IQR increase in road density
Holguin et al, Am J Resp Crit Care Med, 2007

Linear trend for road density exposure at the homes
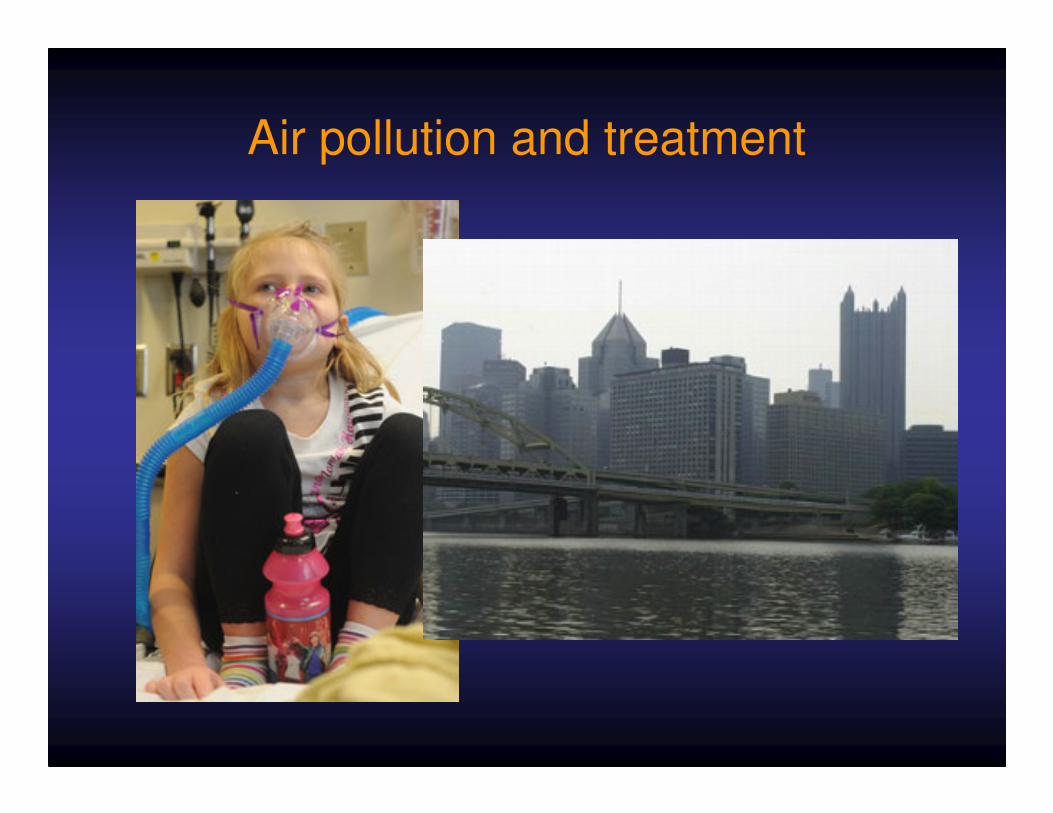
Air pollution and treatment

Association between 10 ppb increase in NO2
with FEV1% response to SABA
The models were adjusted for: gender, pets at home in the last 12 months, presence of mold in the home and maximum temperature. Open Squares: FEV1, dark squares: FVC
Hernandez – Cadena et al, Chest 2009FVC FEV1
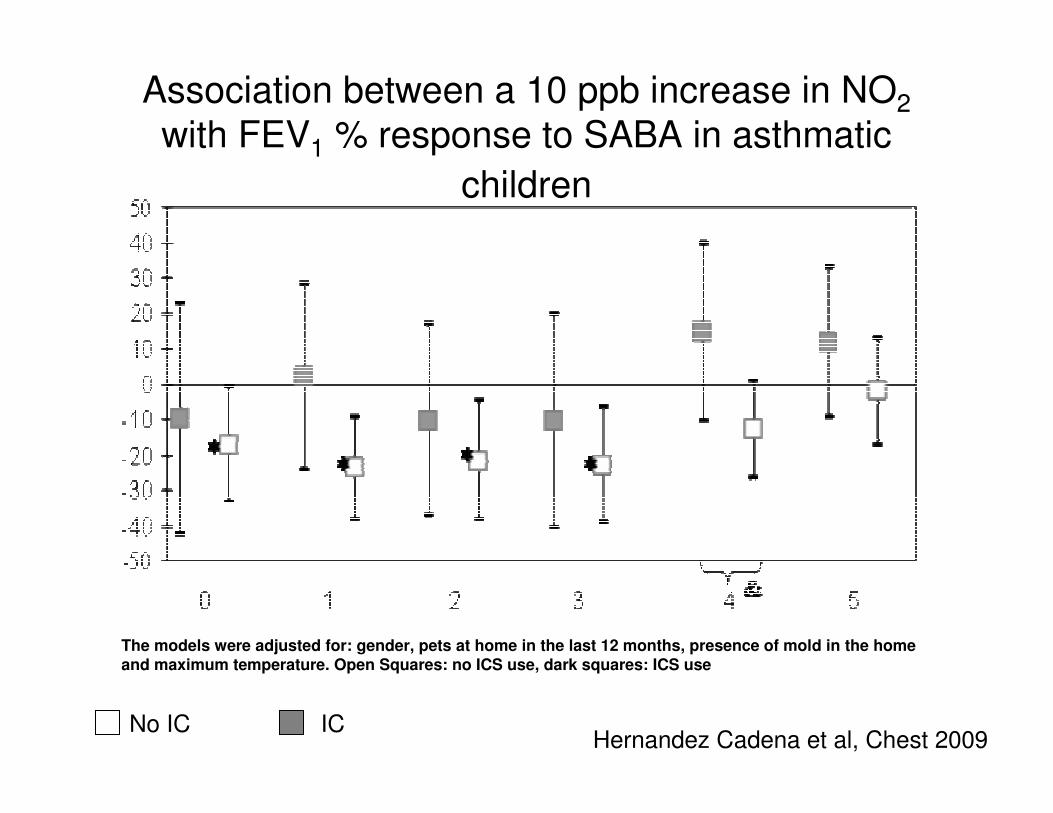
Association between a 10 ppb increase in NO2
with FEV1 % response to SABA in asthmatic
children
The models were adjusted for: gender, pets at home in the last 12 months, presence of mold in the home and maximum temperature. Open Squares: no ICS use, dark squares: ICS use
Hernandez Cadena et al, Chest 2009No IC IC

Long term consequences

McConnell, Lancet 2002

Gauderman W et al. N Engl J Med 2004;351:1057-1067
Community-Specific Proportion of 18-Year-Olds with a FEV1 below 80 Percent of the Predicted Value Plotted against the Average Levels of Pollutants from 1994 through 2000

Gauderman W et al. N Engl J Med 2004;351:1057-1067
Community-Specific Average Growth in FEV1 among Girls and Boys During the Eight-Year Period from 1993 to 2001 Plotted against Average Nitrogen Dioxide (NO2) Levels from 1994
through 2000

Lung growth from most to least polluted

Environmental health is complex
The National Children’s Health study. http://www.nationalchildrensstudy.gov/

SES and susceptibility to exposures
Mary O’ Neill, EHP, 2006


Asthma, chronic NO2 exposure and
violence
Environmental Health Perspectives

What if we reduce emissions?

Freeman, M JAMA 2001

Less pollution, less asthma morbidity
Freeman, M. JAMA 2001

Reduced Exposure to PM10 and AttenuatedAge-Related Decline in Lung Function
Exposure on 9651 SAPALDIA participants. Estimates on the annual PM10
individual home outdoor exposureNEJM, 2007
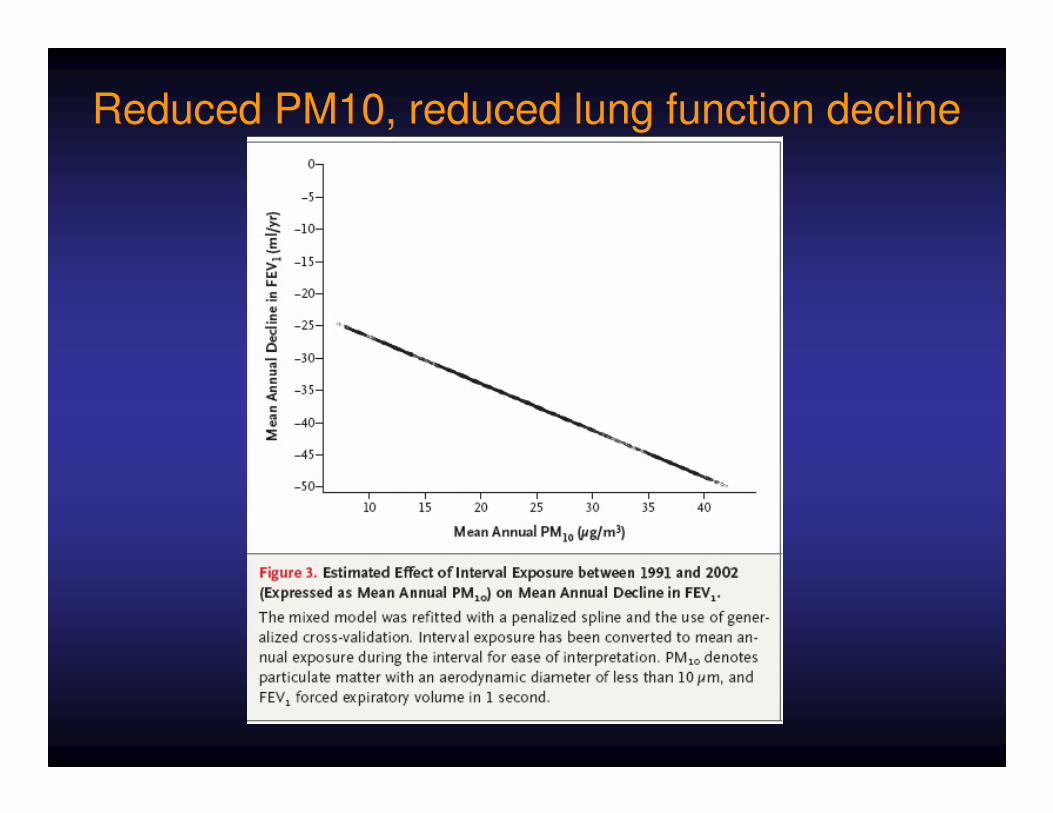
Reduced PM10, reduced lung function decline

A reduction of 10 µg per cubic meter in PM2.5 was associated with an increased
life expectancy of 0.95±0.57 for the least-polluted areas and 0.57±0.26 year for other areas


Asthma cohort study
Woodland Hills andBraddock – Liberty Borough Draw from schools and clinics
Incident (ISAAC screen) and prevalent asthma cases
Exposures:Outdoor air pollution
ETSPsychosocial Factors
Nutrition
Asthma Severity Asthma Burden (Morbidity)
Co-morbidities: Obesity, nutrition (Vitamin D), Psychosocial Factors


Allegheny County Health Department http://www.achd.net/air/pubs/pdf/4q07aqreport.pdf


US Steel Proposes $1B Investment In Clairton PlantU.S. Steel is set to announce a major capital investment at Clairton Coke Works
Reuters, 2007


Collaborators & Partners
• CMU Civil Engineering – Center for Atmospheric Particles
• Robotics CMU, CREATE Laboratory
• Department of Psychology CMU and University of Pittsburgh
• Allegheny County Health Department
• G.A.S.P.
• S.H.I.P.
• CMH, University of Pittsburgh
• Heinz Foundation
