air pollution: home or away?
TRANSCRIPT
HIA of air pollution episode - Helen Macintyre 1

UK Air Pollution Episode
March-April 2014.
2 HIA of air pollution episode - Helen Macintyre
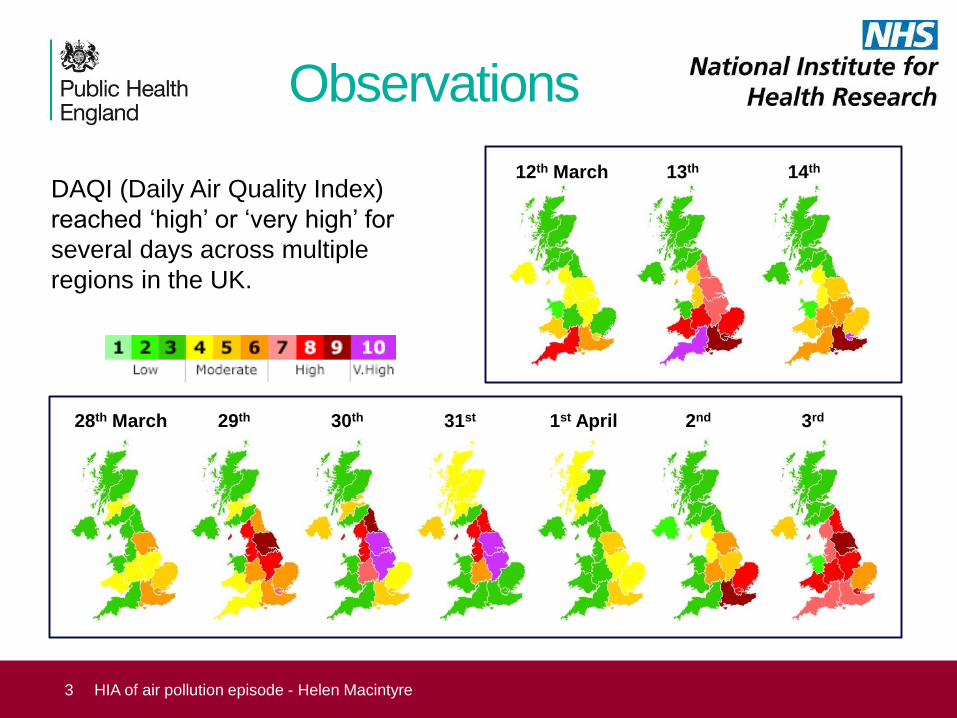
Observations
3 HIA of air pollution episode - Helen Macintyre
DAQI (Daily Air Quality Index)
reached ‘high’ or ‘very high’ for
several days across multiple
regions in the UK.
12th March 14th 13th
28th March 29th 1st April 30th 31st 2nd 3rd

Observations
4 HIA of air pollution episode - Helen Macintyre
PM2.5 levels reached over 80 µg m-3 at some urban background sites.
Daily mean PM2.5 levels from Jan – Jun show springtime peaks (2011-15) at urban
background sites.
Observed daily mean PM2.5 at an urban background site during January-June from 2011 to 2015 inclusive. (Data form AURN via Defra website)
0
10
20
30
40
50
60
70
80
01-Jan 31-Jan 01-Mar 31-Mar 30-Apr 30-May 29-Jun
PM
2.5
Daily M
ean
(µ
g m
-3)
London N. Kensington 2011
2012
2013
2014
2015
DAQI = 4:
‘Moderate’.
health effects
at 36 µg m-3

Mortality (all-cause)
• Analysed 12th – 14th March and 28th March – 3rd April.
• Total of 604 deaths brought forward due to short-term exposure to PM2.5 summed across the UK.
• Estimate that 302 of these would be expected due to more typical levels of PM2.5 (based on available measurements from urban background sites).
• Estimate a two-fold increase in mortality attributable to short-term exposure to PM2.5.
5 HIA of air pollution episode - Helen Macintyre
Observed daily mean PM2.5 at an urban background site during January-June
from 2012 to 2015 inclusive. (Data form AURN via Defra website)

6


Figure 3
8


10
Saharan Dust Storm Carried North towards UK 29th March 2014

London Bloomsbury make up of PM2.5 and PM10
11

12
3500
4000
4500
5000
5500
6000
01
/03
/201
402
/03
/201
403
/03
/201
404
/03
/201
405
/03
/201
406
/03
/201
407
/03
/201
40
8/0
3/2
01
409
/03
/201
41
0/0
3/2
01
411
/03
/201
412
/03
/201
413
/03
/201
414
/03
/201
415
/03
/201
416
/03
/201
417
/03
/201
418
/03
/201
419
/03
/201
420
/03
/201
421
/03
/201
422
/03
/201
423
/03
/201
424
/03
/201
425
/03
/201
426
/03
/201
427
/03
/201
428
/03
/201
429
/03
/201
430
/03
/201
431
/03
/201
401
/04
/201
402
/04
/201
403
/04
/201
404
/04
/201
405
/04
/201
406
/04
/201
407
/04
/201
408
/04
/201
409
/04
/201
410
/04
/201
411
/04
/201
41
2/0
4/2
01
413
/04
/201
41
4/0
4/2
01
415
/04
/201
416
/04
/201
417
/04
/201
418
/04
/201
419
/04
/201
420
/04
/201
421
/04
/201
422
/04
/201
423
/04
/201
424
/04
/201
425
/04
/201
426
/04
/201
427
/04
/201
428
/04
/201
429
/04
/201
430
/04
/201
4
Daily T
ota
l o
f 999 C
alls
LAS Daily Total Number of 999 Calls March-April 2014

13
1000
1050
1100
1150
1200
1250
1300
1350
1400
1450
1500
01
/03
/201
402
/03
/201
403
/03
/201
404
/03
/201
405
/03
/201
406
/03
/201
407
/03
/201
408
/03
/201
409
/03
/201
410
/03
/201
411
/03
/201
412
/03
/201
413
/03
/201
414
/03
/201
415
/03
/201
416
/03
/201
417
/03
/201
418
/03
/201
419
/03
/201
420
/03
/201
421
/03
/201
422
/03
/201
423
/03
/201
424
/03
/201
425
/03
/201
426
/03
/201
427
/03
/201
428
/03
/201
429
/03
/201
430
/03
/201
431
/03
/201
401
/04
/201
402
/04
/201
403
/04
/201
404
/04
/201
405
/04
/201
406
/04
/201
407
/04
/201
408
/04
/201
409
/04
/201
410
/04
/201
411
/04
/201
412
/04
/201
413
/04
/201
414
/04
/201
415
/04
/201
416
/04
/201
417
/04
/201
418
/04
/201
419
/04
/201
420
/04
/201
421
/04
/201
422
/04
/201
423
/04
/201
424
/04
/201
425
/04
/201
426
/04
/201
427
/04
/201
428
/04
/201
429
/04
/201
430
/04
/201
4
Daily C
atA
In
cid
en
ts
LAS Daily Number of CatA Incidents March-April 2014

14
50.00%
55.00%
60.00%
65.00%
70.00%
75.00%
80.00%
85.00%
90.00%
95.00%
01
/03
/201
402
/03
/201
403
/03
/201
404
/03
/201
405
/03
/201
406
/03
/201
407
/03
/201
408
/03
/201
409
/03
/201
410
/03
/201
411
/03
/201
412
/03
/201
413
/03
/201
414
/03
/201
415
/03
/201
41
6/0
3/2
01
417
/03
/201
418
/03
/201
419
/03
/201
420
/03
/201
421
/03
/201
422
/03
/201
423
/03
/201
424
/03
/201
425
/03
/201
426
/03
/201
427
/03
/201
428
/03
/201
429
/03
/201
430
/03
/201
431
/03
/201
401
/04
/201
402
/04
/201
403
/04
/201
404
/04
/201
405
/04
/201
406
/04
/201
407
/04
/201
408
/04
/201
409
/04
/201
41
0/0
4/2
01
411
/04
/201
412
/04
/201
413
/04
/201
414
/04
/201
415
/04
/201
416
/04
/201
417
/04
/201
418
/04
/201
419
/04
/201
420
/04
/201
421
/04
/201
422
/04
/201
423
/04
/201
424
/04
/201
425
/04
/201
426
/04
/201
427
/04
/201
428
/04
/201
429
/04
/201
430
/04
/201
4
LAS Daily % CatA Incidents Attended Within 8 Minutes

50
100
150
200
250
300
350
400
01
/03
/201
40
2/0
3/2
01
403
/03
/201
404
/03
/201
405
/03
/201
406
/03
/201
407
/03
/201
408
/03
/201
409
/03
/201
410
/03
/201
411
/03
/201
412
/03
/201
413
/03
/201
414
/03
/201
415
/03
/201
416
/03
/201
417
/03
/201
418
/03
/201
419
/03
/201
420
/03
/201
421
/03
/201
42
2/0
3/2
01
423
/03
/201
424
/03
/201
425
/03
/201
426
/03
/201
427
/03
/201
428
/03
/201
429
/03
/201
430
/03
/201
431
/03
/201
401
/04
/201
402
/04
/201
403
/04
/201
404
/04
/201
405
/04
/201
406
/04
/201
407
/04
/201
408
/04
/201
409
/04
/201
410
/04
/201
41
1/0
4/2
01
412
/04
/201
413
/04
/201
414
/04
/201
415
/04
/201
416
/04
/201
417
/04
/201
418
/04
/201
419
/04
/201
420
/04
/201
421
/04
/201
422
/04
/201
423
/04
/201
424
/04
/201
425
/04
/201
426
/04
/201
427
/04
/201
428
/04
/201
429
/04
/201
430
/04
/201
4
LAS Number of CatA Respiratory Calls by Illness Types
Asthma
COPD
Hypervent
Respirat
Dyspnoea
15

16
100
150
200
250
300
350
01
/03
/201
402
/03
/201
403
/03
/201
404
/03
/201
405
/03
/201
406
/03
/201
407
/03
/201
408
/03
/201
409
/03
/201
410
/03
/201
411
/03
/201
412
/03
/201
413
/03
/201
414
/03
/201
415
/03
/201
416
/03
/201
417
/03
/201
418
/03
/201
419
/03
/201
420
/03
/201
421
/03
/201
422
/03
/201
423
/03
/201
424
/03
/201
425
/03
/201
426
/03
/201
427
/03
/201
428
/03
/201
429
/03
/201
430
/03
/201
431
/03
/201
401
/04
/201
402
/04
/201
403
/04
/201
404
/04
/201
405
/04
/201
406
/04
/201
407
/04
/201
408
/04
/201
409
/04
/201
410
/04
/201
411
/04
/201
412
/04
/201
413
/04
/201
414
/04
/201
415
/04
/201
416
/04
/201
417
/04
/201
418
/04
/201
419
/04
/201
420
/04
/201
421
/04
/201
422
/04
/201
423
/04
/201
424
/04
/201
425
/04
/201
426
/04
/201
427
/04
/201
428
/04
/201
429
/04
/201
430
/04
/201
4
LAS Daily Cardiac Incidents March - April 2014
cardiac arrhy
cardiac arrest
cardiac chest pain
pain chest

17
0
10
20
30
40
50
60
70
80
200 220 240 260 280 300 320 340 360 380
P
M
1
0
a
n
d
P
M
2
.
5
u
g
/
m
3
LAS Respiratory Calls
PM10 and PM2.5 Levels London Bloomsberry versus LAS Respiratory Calls March 29th to April 4th 2014
PM10
PM2.5

18
y = 3.2x + 262 R² = 0.71
200
220
240
260
280
300
320
340
360
380
0 5 10 15 20 25 30 35 40
LA
S D
ialy
Resp
irato
ry
%PM10 Saharan Dust
LAS Daily Total Respiratory Calls v. % of PM10 Saharan Dust March 29th to April 4th 2014

19
y = 5.8x + 258 R² = 0.89
200
220
240
260
280
300
320
340
360
380
400
0 5 10 15 20 25
L
A
S
T
o
t
a
l
D
a
i
l
y
R
e
s
p
i
r
a
t
o
r
y
c
a
l
l
s
PM2.5 % Saharan Dust
LAS Daily Total Respiratory Calls v. % of PM2.5 Saharan Dust March 29th to April 4th 2014

400
450
500
550
600
650
700
999 I
ncid
en
ts
Date
Birmingham Ambulance 999 Incidents

60
80
100
120
140
160
180
200
Yorkshire Breathing Problems