air quality and health chhabra sk (author for correspondence
TRANSCRIPT
1
Air Quality and Health
Chhabra SK
(Author for correspondence)
Professor and Head
Department of Cardiorespiratory Physiology
University of Delhi, Delhi – 110 007
Tel: 091-011-7667102
Fax: 091-011-7667420
Email: [email protected]
Pande JN Professor and Head
Department of Medicine
All India Institute of Medical Sciences
New Delhi – 110 029
Tel: 091-11-6867757
Fax: 091-11-6865934
Email: [email protected]
Joshi TK Director
Center for Occupational and Environmental Medicine
Lok Nayak Jai Prakash Narayan Hospital
New Delhi –
Email: [email protected]
Kumar P Consultant, Environment and Health
New Delhi
Email: [email protected]
2
Abstract
This paper is written as part of the Harvard University Project, Systems Analysis of PersonalTransportation Needs in Emerging Market Countries. It reviews the current literature on thehealth impact of ambient air pollution in India, with special emphasis on Delhi and providesrecommendations for areas where future research could be directed.
High levels of total suspended particulate matter (TSP) in ambient air of Delhi - threetimes the annual national standard of 140µg/m3 - are a serious cause for concern. There isevidence of elevated rates of respiratory morbidity amongst those dwelling in highly pollutedareas of Delhi, after adjusting for several confounders. Daily counts of emergency room visits foracute asthma, acute exacerbation of chronic obstructive airway disease (COAD) and acutecoronary events are related to daily levels of pollutants, particularly TSP recorded a day earlierusing time series approach. It is estimated that almost one fifth of the emergency room visits forthese ailments in Delhi are attributable to particulate levels exceeding the national standards.Daily mortality from non-traumatic causes has been shown to be related to TSP levels in a timeseries analysis, however, the increase in mortality per 100 microgram/per cubic meter increase inDelhi is less as compared to similar effect noted from other parts of the world. Further, the excessmortality is noted in relatively younger age groups as well.
More studies are needed to confirm these observations and provide a concrete basis forpolicy decisions to improve air quality and public health in Delhi. Further studies are required onthe adverse health effects of ozone, benzene, lead and other pollutants.

3
AIR QUALITY MONITORING IN DELHI
AIR QUALITY MONITORING BY CENTRAL POLLUTION CONTROL BOARD
The Central Pollution Control Board (CPCB), Government of India, as part of the NationalAmbient Air Quality Monitoring (NAAQM) Network, routinely monitors ambient air quality inDelhi. Six monitoring stations are established under this network in various parts of Delhirepresenting residential, industrial or mixed-use areas. They are located at Shahzada Bagh (North-West), Ashok Vihar (North-North West), Janakpuri (SouthWest), Shahdara (NorthEast),Nizamuddin (SouthEast) and Siri Fort (South). While Shahzada Bagh and Shahdara are classifiedas ‘industrial areas’, Nizamuddin as ‘mixed use area’ (residential-cum-commercial), theremaining are ‘residential’. However, with increasing developmental and commercial activities,the areas, which were earlier classified, as 'Residential' would be better, described as ‘mixed use’today. Data on air quality in these areas is available from 1987 onwards. In addition to the abovesix areas, the National Environmental Engineering Research Institute (NEERI) has establishedthree monitoring stations viz. Najafgarh (West Delhi - Industrial), Netaji Nagar (South -Residential) and Town Hall (Central-North, Mixed). Data on air quality in these areas is availablefrom 1989 onwards.
The Central Pollution Control Board has developed the currently applicable nationalambient air quality standards. Developed in 1982, these were subsequently revised and notified in1994. The standards are based on land use and other factors related to different areas. Accordingto these criteria, areas were classified into industrial, mixed (with intense industrial activity),residential and sensitive (hill stations, national parks, national monuments and sanctuaries).
Regular monitoring by CPCB and NEERI is being done for only three criteria pollutants,viz. Suspended Particulate Matter (SPM), oxides of nitrogen (as NO2) and sulfur dioxide. Theambient levels of Respirable Particulate Matter (PM10, particles < 10 µm in diameter), lead andcarbon monoxide were not being measured at any of the abovementioned nine stations tillrecently. The monitoring is done over twelve months of the year with a frequency of not less thanonce a week with a sampling time of 8 hours.
Most of the information available on air quality in Delhi pertains to the three criteriapollutants monitored by the CPCB (1,2). Some data is available on the PM10 levels that have beenmonitored at a few locations recently and there are a few reports on levels of lead, ozone, volatileorganic compounds that different agencies or workers have measured as specific projects.Keeping these limitations in view, the available information on air quality is presented in thefollowing sections followed by a review of studies carried out to assess its impact on health.
Suspended Particulate Matter (SPM)/Total Suspended Particulates (TSP)
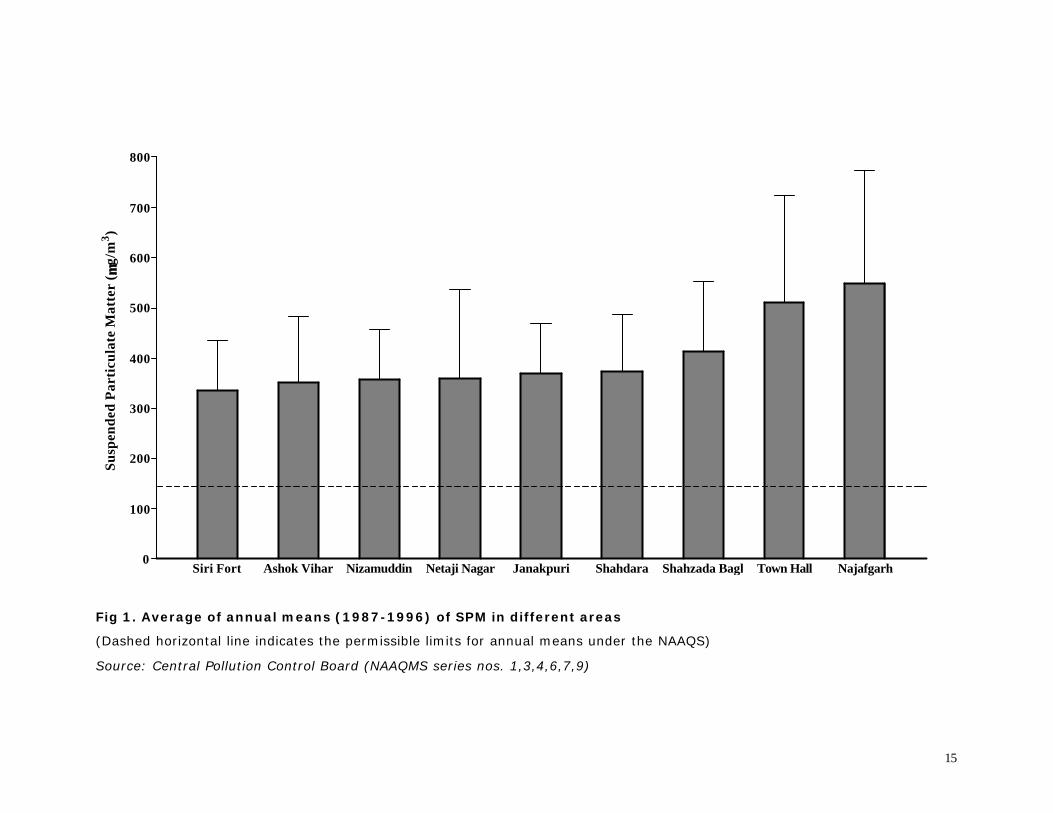
Fig 1 shows the mean±sd of the annual means from 1987-1996 of SPM in different areasbeing monitored. In increasing order, the values for the different areas were (figures in the orderof mean±sd, 95% confidence intervals for the mean in µg/m3) as follows:
Siri Fort: 336.06±98.84, 316.58 to 355.57; Ashok Vihar: 351.72±131.06, 325.97 to377.45; Nizamuddin: 358.93±98.66, 339.55 to 378.31; Netaji Nagar: 360.33±175.96, 317.08 to403.58; Janakpuri: 369.75±98.62, 325.97 to 377.45; Shahdara: 374.05±112.21, 351.79 to 396.31;Shahzada Bagh: 414.02±137.87, 386.94 to 441.09; Town Hall: 511.94±212.30, 462.41 to 561.47;Najafgarh: 548.49±225.12, 488.76 to 608.22. Analysis of variance revealed a significantdifference between these means (F=20.22, p<0.00001). Inter-group comparisons with theStudent-Neuman-Keuls test revealed that the levels at Najafgarh and Town Hall weresignificantly higher than all other areas though between themselves, these were not significantlydifferent. The levels at Shahzada Bagh were significantly lower than at these two areas but were
4
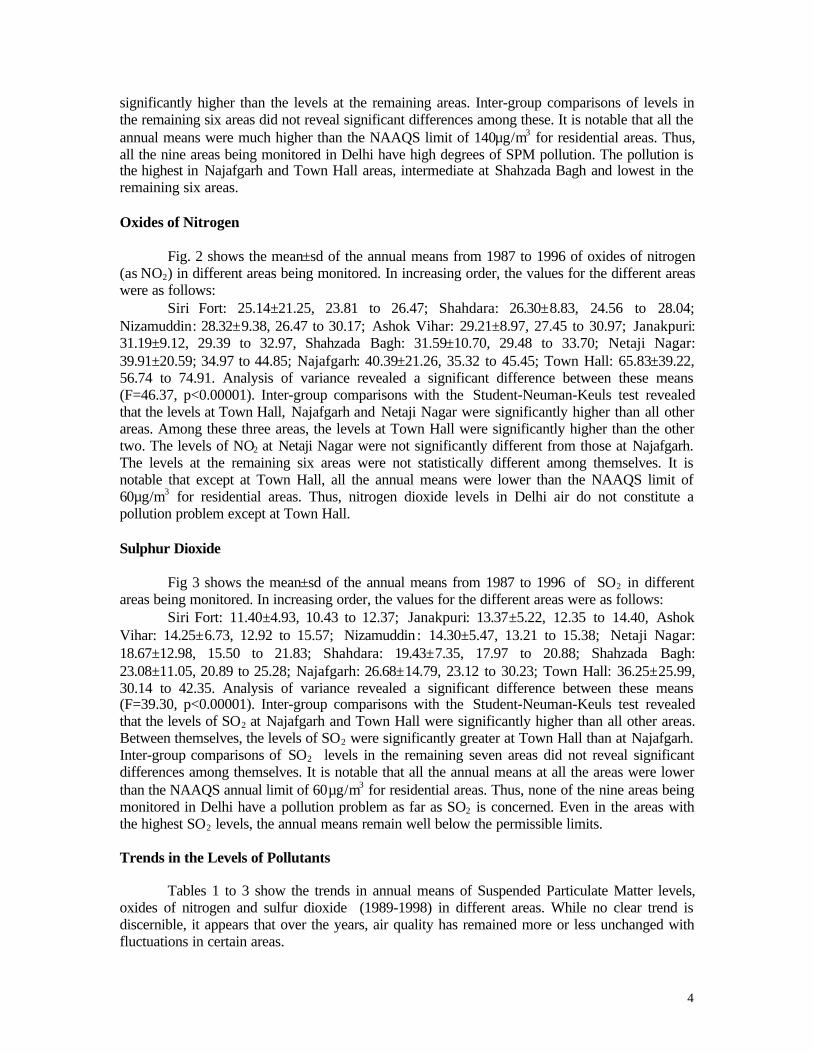
significantly higher than the levels at the remaining areas. Inter-group comparisons of levels inthe remaining six areas did not reveal significant differences among these. It is notable that all theannual means were much higher than the NAAQS limit of 140µg/m3 for residential areas. Thus,all the nine areas being monitored in Delhi have high degrees of SPM pollution. The pollution isthe highest in Najafgarh and Town Hall areas, intermediate at Shahzada Bagh and lowest in theremaining six areas.
Oxides of Nitrogen
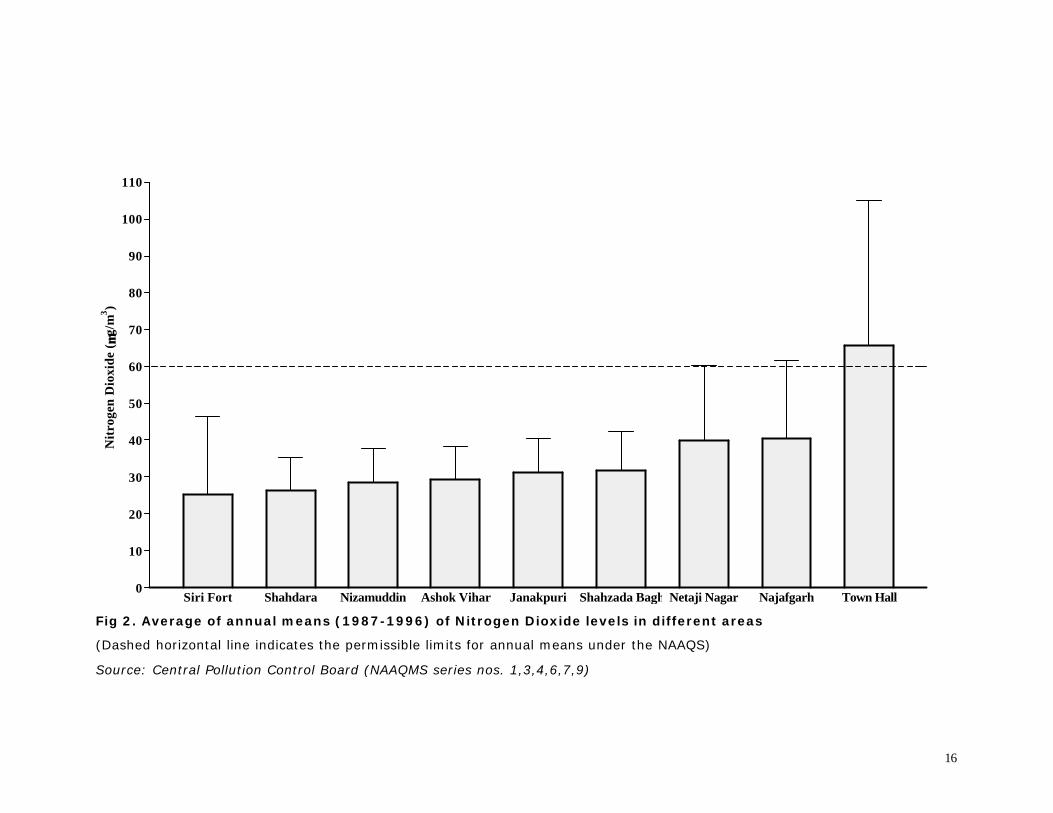
Fig. 2 shows the mean±sd of the annual means from 1987 to 1996 of oxides of nitrogen(as NO2) in different areas being monitored. In increasing order, the values for the different areaswere as follows:
Siri Fort: 25.14±21.25, 23.81 to 26.47; Shahdara: 26.30±8.83, 24.56 to 28.04;Nizamuddin: 28.32±9.38, 26.47 to 30.17; Ashok Vihar: 29.21±8.97, 27.45 to 30.97; Janakpuri:31.19±9.12, 29.39 to 32.97, Shahzada Bagh: 31.59±10.70, 29.48 to 33.70; Netaji Nagar:39.91±20.59; 34.97 to 44.85; Najafgarh: 40.39±21.26, 35.32 to 45.45; Town Hall: 65.83±39.22,56.74 to 74.91. Analysis of variance revealed a significant difference between these means(F=46.37, p<0.00001). Inter-group comparisons with the Student-Neuman-Keuls test revealedthat the levels at Town Hall, Najafgarh and Netaji Nagar were significantly higher than all otherareas. Among these three areas, the levels at Town Hall were significantly higher than the othertwo. The levels of NO2 at Netaji Nagar were not significantly different from those at Najafgarh.The levels at the remaining six areas were not statistically different among themselves. It isnotable that except at Town Hall, all the annual means were lower than the NAAQS limit of60µg/m3 for residential areas. Thus, nitrogen dioxide levels in Delhi air do not constitute apollution problem except at Town Hall.
Sulphur Dioxide
Fig 3 shows the mean±sd of the annual means from 1987 to 1996 of SO2 in differentareas being monitored. In increasing order, the values for the different areas were as follows:
Siri Fort: 11.40±4.93, 10.43 to 12.37; Janakpuri: 13.37±5.22, 12.35 to 14.40, AshokVihar: 14.25±6.73, 12.92 to 15.57; Nizamuddin : 14.30±5.47, 13.21 to 15.38; Netaji Nagar:18.67±12.98, 15.50 to 21.83; Shahdara: 19.43±7.35, 17.97 to 20.88; Shahzada Bagh:23.08±11.05, 20.89 to 25.28; Najafgarh: 26.68±14.79, 23.12 to 30.23; Town Hall: 36.25±25.99,30.14 to 42.35. Analysis of variance revealed a significant difference between these means(F=39.30, p<0.00001). Inter-group comparisons with the Student-Neuman-Keuls test revealedthat the levels of SO2 at Najafgarh and Town Hall were significantly higher than all other areas.Between themselves, the levels of SO2 were significantly greater at Town Hall than at Najafgarh.Inter-group comparisons of SO2 levels in the remaining seven areas did not reveal significantdifferences among themselves. It is notable that all the annual means at all the areas were lowerthan the NAAQS annual limit of 60µg/m3 for residential areas. Thus, none of the nine areas beingmonitored in Delhi have a pollution problem as far as SO2 is concerned. Even in the areas withthe highest SO2 levels, the annual means remain well below the permissible limits.
Trends in the Levels of Pollutants
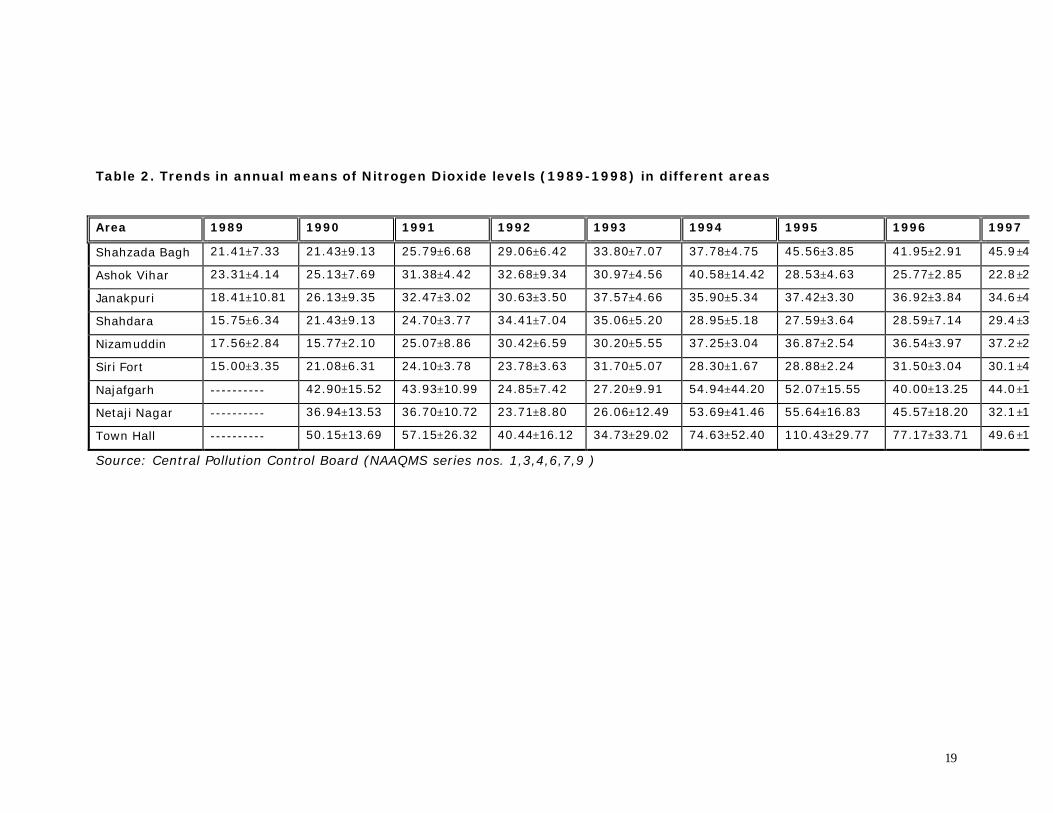
Tables 1 to 3 show the trends in annual means of Suspended Particulate Matter levels,oxides of nitrogen and sulfur dioxide (1989-1998) in different areas. While no clear trend isdiscernible, it appears that over the years, air quality has remained more or less unchanged withfluctuations in certain areas.
5
AIR QUALITY MONITORING BY OTHER AGENCIES/RESEARCHERS
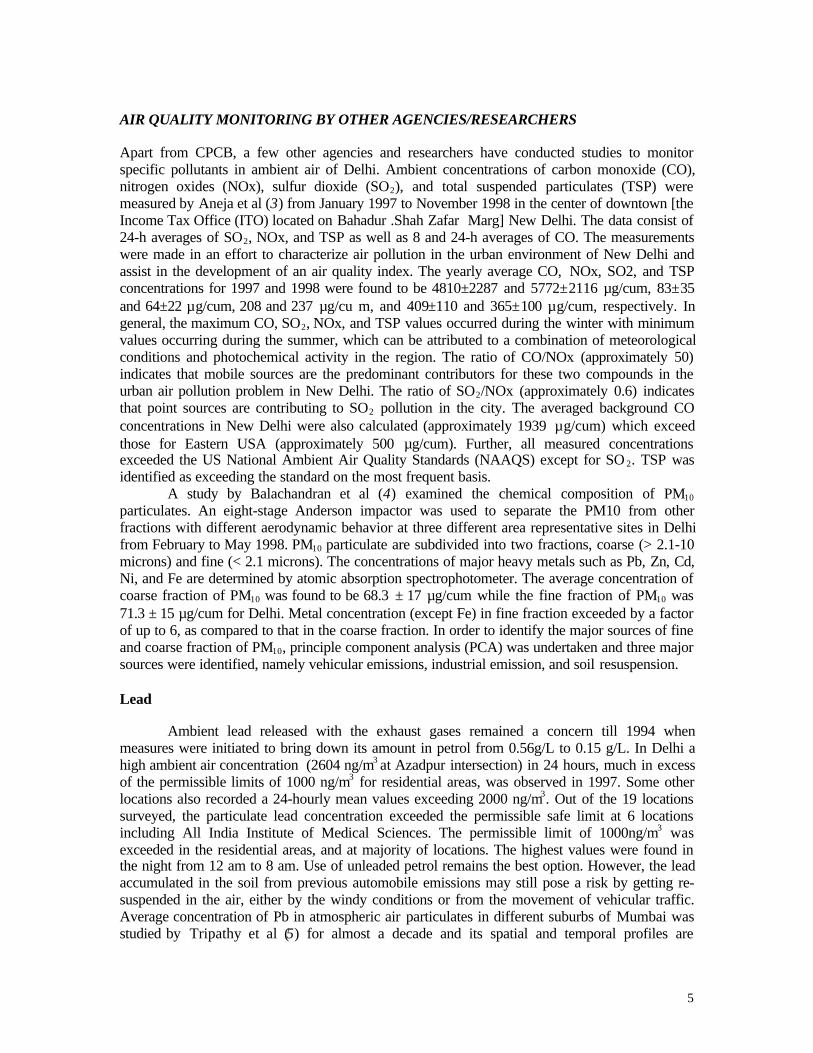
Apart from CPCB, a few other agencies and researchers have conducted studies to monitorspecific pollutants in ambient air of Delhi. Ambient concentrations of carbon monoxide (CO),nitrogen oxides (NOx), sulfur dioxide (SO2), and total suspended particulates (TSP) weremeasured by Aneja et al (3) from January 1997 to November 1998 in the center of downtown [theIncome Tax Office (ITO) located on Bahadur .Shah Zafar Marg] New Delhi. The data consist of24-h averages of SO2, NOx, and TSP as well as 8 and 24-h averages of CO. The measurementswere made in an effort to characterize air pollution in the urban environment of New Delhi andassist in the development of an air quality index. The yearly average CO, NOx, SO2, and TSPconcentrations for 1997 and 1998 were found to be 4810±2287 and 5772±2116 µg/cum, 83±35and 64±22 µg/cum, 208 and 237 µg/cu m, and 409±110 and 365±100 µg/cum, respectively. Ingeneral, the maximum CO, SO2, NOx, and TSP values occurred during the winter with minimumvalues occurring during the summer, which can be attributed to a combination of meteorologicalconditions and photochemical activity in the region. The ratio of CO/NOx (approximately 50)indicates that mobile sources are the predominant contributors for these two compounds in theurban air pollution problem in New Delhi. The ratio of SO2/NOx (approximately 0.6) indicatesthat point sources are contributing to SO2 pollution in the city. The averaged background COconcentrations in New Delhi were also calculated (approximately 1939 µg/cum) which exceedthose for Eastern USA (approximately 500 µg/cum). Further, all measured concentrationsexceeded the US National Ambient Air Quality Standards (NAAQS) except for SO 2. TSP wasidentified as exceeding the standard on the most frequent basis.
A study by Balachandran et al (4) examined the chemical composition of PM10
particulates. An eight-stage Anderson impactor was used to separate the PM10 from otherfractions with different aerodynamic behavior at three different area representative sites in Delhifrom February to May 1998. PM10 particulate are subdivided into two fractions, coarse (> 2.1-10microns) and fine (< 2.1 microns). The concentrations of major heavy metals such as Pb, Zn, Cd,Ni, and Fe are determined by atomic absorption spectrophotometer. The average concentration ofcoarse fraction of PM10 was found to be 68.3 ± 17 µg/cum while the fine fraction of PM10 was71.3 ± 15 µg/cum for Delhi. Metal concentration (except Fe) in fine fraction exceeded by a factorof up to 6, as compared to that in the coarse fraction. In order to identify the major sources of fineand coarse fraction of PM10, principle component analysis (PCA) was undertaken and three majorsources were identified, namely vehicular emissions, industrial emission, and soil resuspension.
Lead
Ambient lead released with the exhaust gases remained a concern till 1994 whenmeasures were initiated to bring down its amount in petrol from 0.56g/L to 0.15 g/L. In Delhi ahigh ambient air concentration (2604 ng/m3 at Azadpur intersection) in 24 hours, much in excessof the permissible limits of 1000 ng/m3 for residential areas, was observed in 1997. Some otherlocations also recorded a 24-hourly mean values exceeding 2000 ng/m3. Out of the 19 locationssurveyed, the particulate lead concentration exceeded the permissible safe limit at 6 locationsincluding All India Institute of Medical Sciences. The permissible limit of 1000ng/m3 wasexceeded in the residential areas, and at majority of locations. The highest values were found inthe night from 12 am to 8 am. Use of unleaded petrol remains the best option. However, the leadaccumulated in the soil from previous automobile emissions may still pose a risk by getting re-suspended in the air, either by the windy conditions or from the movement of vehicular traffic.Average concentration of Pb in atmospheric air particulates in different suburbs of Mumbai wasstudied by Tripathy et al (5) for almost a decade and its spatial and temporal profiles are

6
discussed in relation to emission sources. In general, the concentration of Pb in the entireresidential suburban atmosphere is well below the Central Pollution Control Board (CPCB, 1994)prescribed limit of 1.5 µg/cum barring a few exceptions for some residential/industrial sites, suchas those of Thane and Kurla scrap yards. The correlation between blood lead of children and airlead reveals that the blood Pb level in children could increase by 3.6 µg/ dl for an incremental riseof 1.0 µg Pb m/cu m of air. The temporal profile of air Pb values indicates a decreasing trend inresidential suburbs (Khar: 1984, 0.39 µg/cum; 1996, 0.17 µg/cum as well as in suburbanresidential areas with low traffic (Goregaon: 1984, 0.53 µg/cum; 1996, 0.30 µg/cum.
Volatile Organic Compounds
With the replacement of lead with alkylbenzenes in petrol, concern has been expressed about thelevels of benzene in the urban air, which is monitored using a BTEX Analyzer (Benzene,Toluene, Ethyl benzene, o, m, p- Xylene) in Delhi and a few other places selectively. In Delhi,the highest concentrations of benzene ranging from 20 to 38 µg/cum were recorded in 1999 bythe monitoring station near Income tax office (ITO). At other places the values ranged between13 to 26 µg/cum. In Kanpur, the monthly average values between 7 to 41 µg/cum were recorded.The average monthly values were higher by a maximum factor of 2.4 at the monitoring locationswhen compared with the United Kingdom’s recommended annual average limit of 16 µg/cum.Like benzene, the polyaromatic hydrocarbons have also been monitored selectively. Themeasurements for benzo (a) pyrene (B[a]P) at six locations in Delhi indicate that the annualaverage ranged between 1.0 to 5.3 ng/cum during the period 1997 to 1999. The reference standardfor B[a]P in ambient air is 10 ng/m3.
Varshney et al (6) monitored total volatile organic compounds (TVOCs) in the urbanareas of Delhi at 13 sites. The levels of TVOCs were found to vary between 3 and 42 ppmv andexhibited wide temporal and seasonal variations. Peak levels coincided with peak traffic density.As these compounds contribute to the generation of toxic oxidants, a need for regular monitoringis recommended.
IMPACT OF INTERVENTIONS ON AIR QUALITY
In Delhi, some citywide interventions have been implemented since the year 2000 with a view toimprove air quality and public health. In April 2000, old commercial vehicles were banned fromplying on the roads, and buses, taxis and three-wheelers switched to CNG as a fuel in April 2001.The impact of these interventions in not known. There is some mixed evidence, especially withregard to levels of respirable suspended particulates (RSP) based on data monitored by theCentral Pollution Control Board and Tata Energy Research Institute (7).
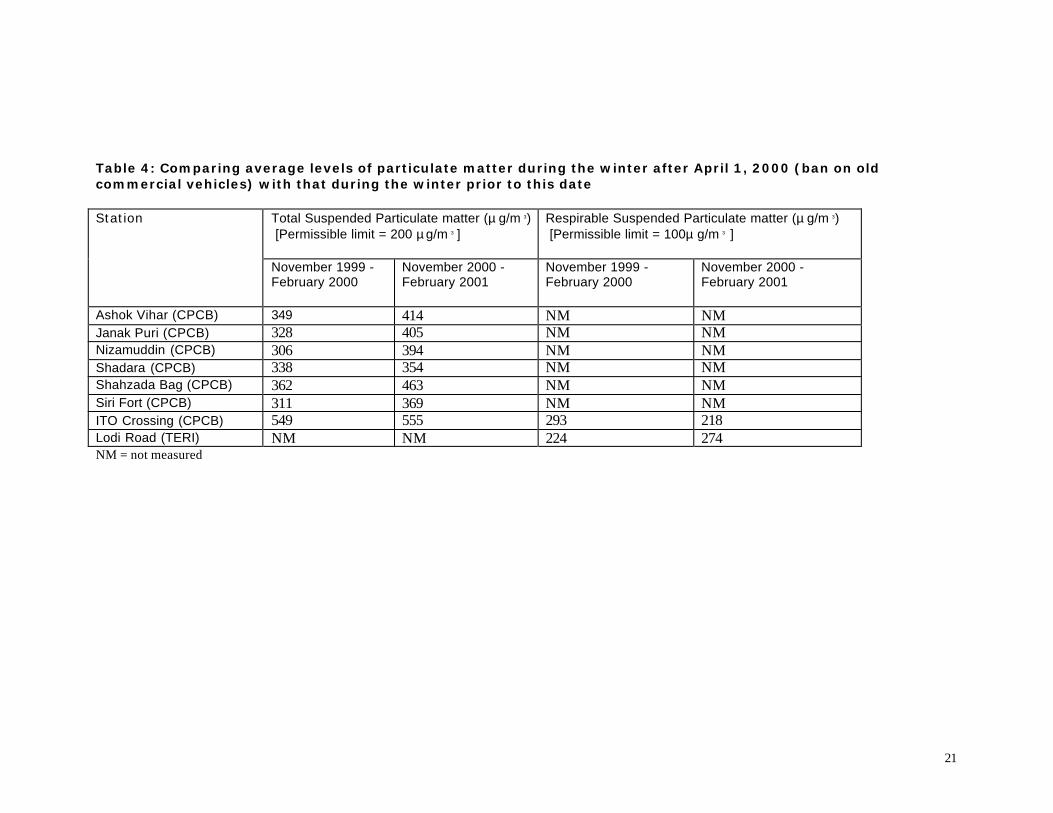
In the winter months (November 2000 – February 2001) following the ban on oldcommercial vehicles the concentration of TSP was higher than those during the winter before theban (November 1999 – February 2000) at all locations monitored by CPCB. RSP levels werehigher at the Lodi Road station operated by TERI but lower at the ITO crossing station operatedby CPCB (Table 4).
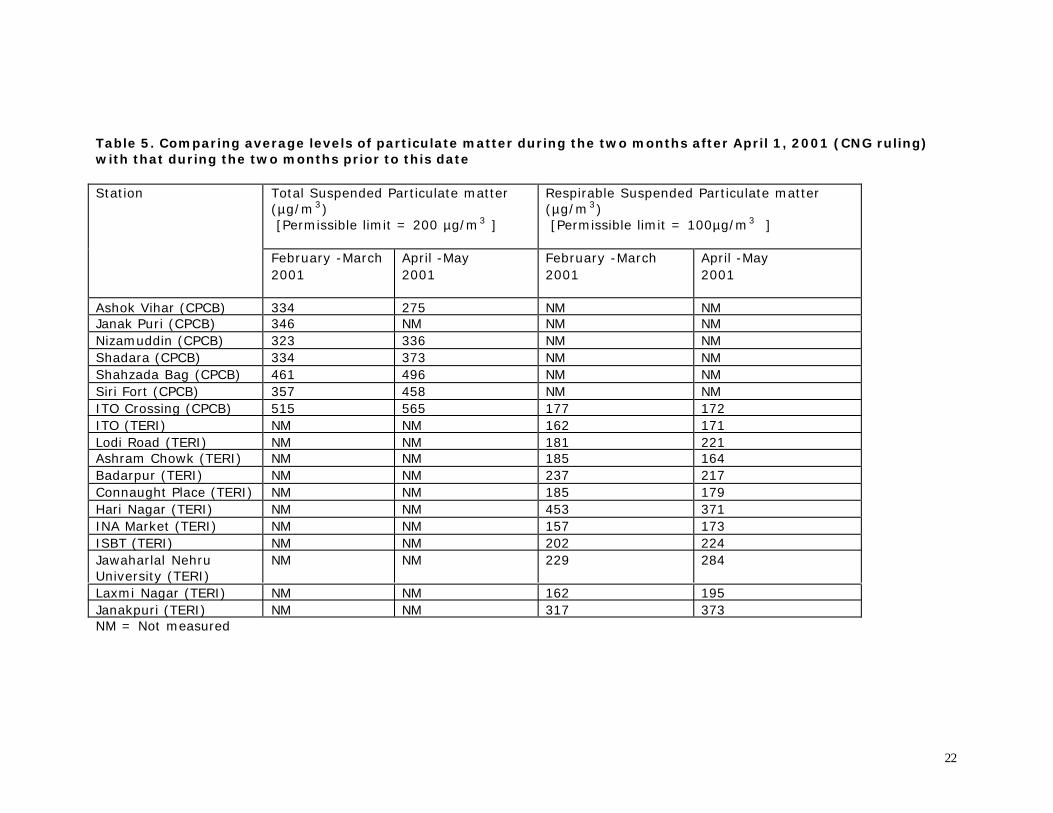
Average levels of RSP in the two-month period April-May 2001 following theintroduction of CNG, as compared to the levels during February-March 2001, increased at sevenlocations operated by TERI including the ITO crossing station. In contrast, at CPCB’s station atITO crossing there was no change in RSP levels and at four other CPCB locations there was adecrease noted in RSP levels (Table 5).
Although it may be still to early to assess the impact of the interventions Delhi’s airquality, it is clear that there is an urgent need for more rigorous air quality monitoring and also
7
use of consistent methodologies in monitoring of critical pollutants in air by different agencies toenable meaningful comparison of data.
HEALTH EFFECTS OF AIR POLLUTION
Published studies in India have given conflicting evidence on the effects of air pollution onoccurrence of respiratory symptoms and diseases. In some studies, no effect has been found onthe prevalence of respiratory symptoms or lung function. In others, a variable effect has beenshown with some age-sex groups having greater prevalence of one or more chronic symptom.Evidence to suggest that short-term and acute exposure to these pollutants leads to aggravation ofsymptoms and deterioration of lung function in patients with asthma and chronic obstructive lungdisease is substantial and more definitive, however, there is considerable uncertainty regardingthe long-term health effects of several air pollutants such as particulates, ozone, oxides ofnitrogen and sulfur dioxide.
STUDIES IN DELHI
Respiratory Morbidity
Chhabra et al (8) carried out a study, the first of its kind, to assess the possible adverse effects oflong-term exposure to air pollution in Delhi.
Subjects for the study were included from residential colonies, belonging to lower,middle and higher economic class, within 1 Km radius of the monitoring stations of the CentralPollution Control Board. In all, 4141 subjects were studied. Three pollution zones wereconsidered according to the differences in particulates concentrations: Low: Below 400µg/m3
(Shahdara, Janakpuri, Netaji Nagar, Nizamuddin, Ashok Vihar, Siri Fort); Medium: 400 to 500µg/m3 (Shahzada Bagh) and High: Above 500 µg/m3 (Najafgarh, Town Hall). As there werefewer areas in medium and high pollution zones, these were combined into a single category ofmedium-high pollution for the purpose of comparison. There was a substantial contrast in airquality in these two zones, the SPM annual means in the medium-high pollution zone being 150-200µg/m3 greater than the low pollution zones. It must be stated here that even the “lowpollution zone” had very high particulate levels. The terms “low”, “medium” and “high” arerelative and not absolute.
A respiratory symptoms questionnaire based on the widely used British MedicalResearch Council, American Thoracic Society and National Heart, and Blood and Lung Institute,USA questionnaires was administered to the subjects followed by a detailed enquiry of symptomsand examination by a Chest specialist to establish a clinical diagnosis in those found to havesymptoms of respiratory disease. The health outcome (respiratory morbidity) was measured asfollows: (1) Chronic respiratory symptoms : Chronic cough, Chronic phlegm, dyspnoea andwheezing; (2) Chronic Respiratory Airways Diseases: Chronic Bronchitis, Chronic ObstructivePulmonary Disease (COPD) and Bronchial Asthma; (3) Lung Function in asymptomaticindividuals.
Among males, in none of the economic groups the differences in the prevalence rates ofchronic chest symptoms were statistically significant. Among female subjects, for chronic coughand chronic phlegm, the prevalence was significantly greater in the higher economic groups inresidents of medium-high pollution zone as compared to the low pollution zone. In non-smokermales, when the occurrence of cough, chronic phlegm, dyspnoea and wheezing was consideredby economic status and age group, no consistent pattern was evident with regard to theirassociation with air pollution. Among non-smoking females however, in most age groups byeconomic status, cough and chronic phlegm were significantly more common in residents ofmedium-high pollution zones as compared to residents of low pollution zone. However, for
8
dyspnoea and wheezing, no consistent pattern was evident with regard to their association withair pollution. The prevalence of Chronic Obstructive Pulmonary Disease and Chronic Bronchitiswas greater in male subjects in the middle and higher economic classes, and in female subjects inall the three economic classes in the medium-high pollution zone as compared to the lowpollution zone. However, the differences were not statistically significant. The differences inprevalence rates of bronchial asthma between the pollution zones were not consistent orsignificant in either males or females.
While the differences in prevalence of chronic respiratory symptoms and airwaysdiseases among residents of the two pollution zones were significant in some of the comparisons,much more striking was the definite demonstration of reduced lung function in asymptomaticnon-smokers, both males and females, among those living in medum-high pollution zones. Ourresults showed that all the four spirometric parameters, FVC, FEV1, F25-75 and PEFR weresignificantly reduced in residents of medium-high pollution areas as compared to those in lowpollution areas. As these comparisons were made among nonsmokers who were asymptomatic,the effects of disease and smoking did not interfere.
It was observed that the proportion of asymptomatic subjects with restrictive ventilatoryimpairment (i.e. FVC less than 70% predicted with a normal FEV1/FVC ratio) was significantlygreater among residents of medium-high pollution areas as compared to residents of low pollutionareas both among males and females. The number of subjects with such an abnormality wassmall, approximately 3%. Another significant observation on lung function abnormalities inasymptomatic subjects was the isolated (i.e. with a normal FEV1 /FVC ratio) reduction inmaximal mid-expiratory flow rates (F25-75). Subjects with such an abnormality wereproportionately greater among residents of medium-high pollution areas for both males andfemales, the former being statistically significant. An isolated reduction in maximal mid-expiratory flow rates suggests early small airways disease.
The differences in the prevalence of some of the chronic respiratory symptoms amongnon-smokers in residents of high and low pollution areas reported in several studies including thepresent imply a definite adverse effect of air pollution. These suggest that hyper-secretion ofmucus may be more common among residents of the more polluted areas. Poorer lung function,which was observed in the medium-high pollution areas, suggests a long-term deleterious effecton the lungs.
Smoking was the most important single independent determinant of cough, phlegm anddyspnoea in the present study. The risk of these symptoms and of COPD/chronic bronchitisincreased with an increase in the intensity of smoking. No additive effect of smoking and airpollution was evident. Economic level was an important risk factor in the present study. Theprevalence of chronic symptoms and diseases was substantially greater in subjects living in slumsand low income housing areas. With an increase in the economic level, the prevalence ofrespiratory symptoms decreased significantly.
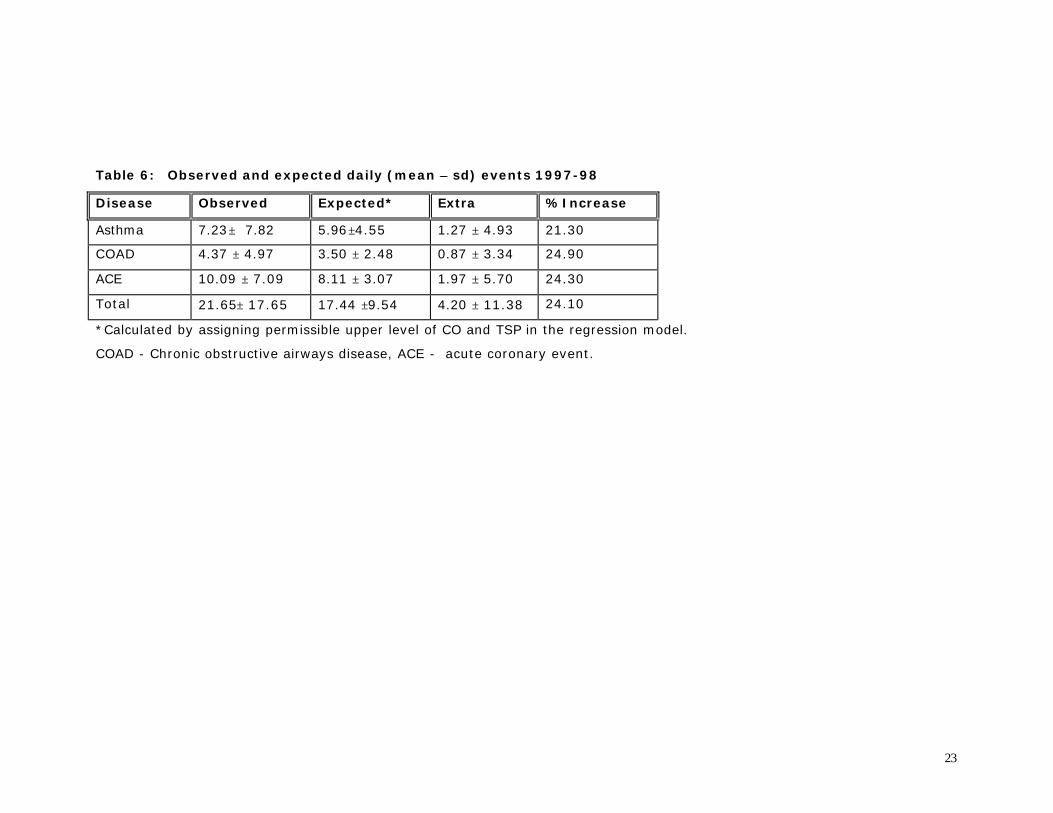
Pande et al (9) studied the relationship between the rates of hospitalization due to acuterespiratory events (asthma and COPD exacerbations) and acute coronary events and ambient airquality. Daily counts of patients visiting the emergency room of the All India Institute of MedicalSciences (AIIMS, New Delhi) for acute asthma, acute exacerbation of chronic obstructive airwaydisease (COAD) and acute coronary event was obtained in a prospective manner from January1997 to December 2000. Daily mean levels of ambient CO, NOX and SO2 were monitored alongwith temperature and humidity. Data was analyzed using one-day time lag for events of interest.Time series analysis was undertaken using Poisson regression and population averaged generalestimation equation, correcting for auto-correlation, day of the week and the season. The ambientlevels of pollutants exceeded the national air quality standards on most of the days, over the two-year period. Further emergency room visits for asthma, COAD and acute coronary eventsincreased by 21.30%, 24.90% and 24.30% respectively on account of higher than acceptablelevels of pollutants (Table 6). It was concluded that there is considerable burden of cardio-
9
respiratory diseases in Delhi due to high levels of ambient air pollution. Delhi has a number ofgovernment hospitals, however, for the present study data was used from a single hospital (AllIndia Institute of Medical Sciences) as there is no central registry of hospital admissions, and theoutpatient records of other hospitals were not available. Considering the limitations in theassessment of exposure and outcome variables, the findings should be taken as preliminaryobservations. They are, however, of sufficient interest since no other reports are available fromDelhi.
A health survey to determine the adverse impact of vehicular pollution in Delhi wasundertaken in 1997 by Joshi (10). Based on area sampling, highly polluted areas (SPMconcentration, > 500 µg/cum) and rural areas with low pollution (assumed to be < 400 µg/cum)were identified and numbered serially. Six pockets from each area were randomly selected. Atotal of 1073 adults were chosen. A lifetime dose for each subject was computed based onaverage air pollutant concentrations and daily time activity patterns. This was used as a surrogatefor individual life time exposure, which cannot be estimated with confidence in the event ofchronic exposure to a multitude of agents, as is the case with vehicular exhaust. A structured andclose-ended interview schedule was administered to the subjects followed by a physicalassessment by a trained physician.
The results showed that exposure to vehicular pollution in the city group (staying in highpollution areas) were three-fold higher than that for rural population. There was no significantdifference in the two groups with regard to morbidity due to asthma, heart disease, and allergies.The symptoms on the day of survey and in previous one year were significantly more in the urbangroup. The urban residents experienced significantly more episodes of respiratory infections,common colds, and febrile illness during past one year indicating the adverse health impact of ahigher dose of vehicular pollution. The frequency of respiratory infections in past one year inasthmatics was significantly more than non-asthmatics. Rural subjects experienced significantlymore symptoms when coming into polluted areas. This paradoxical observation might be due tothe tolerance in urban group acquired due to frequent and regular exposure to vehicular pollution.Exposure to vehicular pollution had a significant effect on diastolic blood pressure as well.
In a door-to-door survey, from October 1994 to March 1995, Akbar (11) studied 3010adults drawn from middle-class background, and aged 25-45 years in Delhi in three geographicalareas, which differed in land-use pattern. The Suspended Particulate Matter (SPM) concentrationsmonitored by the Central Pollution Control Board were used as indicators of exposure. RespirableSPM (RSPM) was estimated in a sub-sample of the households. The long-term average SPMconcentrations in winters (1989-1993) in residential, commercial residential, and industrial areaswere 314 µg/cum, 337 µg/cum, and 420 µg/cum respectively. The mean RSPM concentrations inthe households in three areas were 215 µg/cum, 182 µg/cum, and 158 µg/cum, respectively inresidential, residential-commercial, and industrial areas respectively. The study concluded thattravel microenvironments have the highest RSPM exposure potential, followed by the ambientenvironment, and indoor microenvironments. Three-wheelers and other “open” modes (e.g.scooters and motorcycles) represent the mode of travel that is highest on the exposure ladder andsignificantly different from buses and cars. Though the RSPM measurements were undertaken atlimited points, the study suggests that a rise in motor vehicle population and especially in thenumber of “open” modes of travel is likely to lead to a large increase in commuters’ exposure tohigh concentrations of traffic generated pollutants, consequently increasing their risk ofrespiratory health damage significantly. Mortality
Cropper et al (12) carried out a time series study of the impact of particulate air pollution on dailymortality in Delhi. Mortality data from the New Delhi Municipal Corporation (NDMC) areas ofDelhi was analyzed that represents about 25% of total deaths in Delhi. A positive significant

10
relationship between particulate pollution and daily non-traumatic deaths, as well as deaths fromrespiratory/cardiovascular problems and for certain age groups was found. In general, the impactswere smaller than those estimated for other countries, where on average, a 100 µg/cu m increasein total particulates leads to a 6% increase in non-traumatic mortality. In Delhi, such an increasein particulates is associated with a 2.3% increase in deaths. This difference was attributed to thefact that in Delhi, a greater proportion of deaths occurs at younger ages and from causes notassociated with air pollution than is the case in the U.S. OTHER STUDIES IN INDIA While studies on prevalence of asthma do not directly provide evidence linking it with airpollution, these are informative as data is valuable in making comparisons with other cities withinand outside the country. A few studies have been carried out in the last few years.
Chowgule et al (13) applied epidemiologic surveillance tools, as a cooperating center ofthe European Community Respiratory Health Survey, to a randomly selected sample of Mumbai(Bombay) residents in 1992 through 1995. From a metropolitan population of over 10 million,they took a one-in-ten random sample from electoral rolls in a socially diverse residential district,and examined asthma symptoms in adults aged 20 to 44 yr. In Phase I, they interviewed 2,313adults about symptoms, asthma diagnosis, and medications in the previous 12 months. In PhaseII, family and smoking history, socioeconomic data, housing characteristics, serum IgE, allergyskin tests, spirometry, and methacholine challenge tests were obtained in a subset of 20% of thosewho had completed Phase I. House dust mite was the most common positive skin test (18%prevalence) and the only one of the nine applied that was significantly associated with asthmasymptoms and physician-diagnosed asthma. Asthma prevalence was 3.5% by physiciandiagnosis, and 17% using a very broad definition including those with asymptomatic bronchialhyper-reactivity. Asthma prevalence was strongly associated with positive house dust mite skintest, family history of asthma, and total serum IgE.
To measure the prevalence of asthma in schoolchildren in Delhi and study the factorsdetermining its occurrence, a questionnaire-based study was carried out in nine randomly selectedschools in Delhi by Chhabra et al (14). The age range was 5 to 17 years. The questionnaires weredistributed to all the children (n = 21,367) for answering by either parent. The key questionsrelated to complaints of recurrent wheezing in the past, during the immediate last 1-year, and alsowheezing exclusively induced by exercise or colds. In all, 19,456 questionnaires were receivedback (response rate 91%). Out of these, 18,955 were complete and analyzed. The prevalence ofcurrent asthma was 11.9% while past asthma was reported by 3.4% of children. Exclusiveexercise-induced asthma was reported by 2.1% while that associated with colds by 2.4% ofchildren. Boys had a significantly higher prevalence of current asthma as compared with girls(12.8% and 10.7%, respectively). Multiple logistic regression analysis showed that male sex, apositive family history of atopic disorders, and the presence of a smoker in the family weresignificant factors influencing the development of asthma while economic class, air pollution(total suspended particulates), and type of domestic kitchen fuel were not.
A few studies carried out in other parts of the country have looked into the adverse healtheffects of air pollution. A health study done by Kamat and Doshi (15) for 4 years in 4129 subjectsfrom 3 urban (high, medium and low SO2 levels) and a rural community showed a highermorbidity in subjects residing in areas with raised levels. Initially, the standardized prevalence (inpercent) for the four areas respectively was: dyspnoea 7.3, 6, 3.2 and 5.5; chronic cough 5.1, 2.7,1.7 and 3.3 and frequent colds 18.0, 20.8, 12.1 and 11 percent. The diagnosis of chronicbronchitis was made in 4.5, 4.5, 2.3 and 5.0 percent and cardiac disorders 6.8, 4.3, 8.2 and 2.7percent in respective 4 areas. After 3 years, 55-60% of urban and 44% of rural subjects werereassessed. Initial lung functions were best in "urban low" area but in all urban areas, annualdecline was larger than in rural subjects. A cross sectional study of 22,272 subjects residing in

11
four slum areas revealed generally higher morbidity with frequent colds, cough and dyspnoea.Daily health diaries maintained in 2232 subjects revealed high morbidity in 2 heavily pollutedareas. Monthly trends correlated with ambient SO2 and SPM. Ambient air pollution wasassociated with greater mortality (SMR) due to cardiorespiratory and malignant diseases. Themajor factors affecting morbidity were pollution, nutrition, occupation, smoking and age.
Awasthi et al (16) randomly selected a cohort of 664 children between the ages of 1month to 4.5 yr from 28 slums (anganwadi centers) of Lucknow, north India. They were followedup fortnightly for six months. The outcomes assessed were presence of respiratory symptomscomplex (RSC) at the time of interview and the number of days on which symptoms had occurredin the past week. Exposure to ambient air sulfur dioxide (SO2), oxides of nitrogen (NOx) andsuspended particulate matter (SPM) on the day of the interview or in the previous week wasassessed by ambient air monitoring at 9 centers within the city. The cumulative incidence of RSCwas 1.06 and the incidence density per 100 days of follow up was 1.63. All three pollutants werepositively correlated with each other and negatively correlated with temperature. Ambient airSPM and SO2 and cooking and heating fuels like dung cakes, wood, coal and kerosene andremaining indoors while the food was cooked were associated with increased incidence of RSC,increased duration of symptoms, or both. They concluded that to improve the respiratory health ofpreschool children, ambient air SPM and SO2 levels should be kept as low as possible andmothers should be advised to keep children in another room while cooking.
Lahiri et al (17) investigated the pulmonary responses of 153 urban and 116 ruralchildren in Calcutta and adjoining areas. A marked increase in respiratory symptoms (43% inurban and 14% in rural) and sputum alveolar macrophages was observed in urban children. Patelet al (18) recently reported the results of a study carried out in 297 children in the central Indiancity of Nagpur. The study included children of six months to 6 years born between 1989 and1995, a period coinciding with the use of leaded petrol. The environmental assessment includedsampling for lead in air, tap water, mother’s milk, dairy milk, and other materials including housepaint. For air sampling they used high volume samplers and collected 24-hour samples in a hightraffic zone in the city center, a residential area, and at the periphery of the town. Venous sampleswere drawn and lead estimated using flameless atomic absorption spectrophotometry. Leadconcentration in air was 0.065, 0.066 and 0.042 µg/cum, in winter, summer and monsoon seasonsrespectively. With CDC criteria (acceptable safe values < 10 µg/cum) as a reference, a total of67.7% of screened children exceeded the level of concern. However, the study did not reveal anassociation between residential proximity to heavily trafficked roads and elevated Pb in contrastto previous studies. They could not rule out the possibility of misclassification and because ofsmall number of children reporting such exposure, it is difficult to draw any definite inference.
CONCLUSIONS
Based on the above review of studies in Delhi on air quality and health, the following conclusionsare drawn.
1. There has been growing concern over the problem of increasing ambient air pollution inDelhi over the past decade. The vehicular traffic has increased enormously contributing amajor share to the burden of pollution. This has resulted in legislation setting deadlinesfor changeover to clean fuels and improved automobile technology. However, the impactof such interventions on public health cannot be assessed without rigorous monitoringsystems in place. Monitoring of various pollutants in Delhi is still patchy and incomplete.There is an urgent need for regular monitoring of respirable SPM (as PM10 or PM5) andin a greater number of monitoring stations, which are the major culprits in causing healthproblems. More data is needed on pollution caused by ozone, lead, benzene and VOCs on
12
a regular basis. These could be obtained through a greater number of individual studies orby incorporating some of these pollutants in the CPCB monitoring schedule.
2. Although several studies have demonstrated adverse health effects of ambient airpollution in Delhi, the magnitude of this effect needs precise quantification. Long termlongitudinal studies on large cohorts of subjects looking for association between theseverity of air pollution and several postulated adverse health effects are required. Forinstance, no information is available on the association of air pollution with low-birthweight babies. Association between air pollution and adverse health effects is influencedby several potential and real confounders such as overcrowding, poverty, tobaccosmoking, malnutrition, indoor air pollution and lack of access to health care and all thesefactors need to be carefully monitored and considered in future studies.
3. More rigorous studies are required to determine the association between air pollution andacute cardio-respiratory events requiring visit to emergency room using time seriesapproach. Such type of studies may be best suited to a place like Delhi. However,accurate health information needs to be obtained from all government and privatehospitals in Delhi for several years before meaningful estimates of increase in morbidityand mortality for a given increase in the levels of pollutants can be made. A large numberof patients in Delhi do not reach any hospital despite significant morbidity or go toprivate practioners so that the proportion of such deaths is not included in governmentrecords. This needs to be taken into account in the interpretation of data obtained fromMunicipal records.
4. No studies have been conducted to assess the relation between air pollution in Delhi andlung cancer or other malignancies. Studies worldwide have related particulate levelsemitted from diesel exhaust with a high incidence of lung cancer. There is a need toundertake studies to examine the effect of air pollution on biomarkers for DNA in Delhi.
Despite several limitations of the reported studies on adverse health effects of air pollution inDelhi, there can be little doubt that the associations are of a causal nature and need to be takenseriously. Alongside future research to more accurately quantify the magnitude of the burden ofdisease due to air pollution, there is a need for policy-related decisions to be implemented with aview to curb the menace air pollution in Delhi and improve public health.
REFERENCES
1. Central Pollution Control Board. National Ambient Air Quality Monitoring Series (NAAQMS)nos. 1 (1990-91), 3 (1990-91), 4 (1992-93), 6 (1994-95), 7 (1995-96).
2. Central Pollution Control Board. National Ambient Air Quality Monitoring Series (NAAQMS)no. 9 (1996-97). Ambient air quality status and trends in Delhi (1989-1993)
3. Aneja VP, Agarwal A, Roelle PA, Phillips SB, Tong Q, Watkins N, Yablonsky R.Measurements and analysis of criteria pollutants in New Delhi, India. Environ Int 2001;27:35-42
4. Balachandran S, Meena BR, Khillare PS. Particle size distribution and its elemental compositionin the ambient air of Delhi. Environ Int 2000;26:49-54
5. Tripathi RM, Raghunath R, Kumar AV, Sastry VN, Sadasivan S. Atmospheric and children'sblood lead as indicators of vehicular traffic and other emission sources in Mumbai, India. SciTotal Environ 2001;267:101-8
6. Varshney CK, Padhy PK. Total volatile organic compounds in the urban environment of Delhi. JAir Waste Manag Assoc 1998; 48: 448-453

13
7. Tata Energy Research Institute, Analysis of Delhi’s Air Quality Data,http://www.teriin.org/news/aug013.pdf, 2001
8. Chhabra SK, Chhabra P, Rajpal S, Gupta RK. Ambient air pollution and chronic respiratorymorbidity in Delhi. Arch Environ Health 2001; 56: 58-64
9. Pande JN, Bhatta N, Biswas D, Pandey RM, Ahluwalia G, Siddaramaiah NH, Khilnani GC.Outdoor air pollution and emergency room visits at a hospital in Delhi. Indian J Chest Dis &Allied Sci 2001; (in press)
10. Joshi TK. A Health Survey To Determine The Adverse Health Impact of Pollution in Delhi.Center for Occupational and Environmental Medicine, MAMC. New Delhi. 1998.
11. Sameer Akbar and Michael R Ashmore. Particulate Air-Pollution and its Association withRespiratory Morbidity in Delhi. Imperial college, Center for Environmental Technology,London.
12. Cropper ML, Simon NB, Alberini A, Sharma PK. The health effects of air pollution in Delhi,India. 1997; World Bank WPS 1860.
13. Chowgule RV, Shetye VM, Parmar JR, Bhosale AM, Khandagale MR, Phalnitkar SV, GuptaPC. Prevalence of respiratory symptoms, bronchial hyperreactivity, and asthma in a megacity.Results of the European community respiratory health survey in Mumbai (Bombay). Am JRespir Crit Care Med 1998;158:547-54
14. Chhabra SK, Gupta CK, Chhabra P, Rajpal S. Risk factors for development of bronchial asthmain children in Delhi. Ann Allergy Asthma Immunol 1999 ;83:385-90
15. Kamat SR, Doshi VB. Sequential health effect study in relation to air pollution in Bombay,India. Eur J Epidemiol 1987 ; 3:265-77
16. Awasthi S, Glick HA, Fletcher RH, Ahmed N. Ambient air pollution & respiratory symptomscomplex in preschool children. Indian J Med Res 1996 ;104:257-62
17. Patel AB, Williams SV, Frumkin H, Kondawar VK, Glick H, Ganju AK. Blood Lead inChildren and its Determinants in Nagpur, India. Indian J Occup Environ Health 2001; 7: 119-126
18. Lahiri T, Roy S, Basu C, Ganguly S, Ray MR, Lahiri P. Air pollution in Calcutta elicits adversepulmonary reaction in children. Indian J Med Res. 2000; 112: 21-6
14
List of tables and figures
1. Fig 1. Average of annual means (1987-1996) of SPM in different areas2. Fig 2. Average of annual means (1987-1996) of Nitrogen Dioxide levels in different areas3. Fig 3. Average of annual means (1987-1996) of Sulfur Dioxide levels in different areas4. Table 1. Trends in annual means of Suspended Particulate Matter levels (1989-1998) in different
areas5. Table 2. Trends in annual means of Nitrogen Dioxide levels (1989-1998) in different areas6. Table 3. Trends in annual means of Sulfur Dioxide levels (1989-1998) in different areas7. Table 4: Comparing average levels of particulate matter during the winter after April 1, 2000 (ban
on old commercial vehicles) with that during the winter prior to this date8. Table 5. Comparing average levels of particulate matter during the two months after April 1,
2001 (CNG ruling) with that during the two months prior to this date9. Table 6. Observed and expected daily events in 1997-98
15
Siri Fort Ashok Vihar Nizamuddin Netaji Nagar Janakpuri Shahdara Shahzada Bagh Town Hall Najafgarh0
100
200
300
400
500
600
700
800
Susp
ende
d P
arti
cula
te M
atte
r ( µµ
g/m
3 )
Fig 1. Average of annual means (1987-1996) of SPM in different areas
(Dashed horizontal line indicates the permissible limits for annual means under the NAAQS)
Source: Central Pollution Control Board (NAAQMS series nos. 1,3,4,6,7,9)
16
Siri Fort Shahdara Nizamuddin Ashok Vihar Janakpuri Shahzada Bagh Netaji Nagar Najafgarh Town Hall0
10
20
30
40
50
60
70
80
90
100
110
Nit
roge
n D
ioxi
de (
µµg/
m3 )
Fig 2. Average of annual means (1987-1996) of Nitrogen Dioxide levels in different areas
(Dashed horizontal line indicates the permissible limits for annual means under the NAAQS)
Source: Central Pollution Control Board (NAAQMS series nos. 1,3,4,6,7,9)

17
Siri Fort Janakpuri Ashok Vihar Nizamuddin Netaji Nagar Shahdara Shahzada Bagh Najafgarh Town Hall0
10
20
30
40
50
60
70
Sulp
hur
Dio
xide
( µµg/
m3 )
Fig 3. Average of annual means (1987-1996) of Sulfur Dioxide levels in different areas
(Dashed horizontal line indicates the permissible limits for annual means under the NAAQS)
Source: Central Pollution Control Board (NAAQMS series nos. 1,3,4,6,7,9)

18
Table 1. Trends in annual means of Suspended Particulate Matter levels (1989-1998) in different areas
Area 1989 1990 1991 1992 1993 1994 1995 1996 1997
Shahzada Bagh 510.5±129.2 297.8±116.9 374.8±150.4 506.5±131.9 422.35±78.7 369.17±62.7 367.8±39.9 371.9±59.9 281.8
Ashok Vihar 388.7±125.4 321.1±121.5 265.3±62.0 319.9±136.9 324.5±83.4 342.5±83.3 405.08±68.6 337.7±81.8 307.3
Janakpuri 326.8±98.8 314.6±92.0 393.1±84.8 372.0±107.8 390.3±77.8 428.3±92.9 419.5±64.1 325.7±64.1 342.7
Shahdara 361.9±107.6 297.9±116.9 325.3±79.5 364.6±98.99 382.0±90.7 352.2±71.8 432.1±98.0 432.17±152.0 313.4
Nizamuddin 333.8±85.2 289.9±85.6 290.9±70.3 360.02±63.3 361.5±Z63.3 439.9±70.8 392.8±103.9 384.8±116.6 363.3
Siri Fort 361.9±107.6 297.9±116.9 325.3±79.5 364.6±99.0 382.0±90.65 352.2±71.7 432.1±98.0 432.2±152.0 366.1
Najafgarh ---------- 498.5±231.6 573.0±148.7 ----------- 590.25±265.5 701.1±227.8 473.6±189.6 500.6±260.4 422.0
Netaji Nagar ---------- 375.6±206.1 425.6±125.5 326.8±243.2 368.6±155.3 508.8±153.7 288.4±148.4 298.3±106.8 295.3
Town Hall ---------- 543.4±258.9 641.2±180.1 401.5±186.1 541.5±192.2 542.6±236.2 466.7±195.0 457.8±196.4 400.0
Source: Central Pollution Control Board (NAAQMS series nos. 1,3,4,6,7,9 )
19
Table 2. Trends in annual means of Nitrogen Dioxide levels (1989-1998) in different areas
Area 1989 1990 1991 1992 1993 1994 1995 1996 1997
Shahzada Bagh 21.41±7.33 21.43±9.13 25.79±6.68 29.06±6.42 33.80±7.07 37.78±4.75 45.56±3.85 41.95±2.91 45.9±4.4
Ashok Vihar 23.31±4.14 25.13±7.69 31.38±4.42 32.68±9.34 30.97±4.56 40.58±14.42 28.53±4.63 25.77±2.85 22.8±2.4
Janakpuri 18.41±10.81 26.13±9.35 32.47±3.02 30.63±3.50 37.57±4.66 35.90±5.34 37.42±3.30 36.92±3.84 34.6±4.5
Shahdara 15.75±6.34 21.43±9.13 24.70±3.77 34.41±7.04 35.06±5.20 28.95±5.18 27.59±3.64 28.59±7.14 29.4±3.9
Nizamuddin 17.56±2.84 15.77±2.10 25.07±8.86 30.42±6.59 30.20±5.55 37.25±3.04 36.87±2.54 36.54±3.97 37.2±2.7
Siri Fort 15.00±3.35 21.08±6.31 24.10±3.78 23.78±3.63 31.70±5.07 28.30±1.67 28.88±2.24 31.50±3.04 30.1±4.0
Najafgarh ---------- 42.90±15.52 43.93±10.99 24.85±7.42 27.20±9.91 54.94±44.20 52.07±15.55 40.00±13.25 44.0±18.6
Netaji Nagar ---------- 36.94±13.53 36.70±10.72 23.71±8.80 26.06±12.49 53.69±41.46 55.64±16.83 45.57±18.20 32.1±12.7
Town Hall ---------- 50.15±13.69 57.15±26.32 40.44±16.12 34.73±29.02 74.63±52.40 110.43±29.77 77.17±33.71 49.6±16.7
Source: Central Pollution Control Board (NAAQMS series nos. 1,3,4,6,7,9 )

20
Table 3. Trends in annual means of Sulfur Dioxide levels (1989-1998) in different areas
Area 1989 1990 1991 1992 1993 1994 1995 1996 1997
Shahzada Bagh 9.98±7.50 23.66±15.09 12.10±7.59 29.03±6.38 25.75±5.79 29.79±6.51 25.98±2.01 22.56±1.23 24.2±2.1
Ashok Vihar 5.13±2.13 6.33±3.75 16.58±5.34 17.57±5.19 17.79±2.81 21.07±3.02 17.69±3.24 16.02±2.11 14.2±1.9
Janakpuri 6.14±3.21 6.54±2.23 11.98±1.92 16.25±3.19 15.04±2.05 16.18±3.98 17.82±2.70 17.01±1.93 15.9±1.9
Shahdara 13.73±4.29 23.66±15.09 17.24±5.52 16.06±6.21 22.27±3.87 21.30±2.97 22.07±3.19 19.91±4.83 15.9±4.2
Nizamuddin 13.25±4.83 7.33±2.95 11.38±10.77 16.88±2.80 13.74±2.54 16.14±2.23 15.89±1.41 17.50±1.58 17.6±1.5
Siri Fort 4.67±2.15 8.75±4.04 8.78±2.90 13.27±3.75 16.68±3.83 12.51±2.26 13.43±1.60 15.08±1.94 12.9±2.8
Najafgarh ---------- 34.66±15.18 32.06±14.25 22.04±11.92 17.11±10.99 33.39±10.15 29.28±19.99 17.21±7.17 19.0±7.6
Netaji Nagar ---------- 18.37±10.27 23.18±16.36 15.04±6.10 18.31±15.99 23.15±10.94 22.45±17.78 11.38±4.08 10.4±3.7
Town Hall ---------- 32.20±11.26 45.60±28.34 28.99±20.09 21.53±15.75 52.03±27.48 41.94±36.36 23.44±16.14 17.9±9.7
Source: Central Pollution Control Board (NAAQMS series nos. 1,3,4,6,7,9 )
21
Table 4: Comparing average levels of particulate matter during the winter after April 1, 2000 (ban on oldcommercial vehicles) with that during the winter prior to this date
Total Suspended Particulate matter (µ g/m 3) [Permissible limit = 200 µ g/m 3 ]
Respirable Suspended Particulate matter (µ g/m 3) [Permissible limit = 100µ g/m 3 ]
Station
November 1999 -February 2000
November 2000 -February 2001
November 1999 -February 2000
November 2000 -February 2001
Ashok Vihar (CPCB) 349 414 NM NMJanak Puri (CPCB) 328 405 NM NMNizamuddin (CPCB) 306 394 NM NMShadara (CPCB) 338 354 NM NMShahzada Bag (CPCB) 362 463 NM NMSiri Fort (CPCB) 311 369 NM NMITO Crossing (CPCB) 549 555 293 218Lodi Road (TERI) NM NM 224 274NM = not measured
22
Table 5. Comparing average levels of particulate matter during the two months after April 1, 2001 (CNG ruling)with that during the two months prior to this date
Total Suspended Particulate matter(µg/m 3) [Permissible limit = 200 µg/m 3 ]
Respirable Suspended Particulate matter(µg/m 3) [Permissible limit = 100µg/m 3 ]
Station
February -March2001
April -May2001
February -March2001
April -May2001
Ashok Vihar (CPCB) 334 275 NM NMJanak Puri (CPCB) 346 NM NM NMNizamuddin (CPCB) 323 336 NM NMShadara (CPCB) 334 373 NM NMShahzada Bag (CPCB) 461 496 NM NMSiri Fort (CPCB) 357 458 NM NMITO Crossing (CPCB) 515 565 177 172ITO (TERI) NM NM 162 171Lodi Road (TERI) NM NM 181 221Ashram Chowk (TERI) NM NM 185 164Badarpur (TERI) NM NM 237 217Connaught Place (TERI) NM NM 185 179Hari Nagar (TERI) NM NM 453 371INA Market (TERI) NM NM 157 173ISBT (TERI) NM NM 202 224Jawaharlal NehruUniversity (TERI)
NM NM 229 284
Laxmi Nagar (TERI) NM NM 162 195Janakpuri (TERI) NM NM 317 373NM = Not measured
23
Table 6: Observed and expected daily (mean ±± sd) events 1997-98
Disease Observed Expected* Extra %Increase
Asthma 7.23± 7.82 5.96±4.55 1.27 ± 4.93 21.30
COAD 4.37 ± 4.97 3.50 ± 2.48 0.87 ± 3.34 24.90
ACE 10.09 ± 7.09 8.11 ± 3.07 1.97 ± 5.70 24.30
Total 21.65± 17.65 17.44 ±9.54 4.20 ± 11.38 24.10
*Calculated by assigning permissible upper level of CO and TSP in the regression model.
COAD - Chronic obstructive airways disease, ACE - acute coronary event.
24
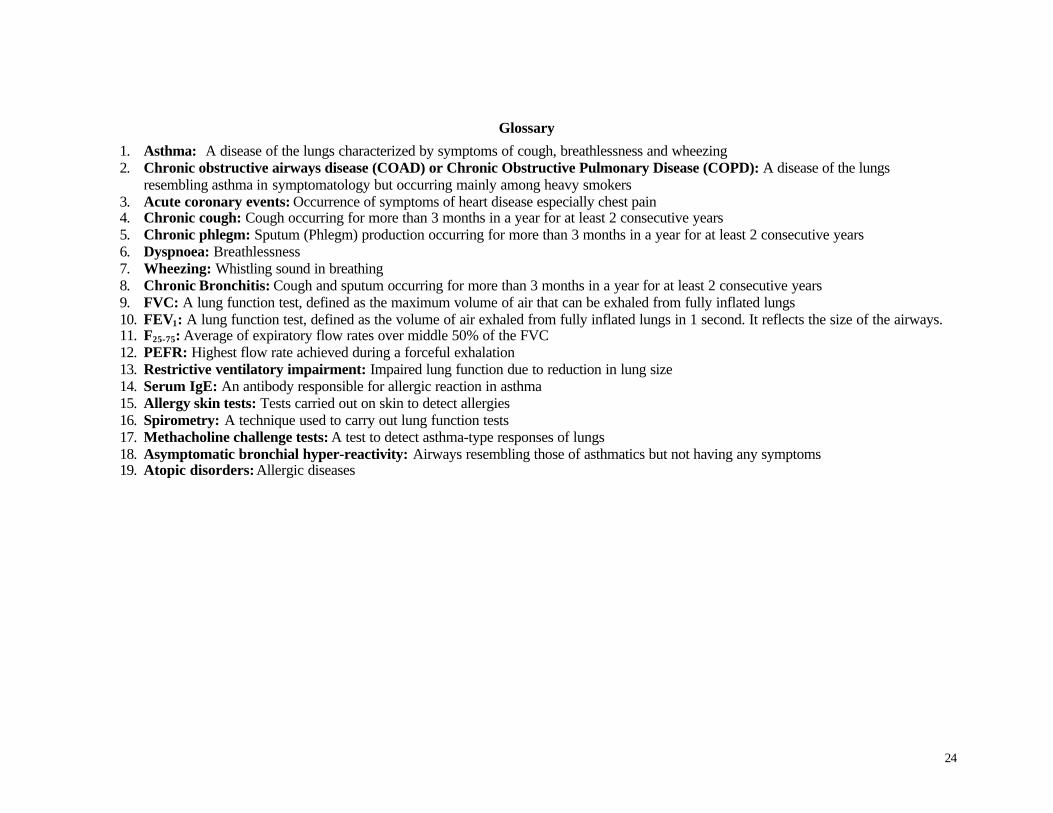
Glossary
1. Asthma: A disease of the lungs characterized by symptoms of cough, breathlessness and wheezing2. Chronic obstructive airways disease (COAD) or Chronic Obstructive Pulmonary Disease (COPD): A disease of the lungs
resembling asthma in symptomatology but occurring mainly among heavy smokers3. Acute coronary events: Occurrence of symptoms of heart disease especially chest pain4. Chronic cough: Cough occurring for more than 3 months in a year for at least 2 consecutive years5. Chronic phlegm: Sputum (Phlegm) production occurring for more than 3 months in a year for at least 2 consecutive years6. Dyspnoea: Breathlessness7. Wheezing: Whistling sound in breathing8. Chronic Bronchitis: Cough and sputum occurring for more than 3 months in a year for at least 2 consecutive years9. FVC: A lung function test, defined as the maximum volume of air that can be exhaled from fully inflated lungs10. FEV1: A lung function test, defined as the volume of air exhaled from fully inflated lungs in 1 second. It reflects the size of the airways.11. F25-75: Average of expiratory flow rates over middle 50% of the FVC12. PEFR: Highest flow rate achieved during a forceful exhalation13. Restrictive ventilatory impairment: Impaired lung function due to reduction in lung size14. Serum IgE: An antibody responsible for allergic reaction in asthma15. Allergy skin tests: Tests carried out on skin to detect allergies16. Spirometry: A technique used to carry out lung function tests17. Methacholine challenge tests: A test to detect asthma-type responses of lungs18. Asymptomatic bronchial hyper-reactivity: Airways resembling those of asthmatics but not having any symptoms19. Atopic disorders: Allergic diseases