air quality modeling analysis air quality modeling … clean fuels refinery project june 6, 2011 ....
TRANSCRIPT

Air Quality Modeling Analysis
Air Quality Modeling Update
for the Final Environmental Impact Statement
for the Mandan, Hidatsa, and Arikara Nation’s
Proposed Clean Fuels Refinery Project
June 6, 2011

Proposed Clean Fuels Refinery ii Air Quality Modeling Update
Table of Contents
Chapter 1 - Introduction ..............................................................................................................1
Chapter 2 - Air Quality Standards ...............................................................................................1
Existing Ambient Air Quality ..................................................................................................2
Chapter 3 — Air Quality Impact Analysis ...................................................................................4
Air Quality Modeling Methodology .........................................................................................5
Model Selection ...................................................................................................................5
AERMET Meteorological Data Processing ..........................................................................5
AERMOD Processing ..........................................................................................................6
Class II NAAQS Analysis Results ........................................................................................8
Chapter 6 — References..............................................................................................................8
List of Tables
Table 1 Summary of Regulatory Ambient Air Quality Concentrations (µg/m3)1..........................2
Table 2 Monitoring Data Summary .............................................................................................4
Table 3 Monitoring Data Summary by Year (µg/m³) ...................................................................4
Table 4 Dimensions of Buildings at the MHA Nation’s Proposed Clean Fuels Refinery ..............6
Table 5 Results of Class II Modeling Analysis ............................................................................8
Table A-1 Source Parameters for MHA Nation’s Proposed Clean Fuels Refinery................... A-1
Table A-2 Source Emission Rates (gm/s) for MHA Nation’s Proposed Clean Fuels Refinery . A-2
List of Figures
Figure 2-1 Ambient Air Quality Monitoring Stations...................................................................3
List of Appendices
Appendix A - Source Emission Rates and Exhaust Parameters

Chapter 1 - Introduction
The purpose of this report is to update the air quality air quality impacts associated with the
proposed Mandan, Hidatsa, and Arikara Nation’s Proposed Clean Fuels Refinery Project (MHA
Refinery). The proposed refinery will be located on the Fort Berthold Indian Reservation in
western North Dakota. The original Air Quality Technical Report for this proposed refinery was
submitted to EPA Region 8 in December, 2007.
This evaluation was done using existing monitoring data available for the MHA Refinery
proposed location and surrounding areas, projections of criteria air pollutants from the proposed
refinery, and air quality modeling. The report also identifies the federal air regulatory
requirements for air emissions from the proposed refinery.
A Vacuum Crude Heater and two Decant Oil Tank Heaters have been added to this analysis
since the December 2007 Air Quality Technical Report.
The air quality modeling conducted was compared concentrations of criteria air pollutants to the
National Ambient Air Quality Standards (NAAQS). This addresses air quality impacts from
emissions of oxides of nitrogen (NOx), carbon monoxide (CO), sulfur dioxide (SO2), and
particulate matter with nominal aerodynamic diameters of 10 microns and 2.5 microns (PM10 and
PM2.5 respectively) from the sources at the MHA Refinery.
Chapter 2 - Air Quality Standards
EPA has established NAAQS for NO2, CO, SO2, PM10, and PM2.5 have been developed to
protect public health and welfare with an adequate margin of safety. The NAAQS for these
pollutants are presented in Table 2 as well as the State of North Dakota’s ambient air quality
standards. These are the regulatory limits that concentrations of pollutants must not exceed
during the specific averaging period for an area to be considered in attainment for air quality.

MHA Refinery Air Quality Modeling Update
Proposed Clean Fuels Refinery 2 Air Quality Modeling Update
Table 1 Summary of Regulatory Ambient Air Quality Concentrations (µg/m3)1
Pollutant Averaging Time
NAAQS2
(µg/m³)
Increment
Class II
(µg/m³)
NO2
1-Hour 1883 NS
Annual 100 100
CO
1-Hour 40,000 40,000
8-Hour 10,000 10,000
PM10 24-Hour 150 150
PM2.5
24-Hour 353 NS
Annual 15 NS
SO2
1-hour 1964 715
24-Hour 365 260
Annual 80 60
1. µg/m³ = micrograms per cubic meter
2. National Ambient Air Quality Standards (40 CFR 50)
3. 98th Percentile
4. 99th Percentile
Existing Ambient Air Quality
Ambient air quality data were selected from EPA ambient air monitoring stations that would be
considered representative of the air quality at the project site. Figure 2-1 Ambient Air Quality
Monitoring Stations shows the locations of the selected monitoring stations.

"
#*
#*
#*
#*#*
CANADA
§̈¦94
Montana
North Dakota
South Dakota
Minot
Bismarck
Sidney
Havre
Miles City
Williston
Dickinson
Minot AFB
BillingsHardin
GlendiveLewistown
Poplar
Beulah
Glasgow
Mobridge
Wolf Point
38-057-0004(PM2.5 Monitor)
38-013-0004(PM10 Monitor)
38-057-0124(NO2 and SO2 Monitor)
30-111-0085(CO Monitor)
MHA Refinery
FIGURE 2-1AMBIENT AIR QUALITY
MONITORING STATIONSANALYSIS AREA: MOUNTRAIL AND WARD COUNTIES, N. DAKOTADate: 05/17/2011Drawn By: MSH
File: I:/1600/Figure 2-1.mxd
FORT BERTHOLD REFINERY EIS
0 50 10025 Miles
8Legend" MHA Refinery#* Monitoring Stations
Interstate HighwayU.S. HighwayCityState Boundary

MHA Refinery Air Quality Modeling Update
Proposed Clean Fuels Refinery 4 Air Quality Modeling Update
Table 2 summarizes the data for these monitoring sites. These data represent maximums and
averages for the years 2005 through 2009.
Table 2 Monitoring Data Summary
Pollutant
Averaging
Period
EPA Station
ID Location
Calculated
Ambient
Concentration
(µg/m³)
Calculation
Method1
NO2
1-hour 38-057-0124 Beulah, ND 41 8H Average
Annual 38-057-0124 Beulah, ND 4 Maximum
CO
1-hour 30-111-0085 Billings, MT 7,980 1H Average
8-hour 30-111-0085 Billings, MT 3,124 1H Average
PM10 24-hour 38-013-0004 Kenmare, ND 45 1H Average
PM2.5
24-hour 38-057-0004 Mercer Co., ND 16 2H Average
Annual 38-057-0004 Mercer Co., ND 6 Maximum
SO2
1-hour 38-057-0124 Beulah, ND 96 4H Average
24-hour 38-057-0124 Beulah, ND 21 1H Average
Annual 38-057-0124 Beulah, ND 3 Max Average
1. NH represents the Nth High (ex. 8H is the Eighth High for that averaging period)
Table 3 presents the monitoring data summary for each year.
Table 3 Monitoring Data Summary by Year (µg/m³) for the Stations Listed in Table 2
Year
NO2 CO PM10 PM2.5 SO2
8th
High
1-Hour Annual
Max
1-Hour
Max
8-Hour
Max
24-
Hour
2nd
High
24-
Hour Annual
4th
High
1-Hour
Max
24-
Hour Annual
2005 43 4 15,276 4,218 34 19 6 99 21 2
2006 47 4 6,726 3,078 52 19 6 94 26 2
2007 39 3 5,130 2,736 76 14 6 99 21 3
2008 36 4 5,472 2,622 32 13 6 112 21 2
2009 41 4 7,296 2,964 30 14 5 73 16 2
Chapter 3 — Air Quality Impact Analysis
The air quality modeling analysis used the same plant, source, and receptor configurations that
were used in the 2007 modeling analysis. Since the previous modeling was conducted using the
ISCST3 dispersion model, the analysis was updated using the AERMOD dispersion modeling
system which is now the EPA preferred model for this application.

MHA Refinery Air Quality Modeling Update
Proposed Clean Fuels Refinery 5 Air Quality Modeling Update
Air Quality Modeling Methodology
Model Selection
The EPA recommended AERMOD dispersion modeling system was used to evaluate Class II air
quality impacts. The AERMOD model (Version 11103) is the latest generation of the EPA’s
AERMOD model, which is recommended for predicting impacts from industrial point sources as
well as area and volume sources. The model combines simple and complex terrain algorithms,
and includes the PRIME algorithms to account for building downwash and cavity zone impacts.
The complete AERMOD modeling system is comprised of three parts—the AERMET pre-
processor, the AERMAP pre-processor, and the AERMOD model. The AERMET (Version
11059) pre-processor compiles the surface and upper-air meteorological data and formats the
data for AERMOD input. The AERMAP (Version 11103) pre-processor is used to obtain
elevation and controlling hill heights for AERMOD input.
BEEST for Windows (Version 9.83) was used to compile and generate the AERMOD model
runs.
AERMET Meteorological Data Processing
Land Use Analysis
Land use analysis for use by AERMET was processed using the AERSURFACE processor.
National Land Cover Data for North Dakota were downloaded from the U.S. Geological Survey
(USGS) webpage (http://edcftp.cr.usgs.gov/pub/data/landcover/states). Precipitation data for
each of the modeling years (2005 through 2009) were compared against a normal precipitation
summary for Minot, ND to determine whether precipitation for each year was dry (below the
30th percentile), average (30th to 70th percentile), or wet (above the 70th percentile).
Selection of the Meteorological Database
Surface data collected at Minot Airport (WBAN 24013) and upper air data collected at
Bismarck, ND (WBAN 24011) for the years 2005 through 2009 were used in this analysis.
Meteorological Data Processing
The surface and upper air data were processed with AERMET along with the output from the
AERSURFACE processing.
The preparation of the meteorological data files using AERMET was a two-step process. The
first step was the extraction of raw hourly surface observations and upper air soundings. The
extracted files were checked by AERMET module for consistency and any missing or calm
hours were identified.
The second step was to read the meteorological data and estimate the boundary layer parameters
required by AERMOD using land use surface parameters unique to the area surrounding the
project site.

MHA Refinery Air Quality Modeling Update
Proposed Clean Fuels Refinery 6 Air Quality Modeling Update
AERMOD Processing
The AERMOD model was used with regulatory default options as recommended in the EPA
Guideline on Air Quality Models as listed as follows:
• Use stack-tip downwash
• Model accounts for elevated terrain effects
• Use calms processing
• Use sequential meteorological date checking
• Use of the PRIME algorithm for sources influenced by building downwash
• Use Missing Data Processing routine
• No exponential decay calculated
Building Downwash
Building wake effects were assessed with the Building Profile Input Program with Plume Rise
Enhancements (BPIP-PRIME, dated 04274). BPIP-PRIME was also be used to analyze Good
Engineering Practice (GEP) stack heights for the point sources. Table 4 presents the dimensions
of the buildings to be used in this analysis.
Table 4 Dimensions of Buildings at the MHA Nation’s Proposed Clean Fuels Refinery
Building/Structure Length 1 (m)1 Length 2 (m) Height (m)
Office Building 71 55 12.2
Utility Building 28 33 12.2 Control Building 49 15 12.2
1. m = meter
Treatment of Chemical Transformations (for example, NO to NO2,
parameterizations)
100 percent of the NOx emissions were assumed to be NO2. No other chemical transformations
were used.
Pollutant Averaging Periods
The following air pollutants were modeled for the corresponding averaging periods:
• NOx – 1-hour and annual
• CO – 1-hour and 8-hour
• SO2 – 1-hour, 24-hour, and annual
• PM10 – 24-hour
• PM2.5 – 24-hour and annual
MHA Refinery Modeled Emission Rates
Estimated emissions for refinery sources included NOx, CO, PM10, and SO2 were presented in air
quality technical report presented to EPA on March 9, 2011 (MHA 2011). Except for the
soybean and soybean meal handling, PM2.5 emissions were assumed to be equivalent to PM10.

MHA Refinery Air Quality Modeling Update
Proposed Clean Fuels Refinery 7 Air Quality Modeling Update
For the soybean and soybean meal handling PM2.5 emission rates were assumed to be 17% of
PM10 emission rates based on information provided in EPA's AP-24 on Table 9.9.1-1. Particulate
Emission Factors for Grain Elevators (USEPA 2011a). These sources include:
• Soybean Loadout
• Meal Loadout 1
• Meal Loadout 2
For all other sources PM2.5 emission rates were assumed to be equivalent to PM10 emission rates.
For the 1-hour NO2 modeling, the emergency generator and fire pump engine were excluded
from the modeling analysis. This is recommended in recent EPA guidance for modeling 1-hour
NO2 with intermittent sources (USEPA 2011b).
For the 1-hour and 24-hour SO2 modeling, annual average emissions (that include elevated
emission events) were used. Although higher short-term SO2 emissions were estimated for this
source, these would be intermittent emissions associated with the shutdown of both Sulfur
Recovery Units (SRUs), therefore the recommendations from EPA's 1-hour NO2 modeling
guidance should be appropriate for SO2 modeling.
According to the EPA 1-hour NO2 guidance (USEPA 2011b, page 8):
"...the intermittent nature of the actual emissions associated with emergency generators
and startup/shutdown in many cases, when coupled with the probabilistic form of the
standard, could result in modeled impacts being significantly higher than actual impacts
would realistically be expected to be for these emission scenarios."
Elevated flaring emissions would be similar to startup/shutdown events since these are based on
the low probability of a shutdown of both SRUs. One SRU will normally be shutdown and will
be used as a backup should a shutdown be required for the other SRU. This design has been
developed to create an extremely low probability for the elevated flaring events. Therefore the
elevated flare emissions would not likely coincide with worst-case meteorological conditions and
maximum background concentrations.
Although the potential elevated SO2 emissions from the flare have been estimated to occur 100
hours per year, this is an extremely conservative assumption. The SRU units will be monitored
and maintained with a goal of having far fewer - if any - events over the period of a year.
Summaries of the modeled emission rates and source exhaust parameters are presented in
Appendix A.
MHA Refinery Air Quality Modeling Update
Proposed Clean Fuels Refinery 8 Air Quality Modeling Update
Receptor Network
The same receptor grid as was used in the original ISCST3 modeling analysis was used in this
analysis. The elevations for these receptors were revised using current data and the AERMAP
receptor elevation processor.
Receptor Elevations
The AERMOD pre-processor AERMAP was used to generate receptor elevations and controlling
terrain elevations.
The elevation data used to generate receptor elevations and controlling terrain elevations were
obtained from the United States Geological Survey (USGS) in a National Elevation Data (NED)
GEOTIFF format. These data were obtained from the USGS Seamless Data Warehouse
(http://seamless.usgs.gov/index.php).
Background Concentrations
Ambient air quality monitoring data for the various criteria pollutants were used to establish
background concentrations in the refinery project area. The data presented above on Table 2
were used to represent ambient background for the modeling analysis. The monitored values
reflect the impacts from existing regional sources such as power plants and mobile sources as
well as transported pollutants from neighboring states.
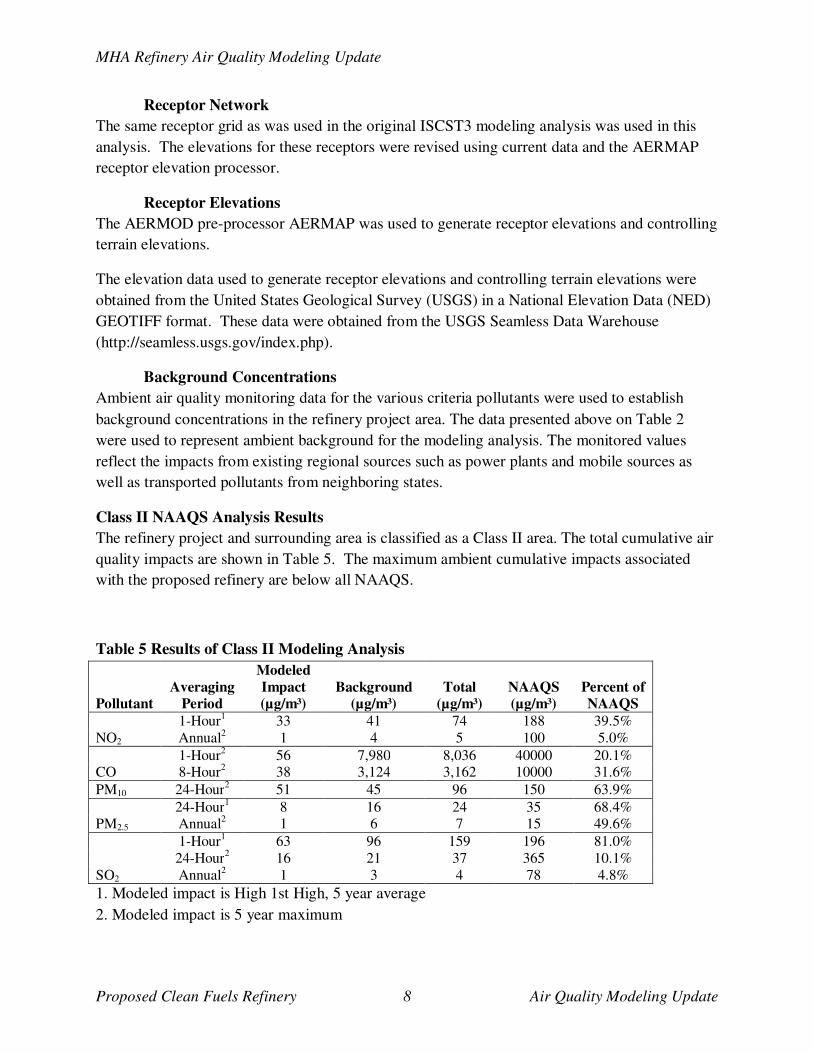
Class II NAAQS Analysis Results
The refinery project and surrounding area is classified as a Class II area. The total cumulative air
quality impacts are shown in Table 5. The maximum ambient cumulative impacts associated
with the proposed refinery are below all NAAQS.
Table 5 Results of Class II Modeling Analysis
Pollutant
Averaging
Period
Modeled
Impact
(µg/m³)
Background
(µg/m³)
Total
(µg/m³)
NAAQS
(µg/m³)
Percent of
NAAQS
NO2
1-Hour1 33 41 74 188 39.5%
Annual2 1 4 5 100 5.0%
CO 1-Hour
2 56 7,980 8,036 40000 20.1%
8-Hour2 38 3,124 3,162 10000 31.6%
PM10 24-Hour2 51 45 96 150 63.9%
PM2.5 24-Hour
1 8 16 24 35 68.4%
Annual2 1 6 7 15 49.6%
SO2
1-Hour1 63 96 159 196 81.0%
24-Hour2 16 21 37 365 10.1%
Annual2 1 3 4 78 4.8%
1. Modeled impact is High 1st High, 5 year average
2. Modeled impact is 5 year maximum

MHA Refinery Air Quality Modeling Update
Proposed Clean Fuels Refinery 9 Air Quality Modeling Update
Chapter 6 — References
MHA 2011. Addendum, Air Quality Technical Report for the Final Environmental Impact
Statement for the Mandan, Hidatsa, and Arikara Nation’s Proposed Clean Fuels Refinery Project.
March 9, 2011
U.S. EPA 2011a. Compilation of Air Pollutant Emission Factors, Fifth Edition, Volume I:
Stationary Point and Area Sources. AP42, Volume I, Supplements A, B, C, D, E, F, Updates
2001, 2002, 2003, and 2004 [Web Page] Located at: hhtp://epa.gov/ttn/chief/ap42/index.html.
Accessed: May 15, 2011.
U.S. EPA 2011b. Memorandum, Additional Clarification Regarding Application of Appendix
W Modeling Guidance for the 1-hour NO2 National Ambient Air Quality Standard.
U.S. EPA 2007. Air Quality Technical Report for the Final Environmental Impact Statement for
the Mandan, Hidatsa, and Arikara Nation’s Proposed Clean Fuels Refinery Project.

MHA Refinery Air Quality Modeling Update
Proposed Clean Fuels Refinery A-1 Air Quality Modeling Update
Appendix A - Source Emission Rates and Exhaust Parameters

MHA Refinery Air Quality Modeling Update
Proposed Clean Fuels Refinery A-2 Air Quality Modeling Update
Table A-1 Source Parameters for MHA Nation’s Proposed Clean Fuels Refinery
Model
ID Source Description
UTM X UTM-Y Elev
Stack
Height
Exhaust
Temp
Exhaust
Velocity
Stack
Diameter
(m) (m) (m) (m) (K) (m/s) (m)
00001 Crude Heater 286096.00 5317510.00 632 30.50 483 0.75 3.050
00002 Reformer Heater 1 286268.00 5317440.00 636 30.50 483 0.72 0.910
00003 Reformer Heater 2 286268.00 5317450.00 636 30.50 483 0.72 0.910
00004 Reformer Heater 3 286268.00 5317460.00 636 30.50 483 1.92 0.910
00005 Reformer Heater 4 286239.00 5317440.00 635 30.50 483 1.44 0.910
00006 Reformer Heater 5 286239.00 5317450.00 635 30.50 483 0.36 0.910
00007 Hydrocracker 1 286212.00 5317300.00 632 30.50 483 1.44 0.910
00008 Hydrocracker 2 286212.00 5317310.00 632 30.50 483 1.68 0.910
00009 Hydrocracker 3 286212.00 5317320.00 633 30.50 483 2.40 0.910
00010 Hydrocracker 4 286212.00 5317330.00 633 30.50 483 1.68 0.910
00011 Olefin 286088.00 5317440.00 631 30.50 483 7.19 0.910
00012 Hydrogen 286272.00 5317500.00 636 30.50 483 11.98 0.910
00013 Boiler 1 286018.00 5317470.00 631 30.50 483 4.79 0.910
00014 Boiler 2 286018.00 5317460.00 631 30.50 483 4.79 0.910
00015 Boiler 3 286018.00 5317450.00 631 30.50 483 4.79 0.910
00016 Flare 286186.00 5317070.00 631 54.90 1273 40.30 0.840
00017 Sulfur Incinerator 286090.00 5317380.00 631 36.60 311 0.03 3.050
00018 Standby Generator 286021.28 5317373.97 631 6.10 797 50.29 0.300
00019 Fire Pump 285913.66 5317224.77 631 6.10 730 9.74 0.300
00020 Soybean Loadout 286295.23 5317621.01 637 11.60 294 6.47 0.300
00021 Meal Loadout 1 286295.23 5317596.55 637 11.60 294 6.47 0.300
00022 Meal Loadout 2 286327.03 5317596.55 637 11.60 294 6.47 0.300
00023
Vacuum Crude
Heater 286096.00 5317510.00 632 30.50 483 0.75 3.050
00024
Decant Oil Tank
Heater 1 286096.00 5317510.00 632 30.50 483 4.79 0.910
00025
Decant Oil Tank
Heater 2 286096.00 5317510.00 632 30.50 483 4.79 0.910

MHA Refinery Air Quality Modeling Update
Proposed Clean Fuels Refinery A-3 Air Quality Modeling Update
Table A-2 Source Emission Rates (gm/s) for MHA Nation’s Proposed Clean Fuels Refinery
Model
ID Source Description
NOx CO PM10 PM2.5 SO2
1-hour Annual 1-hour 8-hour
24-
hour
24-
hour Annual 1-hour
24-
hour Annual
00001 Crude Heater 0.4820 0.1991 0.6464 0.6464 0.0403 0.0403 0.0401 0.1395 0.1395 0.0615
00002 Reformer Heater 1 0.0413 0.0171 0.0554 0.0554 0.0035 0.0035 0.0034 0.0120 0.0120 0.0053
00003 Reformer Heater 2 0.0413 0.0171 0.0554 0.0554 0.0035 0.0035 0.0034 0.0120 0.0120 0.0053
00004 Reformer Heater 3 0.1102 0.0455 0.1478 0.1478 0.0092 0.0092 0.0092 0.0319 0.0319 0.0141
00005 Reformer Heater 4 0.0826 0.0341 0.1108 0.1108 0.0069 0.0069 0.0069 0.0239 0.0239 0.0105
00006 Reformer Heater 5 0.0207 0.0085 0.0277 0.0277 0.0017 0.0017 0.0017 0.0060 0.0060 0.0026
00007 Hydrocracker 1 0.0826 0.0341 0.1108 0.1108 0.0069 0.0069 0.0069 0.0239 0.0239 0.0105
00008 Hydrocracker 2 0.0964 0.0398 0.1293 0.1293 0.0081 0.0081 0.0080 0.0279 0.0279 0.0123
00009 Hydrocracker 3 0.1377 0.0569 0.1847 0.1847 0.0115 0.0115 0.0115 0.0399 0.0399 0.0176
00010 Hydrocracker 4 0.0964 0.0398 0.1293 0.1293 0.0081 0.0081 0.0080 0.0279 0.0279 0.0123
00011 Olefin 0.4131 0.1706 0.5541 0.5541 0.0345 0.0345 0.0344 0.1196 0.1196 0.0527
00012 Hydrogen 0.6885 0.2844 0.9235 0.9235 0.0576 0.0576 0.0573 0.1993 0.1993 0.0879
00013 Boiler 1 0.2754 0.1015 0.3694 0.3694 0.0230 0.0230 0.0229 0.0797 0.0797 0.0352
00014 Boiler 2 0.2754 0.1015 0.3694 0.3694 0.0230 0.0230 0.0229 0.0797 0.0797 0.0352
00015 Boiler 3 0.2754 0.1015 0.3694 0.3694 0.0230 0.0230 0.0229 0.0797 0.0797 0.0352
00016 Flare 0.0857 0.0857 0.4662 0.4662 0.0115 0.0115 0.0115 0.8193 0.8193 0.8193
00017 Sulfur Incinerator 0.0000 0.0000 0.6000 0.6000 0.0000 0.0000 0.0000 1.0698 1.0698 1.0577
00018 Standby Generator 2.4809 0.1412 0.1814 0.1814 0.0202 0.0202 0.0011 0.0617 0.0617 0.0035
00019 Fire Pump 0.4586 0.0261 0.0202 0.0202 0.0050 0.0050 0.0003 0.0126 0.0126 0.0007
00020 Soybean Loadout 0.0000 0.0000 0.0000 0.0000 0.1184 0.0201 0.0201 0.0000 0.0000 0.0000
00021 Meal Loadout 1 0.0000 0.0000 0.0000 0.0000 0.0680 0.0116 0.0115 0.0000 0.0000 0.0000
00022 Meal Loadout 2 0.0000 0.0000 0.0000 0.0000 0.0580 0.0099 0.0098 0.0000 0.0000 0.0000
00023 Vacuum Crude Heater 0.2066 0.0853 0.2770 0.2770 0.0173 0.0173 0.0172 0.0598 0.0598 0.0264
00024
Decant Oil Tank
Heater 1 0.0138 0.0057 0.0185 0.0185 0.0012 0.0012 0.0011 0.0040 0.0040 0.0018
00025
Decant Oil Tank
Heater 2 0.0138 0.0057 0.0185 0.0185 0.0012 0.0012 0.0011 0.0040 0.0040 0.0018