air quality study for the the village at golden triangle
TRANSCRIPT

Air Quality Study
for the
The Village at Golden Triangle 20600 Golden Triangle Road, Santa Clarita, CA 91351
PREPARED FOR:
College Tuition, LLC 2566 Overland Avenue #695
Los Angeles, CA 90064
PREPARED BY:
Westlake Village 920 Hampshire Road, Suite A5
Westlake Village, CA 91361
Los Angeles 706 S. Hill Street, 11th Floor Los Angeles, CA 90014
March 2020

The Village at Golden Triangle i City of Santa Clarita Air Quality Study March 2020
TABLE OF CONTENTS
Section Page
Executive Summary ....................................................................................................................................... 1 Introduction .................................................................................................................................................. 2 Project Description ........................................................................................................................................ 2 Regulatory Setting ......................................................................................................................................... 2 Environmental Setting ................................................................................................................................. 11 Methodology ............................................................................................................................................... 15 SCAQMD Air Quality Significance Thresholds ............................................................................................. 16 Impact Analysis ........................................................................................................................................... 20
Attachments
A CalEEMod Air Quality Emission Output Files
Figures
Figure Page
1 Regional and Local Vicinity Map ...................................................................................................... 3 2 Location of Sensitive Receptors ..................................................................................................... 14
Tables
Table Page
1 Sources and Health Effects of Criteria Air Pollutants ....................................................................... 4 2 Ambient Air Quality Standards ........................................................................................................ 7 3 Air Quality Monitoring Summary ................................................................................................... 12 4 South Coast Air Basin Attainment Status ....................................................................................... 13 5 Construction Thresholds ................................................................................................................ 17 6 Localized Significance Thresholds .................................................................................................. 18 7 Operational Thresholds .................................................................................................................. 18 8 Project Construction Schedule ....................................................................................................... 20 9 Project Construction Diesel Equipment Inventory ......................................................................... 21 10 Unmitigated Maximum Construction Emissions ............................................................................ 22 11 Unmitigated Maximum Operational Emissions ............................................................................. 22 12 Localized Construction and Operational Emissions ....................................................................... 23
Air Quality Study
The Village at Golden Triangle 1 City of Santa Clarita Air Quality Study March 2020
EXECUTIVE SUMMARY
This Air Quality Study assesses and discusses the potential air quality impacts that may occur with The
Village at Golden Triangle (Project), located in the City of Santa Clarita (City). The analysis estimates future
emission levels at surrounding land uses resulting from construction and operation of the Project and
identifies the potential for significant impacts. An evaluation of the Project’s contribution to potential
cumulative air quality impacts is also provided. Air quality worksheets are provided in Attachment A:
CalEEMod Air Quality Emission Output Files.
This report summarizes the potential for the Project to conflict with an applicable air quality plan; violate
an air quality standard or threshold; result in a cumulatively net increase of criteria pollutant emissions;
expose sensitive receptors to substantial pollutant concentrations; or create objectionable odors affecting
a substantial number of people. The findings of the analyses are as follows:
• The Project would be consistent with air quality policies set forth by the South Coast Air QualityManagement District (SCAQMD) and the Air Quality Management Plan.
• Construction and operational emissions would not contribute to short- or long-term emissions thatwould increase the carcinogenic effects on sensitive receptors. Emissions associated with operationwould not exceed the SCAQMD-recommended thresholds. Thus, the Project would not result in aregional violation of applicable air quality standards or jeopardize the timely attainment of suchstandards in the South Coast Air Basin.
• Operation of the Project will not employ toxic air contaminant–emitting processes. No substantialpollutant concentration would be generated.
• Project construction and operations would not result in significant levels of odors.
• The Project would result in less than significant cumulative air quality impacts during construction and operation of the Project.

Air Quality Study
The Village at Golden Triangle 2 City of Santa Clarita Air Quality Study March 2020
INTRODUCTION
This Air Quality Study was prepared to evaluate the potential impacts during construction and operation
of The Village at Golden Triangle (Project) in the City of Santa Clarita, California. The report provides a
summary of the Project components; describes the existing regulatory framework for air pollutants;
discusses the environmental setting of the Project; and assesses the potential environmental impacts
pertaining to air quality that may result from Project implementation. Determination of significance for
Project impacts is based on analysis in accordance with the applicable regulatory thresholds.
PROJECT DESCRIPTION
The Project site is located at 20600 Golden Triangle Road (Project site), in the City of Santa Clarita (City),
south of Golden Triangle Road and west of Isabella Parkway, as shown in Figure 1: Regional and Local
Vicinity Map. The Project site is located on Assessor Parcel Number 2836-017-054. The proposed Project
consists of the construction of 180 apartment units (18 studio units, 108 one-bedroom units, and 54 two-
bedroom units) and 417 parking stalls. Grading of the site consists of 90,000 cubic yards of cut and 90,000
cubic yards of fill; no export of soil would be required.
REGULATORY SETTING
Ambient air quality emissions present complex environmental issues that require regulatory attention on
both large and small scales. The cumulative nature of project-level and localized emissions contributing to
greater regional conditions warrants that regulatory policies be instituted on national, State, and regional
levels to address air quality concerns. The following sections outline the applicable regulatory framework
that exists at the national, State, and regional levels for air quality.
Background
The United States Environmental Protection Agency (USEPA) is responsible for federal oversight and
enforcement of air quality management policies under the 1970 Clean Air Act (CAA). Each individual state
is tasked with preparing and adhering to State Implementation Plans1 (SIPs) for achieving the goals set
forth within the CAA. California has some of the most stringent air quality policies in the country and,
through the California Air Resources Board (CARB) branch of the California Environmental Protection
Agency (CalEPA), has developed its own ambient air quality standards (AAQS).
1 A State Implementation Plan is a document prepared by each state describing existing air quality conditions and measures that will be followed to attain and maintain National Ambient Air Quality Standards.

Los Angeles County
Kern County
Ventu
ra C
ounty
Los A
ngele
s C
ounty
Sherman Oaks
Calabasas
MalibuS
an B
ern
ard
ino C
ounty
Los A
ngele
s C
ounty
Santa Monica
Santa Clarita
Chatsworth
WarnerCenter
Granada Hills
Porter RanchMission Hills
Sun Valley
Woodland Hills Encino
Culver City
Pasadena
SouthPasadena
Hollywood
Beverly Hills
Inglewood
HuntingtonPark
LosAngeles
El Monte
Montbello
Whittier
Santa Fe SpringsDowney
Monterey Park
La MiradaParamountComptonCerritos
Gardena
CarsonTorranceLakewood
Rancho PalosVerdes
Long Beach
US
66
US
101
US
101
US
101
10INTERSTATE
210INTERSTATE
210INTERSTATE
10INTERSTATE
10INTERSTATE
605INTERSTATE
710INTERSTATE
605INTERSTATE
105INTERSTATE
5INTERSTATE
5INTERSTATE
5INTERSTATE
5INTERSTATE
405INTERSTATE
405INTERSTATE
405INTERSTATE
405INTERSTATE
90CALIFORNIA
91CALIFORNIA
47CALIFORNIA
110CALIFORNIA
110CALIFORNIA
107CALIFORNIA
1CALIFORNIA
1CALIFORNIA
1CALIFORNIA
1CALIFORNIA
2CALIFORNIA
23CALIFORNIA
27CALIFORNIA
118CALIFORNIA118
CALIFORNIA
126CALIFORNIA
126CALIFORNIA
14CALIFORNIA
14CALIFORNIA
27CALIFORNIA
2CALIFORNIA
2CALIFORNIA
2CALIFORNIA
138CALIFORNIA
138CALIFORNIA
138CALIFORNIA
138CALIFORNIA
18CALIFORNIA
90CALIFORNIA
42CALIFORNIA
213CALIFORNIA
39CALIFORNIA
60CALIFORNIA
60CALIFORNIA
57CALIFORNIA
72CALIFORNIA
134CALIFORNIA
170CALIFORNIA
19CALIFORNIA
71CALIFORNIA
30CALIFORNIA
39CALIFORNIA
California Aqueduct
P a c i f i c O c e a n
NorthHollywood
Burbank
Glendale
APPROXIMATE SCALE IN MILES
52.50 10
N
Regional and Local Vicinity Map
FIGURE 1SOURCE: Google Earth - 2020; Meridian Consultants, LLC - 2020
278-001-20
ProjectLocation
APPROXIMATE SCALE IN FEET
5002500 1000
N
Project Site
Air Quality Study
The Village at Golden Triangle 4 City of Santa Clarita Air Quality Study March 2020
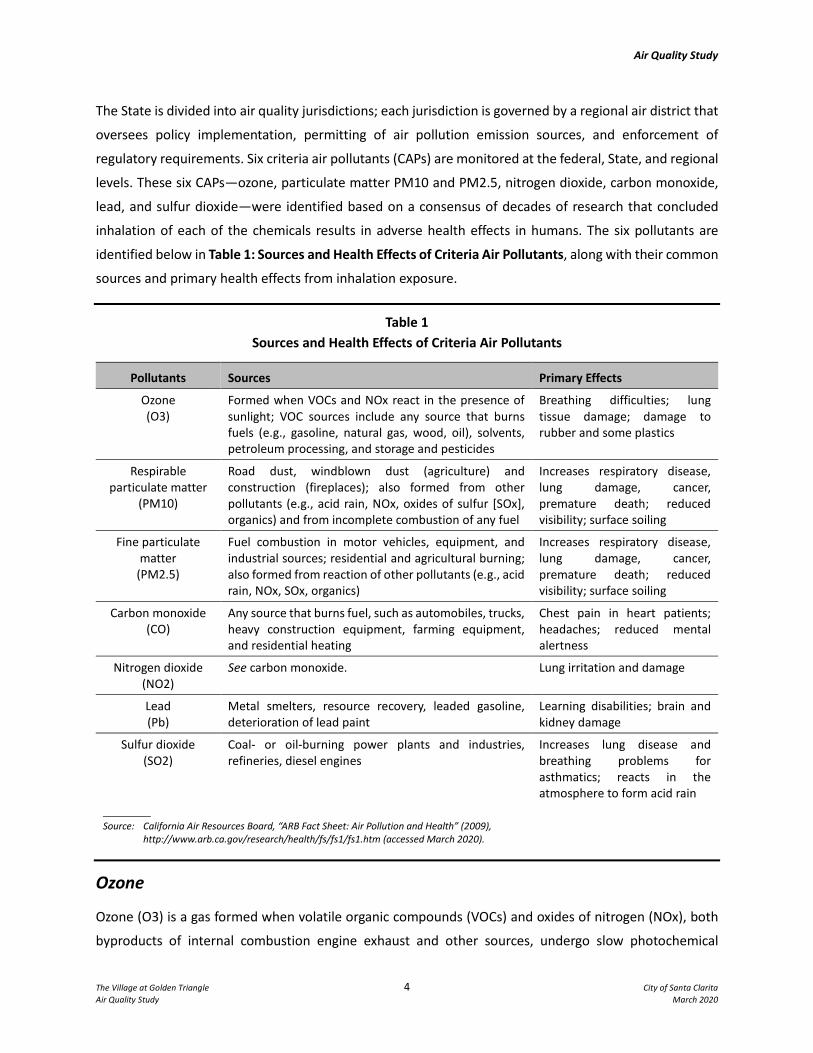
The State is divided into air quality jurisdictions; each jurisdiction is governed by a regional air district that
oversees policy implementation, permitting of air pollution emission sources, and enforcement of
regulatory requirements. Six criteria air pollutants (CAPs) are monitored at the federal, State, and regional
levels. These six CAPs—ozone, particulate matter PM10 and PM2.5, nitrogen dioxide, carbon monoxide,
lead, and sulfur dioxide—were identified based on a consensus of decades of research that concluded
inhalation of each of the chemicals results in adverse health effects in humans. The six pollutants are
identified below in Table 1: Sources and Health Effects of Criteria Air Pollutants, along with their common
sources and primary health effects from inhalation exposure.
Table 1 Sources and Health Effects of Criteria Air Pollutants
Pollutants Sources Primary Effects
Ozone (O3)
Formed when VOCs and NOx react in the presence of sunlight; VOC sources include any source that burns fuels (e.g., gasoline, natural gas, wood, oil), solvents, petroleum processing, and storage and pesticides
Breathing difficulties; lung tissue damage; damage to rubber and some plastics
Respirable particulate matter
(PM10)
Road dust, windblown dust (agriculture) and construction (fireplaces); also formed from other pollutants (e.g., acid rain, NOx, oxides of sulfur [SOx], organics) and from incomplete combustion of any fuel
Increases respiratory disease, lung damage, cancer, premature death; reduced visibility; surface soiling
Fine particulate matter
(PM2.5)
Fuel combustion in motor vehicles, equipment, and industrial sources; residential and agricultural burning; also formed from reaction of other pollutants (e.g., acid rain, NOx, SOx, organics)
Increases respiratory disease, lung damage, cancer, premature death; reduced visibility; surface soiling
Carbon monoxide (CO)
Any source that burns fuel, such as automobiles, trucks, heavy construction equipment, farming equipment, and residential heating
Chest pain in heart patients; headaches; reduced mental alertness
Nitrogen dioxide (NO2)
See carbon monoxide. Lung irritation and damage
Lead (Pb)
Metal smelters, resource recovery, leaded gasoline, deterioration of lead paint
Learning disabilities; brain and kidney damage
Sulfur dioxide (SO2)
Coal- or oil-burning power plants and industries, refineries, diesel engines
Increases lung disease and breathing problems for asthmatics; reacts in the atmosphere to form acid rain
Source: California Air Resources Board, “ARB Fact Sheet: Air Pollution and Health” (2009),
http://www.arb.ca.gov/research/health/fs/fs1/fs1.htm (accessed March 2020).
Ozone
Ozone (O3) is a gas formed when volatile organic compounds (VOCs) and oxides of nitrogen (NOx), both
byproducts of internal combustion engine exhaust and other sources, undergo slow photochemical

Air Quality Study
The Village at Golden Triangle 5 City of Santa Clarita Air Quality Study March 2020
reactions in the presence of sunlight. Ozone concentrations are generally highest during the summer
months, when direct sunlight, light wind, and warm temperature conditions are favorable to the formation
of this pollutant.
Volatile Organic Compounds
VOCs are compounds comprised primarily of atoms of hydrogen and carbon. Internal combustion
associated with motor vehicle usage is the major source of hydrocarbons. Adverse effects on human health
are not caused directly by VOCs, but rather by reactions of VOCs to form secondary air pollutants, including
ozone. VOCs themselves are not criteria pollutants; however, they contribute to the formation of ozone
and are regulated under State policies.
Respirable Particulate Matter
Respirable particulate matter (PM10) consists of extremely small, suspended particles or droplets 10
micrometers (μm) or smaller in diameter. Some sources of PM10, like pollen and windstorms, are naturally
occurring. However, in populated areas, most PM10 is caused by road dust, diesel soot, combustion
products, the abrasion of tires and brakes, and construction activities.
Fine Particulate Matter
PM2.5 refers to fine particulate matter that is 2.5 μm or smaller in size. Sources of PM2.5 include fuel
combustion from automobiles, power plants, wood burning, industrial processes, and diesel-powered
vehicles, such as buses and trucks. These fine particles are also formed in the atmosphere when gases,
such as sulfur dioxide (SO2), NOx, and VOCs are transformed in the air by chemical reactions.
Carbon Monoxide
Carbon monoxide (CO) is a colorless, odorless gas produced by the incomplete combustion of fuels. CO
concentrations tend to be the highest during winter mornings with little to no wind, when surface-based
inversions trap the pollutant at ground levels. Because CO is emitted directly from internal combustion
engines, unlike ozone, and because motor vehicles operating at slow speeds are the primary source of CO
in the South Coast Air Basin (Basin), the highest ambient CO concentrations are generally found near
congested transportation corridors and intersections.
Nitrogen Dioxide
Nitrogen dioxide (NO2) is a reddish-brown, highly reactive gas that is formed in the ambient air through
the oxidation of nitric oxide (NO). NO2 is also a byproduct of fuel combustion. The principle form of NO2
produced by combustion is NO, but NO reacts quickly to form NO2, creating the mixture of NO and NO2
referred to as NOx. NO2 acts as an acute irritant and, in equal concentrations, is more injurious than NO.

Air Quality Study
The Village at Golden Triangle 6 City of Santa Clarita Air Quality Study March 2020
At atmospheric concentrations, however, NOx is only potentially irritating. NO2 absorbs blue light, the
result of which is a brownish-red cast to the atmosphere and reduced visibility.
Lead
Lead (Pb) occurs in the atmosphere as particulate matter. The combustion of leaded gasoline is the primary
source of airborne lead in the Basin. The use of leaded gasoline is no longer permitted for on-road motor
vehicles, so most such combustion emissions are associated with off-road vehicles, such as race cars, that
use leaded gasoline. Other sources of Pb include the manufacturing and recycling of batteries; sanding or
removal of lead-based paint; ink; ceramics; ammunition; and secondary lead smelters.
Sulfur Dioxide
SO2 is a colorless, extremely irritating gas or liquid. It enters the atmosphere as a pollutant mainly as a
result of the burning of high-sulfur-content fuel oils and coal, as well as from chemical processes occurring
at chemical plants and refineries. When SO2 oxidizes in the atmosphere, it forms sulfates (SO4).
Federal
The USEPA sets national vehicle and stationary source emission standards; oversees approval of all SIPs;
provides research and guidance for air pollution programs; and sets National Ambient Air Quality
Standards (NAAQS). The NAAQS for the six CAPs are shown in Table 2: Ambient Air Quality Standards and
were identified from provisions of the 1970 CAA. The sections of the CAA that are most applicable to the
Project include Title I: Nonattainment Provisions and Title II: Mobile Source Provisions.
The CAA and the promulgated standards have evolved as a living document over time as research into the
effects of air pollution has enhanced regulatory understanding of the associated issues. The 1990
amendments to the CAA identify specific emission reduction goals for areas not meeting the NAAQS.
These amendments require both a demonstration of reasonable further progress toward attainment and
incorporation of additional sanctions for failure to attain or to meet interim milestones. On the national
level, the USEPA designates regions as achieving “attainment” or suffering from “nonattainment” of the
NAAQS based on air quality monitoring data. Regions that are designated as being in nonattainment are
responsible for devising localized strategies for reducing emissions of CAPs and achieving regional
attainment within a predetermined timeframe set by the USEPA.
The NAAQS were further amended in July 1997 to include an 8-hour standard for ozone and to adopt an
NAAQS for PM2.5. The NAAQS were amended again in September 2006 to include an established
methodology for calculating PM2.5, as well as to revoke the annual PM10 threshold. Additional revisions
to the AAQS may be implemented in the future as the science of air quality progresses.

Air Quality Study
The Village at Golden Triangle 7 City of Santa Clarita Air Quality Study March 2020
Table 2 Ambient Air Quality Standards
Pollutants Averaging
Time
California Standards Federal Standards
Concentration Method Primary Secondary Method
Ozone (O3)
1 hour 0.09 ppm
(180 µg/m3) Ultraviolet
photometry
— Same as primary standard
Ultraviolet photometry
8 hours 0.07 ppm
(137 µg/m3) 0.075 ppm
(147 µg/m3)
Respirable particulate
matter (PM10)
24 hours 50 µg/m3
Gravimetric or beta attenuation
150 µg/m3 Same as primary standard
Inertial separation
and gravimetric
analysis
Annual arithmetic
mean 20 µg/m3 —
Fine particulate matter (PM2.5)
24 hours No separate State standard 35 µg/m3 Same as primary standard
Inertial separation
and gravimetric
analysis
Annual arithmetic
mean 12 µg/m3 Gravimetric or
beta attenuation 15 µg/m3
Carbon monoxide (CO)
8 hours 9.0 ppm
(10 mg/m3) Nondispersive
infrared photometry
(NDIR)
9 ppm (10 mg/m3)
None NDIR 1 hour
20 ppm (23 mg/m3)
35 ppm (40 mg/m3)
Nitrogen dioxide (NO2)
Annual arithmetic
mean
0.03 ppm (57 µg/m3) Gas phase
chemilumi-nescence
0.053 ppm (100 µg/m3) Same as
primary standard
Gas phase chemilumi-nescence
1 hour 0.18 ppm
(339 µg/m3) 0.100 ppm
(188 µg/m3) Source: California Air Resources Board website at: http://www.arb.ca.gov/research/aaqs/aaqs.htm (accessed March 2020). Note: ppm = parts per million.
State
The California Clean Air Act, signed into law in 1988, requires all areas of the State to achieve and maintain
the California Ambient Air Quality Standards (CAAQS) by the earliest practicable date. The CARB is
responsible for the coordination and administration of both State and federal air pollution control
programs within California. In this capacity, CARB conducts research, sets CAAQS, compiles emission
inventories, develops suggested control measures, and provides oversight of local programs. CARB
establishes emissions standards for motor vehicles sold in California, consumer products, and various
types of commercial equipment. It also sets fuel specifications to further reduce vehicular emissions and
the CAAQS currently in effect for each of the criteria pollutants, as well as other pollutants recognized by

Air Quality Study
The Village at Golden Triangle 8 City of Santa Clarita Air Quality Study March 2020
the State. The CAAQS are provided in Table 2; it should be noted that the CAAQS are generally more
stringent than the NAAQS, reflecting California’s diligent efforts toward reducing air pollution and
improving air quality.
Regional
In California, jurisdiction over air quality management, enforcement, and planning divided into 35
geographic regions. Within each region, a local air district is responsible for oversight of air quality
monitoring, modeling, permitting, and enforcement to ensure that regulatory violations are avoided
wherever possible.
The Project site is located within the 6,700-square-mile Basin and is under the jurisdiction of the South
Coast Air Quality Management District (SCAQMD). The Basin includes the southern two-thirds of Los
Angeles County, all of Orange County, and the western urbanized portions of Riverside and San Bernardino
Counties.
South Coast Air Quality Management District
SCAQMD shares responsibility with CARB for ensuring that all State and federal AAQS are achieved and
maintained over an area of approximately 10,743 square miles. This area includes the South Coast and
Salton Sea Air Basins, all of Orange County, and the nondesert portions of Los Angeles, Riverside, and San
Bernardino Counties. It does not include the Antelope Valley or the nondesert portion of western San
Bernardino County.
SCAQMD is responsible for controlling emissions, primarily from stationary sources. SCAQMD maintains
air quality monitoring stations throughout the air basins. SCAQMD, in coordination with the Southern
California Association of Governments (SCAG), is also responsible for developing, updating, and
implementing the Air Quality Management Plan (AQMP) for the air basins. An AQMP is a plan prepared
and implemented by an air pollution district for a county or region designated as being in nonattainment
of the NAAQS or CAAQS. The term “nonattainment area” is used to refer to an air basin in which one or
more AAQS are exceeded. SCAQMD also prepares the SIP for its jurisdiction and promulgates rules and
regulations. The SIP includes strategies and tactics to be used to attain the federal ozone standards in the
South Coast Air Basin. The SIP elements are taken from the most recent AQMP.

Air Quality Study
The Village at Golden Triangle 9 City of Santa Clarita Air Quality Study March 2020
SCAQMD approved a Final 2016 AQMP on March 3, 2017.2 The 2016 AQMP includes transportation
control measures developed by SCAG from its 2016–2040 Regional Transportation Plan/Sustainable
Communities Strategy, as well as the integrated strategies and measures needed to meet the NAAQS. The
2016 AQMP demonstrates attainment of the 1-hour and 8-hour ozone NAAQS, as well as the latest 24-hour
and annual PM2.5 standards.
SCAQMD is responsible for limiting the amount of emissions that can be generated throughout the air
basins by various stationary, area, and mobile sources. Specific rules and regulations have been adopted
by the SCAQMD Governing Board that limit the emissions that can be generated by various uses/activities
and identifying specific pollution-reduction measures that must be implemented in association with
various uses and activities. These rules regulate not only the emissions of the federal and State criteria
pollutants, but also toxic air contaminants (TACs) and acutely hazardous materials. The rules are also
subject to ongoing refinement by SCAQMD.
Among the SCAQMD rules applicable to the Project are Rule 403 (Fugitive Dust) and Rule 1113
(Architectural Coatings). Rule 403 requires the use of stringent best available control measures (BACMs)
to minimize PM10 emissions during grading and construction activities. Rule 1113 limits the VOC content
of coatings, with a VOC content limit for flat coatings of 50 grams per liter (g/L).3 Additional details
regarding these rules and other potentially applicable rules are presented as follows.
Rule 402 (Nuisance): This rule states that a “person shall not discharge from any source whatsoever such
quantities of air contaminants or other material which cause injury, detriment, nuisance, or annoyance to
any considerable number of persons or to the public, or which endanger the comfort, repose, health or
safety of any such persons or to the public, or which cause, or have a natural tendency to cause, injury or
damage to business or property.”4
Rule 403 (Fugitive Dust). This rule requires fugitive dust sources to implement BACMs for all sources and
prohibits all forms of visible particulate matter from crossing any property line. BACMs may include
application of water or chemical stabilizers to disturbed soils covering haul vehicles; restricting vehicle
speeds on unpaved roads to 15 miles per hour (mph); sweeping loose dirt from paved site-access
roadways; cessation of construction activity when winds exceed 25 mph; and establishing a permanent
2 South Coast Air Quality Management District (SCAQMD), “Final 2016 Air Quality Management Plan” (2016), accessed March 2020, https://www.aqmd.gov/docs/default-source/clean-air-plans/air-quality-management-plans/2016-air-quality-management-plan/final-2016-aqmp/final2016aqmp.pdf?sfvrsn=15.
3 SCAQMD, “Rule 1113 Architectural Coating” (amended September 6, 2013), accessed March 2020, http://www.aqmd.gov/docs/default-source/rule-book/reg-xi/r1113.pdf.
4 SCAQMD, “Rule 402—Nuisance,” accessed March 2020, http://www.aqmd.gov/docs/default-source/rule-book/rule-iv/rule-402.pdf.

Air Quality Study
The Village at Golden Triangle 10 City of Santa Clarita Air Quality Study March 2020
ground cover on finished sites. SCAQMD Rule 403 is intended to reduce PM10 emissions from any
transportation, handling, construction, or storage activity that has the potential to generate fugitive dust
(see also Rule 1186).
Rule 1113 (Architectural Coatings). This rule requires manufacturers, distributors, and end users of
architectural and industrial maintenance coatings to reduce VOC emissions from the use of these coatings,
primarily by placing limits on the VOC content of various coating categories.
Rule 1146.2 (Emissions of Oxides of Nitrogen from Large Water Heaters and Small Boilers and Process
Heaters). This rule requires manufacturers, distributors, retailers, refurbishers, installers, and operators of
new and existing units to reduce NOx emissions from natural-gas-fired water heaters, boilers, and process
heaters as defined in this rule.
Rule 1186 (PM10 Emissions from Paved and Unpaved Roads, and Livestock Operations). This rule applies
to owners and operators of paved and unpaved roads and livestock operations. The rule is intended to
reduce PM10 emissions by requiring the cleanup of material deposited onto paved roads, use of certified
street sweeping equipment, and treatment of high-use unpaved roads (see also Rule 403).
Stationary emissions sources subject to these rules are regulated through SCAQMD’s permitting process.
Through this permitting process, SCAQMD also monitors the amount of stationary emissions being
generated and uses this information in developing AQMPs.
Local
City of Santa Clarita Conservation and Open Space Element
Local governments, such as the City of Santa Clarita, share the responsibility to implement or facilitate
some of the control measures of the AQMP. These governments have the authority to reduce air pollution
through local policies and land use decision-making authority. Specifically, local governments are
responsible for the mitigation of emissions resulting from land use decisions and for the implementation
of transportation control measures as outlined in the AQMP. The AQMP assigns local governments certain
responsibilities to assist the Basin in meeting air quality goals and policies. In general, the first step towards
assigning a local government’s responsibility is accomplished by identifying the air quality goals, policies,
and implementation measures in its General Plan.5 Applicable goals from the Conservation and Open
Space Element to improve air quality are provided below:
5 City of Santa Clarita General Plan, Conservation and Open Space Element, accessed March 2020, https://www.codepublishing.com/CA/SantaClarita/html/SantaClaritaGP/6%20-%20Conservation%20and%20Open%20Space%20Element.pdf.

Air Quality Study
The Village at Golden Triangle 11 City of Santa Clarita Air Quality Study March 2020
Goal CO 7: Clean air to protect human health and support healthy ecosystems.
Objective CO 7.1: Reduce air pollution from mobile sources.
Objective CO 7.2: Apply guidelines to protect sensitive receptors from sources of air pollution as developed by the CARB, where appropriate.
Objective CO 7.3: Coordinate with other agencies to plan for and implement programs for improving air quality in the South Coast Air Basin.
ENVIRONMENTAL SETTING
Regional Air Quality
The USEPA is the federal agency responsible for overseeing the country’s air quality and setting the NAAQS for the CAPs. The NAAQS were devised based on extensive modeling and monitoring of air pollution across
the country; they are designed to protect public health and prevent the formation of atmospheric ozone.
Air quality of a region is considered to be in attainment of the NAAQS if the measured ambient air pollutant
levels do not exceed the applicable concentration threshold. Table 2 presents the federal and State AAQS.
As noted previously, the CARB is the State agency responsible for setting the CAAQS. Air quality of a region
is considered to be in attainment of the CAAQS if the measured ambient air pollutant levels for O3, CO, NO2, SO2, PM10, PM2.5, and Pb are not exceeded, and all other standards are not equaled or exceeded
at any time in any consecutive 3-year period. The CAAQS are also presented in Table 2.
For evaluation purposes, the SCAQMD territory is divided into 38 source receptor areas (SRAs). These SRAs
are designated to provide a general representation of the local meteorological, terrain, and air quality
conditions within the particular geographical area.
The Project site is within SRA 13, Santa Clarita Valley.6 The nearest air monitoring station SCAQMD operates is located at 22224 Placerita Canyon Road.7 This station monitors O3, NO2, PM10 and PM2.5.
Table 3: Air Quality Monitoring Summary summarizes published monitoring data from 2016 through
2018, the most recent 3-year period available. The data show that during the past few years, the region
has exceeded the O3, PM10 and PM2.5 standards.
6 SCAQMD, General Forecast Areas and Air Monitoring Areas, map, accessed March 2020, http://www.aqmd.gov/docs/default-source/default-document-library/map-of-monitoring-areas.pdf.
7 South Coast Air Quality Management District, Site Survey Report for Santa Clarita–Placerita, AQS ID 060376012, accessed March 2020, http://www.aqmd.gov/docs/default-source/clean-air-plans/air-quality-monitoring-network-plan/aaqmnp-santaclarita.pdf.

Air Quality Study
The Village at Golden Triangle 12 City of Santa Clarita Air Quality Study March 2020
Table 3 Air Quality Monitoring Summary
Air Pollutant Average Time (Units) 2016 2017 2018
Ozone (O3) State Max 1 hour (ppm) 0.130 0.151 0.132
Days > CAAQS threshold (0.09 ppm) 29 45 21
National Max 8 hour (ppm) 0.115 0.128 0.106
Days > NAAQS threshold (0.075 ppm) 57 73 52
State Max 8 hour (ppm) 0.116 0.129 0.107
Days > CAAQS threshold (0.07 ppm) 59 76 553
Carbon monoxide (CO) — — —
Nitrogen dioxide (NO2) National Max 1 hour (ppm) 0.046 0.058 0.059
Days > NAAQS threshold (0.100 ppm) 0 0 0
State Max 1 hour (ppm) 0.046 0.057 0.058
Days > CAAQS threshold (0.18 ppm) 0 0 0
Respirable particulate matter (PM10)
National Max (µg/m3) 96.0 66.5 49.4
National Annual Average (µg/m3) 23.4 21.2 22.2
Days > NAAQS threshold (150 µg/m3) 0 0 0
State Max (µg/m3) 96.1 66.5 47.2
State Annual Average (µg/m3) 23.6 — —
Days > CAAQS threshold (50 µg/m3) 1 2 0
Fine particulate matter (PM2.5)
National Max (µg/m3) — — —
National Annual Average (µg/m3) — — —
Days > NAAQS threshold (35 µg/m3) — — —
State Max (µg/m3) 33.9 32.6 31.9
State Annual Average (µg/m3) 9.4 10.2 10.4 Source: CARB, iADAM: Air Quality Data Statistics. Note: (—) = Data not available.
The USEPA and the CARB designate air basins where AAQS are exceeded as “nonattainment” areas. If
standards are met, the area is designated as an “attainment” area. If there is inadequate or inconclusive
data to make a definitive attainment designation, they are considered “unclassified.” Federal
nonattainment areas are further designated as marginal, moderate, serious, severe, or extreme as a
function of deviation from standards.

Air Quality Study
The Village at Golden Triangle 13 City of Santa Clarita Air Quality Study March 2020
The current attainment designations for the Basin are shown in Table 4: South Coast Air Basin Attainment
Status. The Basin is currently designated as being in nonattainment at the federal level for O3 and PM2.5;
and at the State level for O3, PM10, and PM2.5.
Table 4 South Coast Air Basin Attainment Status
Pollutant State Status National Status
Ozone (O3) Nonattainment Nonattainment
Carbon monoxide (CO) Attainment Unclassified/Attainment
Nitrogen dioxide (NO2) Attainment Unclassified/Attainment
Sulfur dioxide (SO2) Attainment Unclassified/Attainment
Respirable particulate matter (PM10) Nonattainment Attainment
Fine particulate matter (PM2.5) Nonattainment Nonattainment
Source: California Air Resources Board (CARB), Area Designation Maps / State and National, accessed March 2020,
http://www.arb.ca.gov/desig/adm/adm.htm, last reviewed October 24, 2019.
Sensitive Receptors
The SCAQMD considers a sensitive receptor to be a person in the population who is particularly susceptible
to health effects due to exposure to an air contaminant. Sensitive receptors are identified near sources of
air pollution to determine the potential for health hazards. Locations evaluated for exposure to air
pollution include but are not limited to residences, schools, hospitals, and convalescent facilities.
Residences are located to the east across Isabella Parkway, and to the north across Soledad Canyon Road.
Figure 2: Location of Sensitive Receptors, provides a detailed image of the proximal land uses and
identifies the sensitive receptors closest to the Project site. These uses represent the nearest sensitive
receptors who may be impacted by emissions of air pollutants from Project implementation. As shown in
Figure 2, residential uses are along Isabella Parkway to the north and east and along Soledad Canyon Road
to the west.

Location of Sensitive Receptors
FIGURE 2
278-001-20
SOURCE: Google Earth - 2020; Meridian Consultants - 2020APPROXIMATE SCALE IN FEET
5002500 1000N
Legend:
Project SiteResidencial

Air Quality Study
The Village at Golden Triangle 15 City of Santa Clarita Air Quality Study March 2020
METHODOLOGY
Construction
Construction of the Project has the potential to generate temporary criteria pollutant emissions through
the use of heavy-duty construction equipment, such as excavators and forklifts, and through vehicle trips
generated from workers and haul trucks traveling to and from the Project site. In addition, fugitive dust
emissions would result from various soil-handling activities. Mobile-source emissions, primarily NOx,
would result from the use of construction equipment, such as dozers and loaders. Construction emissions
can vary substantially from day to day, depending on the level of activity, the specific type of construction
activity, and prevailing weather conditions. The assessment of construction air quality impacts considers
each of these potential sources.
Daily regional emissions during construction are forecasted by assuming a conservative estimate of
construction activities (i.e., assuming all construction occurs at the earliest feasible date) and applying the
mobile source and fugitive dust emissions factors. The Project would be required to comply with the
following regulatory compliance measures:
• Construction Equipment Controls. During construction, all off-road construction equipment greater than 50 horsepower shall meet U.S. EPA Tier 3 emission standards with Level 3 DPF to minimize emissions of NOx associated with diesel construction equipment.
• Control Efficiency of PM10. During construction, methods and techniques should be applied to various operations or equipment when appropriate to reduce estimated emissions related to particulate matter. This includes replacing ground cover in disturbed areas as quick as possible, yielding to emission reduction efficiency of 15 – 49 percent.8
The emissions are estimated using the SCAQMD-recommended CalEEMod software. CalEEMod is based
on outputs from the CARB off-road emissions model (OFFROAD) and the CARB on-road vehicle emissions
model (EMFAC), which are emissions estimation models developed by CARB and used to calculate
emissions from construction activities, including on- and off-road vehicles. The input values used in this
analysis are based on conservative assumptions in CalEEMod, with appropriate, Project-specific
adjustments based on equipment types and expected construction activities. These values were then
applied to the construction phasing assumptions used in the criteria pollutant analysis to generate criteria
8 SCAQMD, CEQA Handbook, Tables 11-4, p. 11-15 and A11-9-A, page A11-77, accessed June 2019, http://www.aqmd.gov/docs/default-source/ceqa/handbook/localized-significance-thresholds/final-sample-construction-scenario-report.pdf.

Air Quality Study
The Village at Golden Triangle 16 City of Santa Clarita Air Quality Study March 2020
pollutant emissions values for each construction activity. Detailed construction equipment lists,
construction scheduling, and emissions calculations are provided in Attachment A.
Operation
Operation of the Project has the potential to generate criteria pollutant emissions through vehicle trips
traveling to and from the Project site. In addition, emissions would result from area sources on site, such
as natural gas combustion, landscaping equipment, and use of consumer products.
Operational emissions were estimated using the CalEEMod software, which was used to forecast the daily
regional emissions from area sources that would occur during long-term Project operations. In calculating
mobile-source emissions, trip-length values were based on the distances provided in CalEEMod.
Area-source emissions are based on natural gas (building heating and water heaters), landscaping
equipment, and consumer product (including paint) usage rates provided in CalEEMod. Natural gas usage
factors in CalEEMod are based on the California Energy Commission’s California Commercial End Use
Survey data set, which provides energy demand by building type and climate zone.
SCAQMD AIR QUALITY SIGNIFICANCE THRESHOLDS
Significance Criteria
Pursuant to Section 15064.7 of the State CEQA Guidelines, a lead agency may consider using, when
available, the significance criteria established by the applicable air quality management district or air
pollution control district when making determinations of significance. SCAQMD is the agency principally
responsible for comprehensive air pollution control in the Basin. As such, SCAQMD recommends that
projects should be evaluated in terms of air pollution control thresholds established by SCAQMD and other
guidance documents. These thresholds were developed by SCAQMD to provide quantifiable levels to
which projects can be compared. The City utilizes the recommended SCAQMD thresholds of significance
for the environmental review of plans and development proposals within its jurisdiction.
The thresholds for determining the significance of impacts are set forth by SCAQMD for both construction
and operational emissions. These thresholds are described below.
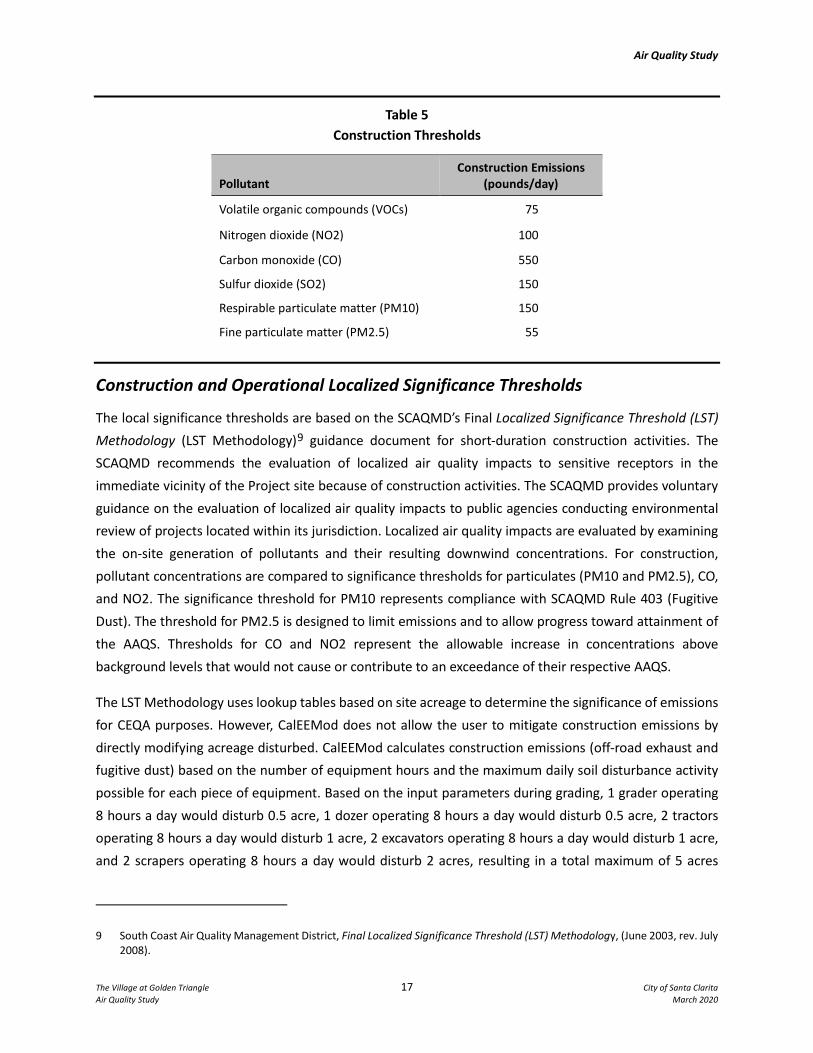
Construction Emission Thresholds
The Project will have a significant impact if it exceeds the construction thresholds listed in
Table 5: Construction Thresholds.
Air Quality Study
The Village at Golden Triangle 17 City of Santa Clarita Air Quality Study March 2020
Table 5 Construction Thresholds
Pollutant Construction Emissions
(pounds/day)
Volatile organic compounds (VOCs) 75
Nitrogen dioxide (NO2) 100
Carbon monoxide (CO) 550
Sulfur dioxide (SO2) 150
Respirable particulate matter (PM10) 150
Fine particulate matter (PM2.5) 55
Construction and Operational Localized Significance Thresholds
The local significance thresholds are based on the SCAQMD’s Final Localized Significance Threshold (LST) Methodology (LST Methodology)9 guidance document for short-duration construction activities. The SCAQMD recommends the evaluation of localized air quality impacts to sensitive receptors in the immediate vicinity of the Project site because of construction activities. The SCAQMD provides voluntary guidance on the evaluation of localized air quality impacts to public agencies conducting environmental review of projects located within its jurisdiction. Localized air quality impacts are evaluated by examining the on-site generation of pollutants and their resulting downwind concentrations. For construction, pollutant concentrations are compared to significance thresholds for particulates (PM10 and PM2.5), CO, and NO2. The significance threshold for PM10 represents compliance with SCAQMD Rule 403 (Fugitive Dust). The threshold for PM2.5 is designed to limit emissions and to allow progress toward attainment of the AAQS. Thresholds for CO and NO2 represent the allowable increase in concentrations above background levels that would not cause or contribute to an exceedance of their respective AAQS.
The LST Methodology uses lookup tables based on site acreage to determine the significance of emissions for CEQA purposes. However, CalEEMod does not allow the user to mitigate construction emissions by directly modifying acreage disturbed. CalEEMod calculates construction emissions (off-road exhaust and fugitive dust) based on the number of equipment hours and the maximum daily soil disturbance activity possible for each piece of equipment. Based on the input parameters during grading, 1 grader operating 8 hours a day would disturb 0.5 acre, 1 dozer operating 8 hours a day would disturb 0.5 acre, 2 tractors operating 8 hours a day would disturb 1 acre, 2 excavators operating 8 hours a day would disturb 1 acre, and 2 scrapers operating 8 hours a day would disturb 2 acres, resulting in a total maximum of 5 acres
9 South Coast Air Quality Management District, Final Localized Significance Threshold (LST) Methodology, (June 2003, rev. July 2008).

Air Quality Study
The Village at Golden Triangle 18 City of Santa Clarita Air Quality Study March 2020
disturbed in one day.10 Thresholds for each criteria pollutant for construction activity and Project operation of the Project site are listed in Table 6: Localized Significance Thresholds.
Table 6 Localized Significance Thresholds
Pollutant
Construction Operational
pounds/day
Nitrogen dioxide (NO2) 246 246
Carbon monoxide (CO) 1,644 1,644
Respirable particulate matter (PM10) 12 3
Fine particulate matter (PM2.5) 6 2
Notes: Based on a distance to sensitive receptors of 25 meters (82 feet). SCAQMD’s Localized Significance Threshold (LST) Methodology for CEQA Evaluations guidance document provides that projects with boundaries located closer than 25 meters to the nearest receptor should use the LSTs for receptors located at 25 meters. LST values for 5-acre site.
Operational Thresholds
Based on the SCAQMD Handbook, thresholds for each criteria pollutant for the operations of the Project
are provided in Table 7: Operational Thresholds.
Table 7 Operational Thresholds
Pollutant Operational Emissions
(pounds/day)
Volatile organic compounds (VOCs) 55
Nitrogen dioxide (NO2) 55
Carbon monoxide (CO) 550
Sulfur dioxide (SO2) 150
Respirable particulate matter (PM10) 150
Fine particulate matter (PM2.5) 55
10 SCAQMD, Fact Sheet for Applying CalEEMod to Localized Significance Thresholds, accessed March 2020, http://www.aqmd.gov/docs/default-source/ceqa/handbook/localized-significance-thresholds/caleemod-guidance.pdf.

Air Quality Study
The Village at Golden Triangle 19 City of Santa Clarita Air Quality Study March 2020
Toxic Air Contaminants
The determination of significance of a project with respect TACs shall be made on a case-by-case basis,
considering the following factors:
• Regulatory framework for toxic materials and process involved;
• Proximity of TACs to sensitive receptors;
• Quantity, volume, and toxicity of the contaminants expected to be emitted;
• Likelihood and potential level of exposure; and
• Degree to which project design will reduce risk of exposure.
Consistency with Applicable Air Quality Plans
Section 15125 of the State CEQA Guidelines requires an analysis of project consistency with applicable
governmental plans and policies. In accordance with the SCAQMD Handbook, the following criteria were
used to evaluate the Project’s consistency with SCAQMD and SCAG regional plans and policies, including
the AQMP:
• Will the Project result in any of the following:
− Increase the frequency or severity of existing air quality violations?
− Cause or contribute to new air quality violations?
− Delay the timely attainment of the air quality standards or the interim emission reductions specified in the AQMP?
• Will the Project exceed the assumptions utilized in preparing the AQMP?
− Is the Project consistent with the population and employment growth projections upon which AQMP forecasted emission levels are based?
− Does the Project include air quality mitigation measures?
− To what extent is Project development consistent with the AQMP land use policies?
Cumulative Threshold
SCAQMD recommends that a project be considered to result in a cumulatively considerable impact to air
quality if any construction-related emissions and operational emissions from individual development
projects exceed the mass daily emissions thresholds for individual projects.11
11 SCAQMD, White Paper on Regulatory Options for Addressing Cumulative Impacts from Air Pollution Emissions, board meeting, Agenda No. 29 (September 5, 2003), Appendix D, p. D-3.

Air Quality Study
The Village at Golden Triangle 20 City of Santa Clarita Air Quality Study March 2020
The SCAQMD neither recommends quantified analyses of the emissions generated by a set of cumulative
development projects nor provides thresholds of significance to be used to assess the impacts associated
with these emissions.
A project is also considered to result in a cumulatively considerable contribution to significant impacts if
the population and employment projections for the project exceed the rate of growth defined in
SCAQMD’s AQMP.
IMPACT ANALYSIS
As noted previously, emissions of air pollutants were estimated for construction and operation of the
Project using CalEEMod. Information needed to parameterize the Project in CalEEMod was obtained from
the Project Applicant. Table 8: Project Construction Schedule provides the dates and durations of each of
the activities will take place during construction, as well as a brief description of the scope of work. Future
dates represent approximations based on the general Project timeline and are subject to change pending
unpredictable circumstances that may arise.
Table 8 Project Construction Schedule
Construction Activity Start Date End Date
Duration (Days) Description
Grading 3/1/2021 11/1/2021 176 Cut and fill of 90,000 cubic yards of soil on-site
Building Construction 11/2/2021 12/26/2022 300 Construction of foundations and structures for
180 apartment units
Paving 12/27/2022 1/23/2023 20 Paving of asphalt surfaces
Architectural Coating 1/24/2023 2/20/2023 20 Application of architectural coatings to building
materials
Note: Refer to Attachment A.2 (Proposed Summer) and Attachment A.3 (Proposed Winter), Section 3.0: Construction Detail.
Construction
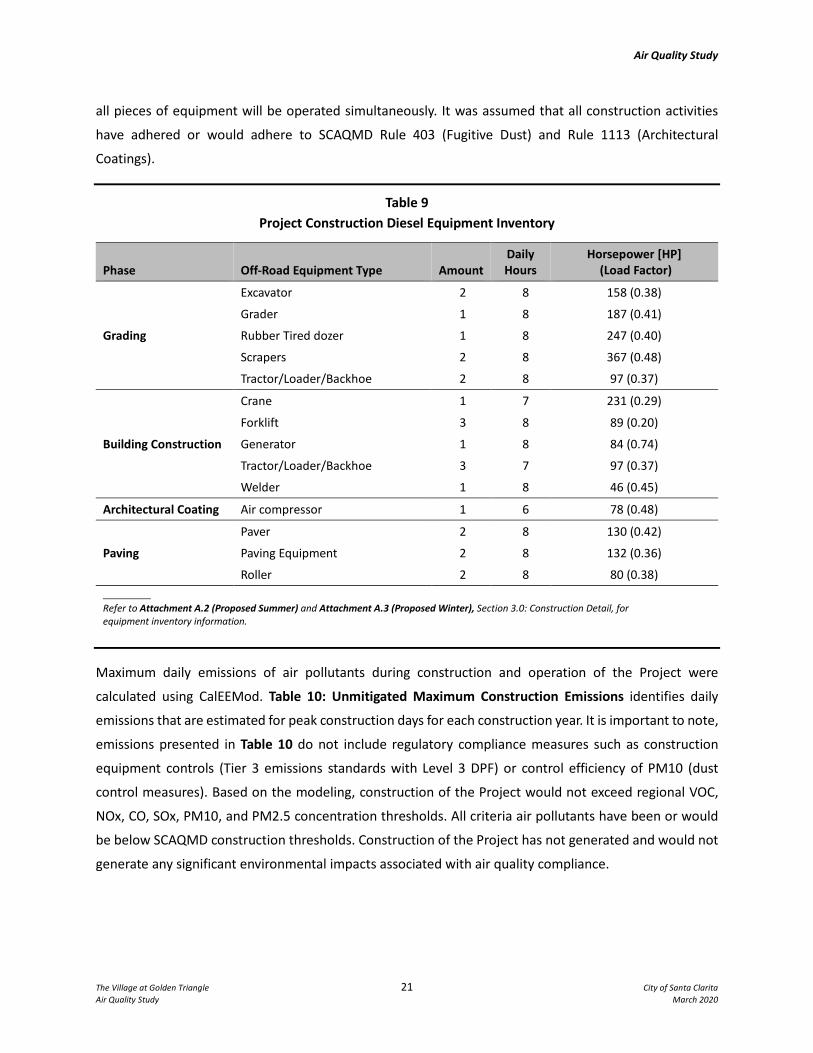
An assessment of air pollutant emissions was prepared utilizing the construction schedule in Table 9. Table
9: Project Construction Diesel Equipment Inventory displays the construction equipment required for
each activity described in Table 8. The forecast of emissions generated during Proposed Project
construction is based on assumptions regarding the type and number of off-road equipment operating. It
is important to note, the model assumes all pieces of equipment will be operated simultaneously during
each phase. This is unlikely, as different activities on the Project site would require different pieces of
equipment to be removed to allow for other equipment to operate. Conservatively this analysis assumes
Air Quality Study
The Village at Golden Triangle 21 City of Santa Clarita Air Quality Study March 2020
all pieces of equipment will be operated simultaneously. It was assumed that all construction activities
have adhered or would adhere to SCAQMD Rule 403 (Fugitive Dust) and Rule 1113 (Architectural
Coatings).
Table 9 Project Construction Diesel Equipment Inventory
Phase Off-Road Equipment Type Amount Daily Hours
Horsepower [HP] (Load Factor)
Grading
Excavator 2 8 158 (0.38)
Grader 1 8 187 (0.41)
Rubber Tired dozer 1 8 247 (0.40)
Scrapers 2 8 367 (0.48)
Tractor/Loader/Backhoe 2 8 97 (0.37)
Building Construction
Crane 1 7 231 (0.29)
Forklift 3 8 89 (0.20)
Generator 1 8 84 (0.74)
Tractor/Loader/Backhoe 3 7 97 (0.37)
Welder 1 8 46 (0.45)
Architectural Coating Air compressor 1 6 78 (0.48)
Paving
Paver 2 8 130 (0.42)
Paving Equipment 2 8 132 (0.36)
Roller 2 8 80 (0.38)
Refer to Attachment A.2 (Proposed Summer) and Attachment A.3 (Proposed Winter), Section 3.0: Construction Detail, for equipment inventory information.
Maximum daily emissions of air pollutants during construction and operation of the Project were
calculated using CalEEMod. Table 10: Unmitigated Maximum Construction Emissions identifies daily
emissions that are estimated for peak construction days for each construction year. It is important to note,
emissions presented in Table 10 do not include regulatory compliance measures such as construction
equipment controls (Tier 3 emissions standards with Level 3 DPF) or control efficiency of PM10 (dust
control measures). Based on the modeling, construction of the Project would not exceed regional VOC,
NOx, CO, SOx, PM10, and PM2.5 concentration thresholds. All criteria air pollutants have been or would
be below SCAQMD construction thresholds. Construction of the Project has not generated and would not
generate any significant environmental impacts associated with air quality compliance.

Air Quality Study
The Village at Golden Triangle 22 City of Santa Clarita Air Quality Study March 2020
Table 10 Unmitigated Maximum Construction Emissions
Source VOC NOx CO SOx PM10 PM2.5
pounds/day Unmitigated Year 2021 4 46 32 <1 9 5 Unmitigated Year 2022 3 21 25 <1 3 1 Unmitigated Year 2023 59 10 15 <1 1 1 Unmitigated Maximum 59 46 32 <1 9 5 SCAQMD Mass Daily Threshold 75 100 550 150 150 55 Threshold exceeded? No No No No No No
Source: CalEEMod. Notes: CO = carbon monoxide; NOx = nitrogen oxides; PM10 = particulate matter less than 10 microns; PM2.5 = particulate matter less than 2.5 microns; SOx = sulfur oxides; VOC = volatile organic compounds. Refer to Attachment A.2 (Proposed Summer) and Attachment A.3 (Proposed Winter), Sections 3.2 through 3.7, for maximum on-site plus off-site emissions during both the summer and winter seasons.
Operation
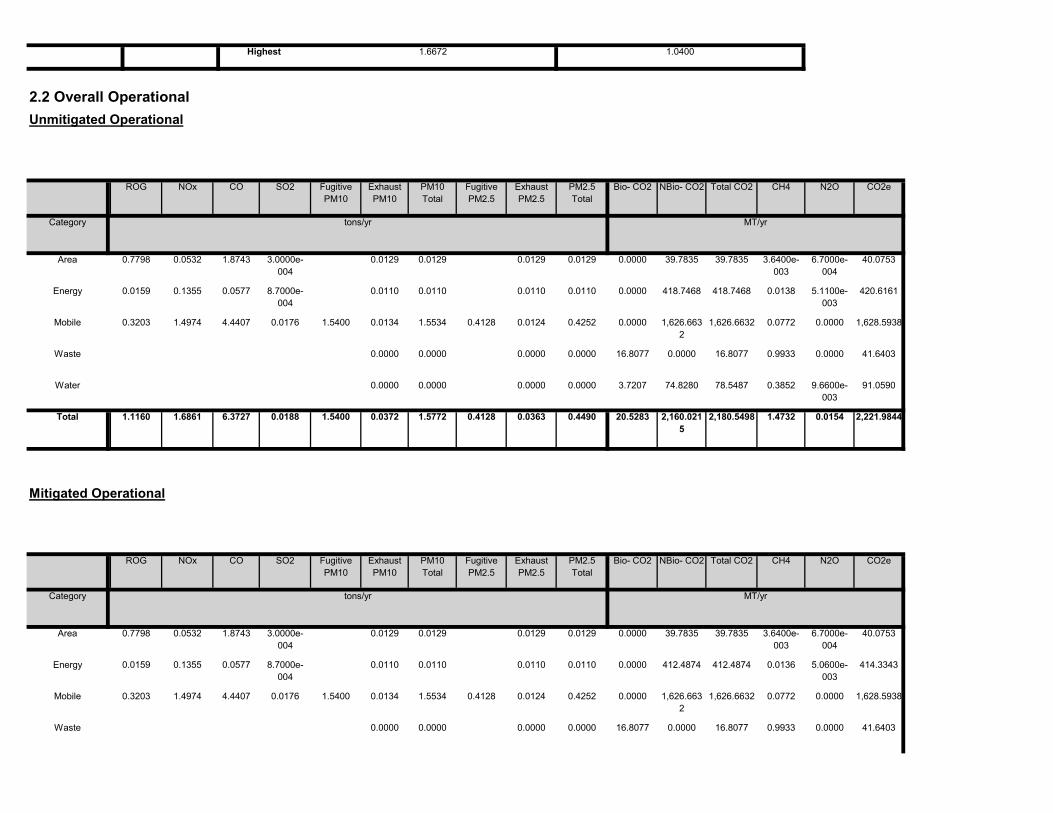
The results presented in Table 11: Unmitigated Maximum Operational Emissions are compared to the SCAQMD-established operational significance thresholds. It is important to note, emissions presented in Table 11 do not include regulatory compliance measures such as compliance with green building standards. Operational emissions will consist primarily of passenger vehicles traveling to and from the Project site. As shown in Table 11, the operational emissions would not exceed the regional VOC, NOx, CO, SOx, PM10, and PM2.5 concentration thresholds.
Table 11 Unmitigated Maximum Operational Emissions
Source VOC NOx CO SOx PM10 PM 2.5
pounds/day Area 5 3 16 <1 <1 <1 Energy <1 1 <1 <1 <1 <1 Mobile 2 9 28 <1 10 3 Total 7 12 44 <1 10 3 SCAQMD Mass Daily Threshold 55 55 550 150 150 55 Threshold exceeded? No No No No No No
Source: CalEEMod. Notes: Totals in table may not appear to add exactly due to rounding in the computer model calculations. CO = carbon monoxide; NOx = nitrogen oxides; PM10 = particulate matter less than 10 microns; PM2.5 = particulate matter less than 2.5 microns; SOx = sulfur oxides; VOC = volatile organic compounds. Refer to Attachment A.2 (Proposed Summer) and Attachment A.3 (Proposed Winter), Section 2.2, for maximum operational emissions during both the summer and winter seasons.

Air Quality Study
The Village at Golden Triangle 23 City of Santa Clarita Air Quality Study March 2020
Localized Significance Thresholds
The result of the LST analysis are provided in Table 12: Localized Construction and Operational Emissions.
These estimates assume the maximum area that would be disturbed during construction on any given day
during Project buildout. Construction would comply with the SCAQMD’s Rule 403 (Fugitive Dust), which
requires watering of the site during dust-generating construction activities, stabilizing disturbed areas with
water or chemical stabilizers, and preventing track-out dust from construction vehicles. As shown in Table
12, emissions would not exceed the localized significance construction and operational thresholds.
Table 12 Localized Construction and Operational Emissions
Source
NOx CO PM10 PM2.5
On-Site Emissions (pounds/day)
Construction Total maximum emissions 30 37 4 3 LST threshold 246 1,644 12 6 Threshold Exceeded? No No No No Operational Project area/energy emissions 3 16 <1 <1 LST threshold 246 1,644 3 2 Threshold Exceeded? No No No No
Notes: Totals in table may not appear to add exactly due to rounding in the computer model calculations. CO = carbon monoxide; NOx = nitrogen oxide; PM10 = particulate matter less than 10 microns; PM2.5 = particulate matter less than 2.5 microns. * = 0.1 lb/day. Refer to Attachment A.2 (Proposed Summer) and Attachment A.3 (Proposed Winter), Sections 3.2 through 3.7, for maximum on-site emissions during both the summer and winter seasons.
Toxic Air Contaminants
Project construction would result in short-term emissions of diesel particulate matter, which is a TAC. Off-
road heavy-duty diesel equipment would emit diesel particulate matter over the course of the
construction period. Localized diesel particulate emissions (strongly correlated with PM2.5 emissions)
would be minimal and would be substantially below localized thresholds, as shown in Table 12. Project
compliance with the CARB anti-idling measure, which limits idling to no more than 5 minutes at any
location for diesel-fueled commercial vehicles, would further minimize diesel particulate matter emissions
in the Project area.

Air Quality Study
The Village at Golden Triangle 24 City of Santa Clarita Air Quality Study March 2020
Project operations would generate only minor amounts of diesel emissions from residential delivery trucks
and incidental maintenance activities. Trucks would comply with the applicable provisions of the CARB
Truck and Bus regulation to minimize and reduce emission from existing diesel trucks. In addition, Project
operations would only result in minimal emissions of air toxics from maintenance or other ongoing
activities, such as from the use of architectural coatings or household cleaning products. As a result, toxic
or carcinogenic air pollutants are not expected to occur in any meaningful amounts in conjunction with
operation of the proposed residential uses within the Project site. Based on the uses expected on the
Project site, potential long-term operational impacts associated with the release of TACs would be minimal
and would not be expected to exceed the SCAQMD thresholds of significance.
Odors
As shown in Table 12, the construction of the Project would result in emissions below the localized
significance thresholds. Mandatory compliance with SCAQMD Rule 1113 would limit the amount of VOCs
in architectural coatings and solvents. According to the SCAQMD, while almost any source may emit
objectionable odors, some land uses are more likely to produce odors because of their operation. Land
uses more likely to produce odors include agriculture, chemical plants, composting operations, dairies,
fiberglass molding manufacturing, landfills, refineries, rendering plants, rail yards, and wastewater
treatment plants. The Project does not contain any active manufacturing activities and would not convert
current agricultural land to residential land uses. Therefore, objectionable odors would not be emitted by
the residential uses.
Any unforeseen odors generated by the Project will be controlled in accordance with SCAQMD Rule 402.
As previously noted, Rule 402 prohibits the discharge of air contaminants that harm, endanger, or annoy
individuals or the public; endanger the comfort, health or safety of individuals or the public; or cause injury
or damage to business or property. Failure to comply with Rule 402 could subject the offending facility to
possible fines and/or operational limitations in an approved odor control or odor abatement plan.
Consistency with AQMP
The Basin is designated nonattainment at the federal and State level for ozone and PM2.5. SCAQMD
developed regional emissions thresholds, as shown in Table 5 and Table 7, to determine whether a project
would contribute to air pollutant violations. If a project exceeds the regional air pollutant thresholds, then
it would significantly contribute to air quality violations in the Basin.
As shown in Table 10, temporary emissions associated with construction of the Project would fall below
SCAQMD thresholds for VOCs, NOx, CO, SOx, PM10, and PM2.5.

Air Quality Study
The Village at Golden Triangle 25 City of Santa Clarita Air Quality Study March 2020
As shown in Table 11, long-term emissions associated with operation of the Project would not exceed
SCAQMD thresholds for VOCs, NOx, CO, SOx, PM10, and PM2.5.
The Project’s maximum potential NOx, CO, PM10, and PM2.5 daily emissions during construction and
operation were analyzed to determine potential effects on localized concentrations and to determine if
the potential exists for such emissions to cause or affect a violation of an applicable AAQS. As shown in
Table 12, NOx, CO, PM10, and PM2.5 emissions would not exceed the SCAQMD localized significance
thresholds.
The Project is also located in an urban area, which would reduce vehicle trips and vehicle miles traveled
due to the Project’s urban infill characteristic and proximity to public transit stops. These measures and
features are consistent with existing recommendations to reduce air emissions.
Cumulative
Development of the Project in conjunction with the related projects near the Project would result in an
increase in construction and operational emissions in an already urbanized area of the City. However,
cumulative air quality impacts from construction, based on SCAQMD guidelines, are not analyzed in a
manner similar to project-specific air quality impacts. Instead, the SCAQMD recommends that a project’s
potential contribution to cumulative impacts should be assessed utilizing the same significance criteria as
those for project-specific impacts. According to the SCAQMD, individual development projects that
generate construction or operational emissions that exceed the SCAQMD recommended daily regional or
localized thresholds for project-specific impacts would also cause a cumulatively considerable increase in
emissions for those pollutants for which the Basin is in nonattainment.
With the implementation of regulatory compliance measures such as Rule 403 (Fugitive Dust) and Rule
1113 (Architectural Coating), the Project’s construction and operational emissions are not expected to
significantly contribute to cumulative emissions for CO, NOx, PM10, and PM2.5. As such, the Project’s
contribution to cumulative air quality emissions in combination with the related projects would not be
cumulatively considerable.
As discussed previously, the Project would not jeopardize the attainment of air quality standards in the
2016 AQMP for the South Coast Air Basin and the Los Angeles County portion of the South Coast Air Basin.
As such, the Project would not have a cumulatively considerable contribution to a potential conflict with
or obstruction of the implementation of the AQMP regional reduction plans.

Attachment ACalEEMod Air Quality Emission Output Files

Attachment A.1Annual

Construction Off-road Equipment Mitigation - As recommended by SCAQMD, alternative applicable strategies include construction equipment with Tier 3 emissions standardsArea Mitigation - Compliant with SCAQMD Rule 1113 - Architectural Coating (<50gms/liter).
Energy Mitigation -
1.3 User Entered Comments & Non-Default Data
Project Characteristics -
Land Use - Project area is approximately 18.49 acres.
Construction Phase - No demolition.
Grading - No soil import/export. 90,000 cy soil would be cut and filled within project site.
Woodstoves - No woodstoves.
CO2 Intensity (lb/MWhr)
702.44 CH4 Intensity (lb/MWhr)
0.029 N2O Intensity (lb/MWhr)
0.006
33
Climate Zone 9 Operational Year 2024
Utility Company Southern California Edison
1.2 Other Project Characteristics
Urbanization Urban Wind Speed (m/s) 2.2 Precipitation Freq (Days)
Parking Lot 417.00 Space 0.00 166,800.00 0
Floor Surface Area Population
Apartments Low Rise 180.00 Dwelling Unit 18.49 180,000.00 515
1.0 Project Characteristics
1.1 Land Usage
Land Uses Size Metric Lot Acreage
CalEEMod Version: CalEEMod.2016.3.2Page 1 of 1 Date: 3/9/2020 11:21 AM
The Village at Golden Triangle - Los Angeles-South Coast County, Annual
The Village at Golden TriangleLos Angeles-South Coast County, Annual

tblConstEquipMitigation Tier No Change Tier 3
tblConstEquipMitigation Tier No Change Tier 3
tblConstEquipMitigation Tier No Change Tier 3
tblConstEquipMitigation Tier No Change Tier 3
tblConstEquipMitigation Tier No Change Tier 3
tblConstEquipMitigation Tier No Change Tier 3
tblConstEquipMitigation Tier No Change Tier 3
tblConstEquipMitigation Tier No Change Tier 3
tblConstEquipMitigation Tier No Change Tier 3
tblConstEquipMitigation Tier No Change Tier 3
tblConstEquipMitigation Tier No Change Tier 3
tblConstEquipMitigation NumberOfEquipmentMitigated 0.00 1.00
tblConstEquipMitigation Tier No Change Tier 3
tblConstEquipMitigation NumberOfEquipmentMitigated 0.00 2.00
tblConstEquipMitigation NumberOfEquipmentMitigated 0.00 2.00
tblConstEquipMitigation NumberOfEquipmentMitigated 0.00 5.00
tblConstEquipMitigation NumberOfEquipmentMitigated 0.00 1.00
tblConstEquipMitigation NumberOfEquipmentMitigated 0.00 2.00
tblConstEquipMitigation NumberOfEquipmentMitigated 0.00 1.00
tblConstEquipMitigation NumberOfEquipmentMitigated 0.00 1.00
tblConstEquipMitigation NumberOfEquipmentMitigated 0.00 2.00
tblConstEquipMitigation NumberOfEquipmentMitigated 0.00 1.00
tblConstEquipMitigation NumberOfEquipmentMitigated 0.00 3.00
tblConstEquipMitigation NumberOfEquipmentMitigated 0.00 1.00
tblConstEquipMitigation NumberOfEquipmentMitigated 0.00 2.00
tblAreaMitigation UseLowVOCPaintParkingCheck False True
tblConstDustMitigation WaterUnpavedRoadVehicleSpeed 0 15
Water Mitigation -
Table Name Column Name Default Value New Value

0.0000 616.9211 616.9211 0.1708 0.0000 621.18980.6437 0.1966 0.8403 0.3154 0.1813 0.49672021 0.4404 4.5894 3.3426 6.9900e-003
NBio- CO2 Total CO2 CH4 N2O CO2e
Year tons/yr MT/yr
Exhaust PM10
PM10 Total
Fugitive PM2.5
Exhaust PM2.5
PM2.5 Total
Bio- CO2
2.0 Emissions Summary
2.1 Overall ConstructionUnmitigated Construction
ROG NOx CO SO2 Fugitive PM10
tblWoodstoves WoodstoveDayYear 25.00 0.00
tblWoodstoves WoodstoveWoodMass 999.60 0.00
tblWoodstoves NumberCatalytic 9.00 0.00
tblWoodstoves NumberNoncatalytic 9.00 0.00
tblLandUse LotAcreage 11.25 18.49
tblLandUse LotAcreage 3.75 0.00
tblFireplaces NumberWood 9.00 0.00
tblGrading AcresOfGrading 440.00 75.00
tblConstructionPhase PhaseStartDate 7/16/2022 12/27/2022
tblFireplaces FireplaceWoodMass 1,019.20 0.00
tblConstructionPhase PhaseStartDate 5/22/2021 11/2/2021
tblConstructionPhase PhaseStartDate 4/10/2021 3/1/2021
tblConstructionPhase PhaseEndDate 8/12/2022 1/23/2023
tblConstructionPhase PhaseStartDate 8/13/2022 1/24/2023
tblConstructionPhase PhaseEndDate 7/15/2022 12/26/2022
tblConstructionPhase PhaseEndDate 5/21/2021 11/1/2021
tblConstructionPhase NumDays 30.00 176.00
tblConstructionPhase PhaseEndDate 9/9/2022 2/20/2023
tblConstEquipMitigation Tier No Change Tier 3

8 12-1-2022 2-28-2023 0.9353 0.9165
6 6-1-2022 8-31-2022 0.7600 0.6804
7 9-1-2022 11-30-2022 0.7549 0.6762
4 12-1-2021 2-28-2022 0.7743 0.6742
5 3-1-2022 5-31-2022 0.7616 0.6820
2 6-1-2021 8-31-2021 1.6670 1.0398
3 9-1-2021 11-30-2021 1.3892 0.9206
Quarter Start Date End Date Maximum Unmitigated ROG + NOX (tons/quarter) Maximum Mitigated ROG + NOX (tons/quarter)
1 3-1-2021 5-31-2021 1.6672 1.0400
0.00 0.00 0.00 0.00 0.00 0.0035.90 15.63 30.99 44.80 9.24 29.99
NBio-CO2 Total CO2 CH4 N20 CO2e
Percent Reduction
28.98 22.92 -11.46 0.00
Exhaust PM10
PM10 Total
Fugitive PM2.5
Exhaust PM2.5
PM2.5 Total
Bio- CO2ROG NOx CO SO2 Fugitive PM10
0.0000 692.1532 692.1532 0.1708 0.0000 694.34990.3188 0.1350 0.4389 0.1351 0.1349 0.2700Maximum 0.5934 3.0737 3.8854 7.7100e-003
0.0000 23.3548 23.3548 5.4600e-003
0.0000 23.49125.7000e-003
5.8700e-003
0.0116 1.5100e-003
5.8700e-003
7.3800e-003
2023 0.5934 0.1054 0.1734 2.7000e-004
0.0000 692.1532 692.1532 0.0879 0.0000 694.34990.3188 0.1202 0.4389 0.0855 0.1200 0.20552022 0.2083 2.4851 3.3678 7.7100e-003
0.0000 616.9204 616.9204 0.1708 0.0000 621.18920.2962 0.1350 0.4312 0.1351 0.1349 0.27002021 0.1786 3.0737 3.8854 6.9900e-003
Total CO2 CH4 N2O CO2e
Year tons/yr MT/yr
PM10 Total
Fugitive PM2.5
Exhaust PM2.5
PM2.5 Total
Bio- CO2 NBio- CO2
Mitigated Construction
ROG NOx CO SO2 Fugitive PM10
Exhaust PM10
0.0000 692.1535 692.1535 0.1708 0.0000 694.35030.6437 0.1966 0.8403 0.3154 0.1813 0.4967Maximum 0.5985 4.5894 3.3426 7.7100e-003
0.0000 23.3548 23.3548 5.4600e-003
0.0000 23.49125.7000e-003
4.8300e-003
0.0105 1.5100e-003
4.5000e-003
6.0200e-003
2023 0.5985 0.0960 0.1515 2.7000e-004
0.0000 692.1535 692.1535 0.0879 0.0000 694.35030.3188 0.1080 0.4267 0.0855 0.1016 0.18712022 0.3416 2.6627 3.1690 7.7100e-003
16.8077 0.0000 16.8077 0.9933 0.0000 41.64030.0000 0.0000 0.0000 0.0000Waste
0.0000 1,626.6632
1,626.6632 0.0772 0.0000 1,628.59381.5400 0.0134 1.5534 0.4128 0.0124 0.4252Mobile 0.3203 1.4974 4.4407 0.0176
0.0000 412.4874 412.4874 0.0136 5.0600e-003
414.33430.0110 0.0110 0.0110 0.0110Energy 0.0159 0.1355 0.0577 8.7000e-004
0.0000 39.7835 39.7835 3.6400e-003
6.7000e-004
40.07530.0129 0.0129 0.0129 0.0129Area 0.7798 0.0532 1.8743 3.0000e-004
Total CO2 CH4 N2O CO2e
Category tons/yr MT/yr
PM10 Total
Fugitive PM2.5
Exhaust PM2.5
PM2.5 Total
Bio- CO2 NBio- CO2
Mitigated Operational
ROG NOx CO SO2 Fugitive PM10
Exhaust PM10
20.5283 2,160.0215
2,180.5498 1.4732 0.0154 2,221.98441.5400 0.0372 1.5772 0.4128 0.0363 0.4490Total 1.1160 1.6861 6.3727 0.0188
3.7207 74.8280 78.5487 0.3852 9.6600e-003
91.05900.0000 0.0000 0.0000 0.0000Water
16.8077 0.0000 16.8077 0.9933 0.0000 41.64030.0000 0.0000 0.0000 0.0000Waste
0.0000 1,626.6632
1,626.6632 0.0772 0.0000 1,628.59381.5400 0.0134 1.5534 0.4128 0.0124 0.4252Mobile 0.3203 1.4974 4.4407 0.0176
0.0000 418.7468 418.7468 0.0138 5.1100e-003
420.61610.0110 0.0110 0.0110 0.0110Energy 0.0159 0.1355 0.0577 8.7000e-004
0.0000 39.7835 39.7835 3.6400e-003
6.7000e-004
40.07530.0129 0.0129 0.0129 0.0129Area 0.7798 0.0532 1.8743 3.0000e-004
Total CO2 CH4 N2O CO2e
Category tons/yr MT/yr
PM10 Total
Fugitive PM2.5
Exhaust PM2.5
PM2.5 Total
Bio- CO2 NBio- CO2
2.2 Overall OperationalUnmitigated Operational
ROG NOx CO SO2 Fugitive PM10
Exhaust PM10
Highest 1.6672 1.0400

Paving Pavers 2 8.00 130 0.42
Building Construction Generator Sets 1 8.00 84 0.74
Building Construction Forklifts 3 8.00 89 0.20
Building Construction Cranes 1 7.00 231 0.29
Grading Excavators 2 8.00 158 0.38
Load Factor
Architectural Coating Air Compressors 1 6.00 78 0.48
Acres of Grading (Site Preparation Phase): 0
Acres of Grading (Grading Phase): 75
Acres of Paving: 0
Residential Indoor: 364,500; Residential Outdoor: 121,500; Non-Residential Indoor: 0; Non-Residential Outdoor: 0; Striped Parking Area:
OffRoad Equipment
Phase Name Offroad Equipment Type Amount Usage Hours Horse Power
20
4 Architectural Coating Architectural Coating 1/24/2023 2/20/2023 5 20
3 Paving Paving 12/27/2022 1/23/2023 5
176
2 Building Construction Building Construction 11/2/2021 12/26/2022 5 300
End Date Num Days Week
Num Days Phase Description
1 Grading Grading 3/1/2021 11/1/2021 5
3.0 Construction Detail
Construction Phase
Phase Number
Phase Name Phase Type Start Date
3.62 0.81 0.84 5.24 12.63 0.940.00 0.00 0.00 0.00 0.00 0.00
NBio-CO2 Total CO2 CH4 N20 CO2e
Percent Reduction
0.00 0.00 0.00 0.00
Exhaust PM10
PM10 Total
Fugitive PM2.5
Exhaust PM2.5
PM2.5 Total
Bio- CO2ROG NOx CO SO2 Fugitive PM10
19.7842 2,142.4345
2,162.2186 1.3961 0.0135 2,201.14171.5400 0.0372 1.5772 0.4128 0.0363 0.4490Total 1.1160 1.6861 6.3727 0.0188
2.9765 63.5004 66.4769 0.3083 7.7600e-003
76.49820.0000 0.0000 0.0000 0.0000Water

Category tons/yr MT/yr
Bio- CO2 NBio- CO2 Total CO2 CH4 N2O CO2eFugitive PM10
Exhaust PM10
PM10 Total
Fugitive PM2.5
Exhaust PM2.5
PM2.5 Total
ROG NOx CO SO2
3.1 Mitigation Measures Construction
Use Cleaner Engines for Construction Equipment
Water Exposed Area
Reduce Vehicle Speed on Unpaved Roads
3.2 Grading - 2021Unmitigated Construction On-Site
14.70 6.90 20.00 LD_Mix HDT_Mix HHDT
6.90 20.00 LD_Mix HDT_Mix HHDT
Architectural Coating 1 40.00 0.00 0.00
Paving 6 15.00 0.00 0.00 14.70
14.70 6.90 20.00 LD_Mix HDT_Mix HHDT
6.90 20.00 LD_Mix HDT_Mix HHDT
Building Construction 9 200.00 47.00 0.00
Grading 8 20.00 0.00 0.00 14.70
Worker Trip Length
Vendor Trip Length
Hauling Trip Length
Worker Vehicle Class
Vendor Vehicle Class
Hauling Vehicle Class
Trips and VMT
Phase Name Offroad Equipment Count
Worker Trip Number
Vendor Trip Number
Hauling Trip Number
Building Construction Welders 1 8.00 46 0.45
Grading Scrapers 2 8.00 367 0.48
Paving Paving Equipment 2 8.00 132 0.36
Grading Tractors/Loaders/Backhoes 2 8.00 97 0.37
Grading Graders 1 8.00 187 0.41
Building Construction Tractors/Loaders/Backhoes 3 7.00 97 0.37
Grading Rubber Tired Dozers 1 8.00 247 0.40
Paving Rollers 2 8.00 80 0.38

0.0000 479.5553 479.5553 0.1551 0.0000 483.43270.2222 0.1144 0.3365 0.1153 0.1144 0.2296Total 0.1340 2.6381 3.2316 5.4600e-003
0.0000 479.5553 479.5553 0.1551 0.0000 483.43270.1144 0.1144 0.1144 0.1144Off-Road 0.1340 2.6381 3.2316 5.4600e-003
0.0000 0.0000 0.0000 0.0000 0.0000 0.00000.2222 0.0000 0.2222 0.1153 0.0000 0.1153Fugitive Dust
Total CO2 CH4 N2O CO2e
Category tons/yr MT/yr
PM10 Total
Fugitive PM2.5
Exhaust PM2.5
PM2.5 Total
Bio- CO2 NBio- CO2
Mitigated Construction On-Site
ROG NOx CO SO2 Fugitive PM10
Exhaust PM10
0.0000 17.4049 17.4049 5.1000e-004
0.0000 17.41770.0193 1.6000e-004
0.0195 5.1200e-003
1.5000e-004
5.2700e-003
Total 7.5700e-003
5.9000e-003
0.0666 1.9000e-004
0.0000 17.4049 17.4049 5.1000e-004
0.0000 17.41770.0193 1.6000e-004
0.0195 5.1200e-003
1.5000e-004
5.2700e-003
Worker 7.5700e-003
5.9000e-003
0.0666 1.9000e-004
0.0000 0.0000 0.0000 0.0000 0.0000 0.00000.0000 0.0000 0.0000 0.0000 0.0000 0.0000Vendor 0.0000 0.0000 0.0000 0.0000
0.0000 0.0000 0.0000 0.0000 0.0000 0.00000.0000 0.0000 0.0000 0.0000 0.0000 0.0000
CO2e
Category tons/yr MT/yr
Hauling 0.0000 0.0000 0.0000 0.0000
PM2.5 Total
Bio- CO2 NBio- CO2 Total CO2 CH4 N2OSO2 Fugitive PM10
Exhaust PM10
PM10 Total
Fugitive PM2.5
Exhaust PM2.5
0.1551 0.0000 483.4333
Unmitigated Construction Off-Site
ROG NOx CO
0.2956 0.1607 0.4563 0.0000 479.5558 479.5558
483.4333
Total 0.3688 4.0832 2.7173 5.4600e-003
0.5697 0.1747 0.7444
0.1607 0.0000 479.5558 479.5558 0.1551 0.00005.4600e-003
0.1747 0.1747 0.1607
0.0000 0.0000 0.0000 0.0000 0.0000
Off-Road 0.3688 4.0832 2.7173
0.0000 0.5697 0.2956 0.0000 0.2956 0.0000Fugitive Dust 0.5697

Unmitigated Construction Off-Site
0.0000 50.9602 50.9602 0.0123 0.0000 51.26760.0211 0.0211 0.0198 0.0198Total 0.0418 0.3835 0.3647 5.9000e-004
0.0000 50.9602 50.9602 0.0123 0.0000 51.26760.0211 0.0211 0.0198 0.0198Off-Road 0.0418 0.3835 0.3647 5.9000e-004
Total CO2 CH4 N2O CO2e
Category tons/yr MT/yr
PM10 Total
Fugitive PM2.5
Exhaust PM2.5
PM2.5 Total
Bio- CO2 NBio- CO2
3.3 Building Construction - 2021Unmitigated Construction On-Site
ROG NOx CO SO2 Fugitive PM10
Exhaust PM10
0.0000 17.4049 17.4049 5.1000e-004
0.0000 17.41770.0193 1.6000e-004
0.0195 5.1200e-003
1.5000e-004
5.2700e-003
Total 7.5700e-003
5.9000e-003
0.0666 1.9000e-004
0.0000 17.4049 17.4049 5.1000e-004
0.0000 17.41770.0193 1.6000e-004
0.0195 5.1200e-003
1.5000e-004
5.2700e-003
Worker 7.5700e-003
5.9000e-003
0.0666 1.9000e-004
0.0000 0.0000 0.0000 0.0000 0.0000 0.00000.0000 0.0000 0.0000 0.0000 0.0000 0.0000Vendor 0.0000 0.0000 0.0000 0.0000
0.0000 0.0000 0.0000 0.0000 0.0000 0.00000.0000 0.0000 0.0000 0.0000 0.0000 0.0000Hauling 0.0000 0.0000 0.0000 0.0000
Total CO2 CH4 N2O CO2e
Category tons/yr MT/yr
PM10 Total
Fugitive PM2.5
Exhaust PM2.5
PM2.5 Total
Bio- CO2 NBio- CO2
Mitigated Construction Off-Site
ROG NOx CO SO2 Fugitive PM10
Exhaust PM10
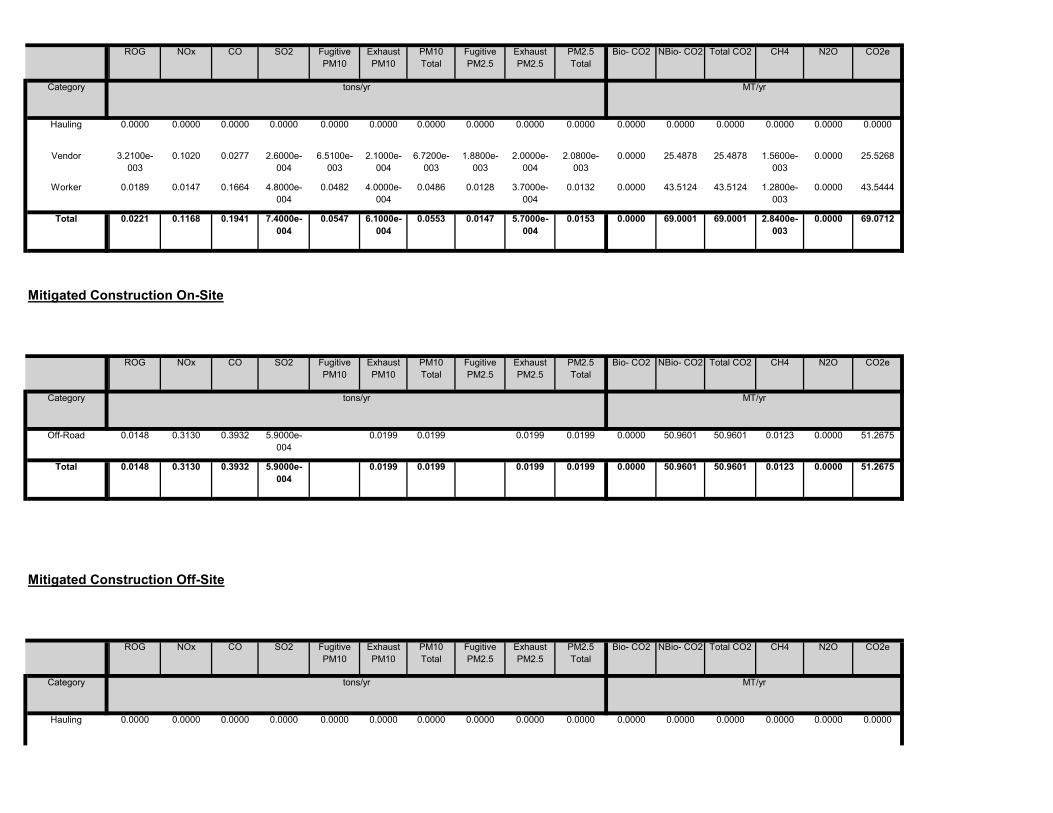
0.0000 50.9601 50.9601 0.0123 0.0000 51.26750.0199 0.0199 0.0199 0.0199Total 0.0148 0.3130 0.3932 5.9000e-004
0.0000 50.9601 50.9601 0.0123 0.0000 51.26750.0199 0.0199 0.0199 0.0199Off-Road 0.0148 0.3130 0.3932 5.9000e-004
Total CO2 CH4 N2O CO2e
Category tons/yr MT/yr
PM10 Total
Fugitive PM2.5
Exhaust PM2.5
PM2.5 Total
Bio- CO2 NBio- CO2
Mitigated Construction On-Site
ROG NOx CO SO2 Fugitive PM10
Exhaust PM10
0.0000 69.0001 69.0001 2.8400e-003
0.0000 69.07120.0547 6.1000e-004
0.0553 0.0147 5.7000e-004
0.0153Total 0.0221 0.1168 0.1941 7.4000e-004
0.0000 43.5124 43.5124 1.2800e-003
0.0000 43.54440.0482 4.0000e-004
0.0486 0.0128 3.7000e-004
0.0132Worker 0.0189 0.0147 0.1664 4.8000e-004
0.0000 25.4878 25.4878 1.5600e-003
0.0000 25.52686.5100e-003
2.1000e-004
6.7200e-003
1.8800e-003
2.0000e-004
2.0800e-003
Vendor 3.2100e-003
0.1020 0.0277 2.6000e-004
0.0000 0.0000 0.0000 0.0000 0.0000 0.00000.0000 0.0000 0.0000 0.0000 0.0000 0.0000Hauling 0.0000 0.0000 0.0000 0.0000
Total CO2 CH4 N2O CO2e
Category tons/yr MT/yr
PM10 Total
Fugitive PM2.5
Exhaust PM2.5
PM2.5 Total
Bio- CO2 NBio- CO2ROG NOx CO SO2 Fugitive PM10
Exhaust PM10

0.0000 391.2535 391.2535 0.0155 0.0000 391.64110.3184 3.3000e-003
0.3217 0.0855 3.0700e-003
0.0885Total 0.1208 0.6415 1.0443 4.2100e-003
0.0000 244.2636 244.2636 6.7300e-003
0.0000 244.43180.2805 2.2400e-003
0.2828 0.0745 2.0600e-003
0.0766Worker 0.1033 0.0775 0.8920 2.7000e-003
0.0000 146.9899 146.9899 8.7800e-003
0.0000 147.20930.0379 1.0600e-003
0.0390 0.0109 1.0100e-003
0.0120Vendor 0.0175 0.5641 0.1523 1.5100e-003
0.0000 0.0000 0.0000 0.0000 0.0000 0.00000.0000 0.0000 0.0000 0.0000 0.0000 0.0000Hauling 0.0000 0.0000 0.0000 0.0000
Total CO2 CH4 N2O CO2e
Category tons/yr MT/yr
PM10 Total
Fugitive PM2.5
Exhaust PM2.5
PM2.5 Total
Bio- CO2 NBio- CO2
Unmitigated Construction Off-Site
ROG NOx CO SO2 Fugitive PM10
Exhaust PM10
0.0000 296.6083 296.6083 0.0711 0.0000 298.38480.1036 0.1036 0.0974 0.0974Total 0.2184 1.9988 2.0945 3.4500e-003
0.0000 296.6083 296.6083 0.0711 0.0000 298.38480.1036 0.1036 0.0974 0.0974Off-Road 0.2184 1.9988 2.0945 3.4500e-003
Total CO2 CH4 N2O CO2e
Category tons/yr MT/yr
PM10 Total
Fugitive PM2.5
Exhaust PM2.5
PM2.5 Total
Bio- CO2 NBio- CO2
3.3 Building Construction - 2022Unmitigated Construction On-Site
ROG NOx CO SO2 Fugitive PM10
Exhaust PM10
0.0000 69.0001 69.0001 2.8400e-003
0.0000 69.07120.0547 6.1000e-004
0.0553 0.0147 5.7000e-004
0.0153Total 0.0221 0.1168 0.1941 7.4000e-004
0.0000 43.5124 43.5124 1.2800e-003
0.0000 43.54440.0482 4.0000e-004
0.0486 0.0128 3.7000e-004
0.0132Worker 0.0189 0.0147 0.1664 4.8000e-004
0.0000 25.4878 25.4878 1.5600e-003
0.0000 25.52686.5100e-003
2.1000e-004
6.7200e-003
1.8800e-003
2.0000e-004
2.0800e-003
Vendor 3.2100e-003
0.1020 0.0277 2.6000e-004

3.4 Paving - 2022Unmitigated Construction On-Site
0.0000 391.2535 391.2535 0.0155 0.0000 391.64110.3184 3.3000e-003
0.3217 0.0855 3.0700e-003
0.0885Total 0.1208 0.6415 1.0443 4.2100e-003
0.0000 244.2636 244.2636 6.7300e-003
0.0000 244.43180.2805 2.2400e-003
0.2828 0.0745 2.0600e-003
0.0766Worker 0.1033 0.0775 0.8920 2.7000e-003
0.0000 146.9899 146.9899 8.7800e-003
0.0000 147.20930.0379 1.0600e-003
0.0390 0.0109 1.0100e-003
0.0120Vendor 0.0175 0.5641 0.1523 1.5100e-003
0.0000 0.0000 0.0000 0.0000 0.0000 0.00000.0000 0.0000 0.0000 0.0000 0.0000 0.0000Hauling 0.0000 0.0000 0.0000 0.0000
Total CO2 CH4 N2O CO2e
Category tons/yr MT/yr
PM10 Total
Fugitive PM2.5
Exhaust PM2.5
PM2.5 Total
Bio- CO2 NBio- CO2
Mitigated Construction Off-Site
ROG NOx CO SO2 Fugitive PM10
Exhaust PM10
0.0000 296.6080 296.6080 0.0711 0.0000 298.38440.1157 0.1157 0.1157 0.1157Total 0.0863 1.8209 2.2878 3.4500e-003
0.0000 296.6080 296.6080 0.0711 0.0000 298.38440.1157 0.1157 0.1157 0.1157Off-Road 0.0863 1.8209 2.2878 3.4500e-003
Total CO2 CH4 N2O CO2e
Category tons/yr MT/yr
PM10 Total
Fugitive PM2.5
Exhaust PM2.5
PM2.5 Total
Bio- CO2 NBio- CO2
Mitigated Construction On-Site
ROG NOx CO SO2 Fugitive PM10
Exhaust PM10

0.0000 4.0055 4.0055 1.3000e-003
0.0000 4.03791.2200e-003
1.2200e-003
1.2200e-003
1.2200e-003
Off-Road 1.1200e-003
0.0226 0.0346 5.0000e-005
Total CO2 CH4 N2O CO2e
Category tons/yr MT/yr
PM10 Total
Fugitive PM2.5
Exhaust PM2.5
PM2.5 Total
Bio- CO2 NBio- CO2
Mitigated Construction On-Site
ROG NOx CO SO2 Fugitive PM10
Exhaust PM10
0.0000 0.2863 0.2863 1.0000e-005
0.0000 0.28643.3000e-004
0.0000 3.3000e-004
9.0000e-005
0.0000 9.0000e-005
Total 1.2000e-004
9.0000e-005
1.0500e-003
0.0000
0.0000 0.2863 0.2863 1.0000e-005
0.0000 0.28643.3000e-004
0.0000 3.3000e-004
9.0000e-005
0.0000 9.0000e-005
Worker 1.2000e-004
9.0000e-005
1.0500e-003
0.0000
0.0000 0.0000 0.0000 0.0000 0.0000 0.00000.0000 0.0000 0.0000 0.0000 0.0000 0.0000Vendor 0.0000 0.0000 0.0000 0.0000
0.0000 0.0000 0.0000 0.0000 0.0000 0.00000.0000 0.0000 0.0000 0.0000 0.0000 0.0000Hauling 0.0000 0.0000 0.0000 0.0000
Total CO2 CH4 N2O CO2e
Category tons/yr MT/yr
PM10 Total
Fugitive PM2.5
Exhaust PM2.5
PM2.5 Total
Bio- CO2 NBio- CO2
Unmitigated Construction Off-Site
ROG NOx CO SO2 Fugitive PM10
Exhaust PM10
0.0000 4.0055 4.0055 1.3000e-003
0.0000 4.03791.1400e-003
1.1400e-003
1.0400e-003
1.0400e-003
Total 2.2100e-003
0.0223 0.0292 5.0000e-005
0.0000 0.0000 0.0000 0.0000 0.0000 0.00000.0000 0.0000 0.0000 0.0000Paving 0.0000
0.0000 4.0055 4.0055 1.3000e-003
0.0000 4.03791.1400e-003
1.1400e-003
1.0400e-003
1.0400e-003
Off-Road 2.2100e-003
0.0223 0.0292 5.0000e-005
Total CO2 CH4 N2O CO2e
Category tons/yr MT/yr
PM10 Total
Fugitive PM2.5
Exhaust PM2.5
PM2.5 Total
Bio- CO2 NBio- CO2ROG NOx CO SO2 Fugitive PM10
Exhaust PM10

0.0000 16.0215 16.0215 5.1800e-003
0.0000 16.15104.0800e-003
4.0800e-003
3.7600e-003
3.7600e-003
Total 8.2600e-003
0.0815 0.1167 1.8000e-004
0.0000 0.0000 0.0000 0.0000 0.0000 0.00000.0000 0.0000 0.0000 0.0000Paving 0.0000
0.0000 16.0215 16.0215 5.1800e-003
0.0000 16.15104.0800e-003
4.0800e-003
3.7600e-003
3.7600e-003
Off-Road 8.2600e-003
0.0815 0.1167 1.8000e-004
Total CO2 CH4 N2O CO2e
Category tons/yr MT/yr
PM10 Total
Fugitive PM2.5
Exhaust PM2.5
PM2.5 Total
Bio- CO2 NBio- CO2
3.4 Paving - 2023Unmitigated Construction On-Site
ROG NOx CO SO2 Fugitive PM10
Exhaust PM10
0.0000 0.2863 0.2863 1.0000e-005
0.0000 0.28643.3000e-004
0.0000 3.3000e-004
9.0000e-005
0.0000 9.0000e-005
Total 1.2000e-004
9.0000e-005
1.0500e-003
0.0000
0.0000 0.2863 0.2863 1.0000e-005
0.0000 0.28643.3000e-004
0.0000 3.3000e-004
9.0000e-005
0.0000 9.0000e-005
Worker 1.2000e-004
9.0000e-005
1.0500e-003
0.0000
0.0000 0.0000 0.0000 0.0000 0.0000 0.00000.0000 0.0000 0.0000 0.0000 0.0000 0.0000Vendor 0.0000 0.0000 0.0000 0.0000
0.0000 0.0000 0.0000 0.0000 0.0000 0.00000.0000 0.0000 0.0000 0.0000 0.0000 0.0000Hauling 0.0000 0.0000 0.0000 0.0000
Total CO2 CH4 N2O CO2e
Category tons/yr MT/yr
PM10 Total
Fugitive PM2.5
Exhaust PM2.5
PM2.5 Total
Bio- CO2 NBio- CO2
Mitigated Construction Off-Site
ROG NOx CO SO2 Fugitive PM10
Exhaust PM10
0.0000 4.0055 4.0055 1.3000e-003
0.0000 4.03791.2200e-003
1.2200e-003
1.2200e-003
1.2200e-003
Total 1.1200e-003
0.0226 0.0346 5.0000e-005
0.0000 0.0000 0.0000 0.0000 0.0000 0.00000.0000 0.0000 0.0000 0.0000Paving 0.0000
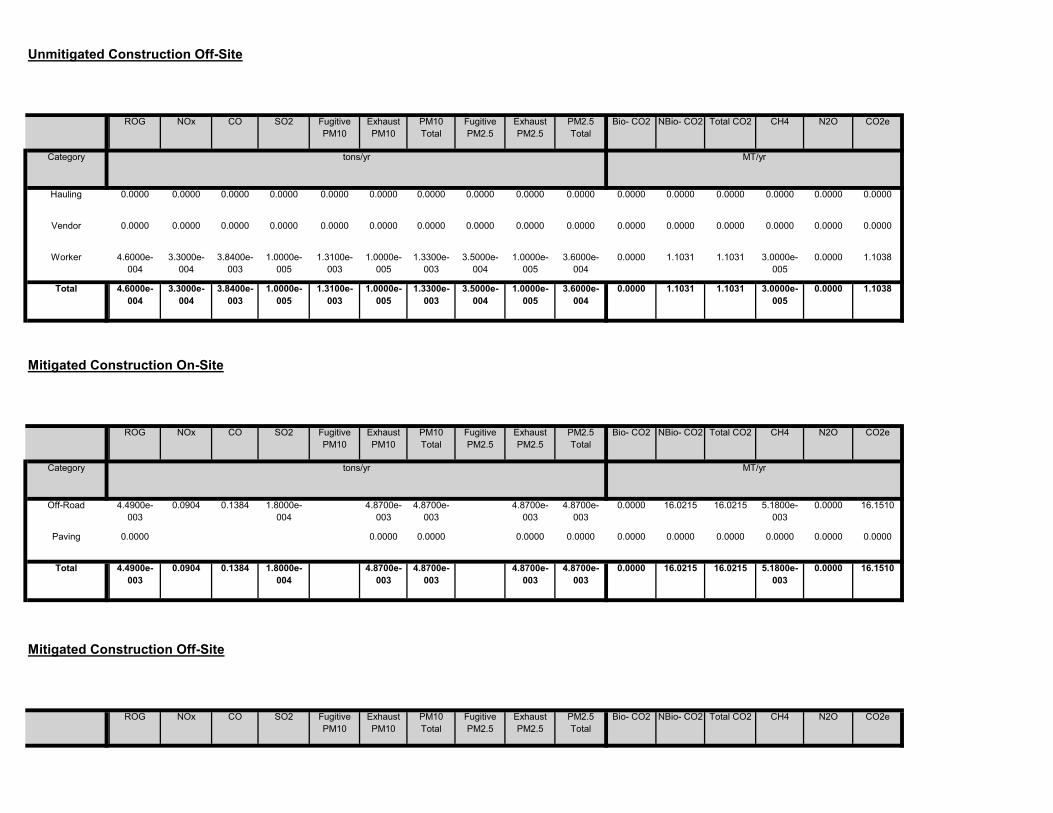
Total CO2 CH4 N2O CO2ePM10 Total
Fugitive PM2.5
Exhaust PM2.5
PM2.5 Total
Bio- CO2 NBio- CO2
Mitigated Construction Off-Site
ROG NOx CO SO2 Fugitive PM10
Exhaust PM10
0.0000 16.0215 16.0215 5.1800e-003
0.0000 16.15104.8700e-003
4.8700e-003
4.8700e-003
4.8700e-003
Total 4.4900e-003
0.0904 0.1384 1.8000e-004
0.0000 0.0000 0.0000 0.0000 0.0000 0.00000.0000 0.0000 0.0000 0.0000Paving 0.0000
0.0000 16.0215 16.0215 5.1800e-003
0.0000 16.15104.8700e-003
4.8700e-003
4.8700e-003
4.8700e-003
Off-Road 4.4900e-003
0.0904 0.1384 1.8000e-004
Total CO2 CH4 N2O CO2e
Category tons/yr MT/yr
PM10 Total
Fugitive PM2.5
Exhaust PM2.5
PM2.5 Total
Bio- CO2 NBio- CO2
Mitigated Construction On-Site
ROG NOx CO SO2 Fugitive PM10
Exhaust PM10
0.0000 1.1031 1.1031 3.0000e-005
0.0000 1.10381.3100e-003
1.0000e-005
1.3300e-003
3.5000e-004
1.0000e-005
3.6000e-004
Total 4.6000e-004
3.3000e-004
3.8400e-003
1.0000e-005
0.0000 1.1031 1.1031 3.0000e-005
0.0000 1.10381.3100e-003
1.0000e-005
1.3300e-003
3.5000e-004
1.0000e-005
3.6000e-004
Worker 4.6000e-004
3.3000e-004
3.8400e-003
1.0000e-005
0.0000 0.0000 0.0000 0.0000 0.0000 0.00000.0000 0.0000 0.0000 0.0000 0.0000 0.0000Vendor 0.0000 0.0000 0.0000 0.0000
0.0000 0.0000 0.0000 0.0000 0.0000 0.00000.0000 0.0000 0.0000 0.0000 0.0000 0.0000Hauling 0.0000 0.0000 0.0000 0.0000
Total CO2 CH4 N2O CO2e
Category tons/yr MT/yr
PM10 Total
Fugitive PM2.5
Exhaust PM2.5
PM2.5 Total
Bio- CO2 NBio- CO2
Unmitigated Construction Off-Site
ROG NOx CO SO2 Fugitive PM10
Exhaust PM10
0.0000 2.5533 2.5533 1.5000e-004
0.0000 2.55717.1000e-004
7.1000e-004
7.1000e-004
7.1000e-004
Total 0.5883 0.0130 0.0181 3.0000e-005
0.0000 2.5533 2.5533 1.5000e-004
0.0000 2.55717.1000e-004
7.1000e-004
7.1000e-004
7.1000e-004
Off-Road 1.9200e-003
0.0130 0.0181 3.0000e-005
0.0000 0.0000 0.0000 0.0000 0.0000 0.00000.0000 0.0000 0.0000 0.0000Archit. Coating 0.5864
Total CO2 CH4 N2O CO2e
Category tons/yr MT/yr
PM10 Total
Fugitive PM2.5
Exhaust PM2.5
PM2.5 Total
Bio- CO2 NBio- CO2
3.5 Architectural Coating - 2023Unmitigated Construction On-Site
ROG NOx CO SO2 Fugitive PM10
Exhaust PM10
0.0000 1.1031 1.1031 3.0000e-005
0.0000 1.10381.3100e-003
1.0000e-005
1.3300e-003
3.5000e-004
1.0000e-005
3.6000e-004
Total 4.6000e-004
3.3000e-004
3.8400e-003
1.0000e-005
0.0000 1.1031 1.1031 3.0000e-005
0.0000 1.10381.3100e-003
1.0000e-005
1.3300e-003
3.5000e-004
1.0000e-005
3.6000e-004
Worker 4.6000e-004
3.3000e-004
3.8400e-003
1.0000e-005
0.0000 0.0000 0.0000 0.0000 0.0000 0.00000.0000 0.0000 0.0000 0.0000 0.0000 0.0000Vendor 0.0000 0.0000 0.0000 0.0000
0.0000 0.0000 0.0000 0.0000 0.0000 0.00000.0000 0.0000 0.0000 0.0000 0.0000 0.0000Hauling 0.0000 0.0000 0.0000 0.0000
Category tons/yr MT/yr

4.0 Operational Detail - Mobile
0.0000 3.6770 3.6770 9.0000e-005
0.0000 3.67934.3800e-003
3.0000e-005
4.4200e-003
1.1600e-003
3.0000e-005
1.2000e-003
Total 1.5200e-003
1.0900e-003
0.0128 4.0000e-005
0.0000 3.6770 3.6770 9.0000e-005
0.0000 3.67934.3800e-003
3.0000e-005
4.4200e-003
1.1600e-003
3.0000e-005
1.2000e-003
Worker 1.5200e-003
1.0900e-003
0.0128 4.0000e-005
0.0000 0.0000 0.0000 0.0000 0.0000 0.00000.0000 0.0000 0.0000 0.0000 0.0000 0.0000Vendor 0.0000 0.0000 0.0000 0.0000
0.0000 0.0000 0.0000 0.0000 0.0000 0.00000.0000 0.0000 0.0000 0.0000 0.0000 0.0000Hauling 0.0000 0.0000 0.0000 0.0000
Total CO2 CH4 N2O CO2e
Category tons/yr MT/yr
PM10 Total
Fugitive PM2.5
Exhaust PM2.5
PM2.5 Total
Bio- CO2 NBio- CO2
Mitigated Construction Off-Site
ROG NOx CO SO2 Fugitive PM10
Exhaust PM10
0.0000 2.5533 2.5533 1.5000e-004
0.0000 2.55719.5000e-004
9.5000e-004
9.5000e-004
9.5000e-004
Total 0.5869 0.0136 0.0183 3.0000e-005
0.0000 2.5533 2.5533 1.5000e-004
0.0000 2.55719.5000e-004
9.5000e-004
9.5000e-004
9.5000e-004
Off-Road 5.9000e-004
0.0136 0.0183 3.0000e-005
0.0000 0.0000 0.0000 0.0000 0.0000 0.00000.0000 0.0000 0.0000 0.0000Archit. Coating 0.5864
Total CO2 CH4 N2O CO2e
Category tons/yr MT/yr
PM10 Total
Fugitive PM2.5
Exhaust PM2.5
PM2.5 Total
Bio- CO2 NBio- CO2
Mitigated Construction On-Site
ROG NOx CO SO2 Fugitive PM10
Exhaust PM10
0.0000 3.6770 3.6770 9.0000e-005
0.0000 3.67934.3800e-003
3.0000e-005
4.4200e-003
1.1600e-003
3.0000e-005
1.2000e-003
Total 1.5200e-003
1.0900e-003
0.0128 4.0000e-005
0.0000 3.6770 3.6770 9.0000e-005
0.0000 3.67934.3800e-003
3.0000e-005
4.4200e-003
1.1600e-003
3.0000e-005
1.2000e-003
Worker 1.5200e-003
1.0900e-003
0.0128 4.0000e-005

0.000696 0.0008500.006253 0.020617 0.031756 0.002560 0.002071 0.005217Parking Lot 0.545348 0.044620 0.206559 0.118451 0.015002
0.031756 0.002560 0.002071 0.005217 0.000696 0.000850
SBUS MH
Apartments Low Rise 0.545348 0.044620 0.206559 0.118451 0.015002 0.006253 0.020617
LHD2 MHD HHD OBUS UBUS MCYLand Use LDA LDT1 LDT2 MDV LHD1
0.00 0.00 0 0 0
4.4 Fleet Mix
19.20 40.60 86 11 3
Parking Lot 16.60 8.40 6.90 0.00
H-S or C-C H-O or C-NW Primary Diverted Pass-by
Apartments Low Rise 14.70 5.90 8.70 40.20
4.3 Trip Type Information
Miles Trip % Trip Purpose %
Land Use H-W or C-W H-S or C-C H-O or C-NW H-W or C-W
Total 1,186.20 1,288.80 1,092.60 4,057,819 4,057,819Parking Lot 0.00 0.00 0.00
Annual VMT
Apartments Low Rise 1,186.20 1,288.80 1092.60 4,057,819 4,057,819
4.2 Trip Summary Information
Average Daily Trip Rate Unmitigated MitigatedLand Use Weekday Saturday Sunday Annual VMT
0.0000 1,626.6632
1,626.6632 0.0772 0.0000 1,628.59381.5400 0.0134 1.5534 0.4128 0.0124 0.4252Unmitigated 0.3203 1.4974 4.4407 0.0176
0.0000 1,626.6632
1,626.6632 0.0772 0.0000 1,628.59381.5400 0.0134 1.5534 0.4128 0.0124 0.4252Mitigated 0.3203 1.4974 4.4407 0.0176
NBio- CO2 Total CO2 CH4 N2O CO2e
Category tons/yr MT/yr
Exhaust PM10
PM10 Total
Fugitive PM2.5
Exhaust PM2.5
PM2.5 Total
Bio- CO2
4.1 Mitigation Measures Mobile
ROG NOx CO SO2 Fugitive PM10

157.88410.0110 0.0000 156.9514 156.9514 3.0100e-003
2.8800e-003
8.7000e-004
0.0110 0.0110 0.0110
0.0000 0.0000 0.0000 0.0000
Total 0.0159 0.1355 0.0577
0.0000 0.0000 0.0000 0.0000 0.0000
157.8841
Parking Lot 0 0.0000 0.0000 0.0000 0.0000 0.0000
0.0110 0.0000 156.9514 156.9514 3.0100e-003
2.8800e-003
8.7000e-004
0.0110 0.0110 0.0110Apartments Low Rise
2.94116e+006
0.0159 0.1355 0.0577
Total CO2 CH4 N2O CO2e
Land Use kBTU/yr tons/yr MT/yr
PM10 Total
Fugitive PM2.5
Exhaust PM2.5
PM2.5 Total Bio- CO2 NBio- CO2
Unmitigated
NaturalGas Use
ROG NOx CO SO2 Fugitive PM10
Exhaust PM10
156.9514 156.9514 3.0100e-003
2.8800e-003
157.8841
5.2 Energy by Land Use - NaturalGas
0.0110 0.0110 0.0110 0.0110 0.0000
3.0100e-003
2.8800e-003
157.8841
NaturalGas Unmitigated
0.0159 0.1355 0.0577 8.7000e-004
0.0110 0.0110 0.0000 156.9514 156.9514
262.7319
NaturalGas Mitigated
0.0159 0.1355 0.0577 8.7000e-004
0.0110 0.0110
0.0000 0.0000 261.7954 261.7954 0.0108 2.2400e-003
0.0000 0.0000 0.0000
255.5360 255.5360 0.0106 2.1800e-003
256.4502
Electricity Unmitigated
0.0000 0.0000 0.0000 0.0000 0.0000
Category tons/yr MT/yr
Electricity Mitigated
Bio- CO2 NBio- CO2 Total CO2 CH4 N2O CO2eFugitive PM10
Exhaust PM10
PM10 Total
Fugitive PM2.5
Exhaust PM2.5
PM2.5 Total
ROG NOx CO SO2
5.0 Energy Detail
Historical Energy Use: N
5.1 Mitigation Measures Energy
Install Energy Efficient Appliances

262.7319
Mitigated
Electricity Use
Total CO2 CH4 N2O CO2e
Total 261.7954 0.0108 2.2400e-003
244.0643
Parking Lot 58380 18.6011 7.7000e-004
1.6000e-004
18.6677
Land Use kWh/yr ton
MT/yr
Apartments Low Rise
763270 243.1942 0.0100 2.0800e-003
157.8841
5.3 Energy by Land Use - ElectricityUnmitigated
Electricity Use
Total CO2 CH4 N2O CO2e
0.0110 0.0000 156.9514 156.9514 3.0100e-003
2.8800e-003
8.7000e-004
0.0110 0.0110 0.0110
0.0000 0.0000 0.0000 0.0000
Total 0.0159 0.1355 0.0577
0.0000 0.0000 0.0000 0.0000 0.0000
157.8841
Parking Lot 0 0.0000 0.0000 0.0000 0.0000 0.0000
0.0110 0.0000 156.9514 156.9514 3.0100e-003
2.8800e-003
8.7000e-004
0.0110 0.0110 0.0110
Land Use kBTU/yr tons/yr MT/yr
Apartments Low Rise
2.94116e+006
0.0159 0.1355 0.0577
Bio- CO2 NBio- CO2 Total CO2 CH4 N2O CO2eFugitive PM10
Exhaust PM10
PM10 Total
Fugitive PM2.5
Exhaust PM2.5
PM2.5 Total
Mitigated
NaturalGas Use
ROG NOx CO SO2

NBio- CO2 Total CO2 CH4 N2O CO2eExhaust PM10
PM10 Total
Fugitive PM2.5
Exhaust PM2.5
PM2.5 Total
Bio- CO2
40.0753
6.2 Area by SubCategoryUnmitigated
ROG NOx CO SO2 Fugitive PM10
0.0129 0.0000 39.7835 39.7835 3.6400e-003
6.7000e-004
3.0000e-004
0.0129 0.0129 0.0129
39.7835 39.7835 3.6400e-003
6.7000e-004
40.0753
Unmitigated 0.7798 0.0532 1.8743
0.0129 0.0129 0.0129 0.0129 0.0000
Category tons/yr MT/yr
Mitigated 0.7798 0.0532 1.8743 3.0000e-004
Bio- CO2 NBio- CO2 Total CO2 CH4 N2O CO2eFugitive PM10
Exhaust PM10
PM10 Total
Fugitive PM2.5
Exhaust PM2.5
PM2.5 Total
ROG NOx CO SO2
256.4502
6.0 Area Detail
6.1 Mitigation Measures Area
Use Low VOC Paint - Residential Interior
Use Low VOC Paint - Residential Exterior
Use Low VOC Cleaning Supplies
Total 255.5360 0.0106 2.1800e-003
237.7825
Parking Lot 58380 18.6011 7.7000e-004
1.6000e-004
18.6677
Land Use kWh/yr ton
MT/yr
Apartments Low Rise
743625 236.9349 9.7800e-003
2.0200e-003

7.0 Water Detail
7.1 Mitigation Measures Water
Install Low Flow Bathroom Faucet
Install Low Flow Kitchen Faucet
Install Low Flow Toilet
0.0000 39.7835 39.7835 3.6400e-003
6.7000e-004
40.07530.0129 0.0129 0.0129 0.0129Total 0.7798 0.0532 1.8743 3.0000e-004
0.0000 3.0426 3.0426 2.9400e-003
0.0000 3.11600.0103 0.0103 0.0103 0.0103Landscaping 0.0563 0.0214 1.8608 1.0000e-004
0.0000 36.7410 36.7410 7.0000e-004
6.7000e-004
36.95932.5600e-003
2.5600e-003
2.5600e-003
2.5600e-003
Hearth 3.7100e-003
0.0317 0.0135 2.0000e-004
0.0000 0.0000 0.0000 0.0000 0.0000 0.00000.0000 0.0000 0.0000 0.0000Consumer Products
0.6612
0.0000 0.0000 0.0000 0.0000 0.0000 0.00000.0000 0.0000 0.0000 0.0000Architectural Coating
0.0586
Total CO2 CH4 N2O CO2e
SubCategory tons/yr MT/yr
PM10 Total
Fugitive PM2.5
Exhaust PM2.5
PM2.5 Total
Bio- CO2 NBio- CO2
Mitigated
ROG NOx CO SO2 Fugitive PM10
Exhaust PM10
0.0000 39.7835 39.7835 3.6400e-003
6.7000e-004
40.07530.0129 0.0129 0.0129 0.0129Total 0.7798 0.0532 1.8743 3.0000e-004
0.0000 3.0426 3.0426 2.9400e-003
0.0000 3.11600.0103 0.0103 0.0103 0.0103Landscaping 0.0563 0.0214 1.8608 1.0000e-004
0.0000 36.7410 36.7410 7.0000e-004
6.7000e-004
36.95932.5600e-003
2.5600e-003
2.5600e-003
2.5600e-003
Hearth 3.7100e-003
0.0317 0.0135 2.0000e-004
0.0000 0.0000 0.0000 0.0000 0.0000 0.00000.0000 0.0000 0.0000 0.0000Consumer Products
0.6612
0.0000 0.0000 0.0000 0.0000 0.0000 0.00000.0000 0.0000 0.0000 0.0000Architectural Coating
0.0586
SubCategory tons/yr MT/yr

91.0590
Mitigated
Total 78.5487 0.3852 9.6600e-003
91.0590
Parking Lot 0 / 0 0.0000 0.0000 0.0000 0.0000
Land Use Mgal ton
MT/yr
Apartments Low Rise
11.7277 / 7.39357
78.5487 0.3852 9.6600e-003
7.2 Water by Land UseUnmitigated
Indoor/Outdoor Use
Total CO2 CH4 N2O CO2e
Unmitigated 78.5487 0.3852 9.6600e-003
91.0590
Category ton
MT/yr
Mitigated 66.4769 0.3083 7.7600e-003
76.4982
Use Water Efficient Irrigation System
Total CO2 CH4 N2O CO2e
Install Low Flow Shower

Land Use tons ton
MT/yr
8.2 Waste by Land UseUnmitigated
Waste Disposed
Total CO2 CH4 N2O CO2e
Unmitigated 16.8077 0.9933 0.0000 41.6403
ton
MT/yr
Mitigated 16.8077 0.9933 0.0000 41.6403
76.4982
8.0 Waste Detail
8.1 Mitigation Measures Waste
Category/Year
Total CO2 CH4 N2O CO2e
Total 66.4769 0.3083 7.7600e-003
76.4982
Parking Lot 0 / 0 0.0000 0.0000 0.0000 0.0000
Land Use Mgal ton
MT/yr
Apartments Low Rise
9.38218 / 6.94256
66.4769 0.3083 7.7600e-003
Indoor/Outdoor Use
Total CO2 CH4 N2O CO2e

User Defined Equipment
Equipment Type Number
Load Factor Fuel Type
Boilers
Equipment Type Number Heat Input/Day Heat Input/Year Boiler Rating Fuel Type
Horse Power Load Factor Fuel Type
10.0 Stationary Equipment
Fire Pumps and Emergency Generators
Equipment Type Number Hours/Day Hours/Year Horse Power
41.6403
9.0 Operational Offroad
Equipment Type Number Hours/Day Days/Year
Total 16.8077 0.9933 0.0000
41.6403
Parking Lot 0 0.0000 0.0000 0.0000 0.0000
Land Use tons ton
MT/yr
Apartments Low Rise
82.8 16.8077 0.9933 0.0000
41.6403
Mitigated
Waste Disposed
Total CO2 CH4 N2O CO2e
Total 16.8077 0.9933 0.0000
41.6403
Parking Lot 0 0.0000 0.0000 0.0000 0.0000
Apartments Low Rise
82.8 16.8077 0.9933 0.0000

11.0 Vegetation

Attachment A.2Proposed Summer
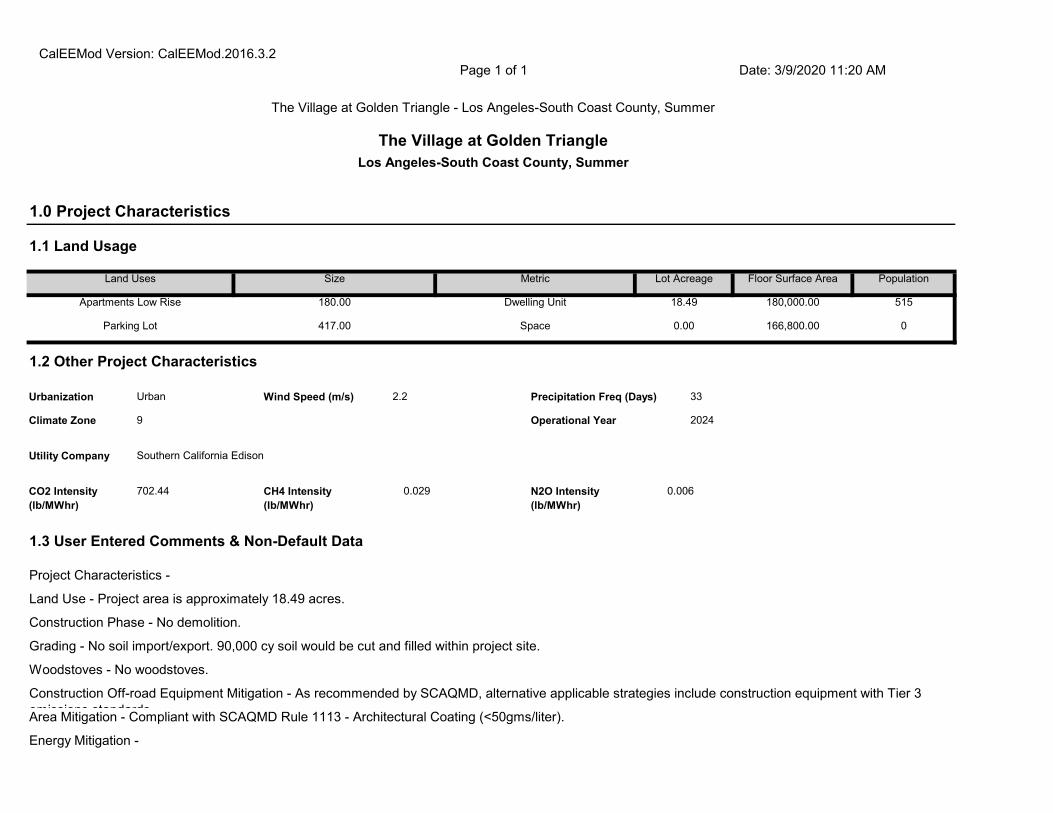
Construction Off-road Equipment Mitigation - As recommended by SCAQMD, alternative applicable strategies include construction equipment with Tier 3 emissions standardsArea Mitigation - Compliant with SCAQMD Rule 1113 - Architectural Coating (<50gms/liter).
Energy Mitigation -
1.3 User Entered Comments & Non-Default Data
Project Characteristics -
Land Use - Project area is approximately 18.49 acres.
Construction Phase - No demolition.
Grading - No soil import/export. 90,000 cy soil would be cut and filled within project site.
Woodstoves - No woodstoves.
CO2 Intensity (lb/MWhr)
702.44 CH4 Intensity (lb/MWhr)
0.029 N2O Intensity (lb/MWhr)
0.006
33
Climate Zone 9 Operational Year 2024
Utility Company Southern California Edison
1.2 Other Project Characteristics
Urbanization Urban Wind Speed (m/s) 2.2 Precipitation Freq (Days)
Parking Lot 417.00 Space 0.00 166,800.00 0
Floor Surface Area Population
Apartments Low Rise 180.00 Dwelling Unit 18.49 180,000.00 515
1.0 Project Characteristics
1.1 Land Usage
Land Uses Size Metric Lot Acreage
CalEEMod Version: CalEEMod.2016.3.2Page 1 of 1 Date: 3/9/2020 11:20 AM
The Village at Golden Triangle - Los Angeles-South Coast County, Summer
The Village at Golden TriangleLos Angeles-South Coast County, Summer

tblConstEquipMitigation Tier No Change Tier 3
tblConstEquipMitigation Tier No Change Tier 3
tblConstEquipMitigation Tier No Change Tier 3
tblConstEquipMitigation Tier No Change Tier 3
tblConstEquipMitigation Tier No Change Tier 3
tblConstEquipMitigation Tier No Change Tier 3
tblConstEquipMitigation Tier No Change Tier 3
tblConstEquipMitigation Tier No Change Tier 3
tblConstEquipMitigation Tier No Change Tier 3
tblConstEquipMitigation Tier No Change Tier 3
tblConstEquipMitigation Tier No Change Tier 3
tblConstEquipMitigation NumberOfEquipmentMitigated 0.00 1.00
tblConstEquipMitigation Tier No Change Tier 3
tblConstEquipMitigation NumberOfEquipmentMitigated 0.00 2.00
tblConstEquipMitigation NumberOfEquipmentMitigated 0.00 2.00
tblConstEquipMitigation NumberOfEquipmentMitigated 0.00 5.00
tblConstEquipMitigation NumberOfEquipmentMitigated 0.00 1.00
tblConstEquipMitigation NumberOfEquipmentMitigated 0.00 2.00
tblConstEquipMitigation NumberOfEquipmentMitigated 0.00 1.00
tblConstEquipMitigation NumberOfEquipmentMitigated 0.00 1.00
tblConstEquipMitigation NumberOfEquipmentMitigated 0.00 2.00
tblConstEquipMitigation NumberOfEquipmentMitigated 0.00 1.00
tblConstEquipMitigation NumberOfEquipmentMitigated 0.00 3.00
tblConstEquipMitigation NumberOfEquipmentMitigated 0.00 1.00
tblConstEquipMitigation NumberOfEquipmentMitigated 0.00 2.00
tblAreaMitigation UseLowVOCPaintParkingCheck False True
tblConstDustMitigation WaterUnpavedRoadVehicleSpeed 0 15
Water Mitigation -
Table Name Column Name Default Value New Value
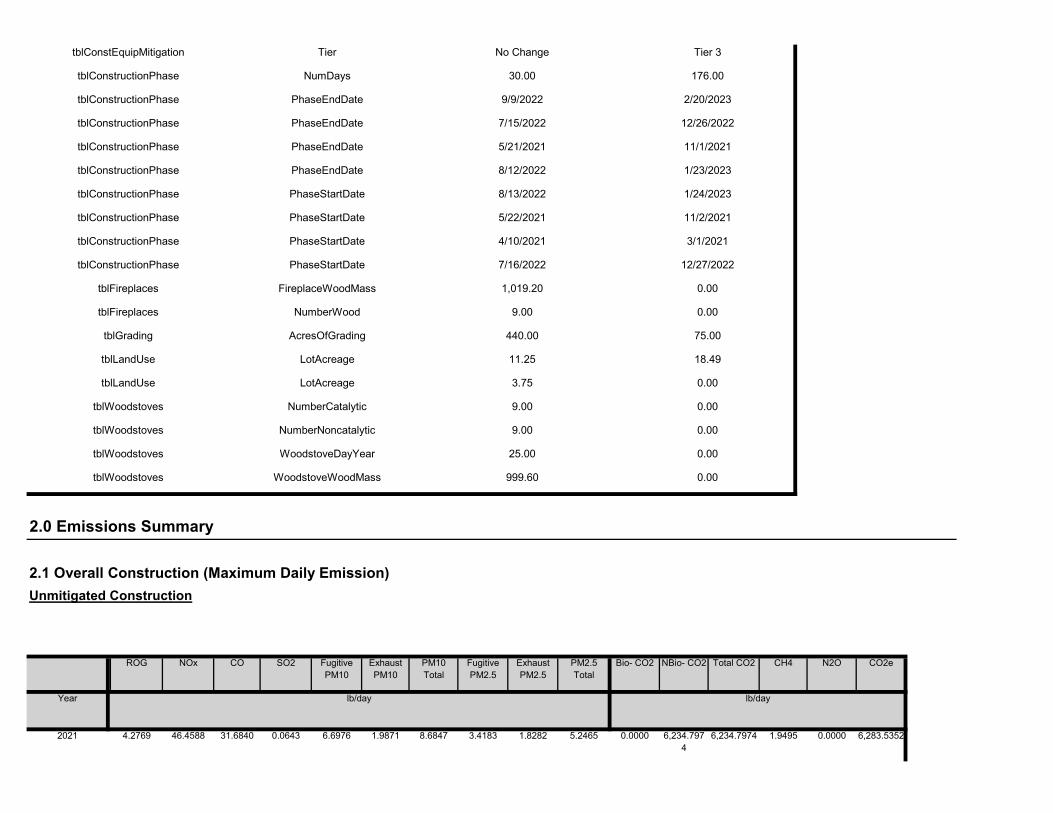
0.0000 6,234.7974
6,234.7974 1.9495 0.0000 6,283.53526.6976 1.9871 8.6847 3.4183 1.8282 5.24652021 4.2769 46.4588 31.6840 0.0643
NBio- CO2 Total CO2 CH4 N2O CO2e
Year lb/day lb/day
Exhaust PM10
PM10 Total
Fugitive PM2.5
Exhaust PM2.5
PM2.5 Total
Bio- CO2
2.0 Emissions Summary
2.1 Overall Construction (Maximum Daily Emission)Unmitigated Construction
ROG NOx CO SO2 Fugitive PM10
tblWoodstoves WoodstoveDayYear 25.00 0.00
tblWoodstoves WoodstoveWoodMass 999.60 0.00
tblWoodstoves NumberCatalytic 9.00 0.00
tblWoodstoves NumberNoncatalytic 9.00 0.00
tblLandUse LotAcreage 11.25 18.49
tblLandUse LotAcreage 3.75 0.00
tblFireplaces NumberWood 9.00 0.00
tblGrading AcresOfGrading 440.00 75.00
tblConstructionPhase PhaseStartDate 7/16/2022 12/27/2022
tblFireplaces FireplaceWoodMass 1,019.20 0.00
tblConstructionPhase PhaseStartDate 5/22/2021 11/2/2021
tblConstructionPhase PhaseStartDate 4/10/2021 3/1/2021
tblConstructionPhase PhaseEndDate 8/12/2022 1/23/2023
tblConstructionPhase PhaseStartDate 8/13/2022 1/24/2023
tblConstructionPhase PhaseEndDate 7/15/2022 12/26/2022
tblConstructionPhase PhaseEndDate 5/21/2021 11/1/2021
tblConstructionPhase NumDays 30.00 176.00
tblConstructionPhase PhaseEndDate 9/9/2022 2/20/2023
tblConstEquipMitigation Tier No Change Tier 3

0.0000 3,266.8307
3,266.8307 0.0880 0.0594 3,286.73170.2876 0.2876 0.2876 0.2876Area 4.6916 2.7094 15.9665 0.0170
Total CO2 CH4 N2O CO2e
Category lb/day lb/day
PM10 Total
Fugitive PM2.5
Exhaust PM2.5
PM2.5 Total
Bio- CO2 NBio- CO2
2.2 Overall OperationalUnmitigated Operational
ROG NOx CO SO2 Fugitive PM10
Exhaust PM10
0.00 0.00 0.00 0.00 0.00 0.0040.79 14.77 34.88 48.60 7.94 31.74
NBio-CO2 Total CO2 CH4 N20 CO2e
Percent Reduction
5.72 21.65 -14.04 0.00
Exhaust PM10
PM10 Total
Fugitive PM2.5
Exhaust PM2.5
PM2.5 Total
Bio- CO2ROG NOx CO SO2 Fugitive PM10
0.0000 6,234.7974
6,234.7974 1.9495 0.0000 6,283.53522.7484 1.3012 4.0497 1.3693 1.3011 2.6704Maximum 58.8449 30.0371 37.5281 0.0643
0.0000 2,366.3564
2,366.3564 0.7181 0.0000 2,384.30840.4471 0.6106 0.7783 0.1186 0.6105 0.65502023 58.8449 11.3314 17.8090 0.0244
0.0000 6,032.4419
6,032.4419 0.7461 0.0000 6,051.09412.5364 0.9292 3.4657 0.6795 0.9275 1.60702022 1.6110 19.0979 26.4345 0.0610
0.0000 6,234.7974
6,234.7974 1.9495 0.0000 6,283.53522.7484 1.3012 4.0497 1.3693 1.3011 2.67042021 1.6741 30.0371 37.5281 0.0643
Total CO2 CH4 N2O CO2e
Year lb/day lb/day
PM10 Total
Fugitive PM2.5
Exhaust PM2.5
PM2.5 Total
Bio- CO2 NBio- CO2
Mitigated Construction
ROG NOx CO SO2 Fugitive PM10
Exhaust PM10
0.0000 6,234.7974
6,234.7974 1.9495 0.0000 6,283.53526.6976 1.9871 8.6847 3.4183 1.8282 5.2465Maximum 58.9771 46.4588 31.6840 0.0643
0.0000 2,366.3564
2,366.3564 0.7181 0.0000 2,384.30840.4471 0.5115 0.6791 0.1186 0.4706 0.51502023 58.9771 10.2278 15.0975 0.0244
0.0000 6,032.4419
6,032.4419 0.7461 0.0000 6,051.09412.5364 0.8347 3.3711 0.6795 0.7851 1.46462022 2.6434 20.4874 24.9242 0.0610

20
4 Architectural Coating Architectural Coating 1/24/2023 2/20/2023 5 20
3 Paving Paving 12/27/2022 1/23/2023 5
176
2 Building Construction Building Construction 11/2/2021 12/26/2022 5 300
End Date Num Days Week
Num Days Phase Description
1 Grading Grading 3/1/2021 11/1/2021 5
3.0 Construction Detail
Construction Phase
Phase Number
Phase Name Phase Type Start Date
0.00 0.00 0.00 0.00 0.00 0.000.00 0.00 0.00 0.00 0.00 0.00
NBio-CO2 Total CO2 CH4 N20 CO2e
Percent Reduction
0.00 0.00 0.00 0.00
Exhaust PM10
PM10 Total
Fugitive PM2.5
Exhaust PM2.5
PM2.5 Total
Bio- CO2ROG NOx CO SO2 Fugitive PM10
0.0000 15,287.7781
15,287.7781
0.6175 0.0768 15,326.0969
9.3641 0.4274 9.7915 2.5057 0.4218 2.9275Total 6.7955 12.0229 43.8677 0.1304
11,072.9511
11,072.9511
0.5114 11,085.7353
9.3641 0.0798 9.4439 2.5057 0.0742 2.5799Mobile 2.0170 8.5709 27.5852 0.1086
947.9963 947.9963 0.0182 0.0174 953.62980.0600 0.0600 0.0600 0.0600Energy 0.0869 0.7426 0.3160 4.7400e-003
0.0000 3,266.8307
3,266.8307 0.0880 0.0594 3,286.73170.2876 0.2876 0.2876 0.2876Area 4.6916 2.7094 15.9665 0.0170
Total CO2 CH4 N2O CO2e
Category lb/day lb/day
PM10 Total
Fugitive PM2.5
Exhaust PM2.5
PM2.5 Total
Bio- CO2 NBio- CO2
Mitigated Operational
ROG NOx CO SO2 Fugitive PM10
Exhaust PM10
0.0000 15,287.7781
15,287.7781
0.6175 0.0768 15,326.0969
9.3641 0.4274 9.7915 2.5057 0.4218 2.9275Total 6.7955 12.0229 43.8677 0.1304
11,072.9511
11,072.9511
0.5114 11,085.7353
9.3641 0.0798 9.4439 2.5057 0.0742 2.5799Mobile 2.0170 8.5709 27.5852 0.1086
947.9963 947.9963 0.0182 0.0174 953.62980.0600 0.0600 0.0600 0.0600Energy 0.0869 0.7426 0.3160 4.7400e-003

6.90 20.00 LD_Mix HDT_Mix HHDTPaving 6 15.00 0.00 0.00 14.70
14.70 6.90 20.00 LD_Mix HDT_Mix HHDT
6.90 20.00 LD_Mix HDT_Mix HHDT
Building Construction 9 200.00 47.00 0.00
Grading 8 20.00 0.00 0.00 14.70
Worker Trip Length
Vendor Trip Length
Hauling Trip Length
Worker Vehicle Class
Vendor Vehicle Class
Hauling Vehicle Class
Trips and VMT
Phase Name Offroad Equipment Count
Worker Trip Number
Vendor Trip Number
Hauling Trip Number
Building Construction Welders 1 8.00 46 0.45
Grading Scrapers 2 8.00 367 0.48
Paving Paving Equipment 2 8.00 132 0.36
Grading Tractors/Loaders/Backhoes 2 8.00 97 0.37
Grading Graders 1 8.00 187 0.41
Building Construction Tractors/Loaders/Backhoes 3 7.00 97 0.37
Grading Rubber Tired Dozers 1 8.00 247 0.40
Paving Rollers 2 8.00 80 0.38
Paving Pavers 2 8.00 130 0.42
Building Construction Generator Sets 1 8.00 84 0.74
Building Construction Forklifts 3 8.00 89 0.20
Building Construction Cranes 1 7.00 231 0.29
Grading Excavators 2 8.00 158 0.38
Load Factor
Architectural Coating Air Compressors 1 6.00 78 0.48
Acres of Grading (Site Preparation Phase): 0
Acres of Grading (Grading Phase): 75
Acres of Paving: 0
Residential Indoor: 364,500; Residential Outdoor: 121,500; Non-Residential Indoor: 0; Non-Residential Outdoor: 0; Striped Parking Area:
OffRoad Equipment
Phase Name Offroad Equipment Type Amount Usage Hours Horse Power

227.7540 227.7540 6.7100e-003
227.92170.2236 1.8100e-003
0.2254 0.0593 1.6600e-003
0.0610Worker 0.0857 0.0589 0.8056 2.2900e-003
0.0000 0.0000 0.0000 0.00000.0000 0.0000 0.0000 0.0000 0.0000 0.0000Vendor 0.0000 0.0000 0.0000 0.0000
0.0000 0.0000 0.0000 0.00000.0000 0.0000 0.0000 0.0000 0.0000 0.0000
CO2e
Category lb/day lb/day
Hauling 0.0000 0.0000 0.0000 0.0000
PM2.5 Total
Bio- CO2 NBio- CO2 Total CO2 CH4 N2OSO2 Fugitive PM10
Exhaust PM10
PM10 Total
Fugitive PM2.5
Exhaust PM2.5
1.9428 6,055.6134
Unmitigated Construction Off-Site
ROG NOx CO
3.3590 1.8265 5.1855 6,007.0434
6,007.0434
6,055.6134
Total 4.1912 46.3998 30.8785 0.0620 6.4740 1.9853 8.4593
1.8265 6,007.0434
6,007.0434 1.94280.0620 1.9853 1.9853 1.8265
0.0000 0.0000
Off-Road 4.1912 46.3998 30.8785
0.0000 6.4740 3.3590 0.0000 3.3590
Category lb/day lb/day
Fugitive Dust 6.4740
Bio- CO2 NBio- CO2 Total CO2 CH4 N2O CO2eFugitive PM10
Exhaust PM10
PM10 Total
Fugitive PM2.5
Exhaust PM2.5
PM2.5 Total
ROG NOx CO SO2
3.1 Mitigation Measures Construction
Use Cleaner Engines for Construction Equipment
Water Exposed Area
Reduce Vehicle Speed on Unpaved Roads
3.2 Grading - 2021Unmitigated Construction On-Site
14.70 6.90 20.00 LD_Mix HDT_Mix HHDTArchitectural Coating 1 40.00 0.00 0.00
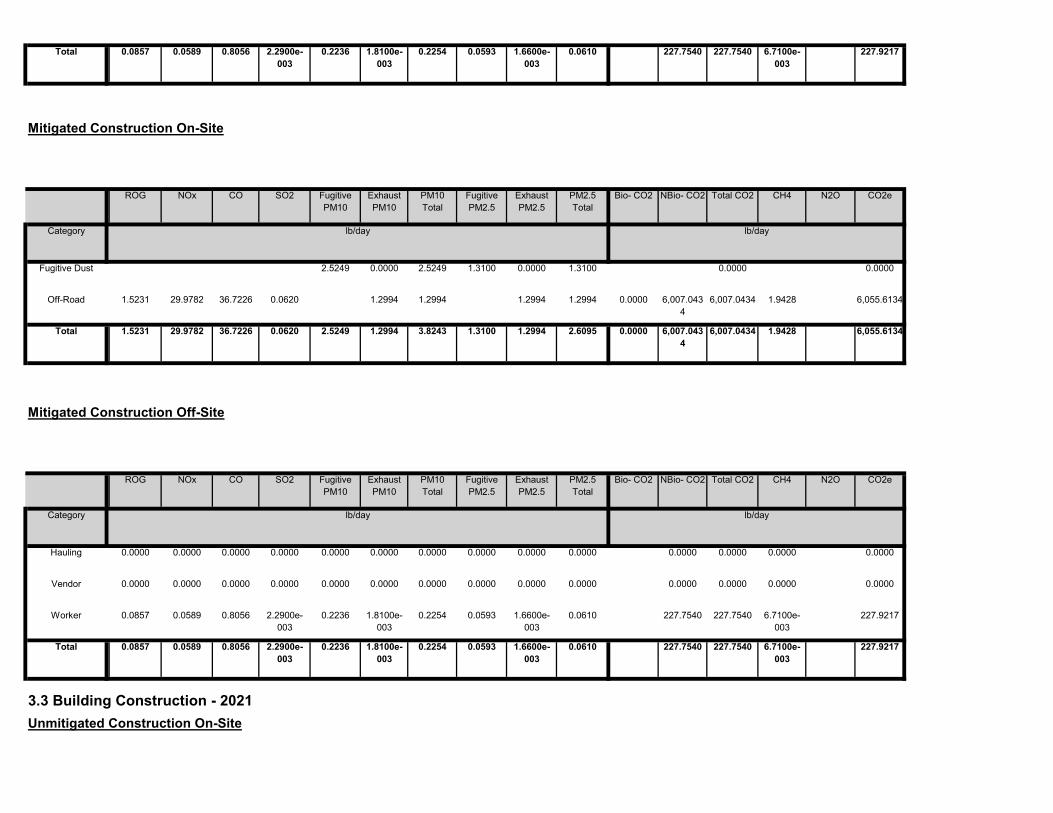
3.3 Building Construction - 2021Unmitigated Construction On-Site
227.7540 227.7540 6.7100e-003
227.92170.2236 1.8100e-003
0.2254 0.0593 1.6600e-003
0.0610Total 0.0857 0.0589 0.8056 2.2900e-003
227.7540 227.7540 6.7100e-003
227.92170.2236 1.8100e-003
0.2254 0.0593 1.6600e-003
0.0610Worker 0.0857 0.0589 0.8056 2.2900e-003
0.0000 0.0000 0.0000 0.00000.0000 0.0000 0.0000 0.0000 0.0000 0.0000Vendor 0.0000 0.0000 0.0000 0.0000
0.0000 0.0000 0.0000 0.00000.0000 0.0000 0.0000 0.0000 0.0000 0.0000Hauling 0.0000 0.0000 0.0000 0.0000
Total CO2 CH4 N2O CO2e
Category lb/day lb/day
PM10 Total
Fugitive PM2.5
Exhaust PM2.5
PM2.5 Total
Bio- CO2 NBio- CO2
Mitigated Construction Off-Site
ROG NOx CO SO2 Fugitive PM10
Exhaust PM10
0.0000 6,007.0434
6,007.0434 1.9428 6,055.61342.5249 1.2994 3.8243 1.3100 1.2994 2.6095Total 1.5231 29.9782 36.7226 0.0620
0.0000 6,007.0434
6,007.0434 1.9428 6,055.61341.2994 1.2994 1.2994 1.2994Off-Road 1.5231 29.9782 36.7226 0.0620
0.0000 0.00002.5249 0.0000 2.5249 1.3100 0.0000 1.3100Fugitive Dust
Total CO2 CH4 N2O CO2e
Category lb/day lb/day
PM10 Total
Fugitive PM2.5
Exhaust PM2.5
PM2.5 Total
Bio- CO2 NBio- CO2
Mitigated Construction On-Site
ROG NOx CO SO2 Fugitive PM10
Exhaust PM10
227.7540 227.7540 6.7100e-003
227.92170.2236 1.8100e-003
0.2254 0.0593 1.6600e-003
0.0610Total 0.0857 0.0589 0.8056 2.2900e-003
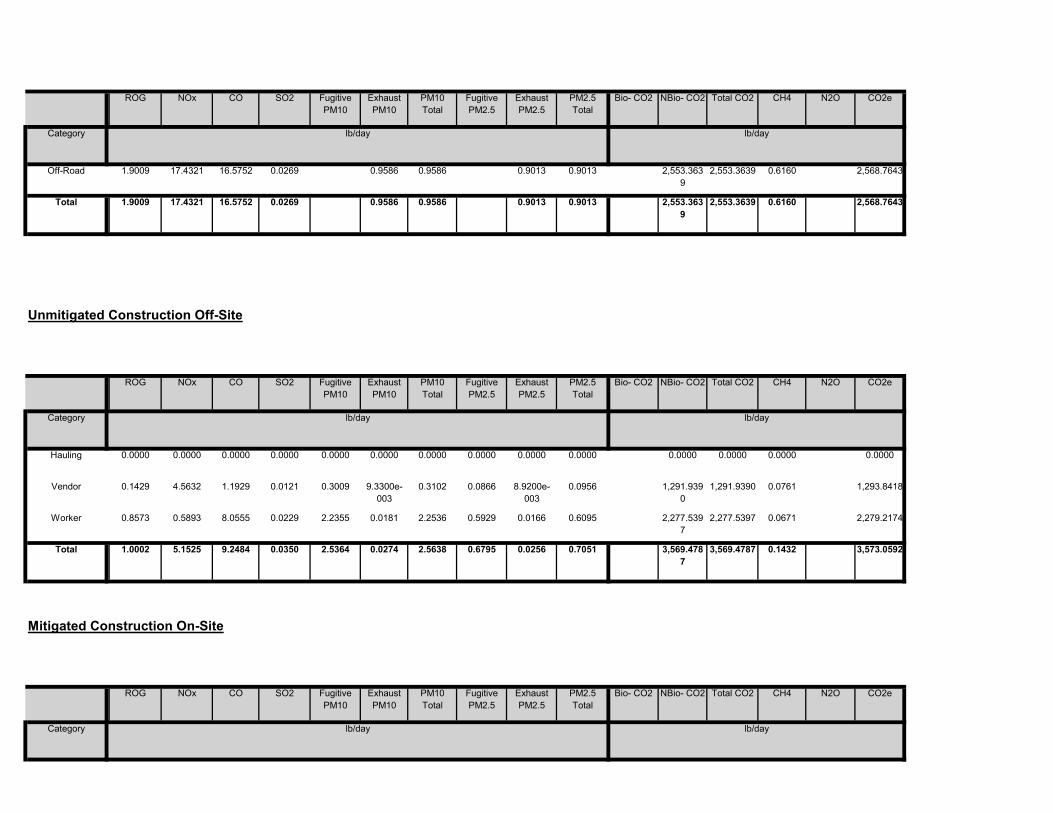
Total CO2 CH4 N2O CO2e
Category lb/day lb/day
PM10 Total
Fugitive PM2.5
Exhaust PM2.5
PM2.5 Total
Bio- CO2 NBio- CO2
Mitigated Construction On-Site
ROG NOx CO SO2 Fugitive PM10
Exhaust PM10
3,569.4787
3,569.4787 0.1432 3,573.05922.5364 0.0274 2.5638 0.6795 0.0256 0.7051Total 1.0002 5.1525 9.2484 0.0350
2,277.5397
2,277.5397 0.0671 2,279.21742.2355 0.0181 2.2536 0.5929 0.0166 0.6095Worker 0.8573 0.5893 8.0555 0.0229
1,291.9390
1,291.9390 0.0761 1,293.84180.3009 9.3300e-003
0.3102 0.0866 8.9200e-003
0.0956Vendor 0.1429 4.5632 1.1929 0.0121
0.0000 0.0000 0.0000 0.00000.0000 0.0000 0.0000 0.0000 0.0000 0.0000Hauling 0.0000 0.0000 0.0000 0.0000
Total CO2 CH4 N2O CO2e
Category lb/day lb/day
PM10 Total
Fugitive PM2.5
Exhaust PM2.5
PM2.5 Total
Bio- CO2 NBio- CO2
Unmitigated Construction Off-Site
ROG NOx CO SO2 Fugitive PM10
Exhaust PM10
2,553.3639
2,553.3639 0.6160 2,568.76430.9586 0.9586 0.9013 0.9013Total 1.9009 17.4321 16.5752 0.0269
2,553.3639
2,553.3639 0.6160 2,568.76430.9586 0.9586 0.9013 0.9013Off-Road 1.9009 17.4321 16.5752 0.0269
Total CO2 CH4 N2O CO2e
Category lb/day lb/day
PM10 Total
Fugitive PM2.5
Exhaust PM2.5
PM2.5 Total
Bio- CO2 NBio- CO2ROG NOx CO SO2 Fugitive PM10
Exhaust PM10

2,554.3336
2,554.3336 0.6120 2,569.63220.8090 0.8090 0.7612 0.7612Total 1.7062 15.6156 16.3634 0.0269
2,554.3336
2,554.3336 0.6120 2,569.63220.8090 0.8090 0.7612 0.7612Off-Road 1.7062 15.6156 16.3634 0.0269
Total CO2 CH4 N2O CO2e
Category lb/day lb/day
PM10 Total
Fugitive PM2.5
Exhaust PM2.5
PM2.5 Total
Bio- CO2 NBio- CO2
3.3 Building Construction - 2022Unmitigated Construction On-Site
ROG NOx CO SO2 Fugitive PM10
Exhaust PM10
3,569.4787
3,569.4787 0.1432 3,573.05922.5364 0.0274 2.5638 0.6795 0.0256 0.7051Total 1.0002 5.1525 9.2484 0.0350
2,277.5397
2,277.5397 0.0671 2,279.21742.2355 0.0181 2.2536 0.5929 0.0166 0.6095Worker 0.8573 0.5893 8.0555 0.0229
1,291.9390
1,291.9390 0.0761 1,293.84180.3009 9.3300e-003
0.3102 0.0866 8.9200e-003
0.0956Vendor 0.1429 4.5632 1.1929 0.0121
0.0000 0.0000 0.0000 0.00000.0000 0.0000 0.0000 0.0000 0.0000 0.0000Hauling 0.0000 0.0000 0.0000 0.0000
Total CO2 CH4 N2O CO2e
Category lb/day lb/day
PM10 Total
Fugitive PM2.5
Exhaust PM2.5
PM2.5 Total
Bio- CO2 NBio- CO2
Mitigated Construction Off-Site
ROG NOx CO SO2 Fugitive PM10
Exhaust PM10
0.0000 2,553.3639
2,553.3639 0.6160 2,568.76430.9036 0.9036 0.9036 0.9036Total 0.6739 14.2261 17.8738 0.0269
0.0000 2,553.3639
2,553.3639 0.6160 2,568.76430.9036 0.9036 0.9036 0.9036Off-Road 0.6739 14.2261 17.8738 0.0269

Mitigated Construction Off-Site
0.0000 2,554.3336
2,554.3336 0.6120 2,569.63220.9036 0.9036 0.9036 0.9036Total 0.6739 14.2261 17.8738 0.0269
0.0000 2,554.3336
2,554.3336 0.6120 2,569.63220.9036 0.9036 0.9036 0.9036Off-Road 0.6739 14.2261 17.8738 0.0269
Total CO2 CH4 N2O CO2e
Category lb/day lb/day
PM10 Total
Fugitive PM2.5
Exhaust PM2.5
PM2.5 Total
Bio- CO2 NBio- CO2
Mitigated Construction On-Site
ROG NOx CO SO2 Fugitive PM10
Exhaust PM10
3,478.1083
3,478.1083 0.1341 3,481.46192.5364 0.0257 2.5621 0.6795 0.0239 0.7034Total 0.9371 4.8718 8.5608 0.0340
2,197.4246
2,197.4246 0.0607 2,198.94092.2355 0.0175 2.2530 0.5929 0.0161 0.6090Worker 0.8031 0.5323 7.4321 0.0221
1,280.6837
1,280.6837 0.0735 1,282.52100.3009 8.1600e-003
0.3091 0.0866 7.8000e-003
0.0944Vendor 0.1341 4.3395 1.1287 0.0120
0.0000 0.0000 0.0000 0.00000.0000 0.0000 0.0000 0.0000 0.0000 0.0000Hauling 0.0000 0.0000 0.0000 0.0000
Total CO2 CH4 N2O CO2e
Category lb/day lb/day
PM10 Total
Fugitive PM2.5
Exhaust PM2.5
PM2.5 Total
Bio- CO2 NBio- CO2
Unmitigated Construction Off-Site
ROG NOx CO SO2 Fugitive PM10
Exhaust PM10

0.0000 0.0000 0.0000 0.00000.0000 0.0000 0.0000 0.0000 0.0000 0.0000Hauling 0.0000 0.0000 0.0000 0.0000
Total CO2 CH4 N2O CO2e
Category lb/day lb/day
PM10 Total
Fugitive PM2.5
Exhaust PM2.5
PM2.5 Total
Bio- CO2 NBio- CO2
Unmitigated Construction Off-Site
ROG NOx CO SO2 Fugitive PM10
Exhaust PM10
2,207.6603
2,207.6603 0.7140 2,225.51040.5679 0.5679 0.5225 0.5225Total 1.1028 11.1249 14.5805 0.0228
0.0000 0.00000.0000 0.0000 0.0000 0.0000Paving 0.0000
2,207.6603
2,207.6603 0.7140 2,225.51040.5679 0.5679 0.5225 0.5225Off-Road 1.1028 11.1249 14.5805 0.0228
Total CO2 CH4 N2O CO2e
Category lb/day lb/day
PM10 Total
Fugitive PM2.5
Exhaust PM2.5
PM2.5 Total
Bio- CO2 NBio- CO2
3.4 Paving - 2022Unmitigated Construction On-Site
ROG NOx CO SO2 Fugitive PM10
Exhaust PM10
3,478.1083
3,478.1083 0.1341 3,481.46192.5364 0.0257 2.5621 0.6795 0.0239 0.7034Total 0.9371 4.8718 8.5608 0.0340
2,197.4246
2,197.4246 0.0607 2,198.94092.2355 0.0175 2.2530 0.5929 0.0161 0.6090Worker 0.8031 0.5323 7.4321 0.0221
1,280.6837
1,280.6837 0.0735 1,282.52100.3009 8.1600e-003
0.3091 0.0866 7.8000e-003
0.0944Vendor 0.1341 4.3395 1.1287 0.0120
0.0000 0.0000 0.0000 0.00000.0000 0.0000 0.0000 0.0000 0.0000 0.0000Hauling 0.0000 0.0000 0.0000 0.0000
Total CO2 CH4 N2O CO2e
Category lb/day lb/day
PM10 Total
Fugitive PM2.5
Exhaust PM2.5
PM2.5 Total
Bio- CO2 NBio- CO2ROG NOx CO SO2 Fugitive PM10
Exhaust PM10

164.8069 164.8069 4.5500e-003
164.92060.1677 1.3100e-003
0.1690 0.0445 1.2100e-003
0.0457Total 0.0602 0.0399 0.5574 1.6500e-003
164.8069 164.8069 4.5500e-003
164.92060.1677 1.3100e-003
0.1690 0.0445 1.2100e-003
0.0457Worker 0.0602 0.0399 0.5574 1.6500e-003
0.0000 0.0000 0.0000 0.00000.0000 0.0000 0.0000 0.0000 0.0000 0.0000Vendor 0.0000 0.0000 0.0000 0.0000
0.0000 0.0000 0.0000 0.00000.0000 0.0000 0.0000 0.0000 0.0000 0.0000Hauling 0.0000 0.0000 0.0000 0.0000
Total CO2 CH4 N2O CO2e
Category lb/day lb/day
PM10 Total
Fugitive PM2.5
Exhaust PM2.5
PM2.5 Total
Bio- CO2 NBio- CO2
Mitigated Construction Off-Site
ROG NOx CO SO2 Fugitive PM10
Exhaust PM10
0.0000 2,207.6603
2,207.6603 0.7140 2,225.51040.6093 0.6093 0.6093 0.6093Total 0.5609 11.2952 17.2957 0.0228
0.0000 0.00000.0000 0.0000 0.0000 0.0000Paving 0.0000
0.0000 2,207.6603
2,207.6603 0.7140 2,225.51040.6093 0.6093 0.6093 0.6093Off-Road 0.5609 11.2952 17.2957 0.0228
Total CO2 CH4 N2O CO2e
Category lb/day lb/day
PM10 Total
Fugitive PM2.5
Exhaust PM2.5
PM2.5 Total
Bio- CO2 NBio- CO2
Mitigated Construction On-Site
ROG NOx CO SO2 Fugitive PM10
Exhaust PM10
164.8069 164.8069 4.5500e-003
164.92060.1677 1.3100e-003
0.1690 0.0445 1.2100e-003
0.0457Total 0.0602 0.0399 0.5574 1.6500e-003
164.8069 164.8069 4.5500e-003
164.92060.1677 1.3100e-003
0.1690 0.0445 1.2100e-003
0.0457Worker 0.0602 0.0399 0.5574 1.6500e-003
0.0000 0.0000 0.0000 0.00000.0000 0.0000 0.0000 0.0000 0.0000 0.0000Vendor 0.0000 0.0000 0.0000 0.0000

Mitigated Construction On-Site
158.7723 158.7723 4.1000e-003
158.87480.1677 1.2800e-003
0.1689 0.0445 1.1700e-003
0.0456Total 0.0566 0.0361 0.5133 1.5900e-003
158.7723 158.7723 4.1000e-003
158.87480.1677 1.2800e-003
0.1689 0.0445 1.1700e-003
0.0456Worker 0.0566 0.0361 0.5133 1.5900e-003
0.0000 0.0000 0.0000 0.00000.0000 0.0000 0.0000 0.0000 0.0000 0.0000Vendor 0.0000 0.0000 0.0000 0.0000
0.0000 0.0000 0.0000 0.00000.0000 0.0000 0.0000 0.0000 0.0000 0.0000Hauling 0.0000 0.0000 0.0000 0.0000
Total CO2 CH4 N2O CO2e
Category lb/day lb/day
PM10 Total
Fugitive PM2.5
Exhaust PM2.5
PM2.5 Total
Bio- CO2 NBio- CO2
Unmitigated Construction Off-Site
ROG NOx CO SO2 Fugitive PM10
Exhaust PM10
2,207.5841
2,207.5841 0.7140 2,225.43360.5102 0.5102 0.4694 0.4694Total 1.0327 10.1917 14.5842 0.0228
0.0000 0.00000.0000 0.0000 0.0000 0.0000Paving 0.0000
2,207.5841
2,207.5841 0.7140 2,225.43360.5102 0.5102 0.4694 0.4694Off-Road 1.0327 10.1917 14.5842 0.0228
Total CO2 CH4 N2O CO2e
Category lb/day lb/day
PM10 Total
Fugitive PM2.5
Exhaust PM2.5
PM2.5 Total
Bio- CO2 NBio- CO2
3.4 Paving - 2023Unmitigated Construction On-Site
ROG NOx CO SO2 Fugitive PM10
Exhaust PM10
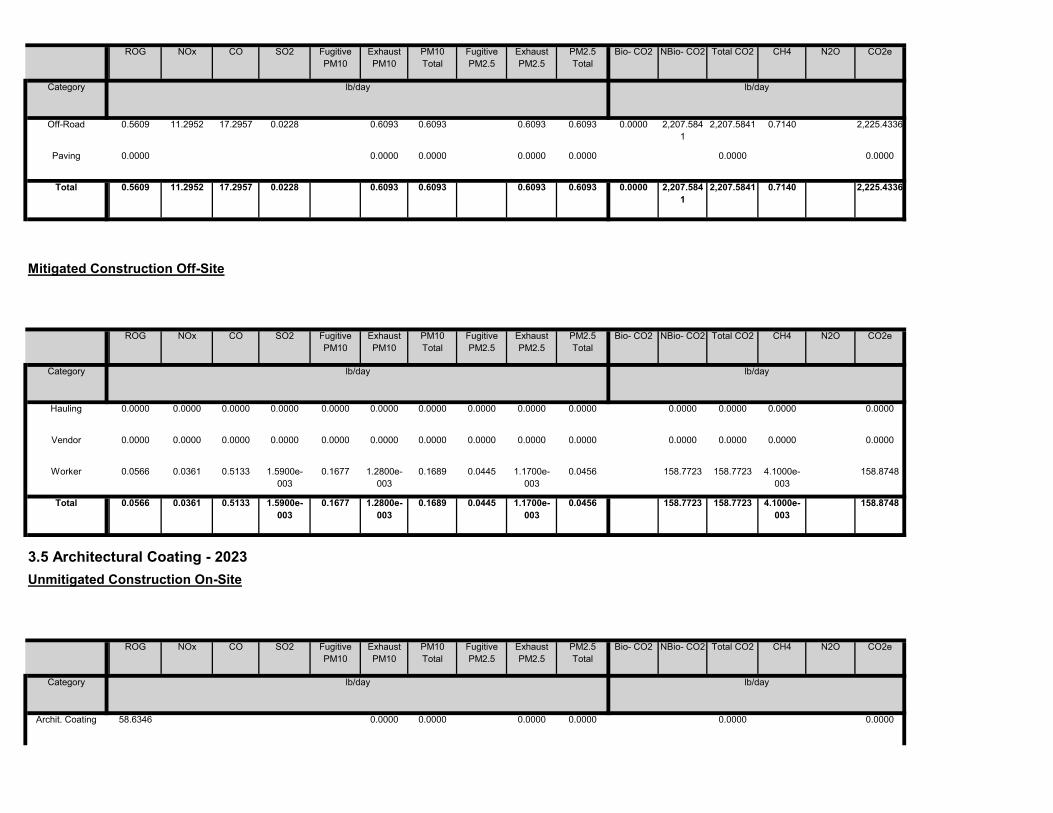
0.0000 0.00000.0000 0.0000 0.0000 0.0000Archit. Coating 58.6346
Total CO2 CH4 N2O CO2e
Category lb/day lb/day
PM10 Total
Fugitive PM2.5
Exhaust PM2.5
PM2.5 Total
Bio- CO2 NBio- CO2
3.5 Architectural Coating - 2023Unmitigated Construction On-Site
ROG NOx CO SO2 Fugitive PM10
Exhaust PM10
158.7723 158.7723 4.1000e-003
158.87480.1677 1.2800e-003
0.1689 0.0445 1.1700e-003
0.0456Total 0.0566 0.0361 0.5133 1.5900e-003
158.7723 158.7723 4.1000e-003
158.87480.1677 1.2800e-003
0.1689 0.0445 1.1700e-003
0.0456Worker 0.0566 0.0361 0.5133 1.5900e-003
0.0000 0.0000 0.0000 0.00000.0000 0.0000 0.0000 0.0000 0.0000 0.0000Vendor 0.0000 0.0000 0.0000 0.0000
0.0000 0.0000 0.0000 0.00000.0000 0.0000 0.0000 0.0000 0.0000 0.0000Hauling 0.0000 0.0000 0.0000 0.0000
Total CO2 CH4 N2O CO2e
Category lb/day lb/day
PM10 Total
Fugitive PM2.5
Exhaust PM2.5
PM2.5 Total
Bio- CO2 NBio- CO2
Mitigated Construction Off-Site
ROG NOx CO SO2 Fugitive PM10
Exhaust PM10
0.0000 2,207.5841
2,207.5841 0.7140 2,225.43360.6093 0.6093 0.6093 0.6093Total 0.5609 11.2952 17.2957 0.0228
0.0000 0.00000.0000 0.0000 0.0000 0.0000Paving 0.0000
0.0000 2,207.5841
2,207.5841 0.7140 2,225.43360.6093 0.6093 0.6093 0.6093Off-Road 0.5609 11.2952 17.2957 0.0228
Total CO2 CH4 N2O CO2e
Category lb/day lb/day
PM10 Total
Fugitive PM2.5
Exhaust PM2.5
PM2.5 Total
Bio- CO2 NBio- CO2ROG NOx CO SO2 Fugitive PM10
Exhaust PM10

0.0000 281.4481 281.4481 0.0168 281.86900.0951 0.0951 0.0951 0.0951Total 58.6940 1.3570 1.8324 2.9700e-003
0.0000 281.4481 281.4481 0.0168 281.86900.0951 0.0951 0.0951 0.0951Off-Road 0.0594 1.3570 1.8324 2.9700e-003
0.0000 0.00000.0000 0.0000 0.0000 0.0000Archit. Coating 58.6346
Total CO2 CH4 N2O CO2e
Category lb/day lb/day
PM10 Total
Fugitive PM2.5
Exhaust PM2.5
PM2.5 Total
Bio- CO2 NBio- CO2
Mitigated Construction On-Site
ROG NOx CO SO2 Fugitive PM10
Exhaust PM10
423.3928 423.3928 0.0109 423.66620.4471 3.4000e-003
0.4505 0.1186 3.1300e-003
0.1217Total 0.1508 0.0963 1.3689 4.2500e-003
423.3928 423.3928 0.0109 423.66620.4471 3.4000e-003
0.4505 0.1186 3.1300e-003
0.1217Worker 0.1508 0.0963 1.3689 4.2500e-003
0.0000 0.0000 0.0000 0.00000.0000 0.0000 0.0000 0.0000 0.0000 0.0000Vendor 0.0000 0.0000 0.0000 0.0000
0.0000 0.0000 0.0000 0.00000.0000 0.0000 0.0000 0.0000 0.0000 0.0000Hauling 0.0000 0.0000 0.0000 0.0000
Total CO2 CH4 N2O CO2e
Category lb/day lb/day
PM10 Total
Fugitive PM2.5
Exhaust PM2.5
PM2.5 Total
Bio- CO2 NBio- CO2
Unmitigated Construction Off-Site
ROG NOx CO SO2 Fugitive PM10
Exhaust PM10
281.4481 281.4481 0.0168 281.86900.0708 0.0708 0.0708 0.0708Total 58.8263 1.3030 1.8111 2.9700e-003
281.4481 281.4481 0.0168 281.86900.0708 0.0708 0.0708 0.0708Off-Road 0.1917 1.3030 1.8111 2.9700e-003

4.2 Trip Summary Information
Average Daily Trip Rate Unmitigated Mitigated
11,072.9511
11,072.9511
0.5114 11,085.7353
9.3641 0.0798 9.4439 2.5057 0.0742 2.5799Unmitigated 2.0170 8.5709 27.5852 0.1086
11,072.9511
11,072.9511
0.5114 11,085.7353
9.3641 0.0798 9.4439 2.5057 0.0742 2.5799Mitigated 2.0170 8.5709 27.5852 0.1086
NBio- CO2 Total CO2 CH4 N2O CO2e
Category lb/day lb/day
Exhaust PM10
PM10 Total
Fugitive PM2.5
Exhaust PM2.5
PM2.5 Total
Bio- CO2
4.0 Operational Detail - Mobile
4.1 Mitigation Measures Mobile
ROG NOx CO SO2 Fugitive PM10
423.3928 423.3928 0.0109 423.66620.4471 3.4000e-003
0.4505 0.1186 3.1300e-003
0.1217Total 0.1508 0.0963 1.3689 4.2500e-003
423.3928 423.3928 0.0109 423.66620.4471 3.4000e-003
0.4505 0.1186 3.1300e-003
0.1217Worker 0.1508 0.0963 1.3689 4.2500e-003
0.0000 0.0000 0.0000 0.00000.0000 0.0000 0.0000 0.0000 0.0000 0.0000Vendor 0.0000 0.0000 0.0000 0.0000
0.0000 0.0000 0.0000 0.00000.0000 0.0000 0.0000 0.0000 0.0000 0.0000Hauling 0.0000 0.0000 0.0000 0.0000
Total CO2 CH4 N2O CO2e
Category lb/day lb/day
PM10 Total
Fugitive PM2.5
Exhaust PM2.5
PM2.5 Total
Bio- CO2 NBio- CO2
Mitigated Construction Off-Site
ROG NOx CO SO2 Fugitive PM10
Exhaust PM10

953.62980.0600 947.9963 947.9963 0.0182 0.01744.7400e-003
0.0600 0.0600 0.0600
947.9963 947.9963 0.0182 0.0174 953.6298
NaturalGas Unmitigated
0.0869 0.7426 0.3160
0.0600 0.0600 0.0600 0.0600
Category lb/day lb/day
NaturalGas Mitigated
0.0869 0.7426 0.3160 4.7400e-003
Bio- CO2 NBio- CO2 Total CO2 CH4 N2O CO2eFugitive PM10
Exhaust PM10
PM10 Total
Fugitive PM2.5
Exhaust PM2.5
PM2.5 Total
ROG NOx CO SO2
0.000696 0.000850
5.0 Energy Detail
Historical Energy Use: N
5.1 Mitigation Measures Energy
Install Energy Efficient Appliances
0.006253 0.020617 0.031756 0.002560 0.002071 0.005217Parking Lot 0.545348 0.044620 0.206559 0.118451 0.015002
0.031756 0.002560 0.002071 0.005217 0.000696 0.000850
SBUS MH
Apartments Low Rise 0.545348 0.044620 0.206559 0.118451 0.015002 0.006253 0.020617
LHD2 MHD HHD OBUS UBUS MCYLand Use LDA LDT1 LDT2 MDV LHD1
0.00 0.00 0 0 0
4.4 Fleet Mix
19.20 40.60 86 11 3
Parking Lot 16.60 8.40 6.90 0.00
H-S or C-C H-O or C-NW Primary Diverted Pass-by
Apartments Low Rise 14.70 5.90 8.70 40.20
4.3 Trip Type Information
Miles Trip % Trip Purpose %
Land Use H-W or C-W H-S or C-C H-O or C-NW H-W or C-W
Total 1,186.20 1,288.80 1,092.60 4,057,819 4,057,819Parking Lot 0.00 0.00 0.00
Annual VMT
Apartments Low Rise 1,186.20 1,288.80 1092.60 4,057,819 4,057,819
Land Use Weekday Saturday Sunday Annual VMT

6.0 Area Detail
6.1 Mitigation Measures Area
Use Low VOC Paint - Residential Interior
947.9963 947.9963 0.0182 0.0174 953.62980.0600 0.0600 0.0600 0.0600Total 0.0869 0.7426 0.3160 4.7400e-003
0.0000 0.0000 0.0000 0.0000 0.00000.0000 0.0000 0.0000 0.0000Parking Lot 0 0.0000 0.0000 0.0000 0.0000
947.9963 947.9963 0.0182 0.0174 953.62980.0600 0.0600 0.0600 0.0600Apartments Low Rise
8.05797 0.0869 0.7426 0.3160 4.7400e-003
Total CO2 CH4 N2O CO2e
Land Use kBTU/yr lb/day lb/day
PM10 Total
Fugitive PM2.5
Exhaust PM2.5
PM2.5 Total Bio- CO2 NBio- CO2
Mitigated
NaturalGas Use
ROG NOx CO SO2 Fugitive PM10
Exhaust PM10
947.9963 947.9963 0.0182 0.0174 953.62980.0600 0.0600 0.0600 0.0600Total 0.0869 0.7426 0.3160 4.7400e-003
0.0000 0.0000 0.0000 0.0000 0.00000.0000 0.0000 0.0000 0.0000Parking Lot 0 0.0000 0.0000 0.0000 0.0000
947.9963 947.9963 0.0182 0.0174 953.62980.0600 0.0600 0.0600 0.0600Apartments Low Rise
8057.97 0.0869 0.7426 0.3160 4.7400e-003
NBio- CO2 Total CO2 CH4 N2O CO2e
Land Use kBTU/yr lb/day lb/day
Exhaust PM10
PM10 Total
Fugitive PM2.5
Exhaust PM2.5
PM2.5 Total Bio- CO2
5.2 Energy by Land Use - NaturalGasUnmitigated
NaturalGas Use
ROG NOx CO SO2 Fugitive PM10

0.0000 3,266.8307
3,266.8307 0.0880 0.0594 3,286.73170.2876 0.2876 0.2876 0.2876Total 4.6916 2.7094 15.9665 0.0170
26.8307 26.8307 0.0259 27.47800.0824 0.0824 0.0824 0.0824Landscaping 0.4503 0.1714 14.8865 7.9000e-004
0.0000 3,240.0000
3,240.0000 0.0621 0.0594 3,259.25370.2052 0.2052 0.2052 0.2052Hearth 0.2970 2.5380 1.0800 0.0162
0.0000 0.00000.0000 0.0000 0.0000 0.0000Consumer Products
3.6231
0.0000 0.00000.0000 0.0000 0.0000 0.0000Architectural Coating
0.3213
Total CO2 CH4 N2O CO2e
SubCategory lb/day lb/day
PM10 Total
Fugitive PM2.5
Exhaust PM2.5
PM2.5 Total
Bio- CO2 NBio- CO2
6.2 Area by SubCategoryUnmitigated
ROG NOx CO SO2 Fugitive PM10
Exhaust PM10
0.0000 3,266.8307
3,266.8307 0.0880 0.0594 3,286.73170.2876 0.2876 0.2876 0.2876Unmitigated 4.6916 2.7094 15.9665 0.0170
0.0000 3,266.8307
3,266.8307 0.0880 0.0594 3,286.73170.2876 0.2876 0.2876 0.2876
CO2e
Category lb/day lb/day
Mitigated 4.6916 2.7094 15.9665 0.0170
PM2.5 Total
Bio- CO2 NBio- CO2 Total CO2 CH4 N2OSO2 Fugitive PM10
Exhaust PM10
PM10 Total
Fugitive PM2.5
Exhaust PM2.5
Use Low VOC Paint - Residential Exterior
Use Low VOC Cleaning Supplies
ROG NOx CO

Fuel Type
Use Water Efficient Irrigation System
8.0 Waste Detail
8.1 Mitigation Measures Waste
9.0 Operational Offroad
Equipment Type Number Hours/Day Days/Year Horse Power Load Factor
7.0 Water Detail
7.1 Mitigation Measures Water
Install Low Flow Bathroom Faucet
Install Low Flow Kitchen Faucet
Install Low Flow Toilet
Install Low Flow Shower
0.0000 3,266.8307
3,266.8307 0.0880 0.0594 3,286.73170.2876 0.2876 0.2876 0.2876Total 4.6916 2.7094 15.9665 0.0170
26.8307 26.8307 0.0259 27.47800.0824 0.0824 0.0824 0.0824Landscaping 0.4503 0.1714 14.8865 7.9000e-004
0.0000 3,240.0000
3,240.0000 0.0621 0.0594 3,259.25370.2052 0.2052 0.2052 0.2052Hearth 0.2970 2.5380 1.0800 0.0162
0.0000 0.00000.0000 0.0000 0.0000 0.0000Consumer Products
3.6231
0.0000 0.00000.0000 0.0000 0.0000 0.0000Architectural Coating
0.3213
Total CO2 CH4 N2O CO2e
SubCategory lb/day lb/day
PM10 Total
Fugitive PM2.5
Exhaust PM2.5
PM2.5 Total
Bio- CO2 NBio- CO2
Mitigated
ROG NOx CO SO2 Fugitive PM10
Exhaust PM10

Fuel Type
User Defined Equipment
Equipment Type Number
11.0 Vegetation
Boilers
Equipment Type Number Heat Input/Day Heat Input/Year Boiler Rating
10.0 Stationary Equipment
Fire Pumps and Emergency Generators
Equipment Type Number Hours/Day Hours/Year Horse Power Load Factor Fuel Type

Attachment A.3Proposed Winter

Construction Off-road Equipment Mitigation - As recommended by SCAQMD, alternative applicable strategies include construction equipment with Tier 3 emissions standardsArea Mitigation - Compliant with SCAQMD Rule 1113 - Architectural Coating (<50gms/liter).
Energy Mitigation -
1.3 User Entered Comments & Non-Default Data
Project Characteristics -
Land Use - Project area is approximately 18.49 acres.
Construction Phase - No demolition.
Grading - No soil import/export. 90,000 cy soil would be cut and filled within project site.
Woodstoves - No woodstoves.
CO2 Intensity (lb/MWhr)
702.44 CH4 Intensity (lb/MWhr)
0.029 N2O Intensity (lb/MWhr)
0.006
33
Climate Zone 9 Operational Year 2024
Utility Company Southern California Edison
1.2 Other Project Characteristics
Urbanization Urban Wind Speed (m/s) 2.2 Precipitation Freq (Days)
Parking Lot 417.00 Space 0.00 166,800.00 0
Floor Surface Area Population
Apartments Low Rise 180.00 Dwelling Unit 18.49 180,000.00 515
1.0 Project Characteristics
1.1 Land Usage
Land Uses Size Metric Lot Acreage
CalEEMod Version: CalEEMod.2016.3.2Page 1 of 1 Date: 3/9/2020 11:19 AM
The Village at Golden Triangle - Los Angeles-South Coast County, Winter
The Village at Golden TriangleLos Angeles-South Coast County, Winter

tblConstEquipMitigation Tier No Change Tier 3
tblConstEquipMitigation Tier No Change Tier 3
tblConstEquipMitigation Tier No Change Tier 3
tblConstEquipMitigation Tier No Change Tier 3
tblConstEquipMitigation Tier No Change Tier 3
tblConstEquipMitigation Tier No Change Tier 3
tblConstEquipMitigation Tier No Change Tier 3
tblConstEquipMitigation Tier No Change Tier 3
tblConstEquipMitigation Tier No Change Tier 3
tblConstEquipMitigation Tier No Change Tier 3
tblConstEquipMitigation Tier No Change Tier 3
tblConstEquipMitigation NumberOfEquipmentMitigated 0.00 1.00
tblConstEquipMitigation Tier No Change Tier 3
tblConstEquipMitigation NumberOfEquipmentMitigated 0.00 2.00
tblConstEquipMitigation NumberOfEquipmentMitigated 0.00 2.00
tblConstEquipMitigation NumberOfEquipmentMitigated 0.00 5.00
tblConstEquipMitigation NumberOfEquipmentMitigated 0.00 1.00
tblConstEquipMitigation NumberOfEquipmentMitigated 0.00 2.00
tblConstEquipMitigation NumberOfEquipmentMitigated 0.00 1.00
tblConstEquipMitigation NumberOfEquipmentMitigated 0.00 1.00
tblConstEquipMitigation NumberOfEquipmentMitigated 0.00 2.00
tblConstEquipMitigation NumberOfEquipmentMitigated 0.00 1.00
tblConstEquipMitigation NumberOfEquipmentMitigated 0.00 3.00
tblConstEquipMitigation NumberOfEquipmentMitigated 0.00 1.00
tblConstEquipMitigation NumberOfEquipmentMitigated 0.00 2.00
tblAreaMitigation UseLowVOCPaintParkingCheck False True
tblConstDustMitigation WaterUnpavedRoadVehicleSpeed 0 15
Water Mitigation -
Table Name Column Name Default Value New Value

0.0000 6,221.4937
6,221.4937 1.9491 0.0000 6,270.22146.6976 1.9871 8.6847 3.4183 1.8282 5.24652021 4.2865 46.4651 31.6150 0.0642
NBio- CO2 Total CO2 CH4 N2O CO2e
Year lb/day lb/day
Exhaust PM10
PM10 Total
Fugitive PM2.5
Exhaust PM2.5
PM2.5 Total
Bio- CO2
2.0 Emissions Summary
2.1 Overall Construction (Maximum Daily Emission)Unmitigated Construction
ROG NOx CO SO2 Fugitive PM10
tblWoodstoves WoodstoveDayYear 25.00 0.00
tblWoodstoves WoodstoveWoodMass 999.60 0.00
tblWoodstoves NumberCatalytic 9.00 0.00
tblWoodstoves NumberNoncatalytic 9.00 0.00
tblLandUse LotAcreage 11.25 18.49
tblLandUse LotAcreage 3.75 0.00
tblFireplaces NumberWood 9.00 0.00
tblGrading AcresOfGrading 440.00 75.00
tblConstructionPhase PhaseStartDate 7/16/2022 12/27/2022
tblFireplaces FireplaceWoodMass 1,019.20 0.00
tblConstructionPhase PhaseStartDate 5/22/2021 11/2/2021
tblConstructionPhase PhaseStartDate 4/10/2021 3/1/2021
tblConstructionPhase PhaseEndDate 8/12/2022 1/23/2023
tblConstructionPhase PhaseStartDate 8/13/2022 1/24/2023
tblConstructionPhase PhaseEndDate 7/15/2022 12/26/2022
tblConstructionPhase PhaseEndDate 5/21/2021 11/1/2021
tblConstructionPhase NumDays 30.00 176.00
tblConstructionPhase PhaseEndDate 9/9/2022 2/20/2023
tblConstEquipMitigation Tier No Change Tier 3

0.0000 3,266.8307
3,266.8307 0.0880 0.0594 3,286.73170.2876 0.2876 0.2876 0.2876Area 4.6916 2.7094 15.9665 0.0170
Total CO2 CH4 N2O CO2e
Category lb/day lb/day
PM10 Total
Fugitive PM2.5
Exhaust PM2.5
PM2.5 Total
Bio- CO2 NBio- CO2
2.2 Overall OperationalUnmitigated Operational
ROG NOx CO SO2 Fugitive PM10
Exhaust PM10
0.00 0.00 0.00 0.00 0.00 0.0040.79 14.77 34.87 48.60 7.94 31.74
NBio-CO2 Total CO2 CH4 N20 CO2e
Percent Reduction
5.56 21.63 -14.16 0.00
Exhaust PM10
PM10 Total
Fugitive PM2.5
Exhaust PM2.5
PM2.5 Total
Bio- CO2ROG NOx CO SO2 Fugitive PM10
0.0000 6,221.4937
6,221.4937 1.9491 0.0000 6,270.22142.7484 1.3012 4.0497 1.3693 1.3011 2.6704Maximum 58.8628 30.0434 37.4591 0.0642
0.0000 2,357.0922
2,357.0922 0.7178 0.0000 2,375.03790.4471 0.6106 0.7783 0.1186 0.6105 0.65502023 58.8628 11.3352 17.7633 0.0243
0.0000 5,868.8328
5,868.8328 0.7472 0.0000 5,887.51252.5364 0.9295 3.4659 0.6795 0.9277 1.60722022 1.7104 19.1429 25.9064 0.0593
0.0000 6,221.4937
6,221.4937 1.9491 0.0000 6,270.22142.7484 1.3012 4.0497 1.3693 1.3011 2.67042021 1.7775 30.0434 37.4591 0.0642
Total CO2 CH4 N2O CO2e
Year lb/day lb/day
PM10 Total
Fugitive PM2.5
Exhaust PM2.5
PM2.5 Total
Bio- CO2 NBio- CO2
Mitigated Construction
ROG NOx CO SO2 Fugitive PM10
Exhaust PM10
0.0000 6,221.4937
6,221.4937 1.9491 0.0000 6,270.22146.6976 1.9871 8.6847 3.4183 1.8282 5.2465Maximum 58.9950 46.4651 31.6150 0.0642
0.0000 2,357.0922
2,357.0922 0.7178 0.0000 2,375.03790.4471 0.5115 0.6791 0.1186 0.4706 0.51502023 58.9950 10.2316 15.0519 0.0243
0.0000 5,868.8328
5,868.8328 0.7472 0.0000 5,887.51252.5364 0.8349 3.3714 0.6795 0.7853 1.46482022 2.7427 20.5324 24.3961 0.0593

20
4 Architectural Coating Architectural Coating 1/24/2023 2/20/2023 5 20
3 Paving Paving 12/27/2022 1/23/2023 5
176
2 Building Construction Building Construction 11/2/2021 12/26/2022 5 300
End Date Num Days Week
Num Days Phase Description
1 Grading Grading 3/1/2021 11/1/2021 5
3.0 Construction Detail
Construction Phase
Phase Number
Phase Name Phase Type Start Date
0.00 0.00 0.00 0.00 0.00 0.000.00 0.00 0.00 0.00 0.00 0.00
NBio-CO2 Total CO2 CH4 N20 CO2e
Percent Reduction
0.00 0.00 0.00 0.00
Exhaust PM10
PM10 Total
Fugitive PM2.5
Exhaust PM2.5
PM2.5 Total
Bio- CO2ROG NOx CO SO2 Fugitive PM10
0.0000 14,760.9211
14,760.9211
0.6155 0.0768 14,799.1895
9.3641 0.4278 9.7918 2.5057 0.4221 2.9278Total 6.7322 12.2305 42.3584 0.1251
10,546.0941
10,546.0941
0.5094 10,558.8279
9.3641 0.0801 9.4442 2.5057 0.0745 2.5802Mobile 1.9537 8.7785 26.0760 0.1034
947.9963 947.9963 0.0182 0.0174 953.62980.0600 0.0600 0.0600 0.0600Energy 0.0869 0.7426 0.3160 4.7400e-003
0.0000 3,266.8307
3,266.8307 0.0880 0.0594 3,286.73170.2876 0.2876 0.2876 0.2876Area 4.6916 2.7094 15.9665 0.0170
Total CO2 CH4 N2O CO2e
Category lb/day lb/day
PM10 Total
Fugitive PM2.5
Exhaust PM2.5
PM2.5 Total
Bio- CO2 NBio- CO2
Mitigated Operational
ROG NOx CO SO2 Fugitive PM10
Exhaust PM10
0.0000 14,760.9211
14,760.9211
0.6155 0.0768 14,799.1895
9.3641 0.4278 9.7918 2.5057 0.4221 2.9278Total 6.7322 12.2305 42.3584 0.1251
10,546.0941
10,546.0941
0.5094 10,558.8279
9.3641 0.0801 9.4442 2.5057 0.0745 2.5802Mobile 1.9537 8.7785 26.0760 0.1034
947.9963 947.9963 0.0182 0.0174 953.62980.0600 0.0600 0.0600 0.0600Energy 0.0869 0.7426 0.3160 4.7400e-003

6.90 20.00 LD_Mix HDT_Mix HHDTPaving 6 15.00 0.00 0.00 14.70
14.70 6.90 20.00 LD_Mix HDT_Mix HHDT
6.90 20.00 LD_Mix HDT_Mix HHDT
Building Construction 9 200.00 47.00 0.00
Grading 8 20.00 0.00 0.00 14.70
Worker Trip Length
Vendor Trip Length
Hauling Trip Length
Worker Vehicle Class
Vendor Vehicle Class
Hauling Vehicle Class
Trips and VMT
Phase Name Offroad Equipment Count
Worker Trip Number
Vendor Trip Number
Hauling Trip Number
Building Construction Welders 1 8.00 46 0.45
Grading Scrapers 2 8.00 367 0.48
Paving Paving Equipment 2 8.00 132 0.36
Grading Tractors/Loaders/Backhoes 2 8.00 97 0.37
Grading Graders 1 8.00 187 0.41
Building Construction Tractors/Loaders/Backhoes 3 7.00 97 0.37
Grading Rubber Tired Dozers 1 8.00 247 0.40
Paving Rollers 2 8.00 80 0.38
Paving Pavers 2 8.00 130 0.42
Building Construction Generator Sets 1 8.00 84 0.74
Building Construction Forklifts 3 8.00 89 0.20
Building Construction Cranes 1 7.00 231 0.29
Grading Excavators 2 8.00 158 0.38
Load Factor
Architectural Coating Air Compressors 1 6.00 78 0.48
Acres of Grading (Site Preparation Phase): 0
Acres of Grading (Grading Phase): 75
Acres of Paving: 0
Residential Indoor: 364,500; Residential Outdoor: 121,500; Non-Residential Indoor: 0; Non-Residential Outdoor: 0; Striped Parking Area:
OffRoad Equipment
Phase Name Offroad Equipment Type Amount Usage Hours Horse Power

214.4502 214.4502 6.3100e-003
214.60800.2236 1.8100e-003
0.2254 0.0593 1.6600e-003
0.0610Worker 0.0954 0.0652 0.7365 2.1500e-003
0.0000 0.0000 0.0000 0.00000.0000 0.0000 0.0000 0.0000 0.0000 0.0000Vendor 0.0000 0.0000 0.0000 0.0000
0.0000 0.0000 0.0000 0.00000.0000 0.0000 0.0000 0.0000 0.0000 0.0000
CO2e
Category lb/day lb/day
Hauling 0.0000 0.0000 0.0000 0.0000
PM2.5 Total
Bio- CO2 NBio- CO2 Total CO2 CH4 N2OSO2 Fugitive PM10
Exhaust PM10
PM10 Total
Fugitive PM2.5
Exhaust PM2.5
1.9428 6,055.6134
Unmitigated Construction Off-Site
ROG NOx CO
3.3590 1.8265 5.1855 6,007.0434
6,007.0434
6,055.6134
Total 4.1912 46.3998 30.8785 0.0620 6.4740 1.9853 8.4593
1.8265 6,007.0434
6,007.0434 1.94280.0620 1.9853 1.9853 1.8265
0.0000 0.0000
Off-Road 4.1912 46.3998 30.8785
0.0000 6.4740 3.3590 0.0000 3.3590
Category lb/day lb/day
Fugitive Dust 6.4740
Bio- CO2 NBio- CO2 Total CO2 CH4 N2O CO2eFugitive PM10
Exhaust PM10
PM10 Total
Fugitive PM2.5
Exhaust PM2.5
PM2.5 Total
ROG NOx CO SO2
3.1 Mitigation Measures Construction
Use Cleaner Engines for Construction Equipment
Water Exposed Area
Reduce Vehicle Speed on Unpaved Roads
3.2 Grading - 2021Unmitigated Construction On-Site
14.70 6.90 20.00 LD_Mix HDT_Mix HHDTArchitectural Coating 1 40.00 0.00 0.00

3.3 Building Construction - 2021Unmitigated Construction On-Site
214.4502 214.4502 6.3100e-003
214.60800.2236 1.8100e-003
0.2254 0.0593 1.6600e-003
0.0610Total 0.0954 0.0652 0.7365 2.1500e-003
214.4502 214.4502 6.3100e-003
214.60800.2236 1.8100e-003
0.2254 0.0593 1.6600e-003
0.0610Worker 0.0954 0.0652 0.7365 2.1500e-003
0.0000 0.0000 0.0000 0.00000.0000 0.0000 0.0000 0.0000 0.0000 0.0000Vendor 0.0000 0.0000 0.0000 0.0000
0.0000 0.0000 0.0000 0.00000.0000 0.0000 0.0000 0.0000 0.0000 0.0000Hauling 0.0000 0.0000 0.0000 0.0000
Total CO2 CH4 N2O CO2e
Category lb/day lb/day
PM10 Total
Fugitive PM2.5
Exhaust PM2.5
PM2.5 Total
Bio- CO2 NBio- CO2
Mitigated Construction Off-Site
ROG NOx CO SO2 Fugitive PM10
Exhaust PM10
0.0000 6,007.0434
6,007.0434 1.9428 6,055.61342.5249 1.2994 3.8243 1.3100 1.2994 2.6095Total 1.5231 29.9782 36.7226 0.0620
0.0000 6,007.0434
6,007.0434 1.9428 6,055.61341.2994 1.2994 1.2994 1.2994Off-Road 1.5231 29.9782 36.7226 0.0620
0.0000 0.00002.5249 0.0000 2.5249 1.3100 0.0000 1.3100Fugitive Dust
Total CO2 CH4 N2O CO2e
Category lb/day lb/day
PM10 Total
Fugitive PM2.5
Exhaust PM2.5
PM2.5 Total
Bio- CO2 NBio- CO2
Mitigated Construction On-Site
ROG NOx CO SO2 Fugitive PM10
Exhaust PM10
214.4502 214.4502 6.3100e-003
214.60800.2236 1.8100e-003
0.2254 0.0593 1.6600e-003
0.0610Total 0.0954 0.0652 0.7365 2.1500e-003

Total CO2 CH4 N2O CO2e
Category lb/day lb/day
PM10 Total
Fugitive PM2.5
Exhaust PM2.5
PM2.5 Total
Bio- CO2 NBio- CO2
Mitigated Construction On-Site
ROG NOx CO SO2 Fugitive PM10
Exhaust PM10
3,401.0262
3,401.0262 0.1442 3,404.63172.5364 0.0277 2.5641 0.6795 0.0259 0.7054Total 1.1036 5.2061 8.6847 0.0333
2,144.5022
2,144.5022 0.0631 2,146.07982.2355 0.0181 2.2536 0.5929 0.0166 0.6095Worker 0.9536 0.6523 7.3651 0.0215
1,256.5240
1,256.5240 0.0811 1,258.55190.3009 9.6300e-003
0.3105 0.0866 9.2100e-003
0.0958Vendor 0.1500 4.5538 1.3196 0.0118
0.0000 0.0000 0.0000 0.00000.0000 0.0000 0.0000 0.0000 0.0000 0.0000Hauling 0.0000 0.0000 0.0000 0.0000
Total CO2 CH4 N2O CO2e
Category lb/day lb/day
PM10 Total
Fugitive PM2.5
Exhaust PM2.5
PM2.5 Total
Bio- CO2 NBio- CO2
Unmitigated Construction Off-Site
ROG NOx CO SO2 Fugitive PM10
Exhaust PM10
2,553.3639
2,553.3639 0.6160 2,568.76430.9586 0.9586 0.9013 0.9013Total 1.9009 17.4321 16.5752 0.0269
2,553.3639
2,553.3639 0.6160 2,568.76430.9586 0.9586 0.9013 0.9013Off-Road 1.9009 17.4321 16.5752 0.0269
Total CO2 CH4 N2O CO2e
Category lb/day lb/day
PM10 Total
Fugitive PM2.5
Exhaust PM2.5
PM2.5 Total
Bio- CO2 NBio- CO2ROG NOx CO SO2 Fugitive PM10
Exhaust PM10

2,554.3336
2,554.3336 0.6120 2,569.63220.8090 0.8090 0.7612 0.7612Total 1.7062 15.6156 16.3634 0.0269
2,554.3336
2,554.3336 0.6120 2,569.63220.8090 0.8090 0.7612 0.7612Off-Road 1.7062 15.6156 16.3634 0.0269
Total CO2 CH4 N2O CO2e
Category lb/day lb/day
PM10 Total
Fugitive PM2.5
Exhaust PM2.5
PM2.5 Total
Bio- CO2 NBio- CO2
3.3 Building Construction - 2022Unmitigated Construction On-Site
ROG NOx CO SO2 Fugitive PM10
Exhaust PM10
3,401.0262
3,401.0262 0.1442 3,404.63172.5364 0.0277 2.5641 0.6795 0.0259 0.7054Total 1.1036 5.2061 8.6847 0.0333
2,144.5022
2,144.5022 0.0631 2,146.07982.2355 0.0181 2.2536 0.5929 0.0166 0.6095Worker 0.9536 0.6523 7.3651 0.0215
1,256.5240
1,256.5240 0.0811 1,258.55190.3009 9.6300e-003
0.3105 0.0866 9.2100e-003
0.0958Vendor 0.1500 4.5538 1.3196 0.0118
0.0000 0.0000 0.0000 0.00000.0000 0.0000 0.0000 0.0000 0.0000 0.0000Hauling 0.0000 0.0000 0.0000 0.0000
Total CO2 CH4 N2O CO2e
Category lb/day lb/day
PM10 Total
Fugitive PM2.5
Exhaust PM2.5
PM2.5 Total
Bio- CO2 NBio- CO2
Mitigated Construction Off-Site
ROG NOx CO SO2 Fugitive PM10
Exhaust PM10
0.0000 2,553.3639
2,553.3639 0.6160 2,568.76430.9036 0.9036 0.9036 0.9036Total 0.6739 14.2261 17.8738 0.0269
0.0000 2,553.3639
2,553.3639 0.6160 2,568.76430.9036 0.9036 0.9036 0.9036Off-Road 0.6739 14.2261 17.8738 0.0269

Mitigated Construction Off-Site
0.0000 2,554.3336
2,554.3336 0.6120 2,569.63220.9036 0.9036 0.9036 0.9036Total 0.6739 14.2261 17.8738 0.0269
0.0000 2,554.3336
2,554.3336 0.6120 2,569.63220.9036 0.9036 0.9036 0.9036Off-Road 0.6739 14.2261 17.8738 0.0269
Total CO2 CH4 N2O CO2e
Category lb/day lb/day
PM10 Total
Fugitive PM2.5
Exhaust PM2.5
PM2.5 Total
Bio- CO2 NBio- CO2
Mitigated Construction On-Site
ROG NOx CO SO2 Fugitive PM10
Exhaust PM10
3,314.4992
3,314.4992 0.1352 3,317.88032.5364 0.0259 2.5624 0.6795 0.0242 0.7037Total 1.0365 4.9168 8.0327 0.0324
2,069.1389
2,069.1389 0.0570 2,070.56332.2355 0.0175 2.2530 0.5929 0.0161 0.6090Worker 0.8957 0.5891 6.7835 0.0208
1,245.3603
1,245.3603 0.0783 1,247.31700.3009 8.4200e-003
0.3093 0.0866 8.0600e-003
0.0947Vendor 0.1408 4.3277 1.2491 0.0117
0.0000 0.0000 0.0000 0.00000.0000 0.0000 0.0000 0.0000 0.0000 0.0000Hauling 0.0000 0.0000 0.0000 0.0000
Total CO2 CH4 N2O CO2e
Category lb/day lb/day
PM10 Total
Fugitive PM2.5
Exhaust PM2.5
PM2.5 Total
Bio- CO2 NBio- CO2
Unmitigated Construction Off-Site
ROG NOx CO SO2 Fugitive PM10
Exhaust PM10

0.0000 0.0000 0.0000 0.00000.0000 0.0000 0.0000 0.0000 0.0000 0.0000Hauling 0.0000 0.0000 0.0000 0.0000
Total CO2 CH4 N2O CO2e
Category lb/day lb/day
PM10 Total
Fugitive PM2.5
Exhaust PM2.5
PM2.5 Total
Bio- CO2 NBio- CO2
Unmitigated Construction Off-Site
ROG NOx CO SO2 Fugitive PM10
Exhaust PM10
2,207.6603
2,207.6603 0.7140 2,225.51040.5679 0.5679 0.5225 0.5225Total 1.1028 11.1249 14.5805 0.0228
0.0000 0.00000.0000 0.0000 0.0000 0.0000Paving 0.0000
2,207.6603
2,207.6603 0.7140 2,225.51040.5679 0.5679 0.5225 0.5225Off-Road 1.1028 11.1249 14.5805 0.0228
Total CO2 CH4 N2O CO2e
Category lb/day lb/day
PM10 Total
Fugitive PM2.5
Exhaust PM2.5
PM2.5 Total
Bio- CO2 NBio- CO2
3.4 Paving - 2022Unmitigated Construction On-Site
ROG NOx CO SO2 Fugitive PM10
Exhaust PM10
3,314.4992
3,314.4992 0.1352 3,317.88032.5364 0.0259 2.5624 0.6795 0.0242 0.7037Total 1.0365 4.9168 8.0327 0.0324
2,069.1389
2,069.1389 0.0570 2,070.56332.2355 0.0175 2.2530 0.5929 0.0161 0.6090Worker 0.8957 0.5891 6.7835 0.0208
1,245.3603
1,245.3603 0.0783 1,247.31700.3009 8.4200e-003
0.3093 0.0866 8.0600e-003
0.0947Vendor 0.1408 4.3277 1.2491 0.0117
0.0000 0.0000 0.0000 0.00000.0000 0.0000 0.0000 0.0000 0.0000 0.0000Hauling 0.0000 0.0000 0.0000 0.0000
Total CO2 CH4 N2O CO2e
Category lb/day lb/day
PM10 Total
Fugitive PM2.5
Exhaust PM2.5
PM2.5 Total
Bio- CO2 NBio- CO2ROG NOx CO SO2 Fugitive PM10
Exhaust PM10

155.1854 155.1854 4.2700e-003
155.29220.1677 1.3100e-003
0.1690 0.0445 1.2100e-003
0.0457Total 0.0672 0.0442 0.5088 1.5600e-003
155.1854 155.1854 4.2700e-003
155.29220.1677 1.3100e-003
0.1690 0.0445 1.2100e-003
0.0457Worker 0.0672 0.0442 0.5088 1.5600e-003
0.0000 0.0000 0.0000 0.00000.0000 0.0000 0.0000 0.0000 0.0000 0.0000Vendor 0.0000 0.0000 0.0000 0.0000
0.0000 0.0000 0.0000 0.00000.0000 0.0000 0.0000 0.0000 0.0000 0.0000Hauling 0.0000 0.0000 0.0000 0.0000
Total CO2 CH4 N2O CO2e
Category lb/day lb/day
PM10 Total
Fugitive PM2.5
Exhaust PM2.5
PM2.5 Total
Bio- CO2 NBio- CO2
Mitigated Construction Off-Site
ROG NOx CO SO2 Fugitive PM10
Exhaust PM10
0.0000 2,207.6603
2,207.6603 0.7140 2,225.51040.6093 0.6093 0.6093 0.6093Total 0.5609 11.2952 17.2957 0.0228
0.0000 0.00000.0000 0.0000 0.0000 0.0000Paving 0.0000
0.0000 2,207.6603
2,207.6603 0.7140 2,225.51040.6093 0.6093 0.6093 0.6093Off-Road 0.5609 11.2952 17.2957 0.0228
Total CO2 CH4 N2O CO2e
Category lb/day lb/day
PM10 Total
Fugitive PM2.5
Exhaust PM2.5
PM2.5 Total
Bio- CO2 NBio- CO2
Mitigated Construction On-Site
ROG NOx CO SO2 Fugitive PM10
Exhaust PM10
155.1854 155.1854 4.2700e-003
155.29220.1677 1.3100e-003
0.1690 0.0445 1.2100e-003
0.0457Total 0.0672 0.0442 0.5088 1.5600e-003
155.1854 155.1854 4.2700e-003
155.29220.1677 1.3100e-003
0.1690 0.0445 1.2100e-003
0.0457Worker 0.0672 0.0442 0.5088 1.5600e-003
0.0000 0.0000 0.0000 0.00000.0000 0.0000 0.0000 0.0000 0.0000 0.0000Vendor 0.0000 0.0000 0.0000 0.0000

Mitigated Construction On-Site
149.5081 149.5081 3.8500e-003
149.60430.1677 1.2800e-003
0.1689 0.0445 1.1700e-003
0.0456Total 0.0633 0.0400 0.4677 1.5000e-003
149.5081 149.5081 3.8500e-003
149.60430.1677 1.2800e-003
0.1689 0.0445 1.1700e-003
0.0456Worker 0.0633 0.0400 0.4677 1.5000e-003
0.0000 0.0000 0.0000 0.00000.0000 0.0000 0.0000 0.0000 0.0000 0.0000Vendor 0.0000 0.0000 0.0000 0.0000
0.0000 0.0000 0.0000 0.00000.0000 0.0000 0.0000 0.0000 0.0000 0.0000Hauling 0.0000 0.0000 0.0000 0.0000
Total CO2 CH4 N2O CO2e
Category lb/day lb/day
PM10 Total
Fugitive PM2.5
Exhaust PM2.5
PM2.5 Total
Bio- CO2 NBio- CO2
Unmitigated Construction Off-Site
ROG NOx CO SO2 Fugitive PM10
Exhaust PM10
2,207.5841
2,207.5841 0.7140 2,225.43360.5102 0.5102 0.4694 0.4694Total 1.0327 10.1917 14.5842 0.0228
0.0000 0.00000.0000 0.0000 0.0000 0.0000Paving 0.0000
2,207.5841
2,207.5841 0.7140 2,225.43360.5102 0.5102 0.4694 0.4694Off-Road 1.0327 10.1917 14.5842 0.0228
Total CO2 CH4 N2O CO2e
Category lb/day lb/day
PM10 Total
Fugitive PM2.5
Exhaust PM2.5
PM2.5 Total
Bio- CO2 NBio- CO2
3.4 Paving - 2023Unmitigated Construction On-Site
ROG NOx CO SO2 Fugitive PM10
Exhaust PM10

0.0000 0.00000.0000 0.0000 0.0000 0.0000Archit. Coating 58.6346
Total CO2 CH4 N2O CO2e
Category lb/day lb/day
PM10 Total
Fugitive PM2.5
Exhaust PM2.5
PM2.5 Total
Bio- CO2 NBio- CO2
3.5 Architectural Coating - 2023Unmitigated Construction On-Site
ROG NOx CO SO2 Fugitive PM10
Exhaust PM10
149.5081 149.5081 3.8500e-003
149.60430.1677 1.2800e-003
0.1689 0.0445 1.1700e-003
0.0456Total 0.0633 0.0400 0.4677 1.5000e-003
149.5081 149.5081 3.8500e-003
149.60430.1677 1.2800e-003
0.1689 0.0445 1.1700e-003
0.0456Worker 0.0633 0.0400 0.4677 1.5000e-003
0.0000 0.0000 0.0000 0.00000.0000 0.0000 0.0000 0.0000 0.0000 0.0000Vendor 0.0000 0.0000 0.0000 0.0000
0.0000 0.0000 0.0000 0.00000.0000 0.0000 0.0000 0.0000 0.0000 0.0000Hauling 0.0000 0.0000 0.0000 0.0000
Total CO2 CH4 N2O CO2e
Category lb/day lb/day
PM10 Total
Fugitive PM2.5
Exhaust PM2.5
PM2.5 Total
Bio- CO2 NBio- CO2
Mitigated Construction Off-Site
ROG NOx CO SO2 Fugitive PM10
Exhaust PM10
0.0000 2,207.5841
2,207.5841 0.7140 2,225.43360.6093 0.6093 0.6093 0.6093Total 0.5609 11.2952 17.2957 0.0228
0.0000 0.00000.0000 0.0000 0.0000 0.0000Paving 0.0000
0.0000 2,207.5841
2,207.5841 0.7140 2,225.43360.6093 0.6093 0.6093 0.6093Off-Road 0.5609 11.2952 17.2957 0.0228
Total CO2 CH4 N2O CO2e
Category lb/day lb/day
PM10 Total
Fugitive PM2.5
Exhaust PM2.5
PM2.5 Total
Bio- CO2 NBio- CO2ROG NOx CO SO2 Fugitive PM10
Exhaust PM10
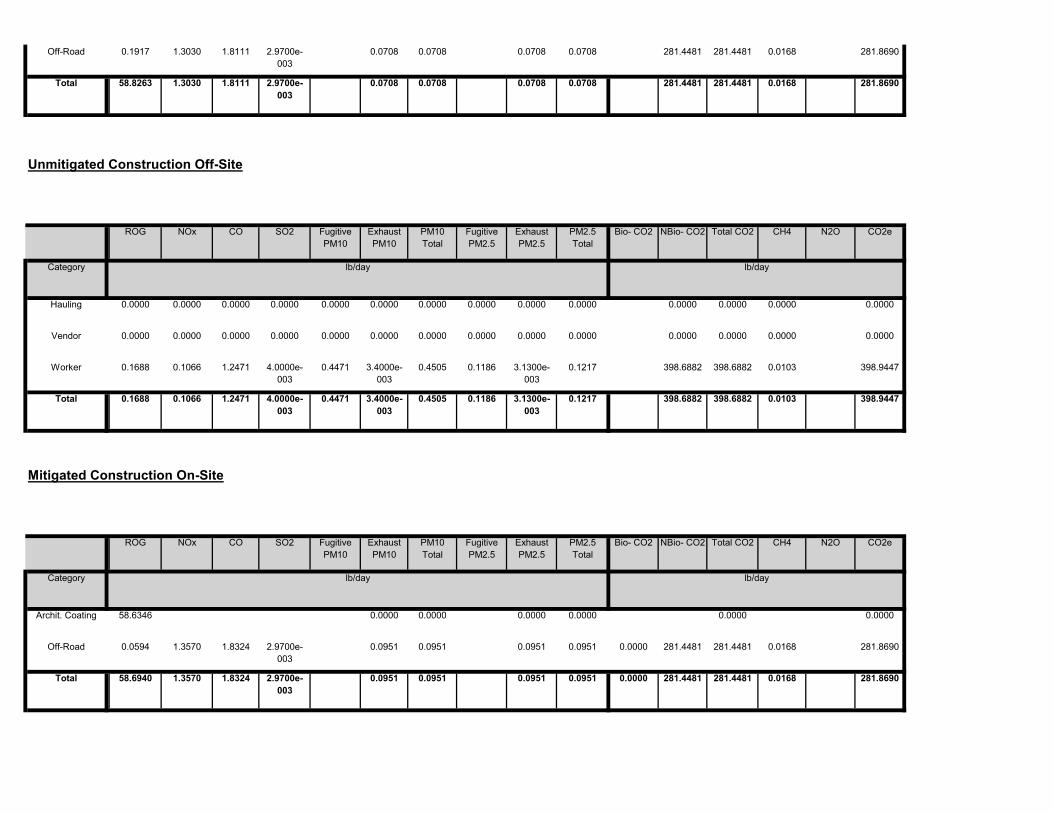
0.0000 281.4481 281.4481 0.0168 281.86900.0951 0.0951 0.0951 0.0951Total 58.6940 1.3570 1.8324 2.9700e-003
0.0000 281.4481 281.4481 0.0168 281.86900.0951 0.0951 0.0951 0.0951Off-Road 0.0594 1.3570 1.8324 2.9700e-003
0.0000 0.00000.0000 0.0000 0.0000 0.0000Archit. Coating 58.6346
Total CO2 CH4 N2O CO2e
Category lb/day lb/day
PM10 Total
Fugitive PM2.5
Exhaust PM2.5
PM2.5 Total
Bio- CO2 NBio- CO2
Mitigated Construction On-Site
ROG NOx CO SO2 Fugitive PM10
Exhaust PM10
398.6882 398.6882 0.0103 398.94470.4471 3.4000e-003
0.4505 0.1186 3.1300e-003
0.1217Total 0.1688 0.1066 1.2471 4.0000e-003
398.6882 398.6882 0.0103 398.94470.4471 3.4000e-003
0.4505 0.1186 3.1300e-003
0.1217Worker 0.1688 0.1066 1.2471 4.0000e-003
0.0000 0.0000 0.0000 0.00000.0000 0.0000 0.0000 0.0000 0.0000 0.0000Vendor 0.0000 0.0000 0.0000 0.0000
0.0000 0.0000 0.0000 0.00000.0000 0.0000 0.0000 0.0000 0.0000 0.0000Hauling 0.0000 0.0000 0.0000 0.0000
Total CO2 CH4 N2O CO2e
Category lb/day lb/day
PM10 Total
Fugitive PM2.5
Exhaust PM2.5
PM2.5 Total
Bio- CO2 NBio- CO2
Unmitigated Construction Off-Site
ROG NOx CO SO2 Fugitive PM10
Exhaust PM10
281.4481 281.4481 0.0168 281.86900.0708 0.0708 0.0708 0.0708Total 58.8263 1.3030 1.8111 2.9700e-003
281.4481 281.4481 0.0168 281.86900.0708 0.0708 0.0708 0.0708Off-Road 0.1917 1.3030 1.8111 2.9700e-003

4.2 Trip Summary Information
Average Daily Trip Rate Unmitigated Mitigated
10,546.0941
10,546.0941
0.5094 10,558.8279
9.3641 0.0801 9.4442 2.5057 0.0745 2.5802Unmitigated 1.9537 8.7785 26.0760 0.1034
10,546.0941
10,546.0941
0.5094 10,558.8279
9.3641 0.0801 9.4442 2.5057 0.0745 2.5802Mitigated 1.9537 8.7785 26.0760 0.1034
NBio- CO2 Total CO2 CH4 N2O CO2e
Category lb/day lb/day
Exhaust PM10
PM10 Total
Fugitive PM2.5
Exhaust PM2.5
PM2.5 Total
Bio- CO2
4.0 Operational Detail - Mobile
4.1 Mitigation Measures Mobile
ROG NOx CO SO2 Fugitive PM10
398.6882 398.6882 0.0103 398.94470.4471 3.4000e-003
0.4505 0.1186 3.1300e-003
0.1217Total 0.1688 0.1066 1.2471 4.0000e-003
398.6882 398.6882 0.0103 398.94470.4471 3.4000e-003
0.4505 0.1186 3.1300e-003
0.1217Worker 0.1688 0.1066 1.2471 4.0000e-003
0.0000 0.0000 0.0000 0.00000.0000 0.0000 0.0000 0.0000 0.0000 0.0000Vendor 0.0000 0.0000 0.0000 0.0000
0.0000 0.0000 0.0000 0.00000.0000 0.0000 0.0000 0.0000 0.0000 0.0000Hauling 0.0000 0.0000 0.0000 0.0000
Total CO2 CH4 N2O CO2e
Category lb/day lb/day
PM10 Total
Fugitive PM2.5
Exhaust PM2.5
PM2.5 Total
Bio- CO2 NBio- CO2
Mitigated Construction Off-Site
ROG NOx CO SO2 Fugitive PM10
Exhaust PM10

953.62980.0600 947.9963 947.9963 0.0182 0.01744.7400e-003
0.0600 0.0600 0.0600
947.9963 947.9963 0.0182 0.0174 953.6298
NaturalGas Unmitigated
0.0869 0.7426 0.3160
0.0600 0.0600 0.0600 0.0600
Category lb/day lb/day
NaturalGas Mitigated
0.0869 0.7426 0.3160 4.7400e-003
Bio- CO2 NBio- CO2 Total CO2 CH4 N2O CO2eFugitive PM10
Exhaust PM10
PM10 Total
Fugitive PM2.5
Exhaust PM2.5
PM2.5 Total
ROG NOx CO SO2
0.000696 0.000850
5.0 Energy Detail
Historical Energy Use: N
5.1 Mitigation Measures Energy
Install Energy Efficient Appliances
0.006253 0.020617 0.031756 0.002560 0.002071 0.005217Parking Lot 0.545348 0.044620 0.206559 0.118451 0.015002
0.031756 0.002560 0.002071 0.005217 0.000696 0.000850
SBUS MH
Apartments Low Rise 0.545348 0.044620 0.206559 0.118451 0.015002 0.006253 0.020617
LHD2 MHD HHD OBUS UBUS MCYLand Use LDA LDT1 LDT2 MDV LHD1
0.00 0.00 0 0 0
4.4 Fleet Mix
19.20 40.60 86 11 3
Parking Lot 16.60 8.40 6.90 0.00
H-S or C-C H-O or C-NW Primary Diverted Pass-by
Apartments Low Rise 14.70 5.90 8.70 40.20
4.3 Trip Type Information
Miles Trip % Trip Purpose %
Land Use H-W or C-W H-S or C-C H-O or C-NW H-W or C-W
Total 1,186.20 1,288.80 1,092.60 4,057,819 4,057,819Parking Lot 0.00 0.00 0.00
Annual VMT
Apartments Low Rise 1,186.20 1,288.80 1092.60 4,057,819 4,057,819
Land Use Weekday Saturday Sunday Annual VMT

6.0 Area Detail
6.1 Mitigation Measures Area
Use Low VOC Paint - Residential Interior
947.9963 947.9963 0.0182 0.0174 953.62980.0600 0.0600 0.0600 0.0600Total 0.0869 0.7426 0.3160 4.7400e-003
0.0000 0.0000 0.0000 0.0000 0.00000.0000 0.0000 0.0000 0.0000Parking Lot 0 0.0000 0.0000 0.0000 0.0000
947.9963 947.9963 0.0182 0.0174 953.62980.0600 0.0600 0.0600 0.0600Apartments Low Rise
8.05797 0.0869 0.7426 0.3160 4.7400e-003
Total CO2 CH4 N2O CO2e
Land Use kBTU/yr lb/day lb/day
PM10 Total
Fugitive PM2.5
Exhaust PM2.5
PM2.5 Total Bio- CO2 NBio- CO2
Mitigated
NaturalGas Use
ROG NOx CO SO2 Fugitive PM10
Exhaust PM10
947.9963 947.9963 0.0182 0.0174 953.62980.0600 0.0600 0.0600 0.0600Total 0.0869 0.7426 0.3160 4.7400e-003
0.0000 0.0000 0.0000 0.0000 0.00000.0000 0.0000 0.0000 0.0000Parking Lot 0 0.0000 0.0000 0.0000 0.0000
947.9963 947.9963 0.0182 0.0174 953.62980.0600 0.0600 0.0600 0.0600Apartments Low Rise
8057.97 0.0869 0.7426 0.3160 4.7400e-003
NBio- CO2 Total CO2 CH4 N2O CO2e
Land Use kBTU/yr lb/day lb/day
Exhaust PM10
PM10 Total
Fugitive PM2.5
Exhaust PM2.5
PM2.5 Total Bio- CO2
5.2 Energy by Land Use - NaturalGasUnmitigated
NaturalGas Use
ROG NOx CO SO2 Fugitive PM10

0.0000 3,266.8307
3,266.8307 0.0880 0.0594 3,286.73170.2876 0.2876 0.2876 0.2876Total 4.6916 2.7094 15.9665 0.0170
26.8307 26.8307 0.0259 27.47800.0824 0.0824 0.0824 0.0824Landscaping 0.4503 0.1714 14.8865 7.9000e-004
0.0000 3,240.0000
3,240.0000 0.0621 0.0594 3,259.25370.2052 0.2052 0.2052 0.2052Hearth 0.2970 2.5380 1.0800 0.0162
0.0000 0.00000.0000 0.0000 0.0000 0.0000Consumer Products
3.6231
0.0000 0.00000.0000 0.0000 0.0000 0.0000Architectural Coating
0.3213
Total CO2 CH4 N2O CO2e
SubCategory lb/day lb/day
PM10 Total
Fugitive PM2.5
Exhaust PM2.5
PM2.5 Total
Bio- CO2 NBio- CO2
6.2 Area by SubCategoryUnmitigated
ROG NOx CO SO2 Fugitive PM10
Exhaust PM10
0.0000 3,266.8307
3,266.8307 0.0880 0.0594 3,286.73170.2876 0.2876 0.2876 0.2876Unmitigated 4.6916 2.7094 15.9665 0.0170
0.0000 3,266.8307
3,266.8307 0.0880 0.0594 3,286.73170.2876 0.2876 0.2876 0.2876
CO2e
Category lb/day lb/day
Mitigated 4.6916 2.7094 15.9665 0.0170
PM2.5 Total
Bio- CO2 NBio- CO2 Total CO2 CH4 N2OSO2 Fugitive PM10
Exhaust PM10
PM10 Total
Fugitive PM2.5
Exhaust PM2.5
Use Low VOC Paint - Residential Exterior
Use Low VOC Cleaning Supplies
ROG NOx CO

Fuel Type
Use Water Efficient Irrigation System
8.0 Waste Detail
8.1 Mitigation Measures Waste
9.0 Operational Offroad
Equipment Type Number Hours/Day Days/Year Horse Power Load Factor
7.0 Water Detail
7.1 Mitigation Measures Water
Install Low Flow Bathroom Faucet
Install Low Flow Kitchen Faucet
Install Low Flow Toilet
Install Low Flow Shower
0.0000 3,266.8307
3,266.8307 0.0880 0.0594 3,286.73170.2876 0.2876 0.2876 0.2876Total 4.6916 2.7094 15.9665 0.0170
26.8307 26.8307 0.0259 27.47800.0824 0.0824 0.0824 0.0824Landscaping 0.4503 0.1714 14.8865 7.9000e-004
0.0000 3,240.0000
3,240.0000 0.0621 0.0594 3,259.25370.2052 0.2052 0.2052 0.2052Hearth 0.2970 2.5380 1.0800 0.0162
0.0000 0.00000.0000 0.0000 0.0000 0.0000Consumer Products
3.6231
0.0000 0.00000.0000 0.0000 0.0000 0.0000Architectural Coating
0.3213
Total CO2 CH4 N2O CO2e
SubCategory lb/day lb/day
PM10 Total
Fugitive PM2.5
Exhaust PM2.5
PM2.5 Total
Bio- CO2 NBio- CO2
Mitigated
ROG NOx CO SO2 Fugitive PM10
Exhaust PM10

Fuel Type
User Defined Equipment
Equipment Type Number
11.0 Vegetation
Boilers
Equipment Type Number Heat Input/Day Heat Input/Year Boiler Rating
10.0 Stationary Equipment
Fire Pumps and Emergency Generators
Equipment Type Number Hours/Day Hours/Year Horse Power Load Factor Fuel Type