air service report waterloo regional airport...
TRANSCRIPT
Summary Report- Waterloo Regional Airport -1-
Commercial air service supported by Waterloo Regional Airport is critical to residents and businesses in the airport’s market area, as well as to visitors who arrive in Iowa via the airport. The airport also performs a very important role as an economic engine for the area it serves. For commercial airports in Iowa to fulfill their important transportation and economic roles, it is essential for them to have information that can be used to assist in air service development. To that end, the Iowa Department of Transportation’s Office of Aviation commissioned a study that provides key data commercial airports can use to make informed decisions in their efforts to maintain and enhance commercial air service. This report summarizes information for Waterloo Regional Airport that is contained in the study’s full technical report on statewide air service and economic impact of commercial air service in Iowa.
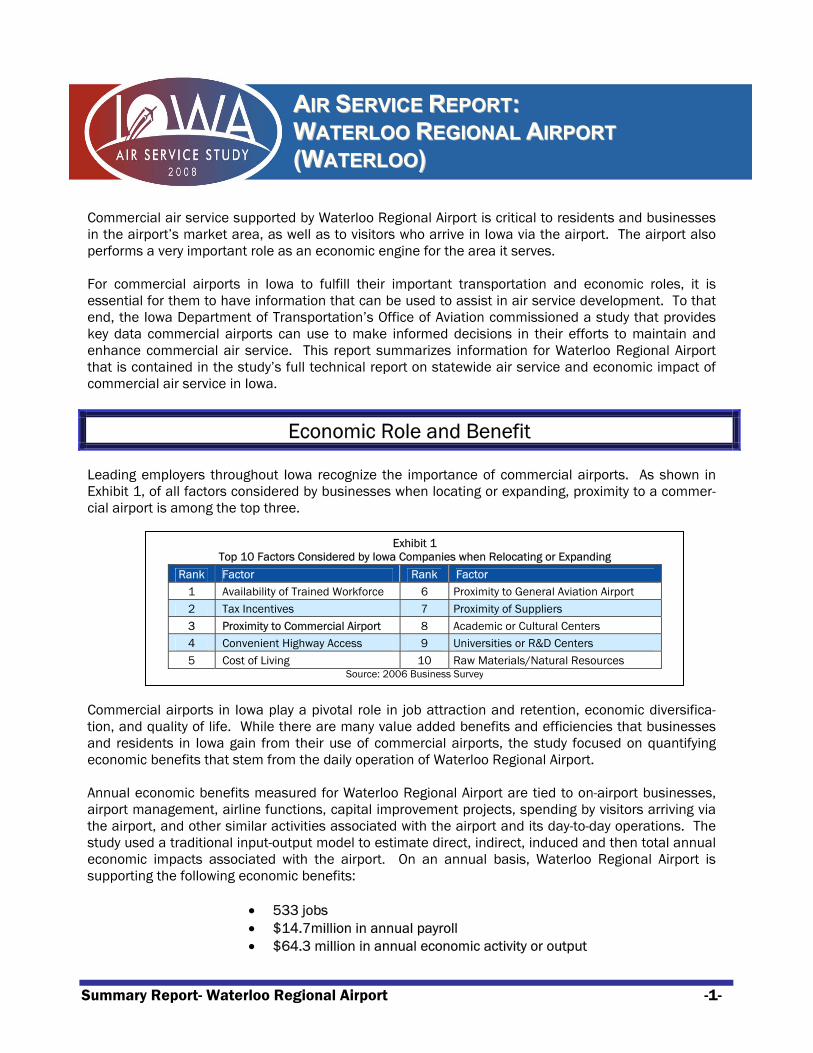
Economic Role and Benefit Leading employers throughout Iowa recognize the importance of commercial airports. As shown in Exhibit 1, of all factors considered by businesses when locating or expanding, proximity to a commer-cial airport is among the top three.
Commercial airports in Iowa play a pivotal role in job attraction and retention, economic diversifica-tion, and quality of life. While there are many value added benefits and efficiencies that businesses and residents in Iowa gain from their use of commercial airports, the study focused on quantifying economic benefits that stem from the daily operation of Waterloo Regional Airport. Annual economic benefits measured for Waterloo Regional Airport are tied to on-airport businesses, airport management, airline functions, capital improvement projects, spending by visitors arriving via the airport, and other similar activities associated with the airport and its day-to-day operations. The study used a traditional input-output model to estimate direct, indirect, induced and then total annual economic impacts associated with the airport. On an annual basis, Waterloo Regional Airport is supporting the following economic benefits:
• 533 jobs • $14.7million in annual payroll • $64.3 million in annual economic activity or output
AAIIRR SSEERRVVIICCEE RREEPPOORRTT:: WWAATTEERRLLOOOO RREEGGIIOONNAALL AAIIRRPPOORRTT ((WWAATTEERRLLOOOO))
Exhibit 1 Top 10 Factors Considered by Iowa Companies when Relocating or Expanding
Rank Factor Rank Factor 1 Availability of Trained Workforce 6 Proximity to General Aviation Airport 2 Tax Incentives 7 Proximity of Suppliers 3 Proximity to Commercial Airport 8 Academic or Cultural Centers 4 Convenient Highway Access 9 Universities or R&D Centers 5 Cost of Living 10 Raw Materials/Natural Resources
Source: 2006 Business Survey

Summary Report- Waterloo Regional Airport -2-
For the airport to continue its important role as a transportation and economic provider, it is critical for its scheduled commercial airline service to be maintained and, if possible, expanded. The study pro-vides important base data that sets the stage for understanding the airport’s market area and for identi-fying air service needs and opportunities.
Historic Market Overview
Waterloo Regional Airport currently has 26 weekly departures to Minneapolis/St. Paul on Pinnacle and Mesaba, Northwest Airlines’ regional partners. Service to Minneapolis/St. Paul is provided with a com-bination of 34-seat Saab 340 turboprop aircraft and 50-seat CRJ regional jets. Exhibit 2 presents historic passenger enplanements for Waterloo Regional Airport. Enplanements declined fairly steadily between 1996 and 2006. Exhibit 2 also shows average one-way airfares from the airport for the same time frame. While airfares are a very important factor impacting enplanements, reliability and frequency of service are also factors for people using Waterloo Regional. Nonstop service to Chicago-O’Hare and St. Louis was discontinued in 2003. This accounts for the sharp drop in en-planements that year. With just one carrier serving the airport, fares subsequently increased following the service reductions.
Exhibit 2 Historic Enplanements and Airfares
Waterloo Regional Airport
0
10,000
20,000
30,000
40,000
50,000
60,000
70,000
80,000
19
96
19
97
19
98
19
99
20
00
20
01
20
02
20
03
20
04
20
05
20
06
En
pla
ne
me
nts
$0
$50
$100
$150
$200
$250
On
e-W
ay
Fa
red
Ave
rage
Fa
re
Enplanements One-Way Fared Average Fare
Sources: Iowa DOT and US DOT O&D Survey

Summary Report- Waterloo Regional Airport -3-
As Exhibit 3 shows, when all commercial airports in Iowa are considered, total enplaning passengers increased slightly between 1996 and 2006. Enplanements for Waterloo Regional Airport account for a decreasing share of total enplanements. In 1996, enplanements at Waterloo Regional accounted for 4.3 percent of total statewide enplanements, compared to 2.0 percent in 2006. Trends in enplane-ments summarized in this section are important when determining what actions are most feasible as they relate to maintaining and/or improving the airport’s scheduled commercial service.
Survey Results
Input from customers is important to determining an airport’s ability to maintain and/or improve scheduled commercial airline service. One component of the study was to conduct surveys of the airport’s users. The information presented here can assist airports in developing air service strate-gies and opportunities for marketing. Customers can be residents of the airport’s market area or they can be visitors to Iowa. As shown in Exhibit 4, the percent of visitor-related enplanements is higher than resident-related enplanements.
Exhibit 4 Resident versus Visitor Split Waterloo Regional Airport
Resident, 45% Visitor, 55%
0% 10% 20% 30% 40% 50% 60% 70% 80% 90% 100%
Source: US DOT O&D Survey
Exhibit 3 Statewide Enplanements
0
200
400
600
800
1,000
1,200
1,400
1,600
1,800
1996 1998 2000 2002 2004 2006
En
pla
ne
me
nts
(0
00
) Fort Dodge
Burlington
Mason City
Waterloo
Sioux City
Dubuque
Cedar Rapids
Des Moines
Source: Iowa DOT

Summary Report- Waterloo Regional Airport -4-
Exhibit 7 Importance of Factors When Choosing a Departure Airport
Waterloo Regional Airport
Rank Category Average Importance Rank Category Average
Importance 1 Reliability of Airline Service 4.41 7 Cheaper or Free Parking 3.12 2 Airline Fares 4.29 8 Passenger Terminal Amenities 3.12 3 Proximity of Airport to Work/Home 4.29 9 Choice of Airline 3.07 4 Nonstop Service to Desired Destination 3.41 10 Frequent Flyer/Mileage Program 3.00 5 Aircraft Size 3.41 11 Faster, Easier Security Clearance 2.82 6 Frequency or Schedule of Flights 3.18
Source: 2006 Passenger Survey
Information on trip purpose was obtained from passengers using the airport. The majority were traveling for vacation and personal reasons. Exhibit 5 summarizes information on trip purpose.
On a scale of 1 to 5, with 5 being excellent, departing passengers rated the airport’s facilities/services as shown in Exhibit 6. According to passengers using Waterloo Regional Airport, the airport has good termi-nal amenities and passenger satisfaction is high.
When developing air service initiatives, it is also important to understand those factors that most influ-ence the customer’s decision when they select an airport for the airline travel. It is a fact that in today’s environment, customers shop and compare among airports. For those customers using Waterloo Re-gional Airport, Exhibit 7 shows the relative importance of various decision making factors, with 5 repre-senting factors having the greatest influence on selecting a departure airport. As highlighted, reliability and fares were top factors influencing airport selection.
Exhibit 5 Trip Purpose
Waterloo Regional Airport
Military5%
Personal53%
Business21%Vacation
21%
Source: 2006 Survey Results
Exhibit 6 Service and Amenities Ratings
Waterloo Regional Airport
Rank Category Average Rating Rank Category Average
Rating 1 Ticket Counter/Lobby 4.39 5 Clarity and Usefulness of Signage 4.11 2 Restaurants/Bar 4.29 6 Security Experience 3.94 3 Restrooms 4.24 7 Departure Gate Area 3.94 4 Parking 4.23 8 News & Gifts 3.50
Source: 2006 Passenger Survey
Summary Report- Waterloo Regional Airport -5-
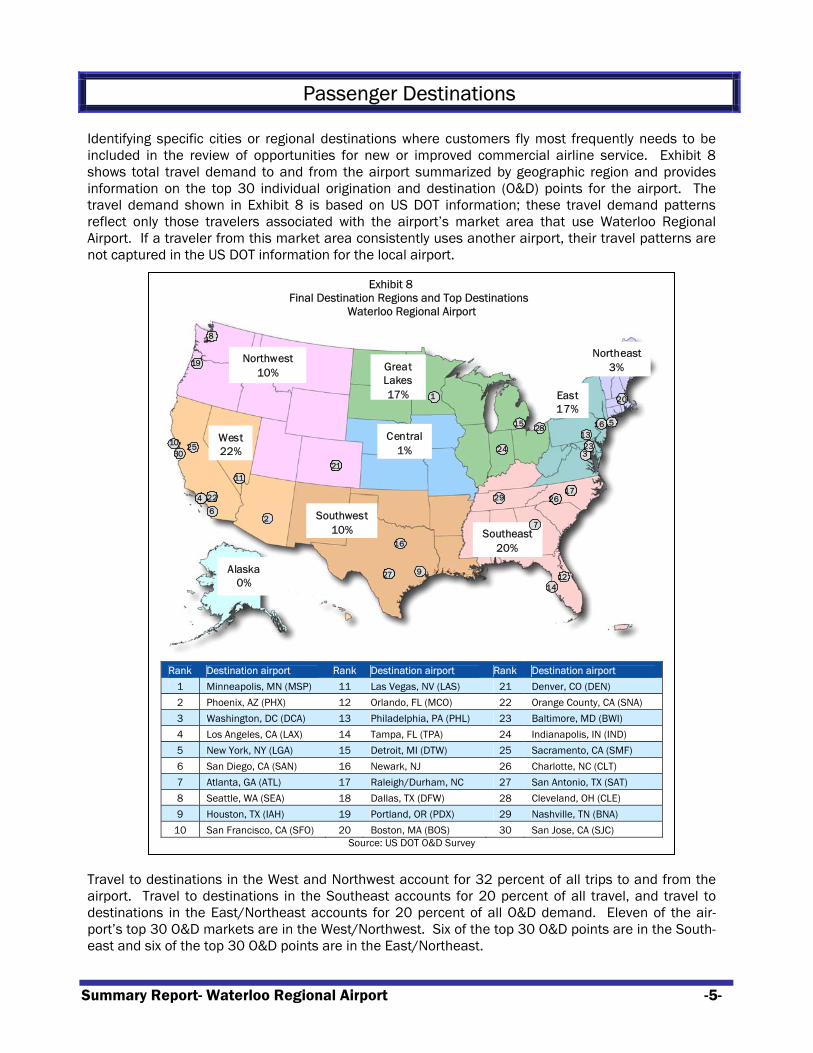
Passenger Destinations
Identifying specific cities or regional destinations where customers fly most frequently needs to be included in the review of opportunities for new or improved commercial airline service. Exhibit 8 shows total travel demand to and from the airport summarized by geographic region and provides information on the top 30 individual origination and destination (O&D) points for the airport. The travel demand shown in Exhibit 8 is based on US DOT information; these travel demand patterns reflect only those travelers associated with the airport’s market area that use Waterloo Regional Airport. If a traveler from this market area consistently uses another airport, their travel patterns are not captured in the US DOT information for the local airport.
Travel to destinations in the West and Northwest account for 32 percent of all trips to and from the airport. Travel to destinations in the Southeast accounts for 20 percent of all travel, and travel to destinations in the East/Northeast accounts for 20 percent of all O&D demand. Eleven of the air-port’s top 30 O&D markets are in the West/Northwest. Six of the top 30 O&D points are in the South-east and six of the top 30 O&D points are in the East/Northeast.
Exhibit 8 Final Destination Regions and Top Destinations
Waterloo Regional Airport
Northwest10%
West22%
Great Lakes17%
Central1%
Southwest10% Southeast
20%
East17%
Northeast3%
Alaska0%
1261
1
4
1
1
11
8
30
6
16
9
28
3
13
14
16
2
2917
19
12
7
5
1
10 25 23
15
22
24
21
11
27
20
Northwest10%
West22%
Great Lakes17%
Central1%
Southwest10% Southeast
20%
East17%
Northeast3%
Alaska0%
112611
11
4
11
11
1111
8
30
6
16
9
28
3
13
14
16
2
2917
19
12
7
5
1
10 25 23
15
22
24
21
11
27
20
Rank Destination airport Rank Destination airport Rank Destination airport
1 Minneapolis, MN (MSP) 11 Las Vegas, NV (LAS) 21 Denver, CO (DEN) 2 Phoenix, AZ (PHX) 12 Orlando, FL (MCO) 22 Orange County, CA (SNA) 3 Washington, DC (DCA) 13 Philadelphia, PA (PHL) 23 Baltimore, MD (BWI) 4 Los Angeles, CA (LAX) 14 Tampa, FL (TPA) 24 Indianapolis, IN (IND) 5 New York, NY (LGA) 15 Detroit, MI (DTW) 25 Sacramento, CA (SMF) 6 San Diego, CA (SAN) 16 Newark, NJ 26 Charlotte, NC (CLT) 7 Atlanta, GA (ATL) 17 Raleigh/Durham, NC 27 San Antonio, TX (SAT) 8 Seattle, WA (SEA) 18 Dallas, TX (DFW) 28 Cleveland, OH (CLE) 9 Houston, TX (IAH) 19 Portland, OR (PDX) 29 Nashville, TN (BNA)
10 San Francisco, CA (SFO) 20 Boston, MA (BOS) 30 San Jose, CA (SJC) Source: US DOT O&D Survey
Summary Report- Waterloo Regional Airport -6-
Market Area Demand
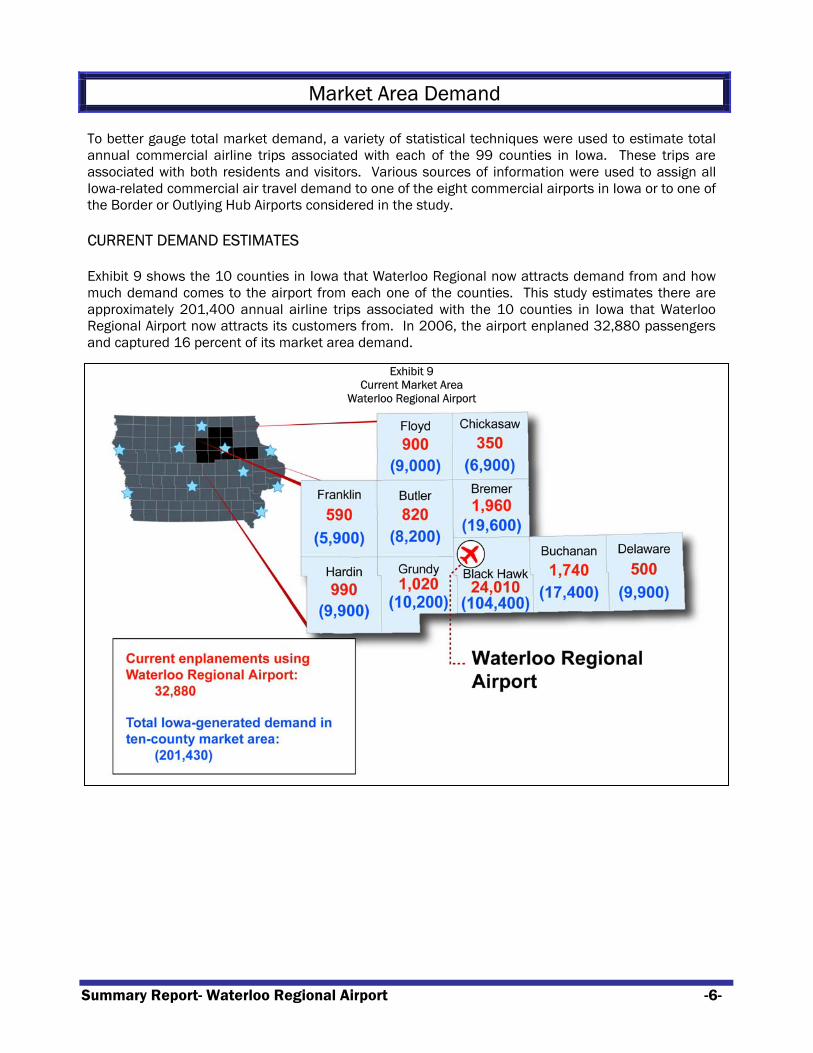
To better gauge total market demand, a variety of statistical techniques were used to estimate total annual commercial airline trips associated with each of the 99 counties in Iowa. These trips are associated with both residents and visitors. Various sources of information were used to assign all Iowa-related commercial air travel demand to one of the eight commercial airports in Iowa or to one of the Border or Outlying Hub Airports considered in the study. CURRENT DEMAND ESTIMATES Exhibit 9 shows the 10 counties in Iowa that Waterloo Regional now attracts demand from and how much demand comes to the airport from each one of the counties. This study estimates there are approximately 201,400 annual airline trips associated with the 10 counties in Iowa that Waterloo Regional Airport now attracts its customers from. In 2006, the airport enplaned 32,880 passengers and captured 16 percent of its market area demand.
Exhibit 9
Current Market Area Waterloo Regional Airport
Summary Report- Waterloo Regional Airport -7-
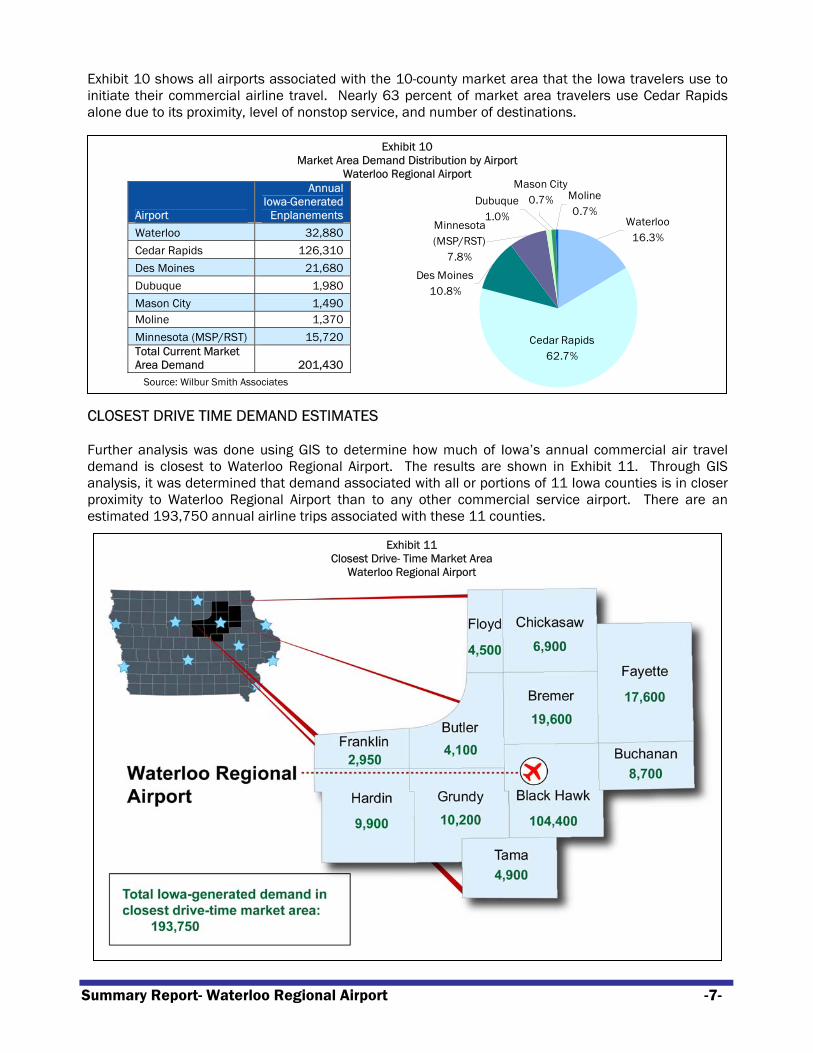
Exhibit 10 shows all airports associated with the 10-county market area that the Iowa travelers use to initiate their commercial airline travel. Nearly 63 percent of market area travelers use Cedar Rapids alone due to its proximity, level of nonstop service, and number of destinations.
CLOSEST DRIVE TIME DEMAND ESTIMATES Further analysis was done using GIS to determine how much of Iowa’s annual commercial air travel demand is closest to Waterloo Regional Airport. The results are shown in Exhibit 11. Through GIS analysis, it was determined that demand associated with all or portions of 11 Iowa counties is in closer proximity to Waterloo Regional Airport than to any other commercial service airport. There are an estimated 193,750 annual airline trips associated with these 11 counties.
Exhibit 11 Closest Drive- Time Market Area
Waterloo Regional Airport
Exhibit 10 Market Area Demand Distribution by Airport
Waterloo Regional Airport
Airport
Annual Iowa-Generated
Enplanements
Waterloo 32,880
Cedar Rapids 126,310
Des Moines 21,680
Dubuque 1,980
Mason City 1,490 Moline 1,370
Minnesota (MSP/RST) 15,720 Total Current Market Area Demand 201,430
Source: Wilbur Smith Associates
Moline0.7%
Mason City0.7%
Minnesota (MSP/RST)
7.8%
Dubuque1.0%
Des Moines10.8%
Cedar Rapids62.7%
Waterloo16.3%
Summary Report- Waterloo Regional Airport -8-
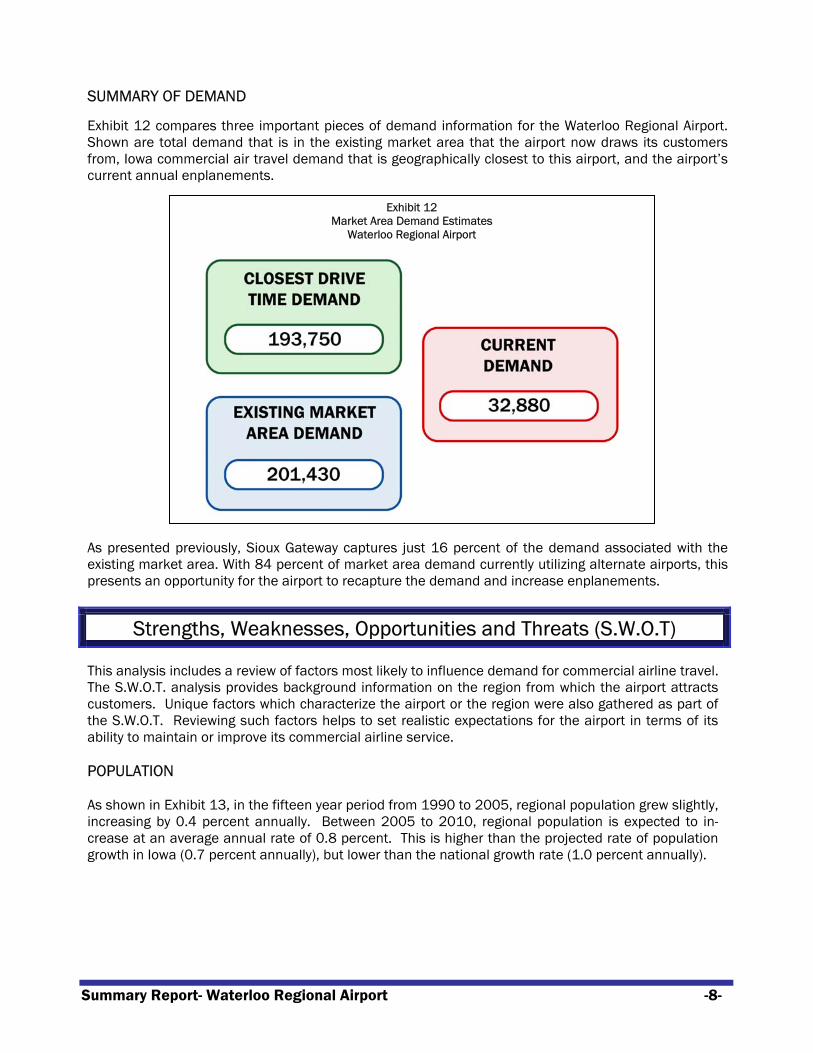
SUMMARY OF DEMAND Exhibit 12 compares three important pieces of demand information for the Waterloo Regional Airport. Shown are total demand that is in the existing market area that the airport now draws its customers from, Iowa commercial air travel demand that is geographically closest to this airport, and the airport’s current annual enplanements.
As presented previously, Sioux Gateway captures just 16 percent of the demand associated with the existing market area. With 84 percent of market area demand currently utilizing alternate airports, this presents an opportunity for the airport to recapture the demand and increase enplanements.
Strengths, Weaknesses, Opportunities and Threats (S.W.O.T)
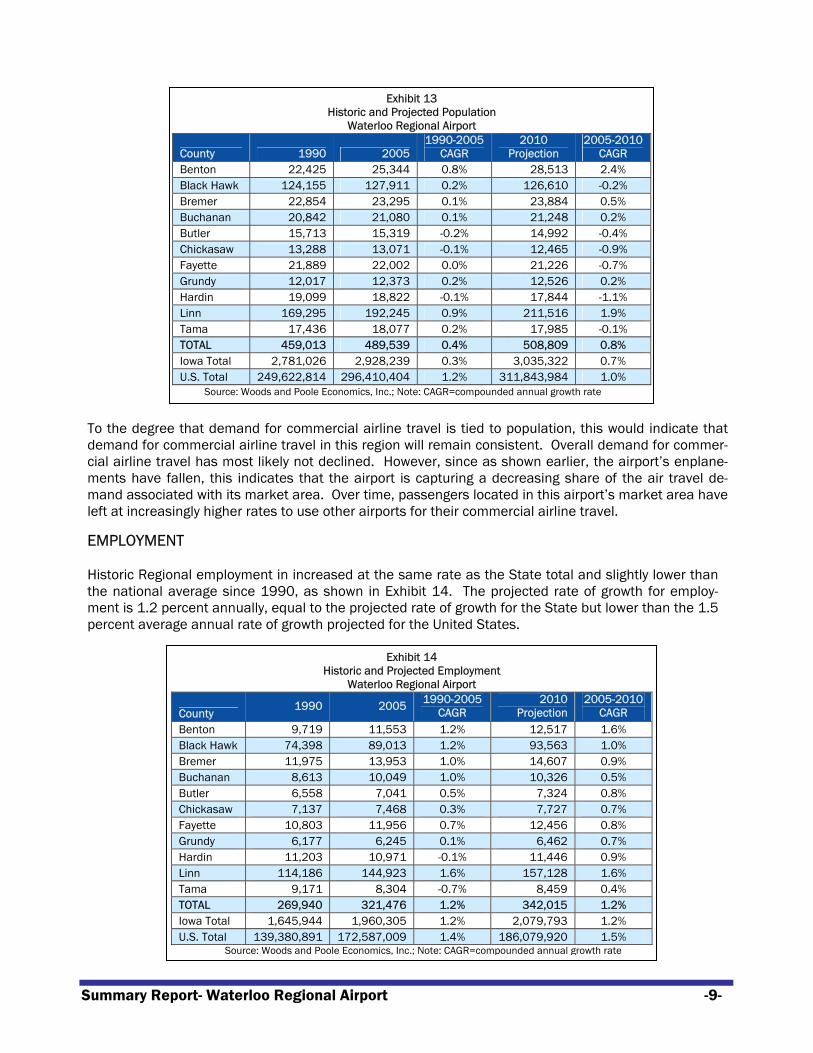
This analysis includes a review of factors most likely to influence demand for commercial airline travel. The S.W.O.T. analysis provides background information on the region from which the airport attracts customers. Unique factors which characterize the airport or the region were also gathered as part of the S.W.O.T. Reviewing such factors helps to set realistic expectations for the airport in terms of its ability to maintain or improve its commercial airline service. POPULATION As shown in Exhibit 13, in the fifteen year period from 1990 to 2005, regional population grew slightly, increasing by 0.4 percent annually. Between 2005 to 2010, regional population is expected to in-crease at an average annual rate of 0.8 percent. This is higher than the projected rate of population growth in Iowa (0.7 percent annually), but lower than the national growth rate (1.0 percent annually).
Exhibit 12 Market Area Demand Estimates
Waterloo Regional Airport
Summary Report- Waterloo Regional Airport -9-
To the degree that demand for commercial airline travel is tied to population, this would indicate that demand for commercial airline travel in this region will remain consistent. Overall demand for commer-cial airline travel has most likely not declined. However, since as shown earlier, the airport’s enplane-ments have fallen, this indicates that the airport is capturing a decreasing share of the air travel de-mand associated with its market area. Over time, passengers located in this airport’s market area have left at increasingly higher rates to use other airports for their commercial airline travel.
EMPLOYMENT Historic Regional employment in increased at the same rate as the State total and slightly lower than the national average since 1990, as shown in Exhibit 14. The projected rate of growth for employ-ment is 1.2 percent annually, equal to the projected rate of growth for the State but lower than the 1.5 percent average annual rate of growth projected for the United States.
Exhibit 13 Historic and Projected Population
Waterloo Regional Airport
County 1990 2005 1990-2005
CAGR 2010
Projection 2005-2010
CAGR Benton 22,425 25,344 0.8% 28,513 2.4% Black Hawk 124,155 127,911 0.2% 126,610 -0.2% Bremer 22,854 23,295 0.1% 23,884 0.5% Buchanan 20,842 21,080 0.1% 21,248 0.2% Butler 15,713 15,319 -0.2% 14,992 -0.4% Chickasaw 13,288 13,071 -0.1% 12,465 -0.9% Fayette 21,889 22,002 0.0% 21,226 -0.7% Grundy 12,017 12,373 0.2% 12,526 0.2% Hardin 19,099 18,822 -0.1% 17,844 -1.1% Linn 169,295 192,245 0.9% 211,516 1.9% Tama 17,436 18,077 0.2% 17,985 -0.1% TOTAL 459,013 489,539 0.4% 508,809 0.8% Iowa Total 2,781,026 2,928,239 0.3% 3,035,322 0.7% U.S. Total 249,622,814 296,410,404 1.2% 311,843,984 1.0%
Source: Woods and Poole Economics, Inc.; Note: CAGR=compounded annual growth rate
Exhibit 14 Historic and Projected Employment
Waterloo Regional Airport
County 1990 2005 1990-2005
CAGR 2010
Projection 2005-2010
CAGR Benton 9,719 11,553 1.2% 12,517 1.6% Black Hawk 74,398 89,013 1.2% 93,563 1.0% Bremer 11,975 13,953 1.0% 14,607 0.9% Buchanan 8,613 10,049 1.0% 10,326 0.5% Butler 6,558 7,041 0.5% 7,324 0.8% Chickasaw 7,137 7,468 0.3% 7,727 0.7% Fayette 10,803 11,956 0.7% 12,456 0.8% Grundy 6,177 6,245 0.1% 6,462 0.7% Hardin 11,203 10,971 -0.1% 11,446 0.9% Linn 114,186 144,923 1.6% 157,128 1.6% Tama 9,171 8,304 -0.7% 8,459 0.4% TOTAL 269,940 321,476 1.2% 342,015 1.2% Iowa Total 1,645,944 1,960,305 1.2% 2,079,793 1.2% U.S. Total 139,380,891 172,587,009 1.4% 186,079,920 1.5% Source: Woods and Poole Economics, Inc.; Note: CAGR=compounded annual growth rate

Summary Report- Waterloo Regional Airport -10-
Many employers in the services and manufacturing sectors tend to have above average use of com-mercial airline service. Often times, retail trade and state/local government have a lower propensity to use commercial airline service. As shown in Exhibit 15, John Deere is the largest employer in the region; this company also ranks 98th on the Fortune 500 list. Other manufacturing companies located in the regjon include Tyson Fresh Meats, Omega Cabinet, and Bertch Cabinet Manufacturing. Two medical facilities in the region (Cove-nant Medical Center and Allen Memorial Hospital) employ nearly 4,700 people combined. Higher education facilities employ an additional 2,500.
Exhibit 16 presents total employment by sector in the region. The service sector is the largest em-ployment sector with 30 percent of total employment. The four largest employment sectors in the region are services, retail trade, manufacturing, and State and local government. With 13 percent of total regional employment, the manufacturing sector employs a higher percentage of workers in the region than at the State or national level.
Exhibit 15 Top Employers in Region Waterloo Regional Airport
Company Name Sector Employees Company Name Sector Employees John Deere Waterloo Ops Manufacturing 4,700 Bertch Cabinet Manufacturing 1,288 Covenant Medical Center Health Services 2,900 Hawkeye Community College Educ. Services 774 Tyson Fresh Meats Manufacturing 2,700 GMAC Mortgage FIRE 734 University of Northern Iowa Educ. Services 1,781 Area 267 Education Agency Educ. Services 650 Allen Memorial Hospital Health Services 1,767 CBE Group FIRE 606 Omega Cabinet Manufacturing 1,350 Target Regional Dist. Center Distrib. Center 572
Source: Greater Cedar Valley Alliance
Exhibit 16 Employment by Sector
Waterloo Regional Airport
Percent of Total Employment
Employment Sector Market Area Iowa United States
Services 29.5% 29.0% 33.5% Retail Trade 16.2% 16.7% 16.4% Manufacturing 13.0% 12.1% 9.5% State and Local Government 10.7% 11.8% 11.2% Finance, Insurance, and Real Estate 7.1% 7.5% 8.3% Transport, Communications, and Public Utilities 6.6% 4.8% 4.7% Construction 5.0% 5.0% 5.6% Wholesale Trade 4.4% 4.4% 4.3% Farm Employment 4.3% 5.4% 1.8% Agricultural Services, Other 1.5% 1.5% 1.4% Federal Civilian Government 0.7% 1.0% 1.6% Federal Military Government 0.7% 0.7% 1.3% Mining 0.1% 0.1% 0.4% Total 100.0% 100.0% 100.0%
Source: Woods and Poole Economics, Inc
Summary Report- Waterloo Regional Airport -11-
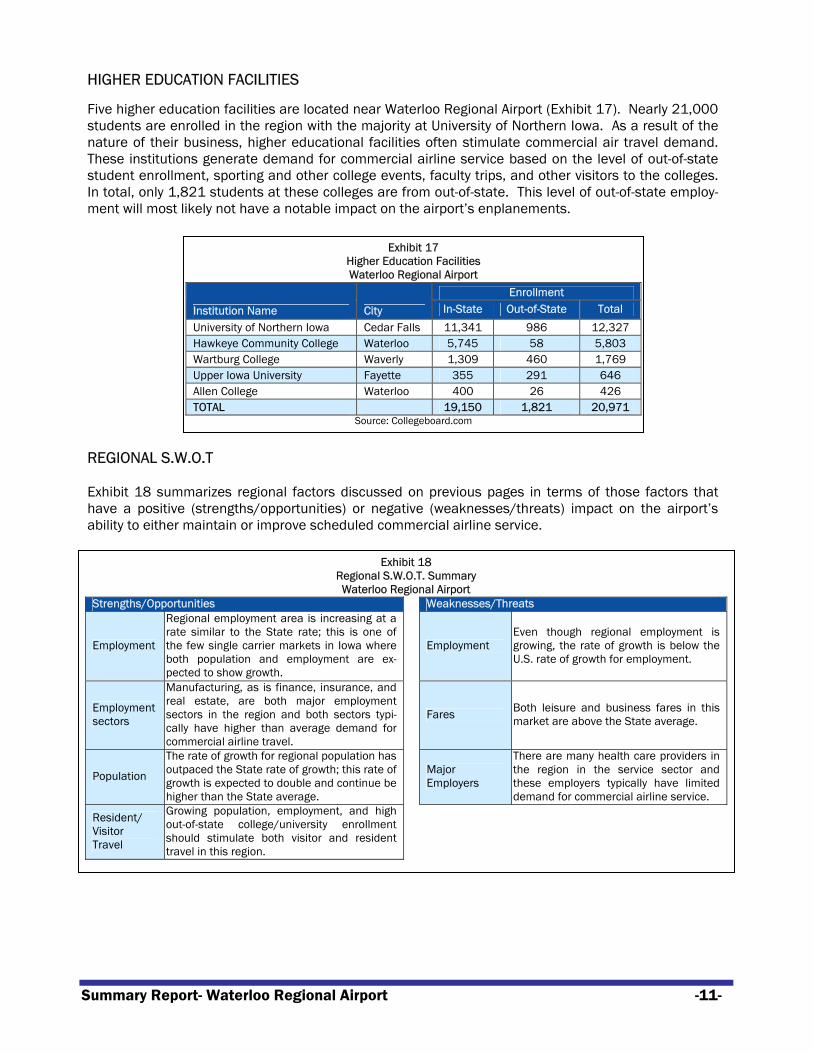
HIGHER EDUCATION FACILITIES Five higher education facilities are located near Waterloo Regional Airport (Exhibit 17). Nearly 21,000 students are enrolled in the region with the majority at University of Northern Iowa. As a result of the nature of their business, higher educational facilities often stimulate commercial air travel demand. These institutions generate demand for commercial airline service based on the level of out-of-state student enrollment, sporting and other college events, faculty trips, and other visitors to the colleges. In total, only 1,821 students at these colleges are from out-of-state. This level of out-of-state employ-ment will most likely not have a notable impact on the airport’s enplanements.
REGIONAL S.W.O.T Exhibit 18 summarizes regional factors discussed on previous pages in terms of those factors that have a positive (strengths/opportunities) or negative (weaknesses/threats) impact on the airport’s ability to either maintain or improve scheduled commercial airline service.
Exhibit 18 Regional S.W.O.T. Summary Waterloo Regional Airport
Strengths/Opportunities Weaknesses/Threats
Employment
Regional employment area is increasing at a rate similar to the State rate; this is one of the few single carrier markets in Iowa where both population and employment are ex-pected to show growth.
Employment Even though regional employment is growing, the rate of growth is below the U.S. rate of growth for employment.
Employment sectors
Manufacturing, as is finance, insurance, and real estate, are both major employment sectors in the region and both sectors typi-cally have higher than average demand for commercial airline travel.
Fares Both leisure and business fares in this market are above the State average.
Population
The rate of growth for regional population has outpaced the State rate of growth; this rate of growth is expected to double and continue be higher than the State average.
Major Employers
There are many health care providers in the region in the service sector and these employers typically have limited demand for commercial airline service.
Resident/ Visitor Travel
Growing population, employment, and high out-of-state college/university enrollment should stimulate both visitor and resident travel in this region.
Exhibit 17 Higher Education Facilities Waterloo Regional Airport
Enrollment
Institution Name City In-State Out-of-State Total
University of Northern Iowa Cedar Falls 11,341 986 12,327 Hawkeye Community College Waterloo 5,745 58 5,803 Wartburg College Waverly 1,309 460 1,769 Upper Iowa University Fayette 355 291 646 Allen College Waterloo 400 26 426 TOTAL 19,150 1,821 20,971
Source: Collegeboard.com

Summary Report- Waterloo Regional Airport -12-
AIRPORT-SPECIFIC S.W.O.T In addition to the factors summarized in the Exhibit 18, there are more specific strengths, opportuni-ties, weaknesses, and threats for the airport to consider. These additional factors are ones that have been identified during the preparation of the study. Exhibit 19 summarizes these additional factors.
Exhibit 19
Airport-Specific S.W.O.T. Factors Waterloo Regional Airport
Strengths • The airport has 4 daily roundtrips: 3 are on the 30-seat Saab 340 aircraft on Mesaba and one flight is on Pin-
nacle who uses a 50-seat regional jet. • Northwest has been cooperative in keeping the fares in Waterloo similar to or the same as their fare in Cedar
Rapids; this helps reduce passenger diversion. The airport has a good working relationship with their incum-bent carrier. The airport communicates frequently with Northwest concerning flight cancellations and/or de-lays.
• Northwest has good record for reliability and on-time service at the airport. • The airport is conveniently located to the homes and businesses of its primary users/market area. • The airport has excellent ground access. • The airport’s rates and charges are competitive. • The airport is financially self-sufficient and is able to use its PFCs and grant money for capital improvement pro-
jects. • The airport has strong backing by City; the City passed a $1 million revenue bond that enabled Northwest to put
a regional jet in the market. The travel bank that the bond supported was well utilized by area businesses; the City only had to spend $350,000 of the $1 million allocated for the travel bank. Once the support was gone, the flight was profitable and stayed in the market.
• The airport/community successfully competed for and won a Federal grant from the Small Community Air Ser-vice Program. Grant was for $550,000; this grant has not been completely expended. Of the total grant, $300,000 was for marketing, $100,000 was for an air service consultant, and $150,000 was to help offset air-line operating costs. Waterloo did not immediately approach Northwest concerning service improvements be-cause at the time, the carrier was in bankruptcy.
• There is strong local interest from many sectors pertaining to air service retention and growth; the airport has had a public/private air service task force of about 15 people for several years. The task force includes local elected officials, economic development concerns, businesses, tourism and travel agents.
• The airport has excellent facilities which include a recently remodeled passenger terminal building and a cov-ered loading bridge.
• The airport has an 8,400-foot runway and an air traffic control tower.
Weaknesses • Current service is limited to one carrier to one hub; the flight frequency is an issue with the airport’s existing
service. • According to this study, 83% of all annual commercial airline travel demand associated with this airport’s mar-
ket area is now leaving the local market area to begin trips from other. • The airport has significant competition for passengers in its market area from other airports including Cedar
Rapids, Des Moines, Moline, and Minneapolis. • Local travel agents are sometimes hard pressed to sell the airport’s service to business travelers because of
the lack of flight frequencies. • Signage to the airport could be improved.
Opportunities • Airport believes that they could attract a higher percentage of its market area and that it can reach isolated
markets beyond its current 10-county market area. • Northwest has indicated they may go back to five departures from the airport, up from the current four daily
roundtrips. • The fact that there is only one carrier allows the airport to put all of their support behind this one carrier. • A new local air service committee being formed; this committee will emphasize economic ties to commercial
airline service.

Summary Report- Waterloo Regional Airport -13-
• The airport may go to an authority type of governance. This would help to get “buy in and support” from a larger and more regional market area and could provide additional revenue streams for the airport.
• John Deere is expanding in the market area; this is good for local economy and may help to generate more de-mand for commercial airline travel.
• The airport still has a Small Community Grant that can be used for service retention and attraction. The airport has an opportunity to pursue an additional grant from this program in the future.
Threats • Lack of stability in the airline industry could have an impact on the market’s air service. • Pilot shortages could impact regional carriers • Changes in Federal or State funding programs could negatively impact the airport’s access to funding. • The airport has overlapping market areas with each of the following: Cedar Rapids (60 minutes away); Des
Moines (2 hours away); and Moline (2½ hours away). • Moline is aggressively marketing in the Waterloo market area. • New service, especially low cost carrier service, at other airports could increase passenger diversion from the
airport’s market area.
Within the U.S. commercial airline system, roughly 70 commercial airports serve almost 90 percent of all commercial airline enplanements. This leaves hundreds of commercial airports, including Waterloo Regional Airport, serving the remaining 10 percent of U.S. enplanements. These airports must com-pete for a limited number of new service opportunities that are available. Years of financial difficulties have made carriers risk adverse and has resulted in far fewer opportunities for new or improved airline service. In this environment, the strengths, weaknesses, opportunities and threats for the airport and its market area, summarized in this section, provide a backdrop for establishing actions which are matched to the particular circumstances of Waterloo Regional Airport.
Options for Sustaining and Improving Air Service
The final section of this summary discusses actions that can be considered by Waterloo Regional Airport as part of follow-on efforts to maintain or improve its airline service.
AIRPORT USE Waterloo Regional Airport draws its passengers from a multi-county market area. This study estimates that this market area’s annual demand for commercial airline travel currently equates to approxi-mately 201,400 annual or 552 outbound passengers per day. This demand estimate includes travel-ers from 10 Iowa counties. The local airport served 16.3 percent of its total market area demand, 32,880 annual enplaning passengers, or 90 passengers per day. An approximation of the individual airports used by the 201,400 travelers associated with the market area for Waterloo Regional Airport is provided in Exhibit 20.

Summary Report- Waterloo Regional Airport -14-
Ninety percent of the demand in the airport’s market area used three airports for their commercial airline travel. Waterloo Regional Airport retained 16.3 percent of the estimated annual commercial airline travel demand associated with the 10-county market area. While the Waterloo market area covers 10 counties, 73 percent of Waterloo Regional Airport passengers are associated with Black Hawk County. Waterloo Regional airport is located in Black Hawk County. Waterloo retained 23 percent of all commercial airline travel demand associated with Black Hawk County and 10 percent or less of the demand associated with each of the other nine counties in the market area. Cedar Rapids captured 62.7 percent of all demand from the 10-county market area, including 67 percent of the commercial airline travel demand associated with Black Hawk County. Des Moines attracted 10.8 percent of the market area’s demand, even though the drive time to this alternate airport is notably longer.
FACTORS AFFECTING DIVERSION
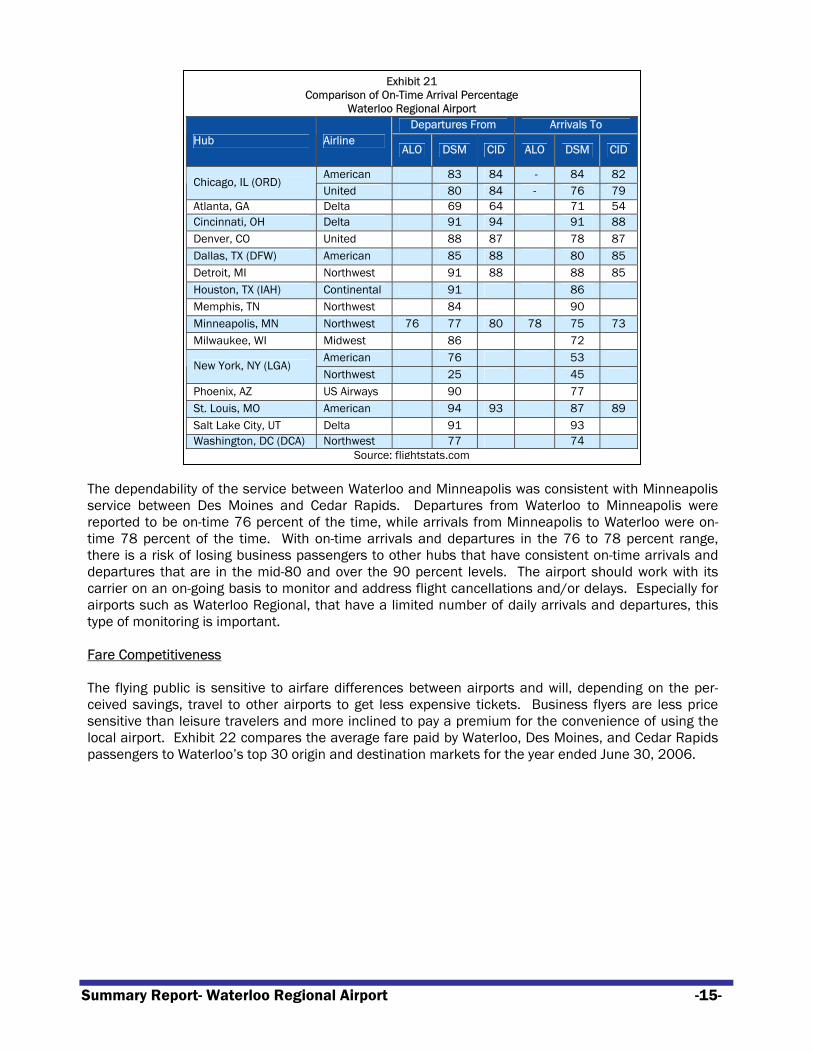
Market area demand retention rates can be attributed to a number of factors. Service reliability, fare competitiveness, flight schedule, adequacy of capacity (number of seats) to existing markets, and number of nonstop destinations are frequently cited problems which will be examined as they pertain to Waterloo Regional Airport. Service Reliability Reliability can be a factor in an air traveler’s decision to use an alternate airport rather than the local airport. Differences in reliability usually, however, are not sufficient to motivate an air traveler to elect to drive one to two hours, as would be the case with passengers from Waterloo’s market area, to another commercial airport. Exhibit 21 examines on-time arrivals at primary hubs that have service from Waterloo, Des Moines and Cedar Rapids and the on-time arrivals from these hubs for August and September 2007.
Exhibit 20 Market Area Demand Distribution
Waterloo Regional Airport Iowa-Generated Enplanements by County
Airport Black Hawk Bremer Buchanan Delaware Floyd Grundy Hardin Other
Total market area en-
planements
Airport %
Waterloo 24,010 1,960 1,740 500 900 1,020 990 1,760 32,880 16.3% Cedar Rapids 69,950 15,680 14,790 6,930 1,800 7,140 1,490 8,520 126,310 62.7%
Des Moines 10,440 0 0 0 0 2,040 7,430 1,770 21,680 10.8%
MSP 0 1,960 0 0 5,400 0 0 8,360 15,720 7.8%
Other 0 0 870 2,480 900 0 0 590 4,840 2.4%
Total 104,400 19,600 17,400 9,900 9,000 10,200 9,900 21,000 201,400 100.0% Waterloo
% 23.0% 10.0% 10.0% 5.0% 10.0% 10.0% 10.0% 8.4% 16.3% N/A
Source: Wilbur Smith Associates
Summary Report- Waterloo Regional Airport -15-
The dependability of the service between Waterloo and Minneapolis was consistent with Minneapolis service between Des Moines and Cedar Rapids. Departures from Waterloo to Minneapolis were reported to be on-time 76 percent of the time, while arrivals from Minneapolis to Waterloo were on-time 78 percent of the time. With on-time arrivals and departures in the 76 to 78 percent range, there is a risk of losing business passengers to other hubs that have consistent on-time arrivals and departures that are in the mid-80 and over the 90 percent levels. The airport should work with its carrier on an on-going basis to monitor and address flight cancellations and/or delays. Especially for airports such as Waterloo Regional, that have a limited number of daily arrivals and departures, this type of monitoring is important. Fare Competitiveness The flying public is sensitive to airfare differences between airports and will, depending on the per-ceived savings, travel to other airports to get less expensive tickets. Business flyers are less price sensitive than leisure travelers and more inclined to pay a premium for the convenience of using the local airport. Exhibit 22 compares the average fare paid by Waterloo, Des Moines, and Cedar Rapids passengers to Waterloo’s top 30 origin and destination markets for the year ended June 30, 2006.
Exhibit 21 Comparison of On-Time Arrival Percentage
Waterloo Regional Airport Departures From Arrivals To
Hub Airline ALO DSM CID ALO DSM CID
American 83 84 - 84 82 Chicago, IL (ORD)
United 80 84 - 76 79 Atlanta, GA Delta 69 64 71 54 Cincinnati, OH Delta 91 94 91 88 Denver, CO United 88 87 78 87 Dallas, TX (DFW) American 85 88 80 85 Detroit, MI Northwest 91 88 88 85 Houston, TX (IAH) Continental 91 86 Memphis, TN Northwest 84 90 Minneapolis, MN Northwest 76 77 80 78 75 73 Milwaukee, WI Midwest 86 72
American 76 53 New York, NY (LGA)
Northwest 25 45 Phoenix, AZ US Airways 90 77 St. Louis, MO American 94 93 87 89 Salt Lake City, UT Delta 91 93 Washington, DC (DCA) Northwest 77 74
Source: flightstats.com
Summary Report- Waterloo Regional Airport -16-
Waterloo Regional Airport average one-way fares were lower than Des Moines average fares in 11 of the top 30 O&D destinations for Waterloo. Fares were also lower than the Cedar Rapids’ average fares in nine of these same markets plus two others, for lower fares in a total of 11 out of the 30 destinations. While average fares provide a good indicator of overall market conditions, greater fare differentials for selected travel itineraries sometimes exist. Larger than average discrepancies in airfares are almost certainly a key reason for passenger diversion to airports other ariports. Reasons for this can include the presence of low cost carriers at competitive airports, availability of seats, more competition, and the availability of non-stop flights which have inherently lower operating costs than connecting flights. Passengers surveyed at Waterloo Regional Airport indicated that on average they would drive 82 additional minutes to an alternate airport to save $150 on a round-trip airfare.
Exhibit 22 Comparison of Average One-Way Airfares
Waterloo Regional Airport Origin airport $ Difference
Rank Market Waterloo Des
Moines Cedar Rapids
ALO-DSM
ALO-CID
1 Minneapolis, MN $131 $227 $200 -$96 -$69 2 Phoenix, AZ $221 $177 $196 $45 $25 3 Washington, DC $161 $154 $156 $7 $5 4 Los Angeles, CA $218 $196 $205 $23 $14 5 New York, NY (LGA) $150 $179 $161 -$29 -$11 6 San Diego, CA $193 $209 $206 -$17 -$14 7 Atlanta, GA $213 $207 $181 $6 $32 8 Seattle, WA $228 $216 $233 $12 -$4 9 Houston, TX (IAH) $206 $223 $190 -$17 $16
10 San Francisco, CA $201 $206 $233 -$5 -$32 11 Las Vegas, NV $214 $134 $130 $80 $84 12 Orlando, FL $188 $140 $170 $48 $19 13 Philadelphia, PA $162 $184 $172 -$22 -$10 14 Tampa, FL $166 $152 $180 $15 -$13 15 Detroit, MI $268 $152 $132 $116 $136 16 Newark, NJ $204 $216 $187 -$12 $16 17 Raleigh/Durham, NC $146 $218 $150 -$73 -$5 18 Dallas, TX (DFW) $240 $200 $198 $39 $42 19 Portland, OR $229 $224 $218 $5 $11 20 Boston, MA $180 $175 $175 $6 $6 21 Denver, CO $229 $189 $176 $40 $54 22 Orange County, CA $227 $230 $268 -$3 -$42 23 Baltimore, MD $158 $162 $165 -$4 -$7 24 Indianapolis, IN $167 $159 $149 $8 $18 25 Sacramento, CA $266 $249 $243 $17 $23 26 Charlotte, NC $198 $185 $176 $13 $23 27 San Antonio, TX $178 $169 $173 $9 $5 28 Cleveland, OH $203 $199 $154 $4 $49 29 Nashville, TN $154 $154 $147 $0 $7 30 San Jose, CA $185 $217 $252 -$33 -$67
All markets $201 $186 $185 $15 $16 Source: Data Base Products, Inc. year ended 6/30/06
Note: Domestic, one-way, does not include taxes, PFC, or non-fare passengers

Summary Report- Waterloo Regional Airport -17-
Nonstop Service Waterloo average fares were $20 or higher than the average fares from Des Moines in seven markets and $20 or higher than the average fares from nine markets out of Cedar Rapids. Several of these same markets had nonstop service out of Des Moines and Cedar Rapids during this period. As shown in Exhibit 23, these higher fare differences were frequently to destinations where nonstop service is available at the other two airports.
Average fares from Waterloo to several markets that only have nonstop service from Cedar Rapids are considerably higher. With a one hour drive to Cedar Rapids, these fare differences are considered significant, particularly for leisure passengers. Even with the additional hour drive for passengers from the Waterloo Regional Airport market area to Des Moines, the fare differentials between the two airports are high enough to create diversion. The airport should work with Northwest to try to achieve equality in the fares that the carrier provides from Waterloo, Cedar Rapids and Des Moines. Flight Schedule Waterloo Regional Airport’s service is provided by Pinnacle and Mesaba, both of these carriers are regional code sharing partners for Northwest Airlines. The September 2007 schedule for Waterloo to Min-neapolis flights is shown in Exhibit 24. The airport’s current schedule includes one trip with 50 seat re-gional jet equipment and another three trips with Saab 340 turboprop equipment with 34 seats per depar-ture. With weekend frequency reductions, the airport’s current schedule includes 26 flights per week with a total of 980 weekly outbound seats. Flight schedules and frequency of flights impact enplanement levels and passenger diversion to other airports. If schedules are not spread throughout the day, do not provide the desired early departure and late arrival at the origin airport, or provide unsatisfactory connecting opportunities at the hub, travelers will seek other options including alternate airports. Northwest flights from the connecting hub in Minneapolis to Waterloo’s top 30 markets range from two to 15 per day as shown in Exhibit 25.
Exhibit 24 Flight Schedule
Waterloo Regional Airport Waterloo to
Minneapolis/St. Paul Minneapolis/St. Paul
to Waterloo
7:00 AM - 8:03 AM 9:20 AM - 10:39 AM 11:03 AM - 12:17 PM 1:20 PM - 2:39 PM
3:04 PM - 4:16 PM 5:15 PM - 6:32 PM 7:05 PM - 8:16 PM 10:23 PM – 11:18 PM
Source: APGDat – September 2007
Exhibit 23 Comparison of Average Airfares to Nonstop Markets
Waterloo Regional Airport Origin airport $ Difference
Rank Market Waterloo Des
Moines Cedar Rapids
ALO-DSM
ALO-CID
1 Minneapolis, MN $131 $227 $200 -$96 -$69 2 Phoenix, AZ $221 $177 * $45 n/a 3 Washington, DC (DCA) $161 $154 * $7 n/a 7 Atlanta, GA $213 $207 * $6 n/a 9 Houston, TX (IAH) $206 $223 * -$17 n/a
11 Las Vegas, NV $214 $134 $130 $80 $84 15 Detroit, MI $268 $152 $132 $116 $136 18 Dallas, TX (DFW) $240 $200 $198 $39 $42 21 Denver, CO $229 $189 $176 $40 $54
Source: Data Base Products, Inc. year ended 6/30/06 Notes: * Did not have nonstop service during this period; Domestic, one-way, does not include taxes, PFC,
or non-fare passengers

Summary Report- Waterloo Regional Airport -18-
The Waterloo schedule is reasonably well-timed and is most likely not a cause of significant passenger diversion. Most travelers, however, given the option, would prefer a higher frequency of flights. Flight frequency rather than the actual schedule for existing flights is most likely more of a contributing factor to passenger diversion to other airports. ADEQUACY OF CAPACITY IN EXISTING MARKETS At present, Waterloo Regional Airport’s nonstop service is limited to Northwest Airlines providing service to their connecting hub in Minneapolis/St. Paul. Seats in the market peaked in 2004, and this higher level of seats resulted in the lowest load factor of the four year period. Seats were reduced in 2005 and further in 2006 as the industry tightened capacity in many domestic markets in an effort to increase load factors and profitability. The Waterloo load factor increased to 63.7 percent in 2006 as seats were reduced to levels comparable to 2003 when the load factor was 63.4 percent. Exhibit 26 outlines Waterloo–Minneapolis service performance for the 2003 through 2006 period.
Currently the rule of thumb in the airline industry is that a load factor of 70 percent or better is needed to cover regional jet costs. Waterloo Regional Airport load factors will need to increase to levels approaching 70 percent to convince Northwest Airlines that additional capacity is needed. Currently, the airport’s service is provided by a mix of regional jet and turboprop aircraft. In order to upgrade service to all regional jets, higher load factors for existing service would be needed. Historically, enplanements did increase in 2004 and 2005 as capacity increased but the load factors were not sufficient to retain the additional capacity.
Exhibit 25 Northwest Airlines’ Minneapolis/St. Paul Daily Connecting Flights
Waterloo Regional Airport Rank Market Trips Rank Market Trips Rank Market Trips
1 Minneapolis, MN N/A 11 Las Vegas, NV 5 21 Denver, CO 6 2 Phoenix, AZ 5 12 Orlando, FL 3 22 Orange County, CA 3 3 Washington, DC (DCA) 6 13 Philadelphia, PA 5 23 Baltimore, MD 3 4 Los Angeles, CA 6 14 Tampa, FL 2 24 Indianapolis, IN 5 5 New York, NY (LGA) 7 15 Detroit, MI 15 25 Sacramento, CA 2 6 San Diego, CA 3 16 Newark, NJ 5 26 Charlotte, NC 3 7 Atlanta, GA 5 17 Raleigh/Durham, NC 2 27 San Antonio, TX 2 8 Seattle, WA 6 18 Dallas, TX (DFW) 6 28 Cleveland, OH 5 9 Houston, TX (IAH) 4 19 Portland, OR 4 29 Nashville, TN 3
10 San Francisco, CA 5 20 Boston, MA 5 30 San Jose, CA 2 Source: APGDat, September 2007
Exhibit 26 Performance of Service to Minneapolis/St. Paul
Waterloo Regional Airport Outbound + Inbound 2003 2004 2005 2006
Trips 2,820 3,893 3,496 2,703
Total Passengers 65,014 81,330 74,118 64,804
Seats 102,524 146,222 127,446 101,740
Load factor 63.4 55.6 58.2 63.7
Passengers/trip 23.1 20.9 21.2 24.0
Seats/trip 36.4 37.6 36.5 37.6
Seats/day each way 140.4 200.3 174.6 139.4 Source: Data Base Products, Inc.
Summary Report- Waterloo Regional Airport -19-
With four trips a day, the current service to Northwest’s connecting hub in Minneapolis provides travelers with good opportunities to reach Waterloo Regional’s top destinations. As mentioned, in today’s environment, it will take sustained load factors of at least 70 to 75 percent for Northwest to again consider additional frequencies to its hub in Minneapolis. An additional 15 passengers per day would have increased the 2006 load factor to 75 percent. Only 60 additional passengers per day would be required to produce a 75 percent load factor if the airport’s scheduled flights (four per day) were all upgraded to regional jets. If Northwest were to increase to five regional jet departures per day, a demand level of 188 daily outbound passengers would be needed to support a 75 percent load factor. Both existing outbound daily passengers (90) and all estimated potential daily outbound passengers for the airport (140) would most likely need to be “committed” to achieve a 75 percent load factor on five daily regional jets. At this level of service, additional demand may not be available to support other service options. POTENTIAL NEW ENPLANEMENTS
The analysis showed that The Eastern Iowa Airport in Cedar Rapids captures about 63 percent of the estimated 201,400 annual or 552 daily outbound passengers from the 10-county market area, while Waterloo Regional Airport captures 16 percent or 90 passengers per day. The one-hour drive to Cedar Rapids provides access to over 30 daily nonstop jet departures to seven major hubs and multiple leisure destinations. Cedar Rapids dependability was excellent for the survey period and fares were significantly lower in some key markets. Cedar Rapids also has some low cost carrier service. For the purpose of this study, potential new enplanements are estimated based on the airport’s ability to recapture existing demand that is currently using alternative airports. The analysis does not include “stimulated” demand or trips that occur due to lower airfares, a successful marketing campaign, etc. that would not otherwise take place if the service situation remains status quo. While there are a number of airports that are used by passengers associated with the airport’s market area, the airport and its market area has shown that there is support for the local airport and service. In the past, Northwest performance issues, the lack of nonstop destinations served, and the number of daily service frequencies have contributed to passenger diversion from the airport’s market area. It is reasonable to assume that improving local service could help capture an additional 25 percent of the airport’s total market demand. This additional capture would produce up to 140 additional daily or 51,100 additional annual outbound passengers for a total of 83,980 enplanements. It appears there is sufficient demand to upgrade Minneapolis service and add two daily departures to another hub. Possible new hubs for consideration are discussed below. Tactics for obtaining new service and recapturing demand is presented in Chapter Seven of the Iowa Air Service Study’s techni-cal report. The potential recapture of demand equates not only to improvements in service at the airport, but also to additional airport revenue and jobs. Based on this study, if the airport was successful in recapturing this demand, it would mean an estimated $1 million in additional annual revenue for the airport. POTENTIAL NEW NONSTOP MARKETS Chicago-O’Hare International Airport Historically, both United and American airlines operated flights from Waterloo Regional to Chicago O’Hare. Most recently, this service was provided by Great Lakes operating under a code sharing agreement with United Airlines. This service was discontinued in February 2003. Data on the per-
Summary Report- Waterloo Regional Airport -20-
formance of this past service is only available for its final five months of operation. During the last five months of service, the flights to Chicago averaged only 7.3 passengers per flight for a 38.4 percent load factor. Over time, both United and American have eliminated turboprop service to Chicago O’Hare. Future turboprop access to this hub is improbable due to airport and air traffic congestion. Waterloo Regional would have to have sufficient demand to support regional jet flights to this hub for it to present a reasonable opportunity for new service. Given the market’s inability to garner sufficient demand to support flights on turboprop aircraft to Chicago, attracting demand levels sufficient to support regional jet flights would be challenging since service from the Chicago hub is largely duplica-tive of current Minneapolis service. Two regional 50-seat jets would require over 70 daily outbound passengers to return a profit for the carrier. With the similarities in service between Minneapolis and Chicago, it could be more challenging to attract the needed level of additional potential daily passen-ger demand. Lambert-St. Louis International Airport Historically, Waterloo Regional had service to the TWA connecting hub in St. Louis. When American purchased TWA, they retained Waterloo flights for a short time, but discontinued service in Septem-ber, 2002. Within the estimate of 140 additional outbound daily passengers for the airport, there could be sufficient demand to support three or four daily flights on 30+ seat aircraft to St. Louis, achieving a load factor in the mid-70 percent range for a carrier. With the suspension of Regions Air by the FAA in March 2007, American no longer has a regional partner using turboprop aircraft. American Eagle is currently not considering adding service to St. Louis, unless there is a very large local market. Great Lakes Airlines is flying from St. Louis to some of the former Regions Air markets, but this carrier has yet to conclude a codeshare agreement with American. St. Louis service offers limited value to Waterloo without the American Airlines codeshare. The airport should monitor the progress that Great Lakes makes in terms of securing a codeshare agreement with American. If an agreement is secured, additional service to St. Louis may represent an opportunity for the airport in terms of securing new service. Great Lakes is currently serving Burlington, under an EAS agreement, with a 19-seat aircraft. Great Lakes service to Waterloo would not be part of the EAS program. Cincinnati/Northern Kentucky International Airport Regional jet service to the Delta hub would provide excellent connecting service to major business centers in the East. The potential traffic is sufficient to pursue this service; however, Delta has al-ready announced their intentions to further reduce its flights from the Cincinnati hub, and it is unlikely that they would entertain service to Waterloo Regional Airport. Cleveland Hopkins International Airport Continental has outlined plans to grow the Cleveland hub; however, their current plans suggest that near term growth will be limited to adding cities currently served from other continental hubs, most notably, Newark. Continental intends to increase service at Cleveland as they decrease service at Newark. As the Cleveland hub develops in future year, it could offer an opportunity for Waterloo, but this opportunity would most likely be several years away. Denver International Airport United Airlines or Frontier Airlines service to Denver would provide excellent routings for the airport to the southwest and west. Frontier does not offer as many connecting destinations as United does from the Denver hub, but it is likely that the lower fares offered by Frontier would help stimulate market

Summary Report- Waterloo Regional Airport -21-
demand, helping to the airport to capture a larger percentage of its estimated demand potential. Also, Frontier does not serve Cedar Rapids either, so this service would help differentiate them from their largest alternate airport. Frontier would use a 70-seat regional jet to serve the market, while United could use a 50-seat regional jet aircraft. In either case there appears to be sufficient potential de-mand to reach the 70 percent load factor required that would be required to support either two flights by Frontier on 70-seat regional jet aircraft or two flights on United using 50-seat regional jets. To support two daily flights on 50 seat regional jets at a reasonable load factor would require daily pas-senger demand in the 70 to 75 outbound passenger range. To support two daily flights on 70-seat regional jets, outbound daily passengers in the 100 to 105 range would be needed. With a daily total potential demand estimate of 140, most of this demand would need to be interested in using service to Denver in order for the service to be viable for the carrier.
Recommendations for Improving Air Service
Waterloo Regional Airport has relatively good air service. The airport is proactive in its air service development efforts. Many of the recommendations noted in this analysis are already being under-taken by the airport. This analysis is meant to supplement Waterloo Regional Airport’s own air service development efforts. The current four flight schedule to Minneapolis provides good connecting service to Waterloo Regional Airport’s top markets. However, Waterloo Regional retains 23 percent of Black Hawk County market area demand and five to 10 percent of the county demand in the rest of the market area. Average fares are lower to many destinations however, the majority of area passengers drive one hour to Cedar Rapids to initiate travel. With nonstop service to multiple hubs and strong schedule reliability the Cedar Rapids service is attractive. SUMMARY OF POTENTIAL SERVICE IMPROVEMENTS Northwest flights currently operate with load factors in the low to mid sixties out of Waterloo and the first priority is to protect the current schedule by improving load factors to 70 percent. It is estimated that the airport may be able to attract as many as 140 additional enplanements from its market area. This level of demand is theoretically sufficient to upgrade additional flights to regional jets or to rein-state an additional frequency. Northwest will likely consider these improvements if demand increases and as load factors improve. Aside from upgrading to additional regional jets or increasing flight frequency to Minneapolis, the airport has some, although not particularly promising, opportunities for service to new connecting hubs. With turboprop flights to Chicago not being available and with Delta cutting connecting flights from Cincinnati, the airport’s two most promising options may be service to St. Louis (assuming Great Lakes is able to negotiate a codesharing agreement with American) or service to Denver on either United or Frontier. While United has more connecting opportunities from Denver, lower cost Frontier service to Denver would have a greater potential to stimulate market demand. Most of the airport’s additional potential outbound passenger demand would be needed to make either of these new services viable for the carrier. The airport’s first priority should be working for service improvements with its current carrier. Demand for existing service needs to rise so that demand is consistently filling 70 to 75 percent of all available seats. At this point, the airport should approach the carrier for additional flights, presumably on regional jets. Waterloo should also work with Northwest on service reliability (which is generally good) and on fares. There are notable differences in fares from Waterloo, Cedar Rapids and Des Moines. When travelers from the Waterloo Regional Airport market drive to these other airports, they may be

Summary Report- Waterloo Regional Airport -22-
getting on airlines other than Northwest. By maintaining a competitive fare in the Waterloo market, Northwest has the potential to stimulate passenger attraction. PROMOTING AIR SERVICE IN THE COMMUNITY While recognizing that airlines have the final say in setting airfares, determining service enhance-ments, and entering new markets, this section analyzed options the airport may consider when pursu-ing improved air service. Every airport should have a solid air service development program in place that is driven by local community support. The current environment within the airline industry has shifted much of the responsibility of promoting passenger air service to airports and the communities they serve. This includes marketing, promotion, and even the consideration of financial support of local airline service. Detailed descriptions of air service development initiatives that can be considered by the airport can be found in Chapter Seven of this study’s technical report LOCAL AIR SERVICE STRATEGIES As part of a strategy to support their current carrier and to increase the number of passengers using the airport, Waterloo should consider all of the following, assuming these actions have not already been undertaken or completed:
• Engage the community leaders and businesses by creating an air service task force. • Create and implement a tailored formal air service development program drawing on federal and
state funds where available. • Identify the true needs and expectations of the local business community as they relate to com-
mercial airline travel. • Identify fare premium levels acceptable to local business and leisure passengers and monitor
airfares on a quarterly basis. • Educate local businesses and elected officials on the importance of using the current service,
the dynamics of air service, and the difficulties of securing air service improvements in the cur-rent airline operating environment.
• Investigate the potential for local community support programs, including revenue guarantees and other airline incentives, to mitigate risks for carriers who might consider new or improved service for the airport.
• Consider a passenger reward program to attract more demand associated with the market area.
Summary Communities can improve their options and potential for air service improvements by understanding their market, the industry environment and their competition. Support of the business community is a critical component of this effort to sustain and improve air service. The recommendations presented in this air service report represent a current snapshot of opportuni-ties that may exist for Waterloo Regional Airport. Due to the dynamic nature of the industry, new issues or opportunities may arise that have not been explored fully in this study. This study was developed to provide the airport with useful information to support its air service development efforts. The State recognizes the remarkable contribution commercial airports in Iowa make to the economy and it is recommended that they continue to partner with the commercial airports to ensure their future success.