air ventilation assessment for customs headquarters
TRANSCRIPT

Issue No : 1 Issue Date : September 2008 Project No. : 775 AIR VENTILATION ASSESSMENT FOR CUSTOMS HEADQUARTERS BUILDING AT 222 JAVA ROAD, NORTH POINT, HONG KONG Report Prepared by : Allied Environmental Consultants Ltd. COMMERCIAL-IN-CONFIDENCE

Issue No : 1 Issue Date : September 2008 Project No. : 775 AIR VENTILATION ASSESSMENT FOR CUSTOMS HEADQUARTERS BUILDING AT 222 JAVA ROAD, NORTH POINT, HONG KONG Report Prepared by : Allied Environmental Consultants Ltd. COMMERCIAL-IN-CONFIDENCE
Author: Checked: Amy M.Y. Cheng Claudine K. Y. Lee BEng(Hons) HD(Env. Tech) MSc MHKIOA MHKIEIA
Approved:
Grace M.H. Kwok BEng(Hons) LEED AP MHKIEIA MHKIOA MIAIA
MRAPA MISWA This report has been prepared by Allied Environmental Consultants Limited with all reasonable skill, care and diligence within the terms of the Agreement with the client, incorporating our General Terms and Conditions of Business and taking account of the resources devoted to it by agreement with the client. We disclaim any responsibility to the client and others in respect of any matters outside the scope of the above. This report is confidential to the client and we accept no responsibility of whatsoever nature to third parties to whom this report, or any part thereof, is made known. Any such party relies upon the report at their own risk.

Project No : 775
AIR VENTILATION ASSESSMENT FOR CUSTOMS HEADQUARTERS BUILDING AT 222 JAVA ROAD, NORTH POINT, HONG KONG
Issue 1 ________________________________________________________________ AEC D:\Project\775\080814\AVA report_Aug08-r3.doc
TABLE OF CONTENTS
LIST OF TABLES ii
LIST OF DIAGRAMS ii
LIST OF FIGURES ii
LIST OF APPENDICES ii
1. INTRODUCTION 2
1.1 Background 2 1.2 Surrounding Built Environment 2
2. EXPERT EVALUATION FOR AIR VENTILATION ASSESSMENT 3
3. SITE WIND AVAILABILITY DATA 4
4. ASSESSMENT APPROACH & METHODOLOGY 6
5. SUMMARY OF RESULTS AND DISCUSSION 8
5.1 An Overall View of the Wind Performance 8 5.1.1 Site Air Ventilation Assessment 10 5.1.2 Local Air Ventilation Assessment 11 5.2 Key Findings 12
6. CONCLUSIONS 14

Project No : 775
AIR VENTILATION ASSESSMENT FOR CUSTOMS HEADQUARTERS BUILDING AT 222 JAVA ROAD, NORTH POINT, HONG KONG
Issue 1 ________________________________________________________________ AEC D:\Project\775\080814\AVA report_Aug08-r3.doc
LIST OF TABLES
Table 1 Summary of the Most Probable Wind Directions which Exceed 75% of a Year
Table 2 Summary of the Wind Velocity of the 8 Most Probable Wind Directions
Table 3 VRw’ for Baseline Scheme and Preferred Development Scheme Table 4 SVRw’ and LVRw’ in Baseline Scheme and Preferred Scheme Table 5 Average VRw’ in Other Specific Areas
LIST OF DIAGRAMS
Diagram 1 Wind Rose of Grid (26, 23)
LIST OF FIGURES
Figure 1 Site Location Plan Figures 2a-b Layout Plans for Baseline Scheme Figures 3a-b Layout Plans for Preferred Development Scheme Figure 4 Locations of Perimeter Test Points Figure 5 Locations of Overall test Points Figure 6 Locations of Specific Areas
LIST OF APPENDICES
Appendix A Details of CFD modelling setting Appendix B Detailed AVA Results

Project No : 775
AIR VENTILATION ASSESSMENT FOR CUSTOMS HEADQUARTERS BUILDING AT 222 JAVA ROAD, NORTH POINT, HONG KONG
Issue 1 ________________________________________________________________ AEC D:\Project\775\080814\AVA report_Aug08-r3.doc
AIM To conduct an Air Ventilation Assessment (AVA) according to “Technical Guide for Air Ventilation Assessment for Developments in Hong Kong” by using Computational Fluid Dynamics (CFD) modelling to predict the wind environment of the Customs Headquarters Building at 222 Java Road, North Point and determine the effects from the surrounding buildings and topography.

Project No : 775
AIR VENTILATION ASSESSMENT FOR CUSTOMS HEADQUARTERS BUILDING AT 222 JAVA ROAD, NORTH POINT, HONG KONG
Issue 1 ________________________________________________________________ AEC D:\Project\775\080814\AVA report_Aug08-r3.doc
1. INTRODUCTION
Allied Environmental Consultants Limited (AEC) has been appointed to undertake an air ventilation study for the proposed Customs Headquarters Building located at 222 Java Road, North Point, Hong Kong.
1.1 Background
The proposed Customs Headquarters Building is located at the junction of Java Road, Tin Chiu Street and Marble Road, North Point, facing Island Eastern Corridor (IEC) and Victoria Harbour. The proposed Headquarters Tower comprises a 34-storey office complex development with an area of approximately 2,850 m2, and the RCP will be rebuilt at G/F.
The study compares the air ventilation for (I) baseline scheme, which is designed according to Employer’s Requirement; and (II) preferred development scheme which is the current design scheme.
For the baseline scheme, the AVA study was conducted based on the building design scheme consisting of 34-storey office complex development with 3-storey of car parking facilities. The layout plans for baseline scheme as shown in Figure 2a-b.
With the analysis of air ventilation condition using baseline scheme, the preferred scheme with wind design features was formulated. The office of 34-storey high building with 5-storey of car parking facilities, which provides more opening for cross ventilation. The layout plans for preferred development scheme as shown in Figure 3a-b.
In both schemes, the building heights from main roof for the proposed development will be no more than 131.5 mPD.
1.2 Surrounding Built Environment
The subject site is located within an area comprising a mix of both high rise residential apartment buildings and commercial buildings. The topography immediately surrounding the site is generally flat.
According to the site wind availability data provided published by the Hong Kong Planning Department, the dominant wind direction is from the east to northeast, predominantly occurring during the spring time. As the short side of the Headquarters building is facing the prevailing wind direction and buildings in downwind direction is at least 50m away from the subject site, which shall not cause significant impact to the wind environment in the surrounding.
Summer winds are indicated as originating predominantly from the south to south-west. There are only 2 office blocks (K. Wah Building and ICAC Headquarters Building) and Island Eastern Corridor located at the downwind direction with relatively low pedestrian flow. It is anticipated that the impact to wind environment shall be insignificant during the summer periods.

Project No : 775
AIR VENTILATION ASSESSMENT FOR CUSTOMS HEADQUARTERS BUILDING AT 222 JAVA ROAD, NORTH POINT, HONG KONG
Issue 1 ________________________________________________________________ AEC D:\Project\775\080814\AVA report_Aug08-r3.doc
2. EXPERT EVALUATION FOR AIR VENTILATION ASSESSMENT
The subject development is located near Victoria Harbour in North Point, which receives prevailing winds from the ENE direction for around 15-20% of the time of a year. The average wind speed of 7.7915 m/s among the eight wind directions was assessed in this AVA. The general wind flow in this site is from east to northeast, which accounts for at least half of the time of the year.
Based on the Employer’s Requirement, a baseline scheme which was designed with maximum utilization of plot ratio and building height was adopted. The baseline scheme consists of 3-storey of car-park facilities to facilitate natural ventilation.
Improvements to the design and layout of the preferred scheme have seen an addition in the number of storeys of car-park facilities. Whereas the baseline scheme proposed a 34-storey tower block, the preferred scheme has modified the shape of the office tower including 5-storey of car parking facilities to facilitate natural ventilation, which provides more opening for cross ventilation.
The addition in the number of storeys of car-park facilities increases the wind permeability of the building and allow cross ventilation to the local environment.
The effect on wind environment in the surrounding areas of the subject development shall be elaborated by comparing the wind velocity ratio simulated for the baseline scheme, and following possible improvements in design and building layout based on the baseline scheme, and a comparison to the preferred development scheme.

Project No : 775
AIR VENTILATION ASSESSMENT FOR CUSTOMS HEADQUARTERS BUILDING AT 222 JAVA ROAD, NORTH POINT, HONG KONG
Issue 1 ________________________________________________________________ AEC D:\Project\775\080814\AVA report_Aug08-r3.doc
3. SITE WIND AVAILABILITY DATA
The assumption of wind data refers to the “Site Wind Availability Data” published by the Planning Department [1] which is simulated by Fifth-Generation NCAR/ Penn State Mesoscale Model (MM5), as recommended in “Technical Guide for Air Ventilation Assessment for Developments in Hong Kong” [2] published by Housing, Planning and Lands Bureau (HPLB) and Environment, Transport and Works Bureau (ETWB). It indicates wind velocity ranges from 0 to 24m/s from 16 wind directions, predicted at the nearest grid (26, 23) to the site and at 596m above the terrain level. The seven most probable wind directions which exceed 75% of a year at this grid are summarised in Table 1 and the wind velocity was summarised in Table 2. Diagram 1 Wind Rose of Grid (30, 24)
The following eight wind directions which exceed 75% of a year were chosen for modelling as they are indicative of all 4 seasons and represent most prevailing wind directions.

Project No : 775
AIR VENTILATION ASSESSMENT FOR CUSTOMS HEADQUARTERS BUILDING AT 222 JAVA ROAD, NORTH POINT, HONG KONG
Issue 1 ________________________________________________________________ AEC D:\Project\775\080814\AVA report_Aug08-r3.doc
Table 1 Summary of the Most Probable Wind Directions which Exceed 75% of a Year
Prevailing Wind Direction
Degree of Wind Direction Probability
NNE 22.5º 6.9% NE 45º 12.4%
ENE 67.5º 18.2% East 90º 15.5% ESE 112.5º 8.9% SE 135º 5.7%
SSW 202.5º 5.9% SW 225º 5.6%
In this AVA, wind directions from 22.5º, 45º, 67.5º, 90º, 112.5º, 135º, 202.5º and 225º are studied, which has a sum of probability of 79.1% of time in a year. Table 2 Summary of the Wind Velocity of the 8 Most Probable Wind
Directions at 596mPD Velocity infinity (m/s)
NNE NE ENE East ESE SE SSW SW
0 to 1 0.001 0.001 0.001 0.001 0.002 0.001 0.001 0.001 1 to 2 0.003 0.003 0.003 0.001 0.002 0.002 0.002 0.003 2 to 3 0.005 0.005 0.003 0.005 0.004 0.004 0.005 0.003 3 to 4 0.005 0.008 0.008 0.007 0.005 0.006 0.005 0.005 4 to 5 0.005 0.01 0.012 0.01 0.006 0.005 0.005 0.007 5 to 6 0.003 0.009 0.012 0.013 0.01 0.005 0.005 0.008 6 to 7 0.003 0.007 0.013 0.011 0.013 0.008 0.009 0.008 7 to 8 0.004 0.011 0.014 0.014 0.011 0.009 0.005 0.007 8 to 9 0.005 0.008 0.014 0.016 0.012 0.005 0.005 0.005 9 to 10 0.005 0.008 0.013 0.018 0.011 0.004 0.006 0.003 10 to 11 0.006 0.01 0.012 0.02 0.006 0.003 0.004 0.001 11 to 12 0.004 0.009 0.017 0.018 0.003 0.001 0.002 0.001 12 to 13 0.003 0.01 0.018 0.01 0.002 0.001 0.001 0.001 13 to 14 0.003 0.009 0.013 0.004 0.001 0.001 0.001 0.000 14 to 15 0.002 0.005 0.011 0.004 0.000 0.000 0.000 0.000 15 to 16 0.003 0.002 0.005 0.002 0.000 0.000 0.000 0.000 16 to 17 0.002 0.002 0.003 0.001 0.000 0.000 0.000 0.000 17 to 18 0.004 0.001 0.002 0.000 0.000 0.000 0.000 0.000 18 to 19 0.001 0.001 0.001 0.001 0.000 0.000 0.000 0.000 19 to 20 0.002 0.001 0.001 0.000 0.000 0.000 0.000 0.000 20 to 21 0.000 0.001 0.001 0.000 0.001 0.000 0.000 0.000 21 to 22 0.000 0.000 0.001 0.000 0.000 0.000 0.000 0.000 22 to 23 0.000 0.000 0.002 0.000 0.000 0.000 0.000 0.000 23 to 24 0.000 0.000 0.001 0.000 0.000 0.000 0.000 0.000

Project No : 775
AIR VENTILATION ASSESSMENT FOR CUSTOMS HEADQUARTERS BUILDING AT 222 JAVA ROAD, NORTH POINT, HONG KONG
Issue 1 ________________________________________________________________ AEC D:\Project\775\080814\AVA report_Aug08-r3.doc
4. ASSESSMENT APPROACH & METHODOLOGY
Air Ventilation Assessment (AVA) aims to assess the impacts of the proposed building on the pedestrian wind environment. Computational fluid dynamics (CFD) computer simulation model, PHOENICS-VR 2008, has been utilized for the microclimate study. It is a sophisticated modelling method, which takes into account the usual fluid dispersion calculation method under both laminar and turbulence flow simulation. The equations that the CFD model solves are algebraic equations which result from applying the conservation laws of physics to finite volumes of space and time. The related wind environment around the redevelopment was assessed by setting up a scaled model of the redevelopment with surrounding building structures. Moreover, this model has the ability to capture the after-building vortices which takes into account the effect of different roof shapes and ambient building structures, which is important in determining the wind flow pattern and wind velocity. The useful functions of this widely used CFD model can certainly “fit for the purpose” of the AVA. Further information on the CFD computer simulation model is detailed in Appendix A. The geometry and simulation options for subject development and surrounding environment have been set up to calculate the wind speed at around the development and surrounding ambient. Related wind speeds around the development were assessed by setting up a scaled model of the development with surrounding building structures. The setting of the CFD modelling is shown as follow: 1) Domain size: x-direction = 833m; y-direction = 781m; z-direction = 600m 2) Grid size: x-direction = 5m; y-direction = 5m; z-direction = 10m (Near subject site: x-direction = 2m; y-direction = 2m; z-direction = 2m) 3) Turbulence model: Chen-Kim modified KE-EP turbulence model (see Appendix A) 4) Wind Profile: Power law wind profile (see Appendix A), Power law exponent of 0.5; roughness coefficient = 3.0 5) Convergence: 0.100%
According to the “Technical Guide for Air Ventilation Assessment for Developments in Hong Kong” [2] published by Housing, Planning and Lands Bureau (HPLB) and Environment, Transport and Works Bureau (ETWB), the assessment area shall include the project’s surrounding up to a perpendicular distance H from the project boundary, where H is the height of the tallest building on site. The study area (surrounding area) shall include a perpendicular distance of 2H from the project boundary. In the latest design scheme, the height of the proposed building from main roof is restricted at approximately 131.5mPD. 50 overall test points are evenly distributed on the streets, open space and places where pedestrians frequently access in the assessment area, which is within 150m radius of the site as shown in Figure 5 and 32 perimeter test points are taken around the project site boundary, including entrances, corners and pedestrian area as shown in Figure 4. The study area is within approximately 270m radius of the site as shown in

Project No : 775
AIR VENTILATION ASSESSMENT FOR CUSTOMS HEADQUARTERS BUILDING AT 222 JAVA ROAD, NORTH POINT, HONG KONG
Issue 1 ________________________________________________________________ AEC D:\Project\775\080814\AVA report_Aug08-r3.doc
Figure 1. It is bounded by Victoria Harbour to the north, Hong Cheung Court to the east, Fortune Building to the south and Java Commercial Centre to the west. Wind velocity is assessed at 2m above ground level. Wind Velocity Ratio (VR) should be used as an indicator of wind performance for the AVA. It indicates how much of the wind availability of a location could be experienced and enjoyed by pedestrians. The higher the wind velocity ratio, the less likely would be the impact of the proposed redevelopment on the wind availability. Wind Velocity Ratio is defined as follows:
∞
=VV
VR pw
where Vp is the wind velocity at the pedestrian level (2m above ground) after taking into
account the effects of buildings; and
V is the wind availability of the site, i.e. wind velocity at the top of the wind boundary layer (typically assumed to be around 400m to 600m above city centre).
In the “Feasibility Study for Establishment of Air Ventilation Assessment System” [3], it is suggested that in general, “the more air ventilation through the city fabric, the better”, taken into account the climatic and urban considerations of Hong Kong. The higher the value of the ratio means the better the proposed redevelopment in not affecting the wind environment. Moreover, spatial average VR including Site spatial average Velocity Ratio (SVR) and Local spatial average Velocity Ratio (LVR) are recommended in the Technical Guide to be used for comparing performances. For this particular project, a baseline scheme was assessed and compared against the preferred design scheme. SVR indicates the impact from the lower portion of the buildings on the project site to the immediate surroundings, while LVR indicates the impact from the upper portion of the buildings on the project site to the surroundings. The increase in SVR and LVR means improvements in the wind environment of the immediate surroundings and surroundings respectively, and vice versa.

Project No : 775
AIR VENTILATION ASSESSMENT FOR CUSTOMS HEADQUARTERS BUILDING AT 222 JAVA ROAD, NORTH POINT, HONG KONG
Issue 1 ________________________________________________________________ AEC D:\Project\775\080814\AVA report_Aug08-r3.doc
5. SUMMARY OF RESULTS AND DISCUSSION
5.1 An Overall View of the Wind Performance
An Initial Study for air ventilation was conducted to assess the potential impact of the proposed development to the wind environment of the neighboring surrounding of the site on pedestrian level. In this AVA, wind directions from 22.5º, 45º, 67.5º, 90º, 112.5º, 135º, 202.5º and 225º were assessed individually by 8 cases. Wind Velocity Ratio (VR) was used as an indicator of performance for each test point to show how much wind available on pedestrian level taking into account the topography and the structure of the proposed development and surrounding buildings. Details of assessment results and wind velocity contour and vector diagrams at the pedestrian level simulated for each wind direction are illustrated in Appendix B. The assessment results of each wind direction were analysed to find out the weighted-mean wind velocity ratio (VRw’) of the baseline scheme and the preferred development scheme. The assessment on the overall wind performance of the baseline scheme and the preferred development scheme was analysed by comparing the weighted-mean wind velocity ratio (VRw’) to account for wind coming from the 8 wind directions. The weighted-mean wind velocity ratio (VRw’) of the 32 perimeter test points and 50 overall test points for the baseline scheme and the preferred development scheme are tabulated in Table 3.
Table 3 VRw’ for Baseline Scheme and Preferred Development Scheme
Test Point No.
VRw’ for Baseline Scheme VRw’ for Preferred Development Scheme
Difference in VRw’ between Baseline
Scheme and Preferred
Development Scheme
Perimeter Test Points P01 0.14 0.13 0.00 P02 0.15 0.11 -0.04 P03 0.13 0.12 -0.01 P04 0.13 0.11 -0.02 P05 0.14 0.18 0.04 P06 0.13 0.17 0.04 P07 0.13 0.16 0.03 P08 0.10 0.14 0.04 P09 0.08 0.14 0.05 P10 0.08 0.14 0.05 P11 0.10 0.14 0.05 P12 0.10 0.14 0.04 P13 0.11 0.16 0.05 P14 0.10 0.16 0.06

Project No : 775
AIR VENTILATION ASSESSMENT FOR CUSTOMS HEADQUARTERS BUILDING AT 222 JAVA ROAD, NORTH POINT, HONG KONG
Issue 1 ________________________________________________________________ AEC D:\Project\775\080814\AVA report_Aug08-r3.doc
P15 0.09 0.17 0.07 P16 0.09 0.17 0.07 P17 0.11 0.14 0.03 P18 0.11 0.14 0.03 P19 0.09 0.14 0.05 P20 0.09 0.16 0.07 P21 0.09 0.21 0.12 P22 0.14 0.23 0.09 P23 0.14 0.23 0.09 P24 0.13 0.20 0.07 P25 0.13 0.18 0.05 P26 0.13 0.16 0.03 P27 0.11 0.14 0.03 P28 0.10 0.12 0.02 P29 0.10 0.11 0.01 P30 0.10 0.09 -0.01 P31 0.10 0.19 0.09 P32 0.10 0.18 0.08
Overall Test Points O01 0.23 0.24 0.02 O02 0.21 0.24 0.03 O03 0.15 0.15 0.00 O04 0.26 0.29 0.03 O05 0.26 0.34 0.08 O06 0.24 0.27 0.03 O07 0.24 0.28 0.04 O08 0.19 0.15 -0.04 O09 0.14 0.10 -0.04 O10 0.23 0.23 -0.00 O11 0.34 0.38 0.04 O12 0.26 0.29 0.03 O13 0.24 0.27 0.03 O14 0.21 0.23 0.02 O15 0.09 0.09 0.00 O16 0.19 0.20 0.02 O17 0.17 0.20 0.03 O18 0.20 0.25 0.04 O19 0.17 0.20 0.03 O20 0.22 0.24 0.02 O21 0.16 0.20 0.04

Project No : 775
AIR VENTILATION ASSESSMENT FOR CUSTOMS HEADQUARTERS BUILDING AT 222 JAVA ROAD, NORTH POINT, HONG KONG
Issue 1 ________________________________________________________________ AEC D:\Project\775\080814\AVA report_Aug08-r3.doc
O22 0.16 0.19 0.03 O23 0.16 0.18 0.02 O24 0.10 0.09 -0.01 O25 0.15 0.18 0.03 O26 0.12 0.15 0.02 O27 0.11 0.12 0.02 O28 0.13 0.13 0.01 O29 0.09 0.09 0.00 O30 0.16 0.17 0.01 O31 0.07 0.07 0.00 O32 0.11 0.10 -0.01 O33 0.12 0.12 0.00 O34 0.10 0.11 0.01 O35 0.22 0.22 0.00 O36 0.24 0.24 0.01 O37 0.21 0.23 0.02 O38 0.17 0.19 0.02 O39 0.16 0.17 0.01 O40 0.15 0.17 0.01 O41 0.15 0.10 -0.05 O42 0.17 0.19 0.02 O43 0.12 0.13 0.01 O44 0.17 0.17 0.00 O45 0.19 0.20 0.01 O46 0.13 0.15 0.01 O47 0.24 0.23 0.01 O48 0.19 0.20 0.01 O49 0.17 0.21 0.04 O50 0.17 0.14 -0.02
* Test points highlighted in grey show increased VRw’ in the preferred development scheme.
5.1.1 Site Air Ventilation Assessment
According to Table 3, 27 out of the 32 perimeter test points in the preferred development scheme show improvement in VRw’ from the baseline scheme in the range of 0.01 - 0.12.
In addition, the wind velocity ratios of preferred development compared with the baseline scheme was assessed by analysing the weighted-mean Site spatial average Velocity Ratio (SVRw’), which is estimated taken into account the probability of each wind direction. Assessment results are summarised in Table 4.

Project No : 775
AIR VENTILATION ASSESSMENT FOR CUSTOMS HEADQUARTERS BUILDING AT 222 JAVA ROAD, NORTH POINT, HONG KONG
Issue 1 ________________________________________________________________ AEC D:\Project\775\080814\AVA report_Aug08-r3.doc
The SVRw’ is 0.11 in the baseline scheme and 0.15 in the preferred scheme. This indicates that the overall wind performance in the immediate vicinity is generally improved on the immediately surrounding wind environment.
Table 4 SVRw’ and LVRw’ in Baseline Scheme and Preferred Scheme Baseline Scheme Preferred Development Scheme
SVR’ 0.11 0.15 LVR’ 0.15 0.18
5.1.2 Local Air Ventilation Assessment
According to the findings of the AVA study, 36 out of the 50 perimeter test points in the preferred development scheme show improvement in VRw’ from the baseline scheme in the range of 0.01 - 0.08. For the test points with decreased VRw’, the reduction of VRw’ are less than 0.05. Moreover, the wind environment in the vicinity of the proposed redevelopment was assessed by analysing the weighted-mean Local spatial average Velocity Ratio (LVRw’). From Table 4, the LVRw’ is 0.15 in the baseline scheme and 0.18 in the preferred scheme, which is increased by 0.03. This indicates that the overall wind performance in the surrounding environment shall be improved from baseline scheme to preferred scheme. In addition, the average VRw’ of the test points representing a specific road/ street/ area as shown in Figure 6 was computed and tabulated in Table 5 for discussion.

Project No : 775
AIR VENTILATION ASSESSMENT FOR CUSTOMS HEADQUARTERS BUILDING AT 222 JAVA ROAD, NORTH POINT, HONG KONG
Issue 1 ________________________________________________________________ AEC D:\Project\775\080814\AVA report_Aug08-r3.doc
Table 5 Average VRw’ in Other Specific Areas
Area/ Street Baseline Scheme
Preferred Development
Scheme Tin Chiu Street 0.15 0.14 Marble Road 0.25 0.28 King’s Road 0.21 0.23 Kam Hong Street 0.20 0.23 Southern area: Upper part of Tin Chiu Street, Tanner Road, Kai Yuen Street
0.14 0.15
Eastern area: Eastern part of King’s Road, Healthy Street West, Tsat Tsz Mui Road, Healthy Street Central
0.17 0.18
Western area: Kam Hong Street, Marble Road, Java Road, Western part of King’s Road
0.23 0.26
5.2 Key Findings
5.2.1 Generally improved wind performance In view of the findings that the average VRw’, SVRw’ and LVRw’ generally increase with the preferred development scheme, it is anticipated that the overall wind performance in the study area shall be equivalent to or slightly better than the baseline scheme. 5.2.2 Positive impact on the immediate vicinity In view of the findings that the VRw’ of the perimeter test points and the SVR’ generally increase with the preferred development scheme, especially the test points in Marble Road, Kam Hong Street and King’s Road as shown in Table 5. It is anticipated that the general wind environment of the local area shall be generally improved. 5.2.3 No adverse impact on the surrounding areas For the majority of overall test points, the individual wind velocity ratio slightly varies with the preferred development scheme comparing with the baseline scheme. The change in wind velocity ratio ranges from 0.01 to 0.04 except O41, O05, which show increment in VRw’ from 0.05 to 0.08. The above points are located at King’s Road and Marble Road crossed to Kam Hong Road. With negligible changes of VRw’ (less than 0.05) in over 90% of test points, it is anticipated that the proposed development shall have no adverse impact on the wind environment of the local area. 5.2.4 Positive impact on southern area, eastern area and western area

Project No : 775
AIR VENTILATION ASSESSMENT FOR CUSTOMS HEADQUARTERS BUILDING AT 222 JAVA ROAD, NORTH POINT, HONG KONG
Issue 1 ________________________________________________________________ AEC D:\Project\775\080814\AVA report_Aug08-r3.doc
As shown in Table 5, the average VRw’ for test points located at southern area, eastern area and western area increase by 0.01, 0.01 and 0.03 with the preferred development scheme respectively. The amplification of air flow indicates that the preferred development shall enhance the local wind environment. 5.2.5 Overall performance Taking into account the above analysis, whilst the two schemes are very similar in the overall air ventilation performance, the preferred development scheme shows a better wind environment in the immediate vicinity.

Project No : 775
AIR VENTILATION ASSESSMENT FOR CUSTOMS HEADQUARTERS BUILDING AT 222 JAVA ROAD, NORTH POINT, HONG KONG
Issue 1 ________________________________________________________________ AEC D:\Project\775\080814\AVA report_Aug08-r3.doc
6. CONCLUSIONS
An Initial Study for Air Ventilation Assessment for the Customs Headquarters Building at 222 Java Road, North Point has been carried out. The findings of the study indicate that the preferred development scheme shall provide slightly better wind environment in the immediate vicinity and local area.

Figure No.
1
Rev:
0 AIR VENTILATION ASSESSMENT FOR CUSTOMS HEADQUARTERS TOWER AT 222 JAVA ROAD, NORTH POINT
Site Location Plan Scale
NTS
Date
08/08

Figure No.
2a
Rev:
0 AIR VENTILATION ASSESSMENT FOR CUSTOMS HEADQUARTERS TOWER AT 222 JAVA ROAD, NORTH POINT
Master Layout Plan for Baseline Scheme – Ground Floor Plan Scale
NTS
Date
08/08

Figure No.
2b
Rev:
0 AIR VENTILATION ASSESSMENT FOR CUSTOMS HEADQUARTERS TOWER AT 222 JAVA ROAD, NORTH POINT
Master Layout Plan for Baseline Scheme – Diagrammatic Section Scale
NTS
Date
08/08

Figure No.
3a
Rev:
0 AIR VENTILATION ASSESSMENT FOR CUSTOMS HEADQUARTERS TOWER AT 222 JAVA ROAD, NORTH POINT
Master Layout Plan for Preferred Development Scheme – Ground Floor Plan Scale
NTS
Date
08/08

Figure No.
3b
Rev:
0 AIR VENTILATION ASSESSMENT FOR CUSTOMS HEADQUARTERS TOWER AT 222 JAVA ROAD, NORTH POINT
Master Layout Plan for Preferred Development Scheme – Diagrammatic Section Scale
NTS
Date
08/08
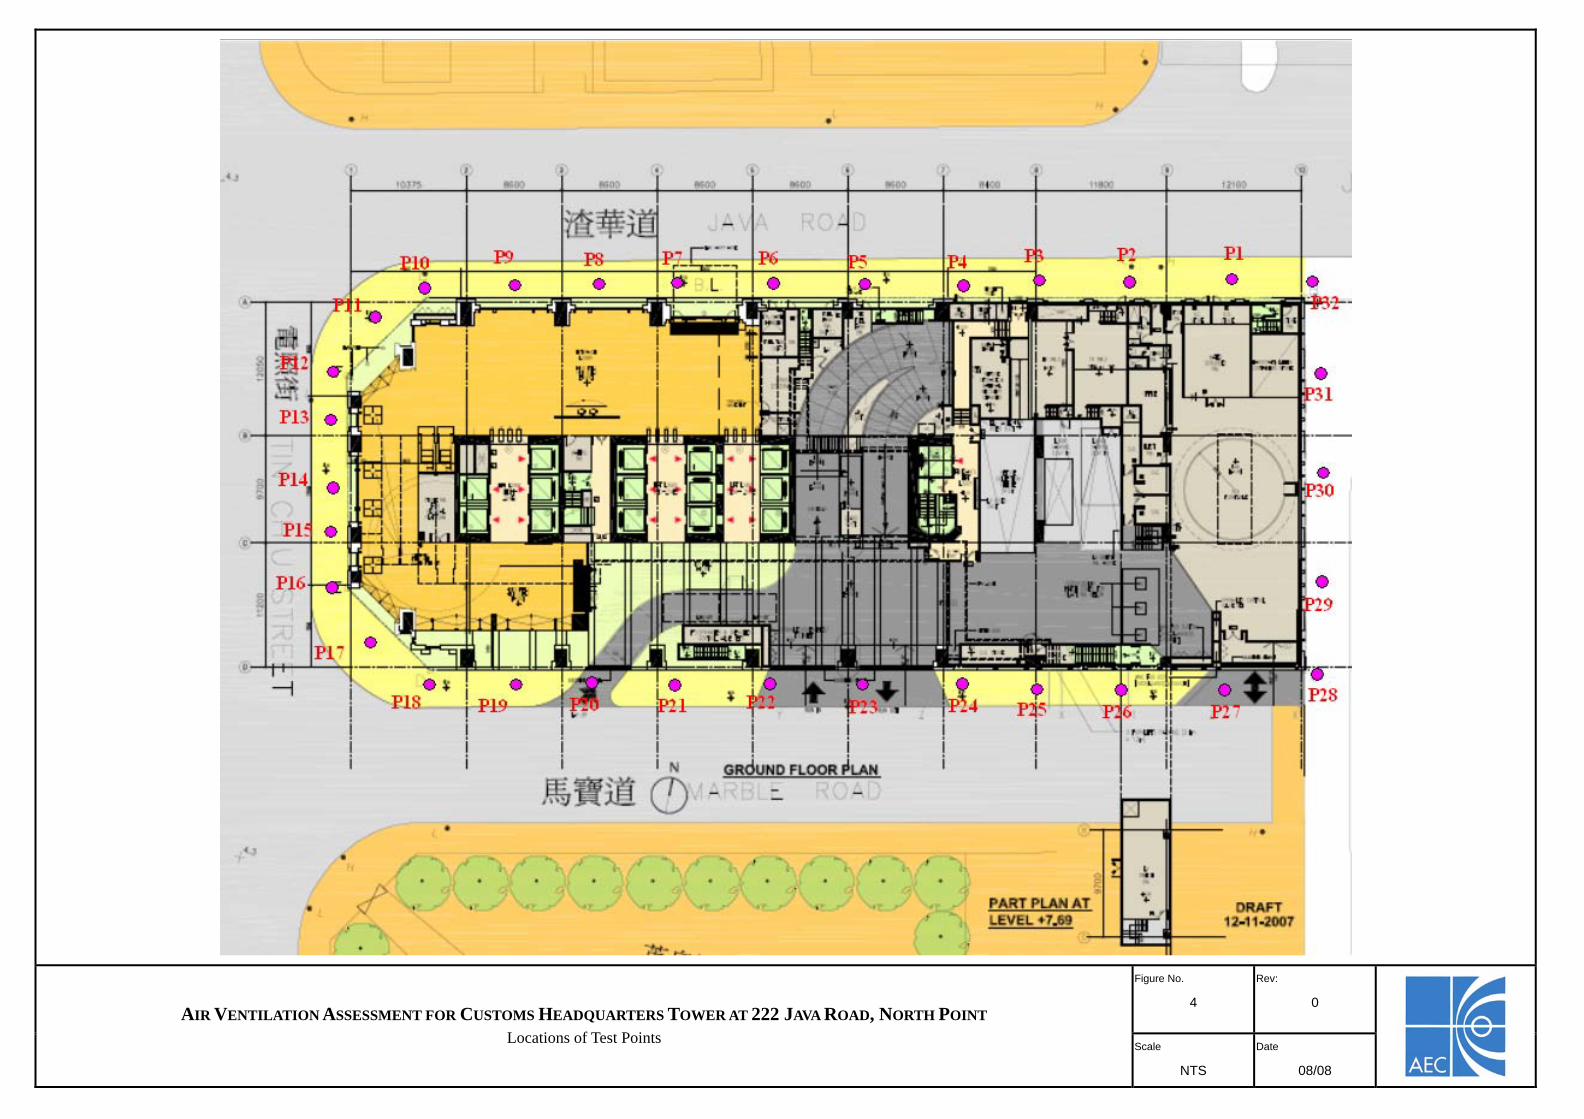
Figure No.
4
Rev:
0 AIR VENTILATION ASSESSMENT FOR CUSTOMS HEADQUARTERS TOWER AT 222 JAVA ROAD, NORTH POINT
Locations of Test Points Scale
NTS
Date
08/08

Figure No.
5
Rev:
0 AIR VENTILATION ASSESSMENT FOR CUSTOMS HEADQUARTERS TOWER AT 222 JAVA ROAD, NORTH POINT
Location of Overall Test Points Scale
NTS
Date
0808

Figure No.
6
Rev:
0 AIR VENTILATION ASSESSMENT FOR CUSTOMS HEADQUARTERS TOWER AT 222 JAVA ROAD, NORTH POINT
Locations of Specific Areas Scale
NTS
Date
08/08
Tin Chiu Street Marble Road King’s Road Kam Hong Street
E
S
W

Appendix A
Details of CFD modelling setting
AIR VENTILATION ASSESSMENT FOR THE CUSTOMS HEADQUARTERS TOWER AT 222 JAVA ROAD, NORTH POINT 1
Issue 1 1 AEC
Appendix A Details of CFD modelling setting 1) Domain Size & Grid Setting
Domain size: x-direction = 833m; y-direction = 781m; z-direction = 600m
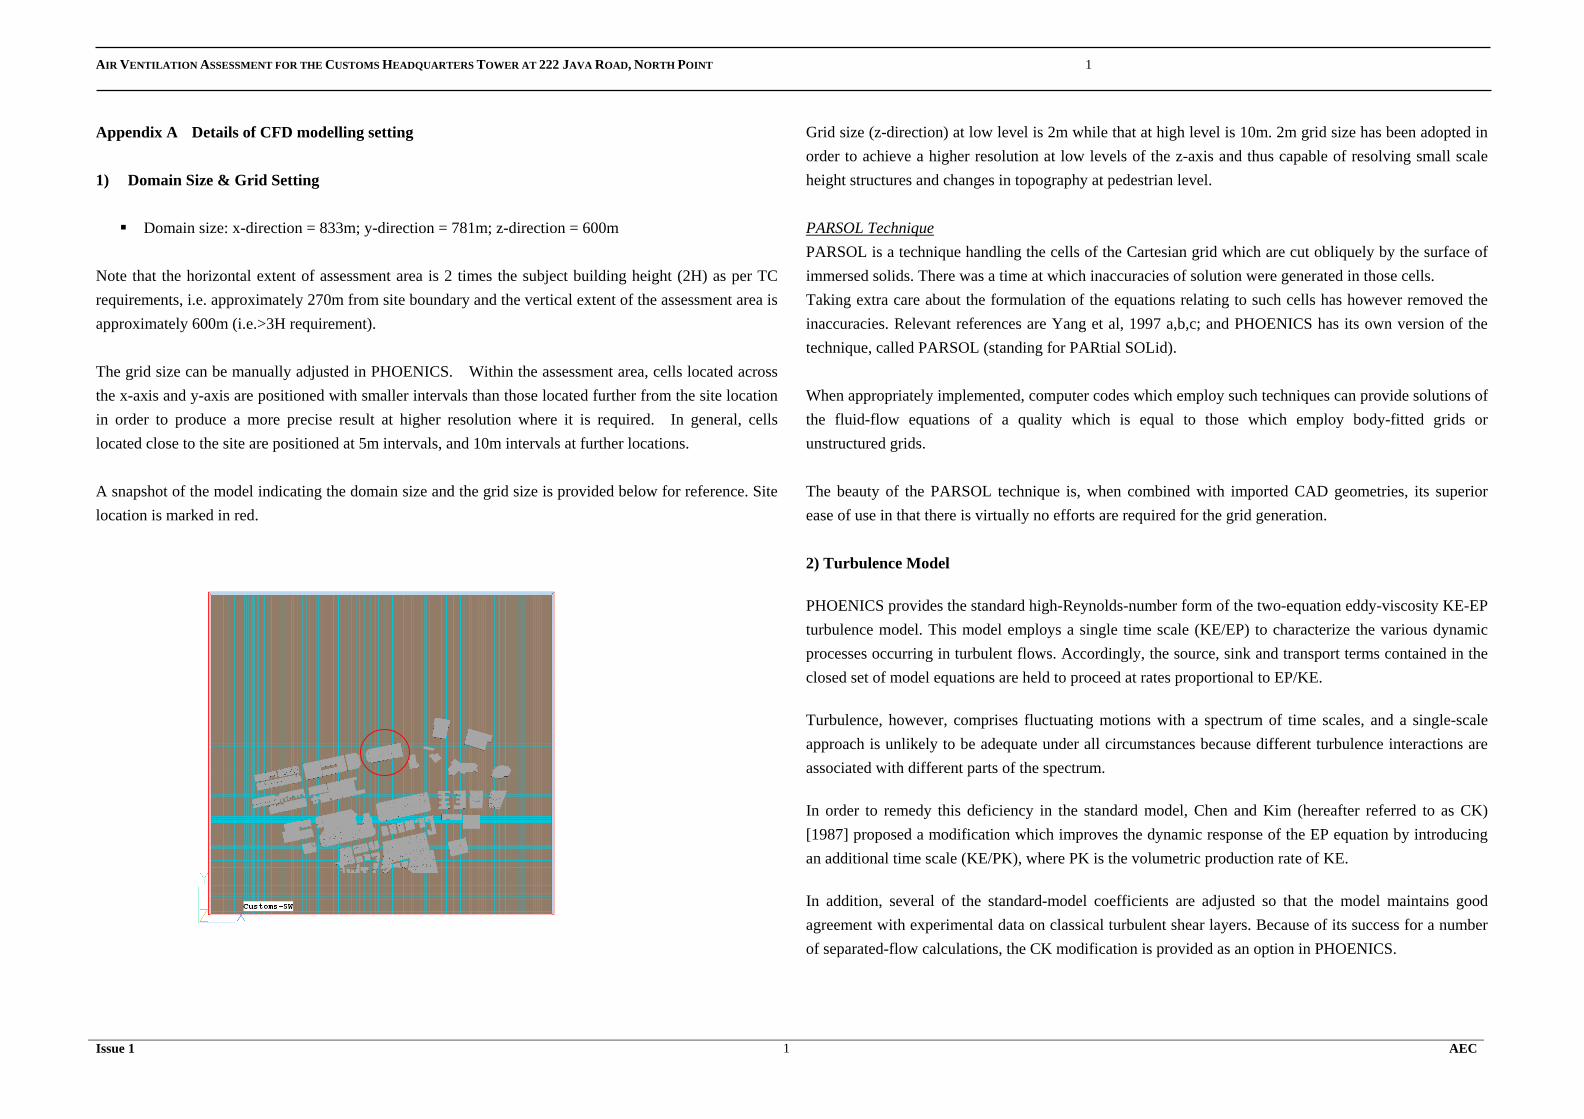
Note that the horizontal extent of assessment area is 2 times the subject building height (2H) as per TC requirements, i.e. approximately 270m from site boundary and the vertical extent of the assessment area is approximately 600m (i.e.>3H requirement). The grid size can be manually adjusted in PHOENICS. Within the assessment area, cells located across the x-axis and y-axis are positioned with smaller intervals than those located further from the site location in order to produce a more precise result at higher resolution where it is required. In general, cells located close to the site are positioned at 5m intervals, and 10m intervals at further locations. A snapshot of the model indicating the domain size and the grid size is provided below for reference. Site location is marked in red.
Grid size (z-direction) at low level is 2m while that at high level is 10m. 2m grid size has been adopted in order to achieve a higher resolution at low levels of the z-axis and thus capable of resolving small scale height structures and changes in topography at pedestrian level. PARSOL Technique PARSOL is a technique handling the cells of the Cartesian grid which are cut obliquely by the surface of immersed solids. There was a time at which inaccuracies of solution were generated in those cells. Taking extra care about the formulation of the equations relating to such cells has however removed the inaccuracies. Relevant references are Yang et al, 1997 a,b,c; and PHOENICS has its own version of the technique, called PARSOL (standing for PARtial SOLid). When appropriately implemented, computer codes which employ such techniques can provide solutions of the fluid-flow equations of a quality which is equal to those which employ body-fitted grids or unstructured grids. The beauty of the PARSOL technique is, when combined with imported CAD geometries, its superior ease of use in that there is virtually no efforts are required for the grid generation. 2) Turbulence Model
PHOENICS provides the standard high-Reynolds-number form of the two-equation eddy-viscosity KE-EP turbulence model. This model employs a single time scale (KE/EP) to characterize the various dynamic processes occurring in turbulent flows. Accordingly, the source, sink and transport terms contained in the closed set of model equations are held to proceed at rates proportional to EP/KE.
Turbulence, however, comprises fluctuating motions with a spectrum of time scales, and a single-scale approach is unlikely to be adequate under all circumstances because different turbulence interactions are associated with different parts of the spectrum.
In order to remedy this deficiency in the standard model, Chen and Kim (hereafter referred to as CK) [1987] proposed a modification which improves the dynamic response of the EP equation by introducing an additional time scale (KE/PK), where PK is the volumetric production rate of KE.
In addition, several of the standard-model coefficients are adjusted so that the model maintains good agreement with experimental data on classical turbulent shear layers. Because of its success for a number of separated-flow calculations, the CK modification is provided as an option in PHOENICS.
AIR VENTILATION ASSESSMENT FOR THE CUSTOMS HEADQUARTERS TOWER AT 222 JAVA ROAD, NORTH POINT 2
Issue 1 2 AEC
The CK modification involves dividing the EP production term into two parts, the first of which is the same as for the standard model but with a smaller multiplying coefficient, and the second of which allows the 'turbulence distortion ratio' (PK/EP) to exert an influence on the production rate of EP.
According to the authors the extra source term represents the energy transfer rate from large-scale to small-scale turbulence controlled by the production-range time scale and the dissipation- range timescale.
The net effect is to increase EP (and thereby decrease KE) when the mean strain is strong (PK/EP>1), and to decrease EP when the mean strain is weak (PK/EP < 1). This feature may be expected to offer advantages in separated flows and also in other flows where the turbulence is removed from local equilibrium.
Chen ( see Monson et al [1990] ) extended the model to perform low- Reynolds-number simulations of bounded flows by introducing the low- Reynolds-number KE-EP extension of Lam and Bremhorst [1981]. This extension is provided for in PHOENICS by allowing the CK modification to be used in combination with the Lam-Bremhorst extension.
The CK modified KE-EP model differs from the standard high-Reynolds- form of the KE-EP model in that: (a) the following model constants take different values:
PRT(KE)=0.75 ; PRT(EP)=1.15 ; C1E=1.15 ; C2E=1.9 (2.1)
and (b) an extra timescale KE/PK is included in the EP-equation via the following additional source term per unit volume:
S,EP = RHO*F1*C3E*PK**2/KE (2.2)
where C3E=0.25, PK is the volumetric production rate of KE, and F1 is the Lam-Bremhorst [1981] damping function which tends to unity at high turbulence Reynolds numbers.
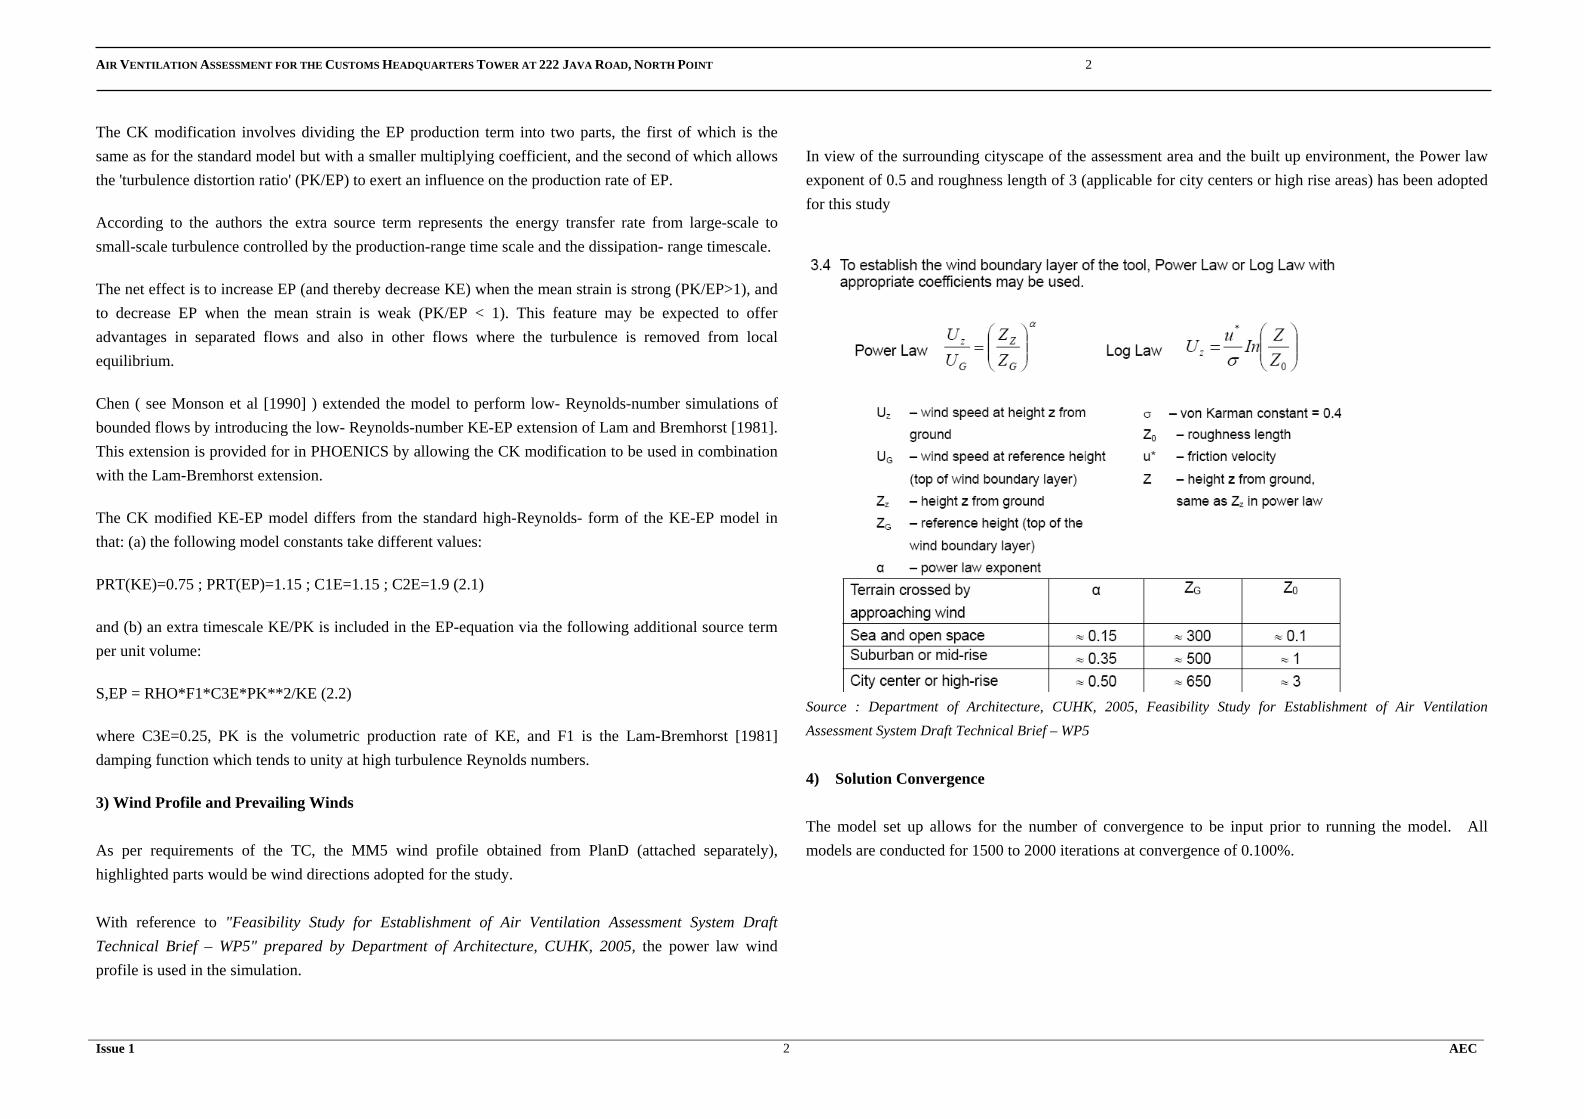
3) Wind Profile and Prevailing Winds As per requirements of the TC, the MM5 wind profile obtained from PlanD (attached separately), highlighted parts would be wind directions adopted for the study. With reference to "Feasibility Study for Establishment of Air Ventilation Assessment System Draft Technical Brief – WP5" prepared by Department of Architecture, CUHK, 2005, the power law wind profile is used in the simulation.
In view of the surrounding cityscape of the assessment area and the built up environment, the Power law exponent of 0.5 and roughness length of 3 (applicable for city centers or high rise areas) has been adopted for this study
Source : Department of Architecture, CUHK, 2005, Feasibility Study for Establishment of Air Ventilation Assessment System Draft Technical Brief – WP5
4) Solution Convergence The model set up allows for the number of convergence to be input prior to running the model. All models are conducted for 1500 to 2000 iterations at convergence of 0.100%.

AIR VENTILATION ASSESSMENT FOR THE CUSTOMS HEADQUARTERS TOWER AT 222 JAVA ROAD, NORTH POINT 3
Issue 1 3 AEC
5) Examples of Outdoor Air Ventilation Study using PHOENICS The PHOENICS software package has been used to undertake all previous CFD modelling. Current AVA studies using this software includes the current commission under term consultancy for Housing Authority, previous URA projects and has been used to undertake assessment under HK-BEAM certification. Internationally, PHOENICS has been used in similar situations on a much larger scale. The city of Glasgow, in the UK, required a suitable CFD code for use in the integrated urban air quality modelling for regulatory purposes. PHOENICS was used to undertake a comprehensive CFD study (Assessing Urban Air Quality using Microscale CFD Modelling, Glasgow Caledonian University, UK), which integrated results of traffic flow in urban road networks, traffic emissions and incorporated a 3-dimensional model of a complex configuration of street canyons into the dispersion model. As a result of the modelling results undertaken using PHOENICS, an urban air quality model of a designated air quality management area in the city centre of Glasgow was developed. There are also researches by Complex Built Environment Systems Group, the Bartlett, University College London on outdoor air quality simulation using PHOENICS as shown below: Analysis of Numerically Modelled Local Concentration Gradients in Street Canyons: Implications
for Air Quality Monitoring. 10th International PHOENICS CFD Conference, Melbourne, Australia Evaluation of Different Numerical Methodologies for Dispersion of Air Pollutants in an Urban
Environment. the 11th International Conference of CFD Society of Canada, University of British Columbia,May 2003, Vancouver
Numerical Prediction of Dispersion Characteristics of Air Pollutants in Idealised Urban Street Canyons. 9th International PHOENICS CFD Conference, Institute of Mechanical Engineering, September 2002, Moscow
Another example would be the application of PHOENICS in urban city planning of Wellington (New Zealand) by Eric N Jal et al. The results from the CFD modelling provide a detailed analysis of the local wind speeds and levels of turbulence and highlight the impact upon pedestrian comfort and safety. In this way the building form can be changed early in the design stage process and enable urban planners to develop safe, yet commercially viable solutions.
PHOENICS has also been used for the “Simulation of turbulent flows and pollutant dispersion around groups of buildings” (Vipac, Australia) in order to examine pollutant problems under different wind
scenarios. Similar to the application being used for our current project, the effects of ventilation within an urban environment were examined. Below are some references related to wind simulations provided by PHOENICS relating to wind studies undertaken internationally. WIND-TURBINES WAKES ON A COMPLEX PLANTED TERRAIN:
http://www.cham.co.uk/casestudies/terrain/terrain.htm Wind Energy Study:
http://www.cham.co.uk/PUC/PUM_London/papers/CHAM_Case_Study_Wind_Energy.pdf Windfield simulation for Apline Skiing Area:
http://www.cham.co.uk/DOCS/Cham_News_Autumn_2004.pdf Prediction the dispersion consequences of Gaseous Releases from a University Research Facility
in an Urban environment, Flowsolve/Scott Wilson, UK Assessing Urban Air Quality using Microscale CFD Modelling, Glasgow Caledonian University,
UK Wind effects around a Bus Canopy, Flowsolve, UK CFD Simulation of Turbulent Flows and Pollutant Dispersion around Groups of Buildings, VIPAC,
Australia Outdoor thermal study at Chongqing: http://www.mdpi.org/sensors/papers/s7102183.pdf Development of base efficiencies in building environment simulation for building simulation
http://www.ibpsa.org/proceedings/BS2003/BS03_1251_1256.pdf

Appendix B
Detailed AVA Results

Wind direction - NNE Baseline Scheme Preferred Development Scheme
Wind Velocity Contour Wind Velocity Contour
Vector Diagram Vector Diagram
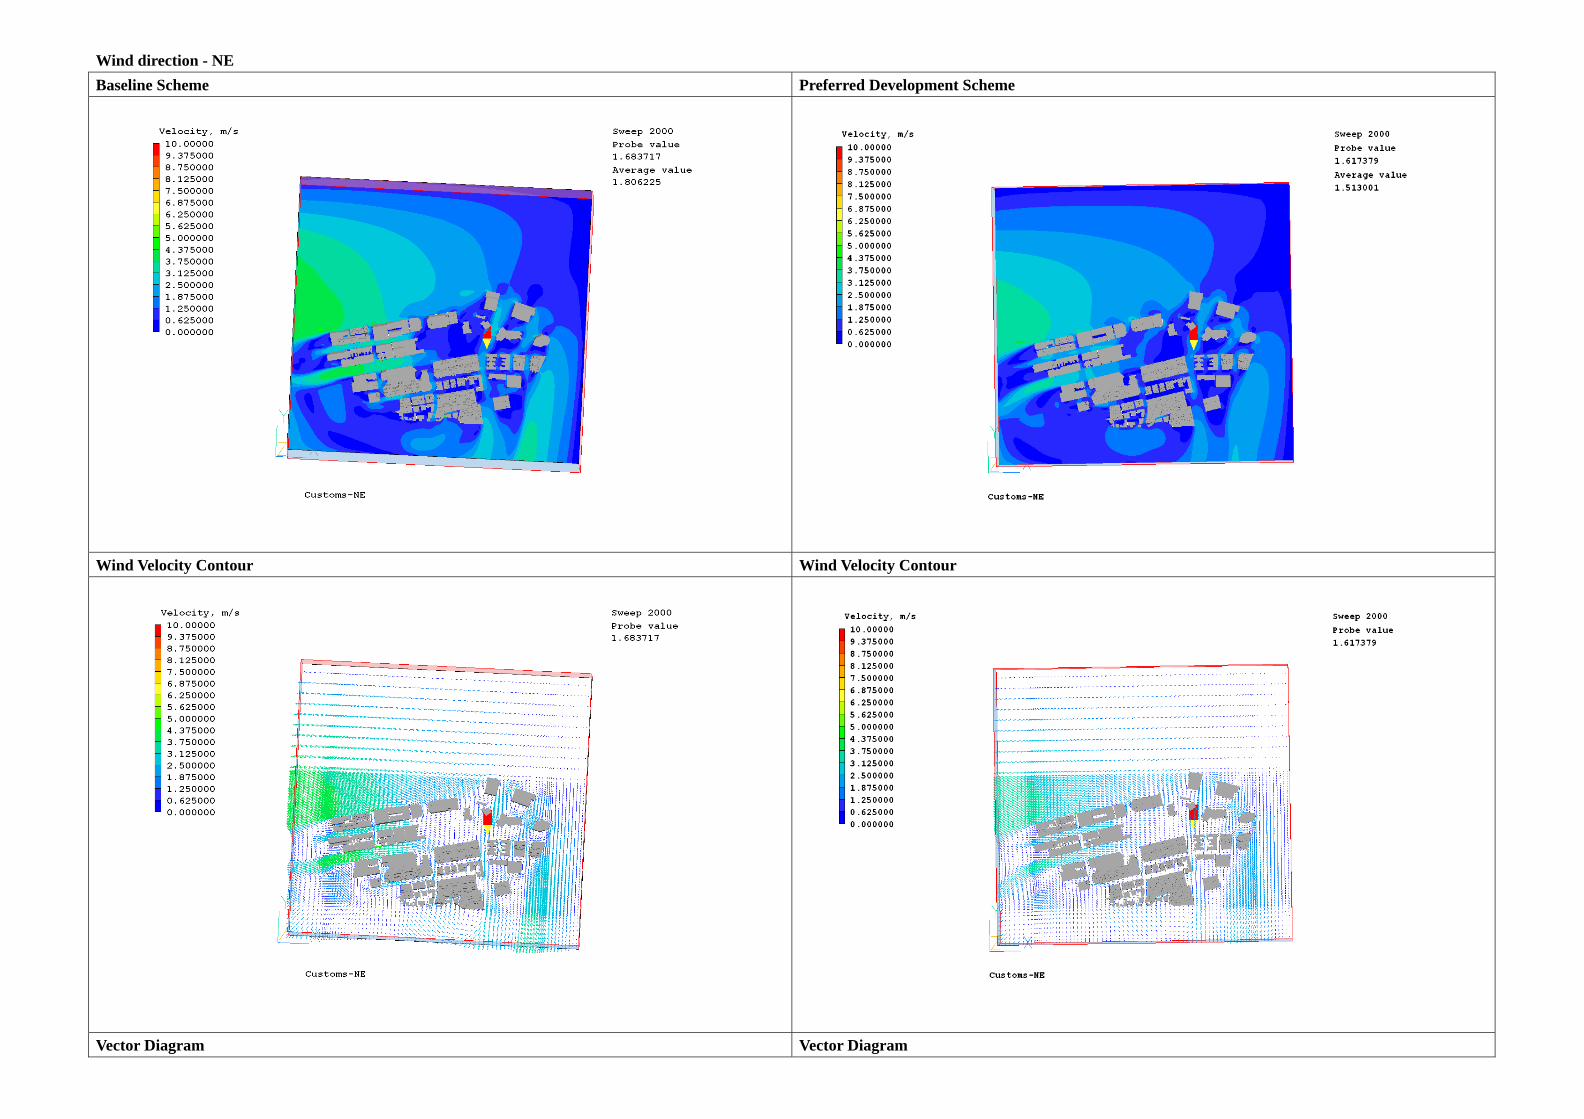
Wind direction - NE Baseline Scheme Preferred Development Scheme
Wind Velocity Contour Wind Velocity Contour
Vector Diagram Vector Diagram

Wind direction - ENE Baseline Scheme Preferred Development Scheme
Wind Velocity Contour Wind Velocity Contour
Vector Diagram Vector Diagram

Wind direction - East Baseline Scheme Preferred Development Scheme
Wind Velocity Contour Wind Velocity Contour
Vector Diagram Vector Diagram

Wind direction - ESE Baseline Scheme Preferred Development Scheme
Wind Velocity Contour Wind Velocity Contour
Vector Diagram Vector Diagram

Wind direction - SE Baseline Scheme Preferred Development Scheme
Wind Velocity Contour Wind Velocity Contour
Vector Diagram Vector Diagram

Wind direction - SSW Baseline Scheme Preferred Development Scheme
Wind Velocity Contour Wind Velocity Contour
Vector Diagram Vector Diagram
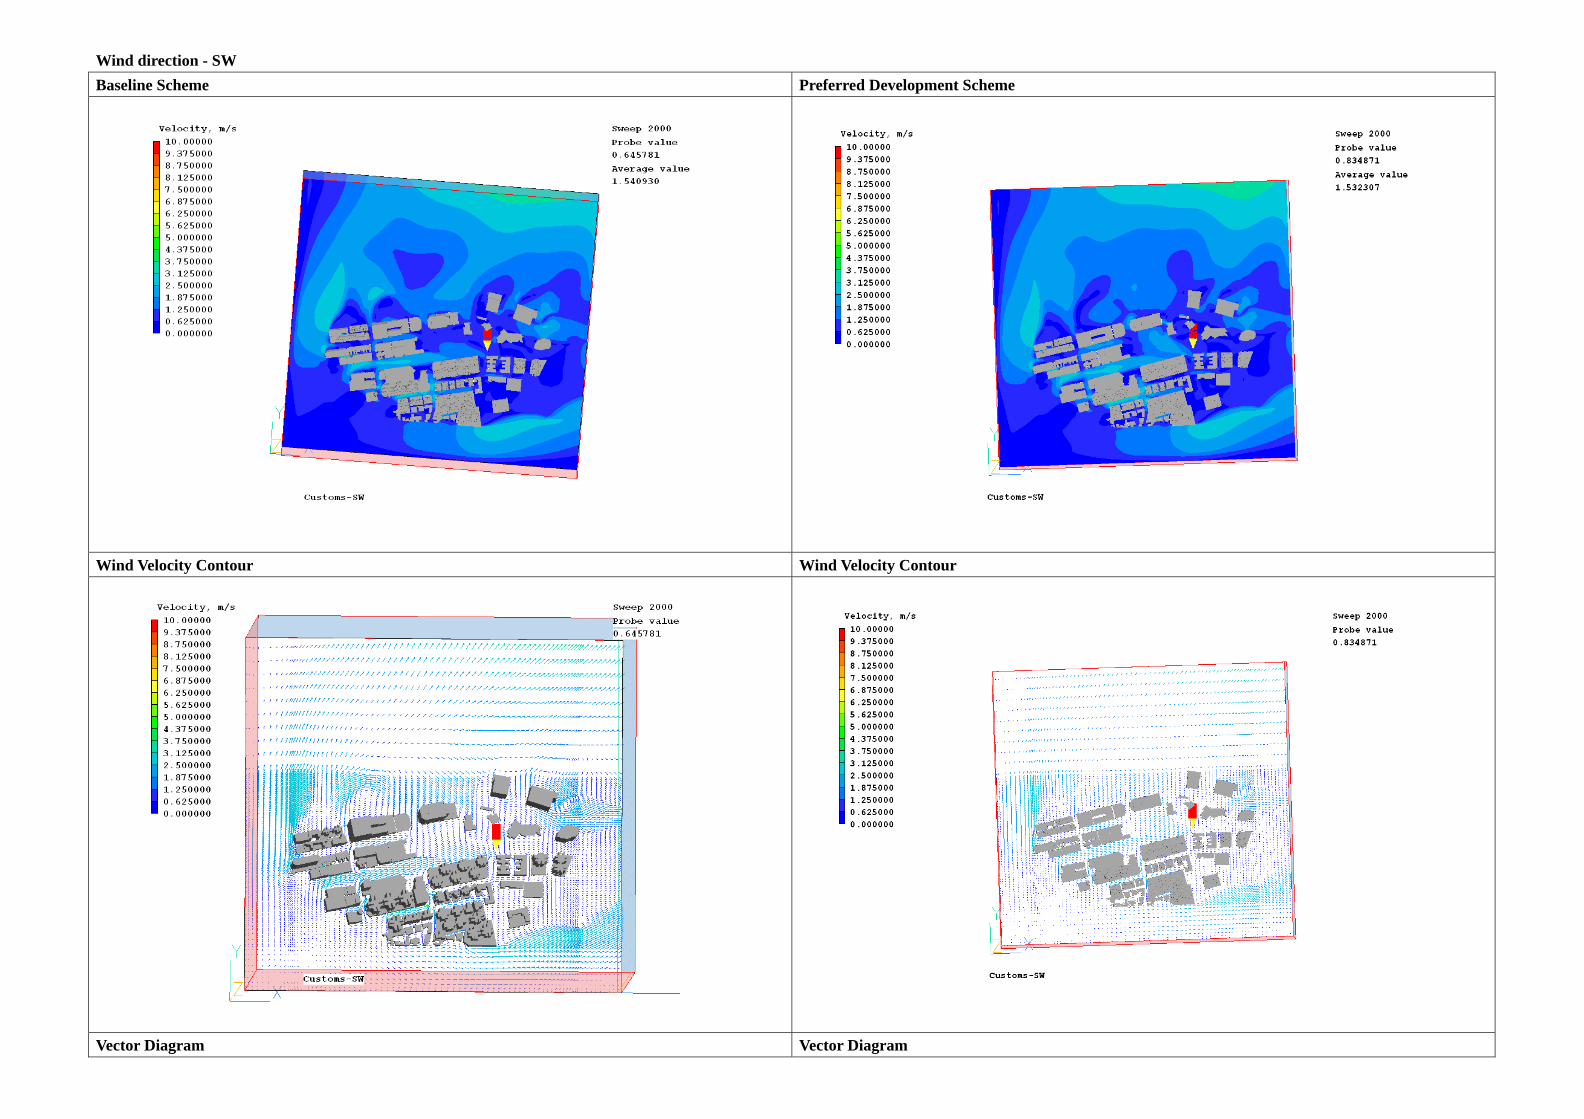
Wind direction - SW Baseline Scheme Preferred Development Scheme
Wind Velocity Contour Wind Velocity Contour
Vector Diagram Vector Diagram